Allcargo Logistics Ltd. - Om Investments cargo logistics.pdf · 2015-05-15 · Allcargo Logistics...
18
Allcargo Logistics Ltd. BUY - 1 of 18 - Wednesday 22 nd April, 2015 This document is for private circulation, and must be read in conjunction with the disclaimer on the last page. STOCK POINTER Target Price `535 CMP ` 334 FY17E PE 11.9x Index Details Allcargo Logistics (ACLL) is an integrated multinational logistics company headquartered in Mumbai, India. It is India’s largest and globally the second largest Less than container load (LCL) consolidator with a presence across 90 countries. It has a diverse presence across various segments viz., Multimodal Transport Operations (MTO), Container1 Freight Stations (CFS) and Project and Engineering Services (PES). Robust growth in the MTO business, revival of the CFS segment and a pick-up in the PES segment is expected to fuel the growth for ACLL in the coming years. We expect ACLL to report a three year net revenue CAGR of 15% to `7,393 crore by FY17E. We also expect PAT to increase at a 3 year CAGR of 35.8% to `374.6 crore. We are positive on the company’s prospects given that We expect Allcargo to continue to outperform the MTO industry growth and grow its volumes at a CAGR of 15.6% over FY14-FY17E period to 121,404 TEUs. MTO is the mainstay for Allcargo and contributes 85% of its top line. Being an ‘asset light’ business it has a very high RoCE of around 40%. MTO revenues are expected to grow to `6,276 crore from `4,125 crore in FY14 implying a CAGR of 15%. We expect the EBITDA margins to expand by 50 bps as a result of improved operational efficiency. In the Multimodal Transport Operations (MTO) Allcargo has grown aggressively by acquiring many global LCL companies, with the first major acquisition being that of the Belgium based ECU Line in 2005-2006. Subsequent to that It has created a niche for itself as an LCL consolidator and is today the second largest player globally. Sensex 28,442 Nifty 8,606 Industry Logistics Scrip Details MktCap (` cr) 4,337 BVPS (`) 142 O/s Shares (Cr) 12.6 AvVol (Lacs) 0.3 52 Week H/L 133/378.5 Div Yield (%) 0.4 FVPS (`) 2.0 Shareholding Pattern Shareholders % Promoters 69.9 DIIs 0.0 FIIs 6.2 Public 23.9 Total 100.0 Allcargo vs. Sensex 0.00 5000.00 10000.00 15000.00 20000.00 25000.00 30000.00 35000.00 0.00 50.00 100.00 150.00 200.00 250.00 300.00 350.00 400.00 17-Apr-14 17-May-14 17-Jun-14 17-Jul-14 17-Aug-14 17-Sep-14 17-Oct-14 17-Nov-14 17-Dec-14 17-Jan-15 17-Feb-15 17-Mar-15 17-Apr-15 Allcargo Sensex Key Financials (` in Cr) Y/E Mar Net Sales EBITDA PAT EPS (`) EPS Growth (%) RONW (%) ROCE (%) P/E (x) EV/EBITDA (x) 2014 4,859 391.1 154.5 11.9 -- 8.6 13.2 28.2 11.8 2015E 5,705 476.2 239.1 18.5 55.5 12.0 20.6 18.0 9.0 2016E 6,563 560.1 314.2 24.4 31.9 14.0 23.8 13.7 7.3 2017E 7,393 640.1 381.4 29.7 21.7 14.9 26.7 11.2 6.1
Transcript of Allcargo Logistics Ltd. - Om Investments cargo logistics.pdf · 2015-05-15 · Allcargo Logistics...
Allcargo Logistics Ltd.
BUY
- 1 of 18 - Wednesday 22nd
April, 2015
This document is for private circulation, and must be read in conjunction with the disclaimer on the last page.
ST
OC
K P
OIN
TE
R
Target Price `535 CMP ` 334 FY17E PE 11.9x
Index Details Allcargo Logistics (ACLL) is an integrated multinational logistics
company headquartered in Mumbai, India. It is India’s largest and
globally the second largest Less than container load (LCL)
consolidator with a presence across 90 countries. It has a diverse
presence across various segments viz., Multimodal Transport
Operations (MTO), Container1 Freight Stations (CFS) and Project
and Engineering Services (PES).
Robust growth in the MTO business, revival of the CFS segment
and a pick-up in the PES segment is expected to fuel the growth
for ACLL in the coming years. We expect ACLL to report a three
year net revenue CAGR of 15% to `7,393 crore by FY17E. We also
expect PAT to increase at a 3 year CAGR of 35.8% to `374.6 crore.
We are positive on the company’s prospects given that
We expect Allcargo to continue to outperform the MTO
industry growth and grow its volumes at a CAGR of 15.6%
over FY14-FY17E period to 121,404 TEUs. MTO is the
mainstay for Allcargo and contributes 85% of its top line.
Being an ‘asset light’ business it has a very high RoCE of
around 40%. MTO revenues are expected to grow to `6,276
crore from `4,125 crore in FY14 implying a CAGR of 15%.
We expect the EBITDA margins to expand by 50 bps as a
result of improved operational efficiency.
In the Multimodal Transport Operations (MTO) Allcargo has
grown aggressively by acquiring many global LCL
companies, with the first major acquisition being that of the
Belgium based ECU Line in 2005-2006. Subsequent to that It
has created a niche for itself as an LCL consolidator and is
today the second largest player globally.
Sensex 28,442
Nifty 8,606
Industry Logistics
Scrip Details
MktCap (` cr) 4,337
BVPS (`) 142
O/s Shares (Cr) 12.6
AvVol (Lacs) 0.3
52 Week H/L 133/378.5
Div Yield (%) 0.4
FVPS (`) 2.0
Shareholding Pattern
Shareholders %
Promoters 69.9
DIIs 0.0
FIIs 6.2
Public 23.9
Total 100.0
Allcargo vs. Sensex
0.00
5000.00
10000.00
15000.00
20000.00
25000.00
30000.00
35000.00
0.00
50.00
100.00
150.00
200.00
250.00
300.00
350.00
400.00
17-A
pr-
14
17-M
ay-1
4
17-J
un
-14
17-J
ul-
14
17-A
ug
-14
17-S
ep
-14
17-O
ct-
14
17-N
ov-1
4
17-D
ec-1
4
17-J
an
-15
17-F
eb
-15
17-M
ar-
15
17-A
pr-
15
Allcargo Sensex
Key Financials (` in Cr)
Y/E Mar Net
Sales EBITDA PAT
EPS
(`)
EPS
Growth (%)
RONW
(%)
ROCE
(%)
P/E
(x)
EV/EBITDA
(x)
2014 4,859 391.1 154.5 11.9 -- 8.6 13.2 28.2 11.8
2015E 5,705 476.2 239.1 18.5 55.5 12.0 20.6 18.0 9.0
2016E 6,563 560.1 314.2 24.4 31.9 14.0 23.8 13.7 7.3
2017E 7,393 640.1 381.4 29.7 21.7 14.9 26.7 11.2 6.1
- 2 of 18- Wednesday 22nd
April, 2015
This document is for private circulation, and must be read in conjunction with the disclaimer on the last page.
With an EBITDA margin of 32%, the CFS is one of the ACLL’s
most profitable businesses. Allcargo is one of the largest CFS
operators in India with a significant presence at major Indian
ports and leadership position at Chennai. With the revival of
EXIM trade and a rise in volumes at major ports we see a
turnaround in this business vertical. Allcargo has built vast
facilities to cater to the expected demand. We believe the
consolidation in this segment is over and expect the volumes
to increase at a 14.2% CAGR to 313,054 TEUs over FY14-FY17E
Revenues are expected to grow at a 17.1% CAGR to `499.5
crores by FY17E.
The asset heavy Project & Engineering Services segment is
gaining traction on the back of good economic growth. Asset
utilization has already picked up from 72% in FY14 to 92% as
on Feb’ 2015 and as the capex cycle revives further, we expect
more order inflows. We expect the revenues to increase to
`585.3 crores by FY17E from `399 crores in FY14 implying a
CAGR of 13.6%.
We initiate coverage on Allcargo Logistics as a BUY with a Price
Objective of `535 representing a potential upside of ~60% over a
period of 18 months. The target price is arrived at by assigning a PE
multiple of 18x on the FY17 EPS of `29.7. At the CMP of `334, the
stock is trading at a PE multiple of 11.9x FY17E.
- 3 of 18- Wednesday 22nd
April, 2015
This document is for private circulation, and must be read in conjunction with the disclaimer on the last page.
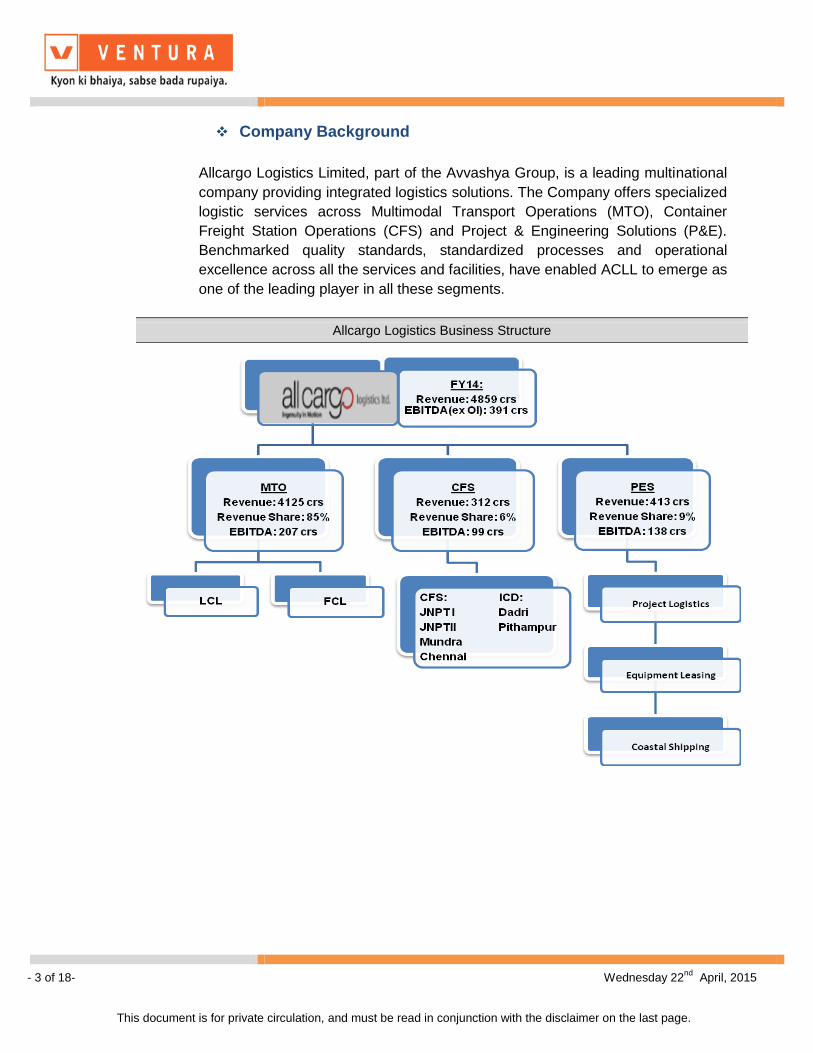
Company Background
Allcargo Logistics Limited, part of the Avvashya Group, is a leading multinational
company providing integrated logistics solutions. The Company offers specialized
logistic services across Multimodal Transport Operations (MTO), Container
Freight Station Operations (CFS) and Project & Engineering Solutions (P&E).
Benchmarked quality standards, standardized processes and operational
excellence across all the services and facilities, have enabled ACLL to emerge as
one of the leading player in all these segments.
Allcargo Logistics Business Structure
- 4 of 18- Wednesday 22nd
April, 2015
This document is for private circulation, and must be read in conjunction with the disclaimer on the last page.
Key Investment Highlights
MTO: Robust volume growth and margin improvement on the
cards :
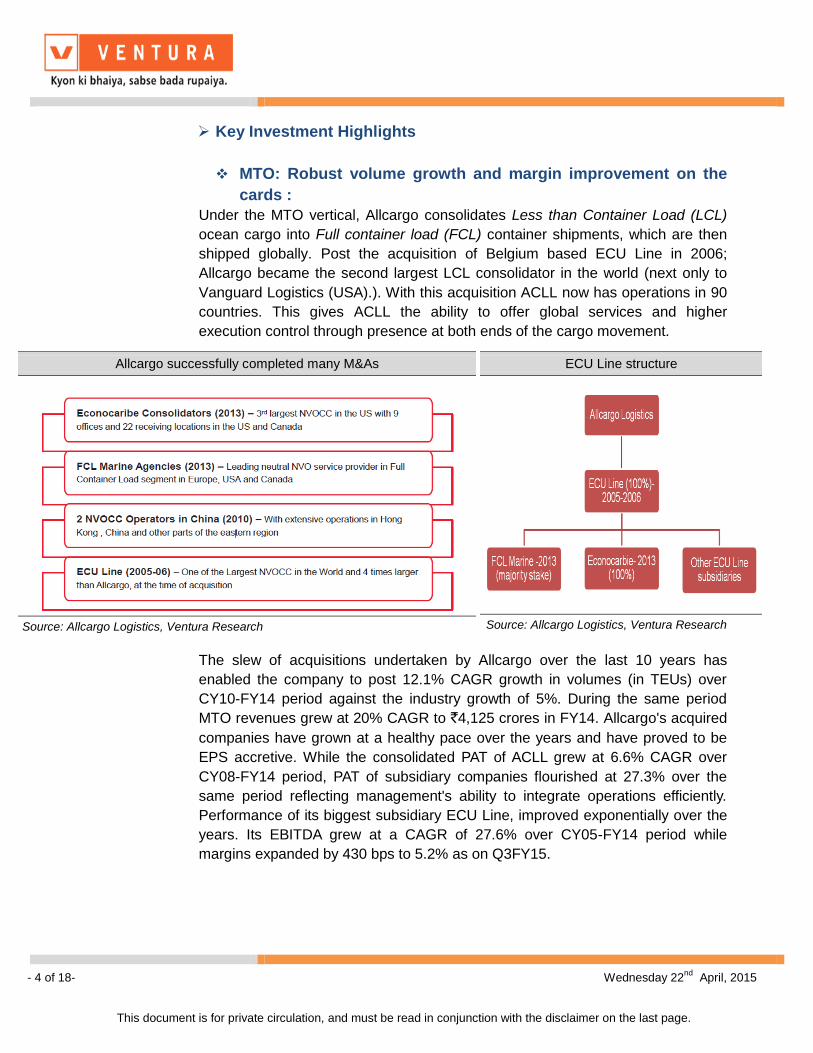
Under the MTO vertical, Allcargo consolidates Less than Container Load (LCL)
ocean cargo into Full container load (FCL) container shipments, which are then
shipped globally. Post the acquisition of Belgium based ECU Line in 2006;
Allcargo became the second largest LCL consolidator in the world (next only to
Vanguard Logistics (USA).). With this acquisition ACLL now has operations in 90
countries. This gives ACLL the ability to offer global services and higher
execution control through presence at both ends of the cargo movement.
The slew of acquisitions undertaken by Allcargo over the last 10 years has
enabled the company to post 12.1% CAGR growth in volumes (in TEUs) over
CY10-FY14 period against the industry growth of 5%. During the same period
MTO revenues grew at 20% CAGR to `4,125 crores in FY14. Allcargo's acquired
companies have grown at a healthy pace over the years and have proved to be
EPS accretive. While the consolidated PAT of ACLL grew at 6.6% CAGR over
CY08-FY14 period, PAT of subsidiary companies flourished at 27.3% over the
same period reflecting management's ability to integrate operations efficiently.
Performance of its biggest subsidiary ECU Line, improved exponentially over the
years. Its EBITDA grew at a CAGR of 27.6% over CY05-FY14 period while
margins expanded by 430 bps to 5.2% as on Q3FY15.
Allcargo successfully completed many M&As
Source: Allcargo Logistics, Ventura Research
ECU Line structure
Source: Allcargo Logistics, Ventura Research
- 5 of 18- Wednesday 22nd
April, 2015
This document is for private circulation, and must be read in conjunction with the disclaimer on the last page.
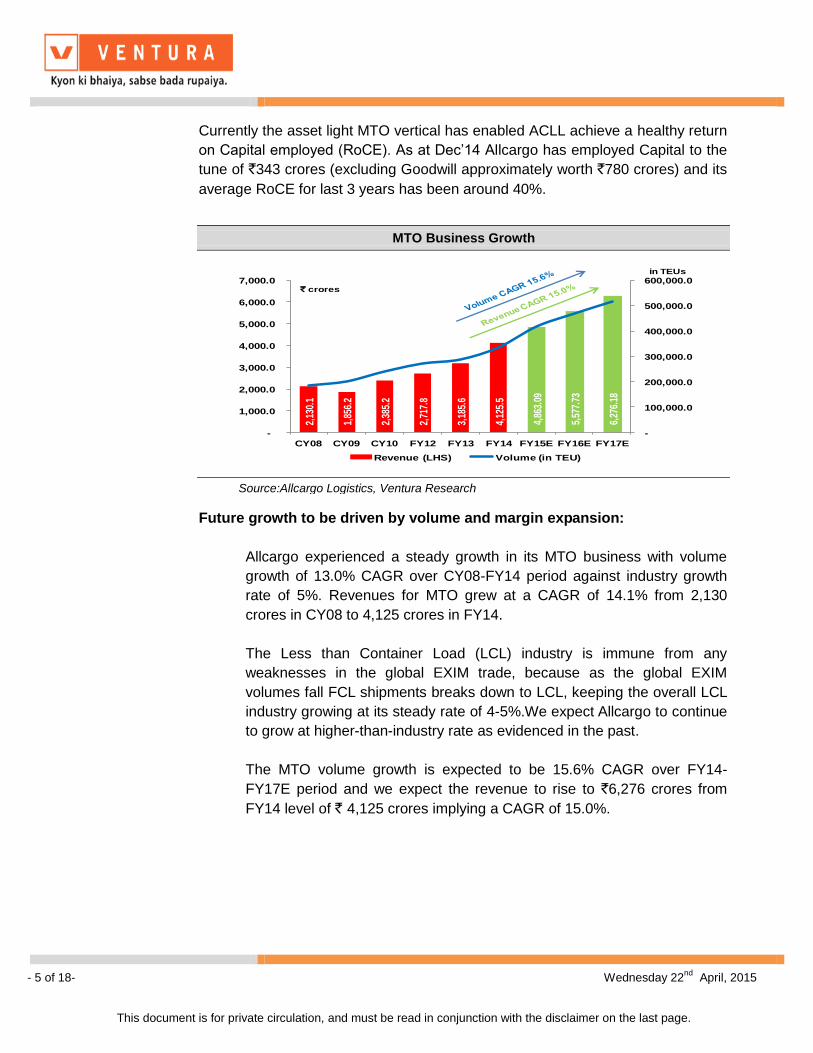
Currently the asset light MTO vertical has enabled ACLL achieve a healthy return
on Capital employed (RoCE). As at Dec’14 Allcargo has employed Capital to the
tune of `343 crores (excluding Goodwill approximately worth `780 crores) and its
average RoCE for last 3 years has been around 40%.
Future growth to be driven by volume and margin expansion:
Allcargo experienced a steady growth in its MTO business with volume
growth of 13.0% CAGR over CY08-FY14 period against industry growth
rate of 5%. Revenues for MTO grew at a CAGR of 14.1% from 2,130
crores in CY08 to 4,125 crores in FY14.
The Less than Container Load (LCL) industry is immune from any
weaknesses in the global EXIM trade, because as the global EXIM
volumes fall FCL shipments breaks down to LCL, keeping the overall LCL
industry growing at its steady rate of 4-5%.We expect Allcargo to continue
to grow at higher-than-industry rate as evidenced in the past.
The MTO volume growth is expected to be 15.6% CAGR over FY14-
FY17E period and we expect the revenue to rise to `6,276 crores from
FY14 level of ` 4,125 crores implying a CAGR of 15.0%.
MTO Business Growth
2,13
0.1
1,85
6.2
2,38
5.2
2,71
7.8
3,18
5.6
4,12
5.5
4,86
3.09
5,57
7.73
6,27
6.18
-
100,000.0
200,000.0
300,000.0
400,000.0
500,000.0
600,000.0
-
1,000.0
2,000.0
3,000.0
4,000.0
5,000.0
6,000.0
7,000.0
CY08 CY09 CY10 FY12 FY13 FY14 FY15E FY16E FY17E
Revenue (LHS) Volume (in TEU)
` crores
in TEUs
Source:Allcargo Logistics, Ventura Research
- 6 of 18- Wednesday 22nd
April, 2015
This document is for private circulation, and must be read in conjunction with the disclaimer on the last page.
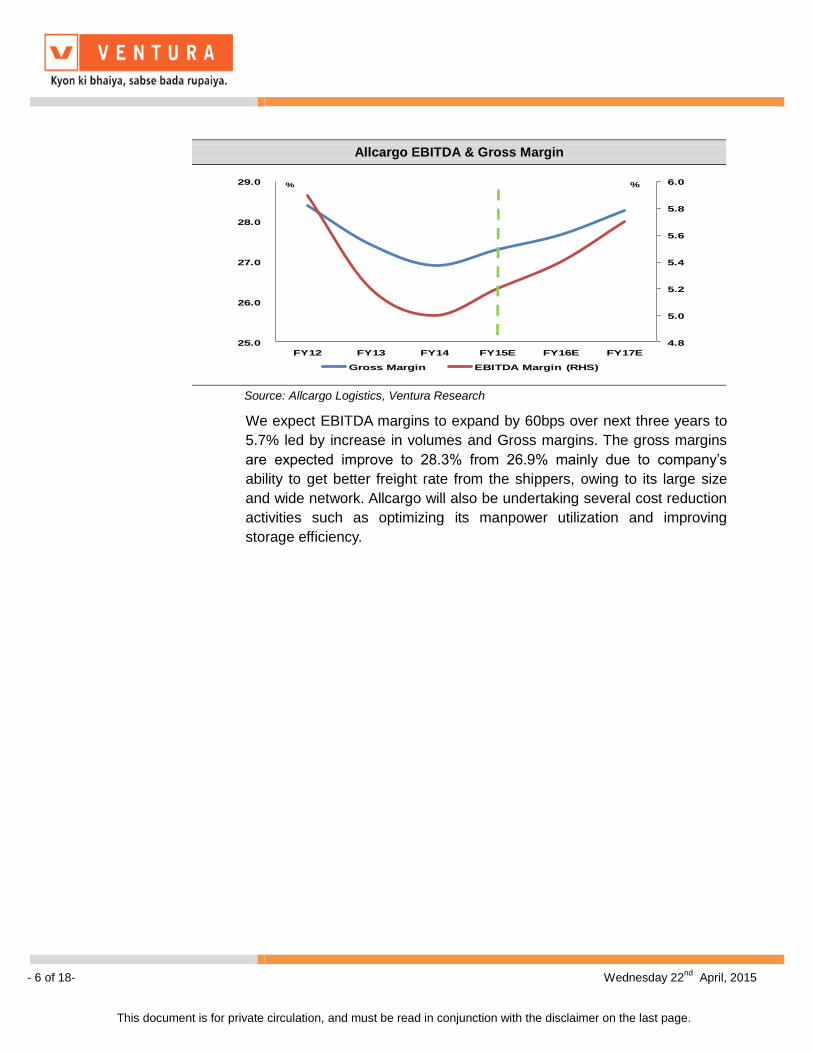
We expect EBITDA margins to expand by 60bps over next three years to
5.7% led by increase in volumes and Gross margins. The gross margins
are expected improve to 28.3% from 26.9% mainly due to company’s
ability to get better freight rate from the shippers, owing to its large size
and wide network. Allcargo will also be undertaking several cost reduction
activities such as optimizing its manpower utilization and improving
storage efficiency.
Allcargo EBITDA & Gross Margin
4.8
5.0
5.2
5.4
5.6
5.8
6.0
25.0
26.0
27.0
28.0
29.0
FY12 FY13 FY14 FY15E FY16E FY17E
Gross Margin EBITDA Margin (RHS)
% %
Source: Allcargo Logistics, Ventura Research
- 7 of 18- Wednesday 22nd
April, 2015
This document is for private circulation, and must be read in conjunction with the disclaimer on the last page.
;
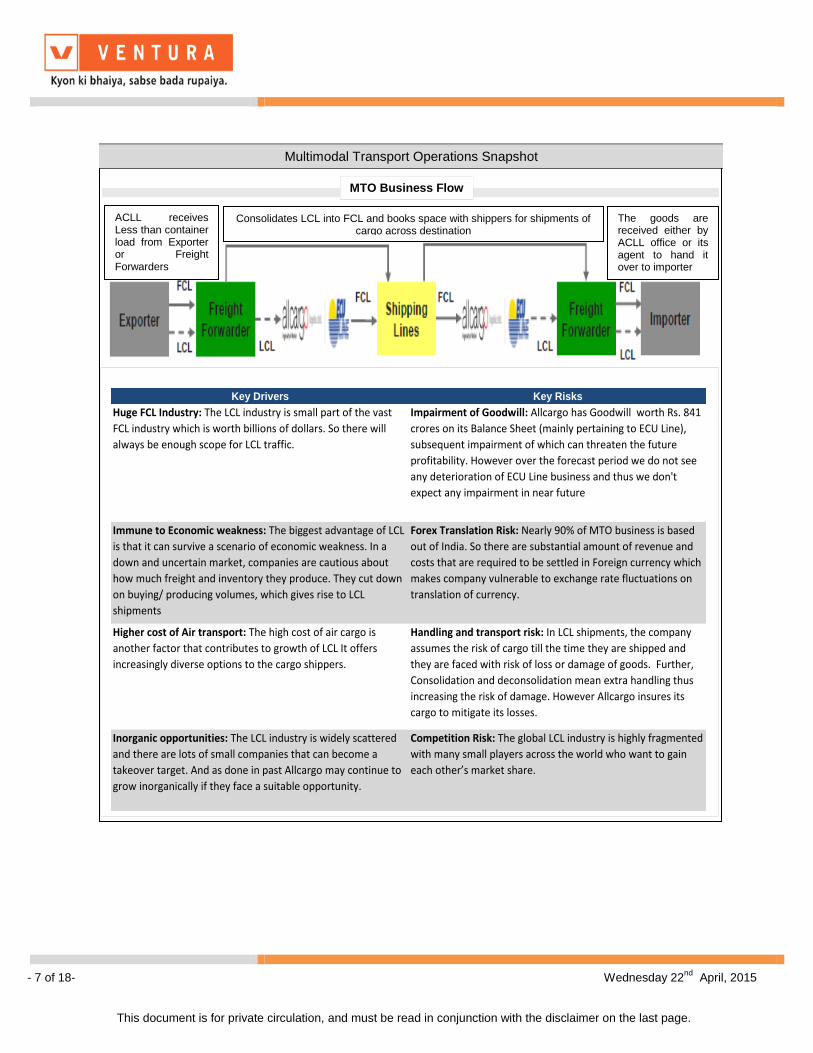
ACLL receives Less than container load from Exporter or Freight Forwarders
Consolidates LCL into FCL and books space with shippers for shipments of cargo across destination
The goods are received either by ACLL office or its agent to hand it over to importer
MTO Business Flow
Multimodal Transport Operations Snapshot
Key Drivers Key Risks
Huge FCL Industry: The LCL industry is small part of the vast
FCL industry which is worth billions of dollars. So there will
always be enough scope for LCL traffic.
Impairment of Goodwill: Allcargo has Goodwill worth Rs. 841
crores on its Balance Sheet (mainly pertaining to ECU Line),
subsequent impairment of which can threaten the future
profitability. However over the forecast period we do not see
any deterioration of ECU Line business and thus we don't
expect any impairment in near future
Immune to Economic weakness: The biggest advantage of LCL
is that it can survive a scenario of economic weakness. In a
down and uncertain market, companies are cautious about
how much freight and inventory they produce. They cut down
on buying/ producing volumes, which gives rise to LCL
shipments
Forex Translation Risk: Nearly 90% of MTO business is based
out of India. So there are substantial amount of revenue and
costs that are required to be settled in Foreign currency which
makes company vulnerable to exchange rate fluctuations on
translation of currency.
Higher cost of Air transport: The high cost of air cargo is
another factor that contributes to growth of LCL It offers
increasingly diverse options to the cargo shippers.
Handling and transport risk: In LCL shipments, the company
assumes the risk of cargo till the time they are shipped and
they are faced with risk of loss or damage of goods. Further,
Consolidation and deconsolidation mean extra handling thus
increasing the risk of damage. However Allcargo insures its
cargo to mitigate its losses.
Inorganic opportunities: The LCL industry is widely scattered
and there are lots of small companies that can become a
takeover target. And as done in past Allcargo may continue to
grow inorganically if they face a suitable opportunity.
Competition Risk: The global LCL industry is highly fragmented
with many small players across the world who want to gain
each other’s market share.
- 8 of 18- Wednesday 22nd
April, 2015
This document is for private circulation, and must be read in conjunction with the disclaimer on the last page.
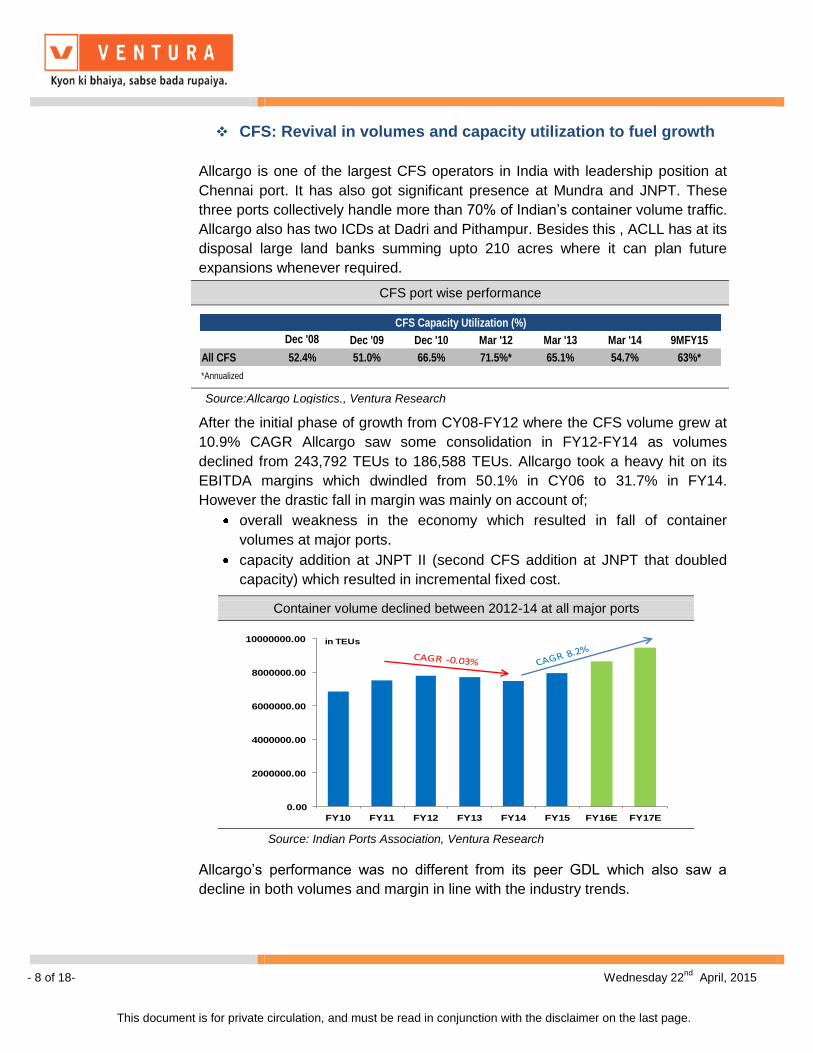
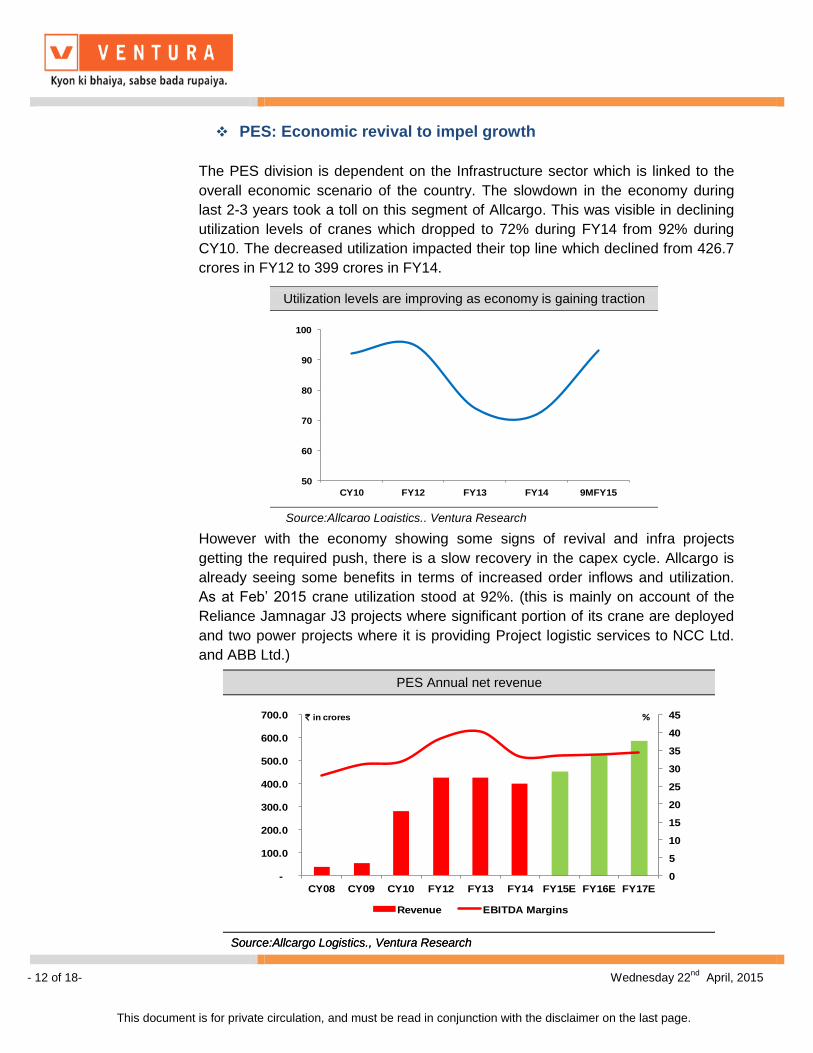
CFS: Revival in volumes and capacity utilization to fuel growth
Allcargo is one of the largest CFS operators in India with leadership position at
Chennai port. It has also got significant presence at Mundra and JNPT. These
three ports collectively handle more than 70% of Indian’s container volume traffic.
Allcargo also has two ICDs at Dadri and Pithampur. Besides this , ACLL has at its
disposal large land banks summing upto 210 acres where it can plan future
expansions whenever required.
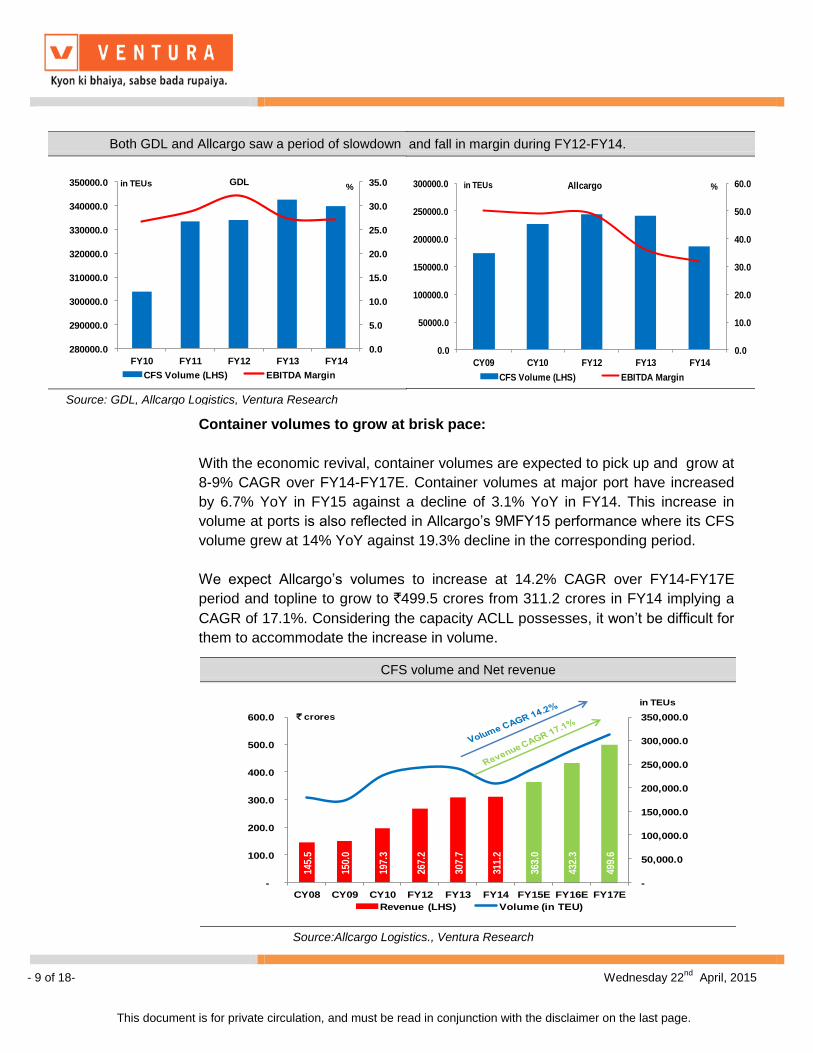
After the initial phase of growth from CY08-FY12 where the CFS volume grew at
10.9% CAGR Allcargo saw some consolidation in FY12-FY14 as volumes
declined from 243,792 TEUs to 186,588 TEUs. Allcargo took a heavy hit on its
EBITDA margins which dwindled from 50.1% in CY06 to 31.7% in FY14.
However the drastic fall in margin was mainly on account of;
overall weakness in the economy which resulted in fall of container
volumes at major ports.
capacity addition at JNPT II (second CFS addition at JNPT that doubled
capacity) which resulted in incremental fixed cost.
Allcargo’s performance was no different from its peer GDL which also saw a
decline in both volumes and margin in line with the industry trends.
Container volume declined between 2012-14 at all major ports
0.00
2000000.00
4000000.00
6000000.00
8000000.00
10000000.00
FY10 FY11 FY12 FY13 FY14 FY15 FY16E FY17E
in TEUs
Source: Indian Ports Association, Ventura Research
CFS port wise performance
Dec '08 Dec '09 Dec '10 Mar '12 Mar '13 Mar '14 9MFY15
All CFS 52.4% 51.0% 66.5% 71.5%* 65.1% 54.7% 63%*
*Annualized
CFS Capacity Utilization (%)
Source:Allcargo Logistics., Ventura Research
- 9 of 18- Wednesday 22nd
April, 2015
This document is for private circulation, and must be read in conjunction with the disclaimer on the last page.
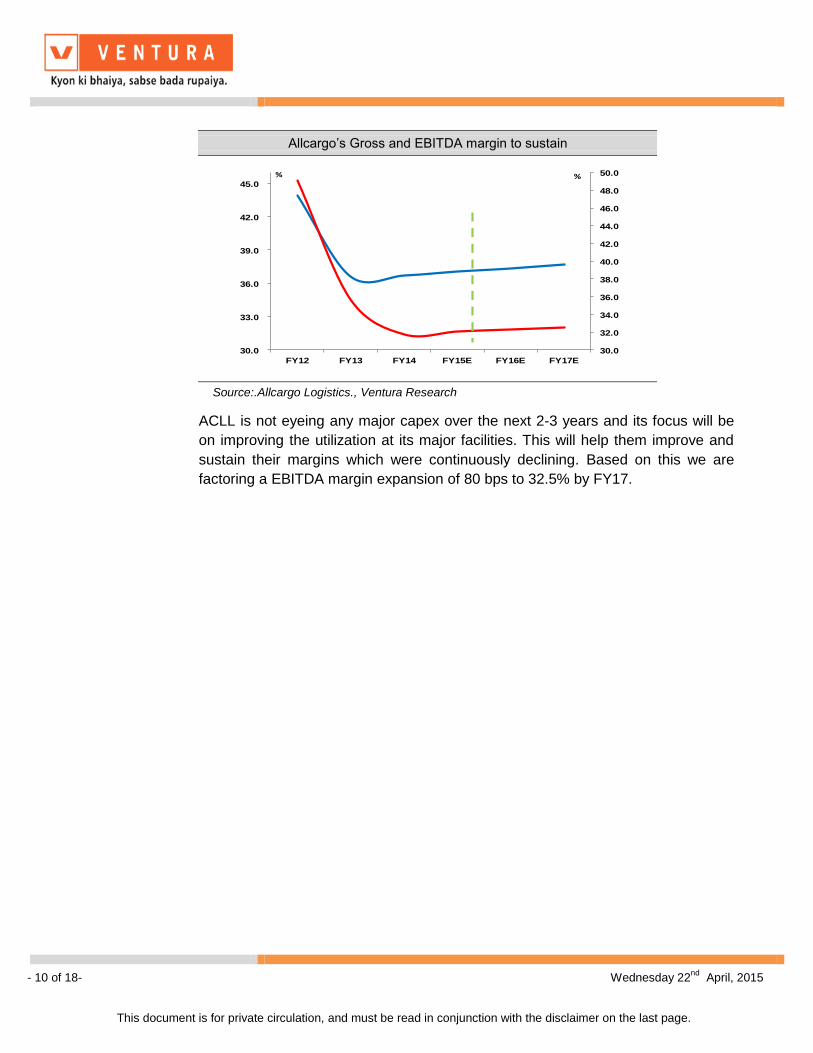
Container volumes to grow at brisk pace:
With the economic revival, container volumes are expected to pick up and grow at
8-9% CAGR over FY14-FY17E. Container volumes at major port have increased
by 6.7% YoY in FY15 against a decline of 3.1% YoY in FY14. This increase in
volume at ports is also reflected in Allcargo’s 9MFY15 performance where its CFS
volume grew at 14% YoY against 19.3% decline in the corresponding period.
We expect Allcargo’s volumes to increase at 14.2% CAGR over FY14-FY17E
period and topline to grow to `499.5 crores from 311.2 crores in FY14 implying a
CAGR of 17.1%. Considering the capacity ACLL possesses, it won’t be difficult for
them to accommodate the increase in volume.
CFS volume and Net revenue
145.
5
150.
0
197.
3
267.
2
307.
7
311.
2
363.
0
432.
3
499.
6
-
50,000.0
100,000.0
150,000.0
200,000.0
250,000.0
300,000.0
350,000.0
-
100.0
200.0
300.0
400.0
500.0
600.0
CY08 CY09 CY10 FY12 FY13 FY14 FY15E FY16E FY17E
Revenue (LHS) Volume (in TEU)
` crores
in TEUs
Source:Allcargo Logistics., Ventura Research
Both GDL and Allcargo saw a period of slowdown
0.0
5.0
10.0
15.0
20.0
25.0
30.0
35.0
280000.0
290000.0
300000.0
310000.0
320000.0
330000.0
340000.0
350000.0
FY10 FY11 FY12 FY13 FY14
CFS Volume (LHS) EBITDA Margin
in TEUs %GDL
Source: GDL, Allcargo Logistics, Ventura Research
and fall in margin during FY12-FY14.
0.0
10.0
20.0
30.0
40.0
50.0
60.0
0.0
50000.0
100000.0
150000.0
200000.0
250000.0
300000.0
CY09 CY10 FY12 FY13 FY14
CFS Volume (LHS) EBITDA Margin
in TEUs %Allcargo
- 10 of 18- Wednesday 22nd
April, 2015
This document is for private circulation, and must be read in conjunction with the disclaimer on the last page.
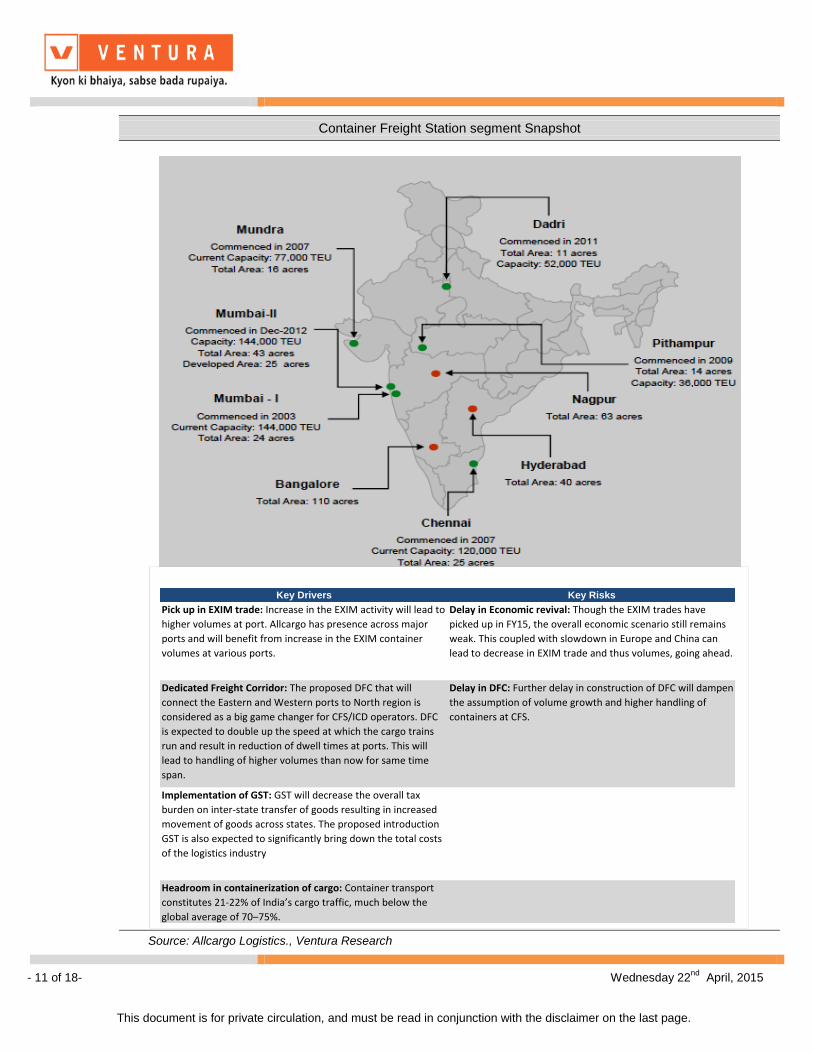
ACLL is not eyeing any major capex over the next 2-3 years and its focus will be
on improving the utilization at its major facilities. This will help them improve and
sustain their margins which were continuously declining. Based on this we are
factoring a EBITDA margin expansion of 80 bps to 32.5% by FY17.
Allcargo’s Gross and EBITDA margin to sustain
30.0
32.0
34.0
36.0
38.0
40.0
42.0
44.0
46.0
48.0
50.0
30.0
33.0
36.0
39.0
42.0
45.0
FY12 FY13 FY14 FY15E FY16E FY17E
%%
Source:.Allcargo Logistics., Ventura Research
- 11 of 18- Wednesday 22nd
April, 2015
This document is for private circulation, and must be read in conjunction with the disclaimer on the last page.
Container Freight Station segment Snapshot
Source: Allcargo Logistics., Ventura Research
Key Drivers Key Risks
Pick up in EXIM trade: Increase in the EXIM activity will lead to
higher volumes at port. Allcargo has presence across major
ports and will benefit from increase in the EXIM container
volumes at various ports.
Delay in Economic revival: Though the EXIM trades have
picked up in FY15, the overall economic scenario still remains
weak. This coupled with slowdown in Europe and China can
lead to decrease in EXIM trade and thus volumes, going ahead.
Dedicated Freight Corridor: The proposed DFC that will
connect the Eastern and Western ports to North region is
considered as a big game changer for CFS/ICD operators. DFC
is expected to double up the speed at which the cargo trains
run and result in reduction of dwell times at ports. This will
lead to handling of higher volumes than now for same time
span.
Delay in DFC: Further delay in construction of DFC will dampen
the assumption of volume growth and higher handling of
containers at CFS.
Implementation of GST: GST will decrease the overall tax
burden on inter-state transfer of goods resulting in increased
movement of goods across states. The proposed introduction
GST is also expected to significantly bring down the total costs
of the logistics industry
Headroom in containerization of cargo: Container transport
constitutes 21-22% of India’s cargo traffic, much below the
global average of 70–75%.
- 12 of 18- Wednesday 22nd
April, 2015
This document is for private circulation, and must be read in conjunction with the disclaimer on the last page.
PES: Economic revival to impel growth
The PES division is dependent on the Infrastructure sector which is linked to the
overall economic scenario of the country. The slowdown in the economy during
last 2-3 years took a toll on this segment of Allcargo. This was visible in declining
utilization levels of cranes which dropped to 72% during FY14 from 92% during
CY10. The decreased utilization impacted their top line which declined from 426.7
crores in FY12 to 399 crores in FY14.
However with the economy showing some signs of revival and infra projects
getting the required push, there is a slow recovery in the capex cycle. Allcargo is
already seeing some benefits in terms of increased order inflows and utilization.
As at Feb’ 2015 crane utilization stood at 92%. (this is mainly on account of the
Reliance Jamnagar J3 projects where significant portion of its crane are deployed
and two power projects where it is providing Project logistic services to NCC Ltd.
and ABB Ltd.)
Utilization levels are improving as economy is gaining traction
50
60
70
80
90
100
CY10 FY12 FY13 FY14 9MFY15
Source:Allcargo Logistics., Ventura Research
PES Annual net revenue
0
5
10
15
20
25
30
35
40
45
-
100.0
200.0
300.0
400.0
500.0
600.0
700.0
CY08 CY09 CY10 FY12 FY13 FY14 FY15E FY16E FY17E
Revenue EBITDA Margins
%` in crores
Source:Allcargo Logistics., Ventura Research
PES Annual net revenue
0
5
10
15
20
25
30
35
40
45
-
100.0
200.0
300.0
400.0
500.0
600.0
700.0
CY08 CY09 CY10 FY12 FY13 FY14 FY15E FY16E FY17E
Revenue EBITDA Margins
%` in crores
Source:Allcargo Logistics., Ventura Research
- 13 of 18- Wednesday 22nd
April, 2015
This document is for private circulation, and must be read in conjunction with the disclaimer on the last page.
In coming years we expect an uptick in the revenue on the back of pick up in the
economy and improved utilization. The EBITDA margins which tumbled from
40.1% to 33.4 in FY 14 are expected to expand by 90bps to 34.3% by FY17E. We
expect the revenue to increase at 13.6% CAGR to `585.3 crores by FY17E.
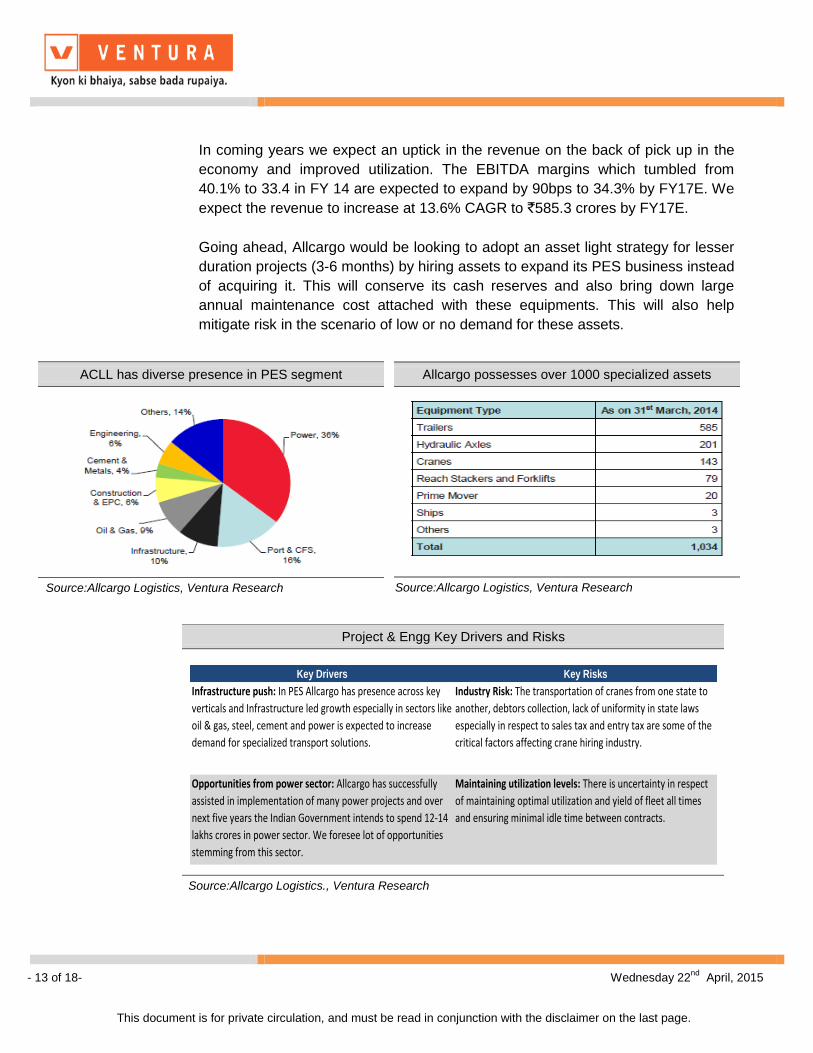
Going ahead, Allcargo would be looking to adopt an asset light strategy for lesser
duration projects (3-6 months) by hiring assets to expand its PES business instead
of acquiring it. This will conserve its cash reserves and also bring down large
annual maintenance cost attached with these equipments. This will also help
mitigate risk in the scenario of low or no demand for these assets.
Allcargo possesses over 1000 specialized assets
Source:Allcargo Logistics, Ventura Research
ACLL has diverse presence in PES segment
Source:Allcargo Logistics, Ventura Research
Project & Engg Key Drivers and Risks
Key Drivers Key Risks
Infrastructure push: In PES Allcargo has presence across key
verticals and Infrastructure led growth especially in sectors like
oil & gas, steel, cement and power is expected to increase
demand for specialized transport solutions.
Industry Risk: The transportation of cranes from one state to
another, debtors collection, lack of uniformity in state laws
especially in respect to sales tax and entry tax are some of the
critical factors affecting crane hiring industry.
Opportunities from power sector: Allcargo has successfully
assisted in implementation of many power projects and over
next five years the Indian Government intends to spend 12-14
lakhs crores in power sector. We foresee lot of opportunities
stemming from this sector.
Maintaining utilization levels: There is uncertainty in respect
of maintaining optimal utilization and yield of fleet all times
and ensuring minimal idle time between contracts.
Source:Allcargo Logistics., Ventura Research
- 14 of 18- Wednesday 22nd
April, 2015
This document is for private circulation, and must be read in conjunction with the disclaimer on the last page.
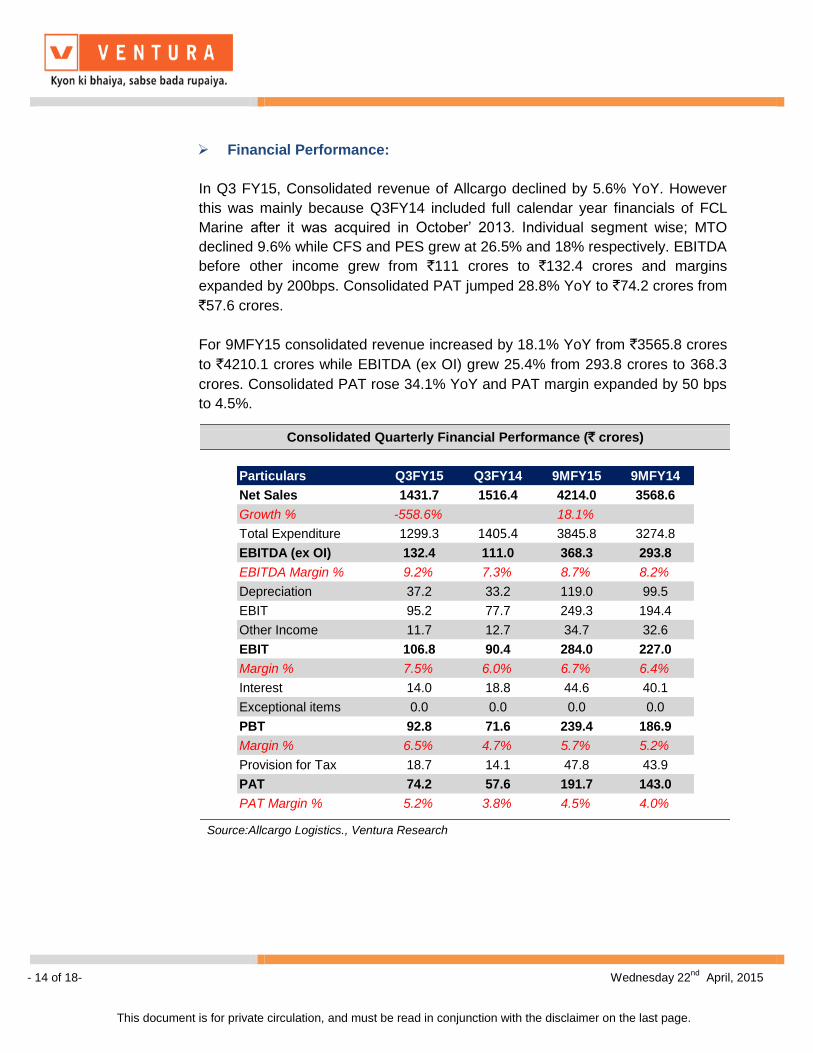
Financial Performance:
In Q3 FY15, Consolidated revenue of Allcargo declined by 5.6% YoY. However
this was mainly because Q3FY14 included full calendar year financials of FCL
Marine after it was acquired in October’ 2013. Individual segment wise; MTO
declined 9.6% while CFS and PES grew at 26.5% and 18% respectively. EBITDA
before other income grew from `111 crores to `132.4 crores and margins
expanded by 200bps. Consolidated PAT jumped 28.8% YoY to `74.2 crores from
`57.6 crores.
For 9MFY15 consolidated revenue increased by 18.1% YoY from `3565.8 crores
to `4210.1 crores while EBITDA (ex OI) grew 25.4% from 293.8 crores to 368.3
crores. Consolidated PAT rose 34.1% YoY and PAT margin expanded by 50 bps
to 4.5%.
Consolidated Quarterly Financial Performance (` crores)
Particulars Q3FY15 Q3FY14 9MFY15 9MFY14
Net Sales 1431.7 1516.4 4214.0 3568.6
Growth % -558.6% 18.1%
Total Expenditure 1299.3 1405.4 3845.8 3274.8
EBITDA (ex OI) 132.4 111.0 368.3 293.8
EBITDA Margin % 9.2% 7.3% 8.7% 8.2%
Depreciation 37.2 33.2 119.0 99.5
EBIT 95.2 77.7 249.3 194.4
Other Income 11.7 12.7 34.7 32.6
EBIT 106.8 90.4 284.0 227.0
Margin % 7.5% 6.0% 6.7% 6.4%
Interest 14.0 18.8 44.6 40.1
Exceptional items 0.0 0.0 0.0 0.0
PBT 92.8 71.6 239.4 186.9
Margin % 6.5% 4.7% 5.7% 5.2%
Provision for Tax 18.7 14.1 47.8 43.9
PAT 74.2 57.6 191.7 143.0
PAT Margin % 5.2% 3.8% 4.5% 4.0%
Source:Allcargo Logistics., Ventura Research
- 15 of 18- Wednesday 22nd
April, 2015
This document is for private circulation, and must be read in conjunction with the disclaimer on the last page.
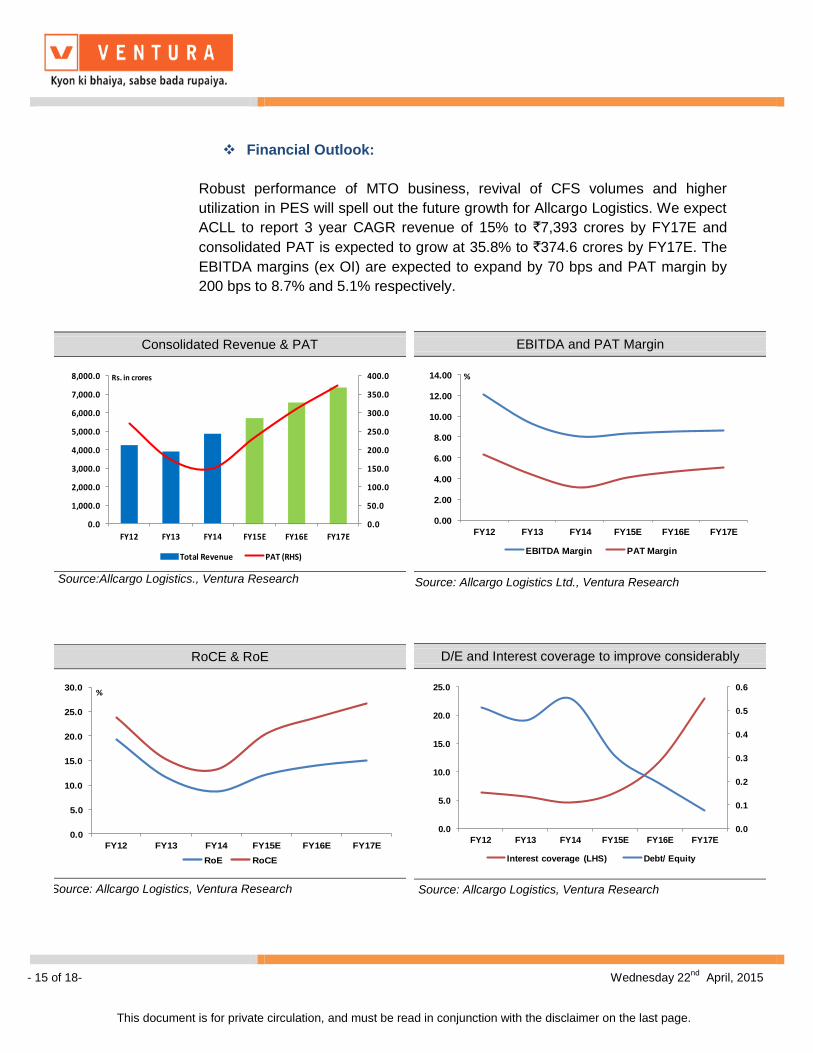
Financial Outlook:
Robust performance of MTO business, revival of CFS volumes and higher
utilization in PES will spell out the future growth for Allcargo Logistics. We expect
ACLL to report 3 year CAGR revenue of 15% to `7,393 crores by FY17E and
consolidated PAT is expected to grow at 35.8% to `374.6 crores by FY17E. The
EBITDA margins (ex OI) are expected to expand by 70 bps and PAT margin by
200 bps to 8.7% and 5.1% respectively.
Consolidated Revenue & PAT
0.0
50.0
100.0
150.0
200.0
250.0
300.0
350.0
400.0
0.0
1,000.0
2,000.0
3,000.0
4,000.0
5,000.0
6,000.0
7,000.0
8,000.0
FY12 FY13 FY14 FY15E FY16E FY17E
Total Revenue PAT (RHS)
Rs. in crores
Source:Allcargo Logistics., Ventura Research
EBITDA and PAT Margin
0.00
2.00
4.00
6.00
8.00
10.00
12.00
14.00
FY12 FY13 FY14 FY15E FY16E FY17E
EBITDA Margin PAT Margin
%
Source: Allcargo Logistics Ltd., Ventura Research
RoCE & RoE
0.0
5.0
10.0
15.0
20.0
25.0
30.0
FY12 FY13 FY14 FY15E FY16E FY17E
RoE RoCE
%
Source: Allcargo Logistics, Ventura Research
D/E and Interest coverage to improve considerably
0.0
0.1
0.2
0.3
0.4
0.5
0.6
0.0
5.0
10.0
15.0
20.0
25.0
FY12 FY13 FY14 FY15E FY16E FY17E
Interest coverage (LHS) Debt/ Equity
Source: Allcargo Logistics, Ventura Research
- 16 of 18- Wednesday 22nd
April, 2015
This document is for private circulation, and must be read in conjunction with the disclaimer on the last page.
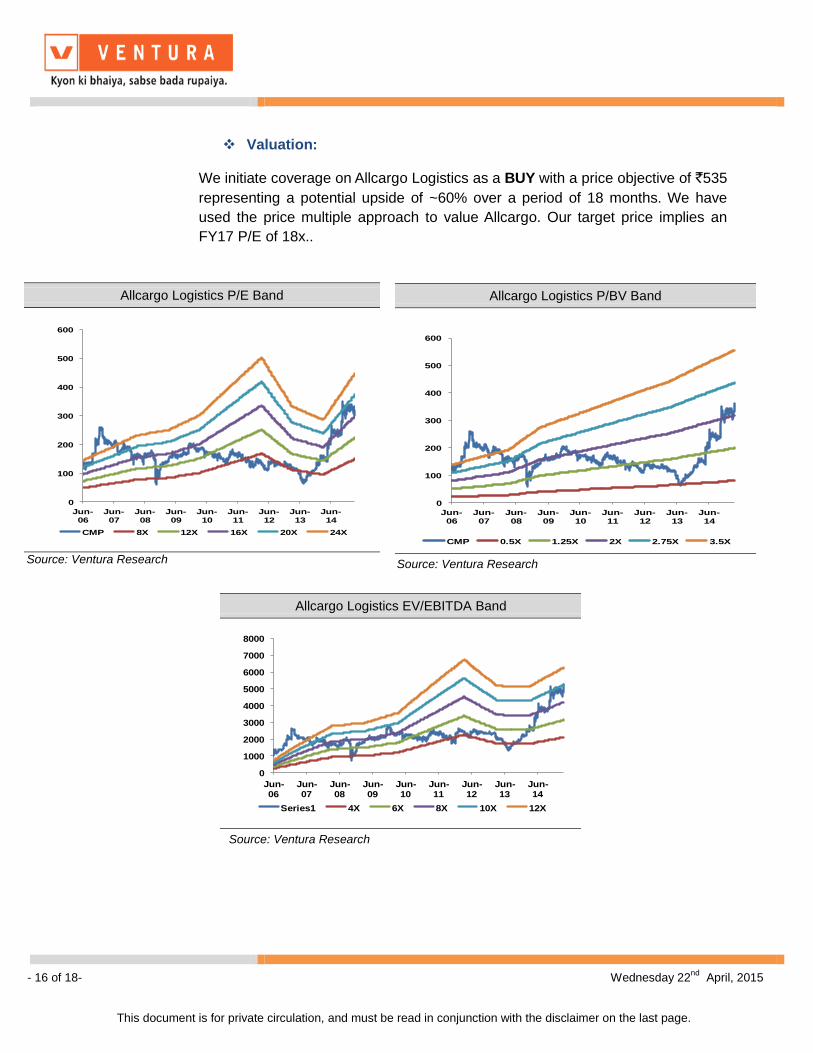
Valuation:
We initiate coverage on Allcargo Logistics as a BUY with a price objective of `535
representing a potential upside of ~60% over a period of 18 months. We have
used the price multiple approach to value Allcargo. Our target price implies an
FY17 P/E of 18x..
Allcargo Logistics P/E Band
0
100
200
300
400
500
600
Jun-06
Jun-07
Jun-08
Jun-09
Jun-10
Jun-11
Jun-12
Jun-13
Jun-14
CMP 8X 12X 16X 20X 24X
Source: Ventura Research
Allcargo Logistics P/BV Band
0
100
200
300
400
500
600
Jun-06
Jun-07
Jun-08
Jun-09
Jun-10
Jun-11
Jun-12
Jun-13
Jun-14
CMP 0.5X 1.25X 2X 2.75X 3.5X
Source: Ventura Research
Allcargo Logistics EV/EBITDA Band
0
1000
2000
3000
4000
5000
6000
7000
8000
Jun-06
Jun-07
Jun-08
Jun-09
Jun-10
Jun-11
Jun-12
Jun-13
Jun-14
Series1 4X 6X 8X 10X 12X
Source: Ventura Research
- 17 of 18- Wednesday 22nd
April, 2015
This document is for private circulation, and must be read in conjunction with the disclaimer on the last page.
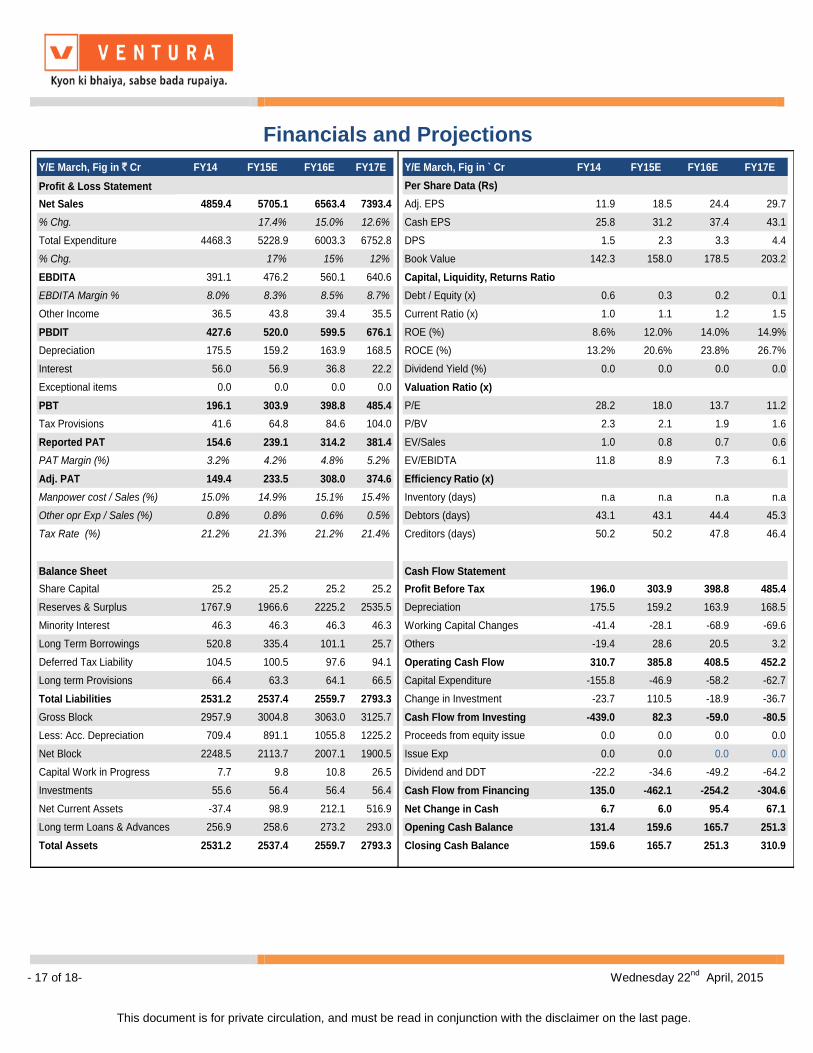
Financials and Projections
Y/E March, Fig in ` Cr FY14 FY15E FY16E FY17E Y/E March, Fig in ` Cr FY14 FY15E FY16E FY17E
Profit & Loss Statement Per Share Data (Rs)
Net Sales 4859.4 5705.1 6563.4 7393.4 Adj. EPS 11.9 18.5 24.4 29.7
% Chg. 17.4% 15.0% 12.6% Cash EPS 25.8 31.2 37.4 43.1
Total Expenditure 4468.3 5228.9 6003.3 6752.8 DPS 1.5 2.3 3.3 4.4
% Chg. 17% 15% 12% Book Value 142.3 158.0 178.5 203.2
EBDITA 391.1 476.2 560.1 640.6 Capital, Liquidity, Returns Ratio
EBDITA Margin % 8.0% 8.3% 8.5% 8.7% Debt / Equity (x) 0.6 0.3 0.2 0.1
Other Income 36.5 43.8 39.4 35.5 Current Ratio (x) 1.0 1.1 1.2 1.5
PBDIT 427.6 520.0 599.5 676.1 ROE (%) 8.6% 12.0% 14.0% 14.9%
Depreciation 175.5 159.2 163.9 168.5 ROCE (%) 13.2% 20.6% 23.8% 26.7%
Interest 56.0 56.9 36.8 22.2 Dividend Yield (%) 0.0 0.0 0.0 0.0
Exceptional items 0.0 0.0 0.0 0.0 Valuation Ratio (x)
PBT 196.1 303.9 398.8 485.4 P/E 28.2 18.0 13.7 11.2
Tax Provisions 41.6 64.8 84.6 104.0 P/BV 2.3 2.1 1.9 1.6
Reported PAT 154.6 239.1 314.2 381.4 EV/Sales 1.0 0.8 0.7 0.6
PAT Margin (%) 3.2% 4.2% 4.8% 5.2% EV/EBIDTA 11.8 8.9 7.3 6.1
Adj. PAT 149.4 233.5 308.0 374.6 Efficiency Ratio (x)
Manpower cost / Sales (%) 15.0% 14.9% 15.1% 15.4% Inventory (days) n.a n.a n.a n.a
Other opr Exp / Sales (%) 0.8% 0.8% 0.6% 0.5% Debtors (days) 43.1 43.1 44.4 45.3
Tax Rate (%) 21.2% 21.3% 21.2% 21.4% Creditors (days) 50.2 50.2 47.8 46.4
Balance Sheet Cash Flow Statement
Share Capital 25.2 25.2 25.2 25.2 Profit Before Tax 196.0 303.9 398.8 485.4
Reserves & Surplus 1767.9 1966.6 2225.2 2535.5 Depreciation 175.5 159.2 163.9 168.5
Minority Interest 46.3 46.3 46.3 46.3 Working Capital Changes -41.4 -28.1 -68.9 -69.6
Long Term Borrowings 520.8 335.4 101.1 25.7 Others -19.4 28.6 20.5 3.2
Deferred Tax Liability 104.5 100.5 97.6 94.1 Operating Cash Flow 310.7 385.8 408.5 452.2
Long term Provisions 66.4 63.3 64.1 66.5 Capital Expenditure -155.8 -46.9 -58.2 -62.7
Total Liabilities 2531.2 2537.4 2559.7 2793.3 Change in Investment -23.7 110.5 -18.9 -36.7
Gross Block 2957.9 3004.8 3063.0 3125.7 Cash Flow from Investing -439.0 82.3 -59.0 -80.5
Less: Acc. Depreciation 709.4 891.1 1055.8 1225.2 Proceeds from equity issue 0.0 0.0 0.0 0.0
Net Block 2248.5 2113.7 2007.1 1900.5 Issue Exp 0.0 0.0 0.0 0.0
Capital Work in Progress 7.7 9.8 10.8 26.5 Dividend and DDT -22.2 -34.6 -49.2 -64.2
Investments 55.6 56.4 56.4 56.4 Cash Flow from Financing 135.0 -462.1 -254.2 -304.6
Net Current Assets -37.4 98.9 212.1 516.9 Net Change in Cash 6.7 6.0 95.4 67.1
Long term Loans & Advances 256.9 258.6 273.2 293.0 Opening Cash Balance 131.4 159.6 165.7 251.3
Total Assets 2531.2 2537.4 2559.7 2793.3 Closing Cash Balance 159.6 165.7 251.3 310.9
- 18 of 18- Wednesday 22nd
April, 2015
This document is for private circulation, and must be read in conjunction with the disclaimer on the last page.
Disclosures and Disclaimer Ventura Securities Limited (VSL) is a SEBI registered intermediary offering broking, depository and portfolio management services to clients. VSL is member of BSE, NSE and MCX-SX. VSL is a depository participant of NSDL. VSL states that no disciplinary action whatsoever has been taken by SEBI against it in last five years except administrative warning issued in connection with technical and venial lapses observed while inspection of books of accounts and records. Ventura Commodities Limited, Ventura Guaranty Limited, Ventura Insurance Brokers Limited and Ventura Allied Services Private Limited are associates of VSL. Research Analyst (RA) involved in the preparation of this research report and VSL disclose that neither RA nor VSL nor its associates (i) have any financial interest in the company which is the subject matter of this research report (ii) holds ownership of one percent or more in the securities of subject company (iii) have any material conflict of interest at the time of publication of this research report (iv) have received any compensation from the subject company in the past twelve months (v) have managed or co-managed public offering of securities for the subject company in past twelve months (vi) have received any compensation for investment banking merchant banking or brokerage services from the subject company in the past twelve months (vii) have received any compensation for product or services from the subject company in the past twelve months (viii) have received any compensation or other benefits from the subject company or third party in connection with the research report. RA involved in the preparation of this research report discloses that he / she has not served as an officer, director or employee of the subject company. RA involved in the preparation of this research report and VSL discloses that they have not been engaged in the market making activity for the subject company. Our sales people, dealers, traders and other professionals may provide oral or written market commentary or trading strategies to our clients that reflect opinions that are contrary to the opinions expressed herein. We may have earlier issued or may issue in future reports on the companies covered herein with recommendations/ information inconsistent or different those made in this report. In reviewing this document, you should be aware that any or all of the foregoing, among other things, may give rise to or potential conflicts of interest. We may rely on information barriers, such as "Chinese Walls" to control the flow of information contained in one or more areas within us, or other areas, units, groups or affiliates of VSL. This report is for information purposes only and this document/material should not be construed as an offer to sell or the solicitation of an offer to buy, purchase or subscribe to any securities, and neither this document nor anything contained herein shall form the basis of or be relied upon in connection with any contract or commitment whatsoever. This document does not solicit any action based on the material contained herein. It is for the general information of the clients / prospective clients of VSL. VSL will not treat recipients as clients by virtue of their receiving this report. It does not constitute a personal recommendation or take into account the particular investment objectives, financial situations, or needs of clients / prospective clients. Similarly, this document does not have regard to the specific investment objectives, financial situation/circumstances and the particular needs of any specific person who may receive this document. The securities discussed in this report may not be suitable for all investors. The appropriateness of a particular investment or strategy will depend on an investor's individual circumstances and objectives. Persons who may receive this document should consider and independently evaluate whether it is suitable for his/ her/their particular circumstances and, if necessary, seek professional/financial advice. And such person shall be responsible for conducting his/her/their own investigation and analysis of the information contained or referred to in this document and of evaluating the merits and risks involved in the securities forming the subject matter of this document. The projections and forecasts described in this report were based upon a number of estimates and assumptions and are inherently subject to significant uncertainties and contingencies. Projections and forecasts are necessarily speculative in nature, and it can be expected that one or more of the estimates on which the projections and forecasts were based will not materialize or will vary significantly from actual results, and such variances will likely increase over time. All projections and forecasts described in this report have been prepared solely by the authors of this report independently of the Company. These projections and forecasts were not prepared with a view toward compliance with published guidelines or generally accepted accounting principles. No independent accountants have expressed an opinion or any other form of assurance on these projections or forecasts. You should not regard the inclusion of the projections and forecasts described herein as a representation or warranty by VSL, its associates, the authors of this report or any other person that these projections or forecasts or their underlying assumptions will be achieved. For these reasons, you should only consider the projections and forecasts described in this report after carefully evaluating all of the information in this report, including the assumptions underlying such projections and forecasts. The price and value of the investments referred to in this document/material and the income from them may go down as well as up, and investors may realize losses on any investments. Past performance is not a guide for future performance. Future returns are not guaranteed and a loss of original capital may occur. Actual results may differ materially from those set forth in projections. Forward-looking statements are not predictions and may be subject to change without notice. We do not provide tax advice to our clients, and all investors are strongly advised to consult regarding any potential investment. VSL, the RA involved in the preparation of this research report and its associates accept no liabilities for any loss or damage of any kind arising out of the use of this report. This report/document has been prepared by VSL, based upon information available to the public and sources, believed to be reliable. No representation or warranty, express or implied is made that it is accurate or complete. VSL has reviewed the report and, in so far as it includes current or historical information, it is believed to be reliable, although its accuracy and completeness cannot be guaranteed. The opinions expressed in this document/material are subject to change without notice and have no obligation to tell you when opinions or information in this report change. This report or recommendations or information contained herein do/does not constitute or purport to constitute investment advice in publicly accessible media and should not be reproduced, transmitted or published by the recipient. The report is for the use and consumption of the recipient only. This publication may not be distributed to the public used by the public media without the express written consent of VSL. This report or any portion hereof may not be printed, sold or distributed without the written consent of VSL. This document does not constitute an offer or invitation to subscribe for or purchase or deal in any securities and neither this document nor anything contained herein shall form the basis of any contract or commitment whatsoever. This document is strictly confidential and is being furnished to you solely for your information, may not be distributed to the press or other media and may not be reproduced or redistributed to any other person. The opinions and projections expressed herein are entirely those of the author and are given as part of the normal research activity of VSL and are given as of this date and are subject to change without notice. Any opinion estimate or projection herein constitutes a view as of the date of this report and there can be no assurance that future results or events will be consistent with any such opinions, estimate or projection. This document has not been prepared by or in conjunction with or on behalf of or at the instigation of, or by arrangement with the company or any of its directors or any other person. Information in this document must not be relied upon as having been authorized or approved by the company or its directors or any other person. Any opinions and projections contained herein are entirely those of the authors. None of the company or its directors or any other person accepts any liability whatsoever for any loss arising from any use of this document or its contents or otherwise arising in connection therewith. The information contained herein is not intended for publication or distribution or circulation in any manner whatsoever and any unauthorized reading, dissemination, distribution or copying of this communication is prohibited unless otherwise expressly authorized. Please ensure that you have read “Risk Disclosure Document for Capital Market and Derivatives Segments” as prescribed by Securities and Exchange Board of India before investing in Securities Market. Ventura Securities Limited Corporate Office: C-112/116, Bldg No. 1, Kailash Industrial Complex, Park Site, Vikhroli (W), Mumbai – 400079