
All you wanted to know about Jobs in India but were afraid ......All you wanted to know about Jobs...
45
1 All you wanted to know about Jobs in India – but were afraid to ask July 9, 2018 Surjit S. Bhalla* [email protected] Tirthatanmoy Das Indian Institute of Management Bangalore and IZA [email protected] *A background report for the EACPM; We would like to thank Abhinav Motheram for excellent research assistance. The analyses presented in this paper are our own, and do not necessarily reflect the positions or views of the Institutions/Organizations with which we are affiliated.
Transcript of All you wanted to know about Jobs in India but were afraid ......All you wanted to know about Jobs...

1
All you wanted to know about Jobs in India – but were afraid to ask
July 9, 2018
Surjit S. Bhalla*
Tirthatanmoy Das
Indian Institute of Management Bangalore and IZA
*A background report for the EACPM; We would like to thank Abhinav Motheram for excellent
research assistance. The analyses presented in this paper are our own, and do not necessarily
reflect the positions or views of the Institutions/Organizations with which we are affiliated.

2
Executive Summary
1. Non-availability of benchmark employment surveys since 2011/12
There is great uncertainty with regard to the status of job creation in the last four years i.e. since
May 2014 when Mr. Modi became Prime Minister of India. The uncertainty has been caused by
the lack of a large scale NSSO survey on employment – the last such survey was in 2011/12.
However, employment data conducted by the Labor Bureau for 2014 (EUS4) and 2015 (EUS5)
are available. The EUS4 survey covers the period prior to Modi becoming PM, and thus
presents an “ideal” initial condition reference point.
In this early 2014 survey, the estimated employment in India was 428 million for the age-group
>=15 years. This is according to the principal status method of measuring employment. Our
estimate for employment in 2017, according to principal status, is 449.8 million, a job gain of
12.8 million over the 2016 employment estimate of 437 million.
2. Economic Conditions since May 2014
The Modi government has undertaken several economic reforms over the last four years, and it
is important to assess the growth, and employment, benefits of these reforms. In addition, some
reforms have been specifically geared towards employment – e.g. the emphasis on road
construction (a labor intensive activity) and the MUDRA initiative (provision of loans to small
entrepreneurs).
The first two years – 2014/15 and 2015/16 – after Modi became PM were drought years, only the
fourth time in the last 150 years that this has happened. Droughts are not conducive to
economic growth, nor conducive to agricultural (rural) employment.
The next two years the weather was normal, but two major economic reforms were undertaken
– demonetization and GST. Both reforms have (had) several objectives; in the main, they have
had a considerable effect on direct tax compliance (demonetization) and indirect tax collection
(GST). Both these reforms introduce uncertainty, and hence, in the short-run, affect economic
growth and employment generation.
In addition, the BJP government also inherited a broken state banking sector; NPA’s at a
decadal high and close to 8 % for state owned banks. Again, reform of banking is non-growth
enhancing in the short run.
Finally, as if growth diminishing factors were not present in abundance, the Indian economy
witnessed the largest increase in real policy rates post 2014. In May 2014, the monetary policy
repo rate was at 8 % and CPI inflation was at 8.3 % i.e. a real policy rate of -0.3 %. The average
real policy rate for fiscal year 2017/18 was 2.5 %, the highest observed in India since the start of
the repo regime in FY2005 when the real policy rate was 2.07 %, and the third highest in the
world (behind Brazil and Russia). Each 1 % increase in the real lending rate leads to a 0.5 %
decline in non-agricultural growth.

3
Thus, there have been several factors arguing against “extra” employment generation in
2017/18.
3. Jobs Promise by PM Modi.
It is popularly believed that PM Narendra Modi had promised the generation of 10 million jobs
a year. We find no record of any such statement. In the BJP Election Manifesto 2014, there is the
following statement “The country has been dragged through 10 years of Jobless Growth by the
Congress-led UPA Government”. At a campaign rally in Agra in August 2013, candidate Modi
did talk about the lack of job generation in the UPA years. In the speech, Modi promised that if
the BJP/NDA was to be elected, they would create 10 million jobs for the youth of the country
(youth defined as those younger than 35 years). This is the only reference to job creation. There
is no reference to the promise of 10 million jobs per year that we could find.
4. Jobs creation post 2013 and specifically 2017/18
While there are no official employment surveys post 2015 (the Labor Bureau survey which
interviewed individuals in the middle of the second successive drought year), there are several
individual pieces of data suggesting a healthy growth in employment in 2017/18.
In addition, quarterly surveys of employment, conducted for only labor-intensive industries,
and covering less than 5 % of the total workforce in the economy (establishments with more
than 10 workers) are available. The last such survey was for October 2017 and it revealed that
3.85 lakh jobs were added between January and October 2017, or approximately 4.6 lakh jobs in
2017. This result, extended to the entire non-farm economy, yields the result that employment
change was close to 8 million in 2017.
There has been a large emphasis on road construction in the last few years, and especially in
2017/18. Indeed, GDP growth of 5.8 % in construction in FY18 was the largest in the last six
years. Construction is a labor-intensive activity and we estimate that construction activity alone added
between 1.7 and 3 million jobs in FY18.
The recently released, but controversial, EPFO (Employee Provident Fund Organization)
employment data suggests a healthy expansion of 7 million jobs in 2017 (Ghosh and Ghosh
2018). For the very young likely first timers – 18-21 years – EPFO job creation has been
proceeding at close to a 2 million annual pace, with a worst case estimate of 1.8 million.
While there is no official government survey on employment since 2015 (NSSO-EU survey for
2017/18 covers the period July 2017-June 2018, and it is expected that the results of this survey
will be made available over the next few months) there is a national employment survey for
2016 and 2017 – it is conducted by a private company, CMIE, in collaboration with BSE.
The raw results of the CMIE survey are for a 12 million job increase in 2017 for the 25-64 age
group (15 million increase for men and a 3 million decline in female jobs). For all age-groups
>=15 years, the CMIE shows an increase of only 1.4 million jobs.

4
However, adjusting the survey CMIE data for Census based population estimates (referred to as
national account estimates in the text; all NSSO survey data estimates of employment are
similarly transformed), 2017 was witness to a job loss of 2 million.
There appear to be mega inconsistencies in the CMIE survey, and major anomalies e.g. the
CMIE data show the lowest share of female employment in the economy and less than half that
observed in 2014. For example, in 2015 Labor Bureau survey, 22 % of all workers in the
economy were women; in CMIE 2017, less than 12 % of all employees were women. In absolute
numbers, there were 93 million women workers in EUS5; in CMIE 2017, there were only 47
million women workers!
5. Our estimates of employment in 2017
In this paper, we make two significant advances over the literature on employment change in
India. First, we construct a definition of employment that is consistent across the three sources of
household level employment data – NSSO, Labor Bureau (2014 and 2015) and CMIE (2016 and
2017).
Second, we adjust the anomalous labor and work-force participation rates in the CMIE data for eleven 5
year age-groups (15-19, 20-24…59-64 and >=65 years), and the two sexes. After the labor force
participation adjustments to CMIE data (adjustments that make 2016 and 2017 the lowest labor
force participation rates ever observed in India), we use the CMIE unemployment rates for 2016
and 2017 to estimate employment levels in 2016 and 2017.
These adjustments lead to a net increase of 12.8 million jobs in 2017 (principal status definition).
This is unlikely to be the new trend growth of employment, as it contains a bounce-back from
the earlier years of drought, and uncertainties induced by demonetization and GST.
For the 2013-2017 period (a span of 3.75 years) net job creation was 22.1 million – a pace
considerably higher than the 11 million jobs created between 2004/5 and 2011/12.
6. Labor force participation rates and jobs needed
One of the main “conventional wisdom” conclusions about the labor market in India is that the
labor force participation rates of women in India have declined, and declined “precipitously”.
This issue is examined in some detail and our preliminary conclusions are: (i) but about half the
decline is explained simply by the fact that more women are attending school (and college) and
hence half the decline is “artificial”; (ii) labor force participation rates for women have declined,
but male participation rates (PR) have declined at about the same rate; (ii) after accounting for
school enrollment, between 1999/00 and 2014, female PR declined from 36.4 % (principal status)
to 33.6 %, and male PR declined from 92.8 % to 89.9 %. This issue, of both male and female LFP
rates, is presently under study.
It is commonly believed (assumed) that India needs 10 to 12 million jobs a year to keep the
unemployment rate constant. We find that this conclusion has not been valid since 2004/5 when
the “required” rate was 10.2 million jobs a year. By 2011, this requirement was reduced to 8.3

5
million; and in 2017, the requirement was only 7.5 million. For 2022, the requirement is further
lowered to 6.9 million.
One final conclusion – the estimate of jobs needed rests on the estimates of labor force
participation rates, especially for women. If this rises, as we think it will, the requirement for job
growth will remain at about 8 million jobs a year.

6
Introduction
It is of academic, policy, and political interest to examine the nature of job growth in India. That
is the goal of this paper. We examine all data available relating to employment from 1999/00 to
2017. The data sources are the NSSO-EU surveys from 1999/00 to 2011/12, the Labor Bureau
employment and unemployment surveys for 2014 and 2015 (EUS4 and EUS5) as well as
alternative data sources like the Quarterly Employment Survey, the employee provident fund
survey of jobs in the formal sector, and the private joint CMIE-BSE employment surveys for
2016 and 2017.
This paper primarily focuses on two specific issues. The first is to estimate the employment
levels in the calendar year 2017 (or fiscal year 2017/18). The second is to estimate the number of
jobs needed to keep parity with the demand for jobs in the next 5-year period. Although a
number of surveys from various years are available, estimating employment in recent years is
challenging due to the lack of reliable data. The last quinquennial survey on Employment-
Unemployment was conducted in 2011/12. Since then NSSO has not published any large
Employment-Unemployment survey. Of course, the Labor Bureau did undertake three surveys
– in 2014, 2015, and 2016 – and we had access to the 2014 and 2015 surveys (referred to as EUS4
and EUS5). However, reliable data on labor market indicators after 2016 are not available.
The lack of data on such an important topic is unfortunate. The Union government has
recognized the problem and starting October 2018, there will be a large-scale quarterly
employment survey in urban areas and an annual employment survey in rural areas. Two
major quinquennial NSSO surveys have been undertaken in 2017/18 (July 2017 to June 2018) –
an employment-unemployment survey as well as a consumer expenditure survey. It is expected
that some results from these two surveys will be available over the next six months or so.
In the meantime, one is left with speculation about employment generation in the Modi years,
May 2014 onwards. Recently, an attempt has been made to capture, via employee payroll
contribution to pension funds (EPFO), the extent of job generation in the formal sector in 2017.
Unlike the US, this is not based on an establishment survey, but on ongoing employee
contributions. These data have to be carefully processed to avoid double-counting i.e. if one was

7
already in the EPFO system, then one is not part of a new job. Ghosh and Ghosh(2018) have
carefully processed the data, and have estimated that 7 million jobs were created in the formal
sector alone in 2017 (the formal sector is about a third of the non-farm economy). The non-farm
(non-cultivator) economy contains about 75-80 % of all jobs in India.
Survey data are needed for verification of the EPFO estimate and such data will not be available
till the end of 2018. There is, however, a private sector survey of employment in 2016 and 2017 –
one conducted jointly by a data service provider (CMIE) and BSE (Bombay Stock Exchange).
These data reveal only a 1.4 million job creation across sectors for all of 2017.
Usually, official Indian survey data do not provide estimates of employment levels– instead,
they report the ratio of employment to population (as well as other ratios – e.g. labor force to
employment, etc.). To retrieve the employment levels, these estimated ratios need to be
multiplied with the respective Census population equivalent estimate (for the age and sex
group under consideration). If one does that with the CMIE data, the corrected employment
estimate of CMIE for 2017 shows a decline of 2 million jobs between 2016 and 2017.
The reader will thus understand the puzzle that we face – two “credible” estimates of job
growth in 2017, but one of the estimates has to be credibly incorrect. Once the NSSO data for
2017/18 are published, the debate about job-creation in 2017 should end. Until then, however, as
is the nature of research, “credible” estimates of job growth in the Indian economy will continue
to be made. Anticipating the results, our “best” estimates of job growth in India, in 2017/18, are
12.8 or 13.5 million depending on the definition of employment status used. We also find that
rising educational attainments play a significant role in slowing the growth in labor force and
employment. Additionally, our estimates suggest that about 7 million jobs need to created every
year to keep pace with the demand for jobs in the next 5-year period (2017 – 2022). For each of
these, we present the methods of calculation in detail and the interested reader can evaluate our
estimate with respect to others – and yes, we will stand corrected if the NSSO 2017/18 data of
employment generation in 2017/18 is substantially below our estimate of 12.8 million.
The plan of the paper is as follows. Section 2 describes the data sources, and definitions, used.
Section 3 documents the method we employ to form a consistent employment series, across

8
time, and definitions. Section 4 discusses Survey Ratios and National Aggregates i.e. system of
estimation of jobs via computation of important ratios like worker participation rate etc. Section
5 discusses the important simultaneous phenomena in India – the expansion in educational
enrollment and decline in labor force participation (for both men and women). Section 6
outlines the employment generation reforms undertaken by the Modi government since 2014.
Section 7 discusses the results on employment generation in India for the period 1999 to 2017.
Section 8 presents estimates of jobs needed in India to keep the unemployment rate constant
(and/or absorb population expansion). Section 9 concludes.
Section 2: Data and Definitions
The question of employment trends in India is clouded in uncertainty. Employment data are not
consistently available, and definitions vary. This section discusses the available data on
employment from a variety of sources, and the different definitions used.
Sources of data on employment
NSSO-EU surveys, 1999/00 – 2011/12
In the main, this study uses the large sample quinquennial National Sample Surveys (NSS) for
the years 1999/00, 2004/5, 2009/10 and 2011/12. These NSS surveys provide a rich basis for
examining labor force and employment issues. The NSSO Employment Unemployment (NSSO-
EU) surveys have significant detail on the labor market and are the “gold standard” for analysis
of labor force and employment trends.
The NSSO provides estimates for five different employment definitions. Three of these
definitions have to do with long-term (365 days) employment. These three are usual principal
status, usual secondary status, and usual principal or subsidiary status. The above three estimates
come under the description of “usual activity status”. The usual status definition pertains to
employment in the preceding 12 months. Thus, for interviews conducted in July 2011 (the
beginning month of EU surveys which run from July to June, corresponding to the agricultural

9
year in India), the employment reference period is from July 2010 to June 2011 (for usual and
principal status) and centered on December 2010. The “reference” month for interviews
conducted in June 2012 is December 2011. Hence, a July 2011-June 2012 interview yields usual
activity status estimates centered on June 2011.
In addition, the NSSO-EU reports an estimate of weekly status of employment (i.e. were you
employed on any day last week), and daily status of employment (what was your status on
each of the seven days in the past week). Data on the daily status of employment, along with
principal status, are used to build a comparable series of employment, 1999-2017 for all
definitions of employment.
Labor Bureau Surveys, 2014-2015
For 2014 and 2015, the study uses Labor Bureau’s Annual Employment and Unemployment
Surveys (fourth and fifth rounds). Both surveys measure labor force and employment estimates
based on the usual activity status definition of employment (i.e. usual (principal + secondary) or
principal status (PS). It is PS which is primarily used in this study.
The field work of the annual surveys four and five, however, was less than 12 months unlike the
benchmark NSS employment and unemployment surveys. Field work for the fourth round of
labor bureau’s annual employment survey (EUS4) was conducted between January 2014 and
July 2014 and therefore the moving reference period as measured by the usual activity status
centers around September 2013 (see discussion above on the “reference” month). In the tables
presented in this paper the fourth round survey is referenced as taking place in 2013, not 2014.
Similarly, the fieldwork for the fifth round (EUS5) was conducted between April 2015 and
December 2015, therefore, the reference period as measured by the usual or principal activity
status centers around January 2015.
What this referencing of survey means is that the employment estimate for the 2014 survey is for
economic conditions unaffected by the 2014 drought. The 2015 survey, centered on January 2015, is

10
deeply affected by the 2014 drought, indeed its employment estimate is right in the middle of
the drought year (Jan 2015).
CMIE employment and unemployment survey 2016, 2017.
Finally, the study employs data from CMIE, a private enterprise, to get comparable labor force
and employment estimates for 2016 and 2017. CMIE, in collaboration with BSE, has published
detailed statistical reports from their triannual employment and unemployment surveys for the
years 2016 and 2017. These triannual reports are publicly accessible from CMIE’s website, and
have data by age-groups on employment, labor force participation rates and unemployment.
For the most recent two-year period, 2016 and 2017, the CMIE’s Consumer Pyramid Survey is
the only source that presents employment statistics1. It is a monthly household survey that
collects the most basic labor market information – age, sex, and whether the person was
employed. So far CMIE has published six reports based on the surveys conducted during 2016
and 2017. (Three for each year, January-May, June-August and September-December). While
the labor market statistics in these reports are useful, using them to assess the changes in the
labor market statistics from years (mostly from NSSO-EU surveys) is complicated due to several
reasons.
The CMIE data on employment is of a radically different nature than the NSSO and/or Labor
Bureau surveys. While the sample size of these surveys is large [>500,000], the questions asked
are minimal (age, sex, employed, unemployed (seeking work) or not in the labor force). The
minimality of the questions should theoretically lead to better estimates, if the survey has been
conducted properly. A large part of accuracy has to do with honesty in reporting by the
interviewer and interviewee, and by the derivation, and accuracy, of the sampling weights.
While one can say little about the former, it is the case that the “accuracy” of the CMIE surveys
is severely in question. Why and how this is likely to be the case is documented in some detail
in Section 7.
1 ‘BSE-CMIE Unemployment in India: A Statistical Profile’. These reports are available since 2016.

11
However, before we get to assessing the accuracy of the CMIE data (accuracy relative to NSSO
surveys) there is the important question of the matching of NSSO (and labor bureau) definitions
with that of CMIE.
Matching CMIE definitions/data with NSSO definitions/data
CMIE definition of employment is a mixture of daily and usual principal status. CMIE’s definition of
employment is somewhat different from NSSO-EU’s definition of employment. CMIE asks
whether the survey respondents worked on the day of the interview. If the respondents did
work on the day of interview, CMIE classifies them as employed. If the respondents did not
work on the day of the interview, but worked the day prior to the day of the interview, CMIE
classifies them as employed. However, if the respondents did not work on any of these two
days but usually worked over the past year, CMIE also classifies them as employed2.
NSSO on the other hand uses three definitions of employment for all the years 1999/00 –
2011/12.3 The first is the usual status where respondents were asked about their activities during
365 days prior to the date of interview. The usual status has two components: the principal
usual status and subsidiary usual status. The principal usual status is the activity status in
which respondents spent longer time (i.e. majority time criterion) during the 365 days prior to
the date of interview. The subsidiary status is the activity status in which respondents spend a
shorter period of time during the 365 days prior to the date of interview.
The second definition is the weekly status where respondents are considered working if they
worked at least one hour on at least one day during the 7 days prior to the date of interview.
The third definition is daily status where respondents report their daily activities during the 7
days prior to the date of survey. Based in these daily responses their daily status is determined4.
As evident from these definitions, NSSO’s definition of employment substantially differs from
CMIE’s definition. As a consequence, CMIE’s employment estimates cannot be directly
compared to the employment estimates from the NSSO surveys.
2 For further details, see BSE-CMIE Unemployment in India: A Statistical Profile reports.
3 See various NSSO-EU reports on Employment and Unemployment in India.
4 For details, see various rounds of NSSO Employment Unemployment reports.

12
Our goal is to construct a comparable series of employment across years and surveys. To make
any meaningful comparison, it is imperative to ensure that the methods computing the
employment levels must follow the same definitions across surveys. It should also be noted that
our preferred employment measure is principal status (and related variables like labor force and
unemployment). This choice is made because principal status separates the respondents whose
primary activity is to work from those whose main activity is something other than work. In
addition, primary status is what is used by CMIE if the interviewee did not work the previous
two days.
Section 3: Towards a comparable definition of employment
We construct a definition that makes NSSO and CMIE employment estimates comparable.
NSSO collects a variety of information which can be used to construct a definition of
employment which is strictly comparable to that used by CMIE. This definition allows us to
construct a daily-adjusted series of employment from 1999/00 to 2017.
Each NSSO survey records respondents’ daily activity status and intensity of engagement in
each of those activities for 7 days prior to the interview dates (daily status and intensity). On
each of these days, the respondents report their activity status and the amount of time they
spent on each activity (zero, a half-day or a full-day). We use this information to apply CMIE’s
employment definition to construct a new employment definition for NSSO surveys. As in
CMIE, we classify a person to be employed if he or she worked on the day preceding to the day
of interview. If the person did not work on the day before the interview day but worked 2 days
prior to the interview date, we classify him/her as employed. In case the respondent did not
work on any of these two days, but usually worked over the year (according to NSSO usual
principal status), we classify him/her as employed.
This procedure creates a definition of daily employment that is comparable to CMIE’s definition
of daily employment. In the same manner we construct a new labor force definition. We classify
a person as a part of the labor force if he or she either worked or looking for work on the day

13
preceding the day of the interview. If a person did not work or look for work on the day before
the interview day, but did work or look for work two days prior to the interview date, we
classify him or her as a part of the labor force. In case the respondents did not work or look for
work on any of these two days, but usually worked or looked for work over the year (according
to NSSO usual principal status), we classify them as a part of the labor force.
Based on these definitions of employment and labor force status, we compute the number of
people employed and number of people in labor force from NSSO 2004/5, 2009/10 and 2011/12.
In terms of definitions, our NSSO employment definition (combination of principal and daily
status) are now fully comparable to the CMIE definition of employment. Hence, we have
comparable data for all the NSSO years (2004/5 to 2011/12) and for CMIE years 2016 and 2017.
However, the Labor Bureau data for 2013 and 2014 does not have any information on daily
employment status, and neither does the 1999/00 NSSO data. What is common to the NSSO and
Labor Bureau surveys is the data on principal status, a feature we will use to estimate the Daily-
PS data for all the years 1999/00 to 2017.
While we use unit level data for the NSSO and Labor Bureau (LB) surveys, we only have access
to the CMIE data according to the following 11 age-sex groups: ages [15-19, 20-24, 25-29, 30-34,
35-39, 40-44, 45-49, 50-54, 55-59, and 60-64] and a catch-all eleventh group, >=65 years. For
purposes of analysis we have converted all the individual level NSSO and Labor Bureau data
into these 22 age-sex classifications.
Summarizing, our procedure to obtain comparable labor market data, across definitions and
across years, is as follows. First, we transform all survey data to make all variables consistent
with Census derived population data. Second, we convert NSSO daily and principal status data
for 2004/5, 2009/10 and 2011/12, to the hybrid daily-principal CMIE definition of employment.
Third, we estimate daily-principal for 1999/00, 2013, and 2014 based on principal status data for
these years. Fourth, we “forecast” labor force trends for 2016 and 2017 based on the trend for
labor market variables for daily-principal data for 2011 through 2014. Fifth, we use the change
in the CMIE unemployment rate between 2016 and 2017 to obtain employment levels for 2017.
And sixth, we use the daily-principal series which we now have for all the years to estimate

14
employment levels for the definitions for which we have partial data (e.g. weekly status data
are only available for the NSSO years.)

15
Section 4 – Survey Ratios and National Aggregates
Official government of India reports on the labor force, employment and unemployment
present employment related results in the form of ratios – the ratio of the labor force to the
population (labor force participation (LFP) rate), the ratio of the work force to the population
(called the worker participation (WP) rate), and the unemployment rate (the ratio of those
unemployed to those in the labor force).
NSSO data only report on the two ratios WP and LFP i.e., NSSO does not report total
employment for any age-sex group. Why? Because the NSSO survey estimate of absolute levels
of each of the three variables – population, labor force, and employment - are not considered
reliable. The data on the total population in the economy (of particular age-groups etc.) as
measured by the surveys are notoriously inaccurate. Studies done by the NSSO itself point to an
under-estimation of around 5 to 10 % for the total population in any given survey year (“Review
of Concepts and Measurement Techniques in Employment and Unemployment Surveys of NSSO”,
NSSO (SDRD) Occasional Paper/1/2008). If the analyst does not account for this possible
discrepancy, gross errors of interpretation, or judgement, can be made.
However, the ratio estimates are considered to be more accurate (because the error present in
population cancels out). The ratios are multiplied with more reliable population levels to arrive
at the employment figure. For the census years, we draw data from census population data,
whereas for the non-census years the population in non-census years, we draw data from the
“demographic extensions” in UN data.
The Census equivalent population for each age-sex group is taken from the UN (2015); the UN
estimates are based on Census data extrapolated for future years via assumptions of fertility
(we take the medium variant). These UN population estimates are taken for each age-sex group
and multiplied by the relevant ratios obtained in the survey data to arrive at an estimate of
working population, labor force, and employment for each age-sex group. For example, the
survey employment to working population ratio is multiplied by the UN (hereafter referred to
as Census) population estimate to obtain the national account (NA) estimate of employment.

16
This is exactly the procedure followed by “official” estimates of employment based on NSSO
surveys. In the tables, these adjusted (transformed) values are reported as adjusted values.
To obtain census-equivalent estimates of employment etc., we estimate the following five
variables for each age-sex classification:
(1) Working age population (WAP)
(2) Labor force – i.e. those working or willing to work;
(3) Employment
(4) The ratio of employment to labor force.
(5) The ratio of labor force to WAP – i.e. the labor force participation rate.
Constructing a comparable and consistent employment series (CMIE’s definition), 1999-2017
Our goal is to provide a consistent series on employment for all the survey years 1999/00 to
2017. For all the NSSO and Labor Bureau survey years (1999/00 to 2014), there is only one
common definition of employment for which all the surveys report employment – principal
status. The CMIE definition of employment, however, is slightly different. It is based on a
mixture of daily and principal status; which we term as Daily-PS. Hence, one method to
definitionally link the labor market data across surveys is to construct a consistent consistent
employment series from 1999/00 to 2014 based on the PS and CMIE Daily-PS definition. We
construct such as series of employment from 1999/00 to 2017 assuming that the rates of change
of employment stay the same regardless of definition (a very safe and innocuous assumption)5.
We follow the following sequence of conversions. First, we create the Daily-PS definition for the
2004/5, 2009/10 and 2011/12 based on the available daily and principal status information in
these survey years. We then obtain Daily-PS employment estimates for 2004/05 to 2011/12
5 This assumption can be verified from NSSO 2004/05, 2009/10 and 2011/12 data. Estimates based on PS and
Daily-PS definitions can be obtained for all three years. Thus, the growth in each of the estimates across definitions can also be assessed. For instance, the growths in employment between 2004/05 and 2011/12 are very similar across these definitions (2.6 percent for PS definition and 2.3 percent for Daily-PS definition respectively).

17
survey years. This means that both Daily-PS and PS employment estimates are now available
for 2004/05, 2009/20, 2011/12. The computation of the Daily-PS estimate of employment for
NSSO 1999/00 is not possible because data for per day activity in the week was not collected
(unlike subsequent NSSO years). However, labor force, employment, and unemployment based
on the principal status definition can still be estimated for these survey years. Based on the
changes in these principal status estimate for labor force participation and we extrapolate the
Daily-PS employment for 1999/00.
That this procedure is reasonably accurate is revealed by the rate of growth estimates of PS
(available in NSSO) and PS-daily (constructed by us) for the period 2004/5 to 2011/12. The
former shows an increase of 10.9 million; the latter an increase of 10 million.
This same procedure is followed to obtain the Daily-PS series for the Labor Bureau Surveys for
2013 and 2014 (EUS4 and EUS5). Theoretically, with these adjustments we have the Daily-PS
estimates for all the years 1999/00 to 2017. However, as mentioned earlier (and discussed in
detail in Section 5) the CMIE results on labor force participation for women are not within the
ballpark of any known estimate for India (or for that matter in the world, circa 2015). Hence, we
need to construct a Daily-PS series for the CMIE years which uses information from CMIE
results and is consistent with official employment surveys.
We suggest the following method, a technique which preserves almost (all) attributes of the
CMIE data. The procedure is almost identical to that used for deriving Daily-PS estimates for
NSSO 1999/00, and Labor Bureau 2013 and 2014 surveys. To obtain Daily-PS estimates for 2016,
we take the rate of change in Daily-PS LFPR (and unemployment rate) from 2013 to 2014 and
assume that this rate of change persists in the change in LFPR (and unemployment rates) from
2014 to 2016. In other words, we are allowing Daily-PS LFPR to follow a trend (usually decline)
for all the twenty-two age-sex groups.
This leaves estimation for 2017. Two options are available – assume the same rate of change, as
observed in 2011 to 2014 to persist in 2017. If this assumption is made, the female LFP rate
declines to 22.3 % in 2017, roughly the same as in Saudi Arabia and the third lowest in the
world, behind Algeria (17 %) and Iran (16.3 %). Or assume that LFP rates (especially for women

18
– on average, the LFP rates for men show an increase in 2016!) remain the same in 2017 as in
2016.
There are at least three reasons to assume that the likely LFP rates are higher in 2017 than in
2016. First, that female LFP rates in 2016 are historically, and comparatively, very low; second,
and more importantly, economic conditions improved in 2017. Third, that CMIE unemployment
rates for women (and men) are significantly lower in 2017 relative to 2016 – for example, CMIE
unemployment rate for men declines from 8.4 % in 2016 to 5.8 % in 2017; for women, the decline
is from 26.6 % in 2016 to 17.1 % in 2017. Another indication that the raw CMIE data for 2016
and 2017 are problematical are these historically high unemployment rates for women.
Note that the 2016 is an average for the calendar year 2016. De-monetization was announced on
November 8, 2016, and it cannot be the “cause” for the high unemployment rate in 2016.
Further, 2016 was a normal agricultural year, after two successive droughts. Thus, as a worst-
case estimate, we assume that the LFP rates for both men and women stay at the same
historically low level in 2017 as in 2016.
Knowledge of Daily-PS labor force participation rates for 2017, and the change in CMIE
unemployment rate from 2016 to 2017, allows the estimation of Daily-PS employment (and
unemployment) in 2017. With this estimation we are able to have a consistent Daily-PS series
for the three labor-market variables of interest – LFP rates, unemployment, and employment –
for the 22 age-sex groups. This consistent Daily-PS series allows the estimation of the missing
labor market variables for all definitions of employment e.g. principal status, usual status, daily
status and weekly status.
Section 5a – Education and Labor Force Participation (LFP) rates – Any link?
The determinants of labor force participation are in large part the determinants of employment.
The former reflects supply, and the latter is what results from a resolution of supply and
demand. Historically, as fertility rates have declined, the labor force participation rates of
women have tended to increase. One other factor associated with female LFPR is the increase in
educational attainment. As women get more educated, they tend to participate more in the

19
formal labor market, and this increase in formal work shows up in an increased participation
rate.
But the most talked about statistic is not the comparatively low LFPR of women in India but
also the decline in labor force participation over the last decade, termed the “precipitous drop”
by World Bank authors Andres et. al. (2017). Co-incident with this drop is the observation that
there has been a large increase in school (school and college) enrollment. Are the two linked or
is it a case of correlation not causation?
It is well known that individuals invest in human capital to enhance their earnings capacity.
Typically, this process takes place in two phases. In the first phase individuals invest full time in
production of human capital enhancing their productivity. This is the phase of specialization in
human capital production or commonly known as schooling where individuals enroll full-time
in educational institutions. In the second phase, individuals devote one part of their time to
work and receive earnings, and devote the other part to accumulate skills that raises their future
earnings. This phase is commonly known as work where individuals receive on-the-job
training.
Although the activities in these two phases may seem different, from the perspective of
earnings they are very similar. Both activities enhance productive capacity which raises
individuals’ future earnings. Both incur the similar type of cost, namely foregone earnings. The
factors (e.g. innate ability, ease of credit constraint for education etc.) that raises the time in
school also raises the time invested during on-the-job trainings. Thus, one cannot be separated
from the other, especially in the context of employment. What that means is that school
attendance must be considered as an integral part of the employment process.
Going to school is not much different than a job in terms of “labor force activity”. Indeed, Nobel
prize winner Gary Becker outlined in his “Allocation of Time” article how the choice of going to
school (and college) is really a choice about employment and occupational choice post
schooling.

20
One of the big “missed” stories on employment in India (and other developing economies
undergoing this transition), indeed the biggest story, is what has been happening to educational
enrollment over the last twenty odd years. Bhalla-Kaur(2011) were the first to empirically point
out that labor force participation rates appear distorted because of this educational expansion.
The simple point is that in order to interpret employment and associated data, we need to
incorporate the changing dynamics of education. Labor force can alternatively be defined as the
conventionally defined labor force (employed + unemployed) plus those attending
school/college on a full-time basis (code 91 in the employment survey codes, NSSO and LB data.
Table 1 documents the increase in educational enrollment for the young (15 – 24 years).
Enrollment increased from 49 million (m) in 1999 to 99 m in 2011. [The tables truncate the NSSO
year to just the first year e.g. 1999/00 is 1999}. Total population in this age-group increased from
199 m to 230 m i.e. the fraction going to school in 1999 was 25 %; in 2011, this fraction was 43 %.

21
Table 1: Population, Schooling, Labor Force & Employment among Youth1,
1999-2017
1999 2004 2009 2011 2013 2014 2016 2017
(in mil)
Population 198.8 215.4 226.9 230.1 232.3 233.4 235.4 236.2
Enrolment 49.2 59.3 87.7 98.7 103 105.3 107.8 109.1
Labor Force - PS2,3 89.1 96.7 82.7 76.9 72.3 65.9 60.1 60.4
Labor Force - PS, adjusted 138.3 156 170.5 175.6 175.3 171.2 149.6 150.2
LFPR - PS 44.8 44.9 36.5 33.4 31.1 28.2 25.5 25.6
LFPR - PS, adjusted 69.6 72.4 75.1 76.3 75.5 73.3 63.6 63.6
Sources: Labor Bureau Annual Employment-Unemployment Surveys 2013/14, 2015/16; NSS Surveys 04/05,
09/10, 11/12; MOSPI; "Unemployment in India", CMIE, Statistical Profiles 2016, 2017; World Population
Prospects: The 2017 Revision, Key Findings and Advance Tables. ESA/P/WP/248.
Notes: 1) Youth are defined as the age group between 15-24 years old.
2) Estimates of Labor Force and its derivatives presented are as per principal activity status (PS).
3) The survey estimates (raw data) are adjusted by gender and age-group population, as per Census - National
Accounts (NA); population data for non-Census years obtained from UN. See text for more details.
Now consider the implications for the labor force (principal status) for this age group. The labor
force declined by 12 m from 89 m to 77 m!
Note the decline in LFPR for the young (listed as LFPR-PS in the table) – there is indeed a
precipitous drop – from 44.8 % in 1999/00 to 33.4 % in 2011. But, after accounting for school
enrollment, (LFPR-PS adjusted), the participation rate for the young increases from 70 % in 1999
to 76 % in 2011.
Table 2 presents detailed data on LFP rates for the age-group 15-24 years, and Table 3 presents
the data for the adult population (> 25 years) and Table 4 for the working age population (ages
>=15 years). The conventional LFP rate, as well as LFP adjusted for education, are presented for
all the years 1999 to 2017. This allows us to examine the nature of the drop in LFP rates for both
22
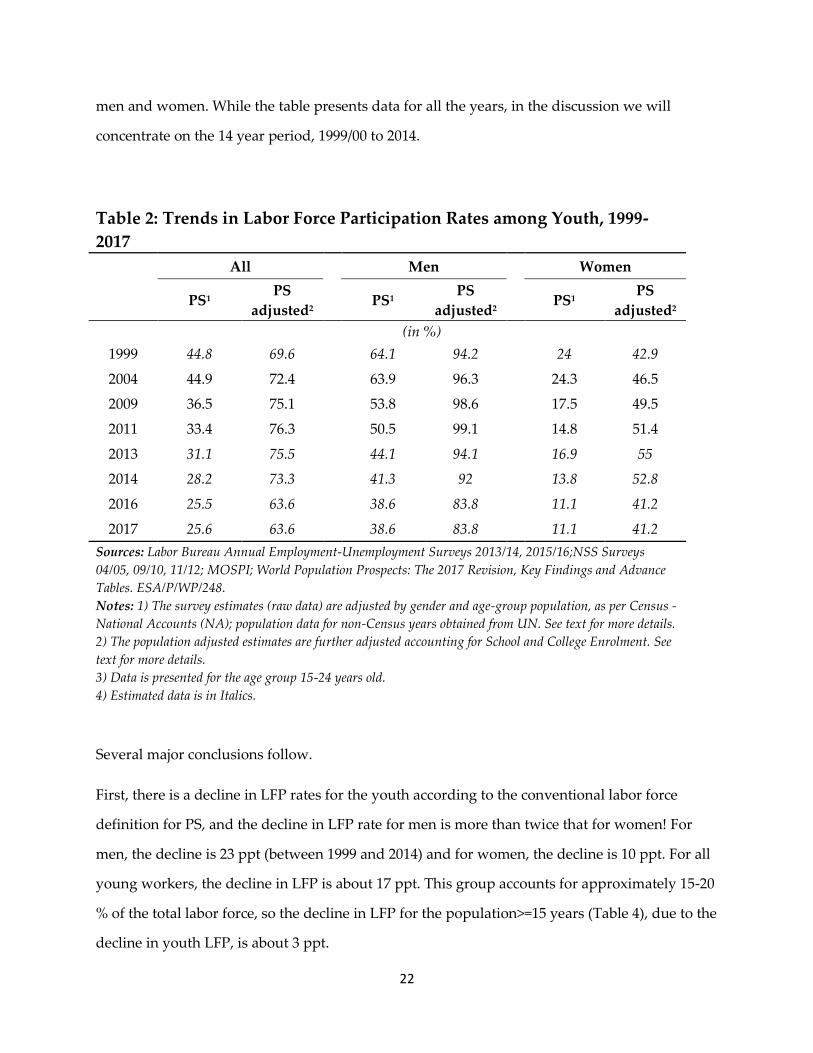
men and women. While the table presents data for all the years, in the discussion we will
concentrate on the 14 year period, 1999/00 to 2014.
Table 2: Trends in Labor Force Participation Rates among Youth, 1999-
2017
All
Men
Women
PS1
PS
adjusted2 PS1
PS
adjusted2 PS1
PS
adjusted2
(in %)
1999 44.8 69.6
64.1 94.2
24 42.9
2004 44.9 72.4
63.9 96.3
24.3 46.5
2009 36.5 75.1
53.8 98.6
17.5 49.5
2011 33.4 76.3
50.5 99.1
14.8 51.4
2013 31.1 75.5
44.1 94.1
16.9 55
2014 28.2 73.3
41.3 92
13.8 52.8
2016 25.5 63.6
38.6 83.8
11.1 41.2
2017 25.6 63.6 38.6 83.8 11.1 41.2
Sources: Labor Bureau Annual Employment-Unemployment Surveys 2013/14, 2015/16;NSS Surveys
04/05, 09/10, 11/12; MOSPI; World Population Prospects: The 2017 Revision, Key Findings and Advance
Tables. ESA/P/WP/248.
Notes: 1) The survey estimates (raw data) are adjusted by gender and age-group population, as per Census -
National Accounts (NA); population data for non-Census years obtained from UN. See text for more details.
2) The population adjusted estimates are further adjusted accounting for School and College Enrolment. See
text for more details.
3) Data is presented for the age group 15-24 years old.
4) Estimated data is in Italics.
Several major conclusions follow.
First, there is a decline in LFP rates for the youth according to the conventional labor force
definition for PS, and the decline in LFP rate for men is more than twice that for women! For
men, the decline is 23 ppt (between 1999 and 2014) and for women, the decline is 10 ppt. For all
young workers, the decline in LFP is about 17 ppt. This group accounts for approximately 15-20
% of the total labor force, so the decline in LFP for the population>=15 years (Table 4), due to the
decline in youth LFP, is about 3 ppt.

23
Adjusted for schooling, the trend in LFP tells a fascinating, and different story. For young men,
there is a minor decline of 2 ppt – from 94.2% in 1999 to 92 % in 2014. For young women, there
is an increase of 10 ppt in the LFPR (from 42.9 % in 1999 to 52.8 % in 2014). Over the years,
young women have gradually caught up with men in terms of educational attainment. This
trend, of female catch-up, is worldwide and has been documented in some detail in
Bhalla(2017).
This comparative performance of young men and young women for years prior to the CMIE
data is also indicative of the “fact” that CMIE LFPR rates are not consistent with historic data,
and historic trends.
Table 3: Trends in LFPR among Adults, 1999-2017
Principal Activity Status (PS)1
All Men Women
(in %)
1999 63.5
91.8
33.4
2004 64.7
92.1
35.8
2009 61.3
92
29.2
2011 59.8
91.7
26.3
2013 58.5
87.3
28.5
2014 58.3
88.6
26.7
2016 58.1
89.8
25.1
2017 58.1 89.7 25.1
Sources: Labor Bureau Annual Employment-Unemployment Surveys 2013/14,
2015/16;NSS Surveys 04/05, 09/10, 11/12; MOSPI; World Population Prospects:
The 2017 Revision, Key Findings and Advance Tables. ESA/P/WP/248.
Notes: 1) Data is presented as per the principal activity status.
2) The survey estimates (raw data) are adjusted by gender and age-group population,
as per Census - National Accounts (NA); population data for non-Census years
obtained from UN. See text for more details.
3) Data is presented for the age group 25 years and above.

24
Table 3 presents the data for adults (>= 25 years). This group is not much affected by increases
in educational enrollment so just the data for LFPR-PS are reported. Two distinct trends emerge.
First, that for both men and women there is a decline in the LFPR, but that the decline for
women (6.7 ppt between 1999 and 2014) is slightly more than double the rate for men (3.2 ppt).
Second, that the decline for women was over by 2011, and indeed the Labor Bureau data for
2013 and 2014 shows a marginal increase in LFPR between 2011 (26.3 %) and 2014 (26.7 %). Note
that the principal status data for 1999 to 2014 has not been adjusted by us – these are the original
survey figures (adjusted by Census population data).
For adult men, however, the pattern is slightly different. The LFPR stays constant at 91.8 %
between 1999 and 2011, but then declines by 3 ppt to 88.6 % in 2014. Though this deserves a
separate study (and explored in Das-Bhalla-Kaur(2018)), the phenomenon of declining labor
force participation rates for men appears to be a global phenomenon. For both men and women,
in developing economies excluding the Middle East, LFPR rates have declined by an average of
3 ppt between 2000 and 2015.
Table 4 presents the trend in LFP rates for the entire (age>=15) population. Traditional LFP rates
show a large decline of 7.5 ppt - from 57.9 % in 1999 to 50.4 % in 2014. However, adjusted for
schooling, the decline is a much smaller 3 ppt – from 65.5 % to 62.5 %.
There is no question that there is a decline in the LFPR of (men) and women; it is just the
magnitude that is in question. There are three papers that one or both of us are involved in that
explore this important question; see Das-Bhalla-Kaur (2018), Kaur et al (2016) and Bhalla-Kaur
(2011) for details. The transition from poor to emerging middle class to middle class – and/or
from uneducated to educated – may provide some clues. There is even the (likely) possibility
that LFPR for women will increase from now on (in India).

25
Table 4: Trends in Labor Force Participation Rates, All Ages, 1999-2017
All
Men
Women
PS1 PS adjusted2 PS1 PS adjusted2 PS1 PS adjusted2
(in %)
1999 57.9 65.5
83.5 92.8
30.6 36.4
2004 58.9 67.1
83.8 93.5
32.5 38.9
2009 54.4 65.4
81.2 94.1
26 35
2011 52.6 64.5
80.4 94.1
23.2 33.2
2013 51.3 63.3
75.6 89.4
25.5 35.6
2014 50.4 62.5
76 89.9
23.4 33.6
2016 49.8 59.8
76.5 88.6
21.6 29.3
2017 49.9 59.7 76.5 88.5 21.6 29.2
Sources: Labor Bureau Annual Employment-Unemployment Surveys 2013/14, 2015/16;NSS Surveys 04/05,
09/10, 11/12; MOSPI; World Population Prospects: The 2017 Revision, Key Findings and Advance Tables.
ESA/P/WP/248.
Notes: 1) The survey estimates (raw data) are adjusted by gender and age-group population, as per Census -
National Accounts (NA); population data for non-Census years obtained from UN. See text for more details.
2) The population adjusted estimates are further adjusted accouting for School and College Enrolment. See text for
more details.
3) Data is presented for the age group 15 years and above.
4) Estimated data is in Italics.

26
Section 5b – CMIE data on Labor Force Participation rates – How Reliable?
Labor Force Participation rates – CMIE data for 2016 and 2017
We had mentioned earlier that the CMIE estimates of LFPR were not very “reliable”. We now
document why we reach that conclusion. The CMIE data problem is the following – it allows
the female labor force participation rate (FLFPR) to drop to historically low levels for India, and
one of the lowest in the world over the last 40 years. The raw CMIE data (Daily-Original in
Table 6) indicates a FLFPR of 11.7 % in 2017 for the age group >=15 years. The last available
estimate of LFPR for the (CMIE) Daily-PS definition is for 2014 – 26.4 % (in the 2011/12 NSSO
survey the estimate is 26.2 %). If the CMIE raw data is correct, then this is a very steep fall, from
26.4 % to 11.7 %, in just three years.
Analysis for other countries suggests that such a fall in LFPR only occurs in war times. For men,
Daily-PS data does not show much of a decline – from 80.7 % in 2011 to 74.3 % in 2017, a decline
of 6 ppt or (log) 8.2 %. For women, the decline is 14.5 ppt or a decline of (log) 81 percent. In
other words, for the same time-period, the decline in LFPR is ten times greater for women than
women.
How unusual is the CMIE data for the ratio of declines in LFPR for women and men? Note that
for CMIE data the ratio is +10. According to World Bank data for over 150 countries, there is no
parallel to the CMIE estimate. Indeed, the highest ratio observed for male LFPR decline of less
than 3 % is Uruguay in 1974. In that year, male LFPR decline was 3 %, female LFPR decline was
23 %, yielding a ratio of 7.5. While the CMIE estimate of female LFPR for 2017 is the lowest in
the world post 2000 (excluding war torn Iraq, and the Arab countries of Algeria and Yemen), its
estimate of the log decline in male and female LFPR is the highest in the world, and that too by
a large margin.

27
Section 6: Employment Generation Reforms since 2014
At a campaign rally in Agra in August 2013, BJP PM candidate Mr. Narendra Modi stated that if
the BJP were to win the next election, that it would, unlike Congress, provide 10 million jobs to
the youth of the country (the youth defined as those under 35 years of age). The BJP manifesto
talks about job creation, but does not mention any specific number. Indeed, we have not been
able to find any public record of a public promise of the number of jobs by the BJP government.
Nevertheless, the belief persists that the BJP (Modi) promised to deliver 10 million jobs a year, and
the fact that this has not happened, is a promise not kept. [Note how 10 million jobs for the
youth has metamorphosed into 10 million jobs a year).
The veracity of job promises notwithstanding, it is a fact that the Modi government has been
conscious of implementing policies linked to job creation. Towards this end, it has initiated a
number of economic and labor market reforms. Some of these reforms are expected to yield
results within a short period of time, whereas others are structural in nature and are expected to
deliver over a longer time horizon. But irrespective of the time factor, these reforms are
expected to either directly or indirectly boost employment. We discuss some of the potential
employment generation reforms below.
MUDRA
On April 8 2015, Government of India announced the creation of MUDRA (Micro Units
Development & Refinance Agency). The primary objective of this scheme is to bring small or
micro enterprises into the financial system and thereby boost employment generation. It is
essentially a refinancing initiative where MUDRA helps various commercial banks, small
finance banks, co-operative banks and other lending institutions to finance small or micro
business units. Any non-corporate, non-firm, small or micro enterprises may participate in this
scheme and seek a loan of 10 lacs or less to develop its business.
The performance of the scheme in the past three years shows significant promise for
employment generation. The total amount sanctioned for the scheme has almost doubled since
its inception (in 2017-18, around 254 thousand crores (thcr)). The number of new loans

28
sanctioned have also increased from 35 million in 2015/16 to 40 million in 2016/17 and 48 million
in 2017-18. If it is assumed that each Rs. 10 lac loan creates at least half a new job, then the
scheme has possibly generated a total of 4 million new non-farm jobs in 2017-18 (derived as 8
million new loans in 2017/18 each providing half a job – note it is the change in number of loans
disbursed in 2017/18 relative to 2016/17 that provides the change in jobs estimated as 4 million).
The government has also introduced a number of structural reforms to ensure a smoother
functioning of the labor market. Among these, labor law reforms are most prominent. Reforms
that aim to enhance workers’ rights6 can potentially raise workers’ productivity. Similarly, the
reforms that restrict child labor7 can raise productive capacity of the future workforce.
Introduction of Skill-India project is another reform that aims to enhance productive capacity of
the future workforce through human capital investments.
The government has also introduced a number of business centric amendments to facilitate
“ease of doing business”.8 These steps incentivize entrepreneurship by lowering transactional
costs, and thereby raises the possibility of more investment. In the FY19 Budget, the
government proposed to contribute 12 percent of employees’ contribution towards their
Employee Provident Fund; this applies to all new employees. The scheme (Pradhan Mantri Rojgar
Protsahan Yojana (PMRPY) Scheme was started in April 2016 with the government committing
to payment of 8.33 %; this has now been expanded to the entire 12 % contribution that is
required.
This social security initiative may have profound implications for work efforts and savings
behavior of the workforce. Even though each of these initiatives differs from the others, and
aims to achieve different goals, in totality they can potentially improve the labor market
functioning by benefitting the stakeholders, that is the employers and the employees. It is too
early to make an estimate of its impact on employment, though a minimum of a million new
6 Maternity Benefit Amendment Act, 2017, The Employee Compensation Act, 2017 etc. 7 Child Labor Amendment Act, 2016. 8 For instance, the amendments such as Ease of Compliance to maintain Registers under various Labour Laws Rules
(2017), Model Shops and Establishments (RE&CS) Bill (2016), Rationalization of Forms and Reports under Certain Labour Laws Rules (2017).

29
jobs a year may not be far-fetched.
Road Construction
There is yet another policy initiative of the Modi government which may have had a solid
contribution to employment generation – road construction. Construction of roads and rural
roads in particular comes with a lot of positive externalities. Khandker et al. (2009) show that in
Bangladesh the rehabilitation of rural roads has reduced poverty by raising agricultural
production, wages, output prices and by lowering input and transportation costs. The study
also finds that rural roads also lead to higher girls’ and boys’ schooling and further states road
investments are pro-poor, meaning the gains are proportionately higher for the poor than for
the non-poor.
More recently and pertaining to the Indian context, Aggarwal (2017) analyses the impact of
Prime Minister’s Rural Road Scheme between the years 2001 and 2010 and finds that road
construction lowers prices paid by rural households for goods produced in urban areas;
increases availability of non-local goods, and increases the labor force participation rate of
prime-aged women.
Between March 2009 and March 2014, construction of highways increased from 70934 km to
91287 km, or an increase of 20353 km over 5 years, or an average building rate of 11.2 km a day.
In FY17, per day construction of highways averaged 22.6 km a year and FY18 topped 27.3
km/day. A 21 % increase in the pace of road construction in FY18 and is bound to have added
jobs in FY18.
An RBI Working Paper by Misra-Suresh, Estimating Employment Elasticity of Growth for the Indian
Economy, 2014, documents that construction has the highest employment elasticity of all the
sectors, 1.13, compared to an average of 0.19 for the entire economy. In the 2011/12 NSSO
survey, the share of employment in construction was 10.6 %; in 2009/10 the share was 9.6 %. On
a base of 450 million, jobs in construction increased by 4.5 million between 2009/10 and 2011/12.
Highway road construction between 2009/10 and 2011/12 increased from a rate of 70934 km to
76818 km – an increase of 8.3 %. According to the NSSO surveys (for occupational category 931

30
– road construction) jobs increased from 21.2 million in 2009/10 to 22.4 million in 2011/12 – an
increase of 1.2 million jobs associated with an 8.3 percent increase in road construction.
GDP data for FY18 is also very revealing and indicative of solid job creation in the construction
sector in FY18. In 2011/12, GDP growth in construction averaged 5.8 %. Since then, FY18 is not
only the first year in which construction growth has topped 4 %, but it is also the first year in which
construction growth has matched the 5.8 % average of 2011/12. Incidentally, as far as acceleration in
construction growth is concerned, acceleration of 4.4 ppt (1.4 to 5.8) in 2018 is the highest in the
last twenty years.
This increase in GDP growth (in construction) is bound to have had a handsome effect on
employment growth in FY18. How much impact? As noted above, the elasticity is close to 1.13
i.e. a rough calculation would be that increase in construction jobs in 2018, if past elasticities
hold, would be close to 5.7 percentage points. On a base of 10 % of total non-farm jobs in
construction (or 35 million), a 5.7 ppt increase means an additional 2.0 million jobs.
An alternate calculation of jobs in construction: Surface road construction, as shown above,
increased by 21 % in 2017/18. If the 2009/10 to 2011/12 relationship holds (8.3 per cent increase in
road construction means 1.2 million jobs), this means that (1.2*2.5) or 3 million jobs were added via road
construction alone in 2017/18.
Adding it all up (road construction, MUDRA loans, pension fund contributions) a 3-5 million
job addition from these schemes alone in 2017/18 seems a reasonable, and conservative,
estimate. In the next section, we summarize all the available evidence with regard to job
creation in 2017/18.
[Note that preliminary results of the NSSO employment survey for 2017/18 should be available
over the next few months – we await anxiously whether our estimates are in the ballpark of the
NSSO estimates].

31
Section 7 – Results on employment, 1999/00 – 2017
In this section, we turn our attention towards estimates of employment in the post 2014 period.
This estimate is of great policy and political concern, and relevance. This is the first year in the
four-year Modi regime that the Indian economy has not suffered from shocks. The first two
years were severe drought years; the third year - 2016/17 – contained a demonetization shock
(November 2016). Hence, calendar 2017 (and more likely FY18, starting April 2017) is the first
“clean” year to understand employment (and GDP) trends in the economy.
There is both a large scale NSSO EU survey presently underway (July 2017-June 2018) as well as
a consumer expenditure survey. The former will form the basis of an annual rural survey and a
quarterly urban survey starting October 2018. There will not be a surfeit of data, but more than
adequate data, for studying the Indian economy, and the all-important job trends starting
October 2018.
This year is also a big election year (though that is the case every year in India!) and national
elections are scheduled for April 2019. Hence, there is more than a casual interest to what
happened to job growth in India in 2017/18, a subject to which we now turn.
A. Quarterly Economic Survey Estimates of Employment
Since 2016, the government has been conducting a Quarterly Economic Survey (QES). While
used by many as an indicator of employment (e.g. “Stagnant Employment Growth” EPW, Vol. 52,
Issue No. 38, 23 Sep, 2017.), it is not a valid indicator of employment for the entire economy.
The QES covers only the non-agricultural sector and within this sector, only firms which are
part of 8 non-farm sectors i.e. Manufacturing, Construction, Trade, Transport, Education,
Health, Accommodation & Restaurant and IT/BPO. The basis of the QES is the Sixth Economic
Census (SEC) of 2013/14, “according to which 58.5 million establishments were found to be in
operation employing 131.29 million persons….the aforesaid 8 sectors constitute approximately
15 % of the total employment (131.29 million persons) as per 6th EC (Ministry of Labour, 2018,
p1). Hence, the QES coverage is approximately 20 million workers (.15*131.3).

32
Two questions arise with respect to the use of the QES survey. First, the extent to which the
number of jobs of the 20 million covered in the QES (> 10 workers) matches the growth in the
remainder of the establishments not covered by the QES (111 million workers). Second, the
extent to which knowledge about 131 million workers helps predict job growth in the rest of the
non-farm economy (220 million workers). (Farmers (cultivators) are estimated to be constant at
around 90-100 million workers).
If the employment growth rate in QES is taken as a rough proxy for non-farm employment in the
economy, then the rate of growth of QES employment can be employed as a rough proxy for
growth in overall employment. The new QES series started in June 2016. The latest data
available is for July-September 2017. During the previous four quarters, employment increased
by a cumulative 0.57 million. On a base of 20 million (underling worker population of QES),
this represents a 2.85 % rate of increase. On a non-farm employment base of around 350 million
in 2016, a 2.85 % increase in employment means a 10 million job gain in 2017.
The QES based estimate of job growth in 2017 (or FY18) is 10 million.
B. EPFO data for 2017--2018
The employee provident fund data is now being released to the public. This sector covers only
the formal sector, and within the formal sector, only those establishments with a firm size of 20
employees or more. According to the Economic Survey (Chapter 2: “A New, Exciting Bird’s-Eye
View of the Indian Economy Through the GST”), these firms accounted for 0.68 per cent of total
enterprises (4.9 lakh out of a total 712.9 lakh firms), and accounted for 60 million workers out of
a total of 220 million.
Ghosh and Ghosh (2018) have used the EPFO data to estimate employment growth in 2017.
Their methodology relies on total number of newly created provident fund accounts, especially
by workers belonging to the 18-25 year age group. After adjusting for possible duplications,
they find that the formal sector accounts for about 91.9 million jobs as on March 2017. Based on

33
this and other estimates they claim that about 0.6 million formal sector jobs were added to the
economy every month or 7 million formal, non-farm jobs were added during 2017/18.
Ghosh and Ghosh (GG) estimate of 7 million jobs is for the organized sector of the economy - a
sector that employs 108 million. In 2017, population aged >=15 years was 937 million, and those
going to school numbered 112 million. The Indian economy has averaged a 50 % worker to
population ratio but in 2017, because of increasing educational enrollment this average is likely
to be around 48 %. This means that expected workers in the economy in 2017, for a 940 million
population, will be around 450 million.
There is a partial check or estimate to the GG method. It is to take only the 18-21 age group from
EPFO data and see how many such “new” employees are present. For the eight-month period Sept 17
thru April 18, 1.43 million new entrants were added to the payroll. It is likely that many of these
jobs are first time jobs.
In 2013 (Sixth Economic Census), only a small fraction of establishments (0.123 million out of a
total 71 million) employed 15-19 workers, the firm size group that could add workers and be
newly eligible for EPFO because they pass the cut-off level of 20 employees. Given the small
fraction of firms (and total employment of approximately 2 million in 2013), it is unlikely that
over-estimation due to firm-size growth is a major factor in the estimation of new employment
from EPFO data.
What remains to be estimated is the fraction of the 18-21 age group who are not first time
workers. At an annualized rate, 1.43 million in 8 months is 2.2 million. A liberal estimate would
be that 20 % of this 2.2 million are not first-time jobs. Which means that we have an estimate of
1.8 million new workers in 2017/18 in just the 18-21 age group.
A. CMIE employment survey 2016 and 2017
The CMIE data is not our first choice for analysis of employment in 2016 and 2017; it is our only
choice. The raw CMIE data paints a rather gloomy picture for job growth in India. There are
two different estimates of CMIE job growth. The raw data itself shows an employment increase
of only 1.4 million jobs for the age group >=15 years – this is the basis of the common refrain

34
that there has been jobless growth in India. The adjusted by population estimate (i.e.
multiplying the worker population ratios by the UN population estimates) one obtains a decline of
2 m jobs in 2017 as per CMIE data. These data are very inconsistent with any other available data
for 2017 whether it be partial employment surveys like QES or employment growth based on
provident fund contributions.
Deconstructing CMIE data for 2016/17
How accurate is the CMIE estimate of job growth in 2017? The job growth (more accurately job
decline) estimate is at odds with whatever we know about FY18. We have noted above the
unprecedented (at least for last twenty years) acceleration in construction GDP in 2017/18, a
universally acknowledged job creation sector. We also have information on job growth via the
QES labor force surveys for 2016 and 2017. And job growth according to the newly available
EPFO data for 2017/18. All these partial estimates of job growth in the economy point to an
estimate of 7 m and above; the CMIE estimate is minus 2 million for 2017.
Table 5 provides some clues – it presents the data on employment as revealed by four different
definitions of employment in the various labor force surveys conducted between 1999/00 and
2014.
Important Trends in Employment, 1999/00 - 2017
While estimates of employment according to all definitions are presented in Table 5, the
discussion below pertains to the principal status definition.
Note that, as mentioned earlier, the 4th Labor Bureau Employment-Unemployment Survey (LB-
EUS) for 2014 is actually “centered” in December 2013 - January 2014 (recall period of one year)
and so is reported as 2013. As such, it serves as a convenient benchmark for employment prior
to the Modi government assuming power. The 2015 LB-EUS survey results are reported for 2014
as its centering is around December 2014. It also should be noted that the first two years of the
BJP-NDA government were drought years, only the fifth time this has happened in the last 150
years (the earliest rainfall data available is for 1871).

35
Of the four employment definitions, the commonly used usual status definition is the one that
shows the least employment change (only a 5 million job increase) between 2004/5 and 2011/12.
All the other three definitions (principal, weekly, and adjusted daily) show a near equal 10 m
job increase. Throughout our analysis, we will be using the principal status, and adjusted daily
status (which in large part is based on principal status) definitions (Table 5).
Table 5: Trends in Employment, Ages >= 15 years, 1999-2017
Activity Status 1999 2004 2009 2011 2013 2014 2016 2017
(in mil)
Survey Estimates
Daily-CMIE - - - - - - 403.5 404.9
Usual 282.7 400.7 395.6 417.2 456.4 423 - -
Principal 261.2 363.3 369.7 383.2 424.3 400.8 - -
Weekly 263.7 372 374.3 392.7 - - - -
Daily-PS - 376.3 378.1 395.9 - - - -
NA adjusted estimates1
Daily-CMIE - - - - - - 394.5 392.5
Usual 404.5 465.6 463.7 471.1 461.6 451.6 459.2 473.1
Principal 374.5 423.2 434.3 434.1 427.7 428 437.0 449.8
Weekly 377.6 432.7 439.2 444.1 440.0 439.0 446.7 460.1
Daily-PS 387.1 437.9 443.8 447.9 443.3 442.7 450.8 464.3
Sources: Labor Bureau Annual Employment-Unemployment Surveys 2013/14, 2015/16; NSS Surveys 04/05, 09/10,
11/12; MOSPI; "Unemployment in India", CMIE, Statistical Profiles 2016, 2017; World Population Prospects: The
2017 Revision, Key Findings and Advance Tables. ESA/P/WP/248.
Notes: 1) The survey estimates (raw data) are adjusted by gender and age-group population, as per Census -
National Accounts (NA); population data for non-Census years obtained from UN. See text for more details.

36
These employment data are surprising – for two important reasons. First, that conventional
wisdom believes that India should have been providing around 10 to 12 million jobs a year in
order to keep the unemployment rate constant. Second, that the employment data are not very
consistent with estimates of growth in labor productivity. Both these caveats (or surprises)
should be kept in mind as we explore the facts, and reasons, behind employment growth in
India.
If one were to look at just the raw survey data i.e. without the required population adjustments,
then according to the principal status definition, employment in India increased by 20 million
between 2004 and 2011 (from 363 m to 383 m). Adjusting for population (as “required” by the
survey authorities themselves) the increase in employment during the very high GDP growth
period 2004 to 2011 (average growth of 7.84 % per annum), was only 11 million, or only at a 0.36
% (CAGR) annual rate. Employment level in 2004/5 was 423.2 million, and 434.1 million in
2011. Note also that there is zero growth in principal status employment between 2009/10 and
2011/12.
By 2013, total employment had declined to 427.7 million, and it stayed at this same level in 2014
(actually increased, very marginally by 0.3 million) in the drought year versus the previous non-
drought year. This zero-growth in employment between 2013 and 2014, and a decline of 6
million from 2011/12 levels, is suggestive of the importance of employment growth in the 2014
election.
For 2017, we obtain an increase in employment of 12.8 million, principal status (from 437
million in 2016 to 449.8 million in 2017. For women, the increase is from 87.8 to 92.1 million, an
increase of 4.3 million. For men, the increase is 8.6 million (from 349.2 million jobs in 2016 to
357.8 million in 2017. We now anxiously await for confirmation (or rejection) of our estimates
from the NSSO survey for 2017/18.
Unemployment
Table 6 provides details according to principal status for two different measures of
unemployment – the conventional definition, and the adjusted definition. In the aggregate, the

37
unemployment rate stayed relatively constant at 4 % and then jumps, somewhat inexplicably, to
6.6 % in 2013 and 7.2 % in 2014 as per the Daily-PS definition. The adjusted labor force and
employment series, on the other hand, shows only a 2 percentage point increase in the
unemployment rate.
Table 7 below is a compilation of all the estimates of employment contained in this paper for
2017 or 2017/18. Regardless of the source of data (except the extremely problematical CMIE
survey) job increase in 2017/18 was between 7 and 13 million. We are partial to our finding of
12.8 million, but await confirmation from the NSOO 2017/18 survey.
Tables 6: Trends in Unemployment Rate, by Activity Status, Both Sexes, 1999-
2017
Activity Status 1999 2004 2009 2011 2013 2014 2016 2017
(in %)
Usual 2.5 2.7 2.7 2.9 4.7 5.5 6.0 4.1
Principal 3.1 4 3.6 4.1 7.3 8 8.7 6.0
Weekly 4 4.3 4.2 4.3 7.7 8.4 9.1 6.3
Daily-PS 2.9 3.6 3.5 3.7 6.6 7.2 7.8 5.4
Daily-Original - 3.6 3.5 3.7 - - 17.2 11.3
Sources: Labor Bureau Annual Employment-Unemployment Surveys 2013/14, 2015/16;NSS Surveys 04/05, 09/10,
11/12; MOSPI; "Unemployment in India", CMIE, Statistical Profiles 2016, 2017.
Notes: 1) The survey estimates (raw data) are adjusted by gender and age-group wise population, as per National
Accounts (NA), obtained from United Nations population estimates which in turn are based on census population
estimates. The NA adjusted estimates are presented in the table. See text for more details.
2) Data is presented for the age group 15 years and above.
3) "Daily-Original" is the NSSO estimates as per daily status for the years 1999-2011 and CMIE estimates for 2016 &
2017. "Daily - PS" is the CMIE equivalent definition of daily status. See text for details

38
Table 7: Estimates of Job Growth in India in 2017 - Different Methods
Explanation Estimate
for 2017/18
(im mil)
EPFO Payroll-only 18-21 age
group
The latest (September 2017-April 2018) data are
taken for only 18-21 year old because this group is
likely to be in their first job and hence double-
counting is minimized. Estimate for just 18-21 year old
1.8 m; only
18-21 year
old
EPFO (Payroll, all years,
formal sector) Ghosh & Ghosh
This is the first study to comprehensively estimate
employment growth on the basis of the newly
available EPFO data - Their estimate is only for the
formal sector (about one-third of non-farm jobs)
7
Quarterly Economic Survey
QES (non-farm)
The Quarterly Economic Survey, covers 20 million
workers, indicates that there was a 2.85 % growth in
employment; growth rate applied to non-farm sector
suggests a 10 million job gain.
10
Construction (GDP in
construction, road
construction in kms
Highest GDP growth in construction, matching
2011/12, in last 20 years; highest acceleration in
construction growth in 2017/18 in 20 years (from 1.4
% in 2016/17 to 5.8 % in 2017/18
1.7-3 m;
only
construction
CMIE -raw data For the 2017 calendar year, indicates job growth of
1.4 million 1.4
CMIE - adjusted by Census
Population
If CMIE population estimates adjusted to Census
based population, then there was negative job
growth in 2017
-2
Estimated CMIE - LFPR for 11
age-sex groups
CMIE labor force participation rates at lowest ever
for both males and females and forecast for 2016 on
basis of principal status Labor Bureau data; CMIE
unemployment rates for 2016 and 2017 used to
forecast unemployment and employment in 2016
and 2017; employment change is 12.8 million jobs
created in 2017
12.812.8
Source: Annual Employment-Unemployment Survey 2013/14; CMIE; NSS Surveys 99/00, 04/05, 09/10, 11/12; MOSPI
Notes:

39
Section 8 – Jobs necessary to meet the rising supply of labor
No discussion about job growth is complete without reference to the number of jobs “needed”.
The “needed” jobs are with reference to an assumed population growth for each age-sex
combination, and assumptions about LFPR. Population data by age-sex are available from the
UN (medium fertility variant) for all the years till 2100. Labor force participation rates are
available from household surveys.
Given these two variables (population growth and LFP rates), estimates for the future (say till
2022) can be obtained by assuming that the LFPR for different age-sex groups is equal to the last
observed rate.
Table 8 reports the estimates of number of jobs necessary for three selected years – 2011/12, 2017
and 2022. Some noteworthy results.
First, that there is virtually no growth in population (between 2017 and 2022) for the 15-19 age
group, and only a 2.3 million gain for the 20-24 age-group. Thus, for the 15-24 age-group,
population growth will increase by a paltry 2.5 million. What happened to the demographic
dividend? Fertility decline – for the better part of a decade, fertility has been declining by
approximately 0.1 percentage point a year and in 2017 is estimated to have reached the
“constant population” rate of 2.1 births per woman. India’s population growth rate has reduced
to about 1.1 % per annum; it would have been lower if mortality rates had not declined at a fast
rate.
All of this adds up to the following conclusions. First, that even in 2011/12, India needed only
8.3 million jobs to maintain the same unemployment level. By 2017, this requirement had
reduced to 7.5 million – and by 2022, the requirement will be for less than 7 million.

40
Table 8: Jobs Needed, 2011-2022
2011
2017
2022
Age
Group Population
Jobs
Needed Population
Jobs
Needed Population
Jobs
Needed
(in mil)
15-19 117.5 0.1
120.1 0.1
120.3 -0.1
20-24 113.1 0.4
116.8 0.2
119.1 0.2
25-29 104.8 1
112.4 0.5
115.5 0.3
30-34 95 1.1
104.8 1
111 0.5
35-39 84.1 1.3
95.1 1.2
103.3 1.1
40-44 75.4 0.9
84.3 1.3
93.4 1.2
45-49 66.4 1
74.7 0.8
82.3 1.3
50-54 57.3 0.8
65.3 0.9
72.2 0.8
55-59 47.6 0.8
55.4 0.8
62 0.8
60-64 34.2 1
44.7 0.6
50.8 0.5
>=65 54.3 0.4
65.2 0.6
79 0.7
All 950.6 8.3
1019.1 7.5
1072.3 6.9
Sources: NSS Survey 11/12; "Unemployment in India", CMIE, Statistical Profiles 2016, 2017; World
Population Prospects: The 2017 Revision, Key Findings and Advance Tables. ESA/P/WP/248.
Notes:

41
Section 9: Conclusions
Our study into the past (and partial present) has led us to re-examine some of the prevailing
conclusions about the job market in India. The first “finding” is that it is incorrect to conclude,
based on historical labor force participation (LFP) trends, that India needs 12 million (range
often mentioned is 10-14 million jobs) jobs a year. The reality is closer to 7-8 million jobs and the
highest needed, over the last 20 years, is the 10 million estimate for 2004/5.
Related to this result is the finding that the size of the young 15-24 age group is expected to
increase by only 2.5 million over the next five years (from 236.2 million in 2017 to 238.7 million
in 2022). Even with the more expansive definition of the young (15-34 years), the increase is
only 11.7 million over the next five years, compared to an increase of almost twice this rate
between 2012 and 2017 (433.9 million to 453.1 million).
Both the demographic dividend and high population growth are now part of history. The
national fertility rate is now at replacement levels (2.1 children per woman) and the population
growth rate has declined to just 1.1 % a year, from a 1.8 % level two decades ago.
The second important result pertains to the rather robust expansion of educational enrollment.
Between 2004/5 and 2011/12, about 40 million more went to school or college (age group >=15
years). Over the next six years, it is estimated that education enrollment increased from 101
million in 2011/12 to 112 million in 2017.
This result has implications for job growth. A person cannot be a full-time worker and a full-
time student. If the two activities are considered as “working” then this adjusted definition of
employment (working or full-time student) provides some clues about the changing labor and
job market in India. The aggregate unemployment rate increases by almost 500 bp between 1999
and 2014 (from 3,1 to 8 %), but the unemployment rate (adjusted for education) shows an
increase of only 250 bp (from 2.3 % in 1999 to 4.8 % in 2014).
Our third important finding pertains to labor force participation (LFP) rates for both women
and men. Much has been discussed in the literature about the so-called precarious drop in
female LFP rates. We find that there has been an equal magnitude drop in LFP rates for men!

42
Further, the LFP rate fall is exaggerated by the fact that educational expansion has occurred
during the same time-period when the LFP rate fall has been the greatest. Adjusting for
educational enrolment, both men and women LFP rates have declined by an equally small
amount – about 3 ppt between 1999 and 2014. A separate paper on this subject will soon be
made available, but the fact remains that LFP rates have not faced a “precipitous” drop for
either males or females.
There is little doubt that 2017 was a good year for employment growth. Using the newly
released EPFO payroll reports, Ghosh and Ghosh estimate that 7 million jobs were added in
2017. Our estimate of the same EPFO data, for the 18-21 age group where there is a minimum of
error due to double counting, indicates about 1.8 million jobs for just this four year age group.
Historically, this is a large job-addition for this age-group. Use of the Quarterly Employment
Survey also indicates job addition to be greater than 7 million in 2017.
In this paper, we have generated employment series for all the various definitions – usual
status, principal status, weekly status, daily status and the CMIE definition (a hybrid daily-
principal status). All the definitions give broadly similar results – for the principal status, we
obtain a 12.8 million jobs gain between the 437 million employment level in 2016 and the 449.8
million employment level in 2017. The 2011/12 NSSO survey reported such employment level to
be 434.1 million, and the 2004/5 survey employment was 423.2 million. What these data indicate
is that in the high economic growth period 2004 to 2011, the economy added 10.9 million jobs; in
the recent 2014 to 2017 period, the economy has added 15.7 million jobs, with most of the gains
in 2017. The data also indicate that just prior to 2014, employment in India was 6 million less
than the 434 million level of 2011/12.
Some of the outsized employment gain in 2017 might be due to the fact that the previous year
employment levels were below normal – two successive droughts, and major economic reforms.
What is ironic is that the year for which there has been the maximum number of claims of
jobless growth, may turn out to be the year of maximum employment gains in the last 15 years.

43
References
1. Aggarwal, Shilpa. “Do Rural Roads Create Pathways out of Poverty? Evidence from India”
Journal of Development Economics 133 (July 2018) 375-395.
2. Andres, Luis Alberto; Dasgupta, Basab; Joseph, George; Abraham, Vinoj; Correia, Maria
C.. 2017. “Precarious drop: reassessing patterns of female labor force participation in India
(English).” Policy Research working paper; no. WPS 8024. Washington, D.C. : World
Bank Group. Available at:
http://documents.worldbank.org/curated/en/559511491319990632/Precarious-drop-
reassessing-patterns-of-female-labor-force-participation-in-India
3. Bhalla, Surjit S. 2018. “Robust job growth, not fake news”, Indian Express, April 28.
4. Bhalla, Surjit S., 2017, The New Wealth of Nations, Simon & Schuster, November.
5. Bhalla, Surjit, and Ravinder Kaur. "Labour force participation of women in India: some facts,
some queries." 2011.
6. CMIE & BSE, "Unemployment in India". Available at:
https://unemploymentinindia.cmie.com/.
7. Das, Tirtha; Bhalla, Surjit; Kaur, Ravinder. 2018. “Labor Force Participation Rates in India –
Issues & Estimates” (forthcoming)
8. Ghosh & Ghosh “Towards a Payroll Reporting in India”, 2018. Available at:
http://www.iimb.ac.in/sites/default/files/Payroll%20in%20India-detailed_0.pdf
9. Ghosh, Ajit. “India Employment Report”. Oxford University Press, 2016.
10. Kapoor, Radhicka. "Waiting for Jobs". No. 286. ICRIER Working Paper, 2014.
11. Kaur, Ravinder, Surjit S Bhalla, Manoj Kumar and Prasanthi Ramakrishnan, 2016, "Sex
Ratio at Birth – The Role of Class and Education" Technical Report, UNFPA, India, April.
12. Khandker, Shahidur R., Zaid Bakht, and Gayatri B. Koolwal. "The poverty impact of rural
roads: Evidence from Bangladesh." Economic Development and Cultural Change 57, no. 4
(2009): 685-722.
13. Labour Bureau. 2015. “Report on 4th Annual Employment-Unemployment Survey (2014-15),
Volume 1”. Ministry of Labour and Employment. Available at:

44
14. Labour Bureau. 2016. “Report on 5th Annual Employment-Unemployment Survey (2015-16),
Volume 1”. Ministry of Labour and Employment. Available at:
http://labourbureaunew.gov.in/UserContent/EUS_5th_1.pdf
15. Labour Bureau. 2017. “Quarterly Report on Employment Scenario (New Series), 2016”.
Ministry of Labour and Employment. Available at: http://labourbureaunew.gov.in/
UserContent/QES_Report_Jan_2017.pdf
16. Labour Bureau. 2018. “Quarterly Report on Employment Scenario in Selected Sectors”.
Ministry of Labour and Employment. March.
17. Misra, Sangita, and Anoop K. Suresh. "Estimating employment elasticity of growth for the
Indian economy." WPS (DEPR) 6 (2014): 2014.
18. NSSO. 2001. “Report No. 458: Employment and Unemployment situation in India, 1999–2000:
NSS 55th round” (New Delhi, Ministry of Statistics and Programme Implementation,
Government of India).
19. NSSO. 2006. “Report No. 515: Employment and Unemployment Situation in India, 2004–05:
NSS 61st round” (New Delhi, Ministry of Statistics and Programme Implementation,
Government of India).
20. NSSO. 2011. “Key Indicators of Household Consumer Expenditure in India 2009–2010: NSS
66th round” (New Delhi, Ministry of Statistics and Programme Implementation,
Government of India).
21. NSSO. 2011. “Report No. 537: Employment and Unemployment Situation in India, 2009–10:
NSS 66th round” (New Delhi, Ministry of Statistics and Programme Implementation,
Government of India).
22. NSSO. 2011. “Report No. 554: Employment and Unemployment Situation in India, 2011–12:
NSS 68th round” (New Delhi, Ministry of Statistics and Programme Implementation,
Government of India).
23. Team, S. D. R. D., Mehta, R., Giri, B. K., & Roy, S., 2008. “Review of Concepts and
Measurement Techniques in Employment and Unemployment Surveys of NSSO.”

45
24. United Nations, Department of Economic and Social Affairs, Population Division (2015).
“World Population Prospects: The 2015 Revision”, Key Findings and Advance Tables.
ESA/P/WP.241.
25. “World Bank. 2018. South Asia Economic Focus, Spring 2018 : Jobless Growth?” Washington,
DC: World Bank. © World Bank. Available at:
https://openknowledge.worldbank.org/handle/10986/29650.”