
All tied up MENA - Building a better working world - EY · PDF fileAll tied up MENA. Working...
20
All tied up MENA Working capital management report 2017
Transcript of All tied up MENA - Building a better working world - EY · PDF fileAll tied up MENA. Working...
All tied up MENAWorking capital management report 2017

ForewordAll tied up MENA: working capital report 2017 is part of a series of working capital (WC) management reports based on EY research, reviewing the WC performance of the world’s largest companies.
WC involves Account receivables — Account payables + inventory
Total sales decreased by
Cash opportunity of
Total net working capital (NWC) increased by
Cash-to-cash (C2C) cycle increased by
in FY16 compared with FY15
was identified in FY16.
in FY16 compared with FY15
days in FY16 compared with FY15
All tied up MENA: working capital report 2017 is the first of the reports in the series, focusing on the Middle East and North Africa (MENA) region. The survey focuses on the top 326 companies in the MENA region, examining their WC performance at the company, regional, industry and country levels. In addition, this report sets out the findings of a review comparing the WC performance of small, medium and large companies with that of very large companies.
The analysis in this report can be useful to benchmark your performance with the industry averages and the upper quartiles.
The analysis also provides insights into the trends of various companies and their WC behavior over a period.
Key findings
4.1%
US$29.8b
2.0% 8
2 | All tied up MENA
ContentsExecutive summary 4
MENA companies overview 6
WC performance — by industry 10
WC performance — by size 12
Top vs. bottom WC performers 14
WC performance — by geography 15
WC self-diagnostic 16
How EY can help 17
Methodology and glossary 19

There was an increase in WC metrics compared with 2013The WC Cash to Cash (C2C) increased by 15 days to 116 days in 2016 from 101 days in 2013. The increase was primarily due to an increase in days sales outstanding (DSO) in 2016 by 13 days compared with 2013.
Very large companies (by size) manage WC more efficiently than mid- and small-sized companiesOverall, the larger companies have managed to improve their WC in 2015 compared with small- and mid-sized companies. The average NWC by sales percentage for very large companies decreased to 7% in 2016 from 10% in 2013. The average NWC by sales percentage for small companies was 35% in 2016.
What influences WC?Middle East (MENA) companies have not been proactive in managing WC in 2016. The following economic situations resulted in WC deterioration in 2016:
• Sales decrease • Volatile oil prices• Rising interest rates• Decrease in banks’ lending appetite
Is it more than just negotiating power?The common misconception is that improvements are related only to payment terms. However, in reality, there are many different levers to pull in trade and non-trade WC, such as order processing time, invoice processing timeline, invoice trigger date, invoice delivery timeline and dispute management.
The key aspect that drives WC reduction for very large companies is their investment in people, policies, processes and infrastructure. Discipline in creating and adhering to smart WC processes helps release cash trapped in the business because of process inefficiencies.
Executive summary
4 | All tied up MENA
Themes Key questions to think about

WC top performers operate better across all the metricsOn the basis of the study, top WC performers, on average, show better financial metrics, such as earnings before interest, taxes, depreciation and amortization (EBITDA), return on equity (ROE), and return on capital employed (ROCE), compared with WC performers at the bottom of the scale. They also have more spare cash toward capital expenditure (capex) compared with poor performers.
There are good performers in every industryOn the basis of the study, every industry has exeptional WC improvement. Out of the top 15 industries, four have seen improvement in WC metrics for 50% or more of the companies.
What is the link?There are multiple strategic advantages of WC improvements, such as:
• Creating investment capacity• De-leveraging the business or improving
shareholder yield• Dividend payments • Lower interest income
What can be learnt from them?There are a number of companies improving their WC performance in every industry. The sectors with the largest variance are building materials, chemicals, food producers and distributors, among others.
5 All tied up MENA |
Themes Key questions to think about

MENA companies overview
Reduced sales growth and cash on hand
In FY16, the sales for MENA companies declined by 4.1% compared with FY15. This was primarily because of subdued industrial activity, weak investment environment and low oil prices. The key sectors with maximum sales drop are household durable products, entertainment industry, oil and gas, and industrial and packing material.
Cash on hand for the MENA companies went down by 2.7% in FY16. This may be because of increased WC metrics; and thereby, excess cash unnecessarily being tied up in the business.
Source: EY analysis, based on publicly available annual financial statements Source: EY analysis, based on publicly available annual financial statements
“ In a tough economic environment, it is important to focus on efficiencies and maintain an optimal capital structure. WC optimization can help support the capital structure by releasing excess cash, which can be effectively utilized elsewhere.”
Hani BisharaEY MENA Debt Advisory, Working Capital and Restructuring Leader
53,653
59,208
52,164 50,776
46,000
48,000
50,000
52,000
54,000
56,000
58,000
60,000
FY13 FY14 FY15 FY16
US$
m
Chart 1: Overall trend of sales over historical period Chart 2: Cash balances over historical period
2,55,787
2,69,975
2,57,111
2,46,638
2,30,0002,35,0002,40,0002,45,0002,50,0002,55,0002,60,0002,65,0002,70,0002,75,000
FY13 FY14 FY15 FY16
US$
m
6 | All tied up MENA

Source: EY analysis, based on publicly available annual financial statements
Source: EY analysis, based on publicly available annual financial statements
Source: EY analysis, based on publicly available annual financial statements
Source: EY analysis, based on publicly available annual financial statements
Increase in short-term borrowings and reduction in total debt compared with 2015
A review of the total debt and short-term borrowings indicate that total debt and short-term borrowings increased by 2.5% and 12.0% respectively in 2016. This indicates the need for increased WC
investment required by companies. The total debt increased by 17.0% between 2013 and 2016.
1,64,919
1,81,595 1,84,928
1,92,949
1,50,0001,55,0001,60,0001,65,0001,70,0001,75,0001,80,0001,85,0001,90,0001,95,0002,00,000
FY13 FY14 FY15 FY16
US$
m
US$m
101 102
108
116
90
95
100
105
110
115
120
2013 2014 2015 2016
Day
s
2013 2014 2015 201665
70
75
80
85
90
Day
s
72 72
78
85
15,640
12,955 13,036 14,733
FY13 FY14 FY15 FY16
US$
m
02,0004,0006,0008,000
10,00012,00014,00016,00018,000
Chart 3: Overall trend in total debt
Chart 5: Overall C2C trend over historical period
Chart 6: Overall DSO trend over historical period
Chart 4: Overall trend in short-term borrowings
The cash to cash cycle for the region increased by eight days to 116 days in 2016 (2013: 101 days). This was primarily because of a significant increase in DSO.
Our study shows that MENA companies are collecting their dues seven days slower in 2016 compared to 2015. There may be multiple drivers, such as increase in credit period, weaker collections process and liquidity issues for a few customers. However, an interesting aspect is the percentage overdue of total receivables and its movement across years. The health of receivables can be ascertained by analyzing the movement of overdue percentage over the period.
7 All tied up MENA |
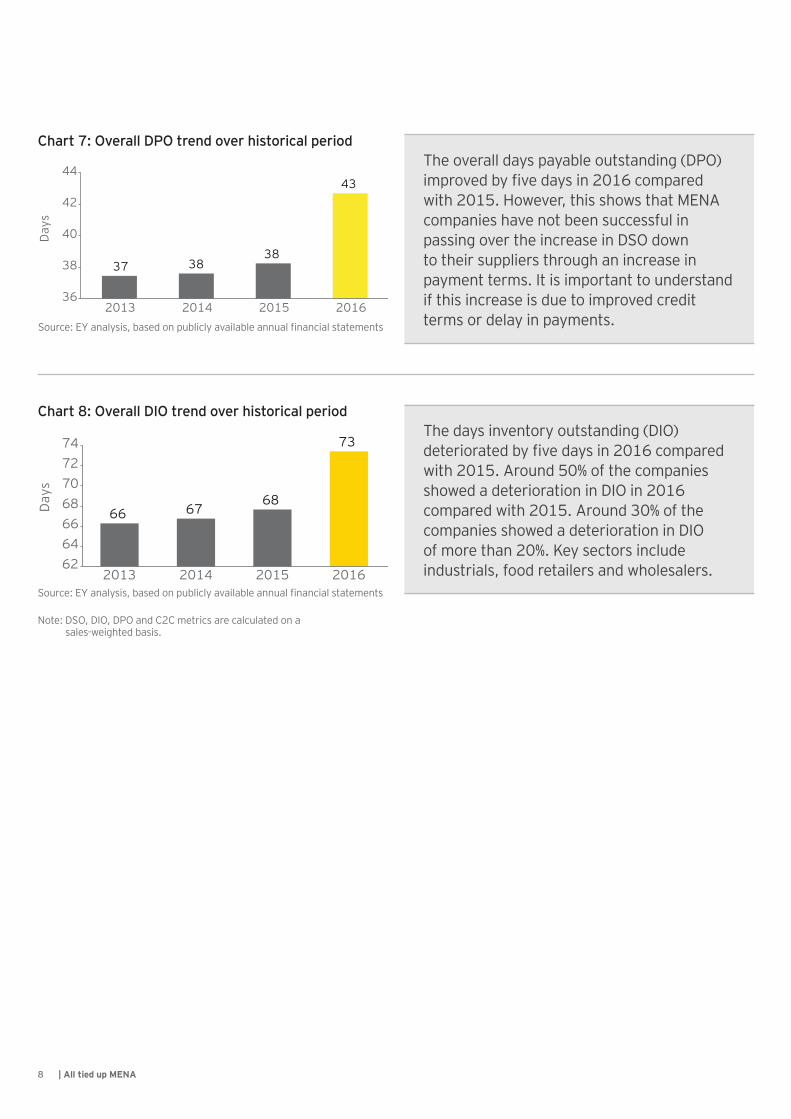
The overall days payable outstanding (DPO) improved by five days in 2016 compared with 2015. However, this shows that MENA companies have not been successful in passing over the increase in DSO down to their suppliers through an increase in payment terms. It is important to understand if this increase is due to improved credit terms or delay in payments.
Chart 7: Overall DPO trend over historical period
Chart 8: Overall DIO trend over historical period
Source: EY analysis, based on publicly available annual financial statements
Source: EY analysis, based on publicly available annual financial statements
Note: DSO, DIO, DPO and C2C metrics are calculated on a sales-weighted basis.
37 38 38
43
36
38
40
42
44
2013 2014 2015 2016
Day
s
66 67 68
73
62646668707274
2013 2014 2015 2016
Day
s
The days inventory outstanding (DIO) deteriorated by five days in 2016 compared with 2015. Around 50% of the companies showed a deterioration in DIO in 2016 compared with 2015. Around 30% of the companies showed a deterioration in DIO of more than 20%. Key sectors include industrials, food retailers and wholesalers.
8 | All tied up MENA

9 All tied up MENA |
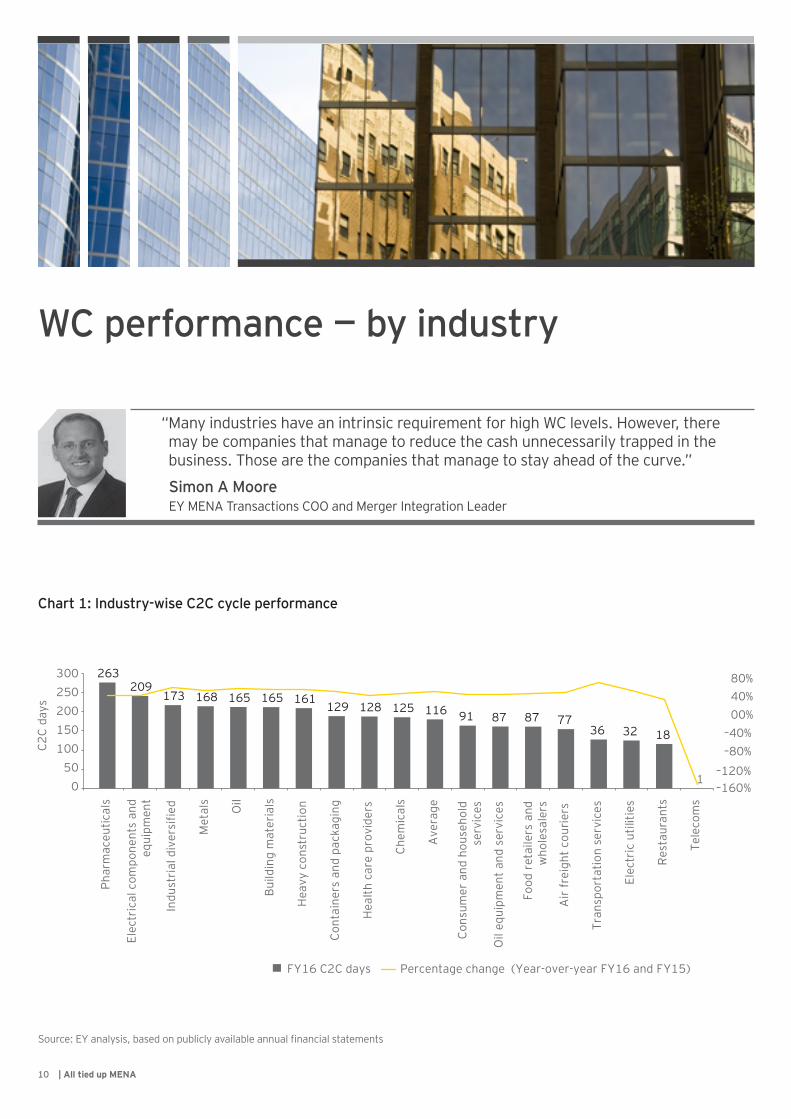
WC performance — by industry
“ Many industries have an intrinsic requirement for high WC levels. However, there may be companies that manage to reduce the cash unnecessarily trapped in the business. Those are the companies that manage to stay ahead of the curve.”
Simon A MooreEY MENA Transactions COO and Merger Integration Leader
Chart 1: Industry-wise C2C cycle performance
Source: EY analysis, based on publicly available annual financial statements
263 209
173 168 165 165 161 129 128 125 116 91 87 87 77
36 32 18
1 –160%–120%
–80%–40%
00%40%80%
050
100150200250300
Phar
mac
eutic
als
Indu
stri
al d
iver
sifie
d
Met
als
Oil
Build
ing
mat
eria
ls
Hea
vy c
onst
ruct
ion
Cont
aine
rs a
nd p
acka
ging
Hea
lth c
are
prov
ider
s
Chem
ical
s
Ave
rage
Air
frei
ght c
ourie
rs
Tran
spor
tatio
n se
rvic
es
Elec
tric
util
ities
Res
taur
ants
Tele
com
s
C2C
days
FY16 C2C days Percentage change (Year-over-year FY16 and FY15)
Oil
equi
pmen
t and
ser
vice
s
Cons
umer
and
hou
seho
ldse
rvic
es
Food
ret
aile
rs a
ndw
hole
sale
rs
Elec
tric
al c
ompo
nent
s an
deq
uipm
ent
10 | All tied up MENA
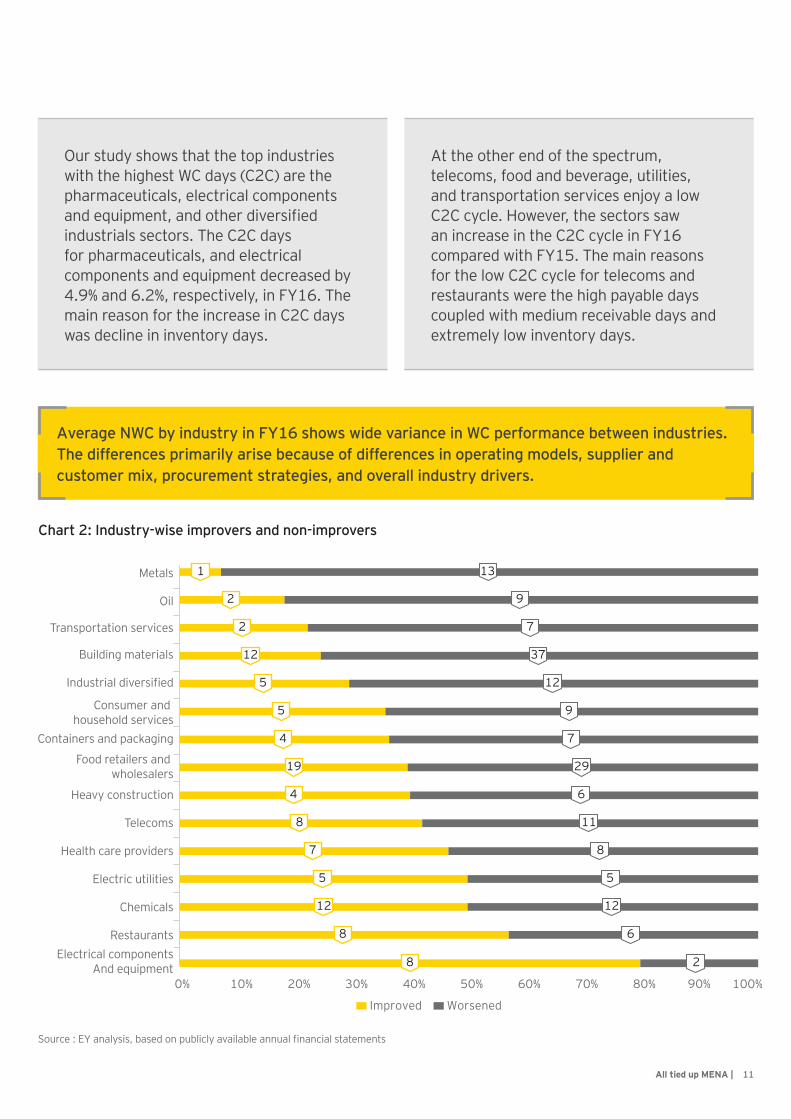
Chart 2: Industry-wise improvers and non-improvers
Source : EY analysis, based on publicly available annual financial statements
2
2
1 13
0% 10% 20% 30% 40% 50% 60% 70% 80% 90% 100%
Improved Worsened
12
5
5
4
19
4
8
7
5
12
8
8
9
7
37
12
9
7
29
6
11
8
5
12
6
2
RestaurantsElectrical components
And equipment
Chemicals
Electric utilities
Health care providers
Telecoms
Heavy construction
Containers and packaging
Industrial diversified
Consumer and household services
Food retailers and wholesalers
Building materials
Transportation services
Oil
Metals
Our study shows that the top industries with the highest WC days (C2C) are the pharmaceuticals, electrical components and equipment, and other diversified industrials sectors. The C2C days for pharmaceuticals, and electrical components and equipment decreased by 4.9% and 6.2%, respectively, in FY16. The main reason for the increase in C2C days was decline in inventory days.
At the other end of the spectrum, telecoms, food and beverage, utilities, and transportation services enjoy a low C2C cycle. However, the sectors saw an increase in the C2C cycle in FY16 compared with FY15. The main reasons for the low C2C cycle for telecoms and restaurants were the high payable days coupled with medium receivable days and extremely low inventory days.
Average NWC by industry in FY16 shows wide variance in WC performance between industries.The differences primarily arise because of differences in operating models, supplier and customer mix, procurement strategies, and overall industry drivers.
11 All tied up MENA |

The gap in WC performance between small, medium, large and very large companies increased in FY16, continuing from previous years.
Source: EY analysis, based on publicly available annual financial statements
Chart 1: Size-wise C2C cycle performance
Table 2: Movement between FY16 and FY15
Company size DSO DPO DIO C2C
Small 6% 16% 8% 4%
Medium 12% 4% 7% 11%
Large 9% 8% 16% 15%
Very large 29% 7% -8% 19%
Small — Revenue less than US$250mMedium — Revenue US$251m to US$750m
Large — Revenue US$750m to US$2bVery large — Revenue more than US$2b
WC performance — by size
C2C
days
Small Medium Large Very large
0204060
80
100120140
FY13 FY14 FY15 FY16
57 59 64
75
110 108 116 131
113 117 123 129
36 21 20 24
“ WC management appears to be a key area of concern for many companies in the region. It is important for MENA companies across sizes to move from an only P&L-focused organization to P&L and cash-focused organization.”
Phil Gandier EY MENA TAS Leader
12 | All tied up MENA
Source: EY analysis, based on publicly available annual financial statements
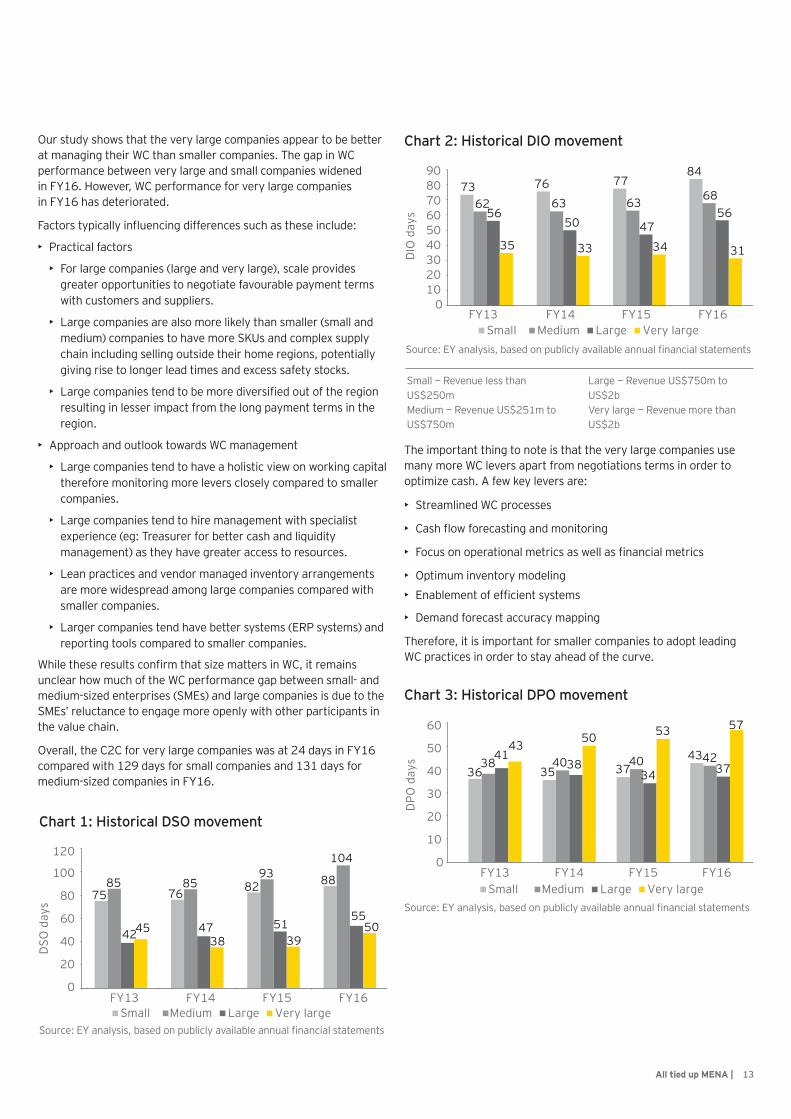
Chart 2: Historical DIO movement
The important thing to note is that the very large companies use many more WC levers apart from negotiations terms in order to optimize cash. A few key levers are:
• Streamlined WC processes
• Cash flow forecasting and monitoring
• Focus on operational metrics as well as financial metrics
• Optimum inventory modeling• Enablement of efficient systems
• Demand forecast accuracy mapping
Therefore, it is important for smaller companies to adopt leading WC practices in order to stay ahead of the curve.
Small — Revenue less than US$250mMedium — Revenue US$251m to US$750m
Large — Revenue US$750m to US$2bVery large — Revenue more than US$2b
73 62
56
35
76 63
50
33
77
63
47
34
84
68 56
31 DIO
day
s
Small Medium Large Very large
0102030405060708090
FY13 FY14 FY15 FY16
Our study shows that the very large companies appear to be better at managing their WC than smaller companies. The gap in WC performance between very large and small companies widened in FY16. However, WC performance for very large companies in FY16 has deteriorated.
Factors typically influencing differences such as these include:
• Practical factors
• For large companies (large and very large), scale provides greater opportunities to negotiate favourable payment terms with customers and suppliers.
• Large companies are also more likely than smaller (small and medium) companies to have more SKUs and complex supply chain including selling outside their home regions, potentially giving rise to longer lead times and excess safety stocks.
• Large companies tend to be more diversified out of the region resulting in lesser impact from the long payment terms in the region.
• Approach and outlook towards WC management
• Large companies tend to have a holistic view on working capital therefore monitoring more levers closely compared to smaller companies.
• Large companies tend to hire management with specialist experience (eg: Treasurer for better cash and liquidity management) as they have greater access to resources.
• Lean practices and vendor managed inventory arrangements are more widespread among large companies compared with smaller companies.
• Larger companies tend have better systems (ERP systems) and reporting tools compared to smaller companies.
While these results confirm that size matters in WC, it remains unclear how much of the WC performance gap between small- and medium-sized enterprises (SMEs) and large companies is due to the SMEs’ reluctance to engage more openly with other participants in the value chain.
Overall, the C2C for very large companies was at 24 days in FY16 compared with 129 days for small companies and 131 days for medium-sized companies in FY16.
Source: EY analysis, based on publicly available annual financial statements
Chart 1: Historical DSO movement
75 76 82 88 85 85 93
104
42 47 51 55
45 38 39
50
0
20
40
60
80
100
120
FY13 FY14 FY15 FY16
DSO
day
s
Small Medium Large Very large
Source: EY analysis, based on publicly available annual financial statements
Chart 3: Historical DPO movement
DPO
day
s
FY13 FY14 FY15 FY16Small Medium Large Very large
36 35 37 43
38 40 40 42 41 38
34 37
43 50 53 57
0
10
20
30
40
50
60
13 All tied up MENA |
Top WC performers
24C2
C
39DSO
38DIO
54DPO
19%
EBITDA by sales
14%
Cape
x by
sales
perc
enta
ge
6%
TWC by sales
percentage6%ROCE
percentage Bottom WC performers
222
C2C
146DSO
119DIO
43DPO
17%
EBITDA by sales
12%
Cape
x by
sales
perc
enta
ge
61%
TWC by sales
percentage3%ROCE
percentage
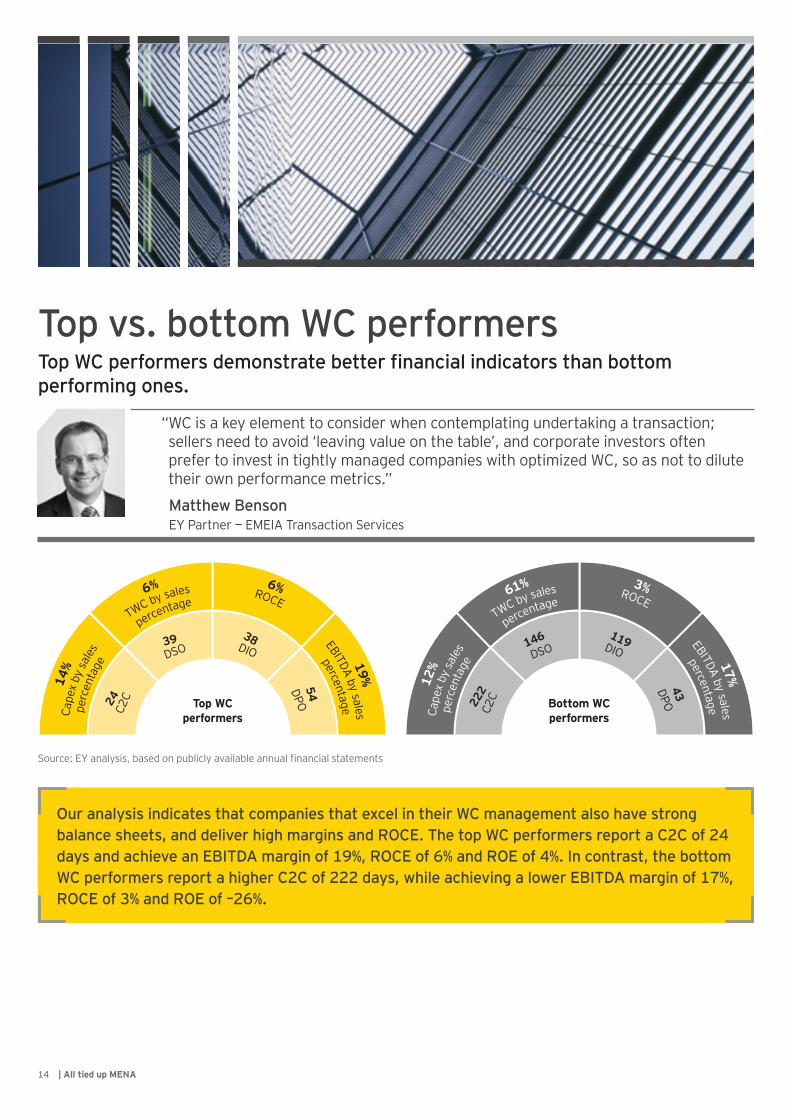
Top vs. bottom WC performersTop WC performers demonstrate better financial indicators than bottom performing ones.
“ WC is a key element to consider when contemplating undertaking a transaction; sellers need to avoid ‘leaving value on the table’, and corporate investors often prefer to invest in tightly managed companies with optimized WC, so as not to dilute their own performance metrics.”
Matthew Benson EY Partner — EMEIA Transaction Services
Source: EY analysis, based on publicly available annual financial statements
Our analysis indicates that companies that excel in their WC management also have strong balance sheets, and deliver high margins and ROCE. The top WC performers report a C2C of 24 days and achieve an EBITDA margin of 19%, ROCE of 6% and ROE of 4%. In contrast, the bottom WC performers report a higher C2C of 222 days, while achieving a lower EBITDA margin of 17%, ROCE of 3% and ROE of –26%.
14 | All tied up MENA

WC performance — by geography
Kingdom of Saudi Arabia
87
799240
130
49
1096351
121
38
1286738
157
16
704636
80
49
835137
97
41
587945
93
36
1139854
157
10
753634
77
326
917343
121
Oman Kuwait EgyptUnited Arab
EmiratesJordan Qatar Bahrain Total
Number of companies DSO
DPODIO
C2C
Source: EY analysis, based on publicly available annual financial statements
Source: EY analysis, based on publicly available annual financial statements
0% 10% 20% 30% 40% 50% 60% 70% 80% 90% 100%
20% 80%
27% 73%
31% 69%
35% 65%
36% 64%
39% 61%
45% 55%
65% 35%
Percentage of improvers Percentage of non-improvers
Bahrain
Jordan
Qatar
Oman
UAE
KSA
Kuwait
Egypt
Chart 1: Country-wise percentage of improvers vs. non-improvers
“ Liquidity and working capital management have been an important focus area for many global companies over the past few years. There is an opportunity for MENA companies to align their WC performance with that of their global peers.”
Jon Morris EY EMEIA Working Capital Leader
15 All tied up MENA |
130
Heavy construction
Air freight couriers
Building materials
Chemicals
Consumer and household services
Containers and packaging
Electric utilities
Electrical components and equipment
Food retailers and wholesalers
Health care providers
Industrial diversified
Oil equipment and services
Pharmaceuticals
Restaurants
Telecoms
Transportation services
Metals
Oil
152
152
160
70
268
125
195
199
222
207
56
106
283
22
35
48
39
110
39
132
47
177
84
110
132
149
122
39
87
232
–1
22
38
170 213
36
86
2
120
19
121
49
89
46
124
83
8
53
87
–16
4
28
110
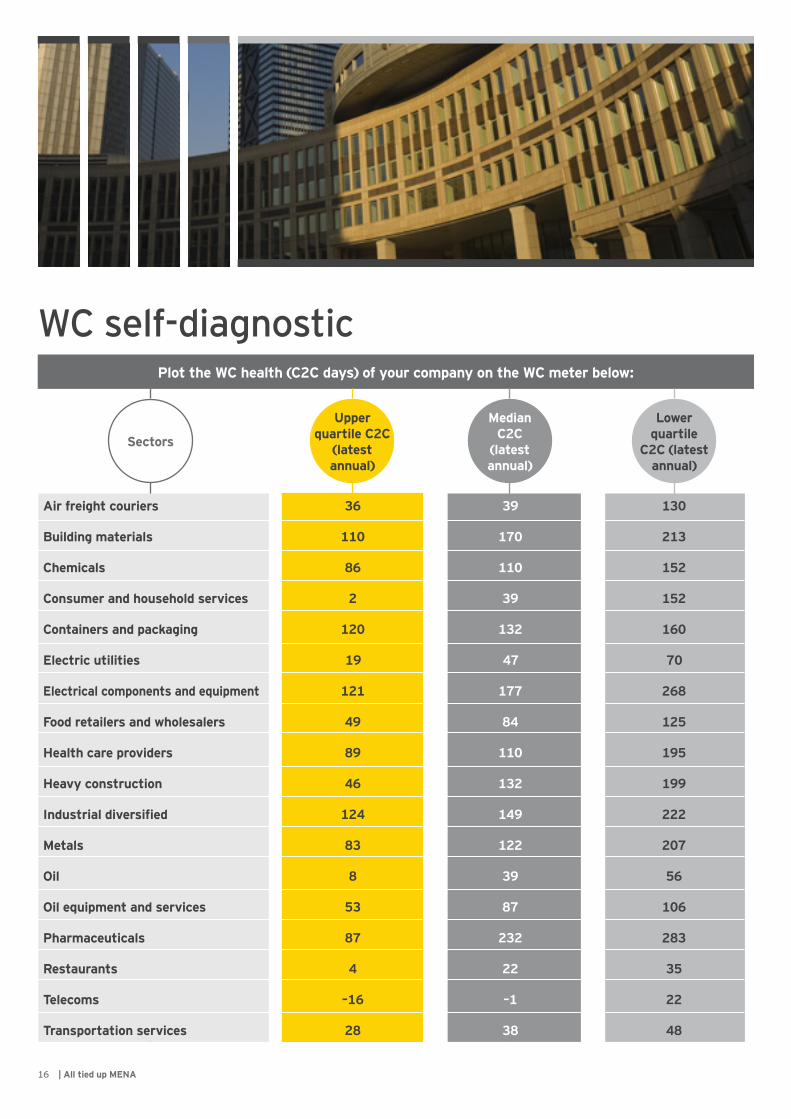
WC self-diagnostic
Sectors
Upper quartile C2C
(latest annual)
Median C2C
(latest annual)
Lower quartile
C2C (latest annual)
Plot the WC health (C2C days) of your company on the WC meter below:
16 | All tied up MENA
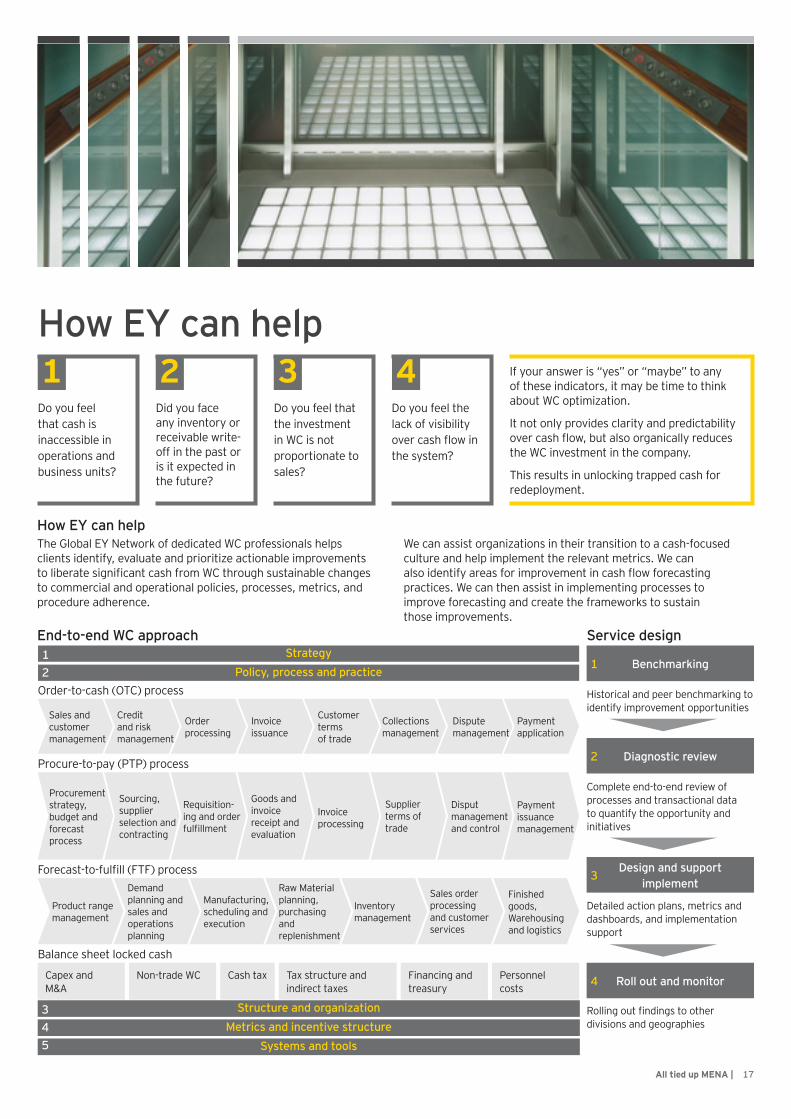
How EY can helpIf your answer is “yes” or “maybe” to any of these indicators, it may be time to think about WC optimization.
It not only provides clarity and predictability over cash flow, but also organically reduces the WC investment in the company.
This results in unlocking trapped cash for redeployment.
How EY can help
End-to-end WC approach Service design
The Global EY Network of dedicated WC professionals helps clients identify, evaluate and prioritize actionable improvements to liberate significant cash from WC through sustainable changes to commercial and operational policies, processes, metrics, and procedure adherence.
We can assist organizations in their transition to a cash-focused culture and help implement the relevant metrics. We can also identify areas for improvement in cash flow forecasting practices. We can then assist in implementing processes to improve forecasting and create the frameworks to sustain those improvements.
Metrics and incentive structureStructure and organization
Systems and tools
StrategyPolicy, process and practice
Order-to-cash (OTC) process
Forecast-to-fulfill (FTF) process
Balance sheet locked cash
Procure-to-pay (PTP) process
Sales and customer management
Product range management
Capex and M&A
Non-trade WC Cash tax Tax structure and indirect taxes
Financing and treasury
Personnel costs
Procurement strategy, budget and forecast process
Credit and risk management
Demand planning and sales and operations planning
Sourcing, supplier selection and contracting
Order processing
Manufacturing, scheduling and execution
Requisition-ing and order fulfillment
Invoice issuance
Raw Material planning, purchasing and replenishment
Goods and invoice receipt and evaluation
Customer terms of trade
Inventory management
Invoice processing
Collections management
Sales order processing and customer services
Supplier terms of trade
Dispute management
Finished goods, Warehousing and logistics
Disput management and control
Payment application
Payment issuance management
1Benchmarking
Historical and peer benchmarking to identify improvement opportunities
1
Diagnostic review
Complete end-to-end review of processes and transactional data to quantify the opportunity and initiatives
2
Design and support implement
Detailed action plans, metrics and dashboards, and implementation support
3
3
2
45
Roll out and monitor
Rolling out findings to other divisions and geographies
4
Do you feel that cash is inaccessible in operations and business units?
1Did you face any inventory or receivable write-off in the past or is it expected in the future?
2Do you feel that the investment in WC is not proportionate to sales?
3Do you feel the lack of visibility over cash flow in the system?
4
17 All tied up MENA |

TeamsJon MorrisEY EMEIA Working Capital Leader+44 20 7951 [email protected]
Pearce QuinnDirector — WorkingCapital Advisory+971 4701 0707 [email protected]
Karthik VenkatramExecutive — WorkingCapital Advisory+971 4701 2141 [email protected]
Hani is a partner in Dubai and has over 20 years of work experience in several areas, including WC management, turnaround management, M&A, corporate finance, banking, and corporate restructuring.
He has extensive experience in refinancing corporations undergoing capital restructuring, both as an advisor and a banker. He has managed debt restructuring transactions exceeding US$10b.
In his capacity as advisor, he was involved in very complex transactions, supplier and bank negotiations, and management of departments and large groups of staff in day-to-day operations.
Jon is a partner from the EY member firms in UK Working Capital services and leads Working Capital Advisory for the Europe, Middle East, India and Africa Region.
From a background in EY member firm’s Restructuring Services advising stressed and distressed companies, Jon has successfully transferred these techniques to enhance business performance in a wider field.
Jon’s clients predominantly include both FTSE 100 and private equity houses, with a particular emphasis on manufacturing, service, telecommunications, media and technology sectors.
Pearce is a director of EY MENA Transactions Advisory Services team. He has been with EY in the region for eight years.
Pearce is the director spearheading the Working Capital projects in the MENA Region. Pearce has worked on WC projects for a leading petroleum company in the UAE.
He has assisted a large multinational UAE business understand the potential cash release from implementing a WC optimization program.
Karthik is an experienced professional with the working capital team with EY MENA.
Karthik completed his Executive MBA from the Indian School of Business, Hyderabad, India.
Karthik has performed multiple WC cash release projects across sectors, such as services, manufacturing, and oil and gas.
He has evaluated processes and policies across the WC framework, including operating strategy, accounts payable, accounts receivable, inventory, reporting structure, and monitoring metrics and incentives.
He has identified multiple process inefficiencies, and re-engineered the inventory, receivables and payables processes.
Hani BisharaEY MENA Debt Advisory, Working Capital and Restructuring Leader+971 4 312 9290 [email protected]
18 | All tied up MENA

Methodology and glossary
• The report contains the findings of a review of the WC performance of 326 companies in the MENA region. We have considered companies with a revenue of above US$10m in 2016, headquartered in MENA.
• This report also sets out the findings of a review comparing the WC performance of small, medium, large and very large companies, using sales as the indicator of each company’s size. SMEs have been defined in this report as follows:
• Small — less than US$250m
• Medium — US$251m to US$750m
• Large — US$750m to US$2b
• Very large — more than US$2b
• The overall analysis draws on companies’ latest fiscal 2016 reports. Performance comparisons have been made with 2015, 2014 and 2013 for the companies.
• The report is based on the review, which is segmented by region, country, industry and company. It uses metrics to provide a clear picture of the overall WC management and identify the resulting levels of cash opportunity.
• Each of the companies analyzed in this research has been allocated to an industry and to a region or country. Reported global, regional and country numbers are sales-weighted.
• The overall review excludes financial institutions and real estate companies because of the difficulty of assessing its “true” WC performance, given the intertwined nature of its industrial and financial activities.
• The performance trends at the country and industry levels need to be treated with a degree of caution; the approach is based on consolidated numbers in the absence of further local details, with each company being allocated to the location of its headquarters.
• Because of differences in industry weightings and the level of international activity within each economy, an analysis of the WC performance gap across countries in Europe would not have been useful or meaningful.
• The WC performance metrics are calculated from the latest publicly available company annual financial statements. In order to make the figures as comparable and consistent as possible, adjustments (see glossary) have been made to the data to reflect the impact of acquisitions and disposals, and off-balance sheet arrangements.
• DSO: year-end trade receivables net of provisions, including value-added tax (VAT) and adding back securitized and current financial receivables, divided by full-year pro forma sales and multiplied by 365 (expressed as a number of days of sales, unless stated otherwise)
• DIO: year-end inventories net of provisions, divided by full-year pro forma sales and multiplied by 365 (expressed as a number of days of sales, unless stated otherwise)
• DPO: year-end trade payables, including VAT and adding back trade-accrued expenses, divided by full-year pro forma sales and multiplied by 365 (expressed as a number of days of sales, unless stated otherwise)
• C2C: sum of DSO and DIO less DPO (expressed as a number of days of sales, unless stated otherwise)
• Pro forma sales: reported sales net of VAT, and adjusted for acquisitions and disposals where this information was available
• NWC: year-end trade receivables net of provisions, including VAT and adding back securitized and current financial receivables plus year less end inventories net of provisions — year-end trade payables, including VAT and adding back trade-accrued expenses
Met
hodo
logy
Glo
ssar
y
19 All tied up MENA |
EY | Assurance | Tax | Transactions | Advisory
About EY
EY is a global leader in assurance, tax, transaction and advisory services. The insights and quality services we deliver help build trust and confidence in the capital markets and in economies the world over. We develop outstanding leaders who team to deliver on our promises to all of our stakeholders. In so doing, we play a critical role in building a better working world for our people, for our clients and for our communities.
EY refers to the global organization, and may refer to one or more, of the member firms of Ernst & Young Global Limited, each of which is a separate legal entity. Ernst & Young Global Limited, a UK company limited by guarantee, does not provide services to clients. For more information about our organization, please visit ey.com.
The MENA practice of EY has been operating in the region since 1923. For more than 90 years, we have grown to more than 6,000 people united across 20 offices and 15 countries, sharing the same values and an unwavering commitment to quality. As an organization, we continue to develop outstanding leaders who deliver exceptional services to our clients and who contribute to our communities. We are proud of our accomplishments over the years, reaffirming our position as the largest and most established professional services organization in the region.
© 2017 EYGM Limited. All Rights Reserved.
EYG no. 06103-172GBL ED None
This material has been prepared for general informational purposes only and is not intended to be relied upon as accounting, tax or other professional advice. Please refer to your advisors for specific advice.
ey.com/mena


![[PreMoney MENA 2015] ArabNet >> Omar Christidis, "THE GLOBAL VC: MENA"](https://static.fdocuments.us/doc/165x107/58d198b51a28ab6f6b8b4a09/premoney-mena-2015-arabnet-omar-christidis-the-global-vc-mena.jpg)