
All Righ - Electrical Engineering · W atermarking and Digital Signature T ec hniques for...
258
Transcript of All Righ - Electrical Engineering · W atermarking and Digital Signature T ec hniques for...

Watermarking and Digital Signature Techniques
for
Multimedia Authentication and Copyright
Protection
Ching-Yung Lin
Submitted in partial ful�llment of the
requirements for the degree of
Doctor of Philosophy
in the Graduate School of Arts and Sciences
Columbia University
2000

c 2000
Ching-Yung Lin
All Rights Reserved
ABSTRACT
Watermarking and Digital Signature Techniques for
Multimedia Authentication and Copyright Protection
Ching-Yung Lin
Multimedia authentication techniques are required in order to ensure trustwor-
thiness of multimedia data. They are usually designed based on two kinds of tools:
digital signature or watermarking. Digital signature is a non-repudiatible, encrypted
version of the message digest extracted from the data. Watermarking techniques
consider multimedia data as a communication channel transmitting owner identi�-
cation or content integrity information. Given an objective for multimedia authen-
tication to reject the crop-and-replacement process and accept content-preserving
manipulations, traditional digital signature or watermarking methods cannot be
directly applied. In this thesis, we �rst propose robust digital signature methods
that have proved to be useful for such types of content authentication. Also, we
have developed a novel semi-fragile watermarking technique to embed the proposed
robust digital signatures. We have implemented a unique Self-Authentication-and-
Recovery Images (SARI) system, which can accept quantization-based lossy com-
pression to a determined degree without any false alarms and can sensitively detect
and locate malicious manipulations. Furthermore, the corrupted areas can be ap-
proximately recovered by the information hidden in the other part of the content.
The amount of information embedded in our SARI system has nearly reached the
theoretical maximum zero-error information hiding capacity of digital images.
Watermarking is a promising solution that can protect the copyright of multime-
dia data through transcoding. A reasonable expectation of applying watermarking

techniques for copyright protection is to consider speci�c application scenarios, be-
cause the distortion behavior involved in these cases (geometric distortion and pixel
value distortion) could be reasonably predictable. We propose a practical public wa-
termarking algorithm that is robust to rotation, scaling, and/or translation (RST)
distortion. This proposed algorithm plays an important role in our design of the
public watermarking technique which survives the image print-and-scan process.
In addition, we present our original work in analyzing the theoretical watermark-
ing capacity bounds for digital images, based on the information theory and the
characteristics of the human vision system. We investigate watermarking capacity
in three directions: the zero-error capacity for public watermarking in magnitude-
bounded noisy environments, the watermarking capacity based on domain-speci�c
masking e�ects, and the watermarking capacity issues based on sophisticated Hu-
man Vision System models.
Contents
1 Introduction 1
1.1 Multimedia Authentication : : : : : : : : : : : : : : : : : : : : : : : : 3
1.1.1 Multimedia Authentication Objectives: Complete Authenti-
cation v.s. Content Authentication : : : : : : : : : : : : : : : 5
1.1.2 Multimedia Authentication Sources: Raw Data v.s. Com-
pressed Data : : : : : : : : : : : : : : : : : : : : : : : : : : : 8
1.1.3 MultimediaAuthenticationMethods: Watermarking v.s. Dig-
ital Signature : : : : : : : : : : : : : : : : : : : : : : : : : : : 8
1.1.4 Requirements of Multimedia Authentication System : : : : : : 12
1.2 Models of Watermarking : : : : : : : : : : : : : : : : : : : : : : : : : 13
1.3 Geometric Distortion Resilient Public Watermarking for Copyright
Protection : : : : : : : : : : : : : : : : : : : : : : : : : : : : : : : : : 14
1.4 Theoretical Watermarking Capacity Issues : : : : : : : : : : : : : : : 17
1.5 Structure of Thesis : : : : : : : : : : : : : : : : : : : : : : : : : : : : 20
1.5.1 Original Contributions of Thesis : : : : : : : : : : : : : : : : : 24
2 Image/Video Authentication Using Robust Digital Signature 25
2.1 Introduction : : : : : : : : : : : : : : : : : : : : : : : : : : : : : : : : 25
2.2 Review of JPEG Lossy Compression : : : : : : : : : : : : : : : : : : 29
2.3 Authentication System : : : : : : : : : : : : : : : : : : : : : : : : : : 30
i

2.3.1 Invariants of an image before and after JPEG compression : : 31
2.3.2 Image Analyzer: Feature Extraction : : : : : : : : : : : : : : : 34
2.3.3 Authentication Process : : : : : : : : : : : : : : : : : : : : : : 38
2.3.4 Encryption, Decryption and Signature Length : : : : : : : : : 41
2.3.5 Example: A small 16 � 8 image : : : : : : : : : : : : : : : : : 43
2.3.6 Color Images : : : : : : : : : : : : : : : : : : : : : : : : : : : 45
2.4 Performance Analysis : : : : : : : : : : : : : : : : : : : : : : : : : : : 45
2.4.1 Noise from the Compression Process and the Probability of
False Alarm : : : : : : : : : : : : : : : : : : : : : : : : : : : : 47
2.4.2 Manipulation and the Probability of Miss : : : : : : : : : : : : 49
2.4.3 The Probability of Attack Success : : : : : : : : : : : : : : : : 52
2.5 Experimental Results : : : : : : : : : : : : : : : : : : : : : : : : : : : 57
2.5.1 Experiments : : : : : : : : : : : : : : : : : : : : : : : : : : : : 57
2.5.2 Probability of Miss and Attack Success : : : : : : : : : : : : : 60
2.6 MPEG Video Authentication : : : : : : : : : : : : : : : : : : : : : : 63
2.6.1 Syntax of a MEPG Video Sequence : : : : : : : : : : : : : : : 66
2.7 Robust Digital Signature : : : : : : : : : : : : : : : : : : : : : : : : : 67
2.7.1 Robust Digital Signature: Type I : : : : : : : : : : : : : : : : 67
2.7.2 Robust Digital Signature: Type II : : : : : : : : : : : : : : : : 70
2.8 Authenticator : : : : : : : : : : : : : : : : : : : : : : : : : : : : : : : 71
2.8.1 Authenticating Video Sequence after Transcoding (Situations
1-3) : : : : : : : : : : : : : : : : : : : : : : : : : : : : : : : : 71
2.8.2 Authenticating Video Sequence after Editing (Situations 4
and 5) : : : : : : : : : : : : : : : : : : : : : : : : : : : : : : : 74
2.9 Experimental Results and Discussion : : : : : : : : : : : : : : : : : : 75
2.10 Conclusion : : : : : : : : : : : : : : : : : : : : : : : : : : : : : : : : : 77
ii

2.11 Proof of Theorems in Chapter 2 : : : : : : : : : : : : : : : : : : : : : 78
2.11.1 Proof of Theorem 1 and Theorem 2 : : : : : : : : : : : : : : : 78
2.11.2 Variable Quantization Tables : : : : : : : : : : : : : : : : : : 80
3 Using Semi-Fragile Watermarks to Generate Self-Authentication-
and-Recovery Images 82
3.1 Introduction : : : : : : : : : : : : : : : : : : : : : : : : : : : : : : : : 82
3.2 Two Invariant Properties in JPEG compression : : : : : : : : : : : : 87
3.3 System Description : : : : : : : : : : : : : : : : : : : : : : : : : : : : 91
3.3.1 Generating and Embedding Authentication Bits : : : : : : : : 91
3.3.2 Generating and Embedding Recovery Bits : : : : : : : : : : : 95
3.3.3 Authentication Process : : : : : : : : : : : : : : : : : : : : : : 96
3.4 Performance Evaluation of Authentication System : : : : : : : : : : : 97
3.4.1 Quality of Watermarked Image : : : : : : : : : : : : : : : : : 98
3.4.2 Probability of False Alarm : : : : : : : : : : : : : : : : : : : : 99
3.4.3 Probability of Miss and Probability of Successful Attack : : : 101
3.4.4 Security : : : : : : : : : : : : : : : : : : : : : : : : : : : : : : 102
3.5 Experimental Results : : : : : : : : : : : : : : : : : : : : : : : : : : : 106
3.5.1 Example : : : : : : : : : : : : : : : : : : : : : : : : : : : : : : 106
3.5.2 Benchmarking : : : : : : : : : : : : : : : : : : : : : : : : : : : 108
3.6 Conclusion and Future Direction : : : : : : : : : : : : : : : : : : : : 112
3.7 Proof of Theorem 4 in Chapter 3 : : : : : : : : : : : : : : : : : : : : 113
4 Geometric Distortion Resilient Public Watermarking and Its Ap-
plications in Image Print-and-Scan Processes 115
4.1 Introduction : : : : : : : : : : : : : : : : : : : : : : : : : : : : : : : : 115
4.2 Properties of the Proposed Watermarking Technique : : : : : : : : : 116
iii

4.3 Algorithm : : : : : : : : : : : : : : : : : : : : : : : : : : : : : : : : : 120
4.3.1 Watermark detection process : : : : : : : : : : : : : : : : : : 122
4.3.2 Watermark embedding process : : : : : : : : : : : : : : : : : : 123
4.4 Implementation problems and solutions : : : : : : : : : : : : : : : : : 127
4.4.1 Rectilinear tiling implied by DFT : : : : : : : : : : : : : : : : 127
4.4.2 Di�culty of inverting log-polar mapping : : : : : : : : : : : : 129
4.4.3 Orientation of image boundaries : : : : : : : : : : : : : : : : : 130
4.4.4 Dynamic range of frequency magnitudes : : : : : : : : : : : : 132
4.4.5 Unreliability of extreme frequencies : : : : : : : : : : : : : : : 133
4.4.6 Images are rotationally asymmetric : : : : : : : : : : : : : : : 133
4.4.7 High correlation between elements of extracted watermark : : 135
4.4.8 Interrelation between changes made in watermark elements : : 136
4.5 Experimental Results : : : : : : : : : : : : : : : : : : : : : : : : : : : 136
4.5.1 Probability of False Positive : : : : : : : : : : : : : : : : : : : 137
4.5.2 Fidelity : : : : : : : : : : : : : : : : : : : : : : : : : : : : : : 140
4.5.3 E�ectiveness : : : : : : : : : : : : : : : : : : : : : : : : : : : : 141
4.5.4 Robustness : : : : : : : : : : : : : : : : : : : : : : : : : : : : 142
4.5.5 JPEG compression : : : : : : : : : : : : : : : : : : : : : : : : 151
4.5.6 Summary of the Experimental Results : : : : : : : : : : : : : 152
4.6 Properties of the Print-and-Scan Process : : : : : : : : : : : : : : : : 152
4.7 Modeling of the Print-and-Scan Process : : : : : : : : : : : : : : : : : 153
4.7.1 Pixel Value Distortion : : : : : : : : : : : : : : : : : : : : : : 154
4.7.2 Geometric Distortion : : : : : : : : : : : : : : : : : : : : : : : 156
4.8 Extracting Invariants in the Print-and-Scan Process : : : : : : : : : : 170
4.9 Experiments : : : : : : : : : : : : : : : : : : : : : : : : : : : : : : : : 174
4.10 Conclusion : : : : : : : : : : : : : : : : : : : : : : : : : : : : : : : : : 181
iv
5 Theoretical Watermarking Capacity of Images 183
5.1 Introduction : : : : : : : : : : : : : : : : : : : : : : : : : : : : : : : : 183
5.1.1 Analysis of Watermarking Capacity Issues : : : : : : : : : : : 184
5.1.2 Prior Works Based on the Information Theory : : : : : : : : : 190
5.1.3 Focus of this Chapter : : : : : : : : : : : : : : : : : : : : : : : 192
5.2 Zero-Error Watermarking Capacity of Digital Image : : : : : : : : : : 193
5.2.1 Number of channels in an image : : : : : : : : : : : : : : : : : 194
5.2.2 Zero-Error Capacity of a Discrete Memoryless Channel and a
Digital Image : : : : : : : : : : : : : : : : : : : : : : : : : : : 195
5.2.3 Figures of Zero-Error Capacity Curve of Digital Images : : : : 201
5.3 Watermarking Capacity based on Domain-Speci�ed Masking E�ect : 202
5.3.1 Capacity of a Variant State Channel : : : : : : : : : : : : : : 202
5.3.2 Masking E�ect in Speci�c Domains : : : : : : : : : : : : : : : 204
5.3.3 Experiments of Watermarking Capacity Based on Domain-
Speci�ed Masking E�ects : : : : : : : : : : : : : : : : : : : : 207
5.4 Watermarking Capacity based on Human Vision System Model : : : 208
5.4.1 Human Vision Model : : : : : : : : : : : : : : : : : : : : : : : 208
5.4.2 Capacity Measurements and Future Directions : : : : : : : : : 212
5.5 Conclusion : : : : : : : : : : : : : : : : : : : : : : : : : : : : : : : : : 214
6 Conclusions and Future Work 216
References 221
v

List of Figures
1-1 (a) Complete Authentication: multimedia data have to be examined
in each transmission, and each intermediate stage must be trustwor-
thy; (b) Content Authentication: multimedia data are endorsed by
the producer and veri�ed only in the last stage. : : : : : : : : : : : : 6
1-2 A multi-level conceptual framework for indexing multimedia informa-
tion (A. Jaimes and S.-F. Chang [56]) : : : : : : : : : : : : : : : : : : 11
1-3 Watermarking: multimedia data as a communication channel : : : : : 13
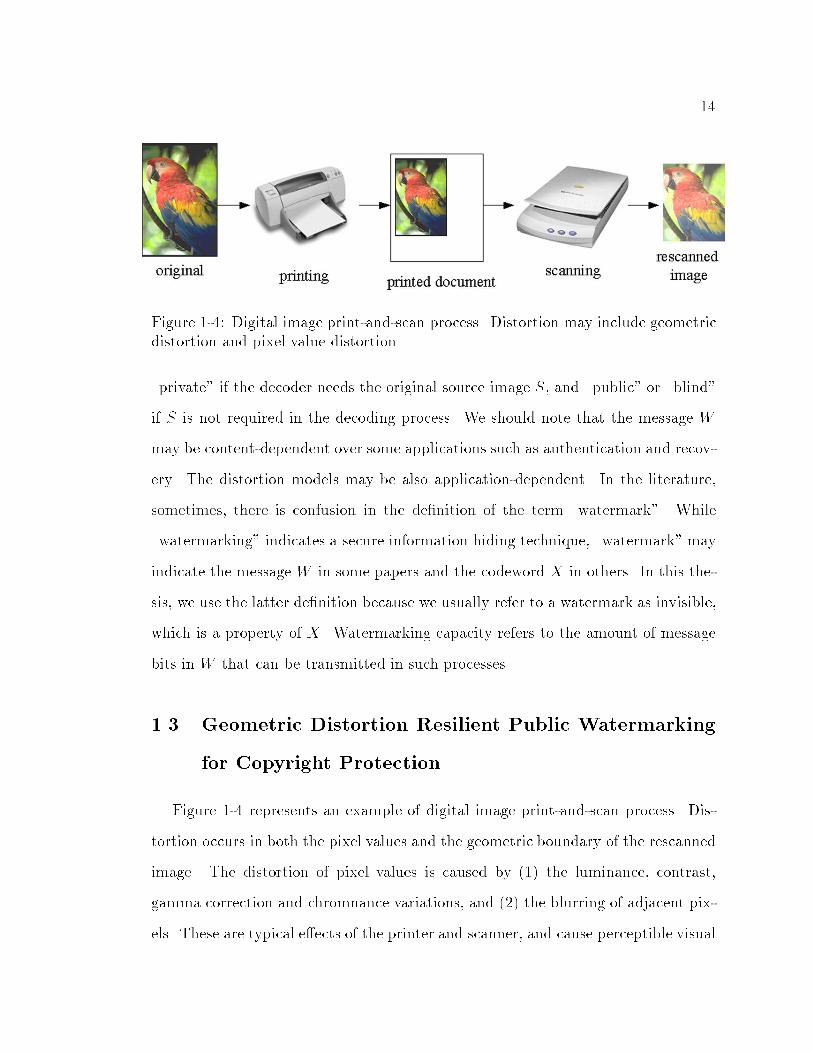
1-4 Digital image print-and-scan process. Distortion may include geo-
metric distortion and pixel value distortion. : : : : : : : : : : : : : : 14
1-5 Three parameters of watermarking: information quantity of embed-
ded message, invisibility, and robustness : : : : : : : : : : : : : : : : 18
2-1 Signature Generator & Authentication Process : : : : : : : : : : : : : 31
2-2 (a) Feature Extraction, (b) Authentication: Comparator : : : : : : : 34
2-3 Conceptual illustration of `miss', `false alarm' and other scenarios. : : 45
2-4 (a) The original image, (b) JPEG compressed image (compression
ratio 9:1), (c) middle of hat brim cloned, (d) authentication result of
(c), (e) mouth manipulated, (f) authentication result of (e). : : : : : 58
2-5 The Probability of Miss with di�erent images. : : : : : : : : : : : : : 60
2-6 The Probability of Miss with di�erent signature lengths. : : : : : : : 61
2-7 The Probability of Miss of images with di�erent JPEG quality factors 62
vi

2-8 The Probability of Success with di�erent manipulation values : : : : 62
2-9 Robust Digital Signature : Type I : : : : : : : : : : : : : : : : : : : : 67
2-10 Robust Digital Signature : Type 2 : : : : : : : : : : : : : : : : : : : : 70
2-11 The Probability of Miss of Digital Signature I : : : : : : : : : : : : : 76
2-12 The Probability of Miss of Digital Signature II : : : : : : : : : : : : : 77
3-1 Embedding authentication bits in the image based on the mapping
functions : : : : : : : : : : : : : : : : : : : : : : : : : : : : : : : : : : 92
3-2 An example of embedding recovery bits : : : : : : : : : : : : : : : : : 95
3-3 Expected value of PSNR of the watermarked image v.s. Accept-
able JPEG Quality Factor. The embedded bits are: (1) Authenti-
cation Only: 3 bits/block, (2) Authentication + Weak Recovery: 9
bits/block , and (3) Authentication + Recovery: 9 bits/block. : : : : 98
3-4 (a) The original image, (b) the watermarked image after embedding
authentication bits ( PSNR = 40.7 dB), (c) the watermarked image
after embedding authentication bits and weak recovery bits ( PSNR
= 37.0 dB). : : : : : : : : : : : : : : : : : : : : : : : : : : : : : : : : 106
3-5 (a) Manipulation on the watermarked image in Figure 3-2(b), (b)
the authentication result of (a), (c) the authentication and recovery
result from the manipulated image of Figure 3-2(c). : : : : : : : : : : 107
3-6 Image test set for SARI benchmarking : : : : : : : : : : : : : : : : : 108
3-7 Average PSNR for di�erent image types after watermarking : : : : : 109
4-1 An example of feature vector shaping: the extracted signal is itera-
tively shaped to the mixed signal, according to the watermark signal : 124
4-2 Proposed watermark embedding process : : : : : : : : : : : : : : : : 125
4-3 Rectilinear tiling and image rotation. : : : : : : : : : : : : : : : : : : 128
vii

4-4 An image and its Discrete Fourier Transform. : : : : : : : : : : : : : 131
4-5 DFT e�ects of rotation : : : : : : : : : : : : : : : : : : : : : : : : : : 131
4-6 DFT e�ects of rotation and cropping : : : : : : : : : : : : : : : : : : 132
4-7 Image with dominant vertical structure and its DFT. : : : : : : : : : 134
4-8 Image with dominant horizontal structure and its DFT. : : : : : : : : 134
4-9 Detection value distributions for 10 watermarks in 10,000 unwater-
marked images: (a) maximumdetection value for each watermark/image
pair and (b) all 90 detection values for each watermark/image pair. : 138
4-10 False positive rates measured with 10,000 unwatermarked images,
(a) individual correlation coe�cients and (b) �nal detection value.
Each solid trace corresponds to one of 10 di�erent watermark vectors.
Dashed line represents theoretical estimates. : : : : : : : : : : : : : : 139
4-11 Signal-to-noise ratio : : : : : : : : : : : : : : : : : : : : : : : : : : : : 140
4-12 Watermarking with little impact on �delity : : : : : : : : : : : : : : : 141
4-13 Character of the watermark noise when the strength is too high.The
watermark strength in this �gure was increased so that the problem
should be visible after printing in a journal. : : : : : : : : : : : : : : 142
4-14 Examples of geometric attacks: (e) and (a) are the original and
padded original respectively, (b)-(d) attacks without cropping, and
(f)-(i) attacks with cropping : : : : : : : : : : : : : : : : : : : : : : : 143
4-15 Rotation without cropping, 4�, 8�, 30�, and 45�, (a) histogram and
(b) ROC : : : : : : : : : : : : : : : : : : : : : : : : : : : : : : : : : : 145
4-16 Rotation with cropping, 4�, 8�, 30�, and 45�, (a) histogram and (b)
ROC : : : : : : : : : : : : : : : : : : : : : : : : : : : : : : : : : : : : 146
4-17 Scaling up without cropping, 5%, 10%, 15%, and 20%, (a) histogram
and (b) ROC : : : : : : : : : : : : : : : : : : : : : : : : : : : : : : : 147
viii
4-18 Scaling up with cropping, 5%, 10%, 15%, and 20%, (a) histogram
and (b) ROC : : : : : : : : : : : : : : : : : : : : : : : : : : : : : : : 148
4-19 Scaling down, 5%, 10%, 15%, and 20%, (a) histogram and (b) ROC : 148
4-20 Translation without cropping, 5%, 10%, and 15%, (a) histogram and
(b) ROC : : : : : : : : : : : : : : : : : : : : : : : : : : : : : : : : : : 150
4-21 Translation with cropping, 5%, 10%, and 15%, (a) histogram and (b)
ROC : : : : : : : : : : : : : : : : : : : : : : : : : : : : : : : : : : : : 150
4-22 JPEG compression, QF = 100, 90, 80, and 70, (a) histogram and (b)
ROC : : : : : : : : : : : : : : : : : : : : : : : : : : : : : : : : : : : : 151
4-23 Typical control windows of scanning processes. Users have the free-
dom to control scanning parameters, as well as can arbitrarily crop
the scanned image. [source: Microtek ScanWizard] : : : : : : : : : : 153
4-24 General geometric distortion of images: (a) original, (b) rotation and
cropping with background and the whole image, (c) rotation and
croppin with background and part of the image, (d) rotation and
cropping with part of the image, (e) scaling, (f) croppin without
background, (g) cropping with background, (h) scaling and cropping,
and (i) rotation, scaling, and cropping : : : : : : : : : : : : : : : : : 157
4-25 Four common methods to calculate DFT coe�cients. The length
and width of DFT window are: (a) the image size, (b) a �xed large
rectangle, (c) the smallest rectangle with radix-2 width and height,
or (d) the smallest square including the whole image. : : : : : : : : : 162
4-26 DFT coe�cients are obtained from the repeated image. : : : : : : : : 163
ix
4-27 The relationship of DFT coe�cients and Fourier coe�cients: (a)
the original continuous signal, (b) the discretized signal, (c) the up-
sampled signal (or enlarged signal in a 2-D image), and (d) the zero-
padded signal : : : : : : : : : : : : : : : : : : : : : : : : : : : : : : : 164
4-28 The spectrum of rotated-and-zero-padded image and rotated-cropped
image : : : : : : : : : : : : : : : : : : : : : : : : : : : : : : : : : : : 169
4-29 Log-polar map of DFT coe�cients. RSC introduces simple shift on
this map. : : : : : : : : : : : : : : : : : : : : : : : : : : : : : : : : : 171
4-30 Extract invariants from log-polar map of DCT coe�cients. : : : : : : 173
4-31 Pixel value distortion of rescanned image. (a) original image [384x256],
(b) rescanned image [402x266], (c) corresponding pixel mapping and
modeling, (d) noise in the spatial domain after gamma correction, (e)
noise in the frequency domain after gamma correction : : : : : : : : : 175
4-32 Robustness test of the extracted feature vector: (a) scaling, (b) JPEG,
(c) strict cropping, (d) general cropping, (e) rotation with general
cropping, and (f) rotation, strict cropping, scaling, and JPEG or
brigtness/contrast adjustment, and (g) RSC, pixel distortion and noise.178
5-1 Binary noise pattern with strength equal to Chou's JND bounds : : : 186
5-2 Sinusoidal pattern with strength smaller than or equal to Chou's JND
bounds : : : : : : : : : : : : : : : : : : : : : : : : : : : : : : : : : : : 186
5-3 Adjacency-reducing mapping of discrete values in the appearance of
quantization noise : : : : : : : : : : : : : : : : : : : : : : : : : : : : : 196
5-4 The Zero-Error Capacity of a 256� 256 gray-level image for channel
case 2 : : : : : : : : : : : : : : : : : : : : : : : : : : : : : : : : : : : 199
5-5 The Zero-Error Capacity of a 256� 256 gray-level image for channel
case 3 : : : : : : : : : : : : : : : : : : : : : : : : : : : : : : : : : : : 200
x

5-6 The estimated watermarking capacity based on four domain-speci�ed
masks : : : : : : : : : : : : : : : : : : : : : : : : : : : : : : : : : : : 207
xi
List of Tables
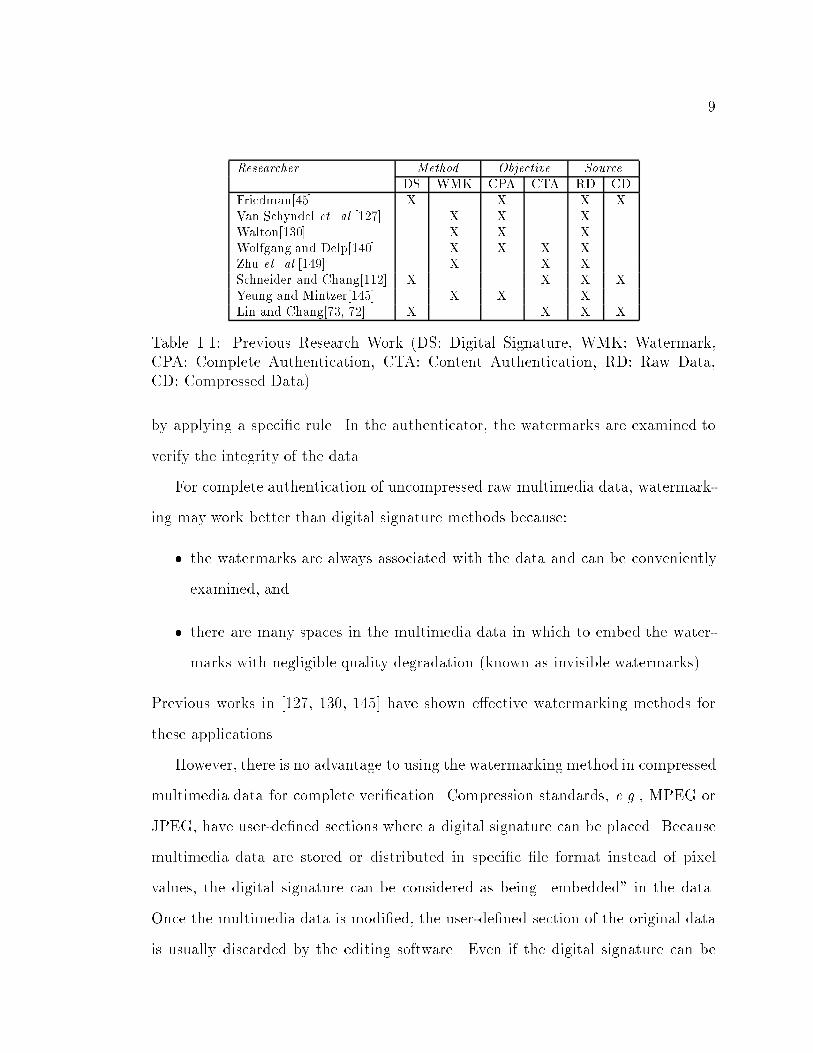
1.1 Previous Research Work (DS: Digital Signature, WMK: Watermark,
CPA: Complete Authentication, CTA: Content Authentication, RD:
Raw Data, CD: Compressed Data) : : : : : : : : : : : : : : : : : : : 9
2.1 Two DCT coe�cient blocks for a 16 � 8 area cut from the image
\Lenna" (right eye region). : : : : : : : : : : : : : : : : : : : : : : : : 43
2.2 DCT coe�cients in Table 1 quantized by a uniform matrix. : : : : : : 44
2.3 Properties of di�erent system variables from viewpoints of di�erent
parties : : : : : : : : : : : : : : : : : : : : : : : : : : : : : : : : : : : 46
2.4 Standard deviation of di�erent operations (results of experiments us-
ing Photoshop 3.0 to manipulate image in the pixel domain) : : : : : 51
2.5 Consistent Properties of Transcoding and Editing Processing Situations 63
3.1 The quantization tables, Q50, of JPEG compression with Quality
Factor(QF) = 50 : (a) luminance,(b) chromnance. The quantization
tables,QQF of other Quality Factor are Integer Round(Q50�q), whereq = 2 � 0:02 � QF , if QF � 50, and q = 50
QF, if QF < 50. In the
baseline JPEG, QQF will be truncated to be within 1 to 255. : : : : : 87
3.2 Viewers' in the SARI subjective visual quality test : : : : : : : : : : : 109
xii

3.3 SARI embedded bits and max invisible (MI) embedding strength re-
ferring to Subjective test. (A+R: embedding authentication and re-
covery bits, Auth: embedding authentication bits) : : : : : : : : : : 110
3.4 SARI performance test under JPEG compression Quality Factor (in
Photoshop 5.0) and Crop-Replacement (C&R) Manipulations (MED:
watermarks are embedded under maximuminvisible embedding strength)111
4.1 Change of Fourier coe�cients after operations in the continuous spa-
tial domain. : : : : : : : : : : : : : : : : : : : : : : : : : : : : : : : : 159
4.2 Change of DFT coe�cients after operations in the discrete spatial
domain. : : : : : : : : : : : : : : : : : : : : : : : : : : : : : : : : : : 167
5.1 The quantization factors for four-level biorthogonal 9/7 DWT coe�-
cients suggested by Watson et. al. : : : : : : : : : : : : : : : : : : : : 206
5.2 A comparison of two HVS models developed by Lubin and Daly : : : 209
xiii

Acknowledgements
I would like to acknowledge the help and support of everyone in the ADVENT
Lab who made my life more pleasant and my work more fun during my doctoral
tenure at Columbia University. The tireless support and the invaluable intellectual
inspiration provided by Prof. Shih-Fu Chang, my thesis advisor, cannot be empha-
sized enough. I particularly appreciate his willingness to share his seemingly endless
supply of knowledge and his endeavor to improve every single word in our papers.
He is my mentor in various aspects, from my research and career, to my daily life.
I cannot express more my appreciation of all the things he has done for me.
I would also like to thank Prof. Dimitris Anastassiou for helping me and guiding
me during the initial stages of my Ph.D. study at Columbia and for chairing my
thesis defense committee. I particularly thank Prof. Alexandros Eleftheriadis and
Prof. John Pavlik for guiding me in both my oral qualify committee and thesis
defense committee. With their insights and suggestions, they made this research
become more interesting and more fun. I also would like to thank all the other
committee members for their time, e�orts, signatures that entitle me to call myself
a doctor! Special thanks are extended to Dr. Ingemar Cox, my advisor during my
summer stay at NEC Research Institute. I have personally bene�ted immensely
from his wide expertise.
I also take pleasure in thanking Dr. Je�rey Bloom, Dr. Matt Miller and Yui
Man Lui, for their support and brainstorming on our project in NEC. I am also
grateful for the invaluable discussion with my friends, Dr. Heather Yu at Panasonic
and Dr. Jana Dittmann at GMD. I would like to thank Prof. Nasir Memon at
Polytech Univ. for his encouragement which made realization of our SARI system.
Also, I personally appreciate my master thesis advisor, Prof. Soo-Chang Pei, for his
willingness to support and guide me even after my departure.
xiv

During the development of this thesis I also had the bene�t of interacting with
a number of colleagues and friends. Special thanks go to my o�cemates Huitao
Luo and Mei Shi with whom we shared intellectual ideas and enjoyed numerous
pleasant moments. I would like to thank Lexing Xie and Dr. Qibin Sun for their
help in benchmarking our authentication system that made my graduation faster.
I specially thank Sara Brook for proofreading most of our papers. And I also thank
to Nicole Luke and Hari Sundaram for their valuable comments on my thesis and
presentations. In particular, I thank Daby Sow, with whom I had invaluable dis-
cussions during our drive to IBM. In my tenure here at Columbia, I would specially
thank Wei Shi, Mei Shi, and their family for their warm hearts in providing me with
much-needed relief and family-like life in New York. Also, I would like to thank
Kuang-Yu Chin for her support for years.
Last but not least, there is no way I could acknowledge enough the support from
my family. I especially thank my parents for everything. They are and will always
be the driving force that helps me pursuing this long term dream and all the future
ones. My sisters' support also helped me tremendously. Thank you very much.
Thank you all!!
xv

To my parents

1
Chapter 1
Introduction
This thesis addresses two closely related problems { multimedia authentica-
tion and copyright protection. We also examine the important issue regarding the
maximum amount of watermark information without causing noticeable perceptual
degradation.
The well-known adage that \seeing is believing" is no longer true due to the
pervasive and powerful multimedia manipulation tools. Such development has de-
creased the credibility that multimedia data such as photos, video or audio clips,
printed documents, etc. used to command. To ensure trustworthiness, multime-
dia authentication techniques are being developed to protect multimedia data by
verifying the information integrity, the alleged source of data, and the reality of
data. This distinguishes from other generic message authentication in its unique re-
quirements of integrity. Multimedia data are generally compressed using standards
such as JPEG, MPEG or H.26+. In many applications, compressed multimedia
data may be accepted as authentic. Therefore, we consider that robustness to lossy
compression is an essential requirement for multimedia authentication techniques.
Multimedia authentication techniques are usually designed based on two
kinds of tools: digital signature or watermarking. Digital signature is a non-repudiatible,
encrypted version of the message digest extracted from the data. It is usually stored
2
as a separate �le, which can be attached to the data to prove integrity and originality.
Watermarking techniques consider multimedia data as a communication channel.
The embedded watermark, usually imperceptible, may contain either a speci�c pro-
ducer ID or some content-related codes that are used for authentication. Given the
objective for multimedia authentication to reject the crop-and-replacement process
and accept content-preserving or imperceptible manipulations, traditional digital
signature or watermarking method cannot be directly applied to authentication.
Traditional digital signature does not allow even a single bit change in the data.
On the other hand, traditional watermarking techniques are designed for surviving
all kinds of manipulations that may miss a lot of content-altering manipulations.
Therefore, there is a need for designing novel robust digital signature or semi-fragile
watermarks for multimedia authentication.
Watermarking has been considered to be a promising solution that can pro-
tect the copyright of multimedia data through transcoding, because the embedded
message is always included in the data. However, today, there is no evidence that
watermarking techniques can achieve the ultimate goal to retrieve the right owner
information from the received data after all kinds of content-preserving manipu-
lations. Because of the �delity constraint, watermarks can only be embedded in
a limited space in the multimedia data. There is always a biased advantage for
the attacker whose target is only to get rid of the watermarks by exploiting vari-
ous manipulations in the �nite watermarking embedding space. A more reasonable
expectation of applying watermarking techniques for copyright protection may be
to consider speci�c application scenarios. For instance, the print-and-scan (PS)
process is commonly used for image reproduction and distribution. It is popular
to transform images between the electronic digital format and the printed format.
The rescanned image may look similar to the original, but may have been distorted
3
during the process. For copyright protection applications, users should be able to
detect the embedded watermark even if it is printed-and-scanned. Since the distor-
tion behavior involved in this case (geometric distortion and pixel value distortion) is
reasonably predictable, we can design useful watermarking techniques which survive
such processes.
In addition, we study the theoretic issue with regard to watermarking embedding
space existing in multimedia data. This space should depend on the properties of
human audio-visual system. It is a complex scienti�c question that we may not be
able to �nd a thorough answer in this thesis. Our objective is to study existing
human vision system models, achieve better understanding of various watermarking
space, and then develop information-theoretic estimation of information capacity via
watermark. Better understanding of capacity and embedding space will contribute
to future development of watermarking techniques.
This chapter is organized as follows. First, we will discuss the meaning, classi-
�cation, and requirements of multimedia authentication, as well as priori works in
this �eld. Then, we will introduce issues related to geometric distortion resilient
public watermarking. After that, we will discuss theoretical watermarking capacity
issues. Finally, we will present the structure of this thesis.
1.1 Multimedia Authentication
Authenticity, by de�nition, means something \as being in accordance with fact,
as being true in substance", or \as being what it professes in origin or authorship,
as being genuine [101]." A third de�nition of authenticity is to prove that some-
thing is \actually coming from the alleged source or origin [136]." For instance,
in the courtroom, insurance company, hospital, newspaper, magazine, or television
news, when we watch/hear a clip of multimedia data, we hope to know whether

4
the image/video/audio is authentic. For electronic commerce, once a buyer pur-
chases multimedia data from the Internet, she needs to know whether it comes from
the alleged producer and she must be assured that no one has tampered with the
content. The credibility of multimedia data is expected for the purpose of being
electronic evidence or a certi�ed product. In practice, di�erent requirements a�ect
the methodologies and designs of possible solutions [10].
In contrast with traditional sources whose authenticity can be established from
many physical clues, multimedia data in electronic forms (digital or analog) can only
be authenticated by non-physical clues. One approach, called blind authentication,
is to examine the characteristics of content for inferencing authorship and the con-
tinuity of content for detecting forgery. This method is widely used in traditional
authentication techniques, but it is still under development for multimedia appli-
cation. Another practical solution is the digital signature method introduced by
Di�e and Hellman in 1976 [36]. The digital signature shall depend on the content
and some secret information only known to the signer [139]. Therefore, the digital
signature cannot be forged, and the authenticator can verify multimedia data by
examining whether its content matches the information contained in the digital sig-
nature. In other words, we trust the signer as well as her digital signature to verify
the data integrity.
Machines can be given the role of signer. This approach has been used byt
Friedman in his work on the \trustworthy" camera in 1993 [45]. By embedding
an encryption chip in the camera, the camera endorses its captured pictures and
generates content-dependent digital signatures.
We should note that no matter how the authentication algorithm is designed,
trustworthiness of the signer will be always of concern. In the traditional research of
message authentication, the signer is usually the one who generates and distributes

5
the message. However, multimedia data are usually distributed and re-interpreted
by many interim entities (e.g., editors, agents). Because of this, it becomes im-
portant to guarantee end-to-end trustworthiness between the origin source and the
�nal recipient. That can be achieved by the robust digital signature method that
we have proposed [112, 73, 75].
Although the word \authentication" has three broad meanings: the integrity
of data, the alleged source of data, and the reality of data, we primarily refer to
the �rst in this thesis. We use the word \copyright protection" to indicate the
second meaning: alleged source. The third meaning, the reality of data, may be
addressed by using a mechanism linking the information of alleged source to real-
world capturing apparatus such as a digital camera.
1.1.1 Multimedia Authentication Objectives: Complete Authentication
v.s. Content Authentication
Based on the objectives of authentication, multimedia authentication techniques
can be classi�ed into two categories: complete authentication and content authenti-
cation. Complete authentication refers to techniques that consider the whole piece of
multimedia data and do not allow any manipulations or transformation [143, 145].
Early works of multimedia authentication were mostly in this category. Because
the non-manipulable data are like messages, many existing message authentication
techniques can be directly applied. For instance, digital signatures can be placed in
the LSB of uncompressed data, or the header of compressed data. Then, manipu-
lations will be detected because the hash values of the altered message bits will not
match the information in the digital signature. In practice, fragile watermarks or
traditional digital signatures may be used for complete authentication.
Content Authentication refers to a di�erent objective that is unique for multime-
6
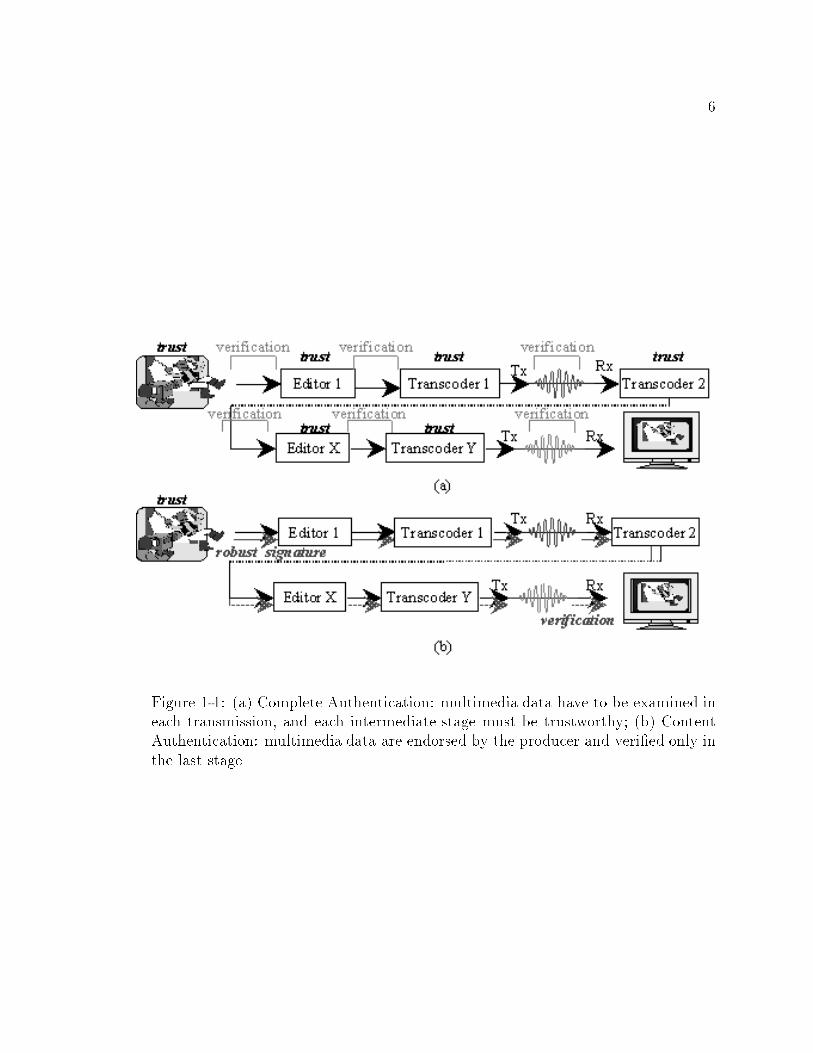
Figure 1-1: (a) Complete Authentication: multimedia data have to be examined ineach transmission, and each intermediate stage must be trustworthy; (b) ContentAuthentication: multimedia data are endorsed by the producer and veri�ed only inthe last stage.

7
dia data. The meaning of multimedia data is based on their content instead of the
bitstreams. In some applications, manipulations on the bitstreams without changing
the meaning of content are considered as acceptable. Compression is an example.
Today, most digital multimedia data are stored or distributed in compressed forms.
To satisfy various needs of broadcasting, storage and transmission, transcoding of
compressed digital videos may also be required. For instance, digital video clips are
usually shot and stored in the compressed format with a pre-determined bitrate, but
distributed with a di�erent bitrate in transmission. Transcoding processes change
the pixel values of the digital video but not its content. Therefore, videos that are
obtained by transcoding the original one should be considered as authentic.
Figure 1-1 shows the bene�t of the Multimedia Content Authentication (MCA).
It represents the complete process of multimedia data, from being produced to being
consumed. With complete veri�cation, we have to verify the data at every trans-
mission stage and trust all the interim entities. However, with content veri�cation,
we can transmit the robust signature with the data and only verify it at the last
stage. Therefore, we do not need to verify the data at each stage and question the
trustworthiness of the intermediate people. This enhances the authenticity of the
data. As in Figure 1-1, if the producer is a trustworthy camera, it can somehow
provide credibility of reality to the data, i.e., proving that the multimedia data
are \real." This is especially useful for those multimedia data that are needed as
electronic evidence.
A broad meaning of content authentication is to authenticate multimedia content
on a semantic level even though manipulations may be perceptible. Such manip-
ulations may include �ltering, color manipulation, geometric distortion, etc. We
distinguish these manipulations from lossy compression because these perceptible
changes may be considered as acceptable to some observers but may be unaccept-

8
able to others. A content authentication technique may choose only to authenticate
the altered multimedia data if manipulation is imperceptible. One example is the
authentication techniques that accept lossy compression up to an allowable level of
quality loss and reject other manipulations. We designed our system to \perfectly"
accept lossy compression and \statistically" accept other manipulations.
1.1.2 Multimedia Authentication Sources: Raw Data v.s. Compressed
Data
Multimedia compression standards have been designed and widely adopted by
various applications: JPEG in the WWW, MPEG-1 in VCD, MPEG-2 format in
DVD, and H.261 and H.263 in video conferencing. The source of a multimedia au-
thentication system may be raw data or compressed data. In practical applications,
the raw format of multimedia data may not be available. For instance, a scanner
generates temporary raw images but only saves them in their compressed format; a
digital camera which captures image/video produces compressed �les only, without
generating any raw data. Therefore, an authentication system which can only au-
thenticate raw data may have limited uses in practice. However, exceptions exist in
(1) non-standard data such as 3D objects, and (2) medical images which usually do
not tolerate lossy compression.
1.1.3 Multimedia Authentication Methods: Watermarking v.s. Digital
Signature
Since the meaning of multimedia data is based on its content, we can modify the
multimedia bitstream to embed some codes, i.e., watermarks, without changing the
meaning of the content. The embedded watermark may represent either a speci�c
digital producer identi�cation label (PIL) or some content-based codes generated
9
Researcher Method Objective Source
DS WMK CPA CTA RD CDFriedman[45] X X X XVan Schyndel et. al.[127] X X XWalton[130] X X XWolfgang and Delp[140] X X X XZhu et. al.[149] X X XSchneider and Chang[112] X X X XYeung and Mintzer[145] X X XLin and Chang[73, 72] X X X X
Table 1.1: Previous Research Work (DS: Digital Signature, WMK: Watermark,CPA: Complete Authentication, CTA: Content Authentication, RD: Raw Data,CD: Compressed Data)
by applying a speci�c rule. In the authenticator, the watermarks are examined to
verify the integrity of the data.
For complete authentication of uncompressed raw multimedia data, watermark-
ing may work better than digital signature methods because:
� the watermarks are always associated with the data and can be conveniently
examined, and
� there are many spaces in the multimedia data in which to embed the water-
marks with negligible quality degradation (known as invisible watermarks).
Previous works in [127, 130, 145] have shown e�ective watermarking methods for
these applications.
However, there is no advantage to using the watermarking method in compressed
multimedia data for complete veri�cation. Compression standards, e.g., MPEG or
JPEG, have user-de�ned sections where a digital signature can be placed. Because
multimedia data are stored or distributed in speci�c �le format instead of pixel
values, the digital signature can be considered as being \embedded" in the data.
Once the multimedia data is modi�ed, the user-de�ned section of the original data
is usually discarded by the editing software. Even if the digital signature can be

10
preserved by the software, we can easily detect the modi�cation, since the hash
values of the modi�ed data will not be the same as the original. Moreover, com-
pressed multimedia data o�er less space for hiding watermarks. Visual quality of
the data may be compromised in order to ensure that enough watermarking bits for
adequately protecting the data.
For content authentication, compression should be distinguished from other ma-
nipulations. Previous watermarks are either too fragile for compression or too exi-
ble to detect malicious manipulations. The performance of an authenticator should
be simultaneously evaluated by two parameters: the probability of false alarm and
the probability of missing manipulations. Fragile watermarks, which have low prob-
ability of miss, usually fail to survive compressions such that their probability of
false alarm is very high. Previous researchers have attempted to modify the frag-
ile watermark to make it more robust with compression [149, 140]. However, such
modi�cations failed to distinguish compression and tampering. When they lower the
probability of false alarm, the probability of miss in their systems increases signif-
icantly. On the other hand, robust watermarks are robust to most manipulations,
but are usually too robust to detect malicious manipulations. Their probability
of miss is usually too high. These drawbacks motivated our design of novel semi-
fragile watermarks we proposed in [84], which will be shown in Chapter 3. Our
proposed Self-Authentication-and-Recovery Images (SARI) system can distinguish
quantization-based lossy compressions from malicious manipulations.
Digital signatures can be stored in two di�erent ways. If the header of the com-
pressed source data remains intact through all processing stages, then the digital
signature can be saved in the header. Otherwise, it can be stored as an independent
�le. Anyone who needs to authenticate the received multimedia data has to request
the source to provide the signature. This may be inconvenient in some cases and
11
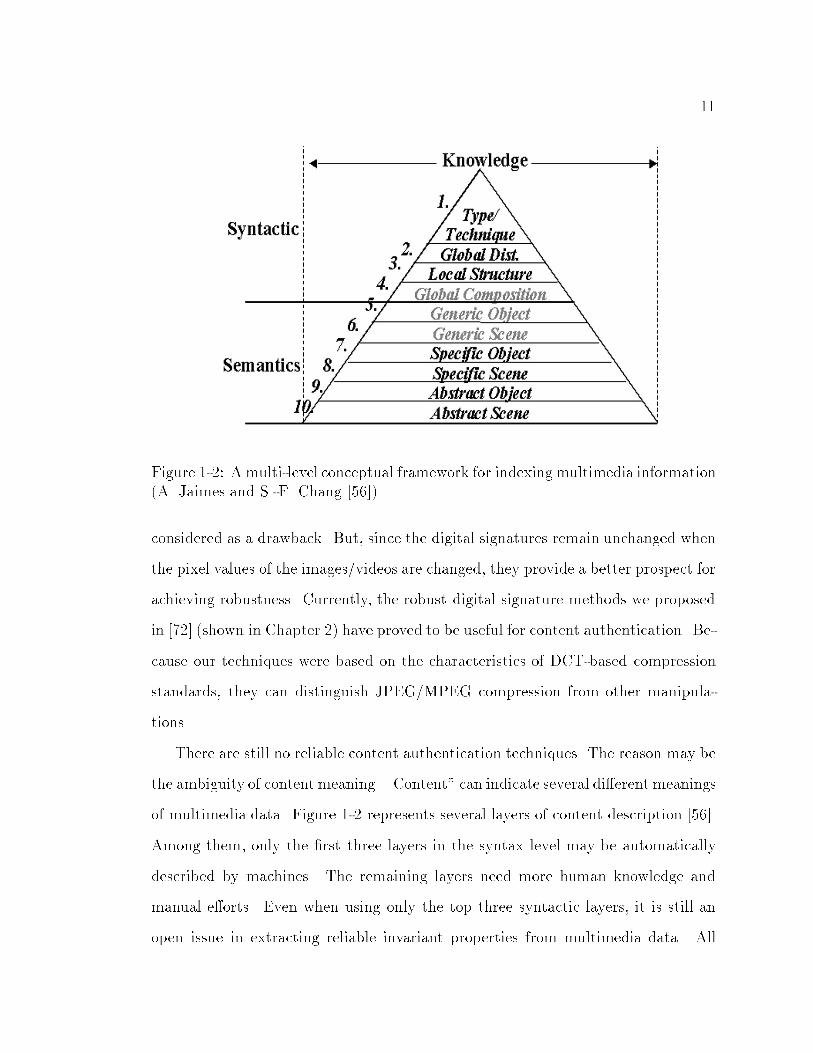
Figure 1-2: A multi-level conceptual framework for indexing multimedia information(A. Jaimes and S.-F. Chang [56])
considered as a drawback. But, since the digital signatures remain unchanged when
the pixel values of the images/videos are changed, they provide a better prospect for
achieving robustness. Currently, the robust digital signature methods we proposed
in [72] (shown in Chapter 2) have proved to be useful for content authentication. Be-
cause our techniques were based on the characteristics of DCT-based compression
standards, they can distinguish JPEG/MPEG compression from other manipula-
tions.
There are still no reliable content authentication techniques. The reason may be
the ambiguity of content meaning. \Content" can indicate several di�erent meanings
of multimedia data. Figure 1-2 represents several layers of content description [56].
Among them, only the �rst three layers in the syntax level may be automatically
described by machines. The remaining layers need more human knowledge and
manual e�orts. Even when using only the top three syntactic layers, it is still an
open issue in extracting reliable invariant properties from multimedia data. All

12
of these demonstrate the di�culty in �nding a content authentication technique.
Therefore, it is not our goal in this thesis in developing such techniques.
In Table 1.1, we compare di�erent previous authentication techniques based on
the type of methods used, the objective, and the source data being authenticated.
1.1.4 Requirements of Multimedia Authentication System
An authentication system should be evaluated based on the following requirements:
� Sensitivity: The authenticator is sensitive to malicious manipulations such as
crop-and-replacement.
� Robustness: The authenticator is robust to acceptable manipulations such as
lossy compression, or other content-preserving manipulations.
� Security: The embedded information bits cannot be forged or manipulated.
For instance, if the embedded watermarks are independent of the content,
then an attacker can copy watermarks from one multimedia data to another.
� Portability: Authentication had better be conducted directly from the received
content. Watermarks have better portability than digital signatures.
� Location of manipulated area: The authenticator should be able to detect
location of altered areas, and verify other areas as authentic.
� Recovery capability: The authenticator may need the ability to recover the
lost content in the manipulated areas (at least approximately).
These are the essential requirements of an \ideal" authenticator. Our proposed
semi-fragile watermarking system, i.e. SARI, in Chapter 3, has achieved most of
these six requirements. The only exception is that the system can totally accept
13
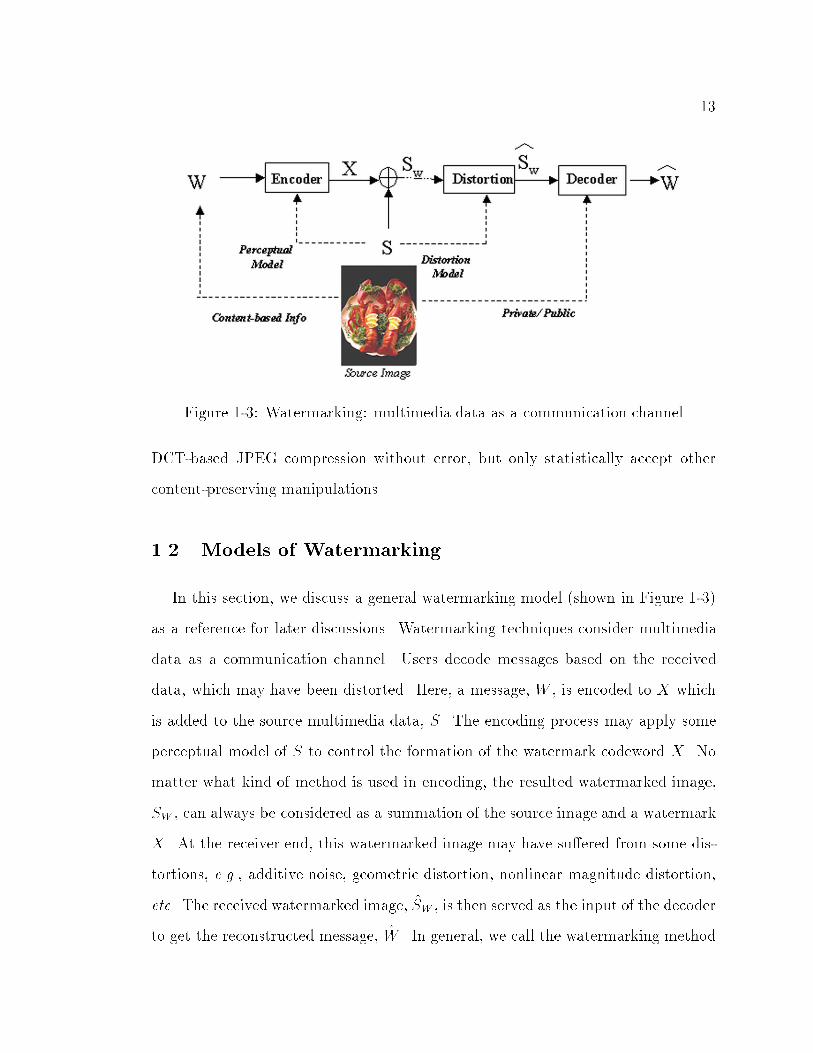
Figure 1-3: Watermarking: multimedia data as a communication channel
DCT-based JPEG compression without error, but only statistically accept other
content-preserving manipulations.
1.2 Models of Watermarking
In this section, we discuss a general watermarking model (shown in Figure 1-3)
as a reference for later discussions. Watermarking techniques consider multimedia
data as a communication channel. Users decode messages based on the received
data, which may have been distorted. Here, a message, W , is encoded to X which
is added to the source multimedia data, S. The encoding process may apply some
perceptual model of S to control the formation of the watermark codeword X. No
matter what kind of method is used in encoding, the resulted watermarked image,
SW , can always be considered as a summation of the source image and a watermark
X. At the receiver end, this watermarked image may have su�ered from some dis-
tortions, e.g., additive noise, geometric distortion, nonlinear magnitude distortion,
etc. The received watermarked image, SW , is then served as the input of the decoder
to get the reconstructed message, W . In general, we call the watermarking method
14
Figure 1-4: Digital image print-and-scan process. Distortion may include geometricdistortion and pixel value distortion.
\private" if the decoder needs the original source image S, and \public" or \blind"
if S is not required in the decoding process. We should note that the message W
may be content-dependent over some applications such as authentication and recov-
ery. The distortion models may be also application-dependent. In the literature,
sometimes, there is confusion in the de�nition of the term \watermark". While
\watermarking" indicates a secure information hiding technique, \watermark" may
indicate the message W in some papers and the codeword X in others. In this the-
sis, we use the latter de�nition because we usually refer to a watermark as invisible,
which is a property of X. Watermarking capacity refers to the amount of message
bits in W that can be transmitted in such processes.
1.3 Geometric Distortion Resilient Public Watermarking
for Copyright Protection
Figure 1-4 represents an example of digital image print-and-scan process. Dis-
tortion occurs in both the pixel values and the geometric boundary of the rescanned
image. The distortion of pixel values is caused by (1) the luminance, contrast,
gamma correction and chromnance variations, and (2) the blurring of adjacent pix-
els. These are typical e�ects of the printer and scanner, and cause perceptible visual

15
quality changes to a rescanned image.
To design a watermarking scheme that can survive geometric distortion as well as
pixel value distortion is important. There has been much emphasis on the robustness
of watermarks to pixel value distortions such as compression and signal �ltering.
However, recently it has become clear that even very small geometric distortions
may break the watermarking method [105, 126]. This problem is most severe when
the original unwatermarked image is unavailable to the detector. Conversely, if the
original image is available to the detector, then the watermarked image can often be
registered to the original and the geometric distortion thereby inverted.1 However,
public watermarking requires that detection of the watermark be performed without
access to the original unwatermarked image. As such, it is not possible to invert the
geometric distortion based on registration of the watermarked and original images.
Before proceeding further, it is important to de�ne what we mean by geometric
distortions (e.g., rotation, scale and translation). Speci�cally, we are interested
in the situation in which a watermarked image undergoes an unknown rotation,
scale and/or translation prior to the detection of the watermark. The detector
should detect the watermark if it is present. This de�nition is somewhat obvious,
so it may be more useful to describe what we are not interested in. In particular,
some watermark algorithms claim robustness to scale changes by �rst embedding a
watermark at a canonical scale, then changing the size of the image and �nally, at
the detector, scaling the image back to the canonical size prior to correlation. In
our opinion, the detector does not see a scale change. Rather, the process is more
closely approximated by a low pass �ltering operation that occurs when the image
is reduced in size. Similarly, tests that rotate an image by some number of degrees
1Although the original Cox et al [23] algorithm did not include this step, subsequent commercialimplementations did so. More recently, Johnson et al [59] observed that it is not necessary to retainthe entire image, a su�ciently small set of key points will su�ce.
16
and subsequently rotate the image by the same amount in the opposite direction
are not adequate tests of robustness to rotation. The same is true for translation.
The common situation we are concerned with occurs when a watermarked image
is printed and then cropped or padded and scanned back into the digital domain. In
these circumstances, the image dimensions have changed both because of cropping
and possibly scaling. There is also likely to be an associated translational shift. In
this example, scaling to a canonical size does not undo the scaling. Rather, if the
cropping is not symmetric in both the rows and columns, then scaling to a canonical
size will result in a change in the image's aspect ratio. We have discussed this and
proposed a solution in [80], which will not be addressed in this thesis. We discussed
applying the proposed watermarking method of the print and scan process in [81],
which will be shown in Chapter 4.
One strategy for detecting watermarks after geometric distortion is to try to
identify what the distortions were and invert them before applying the watermark
detector. This can be accomplished by embedding a registration pattern along with
the watermark [103, 30].
One problem with this solution is that it requires the insertion and detection of
two watermarks, one for registration and one to carry the data payload. This ap-
proach is more likely to reduce the image �delity. A second problem arises because
all images watermarked with this method will share a common registration water-
mark. This fact may improve collusion attempts to discern the registration pattern
and, once found, the registration pattern could be removed from all watermarked
images thus restricting the invertibility of any geometric distortions.
Another way to implement the above strategy is to give the watermark a rec-
ognizable structure. For example, as suggested in [68], the watermark might be
embedded multiple times in the image at di�erent spatial locations. The autocorre-

17
lation function of a watermarked image yields a pattern of peaks corresponding to
the embedded locations. Changes in this pattern of peaks can be used to describe
any a�ne distortions to which the watermarked image has been subject. This
method has signi�cant potential, but, similar to the above methods, has two failure
modes. For successful detection both the identi�cation of the geometric distortion
and the detection of the watermark after inversion of that distortion must be suc-
cessful. Both of these processes must be robust and resistant to tampering. Second,
spurious autocorrelation peaks may occur as a result of JPEG/MPEG compression
artifacts introduced after embedding but prior to detection. Further experiments
are needed to validate this approach.
It becomes clear that a public watermarking scheme that can survive geometric
distortion as well as pixel value distortion by the watermark itself is an advantage
in real applications. We will propose such a novel technique in Chapter 4.
1.4 Theoretical Watermarking Capacity Issues
Regardless of security issues, watermarking capacity is determined by invisibility
and robustness requirements. A conceptual description is shown in Figure 1-5.
There are three dimensions in this �gure. If one parameter is determined, the other
two parameters are inverse-proportional. For instance, a speci�c application may
determine how many message bits are needed, copyright protection may need to
embed about 10 bytes and authentication may need anywhere from 100-1000 bytes
for a 256� 256 image. After the embedded amount is decided, there always exists a
trade-o� between visual quality and robustness. Robustness refers to the extraction
of embedded bits with an error probability equal to or approaching zero. Visual
quality represents the quality of watermarked image. In general, if we want to make
our message bits more robust against attacks, then a longer codeword or larger

18
Figure 1-5: Three parameters of watermarking: information quantity of embeddedmessage, invisibility, and robustness
codeword amplitudes will be necessary to provide better error-resistence. However,
visual quality degradation can be expected. Another scenario may be that with a
default visual quality, there exists a trade-o� between the information quantity of
embedded message and robustness. For instance, the fewer the message bits are
embedded, the more redundant the codeword can be. Therefore, the codeword has
better error correction capability against noises. What we show in Figure 1-5 is only
a concept. It is our objective to theoretically draw the curves.
Theoretical capacity issues of digital watermarking have not been fully under-
stood. Most of the previous works on watermarking capacity [6, 109, 114] directly
apply information-theoretic channel capacity bounds without considering the prop-
erties of multimedia data. Shannon's well-known channel capacity bound,
C =1
2log2(1 +
P
N); (1.1)
is a theoretic capacity bound of an analog-value time-discrete communication chan-

19
nel in a static transmission environment, i.e., where the (codeword) signal power
constraint, P , and the noise power constraint, N , are constants [116]. Transmitting
message rate at this bound, the probability of decoding error can approach zero if
the length of codeword approaches in�nite, which implies that in�nite transmission
samples are expected.
Considering multimedia data, we found there are di�culties if we directly apply
Eq. (1.1). The �rst is the number of channels. If the whole image is a channel, then
this is not a static transmission environment because the signal power constraints
are not uniform throughout the pixels, based on the human vision properties. If
the image is a composition of parallel channels, then this capacity is meaningless
because there is only one or few sample(s) in each channel. The second di�culty
is the issue of digitized values in the multimedia data. Contrary to oating point
values which have in�nite states, integer value has only �nite states. This makes
a di�erence in both the applicable embedding watermark values and the e�ect of
noises. The third obstacle is that we will not know how large the watermark signals
can be without an extensive study of human vision system models, which is usually
ignored in most previous watermarking researches, perhaps because of its di�culties
and complexity. The fourth hurdle is that of noise modeling. Despite the existence
of various distortion/attack, we think that additive noises might be the easiest
modeling case. Other distortions may be modeled as additive noises if the distorted
image can be synchronized/registered. There are other issues such as private or
public watermarking and questions as to whether noise magnitudes are bounded.
For instance, Eq. (1.1) is a capacity bound derived for Gaussian noises and is
an upper bound for all kinds of additive noises. However, in an environment with
�nite states and bounded-magnitude noises, transmission error can actually be zero,
instead of approaching zero as in Eq. (1.1). This motivated a research of zero-error

20
capacity initialed by Shannon in 1956 [117]. Quantization, if an upper bound on
the quantization step exists, is an example of such a noise. We can �nd the zero-
error capacity of a digital image if quantization is the only source of distortion
such as in JPEG. These di�culties motivated our work in Chapter 5. Avoiding
to directly apply Shannon's channel capacity theory, we try to �nd the theoretical
watermarking capacity based on the properties of digital images discussed above.
1.5 Structure of Thesis
In Chapter 2, we present an e�ective technique for image authentication which
can prevent malicious manipulations but allow JPEG lossy compression. The au-
thentication signature is based on the invariance of the relationships between DCT
coe�cients at the same position in separate blocks of an image. These relationships
are preserved when DCT coe�cients are quantized in JPEG compression. Our pro-
posed method can distinguish malicious manipulations from JPEG lossy compres-
sion regardless of the compression ratio or the number of compression iterations.
We describe adaptive methods with probabilistic guarantee to handle distortions
introduced by various acceptable manipulations such as integer rounding, image
�ltering, image enhancement, or scaling-rescaling. We also present theoretical and
experimental results to demonstrate the e�ectiveness of the technique. The invari-
ant properties proposed in this chapter can achieve negligible probability of false
alarm as well as a very low probability of miss, and may be the best solution in
extracting invariants which survive lossy compression.
In addition, we will describe extension of such techniques to authenticate MPEG
compressed video. We �rst discuss issues of authenticating MPEG videos under var-
ious transcoding situations, including dynamic rate shaping, requantization, frame
type conversion, and re-encoding. In the second part of this chapter, we propose
21
a robust video authentication system which accepts some MPEG transcoding pro-
cesses but is able to detect malicious manipulations. It is based on unique invariant
properties of the transcoding processes. Digital signature techniques as well as pub-
lic key methods are used in our robust video authentication system.
In Chapter 3, we propose a Self-Authentication-and-Recovery Images (SARI)
system which utilizes our novel semi-fragile watermarking technique for authenti-
cation. This technique can accept JPEG lossy compression on the watermarked
image to a pre-determined quality factor, and rejects malicious attacks. The au-
thenticator can identify the positions of corrupted blocks, and recover them with an
approximation of the original ones. SARI has achieved the six multimedia authenti-
cation system requirements illustrated in Section 1.1.4. The security of the proposed
method is achieved by using the secret block mapping function which controls the
signature generating/embedding processes.
Our authenticator is based on two invariant properties of DCT coe�cients be-
fore and after JPEG compressions. They are deterministic so that no probabilistic
decision is needed in the system. The �rst property shows that if we modify a DCT
coe�cient to an integral multiple of a quantization step, which is larger than or
equal to the steps used in later JPEG compressions, then this coe�cient can be
exactly reconstructed after later acceptable JPEG compression. We later proved in
Chapter 5 that this property has almost explored the maximum zero-error capacity
of digital image. The second property is the invariant relationships between two
coe�cients in a block pair before and after JPEG compression. Therefore, we can
use the second property to generate authentication signature, and use the �rst prop-
erty to embed it as watermarks. There is no perceptible degradation between the
watermarked image and the original. In addition to authentication signatures, we
can embed the recovery bits for recovering approximate pixel values in corrupted ar-
22
eas. Our authenticator utilizes the compressed bitstream and thus avoids rounding
errors in reconstructing DCT coe�cients. Experimental results showed the e�ec-
tiveness of this system. The system retrieved no false alarms, i.e., no acceptable
JPEG compression was rejected, and demonstrated great sensitivity in rejecting
crop-and-replacement manipulations.
In Chapter 4, we propose a public watermarking algorithm that is robust to
rotation, scaling, and/or translation (RST) distortion.2 The watermark is embed-
ded into a 1-dimensional signal obtained by �rst taking the Fourier transform of
the image, resampling the Fourier magnitudes into log-polar coordinates, and then
summing a function of those magnitudes along the log-radius axis. If the image is
rotated, the resulting signal is cyclically shifted. If it is scaled, the signal is multi-
plied by some value. And if the image is translated, the signal is una�ected. We can
therefore compensate for rotation with a simple search, and compensate for scaling
by using the correlation coe�cient as the detection metric. False positive results on
a database of 10,000 images are reported. Robustness results on a database of 2,000
images are described. It is shown that the watermark is robust to rotation, scale and
translation. In addition, we describe tests examining the watermark's resistance to
cropping and JPEG compression.
After an image is printed-and-scanned, it is usually �ltered, rotated, scaled,
cropped, and contrast-and-luminance adjusted, as well as distorted by noises. Chap-
ter 4 also presents models for the print-and-scan process, considering both pixel
value distortion and geometric distortion. We show properties of the discretized,
rescanned image in both the spatial and frequency domains, then further analyze
the changes in the Discrete Fourier Transform (DFT) coe�cients. Based on these
2Part of this chapter represents joint work with J. Bloom, M. Miller, I. Cox, M. Wu and Y. Lui[83].
23
properties, we show several techniques for extracting invariants from the original
and rescanned image, with potential applications in image watermarking and au-
thentication. These invariants helped design the watermarking algorithm proposed
in this chapter to survive print-and-scan process. Preliminary experiments show the
validity of the proposed model and the robustness of the watermark.
In Chapter 5, we address the following important question: how much informa-
tion can be reliably transmitted as watermarks without causing noticeable quality
losses, while being robust to some distortions on the watermarked images? Our ob-
jective is to �nd theoretical watermarking capacity bounds of digital images based
on the information theory and the characteristics of the human vision system. We
investigate watermarking capacity in three directions. First, the zero-error capacity
for public watermarking in magnitude-bounded noisy environment. In an envi-
ronment with �nite states and bounded-magnitude noises, transmission error can
actually be zero, instead of stochastically approaching zero as usually addressed in
Shannon's capacity theory. We �nd the zero-error capacity of a digital image if
quantization is the only source of distortion such as in JPEG. We consider that
signal, watermark and noise are all discrete values, as in real representation of dig-
ital images. Second, we study the watermarking capacity based on domain-speci�c
masking e�ects. We show the capacity of private watermarking in which the power
constraints are not uniform in di�erent samples. Then, we apply domain-speci�c
HVS models to estimate the constraints in images and show the theoretical water-
marking capacity of an image in the general noisy environments. Third, we study
the watermarking capacity issues based on Human Vision Systemmodels. We study
in details the Human Vision System developed by Daly and Lubin, and then show
the di�culties and the necessity of future work in order to use them to estimate
watermarking capacity.

24
In Chapter 6, we present the conclusion of our thesis and describe several future
research issues in this �eld.
1.5.1 Original Contributions of Thesis
The original contributions of this thesis include the following:
� Invariant feature codes of image or video that can distinguish DCT-based
lossy compression from malicious crop-and-replacement manipulations. These
codes can achieve no false alarm in DCT-based lossy compressions and have
great sensitivity in detecting malicious manipulations. (Chapter 2)
� Robust digital signatures for authenticating MPEG video through various
transcoding and editing. (Chapter 2)
� Unique Self-Authentication-and-Recovery Images (SARI) system based on
semi-fragile watermarking (http://www.ctr.columbia.edu/sari). SARI authen-
ticator can authenticate the watermarked images after DCT-based lossy com-
pressions, detect and locate malicious manipulations, and recover an approxi-
mation of the original on the corrupted areas. (Chapter 3)
� Novel public watermarking that is robust to a�ne transformation and pixel
value distortion. We model the image print-and-scan process and develop a
public watermarking scheme which survives this process (Chapter 4).
� Zero-Error watermarking capacity of digital images in a magnitude-constrained
noisy environment (Chapter 5).
� Private watermarking capacity for digital images in a power-constrained noisy
environment based on the characteristics of the Human Vision System (Chap-
ter 5).

25
Chapter 2
Image/Video Authentication Using Robust
Digital Signature
2.1 Introduction
Development of robust image authentication techniques becomes an important
issue. If we consider a digital image to be merely an ordinary bitstream on which
no modi�cation is allowed, then there is not much di�erence between image au-
thentication and other message authentication problems. Two methods have been
suggested for achieving the authenticity of digital images: having a digital camera
sign the image using a digital signature [45], or embedding a secret code in the image
[130]. The �rst method uses an encrypted digital \signature" which is generated in
the capturing devices. A digital signature is based on the method of Public Key
Encryption citepublic, marc. A private key is used to encrypt a hashed version of
the image. This encrypted message is called the \signature" of the image, and it
provides a way to ensure that this signature cannot be forged. This signature then
travels with the image. The authentication process of this image needs an asso-
ciated public key to decrypt the signature. The image received for authentication
is hashed and compared to the codes of the signature. If they match, then the
26
received image is authenticated. The second method embeds a \watermark" in an
image [74, 130, 145]. The fragile watermark usually will be destroyed after manipu-
lation. Authenticity is determined by examining the watermark extracted from the
received image. Both the above methods have clear drawbacks. Authenticity will
not be preserved unless every pixel of the images is unchanged. However, since lossy
compression such as JPEG is often acceptable - or even desired - in practical appli-
cations, an authentication method needs to be able to distinguish lossy compression
from malicious manipulations.
Manipulations on images can be considered in two ways: method and purpose.
Manipulation methods include compression, format transformation, shifting, scal-
ing, cropping, quantization, �ltering, replacement, etc. The purpose of manipula-
tions may be transformation or attack. The former are usually acceptable, and the
latter, unacceptable. We list two kinds of transformation of representation below:
1. Format transformation and lossless compression. Disregarding the noise caused
by the precision limitation during computation, pixel values are not changed
after these manipulations. Therefore, we exclude these manipulations in the
discussion in this paper.
2. Application-speci�c transformations. Some applications may require lossy
compression in order to satisfy the resource constraints on bandwidth or stor-
age. Some applications may also need to enhance the image quality, crop the
image, change the size, or perform some other operations. A common as-
pect of these manipulations is that they change the pixel values, which results
in di�erent levels of visual distortion in the image. Usually, most of these
operations try to minimize the visual distortion.
Attacks, or malicious manipulations, change the image to a new one which car-
ries a di�erent visual meaning to the observer. One typical example is replacing
27
some parts of the image with di�erent content.
It is di�cult for an authenticator to know the purpose of manipulation. A prac-
tical approach is to design an authenticator based on the manipulation method. In
this paper, we design an authenticator which accepts format transformation, lossless
compression, and the popular JPEG lossy compression. The authenticator rejects
replacement manipulations because they are frequently used for attacks. Our au-
thenticator does not aim to reject or accept, in absolute terms, other manipulation
methods because the problem of whether they are acceptable depends on appli-
cations. But, if necessary, some manipulations can be clearly speci�ed by users,
such as shifting, cropping, or constant intensity enhancement. We will discuss this
more rigorously later. The proposed authentication techniques have been extended
and applied to MPEG video authentication as in [76] (also shown in Section 2.6 -
Section 2.9).
For an image, there are some invariance properties which can be preserved during
JPEG lossy compression. Let us consider the relationship between two DCT coe�-
cients of the same position in two separate 8�8 blocks of an image. This relationship
will hold even if these coe�cients are quantized by an arbitrary quantization table
in a JPEG compression process. In this paper, we will use this invariance prop-
erty and propose a robust authentication method which can distinguish malicious
manipulations from JPEG lossy compression.
A comprehensible list of multimedia authentication research papers can be found
in [79]. Bhattacha and Kutter proposed an authentication method which extracts
\salient" image feature points by using a scale interaction model and Mexican-Hat
wavelets [11]. They generate a digital signature based on the locations of these
feature points. The advantage of this technique is its compact signature length.

28
But, the selection process and relevance of the selected points are not clear. This
technique may not be adequate for detecting some crop-and-replace manipulations
inside the objects. Its robustness to lossy compression is also unclear. Queluz
proposed techniques to generate digital signatures based on moments and edges
[108]. Moment features ignore the spatial distribution of pixels. Images can be
easily manipulated without changing their moments. Edge-based features may be
a good choice for image authentication because the contour of objects should keep
consistent for acceptable manipulations. However, several issues have to be further
solved such as the reduction of signature length, the consistency of edge detector,
and the robustness to color manipulations. Fridrich proposed a robust watermarking
technique for authentication [42][43]. He divided images to 64�64 blocks. For eachblock, quasi-VQ codes are embedded by the spread spectrum method[23]. This
technique is robust to manipulations. But, it cannot detect small area modi�cation.
The error between the extracted watermark and the reconstructed quasi-VQ codes
is too large after JPEG compression[43]. Therefore, this technique would have
di�culty distinguishing malicious manipulations from JPEG compressions.
This chapter is organized as follows. We brie y review the JPEG system in
Section 2.2. In Section 2.3, a general system for authentication will be proposed.
Also, we will describe how to control parameters for di�erent practical uses. A
simple example is shown in this section. We will present rigorous performance
analysis in Section 2.4. Experimental results will be shown in Section 2.5. From
Section 2.6 to Section 2.9, we will show how to design robust digital signature for
video authentication. In Section 2.10, we will present conclusions and discuss future
work.

29
2.2 Review of JPEG Lossy Compression
In this section, we brie y review the JPEG lossy compression standard. At the input
to the JPEG[129] encoder, the source image, X, is grouped into } nonoverlapping
8 � 8 blocks, X =S}p=1Xp. Each block is sent sequentially to the Discrete Cosine
Transform (DCT). Instead of representing each block, Xp, as a 8�8 matrix, we can
rewrite it as a 64 � 1 vector following the \zigzag" order[129]. Therefore, the DCT
coe�cients, Fp, of the vector, Xp, can be considered as a linear transformation of
Xp with a 64 � 64 transformation matrix D, s.t.,
Fp = DXp: (2.1)
Each of the 64 DCT coe�cients is uniformly quantized with a 64-element quantiza-
tion table Q. In JPEG, the same table is used on all blocks of an image. (For color
images, there could be three quantization tables for YUV domains, respectively.)
Quantization is de�ned as the division of each DCT coe�cient by its corresponding
quantizer step size, and rounding to the nearest integer:
~fp(�) � Integer Round(Fp(�)
Q(�)); (2.2)
where � = 1:::64. In eq.(2.2), ~fp is the output of the quantizer. We de�ne ~Fp, a
quantized approximation of Fp, as
~Fp(�) � ~fp(�) �Q(�): (2.3)
In addition to quantization, JPEG also includes scan order conversion, DC di�er-
ential encoding, and entropy coding. Inverse DCT (IDCT) is used to convert ~Fp to
30
the spatial-domain image block ~Xp.
~Xp = D�1~Fp: (2.4)
All blocks are then tiled to form a decoded image frame.
Theoretically, the results of IDCT are real numbers. However, the brightness of
an image is usually represented by an 8-bit integer from 0 to 255 and thus a rounding
process mapping those real numbers to integers is necessary. We found that popular
JPEG softwares such as PhotoShop, xv, etc. use the integer rounding functions in
several steps of their DCT and IDCT operators in order to save computation or
memory. The input and output of their DCT and IDCT operators are all integers.
This approximation may not introduce too much visual distortion but may a�ect
the authentication system performance that we will discuss in more detail in Section
2.4.
2.3 Authentication System
The proposed authentication method is shown in Figure 2-1. Our method uses a
concept similar to that of the digital signature method proposed by Friedman[45],
but their technique doesn't survive lossy compression. A signature and an image are
generated at the same time. The signature is an encrypted form of the feature codes
or hashes of the image. When a user needs to authenticate the image he receives,
he should decrypt this signature and compare the feature codes (or hashed values)
of this image to their corresponding values in the original signature. If they match,
this image is said to be \authenticated." The most important di�erence between our
method and Friedman's \trustworthy camera" is that we use invariance properties
in JPEG lossy compression as robust feature codes instead of using hashes of raw
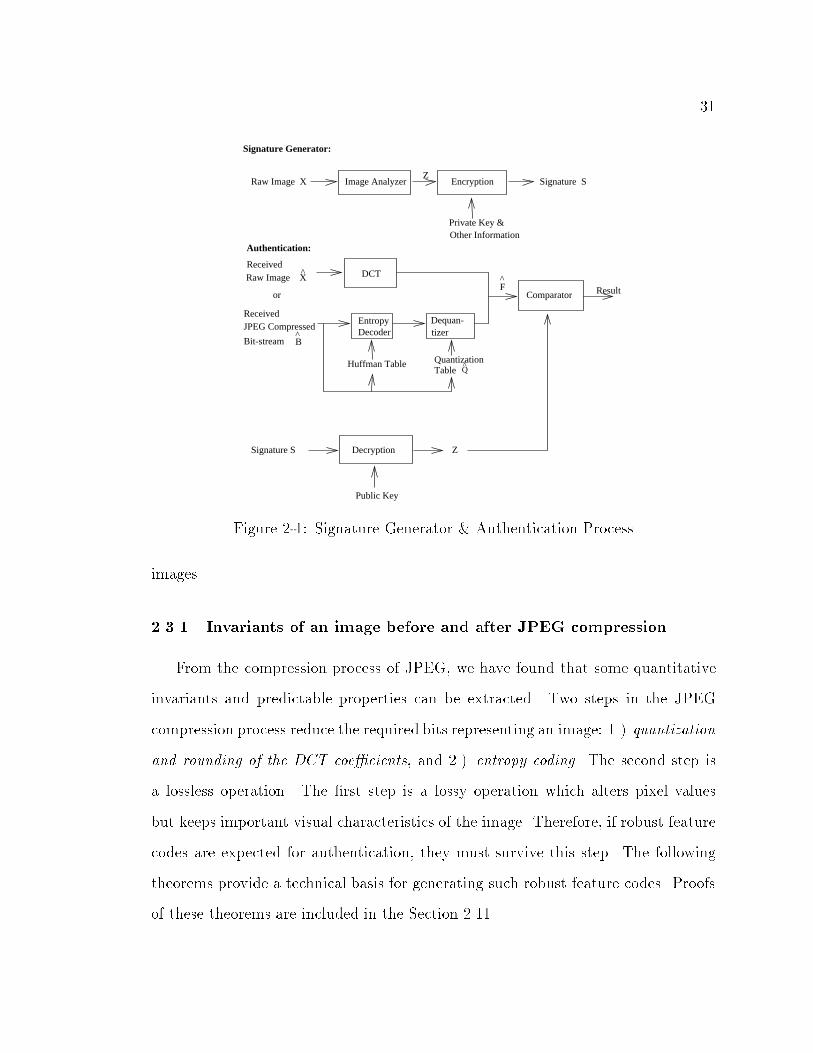
31
ComparatorF^
Result
Huffman Table
^B
QTable
Encryption
Received
Authentication:
Signature Generator:
DCT
EntropyDecoder
Quantization
Dequan-tizer
Signature S ZDecryption
Image AnalyzerZ
Signature SRaw Image X
Other InformationPrivate Key &
Raw Image X^
JPEG CompressedReceived
Bit-stream
Public Key
or
Figure 2-1: Signature Generator & Authentication Process
images.
2.3.1 Invariants of an image before and after JPEG compression
From the compression process of JPEG, we have found that some quantitative
invariants and predictable properties can be extracted. Two steps in the JPEG
compression process reduce the required bits representing an image: 1.) quantization
and rounding of the DCT coe�cients, and 2.) entropy coding. The second step is
a lossless operation. The �rst step is a lossy operation which alters pixel values
but keeps important visual characteristics of the image. Therefore, if robust feature
codes are expected for authentication, they must survive this step. The following
theorems provide a technical basis for generating such robust feature codes. Proofs
of these theorems are included in the Section 2.11.
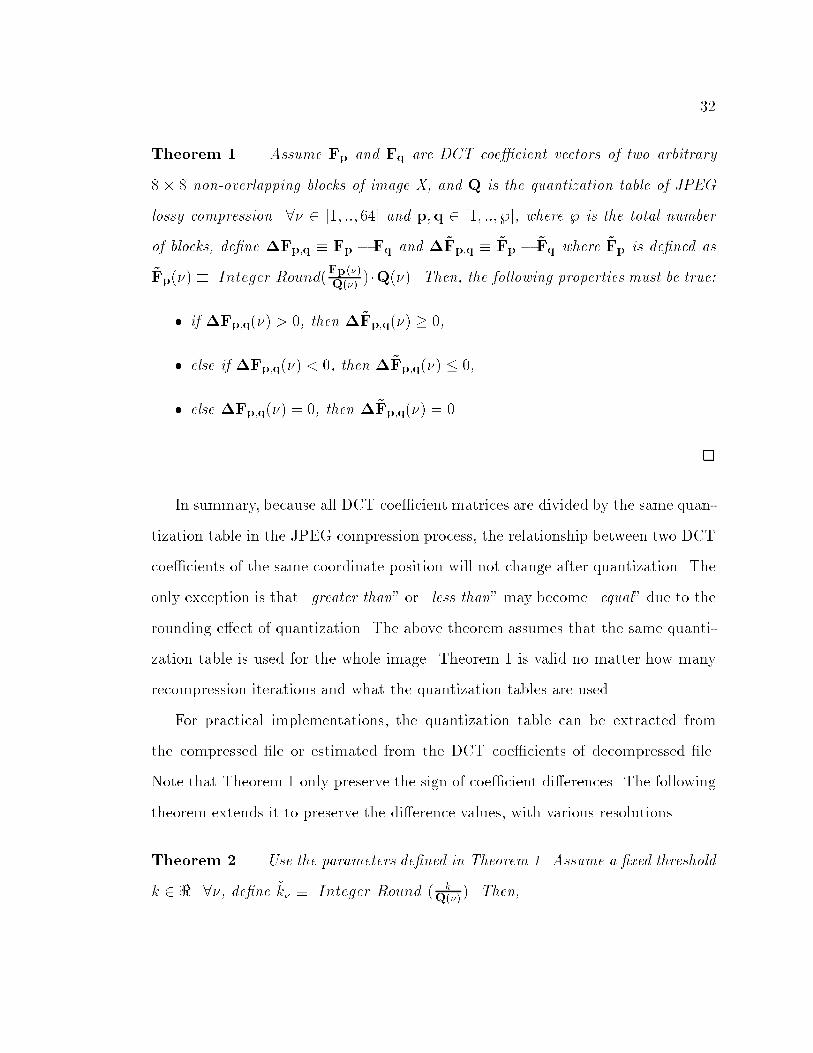
32
Theorem 1 Assume Fp and Fq are DCT coe�cient vectors of two arbitrary
8 � 8 non-overlapping blocks of image X, and Q is the quantization table of JPEG
lossy compression. 8� 2 [1; ::; 64] and p;q 2 [1; ::; }], where } is the total number
of blocks, de�ne �Fp;q � Fp � Fq and �~Fp;q � ~Fp � ~Fq where ~Fp is de�ned as
~Fp(�) � Integer Round(Fp(�)
Q(�)) �Q(�). Then, the following properties must be true:
� if �Fp;q(�) > 0, then �~Fp;q(�) � 0,
� else if �Fp;q(�) < 0, then �~Fp;q(�) � 0,
� else �Fp;q(�) = 0, then �~Fp;q(�) = 0.
2
In summary, because all DCT coe�cient matrices are divided by the same quan-
tization table in the JPEG compression process, the relationship between two DCT
coe�cients of the same coordinate position will not change after quantization. The
only exception is that \greater than" or \less than" may become \equal" due to the
rounding e�ect of quantization. The above theorem assumes that the same quanti-
zation table is used for the whole image. Theorem 1 is valid no matter how many
recompression iterations and what the quantization tables are used .
For practical implementations, the quantization table can be extracted from
the compressed �le or estimated from the DCT coe�cients of decompressed �le.
Note that Theorem 1 only preserve the sign of coe�cient di�erences. The following
theorem extends it to preserve the di�erence values, with various resolutions.
Theorem 2 Use the parameters de�ned in Theorem 1. Assume a �xed threshold
k 2 <. 8�, de�ne ~k� � Integer Round ( kQ(�)). Then,
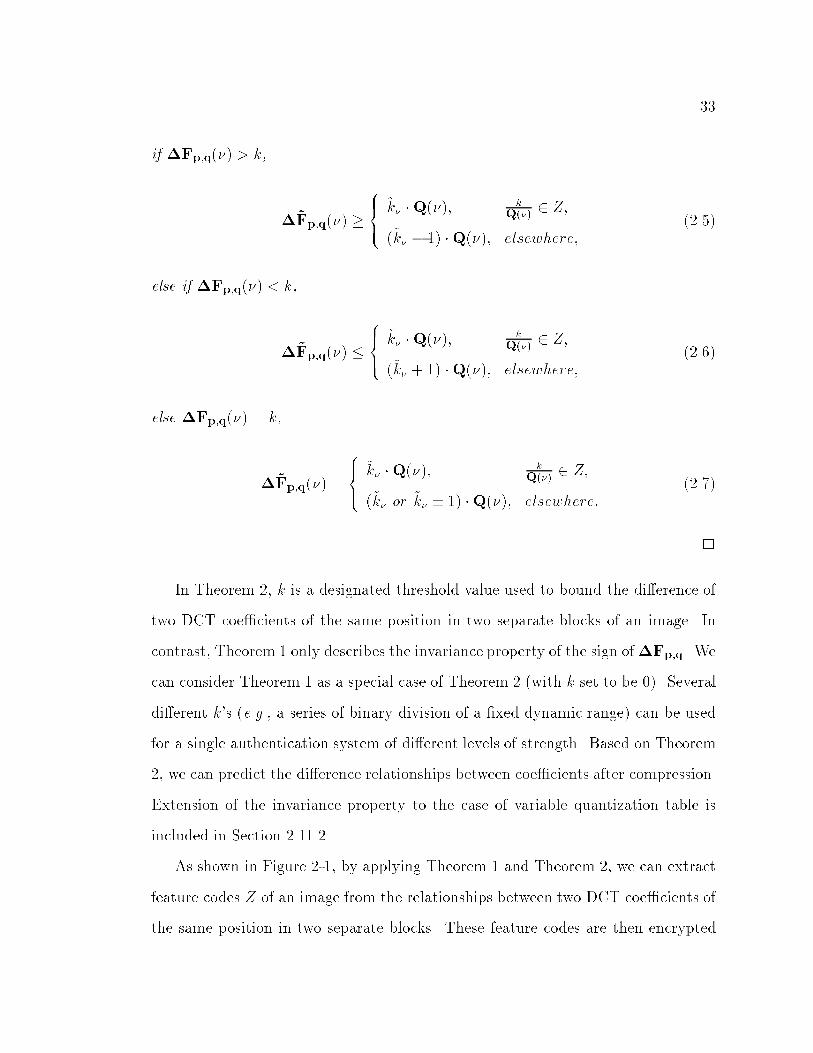
33
if �Fp;q(�) > k,
�~Fp;q(�) �8><>:
~k� �Q(�); kQ(�)2 Z;
(~k� � 1) �Q(�); elsewhere;(2.5)
else if �Fp;q(�) < k,
�~Fp;q(�) �8><>:
~k� �Q(�); kQ(�)2 Z;
(~k� + 1) �Q(�); elsewhere;(2.6)
else �Fp;q(�) = k,
�~Fp;q(�) =
8><>:
~k� �Q(�); kQ(�) 2 Z;
(~k� or ~k� � 1) �Q(�); elsewhere:(2.7)
2
In Theorem 2, k is a designated threshold value used to bound the di�erence of
two DCT coe�cients of the same position in two separate blocks of an image. In
contrast, Theorem 1 only describes the invariance property of the sign of�Fp;q. We
can consider Theorem 1 as a special case of Theorem 2 (with k set to be 0). Several
di�erent k's (e.g., a series of binary division of a �xed dynamic range) can be used
for a single authentication system of di�erent levels of strength. Based on Theorem
2, we can predict the di�erence relationships between coe�cients after compression.
Extension of the invariance property to the case of variable quantization table is
included in Section 2.11.2.
As shown in Figure 2-1, by applying Theorem 1 and Theorem 2, we can extract
feature codes Z of an image from the relationships between two DCT coe�cients of
the same position in two separate blocks. These feature codes are then encrypted

34
Up=1
P
Up=1
P
F = Fp = DCT( Xp )
Up=1
P
∆ νFp,q ( ) < k
νNext , p, n
Image X = Xp
For = 1 to bν
Yes
No
z=0 z=1
For n = 1 to N
n
zZ ( ) = n
P/21For p = p to p
ν
DCT:
Input:
Loop 3:
(Blocks)
Output:
Next:
Coefficients)( Zig-zag
Compare:
Loop 2:
Loop 1:(Sets)
F^
νNext , p, n
∆ ^ ν
Z
Block p or q has been manipulated
Yes
No
For n = 1 to N
For = 1 to bν
ν 0
Yes Yes
τ∆ ^ ν −τ^Fp,q( )- k > ^Fp,q( )- k <
^
P/21For p = p to p
n
nZ ( ) =
Loop 3:
(Blocks)
Coefficients)( Zig-zag
Loop 2:
Loop 1:(Sets)
Next:
Output:
Input:
Compare:
(b)(a)
,p
,p
Figure 2-2: (a) Feature Extraction, (b) Authentication: Comparator
as a signature. For the authentication process, a user has to calculate the DCT
coe�cients of the image, and compare them to the features decrypted from the
digital signature S. This image is said to be authenticated if all the DCT coe�cient
relationships satisfy the criteria predicted by the features of the original image.
2.3.2 Image Analyzer: Feature Extraction
Figure 2-2(a) is the ow chart of the feature extraction process. First, a digital
image X is sent into the image analyzer. Each 8 � 8 block of this image is then
transformed to the DCT coe�cients.

35
There are three loops for generating feature codes:
� Loop 1: Generate N sets of feature codes, Zn;p, n = 1 to N . Each set uses
di�erent k and bn, where k is de�ned in Theorem 2, bn is the number of DCT
coe�cients compared in each block pair.
� Loop 2: Iterate over all possible block pairs, p = p1 to p}
2
, where } is the total
number of blocks in the image.
� Loop 3: Iterate over each of the bn selected coe�cient pairs.
In Loop 1, N sets of feature codes are generated. For each set, parameter bn
represents how many bits are generated in each block. Parameter k represents the
precision threshold used in Theorem 2. The �rst set, k = 0, protects the sign of
�Fp;q. From the second set to the last set, k's are set to protect the magnitude of
�Fp;q with increasing accuracy. We will discuss how to de�ne the thresholds later
in this section.
In Loop 2, we need to form DCT blocks into pairs. As de�ned in Theorem 2, the
DCT coe�cient di�erence between block p and block q is computed. Let us denote
one set of blocks Pp = fp1; p2; :::; p}2
g and another set of blocks Pq = fq1; q2; :::; q}2
g.For example, Pp can be all the even blocks, f0; 2; 4; :::; }� 1g, and Pq can be all the
odd blocks, f1; 3; 5; :::; }�2g. The formation of all blocks in an image into pairs can
be based on an arbitrary mapping function, W , as long as the following conditions
are kept.
Pq = W (Pp); (2.8)
and
Pp \ Pq = �; Pp [ Pq = P: (2.9)
If redundancy is allowed, Pp and Pq each may contain more blocks than }2 . The

36
choice of the mapping function W can serve as a secret parameter, used to en-
hance the security of authenticator. For example, the image analyzer uses a seed
to generate the mapping function W and provides the seed with the feature codes
to the authenticator. Each authenticator can transform this seed into the mapping
function. This transformation method will not be made public. Therefore, each
manufacturer of the image authenticator can implement his/her own transforma-
tion method.
In Loop 3, for each block, we compare the bn selected values (indexed in the
zigzag order) in the DCT domain. Both DC and AC values in the DCT domain
are used. At �rst, the di�erence of DC values in block p and q, �Fp;q(1), is used
for comparison. If this value is smaller than k, then a feature code bit z = 0 is
added to the end of the previous feature code. Otherwise, if this value is greater or
equal to k, we will assign z = 1. (We classify two cases, \greater" and \equal", to
the same type because the probability of �Fp;q(�) = 0 is quite small. If they are
classi�ed into three di�erent types, i.e., \greater", \equal" and \less than", two bits
should be used in this case. This will result in the increased length of feature codes.)
Thereafter, the di�erences in selected AC values are compared with k. Only bn � 1
AC di�erences, are used in this process. After Loops 1, 2 and 3 are completed, the
feature codes, Z, of this image are generated. Usually, the bn selected positions are
located in the low and middle frequency bands for the following two reasons: 1.) they
are usually larger than the high-band coe�cients because of energy concentration,
and 2.) their values are usually conserved after JPEG compression because the
values in the quantization table, Q, in these bands are small.

37
2.3.2.1 Precision Thresholds and Other Considerations
Theoretically, threshold values, k, can be determined arbitrarily, and they may
vary for di�erent n and �. In our system, for the �rst set, all k1;p(�) are set to
zeros. We use a binary division method to set thresholds for other sets. Assume the
dynamic range of �Fp;q(�) is from �� to �. If we know that �Fp;q(�) < 0 in the
�rst set, then we can set the threshold in the second set as ��=2. Furthermore, if we
know that this value�Fp;q(�) > ��=2 in the second set, the threshold in the third
set can be set as ��=4. These thresholds result in dynamic binary decision ranges.
This method protects the magnitude of �Fp;q(�) with an increasing accuracy as
more sets are being used. The larger N is, the more precisely will the coe�cient
di�erences be limited.
De�ne a constant � which is a power of 2, and the threshold used in the n-th set
of block p at the position � is kn;p(�). A closed form of kn;p(�) is
kn;p(�) = �n�1Xi=1
(1
2)i(�1)Zi;p(�)+1; n > 1: (2.10)
To simplify the notation in later discussions, we use k = kn;p(�) instead.
In addition to the parameters used in the three loops, some extra information
about the image is necessary for defeating attacks. In our authentication system,
a possible attack is to make a constant change to DCT coe�cients at the same
location in all blocks. This will not change the di�erence values between pairs of
DCT coe�cients from two di�erent blocks. For instance, raising the image intensity
uniformly changes the DC parameter in all blocks and defeats the previous approach.
To defeat this attack, we record the mean value of DCT coe�cients in each (selected)
position for all blocks in the signature. These additional feature codes need no more
than 64 bytes. When the DCT coe�cients are changed by constant values, they will
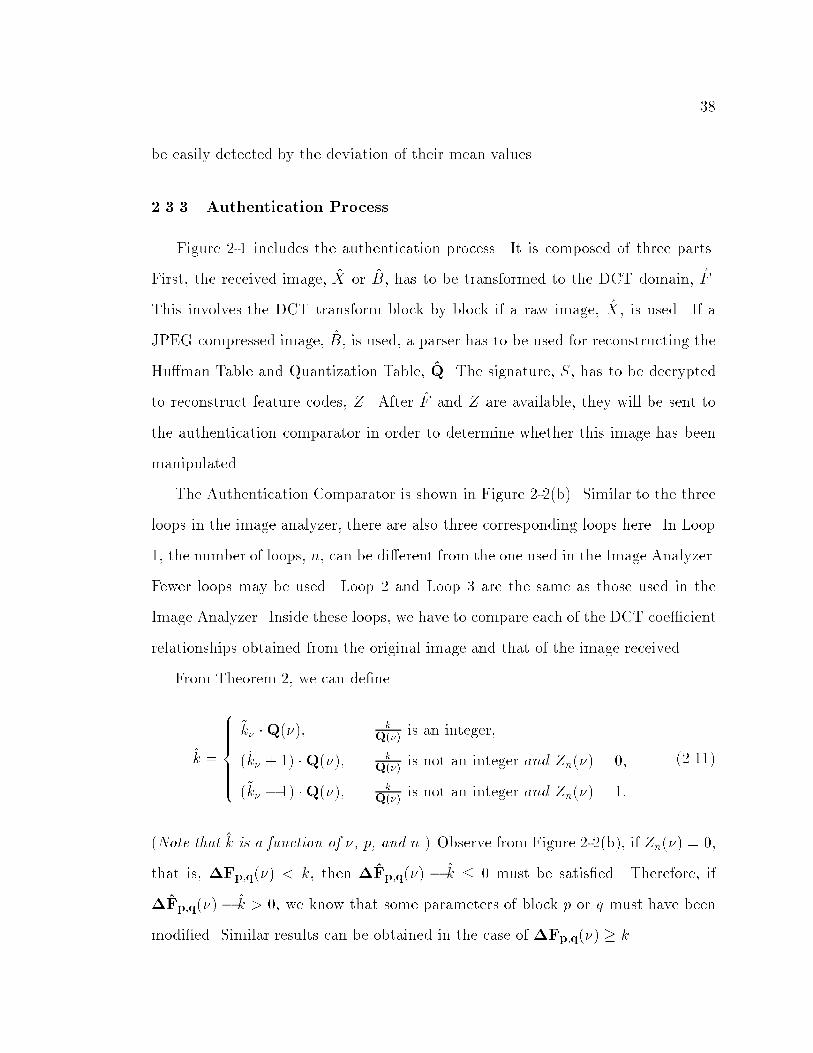
38
be easily detected by the deviation of their mean values.
2.3.3 Authentication Process
Figure 2-1 includes the authentication process. It is composed of three parts.
First, the received image, X or B, has to be transformed to the DCT domain, F .
This involves the DCT transform block by block if a raw image, X, is used. If a
JPEG compressed image, B, is used, a parser has to be used for reconstructing the
Hu�man Table and Quantization Table, Q. The signature, S, has to be decrypted
to reconstruct feature codes, Z. After F and Z are available, they will be sent to
the authentication comparator in order to determine whether this image has been
manipulated.
The Authentication Comparator is shown in Figure 2-2(b). Similar to the three
loops in the image analyzer, there are also three corresponding loops here. In Loop
1, the number of loops, n, can be di�erent from the one used in the Image Analyzer.
Fewer loops may be used. Loop 2 and Loop 3 are the same as those used in the
Image Analyzer. Inside these loops, we have to compare each of the DCT coe�cient
relationships obtained from the original image and that of the image received.
From Theorem 2, we can de�ne
k =
8>>>>><>>>>>:
~k� �Q(�); kQ(�) is an integer;
(~k� + 1) �Q(�); kQ(�) is not an integer and Zn(�) = 0;
(~k� � 1) �Q(�); kQ(�) is not an integer and Zn(�) = 1:
(2.11)
(Note that k is a function of �, p, and n.) Observe from Figure 2-2(b), if Zn(�) = 0,
that is, �Fp;q(�) < k, then �Fp;q(�) � k � 0 must be satis�ed. Therefore, if
�Fp;q(�) � k > 0, we know that some parameters of block p or q must have been
modi�ed. Similar results can be obtained in the case of �Fp;q(�) � k.
39
However, some integer rounding noise may be introduced if the following cases
occur: (1) the image is converted back to integral pixel values during the decode-
reencode process, (2) the compressor and the signature generator use di�erent chro-
matic decimation algorithms for color images, or (3) the JPEG encoder calculates
imprecise DCT. Therefore, we must introduce a tolerance bound � in the authenti-
cator. We augment the comparing process with the following position.
Proposition 1: Block p or q can be said to be manipulated
if
�Fp;q(�)� k > �; (2.12)
for the case of �Fp;q(�)� k < 0, (or equivalently Zn(�) = 0),
or if
�Fp;q(�)� k < ��; (2.13)
for the case of �Fp;q(�)� k � 0, (or equivalently Zn(�) = 1.)
The tolerance, � , is determined by the level of integer rounding errors. Optimal
levels of the rounding tolerance will be discussed in Section 2.4.1.
Note that the result of authentication can be a binary indicator, true or false,
for the whole image, or it may indicate the authenticity or forgery of speci�c parts
in an image.
2.3.3.1 Other Considerations
Manipulation in speci�c block pairs can be located by the proposed technique.
However, the authenticator using non-overlapping sets in Eq.(2.9) will not be able to
identify which block in the pair has been modi�ed. If identi�cation of speci�c blocks
is needed, we can use overlapping sets in Eq.(2.9). Identifying local changes is very
useful to some applications in which both global and local contents are important.
40
For instance, in a picture of ten people, even if a man's face has been substituted by
that of another person or has been removed, another parts of the image can still be
veri�ed to authenticate the appearance of the other nine people. Another advantage
is that the system can verify authenticity in a selected area (e.g., some news agency
may cut out boundary areas of �le photos).
Boundary cropping and/or position shifting are often performed on images to suit
application needs. The proposed authentication signature is sensitive to cropping
and shifting. However, for cropping, image block pairs that are not a�ected by
cropping may still be authenticated. If cropping is allowed in some situations, we
can design a robust digital signature with carefully selected mapping function, e.g.,
selecting pairs from adjacent blocks. For shifting, if no DCT quantization is done
on the shifted image (e.g., shifting in the pixel domain only), the shifted image can
be adjusted to the right position that results in the matched DCT block structure.
Then, the DCT domain signature can be veri�ed.
Constant intensity change in the image is sometimes expected, especially when
the image is too dark or too bright. Our proposed authenticator solves this problem
by relaxing the change threshold �s(1) of the mean value of DC coe�cients.
Scaling is a common operation in many situations. For instance, a user may scan
a picture with high resolution, and then down-sample it to an appropriate size. In
this case, the signature generator has to record the original size of the image. Then,
the authenticator can resize the image to its original size before the authentication
process. Because the distribution of these sampling/interpolation noises can be
modeled by a Gaussian function whose variance is not too large [57], there will be
no large changes in the DCT coe�cients. Similar to the recompression distortions,
these changes can be accepted by setting adequate tolerance values.
Other lossy compression techniques such as wavelet-based methods or color space

41
decimation methods can be also considered as noise-adding processes. Similarly, we
can use larger tolerances for these cases. Filtering, such as low-pass �ltering and
edge enhancement, may cause more visual changes and may cause challenges to the
proposed technique. However, if the change in pixel values is not too large, we
can consider them as some kind of noise and use adequate tolerance values. This
strategy of adjusting tolerance levels can also be applied to other operations as well.
The authenticator is sometimes expected to pass only those images that are com-
pressed by JPEG up to a certain compression ratio or quality factor. For example,
if the image is JPEG compressed below the 20:1 ratio, the image is acceptable. Oth-
erwise, if it is compressed more, it will fail the test. The argument for failing highly
compressed images is that such images usually have poor quality and should not
be considered as authentic. To satisfy this need, we can apply one of the following
methods. The �rst one is to calculate the compression ratio from the raw image size
and the compressed �le size. If it is too high, the authenticator can reject it before
any authenticating process. The second method is to calculate the increase of the
number of the \equal" signature bits after compression. The number of \equal"
signature bits increases if the image is compressed more. We can set a threshold on
this change to reject those images that have too many \equal" coe�cients in the
block pairs.
2.3.4 Encryption, Decryption and Signature Length
The feature codes are encrypted by a secret private key of the Public Key
method. As described in Section 3.2, the length, lf , of feature codes is determined
by the comparison bits }2 � (
PNn=1 bn), the seeds of the block pair mapping function
and selected DCT positions, and the DCT mean values (see Section 3.2.1). For
instance, assume the image size is 320 � 240 = 76800(bytes). In a scenario that 10

42
bits of feature codes are used for each block pair, i.e., N = 1 and b = 10. Assume
both the seeds are 2 bytes long, and 6 DCT coe�cient averages are recorded, then
the length of feature codes, lf , will be40�30
2 � 10 � 18 + 2 + 2 + 6 = 760(bytes). The
signature length can be further reduced with the reduction of the authenticator's
e�ectiveness. We will analyze this trade-o� in detail in Section 4.
The Public Key algorithm is used so that any user can easily access a public key
to decrypt the signature. The most famous public key algorithm is RSA (Rivest,
Shamir, and Adleman)[64][113]. The key length of RSA is variable but the most
commonly used length is 512 bits [113], while the message block size must be smaller
than the key length. If we choose to divide the feature codes into B-bit blocks, it
needs dlf � 8 � 1Be RSA calculations (where dxe denotes the integer ceiling function).
Assume the output length of each RSA is lr, then the signature length will be
dlf � 8 � 1Be � lr bits. For instance, in previous example, if B = 510 and lr = 511 are
used, then the RSA algorithm has to be run 12 times and the signature length will
be 767 bytes. It is about 1100
of the original image size.
A problem with Public Key algorithms is the speed. In hardware, the RSA
Public Key algorithm is 1000 times slower than the DES Secret Key algorithm. The
di�erence is about 100 times in software [113]. Therefore, if e�ciency is critical,
we can choose the Secret Key algorithm instead of the Public Key algorithm. The
drawback is that users have to keep their secret keys safe, and the image can be
authenticated by only the few people who own the secret key.
Implementation of a Public Key Infrastructure (PKI) is necessary for practical
application. A PKI is the set of security services that enable the use and man-
agement of public-key cryptography and certi�cates, including key, certi�cate, and
policy management [54]. If the image is generated from a hardware device, such
as digital camera or scanner, then the manufacturer can serve as a Certi�cation

43
486 91 -66 -91 -17 -1 14 -0140 41 44 35 -8 -12 -6 -443 108 -54 5 16 13 -9 -0-143 -21 84 34 22 -0 -12 69 -18 -2 -32 8 5 5 12-23 -9 1 -1 -8 1 2 -03 10 -14 4 6 -1 -1 -6-8 -10 14 3 -1 -2 -2 -3
727 -188 -3 -28 -16 -4 -6 -151 -77 22 45 11 1 2 331 -52 -73 -8 5 5 10 773 40 -21 -7 1 -13 -2 -219 12 -21 -17 4 2 2 -120 15 -2 -17 -5 2 -0 -116 16 13 1 2 6 -2 0-1 -3 -6 -12 -6 -1 1 3
(a) (b)
Table 2.1: Two DCT coe�cient blocks for a 16�8 area cut from the image \Lenna"(right eye region).
Authority (CA) issuing all user private-public key pairs. Private keys can be either
embedded in the hardware device or issued to the driver software while customers
register their information. Any end entity can examine the authenticity of images
by requesting the public key and the authentication software from the manufacturer.
Similarly, if the image is generated by a Content Holder, he/she can ask a private-
public key pairs from any CA, which provides both key pairs and authentication
software. The details of the PKI and the related standard X:509 can be found in
[52].
2.3.5 Example: A small 16 � 8 image
We will use a small 16 � 8 image, X, as an example to illustrate the proposed
authentication technique. This image is divided into two 8 � 8 blocks, from which
DCT coe�cients are computed. Therefore, } = 2. Its DCT coe�cients are shown
in Table 2.1. For simplicity, only integral values of them are shown in the table.
First, let us consider the case of N = 1, i.e., only one threshold value k = 0
is used for feature code generation. Assume the �rst 10 coe�cients in the zigzag
order of the two blocks are compared. In this case, the length of the feature codes,
Z, will be 10 bits (b1 = 10) �F1;2(1) = �241 < 0. Therefore, the �rst bit of the
feature codes, Z, is 0. The second coe�cients in the zigzag order are: F1(2) = 91
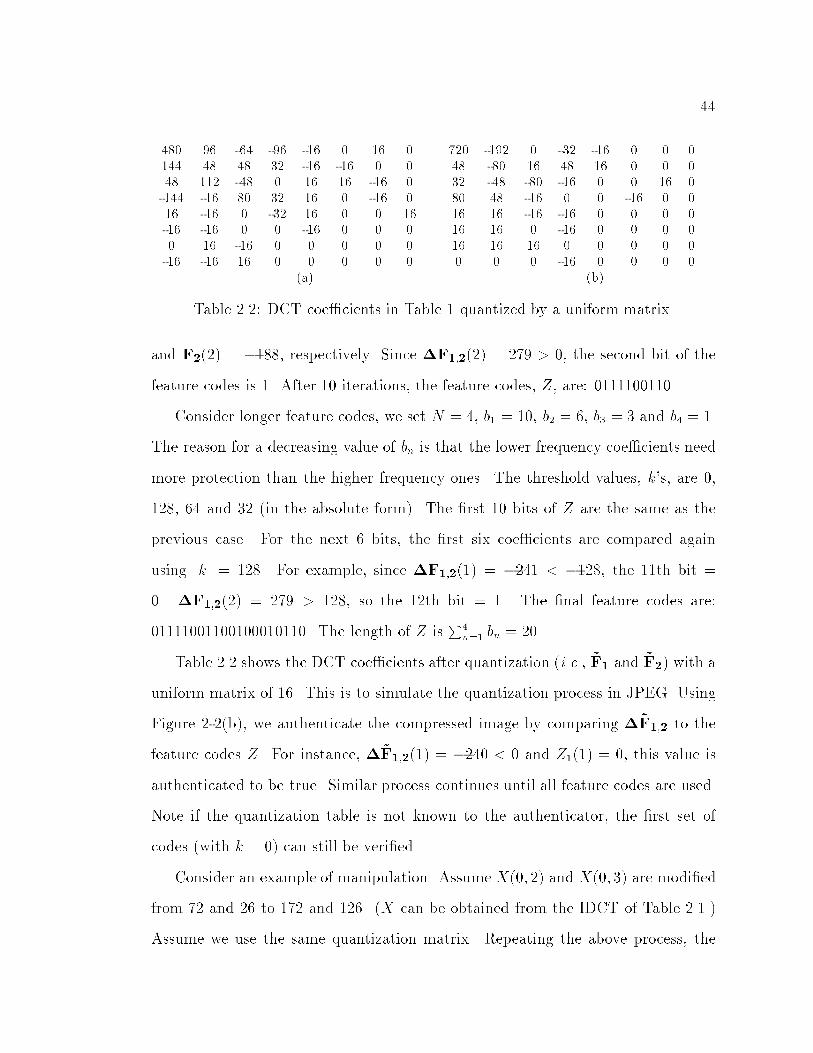
44
480 96 -64 -96 -16 0 16 0144 48 48 32 -16 -16 0 048 112 -48 0 16 16 -16 0-144 -16 80 32 16 0 -16 016 -16 0 -32 16 0 0 16-16 -16 0 0 -16 0 0 00 16 -16 0 0 0 0 0-16 -16 16 0 0 0 0 0
720 -192 0 -32 -16 0 0 048 -80 16 48 16 0 0 032 -48 -80 -16 0 0 16 080 48 -16 0 0 -16 0 016 16 -16 -16 0 0 0 016 16 0 -16 0 0 0 016 16 16 0 0 0 0 00 0 0 -16 0 0 0 0
(a) (b)
Table 2.2: DCT coe�cients in Table 1 quantized by a uniform matrix.
and F2(2) = �188, respectively. Since �F1;2(2) = 279 > 0, the second bit of the
feature codes is 1. After 10 iterations, the feature codes, Z, are: 0111100110.
Consider longer feature codes, we set N = 4, b1 = 10, b2 = 6, b3 = 3 and b4 = 1.
The reason for a decreasing value of bn is that the lower frequency coe�cients need
more protection than the higher frequency ones. The threshold values, k's, are 0,
128, 64 and 32 (in the absolute form). The �rst 10 bits of Z are the same as the
previous case. For the next 6 bits, the �rst six coe�cients are compared again
using jkj = 128. For example, since �F1;2(1) = �241 < �128, the 11th bit =
0. �F1;2(2) = 279 > 128, so the 12th bit = 1. The �nal feature codes are:
01111001100100010110. The length of Z isP4
n=1 bn = 20.
Table 2.2 shows the DCT coe�cients after quantization (i.e., ~F1 and ~F2) with a
uniform matrix of 16. This is to simulate the quantization process in JPEG. Using
Figure 2-2(b), we authenticate the compressed image by comparing �~F1;2 to the
feature codes Z. For instance, �~F1;2(1) = �240 < 0 and Z1(1) = 0, this value is
authenticated to be true. Similar process continues until all feature codes are used.
Note if the quantization table is not known to the authenticator, the �rst set of
codes (with k = 0) can still be veri�ed.
Consider an example of manipulation. Assume X(0; 2) and X(0; 3) are modi�ed
from 72 and 26 to 172 and 126. (X can be obtained from the IDCT of Table 2.1.)
Assume we use the same quantization matrix. Repeating the above process, the

45
I.
Sτ
R
S
Rn
..
.
.
..
(a)
(b)
(c)
(d)
(f)
(e)
.(g)
Figure 2-3: Conceptual illustration of `miss', `false alarm' and other scenarios.
authenticator will detect the manipulation due to the mismatch of the 4th bit of
the feature codes.
2.3.6 Color Images
In the JPEG standard, color images are considered to be in the Y CbCr format.
Chromatic components (Cb; Cr) are usually down-sampled at the rate of 2:1 (hori-
zontal direction only) or 4:1 (one-half in both horizontal and vertical directions). To
authenticate a color image, we �rst down-sample the chromatic components with
the sampling rate 4 : 1. Then, we generate the feature codes of Y , Cb, Cr in the
same way as described earlier. In the authenticator, if the chromatic components
are sampled by 2 : 1, they are subsampled again in the other direction in order to
obtain 4 : 1 subsampled color components.
2.4 Performance Analysis
The image authenticator is a manipulation detector with two types of error in-
volved: miss and false alarm[111]. `Miss' refers to the situation in which an image
is manipulated by unacceptable manipulations but the system reports the image as
authentic. `Miss' is also called Type II error in Hypotheses Testing. `False alarm'
means that the system reports the existence of manipulation while the image is, in

46
ImageMapping Function &Number of Bits in Sets
Manipulation Rounding Noise
Signature Generator �xed selected random randomAuthenticator �xed �xed random random
Attacker �xed random �xed randomSystem Evaluation random random/�xed random/�xed random
Table 2.3: Properties of di�erent system variables from viewpoints of di�erent par-ties
fact, not modi�ed by unacceptable manipulations. It is also called a Type I error. In
our authentication system, the test is based on block pairs. For each block pair, we
perform the following test: H0: the pixels in the image block pair are not modi�ed,
or modi�ed to new values that can be obtained by the JPEG compression processes.,
versus H1: the pixels in the image block pair are modi�ed to new values that can-
not be obtained by any JPEG process. The test function is de�ned in Proposition
1. Conceptual illustration of `Miss', `False alarm' and other scenarios are shown in
Figure 2-3. I represents the original image. R is the set of images obtained by JPEG
compression of I. Rn is R augmented with rounding errors in JPEG compression.
S is the set of images passing authentication. S� is the set of images passing au-
thentication allowing tolerance bounds. (a), (b) and (d) are correct authentication.
(c) is a miss. (d) is a false alarm by S but correct authenticated by S� . (e) is a
correct authentication by S but missed by S� . (f) is a false alarm. (g) is a successful
detection of manipulation.
The Probability of Miss, Pm, and the Probability of False Alarm, Pf , are esti-
mated by the signature generator and are useful to users of the authenticator. An
additional evaluation metric, the Probability of Success, Ps, can also be used from
the attacker's viewpoint. The attacker may try to manipulate the image based on
his best knowledge of the authentication technique. Detailed discussion using these
metrics will be shown in this section.
Several variables are needed to estimate these probabilities. We can classify
47
variables to three types: pre-determined values, selectable variables, and stochastic
variables. The signature generator estimates a list of Pf and Pm based on di�erent
quantization tables and tolerances. Based on the quantization table used in the
compressed image, the user may choose tolerances, � , to satisfy constraints on Pf
and Pm. Various properties of system variable from viewpoints of di�erent parties
are shown in Table 2.3.
2.4.1 Noise from the Compression Process and the Probability of False
Alarm
Rounding noise may be added during the JPEG compression process and they
may cause false alarm. In practice, computer software and hardware calculate the
DCT with �nite precision. For some cases, not only the input and the output of
DCT operations are integers, but also some of the intermediate values. This will
add rounding noise to the DCT values. In addition, some applications may drop
small values in the high frequency positions. Combining these considerations, we
can modify Eq.(2.2) to
~fp(�) = Integer Round(Fp(�) +Nd
Q(�)) +Nr; (2.14)
where Nd is the noise of DCT operation and Nr is the noise of integer rounding.
Both are random variables. Nd usually depends on speci�c implementations and
the number of recompression processes. Also, in most systems, the rounding rules
are consistent over di�erent positions and thus the e�ect of Nr can be ignored in
computing DCT coe�cient di�erences.
The Probability of False Alarm of a block pair, Pf , represents the probability
that at least one DCT di�erence value in the block pair triggers the detector in

48
Proposition 1, because of the e�ect of rounding noise. We can write Pf as
Pf = 1 �NYn=1
bnY�=b1
(1 � �n;�) �NXn=1
bnX�=b1
�n;� ; (2.15)
where �n;� is the probability that a DCT di�erence value �~Fp;q(�) triggers the
false alarm. That is,
�n;� =
8><>:
P [�~Fp;q(�)� k < �� ]; given �Fp;q(�) � k;
P [�~Fp;q(�)� k > � ]; given �Fp;q(�) < k:(2.16)
Because of symmetry, these two probabilities are the same. To calculate �n;� , we �rst
de�ne a discrete random variableN 0d;p, s.t., bfp+1
2c+N 0
d;p � Integer Round(Fp(�)+Nd;p
Q(�)) =
bFp(�)+Nd;p
Q(�) + 12c where fp =
Fp(�)
Q(�) and b�c represents the ` oor' function. N 0d;p is
the noise e�ect in the quantized coe�cient, and can be derived from the continuous
noise Nd. Its probability density function is
P [N 0d;p = nd] = P [ (nd+bfp+1
2c�fp+1
2)�Q(�) > Nd;p � (nd+bfp+1
2c�fp�1
2)�Q(�) ]:(2.17)
The probability density function of N 0d;q can be obtained in a similar way. After
some transformations from Eq. (2.16),
�n;� = P [N 0d;p �N 0
d;q < k0 � � 0 � bfp + 1
2c+ bfq + 1
2c]; (2.18)
where k0 = kQ(�) and � 0 = �
Q(�) . Then, we can obtain �n;� by using the pdf in Eq.
(2.17).
Applying Eq. (2.15), the user of image authenticator can set suitable tolerance
value � depending on the Quantization Table reconstructed from the bitstream, the
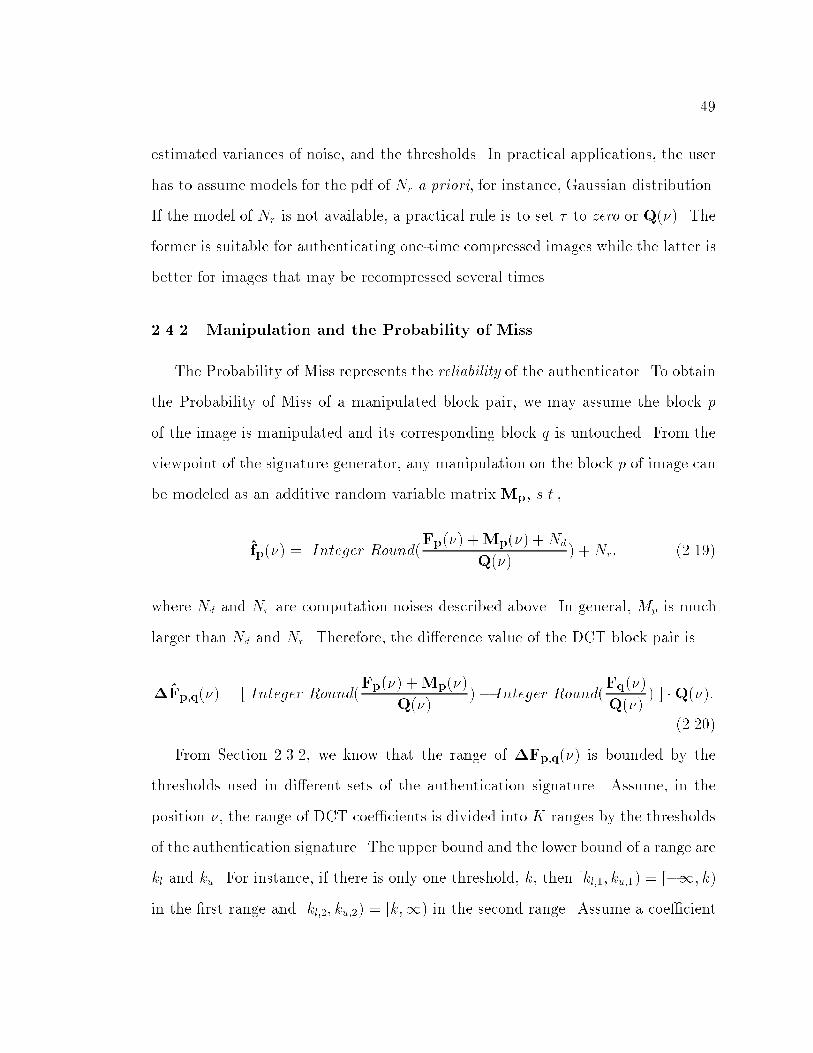
49
estimated variances of noise, and the thresholds. In practical applications, the user
has to assume models for the pdf of Nr a priori, for instance, Gaussian distribution.
If the model of Nr is not available, a practical rule is to set � to zero or Q(�). The
former is suitable for authenticating one-time compressed images while the latter is
better for images that may be recompressed several times.
2.4.2 Manipulation and the Probability of Miss
The Probability of Miss represents the reliability of the authenticator. To obtain
the Probability of Miss of a manipulated block pair, we may assume the block p
of the image is manipulated and its corresponding block q is untouched. From the
viewpoint of the signature generator, any manipulation on the block p of image can
be modeled as an additive random variable matrixMp, s.t.,
fp(�) = Integer Round(Fp(�) +Mp(�) +Nd
Q(�)) +Nr: (2.19)
where Nd and Nr are computation noises described above. In general, Mp is much
larger than Nd and Nr. Therefore, the di�erence value of the DCT block pair is
�Fp;q(�) = [ Integer Round(Fp(�) +Mp(�)
Q(�))� Integer Round(
Fq(�)
Q(�)) ] �Q(�):
(2.20)
From Section 2.3.2, we know that the range of �Fp;q(�) is bounded by the
thresholds used in di�erent sets of the authentication signature. Assume, in the
position �, the range of DCT coe�cients is divided into K ranges by the thresholds
of the authentication signature. The upper bound and the lower bound of a range are
kl and ku. For instance, if there is only one threshold, k, then [kl;1; ku;1) = [�1; k)
in the �rst range and [kl;2; ku;2) = [k;1) in the second range. Assume a coe�cient

50
�Fp;q(�) is in this range,
�Fp;q(�) 2 [ kl;�; ku;� ): (2.21)
After JPEG compression, the range of �~Fp;q(�) should be bounded by [kl;�; ku;� ]
within a tolerance level, � . Therefore, the probability that the authenticator fails
to detect a manipulation on position � of the block pair (p; q) is
�� = P [ �Fp;q(�) 2 [kl;� � �; ku;� + � ] ]; given �Fp;q(�) 2 [ kl;� ; ku;� ): (2.22)
If we consider Mp as a random variable and apply Eq. (2.20), Eq. (2.22) becomes
�� = P [ ml;� �Mp(�) � mu;� ]; (2.23)
where 8><>:
ml;� = kl;� � � + (bFq(�)Q(�)
+ 12c � 1
2) �Q(�)� Fp(�);
mu;� = ku;� + � + (bFq(�)Q(�)
+ 12c+ 1
2) �Q(�)� Fp(�):
(2.24)
Assume a bn � 1 vector Mp, which is a subset of Mp representing the selected bn
elements of Mp, has a probability density function (pdf) f(Mp). Also, assume a
range set RB, RB = fMp(�) : ml;� � Mp(�) � mu;�g;8�, to specify the accepted
range of manipulation. Then, the Probability of Miss, Pm, of a speci�c image block
pair is
Pm =ZRB
f(Mp) dMp: (2.25)
To derive Pm, we need to know the pdf of manipulation, i.e., f(Mp). We �rst
consider manipulations in the spatial domain. Since the possible manipulation to
an image block is arbitrary, from the signature generator's viewpoint, there is no
exact distribution function. However, we can assume that the manipulated image
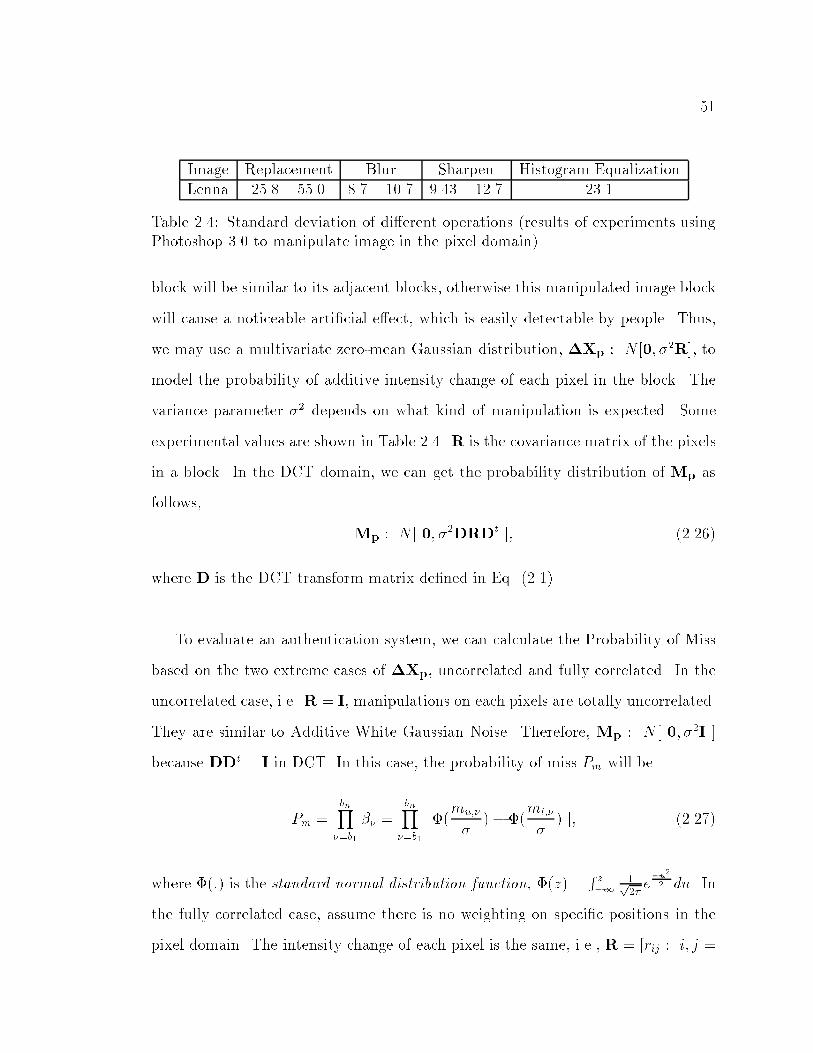
51
Image Replacement Blur Sharpen Histogram EqualizationLenna 25.8 { 55.0 8.7 { 10.7 9.43 { 12.7 23.1
Table 2.4: Standard deviation of di�erent operations (results of experiments usingPhotoshop 3.0 to manipulate image in the pixel domain)
block will be similar to its adjacent blocks, otherwise this manipulated image block
will cause a noticeable arti�cial e�ect, which is easily detectable by people. Thus,
we may use a multivariate zero-mean Gaussian distribution, �Xp : N [0; �2R], to
model the probability of additive intensity change of each pixel in the block. The
variance parameter �2 depends on what kind of manipulation is expected. Some
experimental values are shown in Table 2.4. R is the covariance matrix of the pixels
in a block. In the DCT domain, we can get the probability distribution of Mp as
follows,
Mp : N [ 0; �2DRDt ]; (2.26)
where D is the DCT transform matrix de�ned in Eq. (2.1).
To evaluate an authentication system, we can calculate the Probability of Miss
based on the two extreme cases of �Xp, uncorrelated and fully correlated. In the
uncorrelated case, i.e. R = I, manipulations on each pixels are totally uncorrelated.
They are similar to Additive White Gaussian Noise. Therefore, Mp : N [ 0; �2I ]
because DDt = I in DCT. In this case, the probability of miss Pm will be
Pm =bnY
�=b1
�� =bnY
�=b1
[ �(mu;�
�)� �(
ml;�
�) ]; (2.27)
where �(:) is the standard normal distribution function, �(z) =R z�1
1p2�e�u2
2 du. In
the fully correlated case, assume there is no weighting on speci�c positions in the
pixel domain. The intensity change of each pixel is the same, i.e., R = [rij : i; j =
52
1::64] where rij = 1. Then, Mp : N [ 0; �2R] where R = [rij : i; j = 1::64] with
r1;1 = 64 and ri;j = 0; elsewhere. In this case, Pm will be
Pm = �(mu;1
8�)� �(
ml;1
8�): (2.28)
Given a speci�c image block pair with the Quantization Table, the tolerance values,
and the thresholds, we can use Eq. (2.27), (2.28), and Table 2.4 to estimate the
range of Probability of Miss in an image block pair.
The above computation estimates the Probability of Miss for a single block pair.
In some applications, the authenticator does not need to localize the manipulation.
In these cases, the miss probability for the whole image is the product of the miss
probabilities of all manipulated block pairs.
2.4.3 The Probability of Attack Success
From the attackers' point of view, they want to know the chance of success in
attacking the authentication system. There are two kinds of attack. First, attackers
may manipulate the image to generate a new image with di�erent visual meaning. In
this case, the attacker may use replacement, deletion, or cloning to change the pixel
values. This kind of manipulation strategy attempts to blend the replaced pixels
smoothly with adjacent areas. Second, attackers may manipulate the image (or
synthesize an image) based on their knowledge about the authentication algorithm
and secret information in the signature. This strategy of is to generate a di�erent
image to fool the authenticator. Note the image content may be clearly altered
or distorted. In particular, if the attack is done in the DCT domain, noticeable
distortion usually can be found in the pixel domain. In the following, we analyze
the probabilities of success for these two types of attacks.

53
2.4.3.1 Attacks with Visual Meaning Changes
Changing visual meaning of an image is a common attack. Based on the changes
and estimation of authentication parameters, an attacker can estimate his chance of
success. For instance, DCT values of the changed blocks are known to the attacker.
If the image will not be further recompressed, the quantization table is also known.
Otherwise, he can estimate the range of success probability based on di�erent quan-
tization tables. The threshold values can be estimated by looking at the DCT values
and the signature. If this is not available, the �rst threshold value can be assumed
to be zero. The tolerance values used in the authenticator are unknown. But he
can assume some reasonable values such as zero or Q(�), and observe their e�ects
on authentication. The only random part for estimating the Probability of Success
would be the values of the DCT coe�cients in another block of the pair.
Therefore, the Probability of Success, Ps, of a manipulated block can be modeled
as
Ps =bnY�=1
� ; (2.29)
where � is the probability of success for each DCT coe�cient. We can compute �
as follows,
� =P
KfP [�Fp;q(�)� kl � ��; �Fp;q(�) � kl] +
P [�Fp;q(�) � ku � �; �Fp;q(�) < ku]g=P
KfP [ Fq(�) � (fm(�) +12 )Q(�)� kl + � ; Fq(�) � Fp(�) � kl]+
P [ Fq(�) � (fm(�) � 12)Q(�) � ku � � ; Fq(�) > Fp(�)� ku]g
�PK �;�
(2.30)
where
fm(�) = bFp(�) +Mp(�)
Q(�)+1
2c: (2.31)
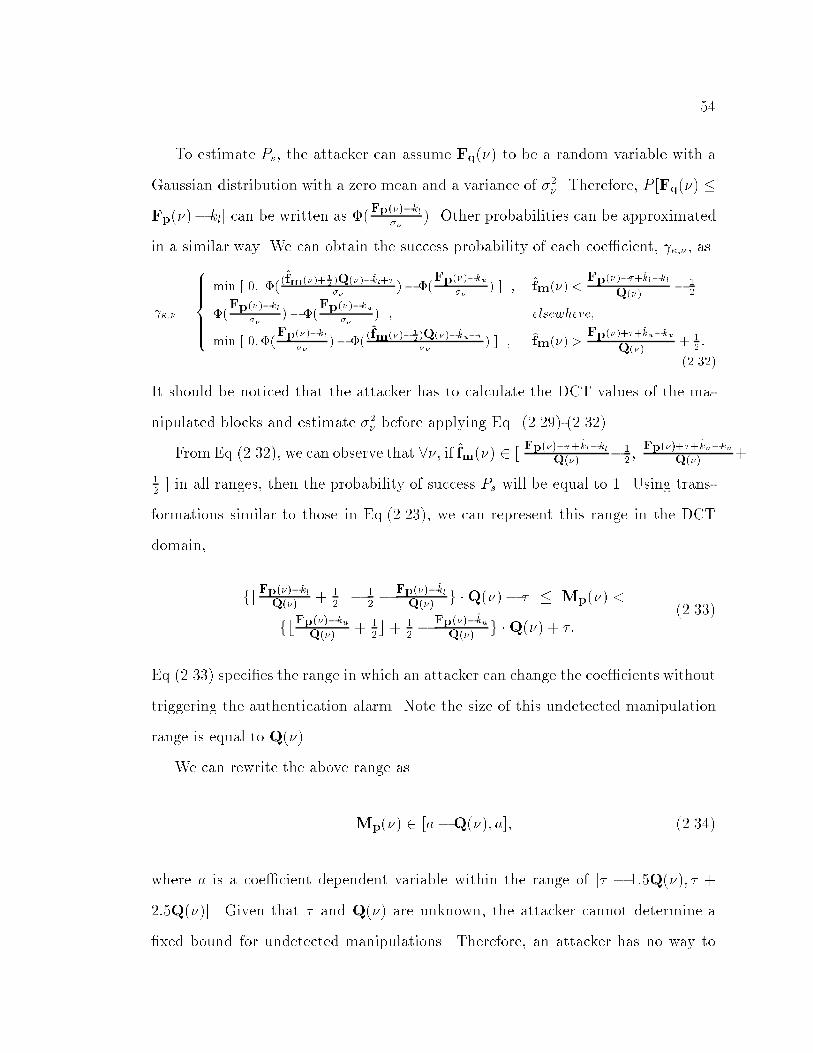
54
To estimate Ps, the attacker can assume Fq(�) to be a random variable with a
Gaussian distribution with a zero mean and a variance of �2�. Therefore, P [Fq(�) �
Fp(�)� kl] can be written as �(Fp(�)�kl
��). Other probabilities can be approximated
in a similar way. We can obtain the success probability of each coe�cient, �;� , as
�;� =
8>>>><>>>>:
min [ 0; �((fm(�)+ 1
2)Q(�)�kl+���
)� �(Fp(�)�ku
��) ] ; fm(�) <
Fp(�)��+kl�kl
Q(�)� 1
2
�(Fp(�)�kl
��) ��(
Fp(�)�ku
��) ; elsewhere;
min [ 0;�(Fp(�)�kl
��)� �(
(fm(�)� 1
2)Q(�)�ku��
��) ] ; fm(�) >
Fp(�)+�+ku�ku
Q(�)+ 1
2 :
(2.32)
It should be noticed that the attacker has to calculate the DCT values of the ma-
nipulated blocks and estimate �2� before applying Eq. (2.29)-(2.32).
FromEq.(2.32), we can observe that 8�, if fm(�) 2 [Fp(�)��+kl�kl
Q(�)�1
2;Fp(�)+�+ku�ku
Q(�)+
12] in all ranges, then the probability of success Ps will be equal to 1. Using trans-
formations similar to those in Eq.(2.23), we can represent this range in the DCT
domain,
fbFp(�)�klQ(�)+ 1
2c � 1
2� Fp(�)�kl
Q(�)g �Q(�)� � � Mp(�) <
fbFp(�)�kuQ(�)
+ 12c+ 1
2� Fp(�)�ku
Q(�)g �Q(�) + �:
(2.33)
Eq.(2.33) speci�es the range in which an attacker can change the coe�cients without
triggering the authentication alarm. Note the size of this undetected manipulation
range is equal to Q(�).
We can rewrite the above range as
Mp(�) 2 [a�Q(�); a]; (2.34)
where a is a coe�cient dependent variable within the range of [� � 1:5Q(�); � +
2:5Q(�)]. Given that � and Q(�) are unknown, the attacker cannot determine a
�xed bound for undetected manipulations. Therefore, an attacker has no way to
55
maliciously manipulate an image without taking the risk of triggering the authenti-
cation alarm.
2.4.3.2 Attacks with Knowledge of Authentication Rules
Some attackers may try to manipulate an image based on their knowledge about
the authentication techniques, but regardless of the visual meaning of the manipu-
lated image. Attackers may want to manipulate or even synthesize an image that
can fool the system without triggering the alarm. In our authentication system, the
security mechanism is based on: 1.) the private key used for the signature encryp-
tion, which ensures the signature cannot be forged; 2.) the secret transformation
mechanism and a seed to generate the mapping function for selecting the block pairs;
and 3.) the secret method and another seed used to select DCT coe�cient positions
in block pairs for comparison. In the following paragraphs, we will discuss four
possible situations, with di�erent extent of knowledge possessed by the attacker.
Security Level I: All information in the signature is secret
If all information in the signature is kept secret from the attacker, the perfor-
mance of the proposed authenticator is the highest, as analyzed in previous sections.
The only possible attack is to make a constant change to DCT coe�cients at the
same location in all blocks. We have proposed a way to solve this problem by record-
ing the mean values of DCT coe�cients as discussed in Section 2.3.2.1 and Section
2.3.3.
Security Level II: The selected DCT coe�cient positions are known
The locations of the selected block pairs and the DCT coe�cients are determined
by some secret algorithms, which are in turn driven by random seed numbers. The

56
secret algorithms are usually pre-designed by the manufacturer of the authentication
system. They can be stored as secret bytecodes embedded in the system. Therefore,
even though the random seeds can be known by the attacker, the real selected
positions are still unknown to the attacker.
In a pessimistic scenario, the attacker knows the secret algorithms and seeds
for the selected DCT coe�cients. Once he knows the real selected positions, he
can arbitrarily change the coe�cients that are not compared in the authentication
process without triggering the authentication alarm. To avoid this problem, the
authenticator can change the rule of selected positions, block by block, in a more
complicated method. Furthermore, if this threat persists, the signature generator
can eventually use all the 64 DCT coe�cients in each block.
Security Level III: The mapping function of block pairs is known
Once the mapping function is known, the attacker also knows the DCT di�er-
ences for each pair of blocks. For example, if only the sign of the DCT di�erences
are used for authentication, and the attacker knows �Fp;q(�) = 10 in the original
compressed image, he can manipulate this value to �Fp;q(�) = 60, which will not
be detected by the authenticator. In this case, multiple threshold sets, k, should
be used because they can protect each coe�cient with a higher accuracy. Although
the DCT di�erences are known to the attacker, he still cannot manipulate those
DCT coe�cients too much, because the allowed degree of manipulation is reduced
as more bits (i.e., smaller k values) are used.
Security Level IV: The private key used for signature encryption is known
The use of private key ensures that only the right source can generate the
authentication signature. In the extreme hypothetical case, the private key used
57
by the original source may be known to the attacker. This is a general problem
for any secure communication and is out of the scope of this paper. However, one
possible way to solve this problem is to ask the original source to register and store
its signature in a trustable institution. The institution stamps a digital postmark
on the signature to prove its receiving time and its originality. Therefore, the forged
signature will be considered invalid because its originality cannot be proven.
It is also worth noting that subjective inspection may provide another means
of protecting the image authenticity. The attacker may try to develop special ma-
nipulations in the DCT domain in order to break the proposed scheme. But at the
same time, it is di�cult for the attacker to control the resulting artifacts in the pixel
domain. These artifacts may be very obvious to humans, even as they are able to
circumvent the authentication process.
2.5 Experimental Results
2.5.1 Experiments
In evaluating the proposed image authenticator, we test di�erent manipulations
on the well-known `Lenna' image. The original image is shown in Figure 2-4(a).
In our experiment, the authentication results together with the DCT coe�cients
F are sent to an IDCT to convert those coe�cients to the pixel domain. Those
blocks detected as manipulated will be highlighted, with the highlight intensity
proportional to the number of manipulated coe�cients in that block. Therefore,
the more coe�cients modi�ed, the brighter this block will be. 10 bits per block pair
are used in generating the signature codes.
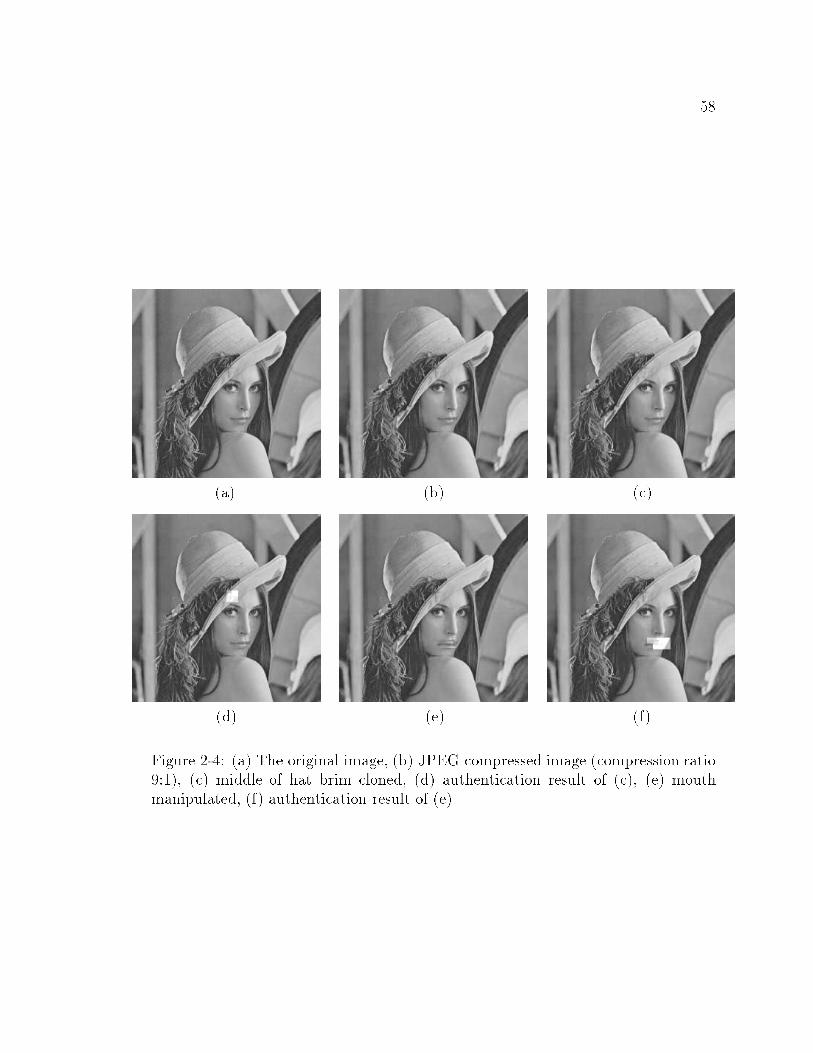
58
(a) (b) (c)
(d) (e) (f)
Figure 2-4: (a) The original image, (b) JPEG compressed image (compression ratio9:1), (c) middle of hat brim cloned, (d) authentication result of (c), (e) mouthmanipulated, (f) authentication result of (e).
59
Experiment 1: Lossy Compression
The `Lenna' image is compressed with compression a ratio 9 : 1. The authenti-
cation signature is generated based on the original `Lenna' image. The compressed
bitstream is sent to the system for authentication. The tolerance bound of the au-
thenticator is set to � = 0, since no integral rounding is involved. As previously
predicted, the authenticator will verify the compressed image as authentic and de-
compress this image perfectly. The authentication result is shown in Figure 2-4(b).
Experiment 2: Recompression and Integer Rounding
The original image is compressed with a compression ratio 6 : 1. Then, this
image is decompressed by Photoshop, rounded to integral values, and recompressed
into an image with compression ratio 9 : 1. In this case, if we use � = Q(�), the
recompression process (9:1) will not trigger the manipulation detector and the �nal
compressed image is still veri�ed as authentic. The �nal decoded image is similar
to Figure 2-4(b).
Experiment 3: Detection of Manipulation
The third experiment is made by manipulating the image by deleting the feather
fringe hanging over the hat brim, just above Lenna's right eye. This feather area
(16�16 pixels) is removed and cloned by its neighboring pixels. This image is shown
in Figure 2-4(c). The authentication result is shown in Figure 2-4(d). It is clearly
shown that the manipulated part has been detected as fake; it is highlighted by the
authenticator. The other example is shown in Figure 2-4(e). In this image, Lenna's
mouth was ipped in the vertical direction. Its authentication result is shown in
Figure 2-4(f).
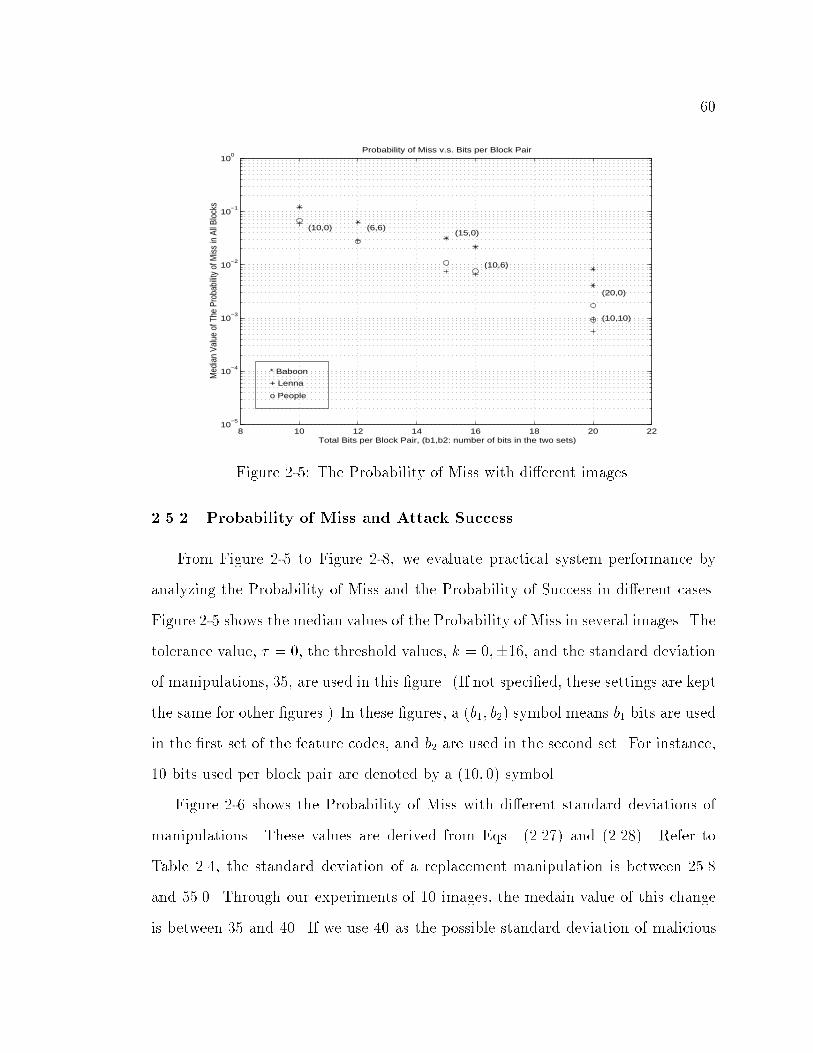
60
8 10 12 14 16 18 20 2210
−5
10−4
10−3
10−2
10−1
100
(10,0) (6,6)(15,0)
(10,6)
(20,0)
(10,10)
* Baboon
+ Lenna
o People
Probability of Miss v.s. Bits per Block Pair
Total Bits per Block Pair, (b1,b2: number of bits in the two sets)
Med
ian
Valu
e of
The
Pro
babi
lity
of M
iss
in A
ll Bl
ocks
Figure 2-5: The Probability of Miss with di�erent images.
2.5.2 Probability of Miss and Attack Success
From Figure 2-5 to Figure 2-8, we evaluate practical system performance by
analyzing the Probability of Miss and the Probability of Success in di�erent cases.
Figure 2-5 shows the median values of the Probability of Miss in several images. The
tolerance value, � = 0; the threshold values, k = 0;�16, and the standard deviation
of manipulations, 35, are used in this �gure. (If not speci�ed, these settings are kept
the same for other �gures.) In these �gures, a (b1; b2) symbol means b1 bits are used
in the �rst set of the feature codes, and b2 are used in the second set. For instance,
10 bits used per block pair are denoted by a (10; 0) symbol.
Figure 2-6 shows the Probability of Miss with di�erent standard deviations of
manipulations. These values are derived from Eqs. (2.27) and (2.28). Refer to
Table 2.4, the standard deviation of a replacement manipulation is between 25.8
and 55.0. Through our experiments of 10 images, the medain value of this change
is between 35 and 40. If we use 40 as the possible standard deviation of malicious
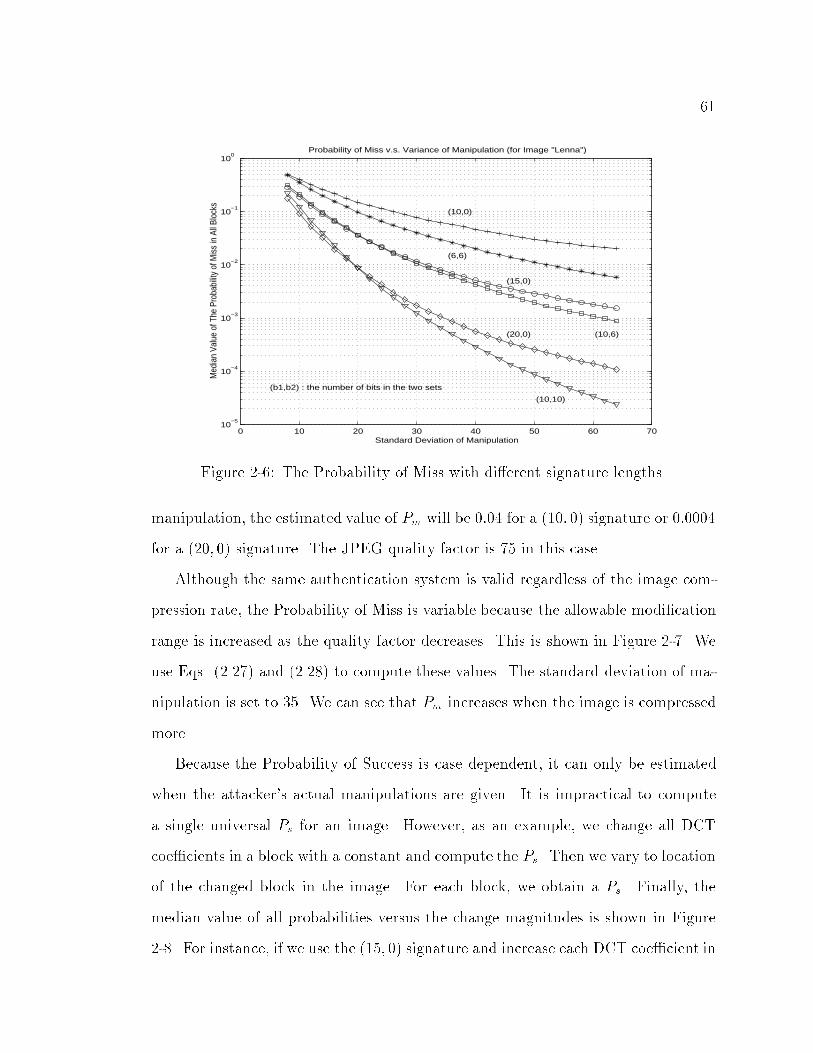
61
0 10 20 30 40 50 60 7010
−5
10−4
10−3
10−2
10−1
100
(10,0)
(6,6)
(15,0)
(10,6)(20,0)
(10,10)
(b1,b2) : the number of bits in the two sets
Probability of Miss v.s. Variance of Manipulation (for Image "Lenna")
Standard Deviation of Manipulation
Med
ian
Valu
e of
The
Pro
babi
lity
of M
iss
in A
ll Bl
ocks
Figure 2-6: The Probability of Miss with di�erent signature lengths.
manipulation, the estimated value of Pm will be 0:04 for a (10; 0) signature or 0:0004
for a (20; 0) signature. The JPEG quality factor is 75 in this case.
Although the same authentication system is valid regardless of the image com-
pression rate, the Probability of Miss is variable because the allowable modi�cation
range is increased as the quality factor decreases. This is shown in Figure 2-7. We
use Eqs. (2.27) and (2.28) to compute these values. The standard deviation of ma-
nipulation is set to 35. We can see that Pm increases when the image is compressed
more.
Because the Probability of Success is case dependent, it can only be estimated
when the attacker's actual manipulations are given. It is impractical to compute
a single universal Ps for an image. However, as an example, we change all DCT
coe�cients in a block with a constant and compute the Ps. Then we vary to location
of the changed block in the image. For each block, we obtain a Ps. Finally, the
median value of all probabilities versus the change magnitudes is shown in Figure
2-8. For instance, if we use the (15; 0) signature and increase each DCT coe�cient in

62
0 10 20 30 40 50 60 70 80 90 10010
−5
10−4
10−3
10−2
10−1
100
Probability of Miss v.s. JPEG Quality Factor
Med
ian
Valu
es o
f Pro
babi
lity
of M
iss
JPEG Quality Factor
(10,0)
(6,6)
(15,0)
(10,6)
(20,0)
(10,10)
Figure 2-7: The Probability of Miss of images with di�erent JPEG quality factors
−30 −20 −10 0 10 20 3010
−5
10−4
10−3
10−2
10−1
100
Probability of Success v.s. Manipulation Value
Med
ian
Valu
es o
f Pro
babi
lity
of S
ucce
ss
Manipulated Value
(10,0)
(6,6)
(15,0)
(10,6)
(20,0)
(10,10)
Figure 2-8: The Probability of Success with di�erent manipulation values
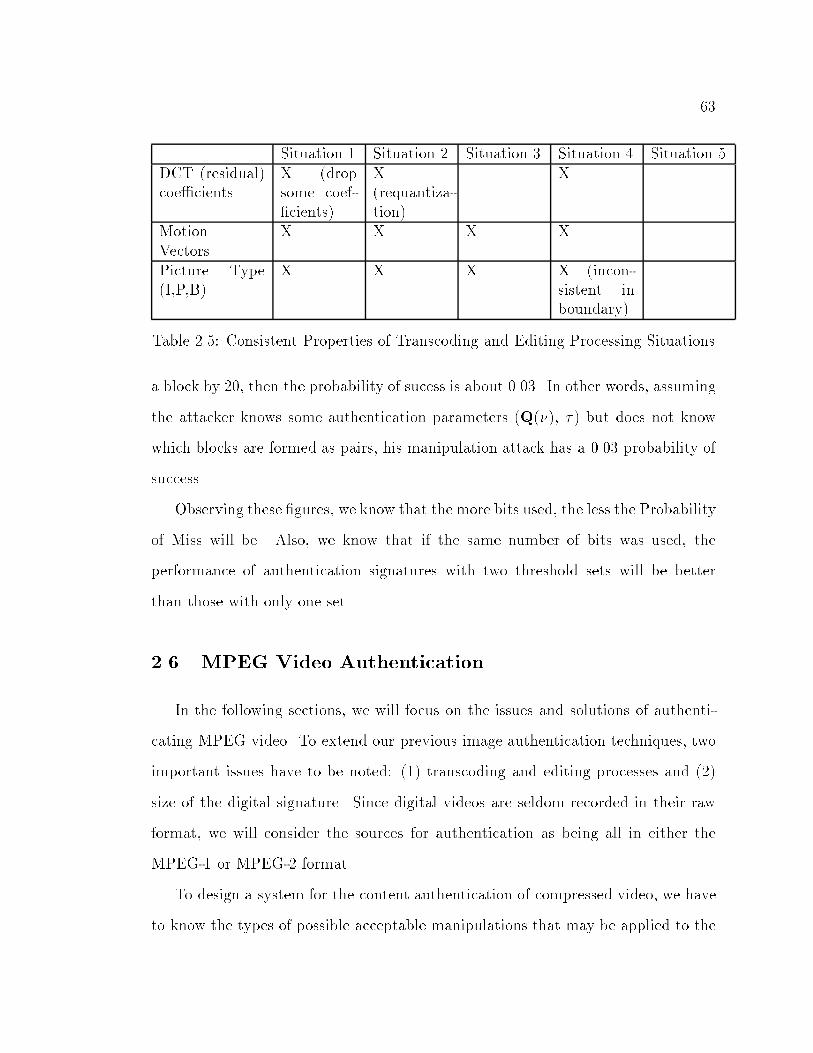
63
Situation 1 Situation 2 Situation 3 Situation 4 Situation 5DCT (residual)coe�cients
X (dropsome coef-�cients)
X(requantiza-tion)
X
MotionVectors
X X X X
Picture Type(I,P,B)
X X X X (incon-sistent inboundary)
Table 2.5: Consistent Properties of Transcoding and Editing Processing Situations
a block by 20, then the probability of sucess is about 0.03. In other words, assuming
the attacker knows some authentication parameters (Q(�), � ) but does not know
which blocks are formed as pairs, his manipulation attack has a 0.03 probability of
success.
Observing these �gures, we know that the more bits used, the less the Probability
of Miss will be. Also, we know that if the same number of bits was used, the
performance of authentication signatures with two threshold sets will be better
than those with only one set.
2.6 MPEG Video Authentication
In the following sections, we will focus on the issues and solutions of authenti-
cating MPEG video. To extend our previous image authentication techniques, two
important issues have to be noted: (1) transcoding and editing processes and (2)
size of the digital signature. Since digital videos are seldom recorded in their raw
format, we will consider the sources for authentication as being all in either the
MPEG-1 or MPEG-2 format.
To design a system for the content authentication of compressed video, we have
to know the types of possible acceptable manipulations that may be applied to the

64
video. In general, �ve acceptable transcoding or editing processing situations may
be applied to the compressed video:
1. Dynamic Rate Shaping[38, 55]: A real-time rate-control scheme in the com-
pressed domain. This technique sets dynamic control points to drop the high-
frequency DCT coe�cients on each 8 � 8 block in a macroblock. Motion
vectors are not changed.
2. Rate Control without Drift Error Correction[128, 37]: This technique is also
applied in the compressed domain. DCT coe�cients are re-quantized to satisfy
di�erent bit-rate constraints. Motion vectors are not changed.
3. Rate Control with Drift Error Correction[125]: This technique improves the
video quality after the requantization of DCT coe�cients, but it needs more
computation. DCT coe�cients of the residue of intercoded blocks are modi�ed
to satisfy the change of the re-quantized intracoded blocks. Motion vectors
are not changed in this case.
4. Editing with Mostly Consistent Picture Types[125, 138, 96]: The picture types
(I, P and B) are kept unchanged in each editing generation. It may be used in
creating a new sequence by cutting and pasting several video segments. The
GOP (Group of Pictures) boundaries in each segment are not changed except
those near the cut positions. Pixel values may be changed for video quality
improvement such as intensity change, �ltering, etc..
5. Editing or Transcoding with Inconsistent Picture Types[125]: In some pro-
cesses, the compressed videos are transformed to the uncompressed bitstreams
which are then edited and re-encoded. The GOP structures and the motion
vectors may change in this case. This kind of process includes format trans-
mission between di�erent compression standards and picture type conversion.

65
The �rst three processes are used for bitrate changes. They are all operated
in the compressed domain. In other words, the structure of the MPEG Program
Streams do not change. From Table 2.5, we can know that after these transcoding
processes, the motion vectors and the picture types are preserved. The only change
is on either the DCT coe�cients of the intra macroblocks or the DCT residual
coe�cients of the non-intra macroblocks.
In studios, cutting and pasting several MPEG video segments to create a new
video sequence is very common. It can be done with two di�erent methods, Pro-
cessing Situation 4 and Processing Situation 5. Their di�erence is basically whether
the GOP structure is preserved through the editing process. In Situation 4, there
are two kinds of GOP in the generated video sequence: original GOPs and created
GOPs. An original GOP comes from an original video sequence with its structure
intact. The created GOPs are generated from the boundary pictures of the original
video sequence(s). There may be no created GOPs if the video sequence is not
allowed to be cut inside a GOP. In practice, the number of created GOPs is much
smaller than that of original GOPs (a typical GOP is about 0.5 second). For this
situation, we focus on authentication of the original GOPs.
Video authentication signatures can be generated for di�erent situations. We
can �nd that for Situation 1-4, the GOP structure is not modi�ed after transcoding
or editing processes. Therefore, we can generate a robust digital signature which
can survive these acceptable manipulations. We called this a Type I robust digital
signature, which will be discussed in Section 2.7.1.
For Situation 5, because the GOP structure has been destroyed, only the pixel
values of pictures will be preserved. Therefore, the video sequence is like a set
of image frames, which can be authenticated by the image authentication that we
proposed in Section 2.3. We call this a Type II robust digital signature. The

66
generation method is shown in Section 2.7.2.
2.6.1 Syntax of a MEPG Video Sequence
In the MPEG standard, each Video Sequence is composed of several sequential
Group of Pictures (GOP). A GOP is an independent unit which includes several
Pictures. In MPEG-1, each frame is a Picture. In MPEG-2, a Picture can be either
a Field-Picture or a Frame-Picture. There are several Slices in a Picture. A Slice is
a string of consecutive MacroBlocks (MBs) of arbitrary length running from left to
right across the picture. The MB is the 16 � 16 motion compensation unit which
includes several 8 � 8 Blocks. (An MB includes 6 blocks with the 4:2:0 chroma
format, 8 blocks with the 4:2:2 chroma format, or 12 blocks with the 4:4:4 chroma
format.) Each block is either Intra-coded or Non-Intra-coded. In MPEG, as with
JPEG, Intra-coded blocks have their DC coe�cients coded di�erently with respect to
the previous block of the same YCbCr type, unless the previous block is Non-Intra,
belongs to a skipped macroblock (MB), or belongs to another Slice[48]. The AC
coe�cients of each block in a macroblock is quantized by the quantization step size
which is given by
(� �Q[m][n])=(8 � v); m; n = 0; 1; ::7; m+ n 6= 0; (2.35)
where � is the quantizer scale and Q is the quantization matrix which is either the
Intra Qmatrix for Intra blocks or the NonIntra Qmatrix for Non-Intra blocks.
Both blocks may be de�ned in the V ideoSequence Header if they are di�erent from
the default values. (In the 4:2:0 format, the luminance and chrominance Q-matrices
are always the same. But they can be di�erent in the 4:2:2 or 4:4:4 formats.) The
parameter v is equal to 1 for MPEG-1 video sequences, or 2 for MPEG-2 video
sequences. The quantizer scale, �, is set for a Slice or a MB.

67
ED
MED
M
z
z
c
m
P blockdata
othersP
feature codesgenerator
Hash
Zc
DigitalSignaturePrivate Key
Encryption
P blockdata
othersPED
M
Picture 1
GOP
ZmHash
Header
Picture N
z
z
m
cfeature codesgenerator
Hash
Figure 2-9: Robust Digital Signature : Type I
2.7 Robust Digital Signature
2.7.1 Robust Digital Signature: Type I
In Section 2.3, we have shown that the relationship between a coe�cient pair, i.e.,
two DCT coe�cients of the same coordinate position, in any two 8� 8 blocks of an
image should remain the same or become equal after the re-quantization processes,
if the same quantization step sizes are applied on the blocks. We have also shown
that the change of the di�erence value of a coe�cient pair after re-quantization
should be bounded in a range speci�ed by the quantization step sizes, which can
be di�erent, of the blocks. Therefore, we can arrange all the blocks in an image to
form block pairs, and generate some codes to represent the relationship status of
coe�cients in selected coordinate positions. The generated codes are then encrypted
by public key method to form a digital signature.
To generate a robust digital signature for Processing Situations 1-4, we can use
the quantized (intra or non-intra) DCT coe�cients of the luminance and chromi-
nance matrices in each macroblock to form comparison pairs. Since the � value as
well as the quantization step size is always the same in all blocks of a macroblock,
the relative relationships of the coe�cients at the corresponding positions of blocks

68
are invariant during transcoding. Therefore, similar to the signature generation pro-
cess of images, we can use them to generate feature codes. First, the feature codes
Zc of a macroblock can be written as,
zc = V LC([p
[b
sgn[ fp(b)� fW (p)(b) ] ) (2.36)
where
� f represents the quantized DCT coe�cients in the compressed video sequence.
They should be extracted from the bitstream and decoded with Variable
Length Decoding (VLD).
� p is the set of the selected blocks in the macroblock, and W is the mapping
function which maps each block at p to its corresponding block for forming a
block pair. For instance, in a 4:2:0 format, if we label the 4 luminance blocks
and the two chrominance as Block 1-6, then we can choose p as f1; 3; 5g and aset q = W (p) = f2; 4; 6g which forms three block pairs of Block f1; 2g, f3; 4gand f5; 6g. For a macroblock of } blocks, there will be }! combinations.
� b is the set of the selected DCT coe�cient positions. They are represents
by the zig-zag order or alternative scan order whichever is used in the Video
Sequence. For instance, if we choose to compare the DC values and the 1
- 5 AC coe�cients in a block pair, then the b will be f1; 2; 3; 4; 5; 6g. The
selection of b can vary for di�erent block pairs.
� the sign function is de�ned as (1) sgn(f) = 1; if f > 0, (2) sgn(f) = 0; if f =
0, and (3) sgn(f) = �1; if f < 0.
It should be noted that here we use the sign function to represent the di�erence
values because there are lots of zeros in the DCT coe�cients of the compressed

69
video sequence. From the viewpoints of information, we should distinguish it from
the other two situations, i.e., positive and negative. This is di�erent from what we
have done for the images[73, 72]. Because there are lots of zeros in the coe�cient
comparison results, the VLC method can be applied to reduce the length of the
feature codes.
In addition to the protection of DCT coe�cients, we need to protect other in-
formation including the motion vectors and control codes as well. This can be done
by adding the hash values of the remnant bitstreams in the video sequence to the
feature codes. At the �rst step, assume a Picture P, P includes Pblock data and Pothers,
where Pblock data includes the codes of DCT coe�cients, the quantizer scale in the
Slice or MB header, and their control codes. Pothers includes all other codes in P .
Then, we can get the hash values as,
zm = Hash(Pothers) (2.37)
where zm is used for protecting other information of a Picture.
Because the GOP is the basic independent unit of a Video Sequence in the
MPEG bitstream, we can encrypt the feature codes and the hash values of each
pictures in a GOP to form a digital signature, i.e.,
DS = Private Key Encrypted(Zc; Zm) (2.38)
where Zc =SPictures V LC(
SMBs zc) is a combination of the feature codes zc of all
the macroblocks in the GOP, and
Zm = Hash(GOP Header; zm;1; zm;2; :::; zm;N) (2.39)
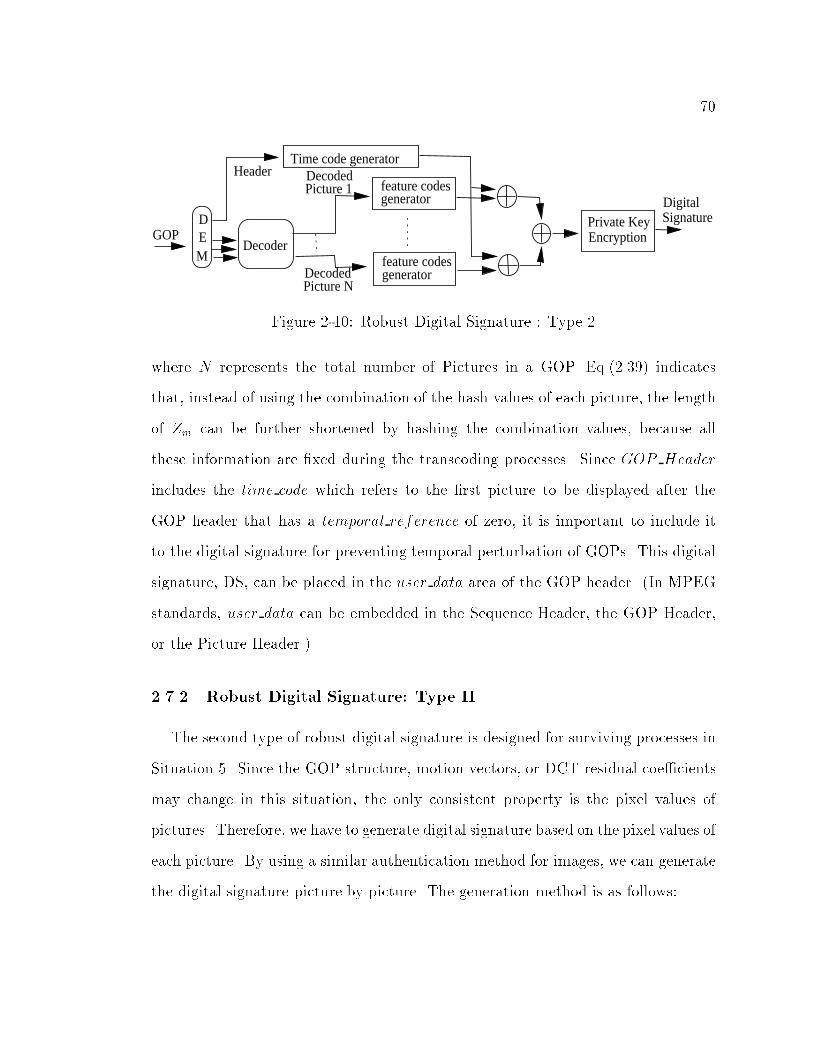
70
ED
M feature codesgenerator
feature codesgenerator Digital
SignaturePrivate KeyEncryptionGOP
Decoder
HeaderPicture 1Decoded
DecodedPicture N
Time code generator
Figure 2-10: Robust Digital Signature : Type 2
where N represents the total number of Pictures in a GOP. Eq.(2.39) indicates
that, instead of using the combination of the hash values of each picture, the length
of Zm can be further shortened by hashing the combination values, because all
these information are �xed during the transcoding processes. Since GOP Header
includes the time code which refers to the �rst picture to be displayed after the
GOP header that has a temporal reference of zero, it is important to include it
to the digital signature for preventing temporal perturbation of GOPs. This digital
signature, DS, can be placed in the user data area of the GOP header. (In MPEG
standards, user data can be embedded in the Sequence Header, the GOP Header,
or the Picture Header.)
2.7.2 Robust Digital Signature: Type II
The second type of robust digital signature is designed for surviving processes in
Situation 5. Since the GOP structure, motion vectors, or DCT residual coe�cients
may change in this situation, the only consistent property is the pixel values of
pictures. Therefore, we have to generate digital signature based on the pixel values of
each picture. By using a similar authentication method for images, we can generate
the digital signature picture by picture. The generation method is as follows:

71
1. Reconstruct the pixel values of the picture of any kind of picture type (I, P,
B).
2. Generate feature codes by using exactly the same procedure as we proposed
in Section 2.3, i.e., dividing the image into 8 � 8 blocks, forming block pairs,
comparing the DCT coe�cients at the block pair, using one bit to represent
each comparison.
3. Add time codes of each picture to the feature codes.
4. Using the Private Key Encryption to form the digital signature.
A diagram of the generating this type of robust digital signature is shown on Figure
2-10.
2.8 Authenticator
2.8.1 Authenticating Video Sequence after Transcoding (Situations 1-3)
The authenticator can be implemented as an augmentation of the general de-
coder. In the authenticator, the digital signature is extracted from the GOP header
and decrypted to get the feature codes and the hash values. For examining the
authenticity of a GOP in the video sequence, similar to the processes of signature
generation, each picture in the GOP is divided into two parts: Pblock data and Pothers.
We then authenticate these two parts separately. To authenticate the hash values,
we can get the Zm of the GOP by using the same hash function(s) in the Eq. (2.37)
and Eq. (2.39). Since this part of information is intact during the transcoding
processes, Zm is expected to be equal to Zm. Otherwise, this GOP must have been
modi�ed by some other processes.

72
To authenticate the feature codes of GOP, the authenticator must �rst apply the
VLC decoding to the feature codes to obtain the signs of the relationship of selected
coe�cients in each block pair. By applying a similar procedure of the authenticator
we proposed on [73, 72], we can authenticate whether the DCT coe�cients have
been maliciously modi�ed because:
� in Situation 1, some DCT high frequency coe�cients in a block may be
dropped and set to zero. Referring to the Theorem 1 in Section 2.3, if two
DCT coe�cients are both equal to zero after transcoding, the authenticator
considers them as authentic. Because the lower frequency coe�cients are pre-
served during transcoding, their relationships will be exactly the same as the
original.
� in Situation 2, the DCT coe�cients may be requantized to satisfy some bitrate
constraints. Since all the DCT coe�cients at the same position of the blocks
in a MB are always quantized by the same quantization step size, according
to the same theorem in Section 2.3, the possible changes of the sign values
of the di�erence of a coe�cient pair are: \positive to positive," \positive to
zero," \zero to zero," \negative to negative," and \negative to zero." If we
�nd the relationships of the coe�cients do not satisfy this rule, we can claim
that the video sequence has been modi�ed by other manipulations.
� in Situation 3, the DCT coe�cients of the intra blocks may be requantized.
Also, the DCT residue coe�cients of the non-intra blocks may be changed to
compensate the quantization error introduced by the requantization of their
reference blocks, and then be requantized again. To authenticate these blocks,
we can introduce some tolerance bound to the authenticator. If we de�ne
�fp;q(b) = fp(b) � fW (p)(b), which is the di�erence of the coe�cients at the

73
position b in the block pair (p;W (p)) of the original video, and �fp;q(b) =
fp(b)�fW (p)(b), which is from the examined video. Then, the following property
has to be satis�ed,
if �fp;q(b) > 0; then �fp;q(b) � ��; (2.40)
else if �fp;q(b) = 0; then � � �fp;q(b) � ��; (2.41)
else if �fp;q(b) < 0; then �fp;q(b) � �: (2.42)
where
� =
8><>:
0; intrablock;
1 +Pi�refi �Qrefi
(b)
��Qnonintra(b); nonintrablock
(2.43)
In Eq. (2.43), � is the quantizer scale of the nonintra blocks p and q in the
examined video sequence. The set i represents the number of reference blocks,
e:g:, i = f1g for a non-intra block in the �rst P picture of GOP, or i = f1; 2gfor a non-intra block in the second P picture of GOP. The parameters �refi
and Qrefi are the quantizer scale and the quantization matrix of the i-th
reference block, respectively. (For a bi-directional predicted non-intra block,
we have to use the average of the �ref � Qref from its two reference blocks.)
The proof of Eq.(2.43) is shown in [78]. Similar to the previous situations,
the authenticator can examine the coe�cients by Eq.(2.40)-(2.42). If they are
not satis�ed, we know that the video sequence must have been modi�ed by
unacceptable manipulations.
In addition to the manipulations within the GOPs, an attacker may perturb the
temporal order of GOPs to change the meaning of video sequence. This manipu-
lation can be detected by examining the time codes on the GOP Header that are
protected in the digital signature. Changes of temporal order of pictures in a GOP

74
can be detected because both feature codes and hash values of the digital signature
are generated in the order of pictures.
2.8.2 Authenticating Video Sequence after Editing (Situations 4 and 5)
The Type I robust digital signature is used in the Situation 4. In this situation,
there are two kinds of GOP in the generated video sequence: original GOPs and
created GOPs. For an original GOP that comes from an original video sequence
with its structure intact, it has its independent digital signature which can be ex-
amined by the same authentication method described earlier. The created GOPs
are generated from the boundary pictures of the segments of the original video se-
quence(s). There may be no created GOPs if we restrict the video sequence cannot
be cut inside a GOP. This means splicing can only be performed to a resolution of
about half a second[14]. If this restriction can not be satis�ed, in a created GOP,
type conversions may be applied on some pictures [96]. In an compressed video edi-
tor, if the digital signature of the corresponding source GOP is copied to the header
of the created GOP, then those pictures without type conversions as well as all the
intracoded macroblocks can be examined. The authenticator cannot examine those
pictures with type conversions. Otherwise, if the digital signature is not copied to
the created GOP, there is no clue for examining the authenticity. In general, we
can neglect these boundary pictures and show that they are not examined. It ad-
dition to authenticating video sequences after cutting and pasting in the temporal
segments, some other editing processes such as intensity enhancement, cropping,
scaling, �ltering, etc. may be applied in the video sequences. The robustness of our
proposed digital signature towards these manipulations has been shown in [75].
For Situation 5 (video cut & paste or transcoding), all pixel values in each
picture may change. However, the changes are like noises and are usually small

75
such that they do not change the meaning of video content. As we have discussed
in [75], small noise-like changes in the spatial domain result in small changes in the
DCT domain, too. Therefore, large changes in the DCT domain can be assumed to
be from malicious manipulations. We can authenticate each picture by some pre-
determined tolerance values, � , in the authenticator. Applying Eq.(2.40)-(2.42), if
all the coe�cient pairs satisfy the equations, we can claim that authenticity of the
examined video sequences.
Because there is no exact tolerance bound for changes caused by transcoding or
editing of Situation 5, the authenticator can only indicate some areas of a picture
\may have been" maliciously manipulated. This is done by observing the authenti-
cation result of the picture with di�erent tolerance values. For instance, if � = 0, we
may �nd the authenticator considers a large percentage of blocks in the picture as
being manipulated. However, as � increases, we can observe that most false-alarms
will disappear and only areas that are actually maliciously manipulated are detected
by the authenticator.
The time codes that are included in the digital signature can be used to detect
changes in the temporal order and indicate the pixel values in the picture of the
speci�c time. Since the video sequence is authenticated picture by picture, its
authenticity can still be examined even if it was re-encoded with di�erent temporal
resolution.
2.9 Experimental Results and Discussion
Several video sequences have been tested with our proposed algorithms by using
two di�erent digital signatures. Our purpose is to evaluate the probability of miss-
ing a malicious manipulation by minimizing the probability of falsely reporting a
manipulation. Through 20 more practical experiments on a video sequence \train"

76
5 10 15 20 25 30 35 40 45 5010
−8
10−7
10−6
10−5
10−4
10−3
10−2
10−1
100
Frame Number
Med
ian
Valu
e of
The
Pro
babi
lity
of M
iss
in A
ll Bl
ock
Pairs
The Probability of Miss of Digital Signature I
Mstd=10
Mstd=20
Mstd=30
Mstd=40
Figure 2-11: The Probability of Miss of Digital Signature I
(e.g., transcoding in di�erent rates, editing with cut and paste, object substitutions,
etc.), we found that in Situations 1,2, and 4, there was no false alarm with tolerance
values, � = 0, and in Situation 3 and 5, there was no false alarm with � = 2. With
those settings, the authenticator can detect all object substitution manipulations.
Further system performance analysis can be done by estimating the probability
of miss. The details of the statistical analysis are shown in [78]. In Figure 2-11,
we show an example of the probability of miss of the video sequence \train", which
includes 50 frames. From Figure 2-11, we can observe them with four di�erent
manipulation levels in terms of the standanrd deviation of Gaussian distributed
manipulation changes in the blocks. In this example, we use six coe�cients com-
pared in a block pair. For the typical level of manipulation in the range of 30 -
40 (shown in Section 2.4), we can see the probabilities of miss of frames are within
the range of 10�7 to 10�3. Those are all quite small. By examining the original
video sequence, I frames or P frames with more intra blocks have larger probability
of miss. That comes from the fact that intra blocks have more nonzero coe�cients

77
5 10 15 20 25 30 35 40 45 5010
−8
10−7
10−6
10−5
10−4
10−3
10−2
10−1
100
Frame Number
Med
ian
Valu
e of
The
Pro
babi
lity
of M
iss
in A
ll Bl
ock
Pairs
The Probability of Miss of Digital Signature II
Mstd=10
Mstd=20
Mstd=30
Mstd=40
Figure 2-12: The Probability of Miss of Digital Signature II
that are more insensitivie to manipulations. From Figure 2-12, we can �nd that the
probabilities of miss of Digital Signature Type II are larger than those in Figure
2-11. The probability of miss is in the range of 10�4 to 10�2. There are two reasons
for this phenomeon. The �rst one is because all the blocks are decompressed and
all of them are considered as the intra blocks. The second reason is the use of a
larger tolerance value (� = 2), which reduces the probability of false alarm but also
increases the probability of miss.
2.10 Conclusion
In this chapter, we have proposed an image authentication technique that distin-
guishes the JPEG lossy baseline compression from other malicious manipulations.
In practical applications, images may be compressed and decompressed several times
and still considered as authentic. Some manipulations, e.g., integral value rounding,
color space transformation and cropping, are also considered acceptable in some ap-

78
plications. We propose a technique that allows JPEG lossy compression but prevents
malicious manipulations. Our proposed technique can be customized to accommo-
date di�erent requirements and accept \desirable" manipulations. Our extensive
analytic and empirical performance analysis has shown the e�ectiveness of this sys-
tem.
Using practical simulations and mathematical analyses, we have examined the
e�ectiveness of the proposed digital signature algorithms for MPEG video authen-
tication. Our technique can distinguish compression from malicious manipulations.
It solves the blind trustworthy problem of interim entities and makes video content
authentication feasible. In the future, we will investigate issues in the MPEG audio
content authentication for a complete multimedia content authentication system.
2.11 Proof of Theorems in Chapter 2
2.11.1 Proof of Theorem 1 and Theorem 2
Proof 1 8a; b; c 2 <, assume a = A + r(a), b = B + r(b), and c = C + r(c),
where A;B;C 2 Z are the rounding integers of a,b,c, respectively, and �0:5 �r(a); r(b); r(c) < 0:5.
Assume a� b > c, then
A+ r(a)�B � r(b) > C + r(c): (2.44)
Therefore,
A�B � C > r(c) + r(b)� r(a): (2.45)
If c is an integer, i.e., r(c) = 0, then
A�B � C > �1:0; (2.46)

79
Since A;B;C are integers,
A�B � C: (2.47)
If r(c) 6= 0, then �1:5 < r(c) + r(b) � r(a) < 1:5. Since A;B;C 2 Z,
A�B � C � 1: (2.48)
Theorem 1 can be proved by substituting a byFp(u;v)
Q(u;v) , A by~Fp(u;v)
Q(u;v) , b byFq(u;v)
Q(u;v) ,
B by~Fq(u;v)
Q(u;v), c by 0, and with every parameter multiplied by Q(u; v). In Theorem
2, Eq.(3.3) can be proved by the same parameter substitutions except c is replaced
by kQ(u;v)
and C is replaced by ~ku;v . Eq.(3.4) and eq.(3.5) can be proved by using
similar methods.
2
In some software implementations, the integer rounding process is replaced by
the truncation process. In this case, Theorem 1 and 2 are still valid. They can be
proved by Proof 2 with the same parameter substitutions as in Proof 1.
Proof 2 8a; b; c 2 <, assume a = A + r(a), b = B + r(b), and c = C +
r(c), where A;B;C 2 Z are the truncated integers of a,b,c, respectively, and 0 �r(a); r(b); r(c) < 1. Similarly, in the case that a � b > c, i.e., A � B � C >
r(c) + r(b)� r(a),
if c is an integer, then �1:0 < r(c) + r(b)� r(a) < 1:0. Therefore,
A�B � C: (2.49)
If r(c) 6= 0, then �1 < r(c) + r(b)� r(a) < 2. Since A;B;C 2 Z,
A�B � C � 0 > �1; (2.50)
80
therefore,
A�B � C; (2.51)
which satis�es A�B � C � 1.
2
2.11.2 Variable Quantization Tables
In some image/video compression techniques, di�erent quantization tables
are used in di�erent image blocks for adaptive compression rate control, such as in
MPEG or later JPEG standards. In these cases, the proposed image authentication
techniques can be extended by the following theorem.
Theorem 3 Use the parameters de�ned in Theorem 1, except ~Fp is de�ned as
~Fp(�) � Integer Round(Fp(�)
Qp(�)) � Qp(�) and ~Fp(�) � Integer Round(
Fq(�)
Qq(�)) �
Qq(�), where Qp and Qq are quantization tables for blocks Fp and Fq respectively.
Assume a �xed threshold k 2 <. The following properties hold:
� if �Fp;q(�) � k, then �~Fp;q(�) � k � 12(Qp(�) +Qq(�)),
� else if �Fp;q(�) < k, then �~Fp;q(�) � k + 12(Qp(�) +Qq(�)).
2
We rede�ne Eq. (2.11) as
k =
8><>:
k + 12(Qp(�) +Qq(�)); if Zn(�) = 0; i:e:; �Fp;q(�) < k;
k � 12(Qp(�) +Qq(�)); if Zn(�) = 1; i:e:; �Fp;q(�) � k:
In other words, if �Fp;q(�) < k, then �Fp;q(�)� k � 0 must be satis�ed.

81
Except the above modi�cations, the authentication system designed for the vari-
able quantization table cases would be the same as the proposed system for the case
with equal quantization tables. A detailed discussion of this case is in [71].
82
Chapter 3
Using Semi-Fragile Watermarks to Generate
Self-Authentication-and-Recovery Images
3.1 Introduction
In this chapter, we propose a semi-fragile watermarking technique that accepts
JPEG lossy compression on the watermarked image to a pre-determined quality
factor, and rejects malicious attacks. The authenticator can identify the posi-
tions of corrupted blocks, and recover them with approximations of the original
ones. In addition to JPEG compression, adjustments of the brightness of the im-
age within reasonable ranges are also acceptable using the proposed authenticator.
The security of the proposed method is achieved by using the secret block map-
ping function which controls the signature generating/embedding processes. Our
Self-Authentication-and-Recovery Images (SARI) authenticator is based on two in-
variant properties of quantization-based lossy compression. They are deterministic
so that no probabilistic decision is needed in the system. The �rst property shows
that if we modify a DCT coe�cient to an integral multiple of a quantization step,
which is larger than the steps used in later JPEG compressions, then this coe�cient
can be exactly reconstructed after later acceptable JPEG compression. The second
83
one is the invariant relationship between two coe�cients in a block pair before and
after JPEG compression. We can use the second property to generate the authen-
tication signature, and use the �rst property to embed it as a watermark. These
properties provide solutions to two major challenges in developing authentication
watermarks (a.k.a., integrity watermarks): how to extract short, invariant and ro-
bust information to substitute fragile hash functions, and how to embed information
that is guaranteed to survive quantization-based lossy compression to an acceptable
extent. Because the �rst property almost reaches maximum zero-error embedding
capacity, in addition to authentication signatures, we can also embed the recovery
bits for recovering approximate pixel values in corrupted areas. Our authenticator
utilizes the compressed bitstream, and thus avoids rounding errors in reconstructing
DCT coe�cients. SARI has been extensively tested through real application soft-
ware, e.g., Photoshop, XV, Paint Shop Pro, etc., in various testing environments.
Experimental results showed the e�ectiveness of this system.
� Previous Techniques for Robust Authentication and Content Authen-
tication
Content authentication techniques are based on either digital signature or water-
mark. A detailed list of multimedia authentication research papers can be found
in [79]. Using digital signature, Schneider and Chang �rst proposed the concept of
salient feature extraction and similarity measure for image content authentication
[112]. They also discussed issues of embedding such signatures into the image. How-
ever, their work lacked a comprehensive analysis of adequate features and embedding
schemes.
Bhattacha and Kutter proposed a method which extracts \salient" image feature
points by using a scale interaction model and Mexican-Hat wavelets [11]. They gen-
84
erated digital signature based on the location of these feature points. The advantage
of this technique was the e�ciency in its signature length. But it lacked a rigorous
mechanism to select visually interesting points. This technique's ability to detect
crop-and-replace manipulations and its robustness through lossy compressions was
questionable.
Queluz proposed techniques to generate digital signature based on moments and
edges of an image[108]. Using moments as features ignores the spatial information.
Images can be manipulated without changing their moments. Edge-based features
may be a good choice for image authentication because the contour of objects should
be consistent during acceptable manipulations. However, it still has several open
issues such as the excessive signature length, the consistency of edge detection, and
the robustness to color manipulation.
Previously, we have developed authentication signatures that can distinguish
JPEG/MPEG compression from malicious manipulations in Chapter 2. Our au-
thentication signature is an encrypted feature vector generated from the invariant
relationship between DCT coe�cients in separate blocks of an image. We proved
that this relationship is preserved when the DCT coe�cients are quantized or re-
quantized in the JPEG/MPEG processes. Because the feature codes are generated
based on the inherent characteristics of JPEG/MPEG processes, they can e�ectively
distinguish such compressions from unacceptable manipulations, especially the crop-
and-replacement attacks. The probability of falsely reporting JPEG/MPEG com-
pression as attacks is negligible. Other acceptable attacks, e.g., brightness and
contrast enhancement, scaling, noise addition, can also be accepted by relaxing a
tolerance threshold in the authenticator.
Using watermarking, Zhu et. al. proposed a method by which measurement of
the error between the watermarked image and the manipulated image determined

85
authenticity [149]. They estimated a masking function from the image, and used
it to measure distortion. Their method added imperceptible changes to the image.
It is not clear that whether this estimated masking function would be the same in
the watermarked image and in the images with acceptable manipulation. Further,
it may not provide the information of error measurement, because the masking
function would change if the image is manipulated by pixel replacement.
Wolfgang and Delp developed an authentication method that embeds bipolar
m-sequence into blocks[140]. This method can localize manipulation, and showed
moderate robustness. But, its watermarks are generated from the checksum of pixel
values excluding LSB. Because acceptable compression may result in the change in
the LSB as well as other bits, a larger probability of false alarm may appear in the
system.
Fridrich proposed a robust watermarking technique for authentication [42][43].
He divided images to 64 pixel� 64 pixel blocks. For each block, quasi-VQ codes were
embedded using the spread spectrum method. This technique was robust to ma-
nipulations. But, comparing his experiments in [42] and in [43], we saw that JPEG
compressions result in more error than pixel replacement. It is unclear whether this
method can detect small area modi�cation or distinguishes JPEG compression from
malicious manipulations.
� Proposed Approaches
In this chapter, we present a watermarking technique for embedding our previously
proposed authentication signatures into images. Such signature-based image wa-
termarks need to satisfy the following criteria. (1) The watermark extracted from
the watermarked image should match the authentication signature of the water-
marked image. This may be di�erent from the original signature extracted from the

86
un-watermarked image. To achieve this, some iterations may be needed in imple-
mentation. (2) The signature and the watermark consist of two layers of protection.
Malicious attacks will destroy either layer or both layers. Acceptable manipulations
should preserve both layers. The performance of an authentication system depends
on these two layers.
We propose a semi-fragile watermarking technique that accepts some acceptable
manipulations such as JPEG lossy compression and reasonable brightness adjust-
ment on the watermarked image to a pre-determined quality factor, and rejects
crop-and-replacement processes. Images with excessive compression rate are con-
sidered un-authentic due to poor quality. The authenticator can identify the position
of corrupted blocks and even recover them with approximations of the originals. Se-
curity of the method is achieved by using a secret block mapping function which
indicates the formation of block pairs and signature/watermarking groups.
Our authenticator is based on the invariant properties of DCT coe�cients be-
fore and after the JPEG compression. These properties are guaranteed so that no
probabilistic decision is needed. The �rst property shows if we quantize a DCT
coe�cient to a reference value, then this pre-quantized coe�cient can be exactly
reconstructed after subsequent JPEG compression, if the original quantized step
is larger than the one used in the JPEG compression. We utilize this property to
embed signature as watermarks. The second property is the invariant relationship
of two coe�cients in a block pair. We use this property to form the authentication
bits of signature. In addition to these properties, two methods are applied in practi-
cal system design: (1) the authentication process utilizes the compressed bitstream
to reconstruct the quantized DCT coe�cients without going back to the pixel do-
main, and (2) the embedding process recursively applies integral DCT and Inverse
DCT until the designated DCT values can be directly obtained from integer pixel
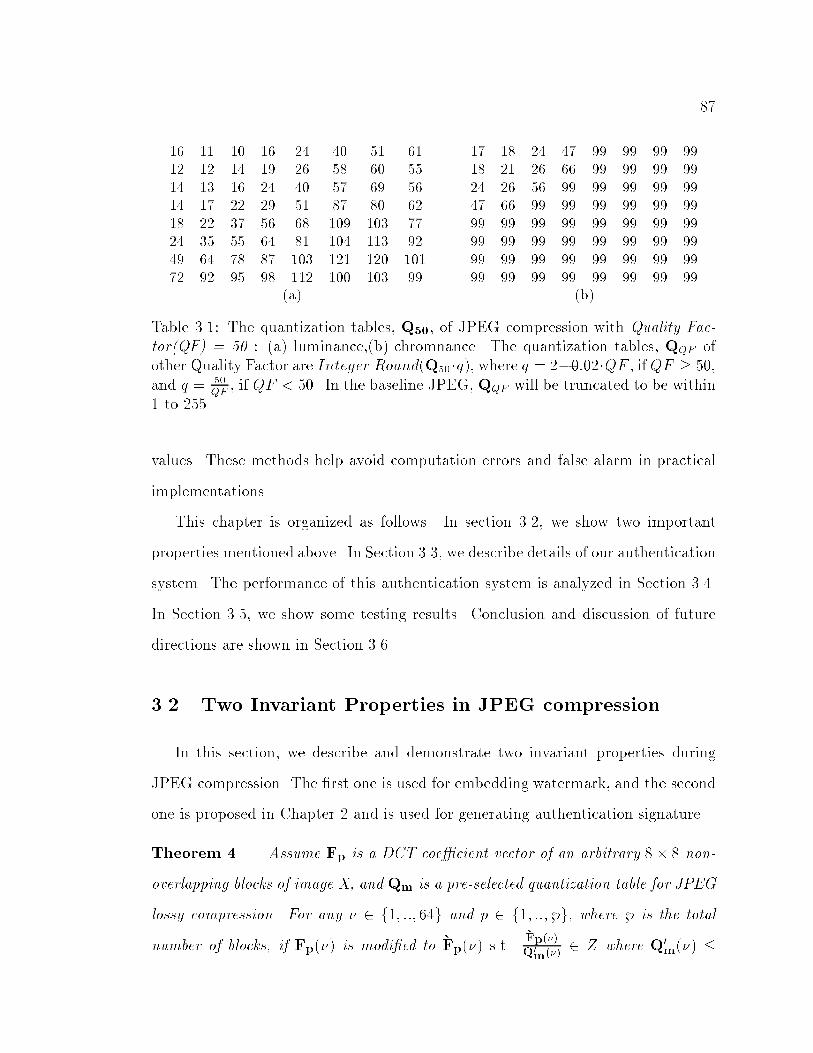
87
16 11 10 16 24 40 51 6112 12 14 19 26 58 60 5514 13 16 24 40 57 69 5614 17 22 29 51 87 80 6218 22 37 56 68 109 103 7724 35 55 64 81 104 113 9249 64 78 87 103 121 120 10172 92 95 98 112 100 103 99
17 18 24 47 99 99 99 9918 21 26 66 99 99 99 9924 26 56 99 99 99 99 9947 66 99 99 99 99 99 9999 99 99 99 99 99 99 9999 99 99 99 99 99 99 9999 99 99 99 99 99 99 9999 99 99 99 99 99 99 99
(a) (b)
Table 3.1: The quantization tables, Q50, of JPEG compression with Quality Fac-tor(QF) = 50 : (a) luminance,(b) chromnance. The quantization tables, QQF ofother Quality Factor are Integer Round(Q50�q), where q = 2�0:02�QF , ifQF � 50,and q = 50
QF, if QF < 50. In the baseline JPEG, QQF will be truncated to be within
1 to 255.
values. These methods help avoid computation errors and false alarm in practical
implementations.
This chapter is organized as follows. In section 3.2, we show two important
properties mentioned above. In Section 3.3, we describe details of our authentication
system. The performance of this authentication system is analyzed in Section 3.4.
In Section 3.5, we show some testing results. Conclusion and discussion of future
directions are shown in Section 3.6.
3.2 Two Invariant Properties in JPEG compression
In this section, we describe and demonstrate two invariant properties during
JPEG compression. The �rst one is used for embedding watermark, and the second
one is proposed in Chapter 2 and is used for generating authentication signature.
Theorem 4 Assume Fp is a DCT coe�cient vector of an arbitrary 8� 8 non-
overlapping blocks of image X, and Qm is a pre-selected quantization table for JPEG
lossy compression. For any � 2 f1; ::; 64g and p 2 f1; ::; }g, where } is the total
number of blocks, if Fp(�) is modi�ed to �Fp(�) s.t.�Fp(�)
Q0
m(�) 2 Z where Q0m(�) �

88
Qm(�), and de�ne ~Fp(�) � Integer Round(�Fp(�)
Q(�)) �Q(�) for any Q(�) � Qm(�),
the following property holds:
Integer Round(~Fp(�)
Q0m(�)
) �Q0m(�) = �Fp(�) (3.1)
2
Proof of Theorem 4: See Section 3.7.
Theorem 4 shows that if a DCT coe�cient is modi�ed to an integral multiple of
a pre-selected quantization step, Q0m, which is larger than all possible quantization
steps in subsequent acceptable JPEG compression, then this modi�ed coe�cient
can be exactly reconstructed after future acceptable JPEG compression. It is recon-
structed by quantizing the subsequent coe�cient again using the same quantization
step, Q0m. We call such exactly reconstructible coe�cients, �Fp, \reference coe�-
cients."
We �rst de�ne the meaning of acceptable JPEG compression. Table 3.1 shows
that quantization tables of JPEG compression for all quality factors. From Table
3.1, we know that
QQF(�) � Qm(�); 8� 2 f1; ::64g and QF � m: (3.2)
In other words, the higher QF (quality factor) is, the smaller the quantization step
is. In Eq. (3.2), the equality will still hold even if QF > m, because of integer
rounding (shown in the description of Table 1). In general, JPEG recommends a
quality factor of 75-95 for visually indistinguishable quality di�erence, and a quality
factor of 50-75 for merely acceptable quality[60]. If we adopt this recommendation
and set the quantization table, Q50, as a quality threshold for acceptable JPEG
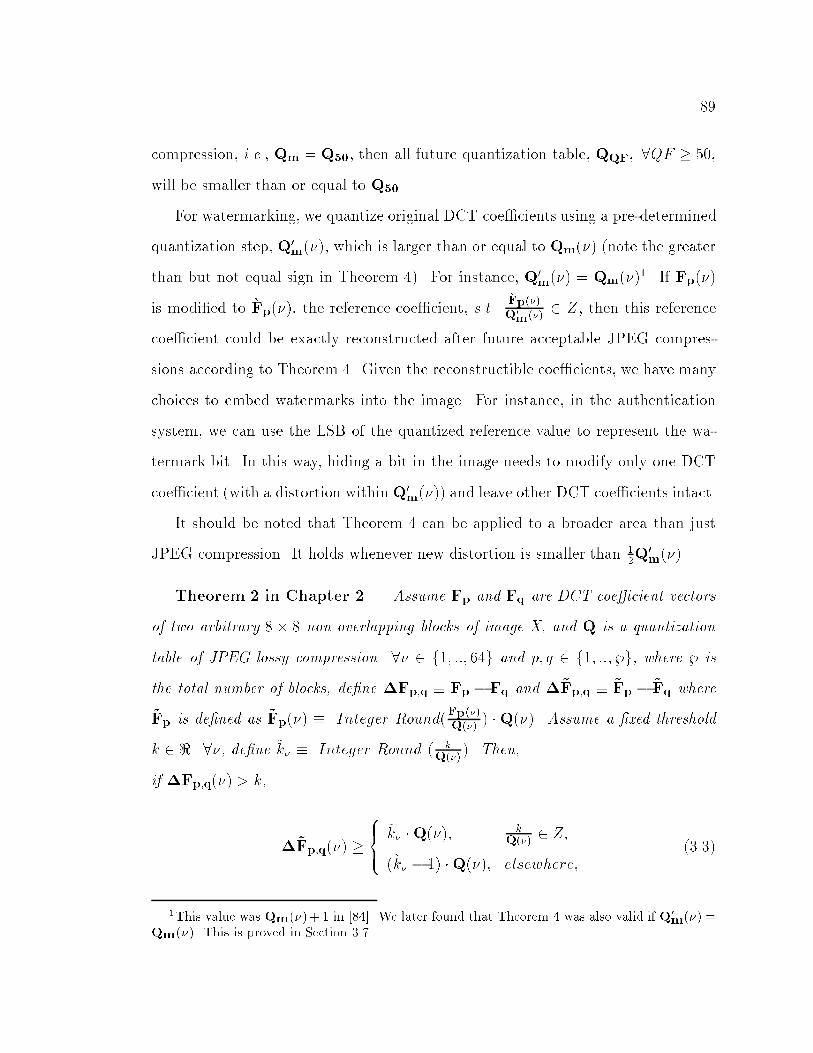
89
compression, i.e., Qm = Q50, then all future quantization table, QQF; 8QF � 50,
will be smaller than or equal to Q50.
For watermarking, we quantize original DCT coe�cients using a pre-determined
quantization step, Q0m(�), which is larger than or equal to Qm(�) (note the greater
than but not equal sign in Theorem 4). For instance, Q0m(�) = Qm(�)1. If Fp(�)
is modi�ed to �Fp(�), the reference coe�cient, s.t.�Fp(�)
Q0
m(�) 2 Z, then this reference
coe�cient could be exactly reconstructed after future acceptable JPEG compres-
sions according to Theorem 4. Given the reconstructible coe�cients, we have many
choices to embed watermarks into the image. For instance, in the authentication
system, we can use the LSB of the quantized reference value to represent the wa-
termark bit. In this way, hiding a bit in the image needs to modify only one DCT
coe�cient (with a distortion within Q0m(�)) and leave other DCT coe�cients intact.
It should be noted that Theorem 4 can be applied to a broader area than just
JPEG compression. It holds whenever new distortion is smaller than 12Q
0m(�).
Theorem 2 in Chapter 2 Assume Fp and Fq are DCT coe�cient vectors
of two arbitrary 8 � 8 non-overlapping blocks of image X, and Q is a quantization
table of JPEG lossy compression. 8� 2 f1; ::; 64g and p; q 2 f1; ::; }g, where } is
the total number of blocks, de�ne �Fp;q � Fp � Fq and �~Fp;q � ~Fp � ~Fq where
~Fp is de�ned as ~Fp(�) � Integer Round(Fp(�)
Q(�)) �Q(�). Assume a �xed threshold
k 2 <. 8�, de�ne ~k� � Integer Round ( kQ(�)
). Then,
if �Fp;q(�) > k,
�~Fp;q(�) �8><>:
~k� �Q(�); kQ(�) 2 Z;
(~k� � 1) �Q(�); elsewhere;(3.3)
1This value was Qm(�)+ 1 in [84]. We later found that Theorem 4 was also valid if Q0
m(�) =Qm(�). This is proved in Section 3.7.
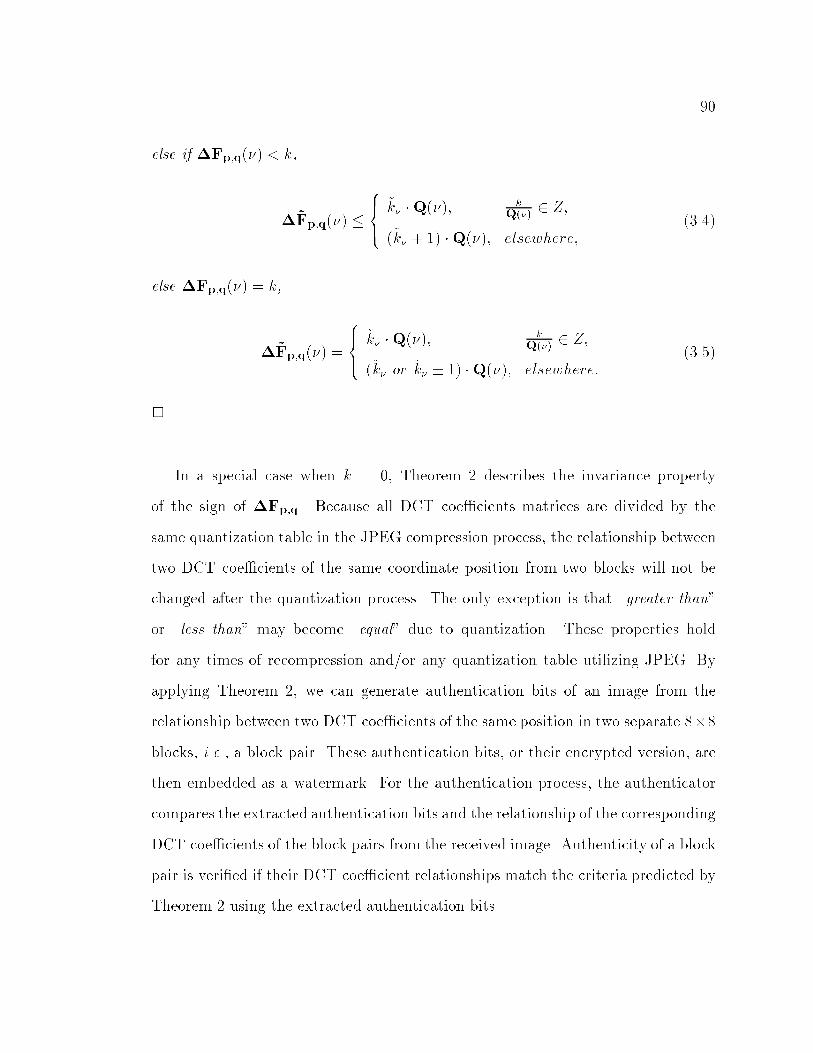
90
else if �Fp;q(�) < k,
�~Fp;q(�) �8><>:
~k� �Q(�); kQ(�)2 Z;
(~k� + 1) �Q(�); elsewhere;(3.4)
else �Fp;q(�) = k,
�~Fp;q(�) =
8><>:
~k� �Q(�); kQ(�)2 Z;
(~k� or ~k� � 1) �Q(�); elsewhere:(3.5)
2
In a special case when k = 0, Theorem 2 describes the invariance property
of the sign of �Fp;q. Because all DCT coe�cients matrices are divided by the
same quantization table in the JPEG compression process, the relationship between
two DCT coe�cients of the same coordinate position from two blocks will not be
changed after the quantization process. The only exception is that \greater than"
or \less than" may become \equal" due to quantization. These properties hold
for any times of recompression and/or any quantization table utilizing JPEG. By
applying Theorem 2, we can generate authentication bits of an image from the
relationship between two DCT coe�cients of the same position in two separate 8�8blocks, i.e., a block pair. These authentication bits, or their encrypted version, are
then embedded as a watermark. For the authentication process, the authenticator
compares the extracted authentication bits and the relationship of the corresponding
DCT coe�cients of the block pairs from the received image. Authenticity of a block
pair is veri�ed if their DCT coe�cient relationships match the criteria predicted by
Theorem 2 using the extracted authentication bits.
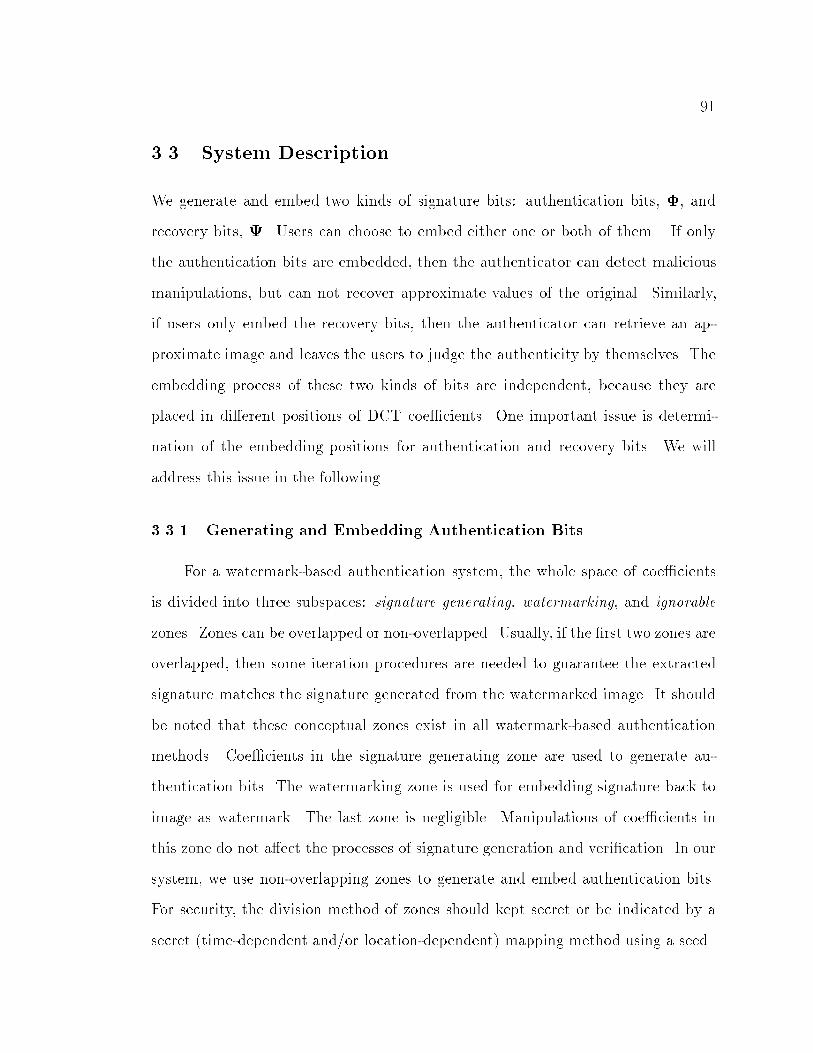
91
3.3 System Description
We generate and embed two kinds of signature bits: authentication bits, �, and
recovery bits, . Users can choose to embed either one or both of them . If only
the authentication bits are embedded, then the authenticator can detect malicious
manipulations, but can not recover approximate values of the original. Similarly,
if users only embed the recovery bits, then the authenticator can retrieve an ap-
proximate image and leaves the users to judge the authenticity by themselves. The
embedding process of these two kinds of bits are independent, because they are
placed in di�erent positions of DCT coe�cients. One important issue is determi-
nation of the embedding positions for authentication and recovery bits. We will
address this issue in the following.
3.3.1 Generating and Embedding Authentication Bits
For a watermark-based authentication system, the whole space of coe�cients
is divided into three subspaces: signature generating, watermarking, and ignorable
zones. Zones can be overlapped or non-overlapped. Usually, if the �rst two zones are
overlapped, then some iteration procedures are needed to guarantee the extracted
signature matches the signature generated from the watermarked image. It should
be noted that these conceptual zones exist in all watermark-based authentication
methods. Coe�cients in the signature generating zone are used to generate au-
thentication bits. The watermarking zone is used for embedding signature back to
image as watermark. The last zone is negligible. Manipulations of coe�cients in
this zone do not a�ect the processes of signature generation and veri�cation. In our
system, we use non-overlapping zones to generate and embed authentication bits.
For security, the division method of zones should kept secret or be indicated by a
secret (time-dependent and/or location-dependent) mapping method using a seed.

92
Figure 3-1: Embedding authentication bits in the image based on the mappingfunctions
We use a signature generation method we proposed in Chapter 2. Similar to the
JPEG process, images are �rst divided to 8 � 8 blocks. Then, blocks are formed
into block pairs using a pre-determined secret mapping function, Tb. For instance,
for a block p, we use Tb to choose a counterpart block to form a block pair, such
that q = Tb(p). For each block pair, we pre-select �a out of 64 positions in the
zigzag order, and denote these positions as a set, Bp, which represents the signature
generating zone of the block pair (p; q). Then, we generate their authentication bits,
�p, such that
�p(�) =
8><>:
1; �Fp;q(�) � 0
0; �Fp;q(�) < 0;(3.6)
where � 2 Bp.
Figure 3-1 shows the process for embedding authentication bits. To embed the
authentication bits, the system has to set a threshold for acceptable JPEG quality
factor, m, a mapping function, Ta, and sets Ep that indicate the watermarking zone
of each block. Each Ep includes12�a positions (since there are two blocks in a pair for
embedding). For instance, if �a = 6, then each block has to embed 3 authentication
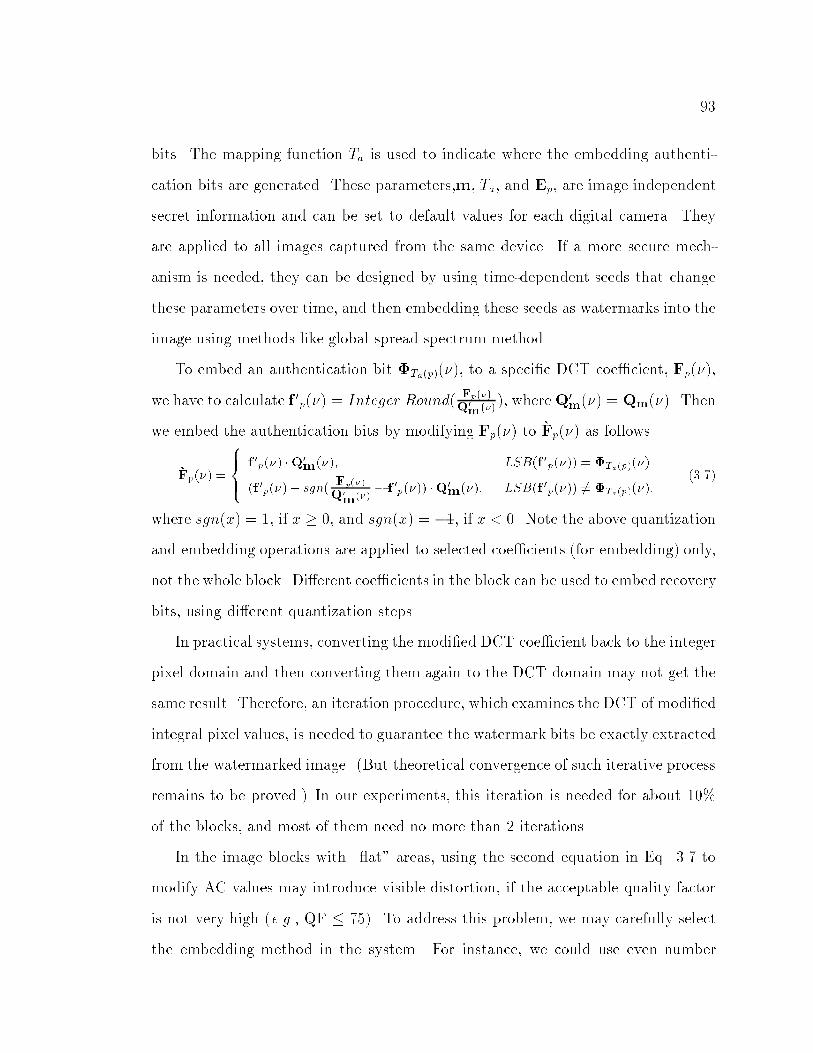
93
bits. The mapping function Ta is used to indicate where the embedding authenti-
cation bits are generated. These parameters,m, Ta, and Ep, are image independent
secret information and can be set to default values for each digital camera. They
are applied to all images captured from the same device. If a more secure mech-
anism is needed, they can be designed by using time-dependent seeds that change
these parameters over time, and then embedding these seeds as watermarks into the
image using methods like global spread spectrum method.
To embed an authentication bit �Ta(p)(�), to a speci�c DCT coe�cient, Fp(�),
we have to calculate f 0p(�) = Integer Round( Fp(�)Q0
m(�)), whereQ0m(�) = Qm(�). Then
we embed the authentication bits by modifying Fp(�) to �Fp(�) as follows
�Fp(�) =
8><>:
f 0p(�) �Q0
m(�); LSB(f 0p(�)) = �Ta(p)(�)
(f 0p(�) + sgn( Fp(�)
Q0
m(�)� f 0p(�)) �Q0
m(�); LSB(f 0p(�)) 6= �Ta(p)(�);(3.7)
where sgn(x) = 1, if x � 0, and sgn(x) = �1, if x < 0. Note the above quantization
and embedding operations are applied to selected coe�cients (for embedding) only,
not the whole block. Di�erent coe�cients in the block can be used to embed recovery
bits, using di�erent quantization steps.
In practical systems, converting the modi�ed DCT coe�cient back to the integer
pixel domain and then converting them again to the DCT domain may not get the
same result. Therefore, an iteration procedure, which examines the DCT of modi�ed
integral pixel values, is needed to guarantee the watermark bits be exactly extracted
from the watermarked image. (But theoretical convergence of such iterative process
remains to be proved.) In our experiments, this iteration is needed for about 10%
of the blocks, and most of them need no more than 2 iterations.
In the image blocks with \ at" areas, using the second equation in Eq. 3.7 to
modify AC values may introduce visible distortion, if the acceptable quality factor
is not very high (e.g., QF � 75). To address this problem, we may carefully select
the embedding method in the system. For instance, we could use even number
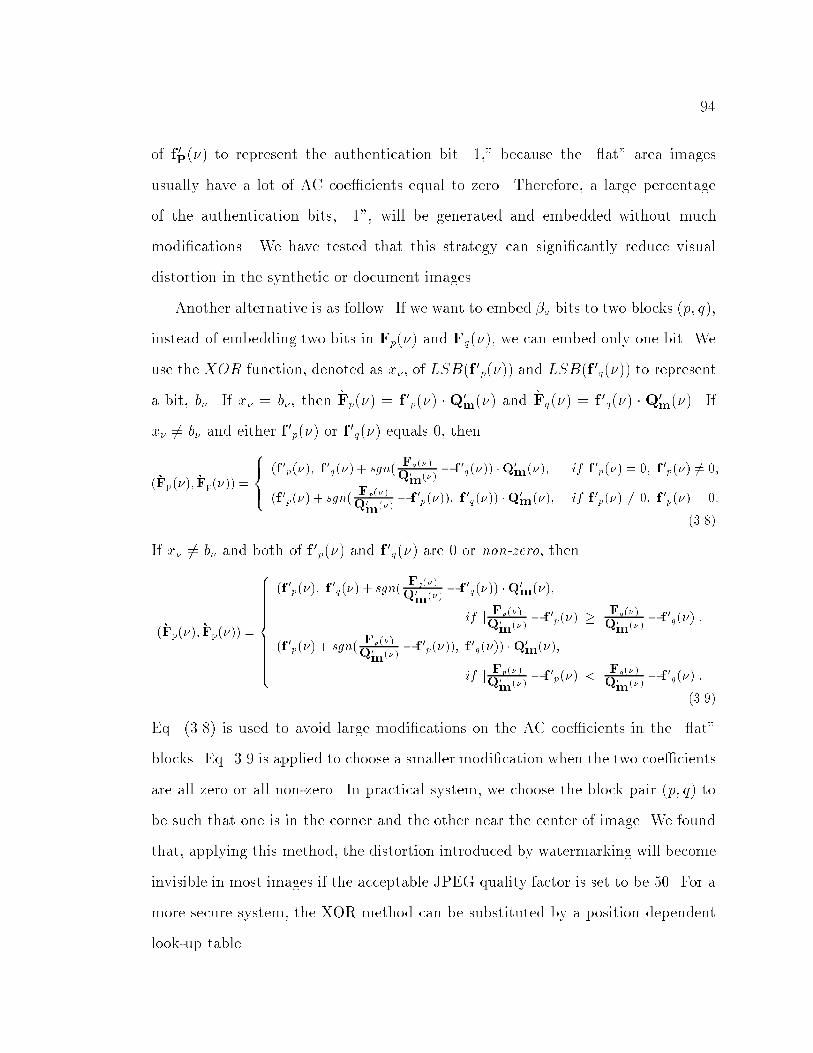
94
of f 0P(�) to represent the authentication bit \1," because the \ at" area images
usually have a lot of AC coe�cients equal to zero. Therefore, a large percentage
of the authentication bits, \1", will be generated and embedded without much
modi�cations. We have tested that this strategy can signi�cantly reduce visual
distortion in the synthetic or document images.
Another alternative is as follow. If we want to embed �a bits to two blocks (p; q),
instead of embedding two bits in Fp(�) and Fq(�), we can embed only one bit. We
use the XOR function, denoted as x�, of LSB(f 0p(�)) and LSB(f 0q(�)) to represent
a bit, b�. If x� = b�, then �Fp(�) = f 0p(�) �Q0m(�) and �Fq(�) = f 0q(�) � Q0
m(�). If
x� 6= b� and either f 0p(�) or f 0q(�) equals 0, then
(�Fp(�); �Fp(�)) =
8><>:
(f 0p(�); f0
q(�) + sgn(Fq(�)
Q0
m(�)� f 0q(�)) �Q
0
m(�); if f 0p(�) = 0; f 0p(�) 6= 0;
(f 0p(�) + sgn( Fp(�)
Q0
m(�)� f 0p(�)); f 0q(�)) �Q0
m(�); if f 0p(�) 6= 0; f 0p(�) = 0:
(3.8)
If x� 6= b� and both of f 0p(�) and f 0q(�) are 0 or non-zero, then
(�Fp(�); �Fp(�)) =
8>>>>>>>><>>>>>>>>:
(f 0p(�); f0
q(�) + sgn(Fq(�)
Q0
m(�)� f 0q(�)) �Q
0
m(�);
if jFp(�)
Q0
m(�)� f 0p(�)j � j
Fq(�)
Q0
m(�)� f 0q(�)j;
(f 0p(�) + sgn( Fp(�)
Q0
m(�)� f 0p(�)); f 0q(�)) �Q0
m(�);
if jFp(�)
Q0
m(�)� f 0p(�)j < j
Fq(�)
Q0
m(�)� f 0q(�)j:
(3.9)
Eq. (3.8) is used to avoid large modi�cations on the AC coe�cients in the \ at"
blocks. Eq. 3.9 is applied to choose a smaller modi�cation when the two coe�cients
are all zero or all non-zero. In practical system, we choose the block pair (p; q) to
be such that one is in the corner and the other near the center of image. We found
that, applying this method, the distortion introduced by watermarking will become
invisible in most images if the acceptable JPEG quality factor is set to be 50. For a
more secure system, the XOR method can be substituted by a position dependent
look-up table.

95
Figure 3-2: An example of embedding recovery bits
3.3.2 Generating and Embedding Recovery Bits
The recovery bits are used to reconstruct an approximation of the original
block. These recovery bits have to cover the whole image, because each block is
possibly manipulated. They can be generated using a procedure similar to low-
bit rate lossy compression. We use JPEG compression with a low quality factor,
because most digital cameras or image editing tools already have components of
JPEG compression, and therefore, the incurred implementation cost is low. Figure
3-2 shows an example of the process for embedding recovery bits. We can see the
quality of an image that is constructed from all recovery bits.
To generate the recovery bits, , we �rst scale down the image by 2 along each
axis, and divide the image into 8�8 blocks. Then, we use a JPEG quantization table
with low QF (e.g., 25) to quantize DCT coe�cients, and apply Hu�man coding on
the quantized coe�cients. These quantization and Hu�man coding procedures are
the same as those in standard JPEG compression. Because images are scaled-down
by 2, we need to embed the encoded bits of each scaled block into 4 original blocks.
The embedding process of recovery bits is similar to that of authentication bits.

96
We also need to set a threshold for acceptable JPEG quality factor,mr, which can be
di�erent from the one used in embedding authentication bits. Selected coe�cients
are pre-quantized based on Q0mr(�) = Qmr(�) to get reference values. A mapping
function, Tr, is used for selecting 4 blocks (denoted as p1, .. ,p4) in the original
image to embed recovery bits of a block in the down-scaled image. We use E0p
to indicate the second watermarking zone for embedding recovery bits. Each E0p
includes �r positions in a block. These parameters are image independent. Then,
recovery bits are embedded in a similar way as in Eq. (3.7) (or Eq. (3.8) and Eq.
(3.9)). They are embedded in these four blocks in a round robin fashion. Because
the coded bit length of a block in the scaled-down image is variable, if the coded
bit length of an block is larger than 4�r, then those bits exceeding the capacity will
be discarded.
3.3.3 Authentication Process
In the authentication process, the system extracts the authentication bits from
the watermarking zone of received image, and uses them to verify whether the DCT
coe�cient relationships in the signature generation zone match the criteria predicted
by Theorem 2. If they match, the image is said to be authentic. Otherwise, the
changed blocks are identi�ed and recovered by using the recovery bits if they are
available.
When a new DCT coe�cient relationship does not match the prediction of the
authentication bit reconstructed from the watermark, we know this image has been
manipulated. Note there could be as many as four blocks involved here. The
examinedDCT coe�cients are in the signature zone of a block pair (say blocks p1 and
p2). The authentication bit is recovered from the watermarking zones of two blocks
(say blocks p3 and p4). When the above comparison process reports a mismatch
97
from an authentication bit in p3, there are three possible areas that could have been
changed: the signature generation zone of p1, the signature generation zone of p2,
and the watermarking zone of p3. Assume only one block has been changed. A
problem of the authentication process is how to identify the manipulated block. To
test whether p1 has been manipulated, we can test the watermarking zone of p1
to see whether it can successfully verify the authenticity of its referred block pair,
because, in general, all zones in a block may have been altered after manipulation.
Similar tests can be applied to p2 and p3. It should be noted that these solutions
are based on the assumption that manipulations are localized. If they are uniformly
existed in the whole image, then our authenticator may report some false alarm
blocks. In the previous example, if p2 is the only manipulated block in these four
blocks but the referred block pair of p1 has been manipulated, then we may report
both p1 and p2 as manipulated.
3.4 Performance Evaluation of Authentication System
We use three measures to evaluate an authentication system: the probability of
false alarm (of acceptable manipulations), PFA, the probability of miss (on detect-
ing malicious manipulations), PM , and the probability of successful attack, PS , as
discussed in Chapter 2. The �rst two are from the authentication system developer.
The last one is from the viewpoints of attacker. The last two are distinguished
based on di�erent information known to the developer and the attacker. These
probabilities usually depend on each individual image and the length of the signa-
ture. Usually, the longer the signature length is, the better the system performance
is. However, for a watermarking system, the longer the embedded signature is,
the worse the watermarked image quality will be. There is a tradeo� between sys-
tem performance and image quality. The analysis in this section is based on the

98
20 30 40 50 60 70 80 90 10020
25
30
35
40
45
50
55
60
65
70
Acceptable JPEG Quality Factor
PSN
R o
f Wat
erm
arke
d Im
age
(dB)
− : Authentication Only−−: Authentication + Weak Recovery−.: Authentication + Recovery
Figure 3-3: Expected value of PSNR of the watermarked image v.s. Accept-able JPEG Quality Factor. The embedded bits are: (1) Authentication Only: 3bits/block, (2) Authentication + Weak Recovery: 9 bits/block , and (3) Authenti-cation + Recovery: 9 bits/block.
implementation described in Eq. (3.6) and Eq. (3.7).
3.4.1 Quality of Watermarked Image
In our system, if we use PSNR to measure the degradation of image quality
caused by watermarking, the expectation value of PSNR will be image indepen-
dent. We �rst show that the expectation value of error power of an individual DCT
coe�cient is,
E[�w2(�)] =
1
2�Z Q0
m(�)
0x2f(x)dx+
1
2�Z Q0
m(�)
0(Q0
m(�)� x)2f(x)dx =1
3Q0m
2(�);
(3.10)
where we assume x to be a random variable which is uniformly distributed between
0 and Q0m(�), i.e., f(x) =
1Q0
m(�) which is the probability density function of x. The
�rst and second terms are the cases that x is quantized to 0 and Q0m(�), respectively.
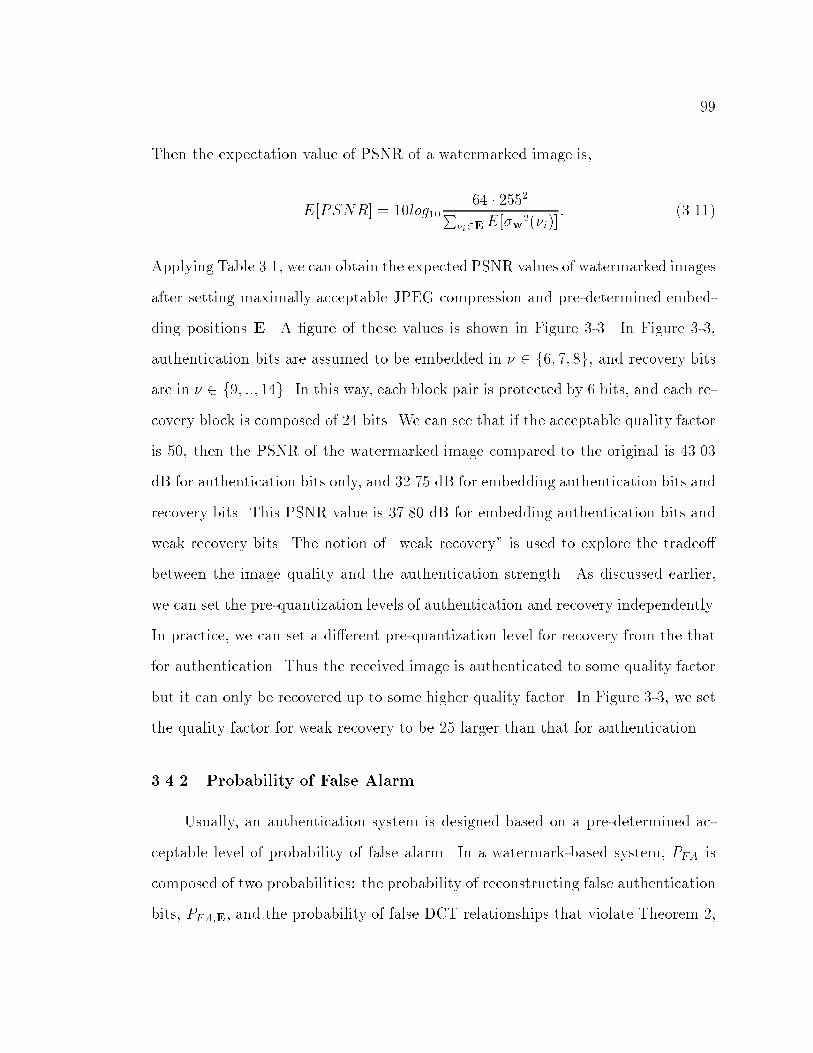
99
Then the expectation value of PSNR of a watermarked image is,
E[PSNR] = 10log1064 � 2552P
�i2EE[�w2(�i)]
: (3.11)
Applying Table 3.1, we can obtain the expected PSNR values of watermarked images
after setting maximally acceptable JPEG compression and pre-determined embed-
ding positions E. A �gure of these values is shown in Figure 3-3. In Figure 3-3,
authentication bits are assumed to be embedded in � 2 f6; 7; 8g, and recovery bits
are in � 2 f9; ::; 14g. In this way, each block pair is protected by 6 bits, and each re-covery block is composed of 24 bits. We can see that if the acceptable quality factor
is 50, then the PSNR of the watermarked image compared to the original is 43.03
dB for authentication bits only, and 32.75 dB for embedding authentication bits and
recovery bits. This PSNR value is 37.80 dB for embedding authentication bits and
weak recovery bits. The notion of \weak recovery" is used to explore the tradeo�
between the image quality and the authentication strength. As discussed earlier,
we can set the pre-quantization levels of authentication and recovery independently.
In practice, we can set a di�erent pre-quantization level for recovery from the that
for authentication. Thus the received image is authenticated to some quality factor
but it can only be recovered up to some higher quality factor. In Figure 3-3, we set
the quality factor for weak recovery to be 25 larger than that for authentication.
3.4.2 Probability of False Alarm
Usually, an authentication system is designed based on a pre-determined ac-
ceptable level of probability of false alarm. In a watermark-based system, PFA is
composed of two probabilities: the probability of reconstructing false authentication
bits, PFA;E, and the probability of false DCT relationships that violate Theorem 2,
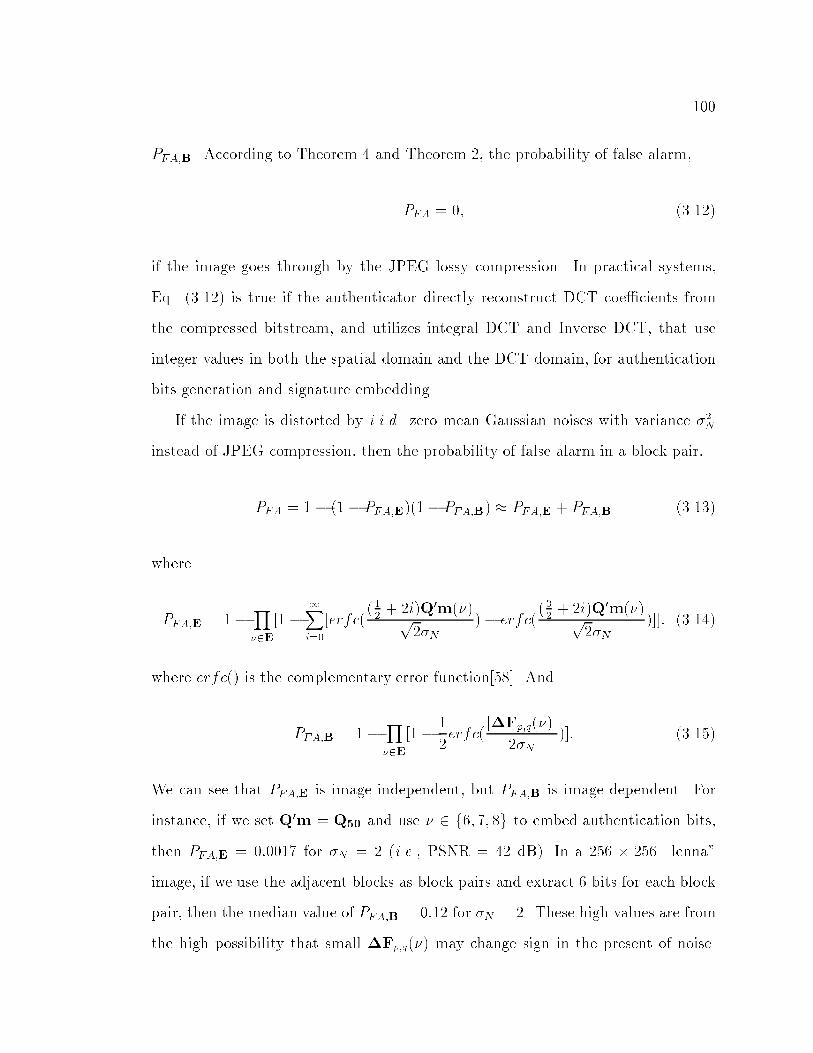
100
PFA;B. According to Theorem 4 and Theorem 2, the probability of false alarm,
PFA = 0; (3.12)
if the image goes through by the JPEG lossy compression. In practical systems,
Eq. (3.12) is true if the authenticator directly reconstruct DCT coe�cients from
the compressed bitstream, and utilizes integral DCT and Inverse DCT, that use
integer values in both the spatial domain and the DCT domain, for authentication
bits generation and signature embedding.
If the image is distorted by i.i.d. zero mean Gaussian noises with variance �2N
instead of JPEG compression, then the probability of false alarm in a block pair,
PFA = 1 � (1� PFA;E)(1� PFA;B) � PFA;E + PFA;B (3.13)
where
PFA;E = 1� Y�2E
[1�1Xi=0
[erfc((12+ 2i)Q0m(�)p
2�N)� erfc(
(32+ 2i)Q0m(�)p
2�N)]]: (3.14)
where erfc() is the complementary error function[58]. And
PFA;B = 1� Y�2E
[1� 1
2erfc(
j�Fp;q(�)j2�N
)]: (3.15)
We can see that PFA;E is image independent, but PFA;B is image dependent. For
instance, if we set Q0m = Q50 and use � 2 f6; 7; 8g to embed authentication bits,
then PFA;E = 0:0017 for �N = 2 (i.e., PSNR = 42 dB). In a 256 � 256 \lenna"
image, if we use the adjacent blocks as block pairs and extract 6 bits for each block
pair, then the median value of PFA;B = 0:12 for �N = 2. These high values are from
the high possibility that small �Fp;q(�) may change sign in the present of noise.

101
However, if we use the tolerance bound in authentication (as in Chapter 2) and set
the bound equal to Q0m, then PFA;B = 9 � 10�9 which decreases signi�cantly.
3.4.3 Probability of Miss and Probability of Successful Attack
The probability of Miss, PM , and the probability of Successful Attack, PS , are
measures of the capability of an authentication to detect unacceptable manipula-
tions. They are calculated from di�erent given information. If a block p is manipu-
lated, then PM;p is the probability that, after manipulation, the relationships of the
DCT coe�cients 2 Bp of the block pair (p,q) do not violate Theorem 2, given the
original Fp, Fq, and Bp. This is a measure from the signature authenticator point of
view. In other words, that is a probability that the content distributor knows how
each speci�c watermarked image may miss a manipulation. PS;p is the probability
that, from the attacker's point of view, his estimation of successful attack without
the information of Fp, Fq, and Bp but with a given attack scenario. These scenarios
may include: attacks with visual meaning changes, attacks based on the DCT val-
ues of the replaced block, attacks based on known mapping functions, attacks based
on know signature generation positions, etc. Detailed discussion and derivation of
these two probabilities are in Chapter 2.2
In this chapter, we only show a simpler measure of PS in the case that attacks
are based on pixel replacement (for changing visual meaning of content) without
given any attack scenario. Here,
PS � 2�3
2��a�N (3.16)
where N is the number of 8� 8 blocks that are a�ected by the attack. If each block
2However, a complete derivation of PM and PS , that includes the probability modeling ofembedding bits, is not yet addressed in this thesis.
102
is protected by �a authentication bits, and 12�a authentication bits from other coef-
�cient pairs are embedded in this block, then changing the pixel values in the block
will in uence 32�a bits totally. Assuming random pixel changes and the coe�cient
pairs are unknown, each manipulation may cause change of each authentication bit
with a probability of 12. Then, with 3
2�a bits involved, the probability of successful
attack (PS) is approximately 2�3
2��a. If �a = 6, then PS is � 2�9. In practical,
because manipulation may cross the block boundary, if an attacker replace an area
of 20 � 20, which may a�ect 16 blocks, then PS � 2�9�16 � 10�43. Practically,
Eq. (3.16) is an conservative estimation of the probability of successful attack (from
attacker's point of view), because the probability that a manipulated coe�cient pair
pass the authenticator may be larger than 12 , and is image dependent (as discussed
in Chapter 2).
3.4.4 Security
Security of the SARI system is achieved by using secret mapping functions, Ta
and Tb, as described in Section 3.3. Using a �xed and not publicized algorithm to
generate Ta and Tb in both watermark embedder and authenticator, early versions of
SARI system provide preliminary level of security against attacks. However, because
the mapping functions may be found and maliciously published, this strategy is
not secure enough. To meet the generic security requirements, we enhanced our
system based on a secret mapping function generator and the common Public Key
Infrastructure (PKI).
A secret function, �, which is a hardware or software component in both wa-
termark embedder and authenticator, is used to generate the mapping functions
based on the seeds which includes user identi�cation, time stamp, and a random

103
seed number generated by the embedder. That is,
fTa; Tbg = �fEmbedderID + T imeStamp+RandomSeedg (3.17)
where � is designed by the system provider. It is similar to a pseudo number
generator plus additional considerations of properties of mapping functions, e.g.,
the minimum distance between locations where the information bits are generated
from and embedded to. In real applications, the three input parameters of � have
to be transmitted to the authenticator through the watermark. This is done by
generating the third type of information bits, �, based on,
�i = PublicKeyAuthfEmbedderID+PrivateKeyEmbedderfT imeStamp+RandomSeed +Hash[�i]gg
(3.18)
where �i, called the security bits, are embedded into the i � th non-overlapping
section of the image. Here, we divide the image into several sections, and embed 1
bit of security bits into each block of the section. Each �i is generated based on the
user ID, a time stamp, a random seed, and a hash of the embedded authentication
bits, �i = [Ta(p)2section i�p, in the section i. A section may include one or several
rows, whose number depends on the image size and the length of security bits. Here,
the purpose of generating multiple sets of security bits is for error resilience.
The design philosophy of the security system is based on three static security
entities, the private key of the authenticator, the private key of the watermark em-
bedder, and the mapping function generator �. A secret dynamic information, the
random seed, is generated by the embedder and is transmitted from the embedder
to the authenticator. This secret random seed is used along with other transparent
information of the embedder ID and the time stamp to generate the mapping func-
tions. In Eq. (3.17) and (3.18), the time stamp does not play a security role, which

104
is used here simply to indicate the fact that other information can also be added
here. If system users need not know the embedding time, it can be deleted in both
equations. In SARI system, the authenticator would retrieve the embedder ID and
the time stamp to the system user as part of authentication services. In other words,
these information would be transparent to users. In Eq. (3.17), we include the hash
values of the embedded authentication bits to make �i content-dependent, i.e., it
cannot be copied from authentic images in faking the authenticity of other images.
Note that, in Chapter 2, we cannot use the hash values of authentication bits in
a robust digital signature, because the DCT relationships may introduce ambigu-
ity in some \equal" cases. However, we can use the hash values of authentication
bits here, because they are not used for content authentication and the embedded
authentication bits can be exactly reconstructed from the watermarked SARI image.
The authentication process begins as follows. First, the authenticator decrypts
the security bits of each section and extract the embedded ID, the time stamp,
the random seed, and the embedded hash values. Only the intended authenticator
devices or software systems can decrypt �i since it requires the matched private
key. Once the embedder ID is known, the public key of the embedder can be used
to extract the information inside the inner most bracket in Eq. (3.18). Without
malicious manipulation, these parameters should be the same in all sections. If there
is manipulation, they are determined based on the majority of the decrypted �i0s.
This is why we divide image into sections for reduplicate embedding. We should
notice that, most cryptographic methods do not allow any single bit change in the
cipher text. Therefore, only those sections that keep integrity of �i can provide
correct parameters. After the parameters is retrieved, the authenticator can apply
Eq. (3.17) to generate mapping functions and authenticate images as described in
Section 3.3.3.

105
Adding the private key of the embedder in Eq. (3.18) is to avoid attacker's
forgery of false input of �. Without this digital signature-like functionality, once
an attacker has found a relation between mapping functions and its corresponding
inputs, he will be able to generate mapping functions as in Eq. (3.17) and embed
authentication watermarks to forged images. Adding the hash of the authentication
bits is to generate diverse and content-based security bits in the sections. It can
also help to prove the integrity of the section, that sometimes is useful in helping
allocating the manipulated positions.
Adding the public key of the authenticator in Eq. (3.18) is to protect the param-
eters from being known by the attacker. In the real cases, we assume that � is not
publicized. Without the public key in Eq. (3.18), this system can still be secure.
However, since � is a component in the hardware or software of embedder, it may
be reverse engineered. In such a scenario, we need to protect the input parameters
of � from being known, otherwise the attacker can use some hacked parameters
to forge watermarks. In Eq. (3.18), only the intended authenticator can retrieve
the parameters. Specifying which authenticator would authenticate the image a
priori is a feasible solution in practice. For example, authentication services can
be deployed on the World Wide Web (WWW) by the same watermark embedder
provider or trusted agents. This additional public key enhances the security of the
authentication system with the trade-o� that the authenticator could not be locally
operated by the recipient.
We trust the unknown private keys to provide the ultimate security protection.
If they are known by the attacker, but the mapping function generator, � is still
secret, the authentication system may be secure, unless the parameters and corre-
sponding mapping functions have been found. At the end, if both the private keys
and the mapping function generator, �, are all known by the attacker, then the

106
(a) (b) (c)
Figure 3-4: (a) The original image, (b) the watermarked image after embeddingauthentication bits ( PSNR = 40.7 dB), (c) the watermarked image after embeddingauthentication bits and weak recovery bits ( PSNR = 37.0 dB).
authentication system is no longer secure.
3.5 Experimental Results
3.5.1 Example
We �rst use the 256 � 256 gray-level \Lenna" image to test our system. The
original and watermarked images are shown in Figure 3-4. We use �a = 6 authenti-
cation bits for each block pair, and set the acceptable JPEG quality factor to be 50.
And, we use enhanced embedding method as in Eq. (3.8) and Eq. (3.9). In Figure
3-4(b), we can see that, the watermarked image looks the same as the original after
embedding authentication bits. The PSNR of this image is lower than the expected
value in Figure 3-3, because this enhanced method modi�es more bits in each block.
In Figure 3-4(c), we show the watermarked image with both authentication bits and
weak recovery bits. For each block, in addition to the authentication bits, several
recovery bits are embedded. These recovery bits survives JPEG compression to QF
=75. There is visible distortion after embedding, but overall, the degradation is

107
(a) (b) (c)
Figure 3-5: (a) Manipulation on the watermarked image in Figure 3-2(b), (b) theauthentication result of (a), (c) the authentication and recovery result from themanipulated image of Figure 3-2(c).
not obvious, and could be considered as acceptable. An experiment of embedding
recovery bits that can survive QF=50 shows a noticeable quality degradation, with
PSNR = 32:95 dB. Its quality degradation may be too much to be considered as
acceptable.
We saved the watermarked image in the raw format, and then use XV on work-
station and Adobe Photoshop on PC to compress them. These two commercial
software use di�erent methods to generate quantization tables in JPEG. XV uses
the same quality factors suggested by JPEG. We found that our watermarked im-
ages can survive all the JPEG lossy compressions with QF � 50. Adobe Photoshop
uses di�erent scales of low, medium, high, and maximum to determine the quan-
tization table. We found that our watermarked images can survive the last three
levels, but introduce some false alarm after compression using the �rst level. The
reason is that its quantization steps are larger than Q50. In practice, if we hope
to survive all JPEG compression in Photoshop, we can use these quantization steps
from Photoshop instead of Q50.
We manipulate the watermarked images using Photoshop. Two images are ma-
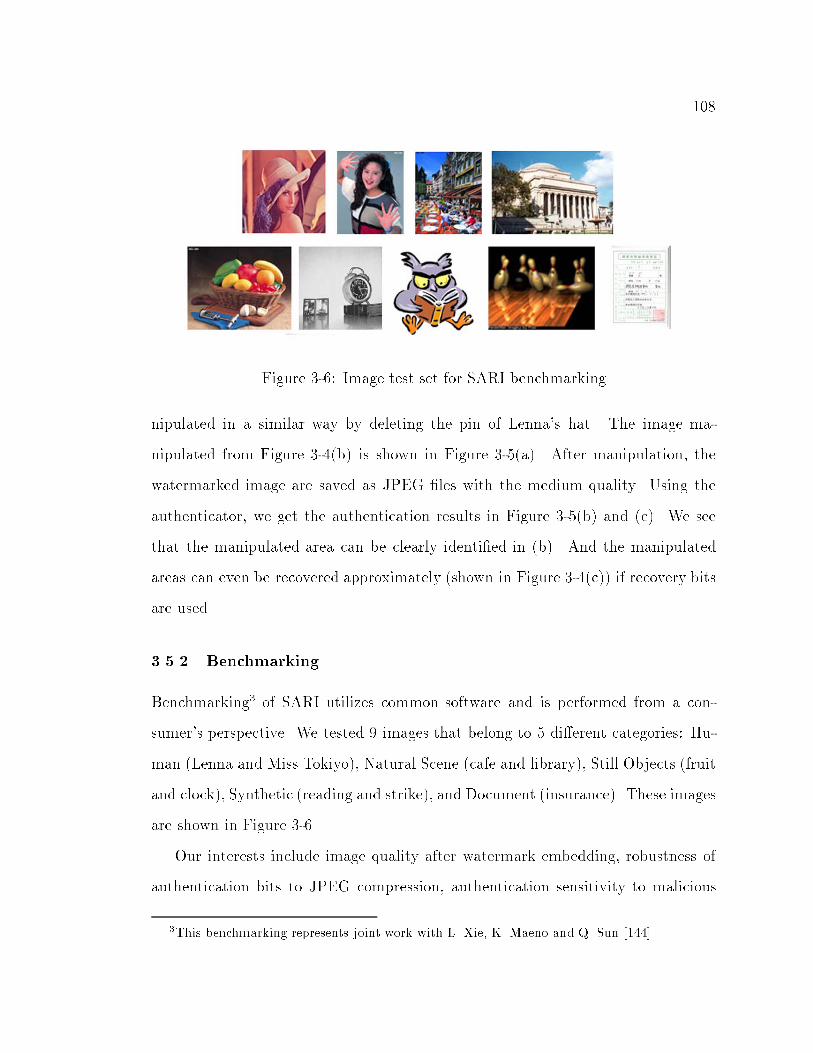
108
Figure 3-6: Image test set for SARI benchmarking
nipulated in a similar way by deleting the pin of Lenna's hat. The image ma-
nipulated from Figure 3-4(b) is shown in Figure 3-5(a). After manipulation, the
watermarked image are saved as JPEG �les with the medium quality. Using the
authenticator, we get the authentication results in Figure 3-5(b) and (c). We see
that the manipulated area can be clearly identi�ed in (b). And the manipulated
areas can even be recovered approximately (shown in Figure 3-4(c)) if recovery bits
are used.
3.5.2 Benchmarking
Benchmarking3 of SARI utilizes common software and is performed from a con-
sumer's perspective. We tested 9 images that belong to 5 di�erent categories: Hu-
man (Lenna and Miss Tokiyo), Natural Scene (cafe and library), Still Objects (fruit
and clock), Synthetic (reading and strike), and Document (insurance). These images
are shown in Figure 3-6.
Our interests include image quality after watermark embedding, robustness of
authentication bits to JPEG compression, authentication sensitivity to malicious
3This benchmarking represents joint work with L. Xie, K. Maeno and Q. Sun [144].
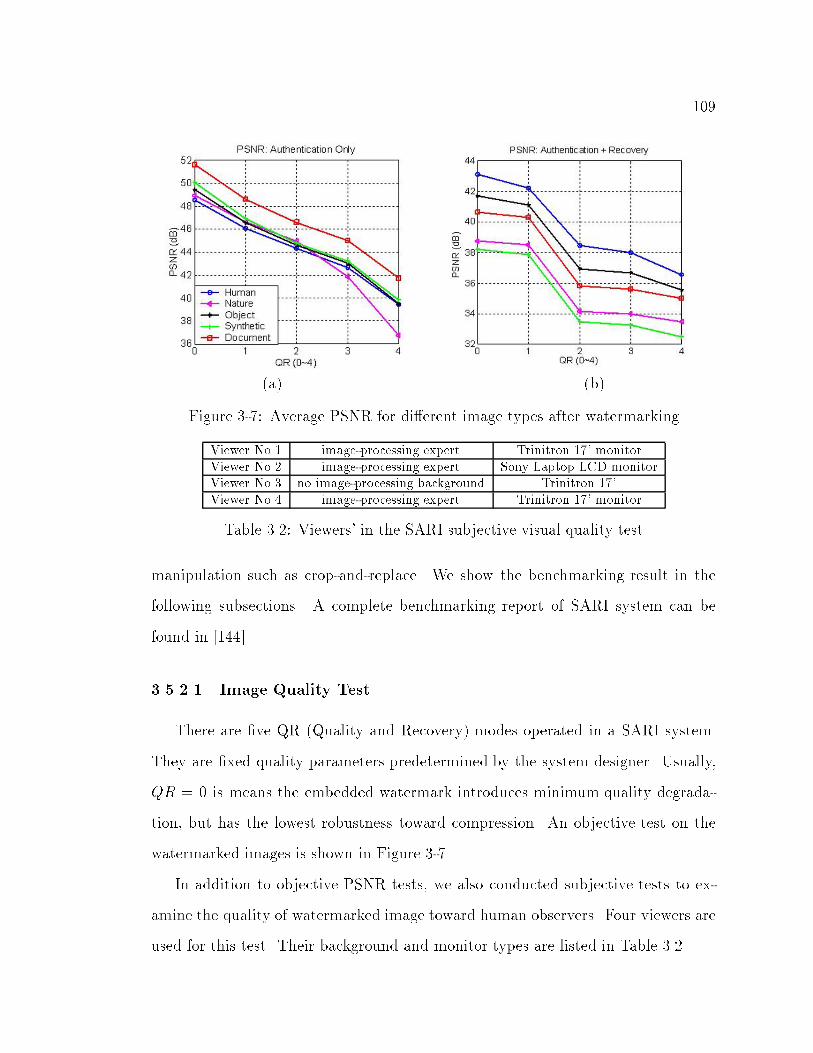
109
(a) (b)
Figure 3-7: Average PSNR for di�erent image types after watermarking
Viewer No.1 image-processing expert Trinitron 17' monitorViewer No.2 image-processing expert Sony Laptop LCD monitorViewer No.3 no image-processing background Trinitron 17'Viewer No.4 image-processing expert Trinitron 17' monitor
Table 3.2: Viewers' in the SARI subjective visual quality test
manipulation such as crop-and-replace. We show the benchmarking result in the
following subsections. A complete benchmarking report of SARI system can be
found in [144].
3.5.2.1 Image Quality Test
There are �ve QR (Quality and Recovery) modes operated in a SARI system.
They are �xed quality parameters predetermined by the system designer. Usually,
QR = 0 is means the embedded watermark introduces minimum quality degrada-
tion, but has the lowest robustness toward compression. An objective test on the
watermarked images is shown in Figure 3-7.
In addition to objective PSNR tests, we also conducted subjective tests to ex-
amine the quality of watermarked image toward human observers. Four viewers are
used for this test. Their background and monitor types are listed in Table 3.2.

110
Image Name Lena Tokiyo Cafe Library FruitImage Type Color Color Color Color ColorImage Size 512*512 768*960 480*592 560*384 400*320
Embedded Bits, Auth 12,288 34,560 13,320 10,080 6,000Embedded Bits, A+R 47,240 109,514 88,751 52,868 24,616Max Invisible QR, Auth 3 3 4 2 4
Max Invisible PSNR, Auth 43.0 42.3 40.2 45.0 39.8Max Invisible QR, A+R 1 1 3 1 3
Max Invisible PSNR, A+R 41.9 42.5 33.2 39.3 36.9
Clock Reading Strike InsuranceGray Color Color Color
256*256 336*352 256*192 792*5763,072 5,544 2,304 21,38411,686 34,033 10,474 90,968
3 2 3 344.7 42.5 43.8 45.00 0 1 1
36.2 34.2 39.6 41.3
Table 3.3: SARI embedded bits and max invisible (MI) embedding strength refer-ring to Subjective test. (A+R: embedding authentication and recovery bits, Auth:embedding authentication bits)
We use the average of subjective tests to show the maximum embedding strength
for each image. This is shown in Table 3.3. From this table, we can see the number
of bits embedded in each image. The number of authentication bits per 8� 8 block
is 3 bits, and the average number of recovery bits are 13.1 bits/block. We can also
see that the maximum acceptable QR or PSNR vary according di�erent image type.
Through the objective and subjective tests, we observed that:
1. The changes are almost imperceptible for modest watermark strength QR =
0 � 2.
2. The embedding capacity of a natural image is generally larger than that of
a synthetic image. This is because the former has more textural areas, thus
the slight modi�cation caused by authentication bits is less visible. The image
quality of human, nature, and still object is generally better than that of

111
Image Name Lena Tokiyo Cafe Library Fruit Clock Reading Strike Insur.Survive QF, MED 3 3 3 4 1 4 3 3 4Survive QF, QR=4 1 2 2 2 1 2 2 2 2Detect M., 1-pix Y Y Y Y Y Y Y Y YDetect M., C&R Y Y Y Y Y Y Y Y Y
Table 3.4: SARI performance test under JPEG compression Quality Factor (inPhotoshop 5.0) and Crop-Replacement (C&R) Manipulations (MED: watermarksare embedded under maximum invisible embedding strength)
synthetic and document image, and both the objective and subjective tests
agree at this point.
3. The quality judgments vary among di�erent viewers. This is because users
pay attention to di�erent features of an image and their tolerance bounds can
be quite di�erent. Moreover, di�erent types of monitors have di�erent display
e�ects, e.g. the images that appear not acceptable on a Dell PC look just �ne
on a Sun Workstation.
3.5.2.2 Sensitivity Test
Table 3.4 shows the benchmarking result of performance test. We tested the robust-
ness against JPEG lossy compression by embedding the watermarks in two di�erent
QR modes. For JPEG Compression, we found that all the information bits embed-
ded in the image can be exactly reconstructed without any false alarm after JPEG
compression. We observed similar results from other JPEG testing using XV, Pho-
toShop 3:0, PaintShop Pro, MS Paint, ACD See32, Kodak Imaging, etc. Statistics
here conform with the designed robustness chart (QR 0� 4). For instance, for im-
age Lena, watermark with strength QR = 4 survives Photoshop 5:0 Quality Factor
1 � 10. Watermarks embedded by using maximum invisible subjective embedding
strength (MED) can survive JPEG compression Quality Factor 3 � 10. This result
is even better than predicted.

112
We embedded the watermarks in the QR = 4 mode to test its sensitivity to
malicious manipulations. QR = 4 is the most robust mode to compression and
is the least sensitive mode in detecting manipulations4. We found that even in
this case, SARI authenticator is quite sensitive to this kind of manipulation. It can
properly detect up to 1-pixel value changes, and it is very e�ective in detecting Crop-
and-Replacement manipulations. In our tests, it properly detects all manipulations.
For recovery tests, we found that in all malicious manipulation cases, an approx-
imation of the original pixels in the corrupted area can be properly reconstructed.
In addition to these two manipulations, we had also tested other image processing
manipulations for reference. We found that the authenticator can detect the change
resulted by blurring, median �ltering. For Gaussian noises, the authenticator detects
changes. But, if further compressed by JPEG, usually no change were detected
because compression cancelled out the slight di�erence introduced by it. We also
found that the robustness of noises or �ltering can be increased through setting larger
tolerance bound in the authentication process (the defaulted tolerance bound, � , is
equal to 1). However, as discussed early in Chapter 2, the authenticator will be less
sensitive to malicious manipulations.
3.6 Conclusion and Future Direction
In this chapter, we present a novel semi-fragile watermarking technique that
accepts JPEG lossy compression on the watermarked image to a pre-determined
quality factor, and rejects unacceptable manipulations such as crop-and-replacement
process. The embedded information includes authentication bits, which are used to
identify the position of malicious attacks, and recovery bits, which are used to re-
4We use QR = 2 for the Insurance image because the visual degradation of QR = 4 is clearlyvisible.
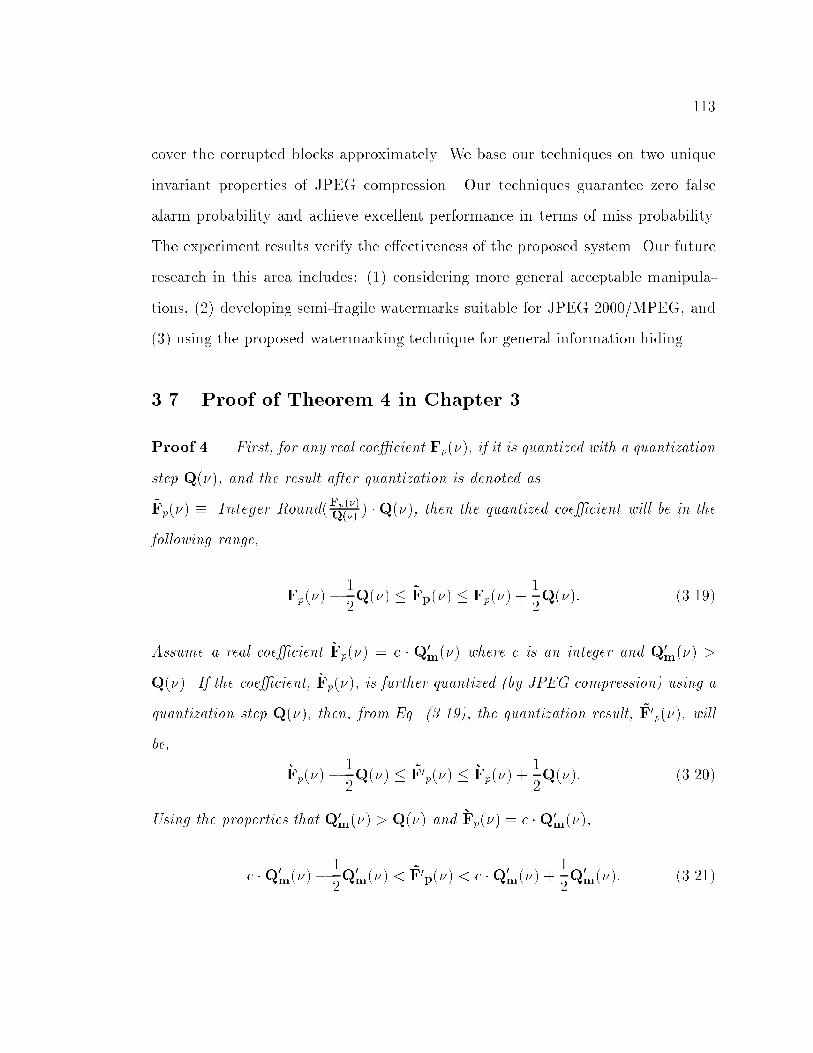
113
cover the corrupted blocks approximately. We base our techniques on two unique
invariant properties of JPEG compression. Our techniques guarantee zero false
alarm probability and achieve excellent performance in terms of miss probability.
The experiment results verify the e�ectiveness of the proposed system. Our future
research in this area includes: (1) considering more general acceptable manipula-
tions, (2) developing semi-fragile watermarks suitable for JPEG 2000/MPEG, and
(3) using the proposed watermarking technique for general information hiding.
3.7 Proof of Theorem 4 in Chapter 3
Proof 4 First, for any real coe�cient Fp(�), if it is quantized with a quantization
step Q(�), and the result after quantization is denoted as
~Fp(�) � Integer Round(Fp(�)Q(�)
) �Q(�), then the quantized coe�cient will be in the
following range,
Fp(�)� 1
2Q(�) � ~Fp(�) � Fp(�) +
1
2Q(�): (3.19)
Assume a real coe�cient �Fp(�) = c � Q0m(�) where c is an integer and Q0
m(�) >
Q(�). If the coe�cient, �Fp(�), is further quantized (by JPEG compression) using a
quantization step Q(�), then, from Eq. (3.19), the quantization result, ~F0p(�), will
be,
�Fp(�)� 1
2Q(�) � ~F0p(�) � �Fp(�) +
1
2Q(�): (3.20)
Using the properties that Q0m(�) > Q(�) and �Fp(�) = c �Q0
m(�),
c �Q0m(�)�
1
2Q0m(�) < ~F0p(�) < c �Q0
m(�) +1
2Q0m(�): (3.21)
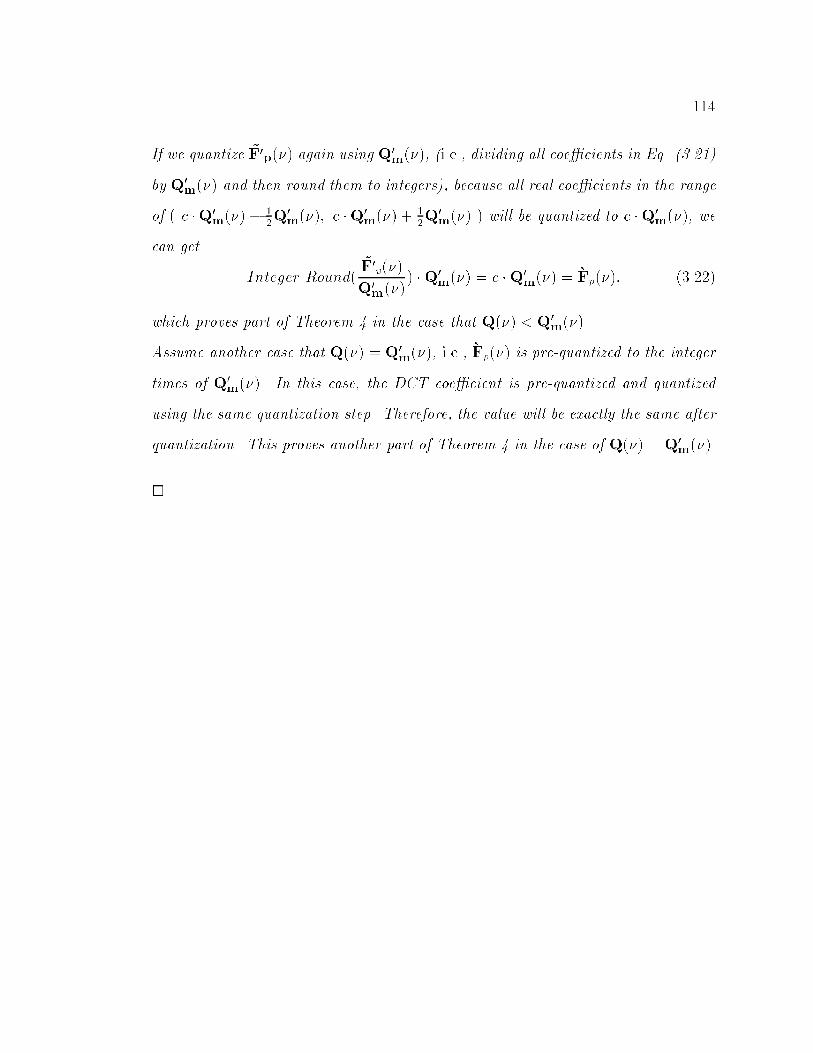
114
If we quantize ~F0p(�) again using Q0m(�), (i.e., dividing all coe�cients in Eq. (3.21)
by Q0m(�) and then round them to integers), because all real coe�cients in the range
of ( c �Q0m(�)� 1
2Q0m(�); c �Q0
m(�) +12Q
0m(�) ) will be quantized to c �Q0
m(�), we
can get
Integer Round(~F0p(�)
Q0m(�)
) �Q0m(�) = c �Q0
m(�) = �Fp(�); (3.22)
which proves part of Theorem 4 in the case that Q(�) < Q0m(�).
Assume another case that Q(�) = Q0m(�), i.e., �Fp(�) is pre-quantized to the integer
times of Q0m(�). In this case, the DCT coe�cient is pre-quantized and quantized
using the same quantization step. Therefore, the value will be exactly the same after
quantization. This proves another part of Theorem 4 in the case of Q(�) = Q0m(�).
2
115
Chapter 4
Geometric Distortion Resilient Public
Watermarking and Its Applications in Image
Print-and-Scan Processes
4.1 Introduction
Today the print-and-scan (PS) process is commonly used for image reproduction
and distribution. It is popular to transform images between the electronic digi-
tal format and the printed format. The rescanned image may look similar to the
original, but may have been distorted during the process. For some image security
applications, such as watermarking for copyright protection, users should be able
to detect the embedded watermark even if it is printed-and-scanned. In image au-
thentication cases, the rescanned image may be considered as authentic, because it
is a reproduction of the original.
After the print-and-scan process, distortion occurs in both the pixel values and
the geometric boundary of the rescanned image. The distortion of pixel values is
caused by (1) the luminance, contrast, gamma correction and chromnance variations,
and (2) the blurring of adjacent pixels. These are typical e�ects of the printer and
scanner, and while they are perceptible to the human eye, they a�ect the visual
116
quality of a rescanned image.
This chapter includes two parts. In the �rst part, we propose a public watermark
technqiue that is invariant to geometric distortions. In the second part, we propose
a model of the print-and-scan (PS) process and present how we can modify the
proposed watermarking technique to be applied in the PS process.
In Section 4.2, we make a brief introduction on the properties of the proposed
watermark technique and an overview on the watermarking techniques that survive
geometric distortions. In Section 4.3, we describe our watermarking algorithm.
This is described in more detail in Section 4.4, including the iterative procedure
for dealing with the one-to-many mapping from watermark to image space. Our
solutions to a number of implementation issues are also discussed in Section 4.4.
Section 4.5 describes the results of experiments on a large database.
In the second part of this chapter, we begin with the discussion of the charac-
teristics of the PS process in Section 4.6. Then, in Section 4.7, we propose a model
that can be used to analyze the distortion of a discretized digital image after the
PS process in the spatial and frequency domain. Then, we will analyze the varia-
tions of DFT coe�cients, leading to important properties for extracting invariants.
In Section 4.8, we discuss several methods that can be used to extract invariants
of the PS process. Some experimental results, including an analysis of the feature
vector proposed in Section 4.3, are shown in Section 4.9. In Section 4.10, we make
a conclusion and discuss some future work.
4.2 Properties of the Proposed Watermarking Technique
In this chapter, we propose a public watermark technique that is invariant to geo-
metric distortions. Our method does not embed an additional registration pattern
[103, 30] or embed watermark in a recognizable structure [68], so there is no need

117
to identify and invert them. In particular, we are concerned with distortions due
to rotation, scale and/or translation (RST). While these geometric distortions have
recently become of interest to the watermarking community, they have long been of
interest to the pattern recognition community. A comprehensive discussion of the
pattern recognition literature is outside the scope of this chapter. Hu [49] described
the use of moment invariants for visual pattern recognition of planar geometric �g-
ures. It has been shown [120] that these classic moment invariants are equivalent to
the radial moments of circular-harmonic functions (CHF's) that arise from a Mellin
transform of the log-polar representation of an image when the complexMellin radial
frequency s, is a real integer s � 1.
The Fourier-Mellin transform is closely related to the algorithm described in
this chapter. There are a variety of related ideas from pattern recognition. First,
Casasent and Psaltis [16, 17] note that the signal-to-noise ratio of the correlation
peak between two images decreases from 30db to 3dB with either a 2% scale change
or a 3:5� rotation. Their proposal is essentially a hybrid opto-electronic implemen-
tation of the Fourier-Mellin transform. Altmann and Reitbock [4] and Altmann
[5] discuss implementation issues related to the discrete Fourier-Mellin transform.
These include interpolation, aliasing, and spectral border e�ects, which are discussed
in detail in Section 4.4 of this chapter. Wechsler and Zimmerman [137] describe a
conformal-log mapping that is very closely related to the Fourier-Mellin transform.
Also, Lin and Brandt [86] discuss the use of the Fourier-Mellin and other transforms
for pattern recognition. Lin and Brandt [86] describe a number of absolute or strong
invariants based on the phase of the Fourier or Fourier-Mellin spectrums. The terms
\absolute" and \strong" refer to the fact that all information about an image ex-
cept that of position, orientation or scale is preserved. This may be important for
recognition tasks, especially if the library of objects is large. Ferraro and Caelli [41]

118
discuss this issue in more detail. However, we do not believe that strong invariants
are necessary for watermarking applications.
It is important to realize that watermark detection is di�erent from the general
problem of recognizing an object. First, an N -bit watermark only requires recog-
nition of N independent patterns. Since N is typically between 32 and 64, this
is considerably smaller than a practical object recognition database. Second, the
watermark is not a naturally occurring object but is arti�cially inserted into an
image. As such, the watermark can be designed to be easily represented. In par-
ticular, it is often advantageous to represent the watermark as a one-dimensional
projection of the image space. If properly designed, this has the bene�t of reducing
a two-dimensional search to one dimension, thereby signi�cantly reducing the com-
putational cost. Finally, since the set of watermarks is small (compared with the
number of naturally occurring objects in a scene) and arti�cially created, it is not
necessary that the image transform be strongly invariant as it is not as important
to be able to reconstruct the image modulo rotation, scale and/or translation from
the parameterization.
O'Ruanaidh and Pun [100] �rst suggested a watermarking method based on the
Fourier-Mellin transform. However, they note very severe implementation di�culties
which we suspect have hampered further work in this area. They choose to use a
transformation that is strongly invariant claiming that \it is more convenient to use
strong invariants because the last stage of embedding a mark involves inverting the
invariant representation to obtain the (marked) watermarked image". We believe
that invertibility is not essential. Following the formulation in [26], suppose we have
a non-invertible extraction function, X(C), that maps a piece of media, C, into an
extracted signal. Such a function would be used as part of a detection strategy. An

119
example extraction function found in the literature[62] is
Xi(C) =Xj2Ri
C(j) 1 � i � N (4.1)
where Ri are disjoint subsets of elements of the media, C. We can often de�ne an
embedding function, Y (w;C), which �nds a new piece of media, Cw = Y (w;Co),
such that
X(Cw) � X (Y (w;Co)) � w (4.2)
and Cw is perceptually similar to Co. In other words, the watermarked image looks
like the original and the vector extracted during detection looks like the watermark
vector. This function is su�cient for use in a watermark embedder. Our public
watermarking algorithm di�ers from that of [100] in two primary ways. First, we
choose to watermark a projection of the transform space. Second, the watermark
embedding is based on the principle of communication with side information [26].
There have been a number of other recent watermarking algorithms designed
to deal with geometric distortions. Of particular note is the recent work of Bas et
al [9]. They describe an algorithm based on the detection of salient features in an
image and the insertion of signals relative to these salient features. Experimental
results indicate that the method is robust to mirror re ection and rotation. However,
surprisingly, the system fails to survive other geometric distortions. A somewhat
related set of methods is described by Maes and van Overveld [90] and Rongen et al
[110]. These methods are based on geometrically warping local regions of an image
onto a set of random lines. However, currently, these methods are not robust to
geometric distortions, but rather, allow for a rapid, but exhaustive search through
the possible set of geometric distortions.

120
4.3 Algorithm
Consider an image i(x; y) and a rotated, scaled, and translated (RST) version of
this image, i0(x; y). Then we can write
i0(x; y) = i (� (xcos�+ ysin�)� x0; � (�xsin�+ ycos�) � y0) (4.3)
where the RST parameters are �, �, and (x0; y0) respectively.
The Fourier transform of i0(x; y) is I 0(fx; fy), the magnitude of which is given
by:
jI 0(fx; fy)j = j�j�2���I ���1(fxcos� + fysin�); �
�1(�fxsin�+ fycos�)���� : (4.4)
Equation 4.4 is independent of the translational parameters, (x0; y0). This is the
well known translation property of the Fourier transform [12].
If we now rewrite Equation 4.4 using log-polar coordinates, i.e.
fx = e�cos� (4.5)
fy = e�sin� (4.6)
then the magnitude of the Fourier spectrum can be written as
jI 0(fx; fy)j = j�j�2���I ���1e�cos(� � �); ��1e�sin(� � �)
���� (4.7)
= j�j�2���I �e(��log�)cos(� � �); e(��log�)sin(�� �)
���� (4.8)
or
jI 0(�; �)j = j�j�2 jI (� � log �; � � �)j : (4.9)
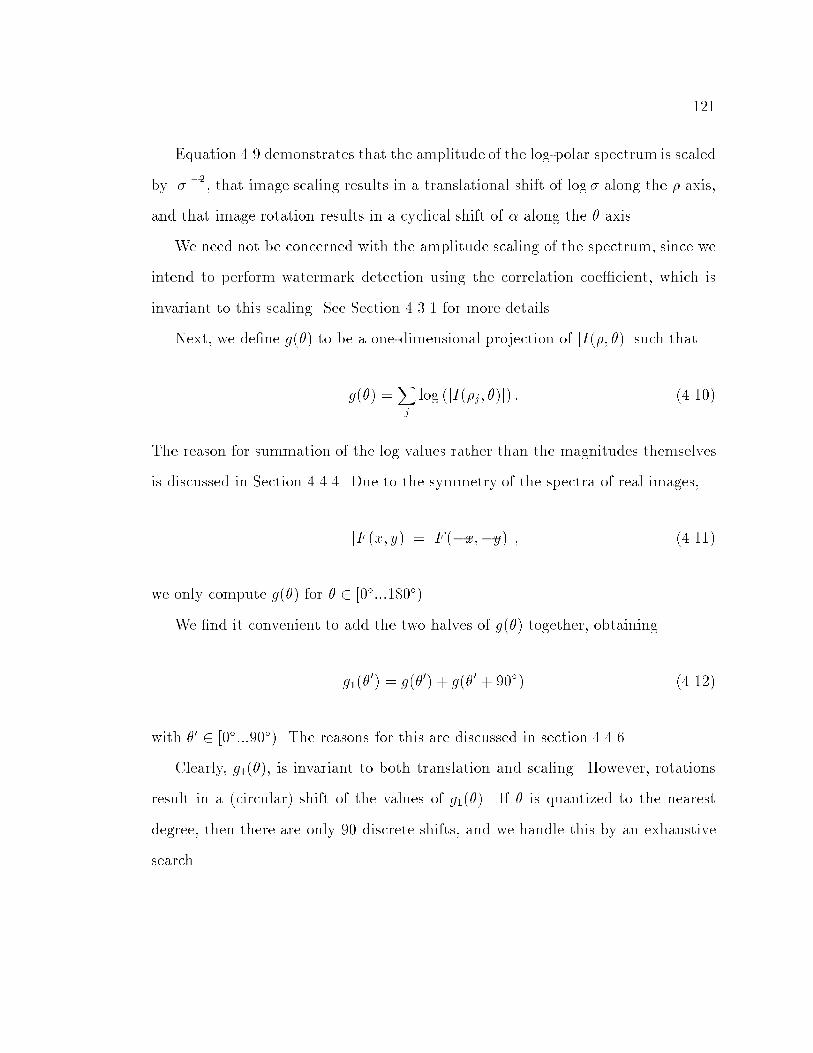
121
Equation 4.9 demonstrates that the amplitude of the log-polar spectrum is scaled
by j�j�2, that image scaling results in a translational shift of log � along the � axis,
and that image rotation results in a cyclical shift of � along the � axis.
We need not be concerned with the amplitude scaling of the spectrum, since we
intend to perform watermark detection using the correlation coe�cient, which is
invariant to this scaling. See Section 4.3.1 for more details.
Next, we de�ne g(�) to be a one-dimensional projection of jI(�; �)j such that
g(�) =Xj
log (jI(�j; �)j) : (4.10)
The reason for summation of the log values rather than the magnitudes themselves
is discussed in Section 4.4.4. Due to the symmetry of the spectra of real images,
jF (x; y)j = jF (�x;�y)j ; (4.11)
we only compute g(�) for � 2 [0�:::180�).
We �nd it convenient to add the two halves of g(�) together, obtaining
g1(�0) = g(�0) + g(�0 + 90�) (4.12)
with �0 2 [0�:::90�). The reasons for this are discussed in section 4.4.6.
Clearly, g1(�), is invariant to both translation and scaling. However, rotations
result in a (circular) shift of the values of g1(�). If � is quantized to the nearest
degree, then there are only 90 discrete shifts, and we handle this by an exhaustive
search.

122
4.3.1 Watermark detection process
In principle, detectors may be built that can handle watermarks encoding several
bits. However, the present detector determines only whether or not a given wa-
termark has been embedded in a given image. It takes as input, an image and a
watermark and the output is a single bit indicating whether the image contains the
watermark.
The watermark is expressed as a vector of length N . To determine whether
the watermark is present, an \extracted signal" v = g1(�) is computed from the
image, for N values of � evenly spaced between 0� and 90�. The extracted signal is
then compared to the watermark using the correlation coe�cient. If the correlation
coe�cient is above a detection threshold T , then the image is judged to contain the
watermark.1
Thus, the basic algorithm for watermark detection proceeds as follows:
1. Compute a discrete log-polar Fourier transform of the input image. This can
be thought of as an array of M rows by 2N columns, in which each row
corresponds to a value of �, and each column corresponds to a value of �.
2. Sum the logs of all the values in each column, and add the result of summing
column j to the result of summing column j +N (j = 0:::N � 1) to obtain an
invariant descriptor v, in which
vj = g1(�j) (4.13)
where �j is the angle that corresponds to column j in the discrete log-polar
Fourier transform matrix.
1The use of correlation coe�cient as a detection measure is recommended in [26]. One bene�tof this metric is its independence to scaling of the signal amplitudes.
123
3. Compute the correlation coe�cient D, between v and the input watermark
vector w, as
D =w � vq
(w � w)(v � v)(4.14)
4. IfD is greater than a threshold T , then indicate that the watermark is present.
Otherwise, indicate that it is absent.
4.3.2 Watermark embedding process
Once a method for detecting watermarks has been de�ned, we can construct a
watermark embedding algorithm which is similar to the methodology described in
[26]. In that paper, watermarking is cast as a case of communications with side
information at the transmitter, which is a con�guration studied by Shannon [118].
The di�erence between this view of watermarking, and a more common view, is as
follows.
In most public watermarking methods found in the literature, the original image
is considered to be noise. The embedder adds a small-amplitude signal to this noise,
and the detector must be sensitive enough to work with the small signal-to-noise
ratio that results.
However, this common approach ignores the fact that the embedder has complete
knowledge of the \noise" caused by the original image. If we view the embedder as
a transmitter and the cover image as a communications channel, then this knowl-
edge amounts to side-information about the behavior of that channel. When the
transmitter knows ahead of time what noise will be added to the signal, its optimal
strategy is to subtract that noise from the signal before transmission. The noise
then gets added back by the communications channel, and the receiver receives a
perfect reconstruction of the intended signal.
In the case of watermarking, it is unacceptable for the embedder to subtract

124
Figure 4-1: An example of feature vector shaping: the extracted signal is iterativelyshaped to the mixed signal, according to the watermark signal
the original image from the watermark before embedding the watermark, because
it would result in unacceptable �delity loss. In fact, if the watermark is expressed
as a pattern that is the same size as the image, then this strategy simply replaces
the image with the watermark pattern, which is clearly too drastic. However, when
the watermark is expressed as a signal in a lower-dimensional space, as is the case
with the present system, the results need not be so drastic, since a wide variety
of full-resolution images project into the same extracted signal and the embedder
may choose the one that most resembles the original. But even in the case of
lower-dimensional watermarks, it is not always possible to completely replace the
extracted signal with the watermark signal while maintaining acceptable �delity.
To makemaximal use of the side-information at the embedder, while maintaining
acceptable �delity, [26] introduces the idea of a \mixing function", f(v;w). This
takes an extracted signal v, and a watermark vector w, as input, and the output
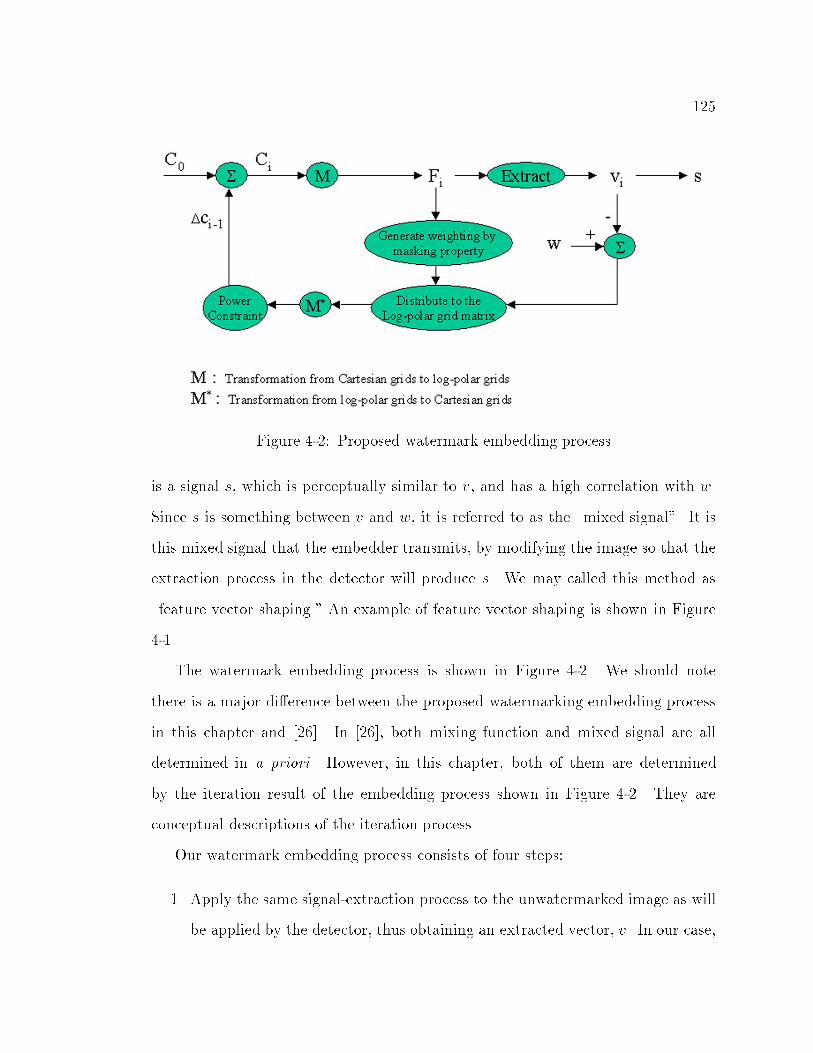
125
Figure 4-2: Proposed watermark embedding process
is a signal s, which is perceptually similar to v, and has a high correlation with w.
Since s is something between v and w, it is referred to as the \mixed signal". It is
this mixed signal that the embedder transmits, by modifying the image so that the
extraction process in the detector will produce s. We may called this method as
\feature vector shaping." An example of feature vector shaping is shown in Figure
4-1.
The watermark embedding process is shown in Figure 4-2. We should note
there is a major di�erence between the proposed watermarking embedding process
in this chapter and [26]. In [26], both mixing function and mixed signal are all
determined in a priori. However, in this chapter, both of them are determined
by the iteration result of the embedding process shown in Figure 4-2. They are
conceptual descriptions of the iteration process.
Our watermark embedding process consists of four steps:
1. Apply the same signal-extraction process to the unwatermarked image as will
be applied by the detector, thus obtaining an extracted vector, v. In our case,

126
this means computing g1(�). In Figure 4-2, C0 is the DFT magnitudes of the
unwatermarked image, Ci is the DFT magnitudes of the watermarked image
after i times of iteration, and Fi is the log-polar map magnitudes after i� th
iteration.
2. Compare the extracted vector, v, to the watermark vector, w. Calculate the
di�erences between this two vectors, and then estimate the required change
in the individual log-polar grids. The required changes are based on a weight-
ing set generated according to the contrast masking property of the original
log-polar coe�cients. In this chapter, we use the weighting set which is pro-
portional to logFi.
3. Transform the estimated changes from log-polar grids to Cartesian grids. They
are performed using linear interpolation. We add an energy constraint on the
estimated changes in the Cartesian DFT domain. Modify the original image
so that, when the signal-extraction process is applied to it, the result will be
vi instead of v.
4. Repeat the �rst three steps until the estimated changes are all smaller than
a threshold, or until a de�ned maximum iteration number (which is 5 in our
process).
Step 2 and 3 are the most di�cult. A natural approach would be to modify
all the values in column j of the log-polar Fourier transform so that their logs sum
to sj instead of vj. This can be done, for example, by adding (sj � vj)=K to each
of the K values in column j. Next, we would invert the log-polar resampling of
the Fourier magnitudes, thus obtaining a modi�ed, Cartesian Fourier magnitude.
Finally, the complex terms of the original Fourier transform would be scaled to
have the new magnitudes found in the modi�ed Fourier transform, and the inverse
127
Fourier transform would be applied to obtain the watermarked image.
The main implementation issue in such an approach is the inherent instability
in inverting the log-polar resampling. We therefore approximate this step with an
iterative method in which a local inversion of the interpolation function is used for
the resampling. The method is shown in Figure 4-2 and further discussed in Section
4.4.2.
4.4 Implementation problems and solutions
There are a number of problems that arise when implementing the algorithm of
Section 4.3. Several of these are addressed below.
4.4.1 Rectilinear tiling implied by DFT
The log-polar Fourier transform of an image can be computed by resampling the
image DFT with a log-polar grid. Some interpolation method must be used during
the resampling, since the log-polar sample points don't generally coincide with the
Cartesian sample points in the DFT.
The DFT is conventionally assumed to represent a tiled version of an image,
as illustrated in Figure 4-3(a). Stone et al [123] have noted that this tiling pat-
tern represents an inherent problem for any algorithm that relies on the rotational
properties of Fourier transforms, since, when the content of an image is rotated, the
rectilinear tiling grid is not rotated along with it. Thus, the DFT of a rotated image
is not the rotated DFT of that image. The problem is illustrated in Figure 4-3(b)
and (c).
One possible solution is to compute the log-polar Fourier transform directly,
without using the Cartesian DFT as an intermediate step. In the continuous Fourier
domain, each point has a value determined by correlating the image with a complex,
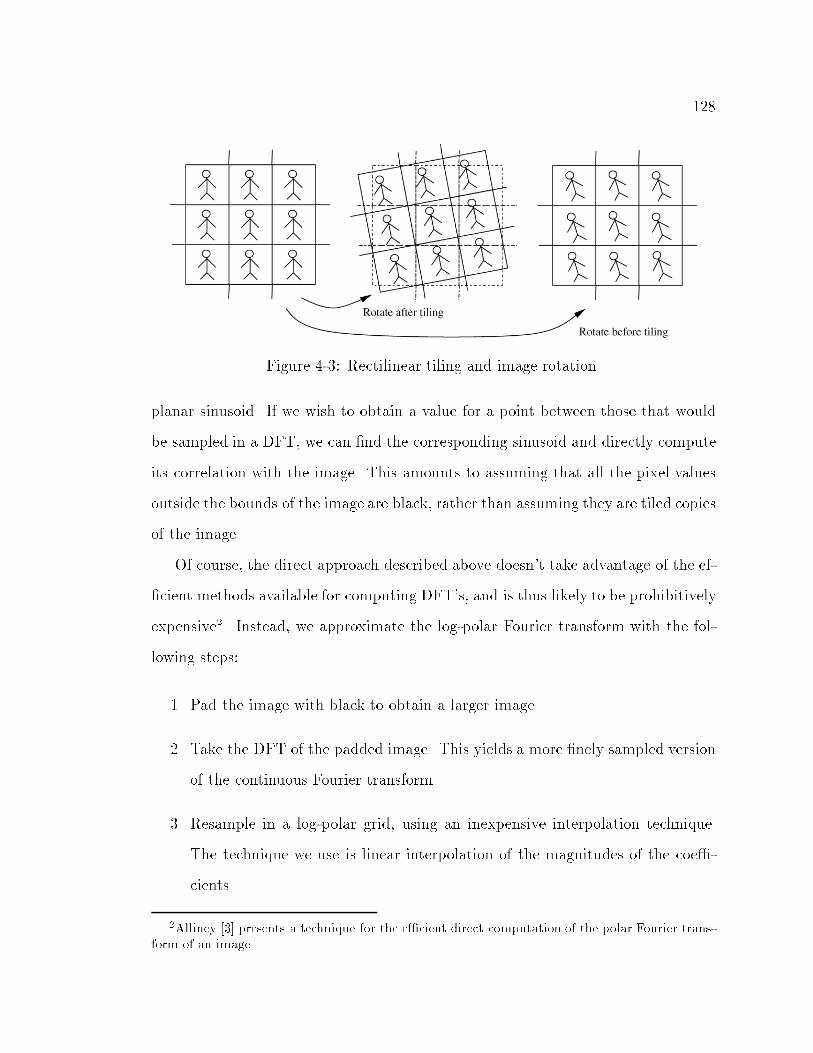
128
Figure 4-3: Rectilinear tiling and image rotation.
planar sinusoid. If we wish to obtain a value for a point between those that would
be sampled in a DFT, we can �nd the corresponding sinusoid and directly compute
its correlation with the image. This amounts to assuming that all the pixel values
outside the bounds of the image are black, rather than assuming they are tiled copies
of the image.
Of course, the direct approach described above doesn't take advantage of the ef-
�cient methods available for computing DFT's, and is thus likely to be prohibitively
expensive2. Instead, we approximate the log-polar Fourier transform with the fol-
lowing steps:
1. Pad the image with black to obtain a larger image.
2. Take the DFT of the padded image. This yields a more �nely sampled version
of the continuous Fourier transform.
3. Resample in a log-polar grid, using an inexpensive interpolation technique.
The technique we use is linear interpolation of the magnitudes of the coe�-
cients.
2Alliney [3] presents a technique for the e�cient direct computation of the polar Fourier trans-form of an image.
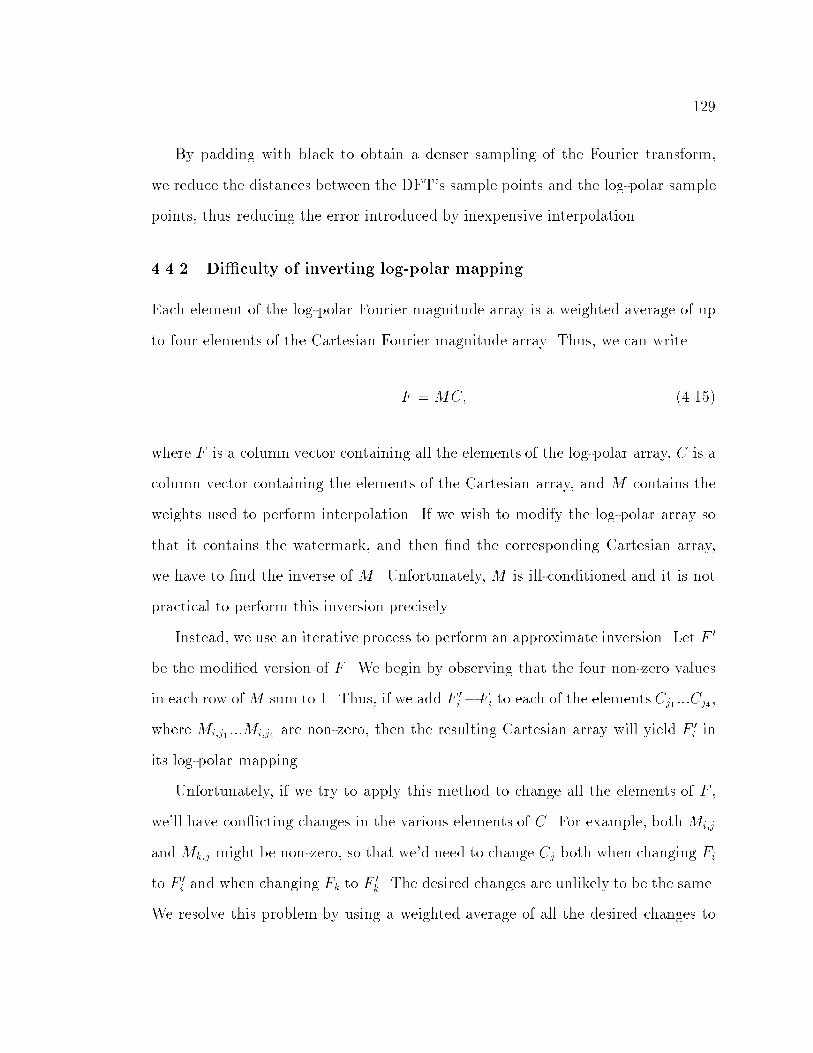
129
By padding with black to obtain a denser sampling of the Fourier transform,
we reduce the distances between the DFT's sample points and the log-polar sample
points, thus reducing the error introduced by inexpensive interpolation.
4.4.2 Di�culty of inverting log-polar mapping
Each element of the log-polar Fourier magnitude array is a weighted average of up
to four elements of the Cartesian Fourier magnitude array. Thus, we can write
F =MC; (4.15)
where F is a column vector containing all the elements of the log-polar array, C is a
column vector containing the elements of the Cartesian array, and M contains the
weights used to perform interpolation. If we wish to modify the log-polar array so
that it contains the watermark, and then �nd the corresponding Cartesian array,
we have to �nd the inverse of M . Unfortunately, M is ill-conditioned and it is not
practical to perform this inversion precisely.
Instead, we use an iterative process to perform an approximate inversion. Let F 0
be the modi�ed version of F . We begin by observing that the four non-zero values
in each row ofM sum to 1. Thus, if we add F 0i �Fi to each of the elementsCj1 :::Cj4,
where Mi;j1 :::Mi;j4 are non-zero, then the resulting Cartesian array will yield F 0i in
its log-polar mapping.
Unfortunately, if we try to apply this method to change all the elements of F ,
we'll have con icting changes in the various elements of C. For example, both Mi;j
and Mk;j might be non-zero, so that we'd need to change Cj both when changing Fi
to F 0i and when changing Fk to F
0k. The desired changes are unlikely to be the same.
We resolve this problem by using a weighted average of all the desired changes to

130
each element of C. So, in the above example, we would change the value of Cj by
Mi;j(F0i � Fi) +Mk;j(F
0k � Fk)
Mi;j +Mk;j(4.16)
(assuming that Mi;j and Mk;j are the only nonzero elements of column j).
The above method results in a rough approximation to the desired inversion. We
can obtain successively better approximations by applying the operation iteratively.
In practice, we �nd it most e�ective to iterate the entire watermark embedding
process described in section 4.3.2, using the above approximate log-polar inversion
in each iteration. We have found that three or four iterations usually su�ce to
produce an approximation that can be detected.
4.4.3 Orientation of image boundaries
It is well known that the rectangular boundary of an image usually causes a \cross"
artifact in the image's energy spectrum (see Figure 4-4). This happens because
there is usually a large discontinuity at each edge of the image due to the implicit
tiling. The DFT magnitude of such vertical and horizontal discontinuities has large
energy in all the vertically and horizontally oriented frequencies, which results in
the cross artifact.
If the image is rotated, but padded with black so that no image content is
cropped, then the cross in the DFT magnitude will also rotate (Figure 4-5). If, on
the other hand, the rotated image is cropped, so that no black is added, then the
new image boundaries cause a horizontal and vertical cross similar to that found in
the original image, even though the rest of the DFT magnitude is rotated (Figure 4-
6). Since the cross has so much energy, it tends to cause two large bumps in the
extracted watermark vector, which substantially reduce the correlation coe�cient
with the embedded watermark.
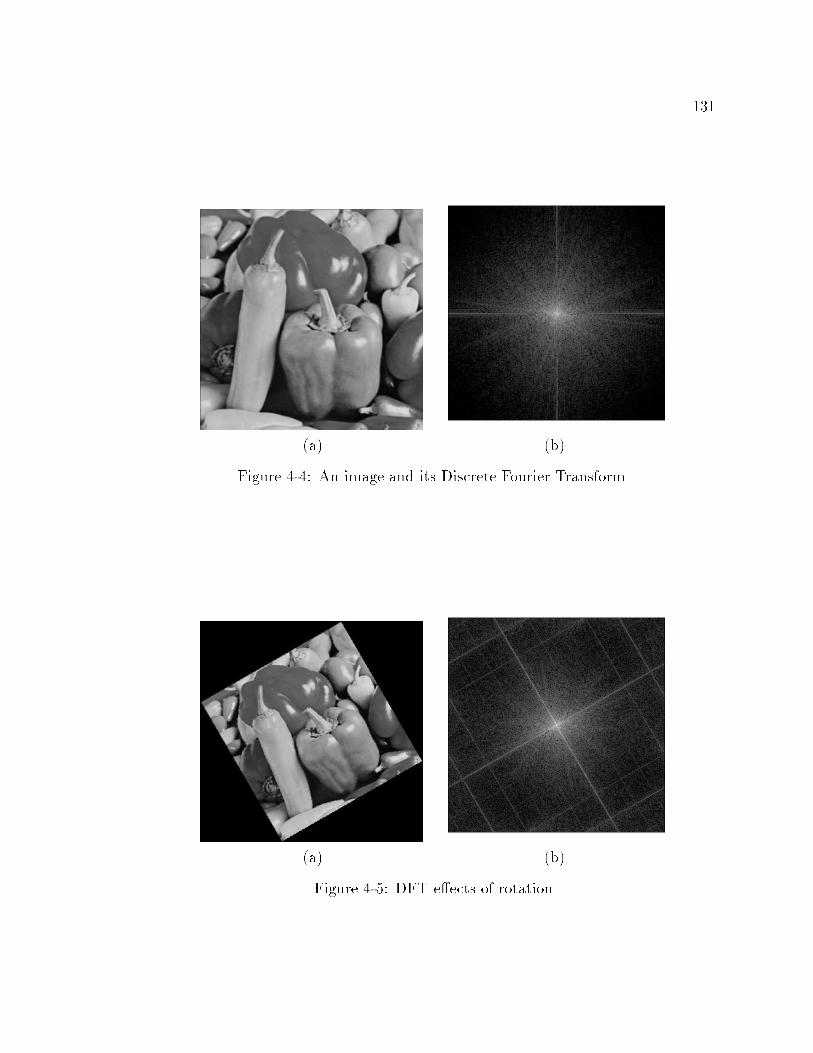
131
(a) (b)
Figure 4-4: An image and its Discrete Fourier Transform.
(a) (b)
Figure 4-5: DFT e�ects of rotation

132
(a) (b)
Figure 4-6: DFT e�ects of rotation and cropping
Our present solution to this problem is to simply ignore the bumps in the ex-
tracted signal by ignoring a neighborhood around each of the two highest-valued
elements. Alternative solutions that appear in the literature include multiplication
of the image by a circularly-symmetric window [32] and blurring of the image edges
[92]. These solutions are probably more general than the one employed here, but
would require modi�cation to the watermark embedder, and has been left for future
work.
4.4.4 Dynamic range of frequency magnitudes
The magnitude of low frequencies can be very much larger than the magnitude of
mid and high frequencies. In these circumstances, the low frequencies can become
overwhelming. To reduce this problem, we sum the logs of the magnitudes of the fre-
quencies along the columns of the log-polar Fourier transform, rather than summing
the magnitudes themselves.
A bene�cial side-e�ect of this is that a desired change in a given frequency
is expressed as a fraction of the frequency's current magnitude rather than as an

133
absolute value. This is better from a �delity perspective.
4.4.5 Unreliability of extreme frequencies
It is well known that the lowest and highest frequencies in an image are usually
unreliable for watermarking. The low frequencies are unreliable because they are
di�cult to modify without making visible changes in the image. The high frequen-
cies are unreliable because they can be easily modi�ed by common processes such
as compression, printing, and analog transmission. Our solution is to neglect these
unreliable frequencies when extracting the watermark.
A better solution would be to use a perceptual model to estimate the max-
imum amount of change that can be applied to each frequency and a model of
speci�c attacks to estimate the degree of robustness. The amount of watermark
energy embedded into each frequency would then be proportional to this perceptual
signi�cance and robustness. Such an approach is discussed in [24, 25, 107, 141].
Application of this idea to the present watermarking method is a topic for future
research.
4.4.6 Images are rotationally asymmetric
The energy in an image is seldom evenly distributed in angular frequency. Images
frequently have a large amount of energy in one group of directions, while hav-
ing much lower energy in an orthogonal group of directions. For example, images
containing buildings and trees have signi�cant vertical structure yielding more en-
ergy in the horizontal frequencies than in the vertical (Figure 4-7), while seascapes
or sunsets are strongly oriented in the horizontal direction yielding higher vertical
frequencies (Figure 4-8).
Spectra such as those of Figures 4-7 and 4-8 suggest an uneven masking ability
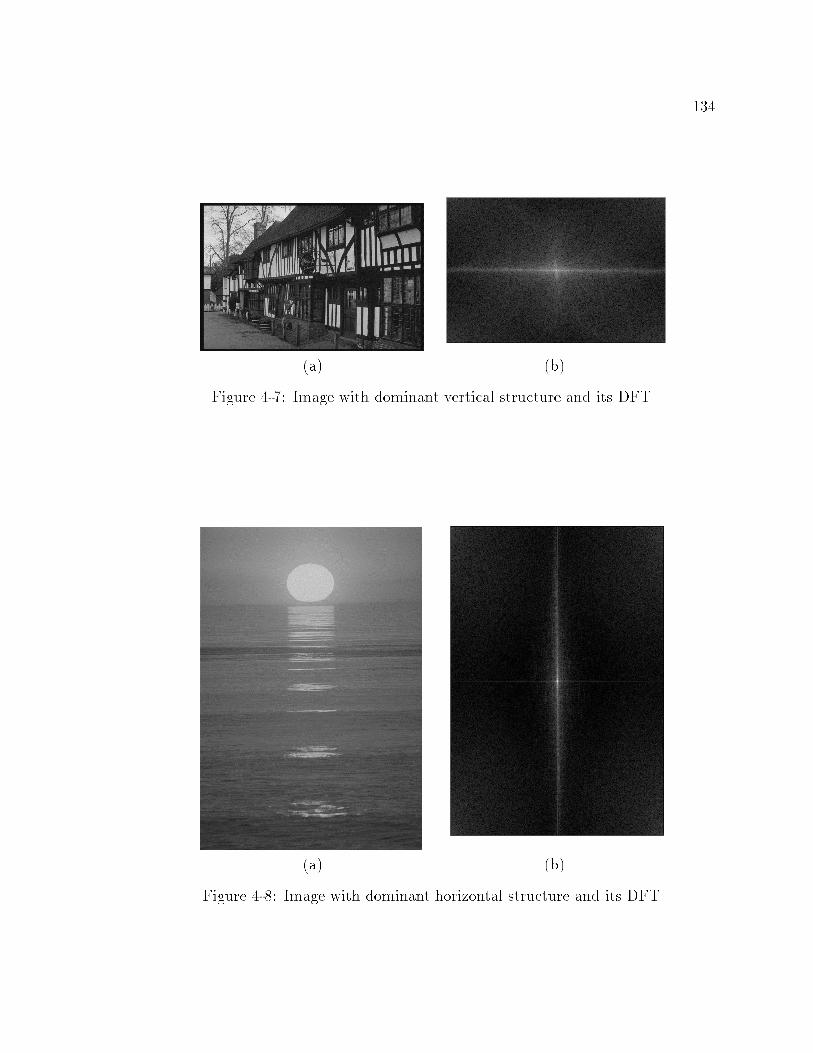
134
(a) (b)
Figure 4-7: Image with dominant vertical structure and its DFT.
(a) (b)
Figure 4-8: Image with dominant horizontal structure and its DFT.

135
in orthogonal directions. As a consequence, it may be much easier, from a �delity
perspective, to embed some portions of the watermark than others. For example,
when watermarking the image of tall buildings, we can more easily hide noise with
a strong vertical component than noise with a strong horizontal component. This
can be a problem if the di�cult-to-modify portions of the watermark are critical in
di�erentiating it from other watermarks.
To reduce this problem, we divide the extracted signal into two halves, and add
the two halves together. Thus, rather than using g(�) of Equation 4.10, we use
g1(�), of Equation 4.12.
If we want to modify an element of g1(�), we can do so by hiding noise that's
oriented along either angle � or angle � + 90�. This increases the likelihood that
each element of the watermark can be embedded within the �delity constraints.
4.4.7 High correlation between elements of extracted watermark
For natural images, g1(�) is likely to vary smoothly as a function of �. In other words,
the extracted signal will have more low-frequency content than high-frequency con-
tent. This reduces the e�ectiveness of the correlation coe�cient as a detection
measure.
We improve the detection measure by applying a whitening �lter to both the ex-
tracted signal and the watermark being tested for before computing the correlation
coe�cient. Note that the whitening �lter is employed only in the watermark detec-
tor; the embedder is unchanged. The whitening �lter was designed to decorrelate
the elements of signals extracted from natural images, and was derived from signals
extracted from 10,000 images from [21]. These images were not used in any of the
subsequent experiments reported in Section 4.5.
The idea of using a whitening �lter to improve watermark detection in this way
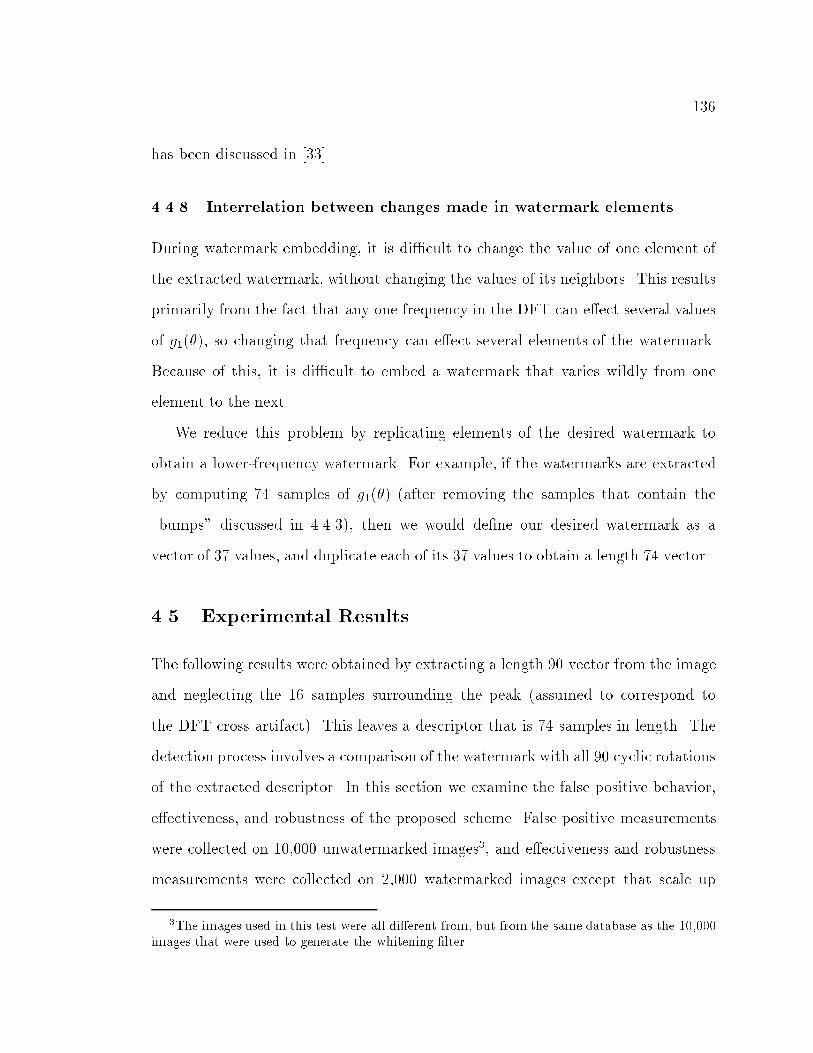
136
has been discussed in [33].
4.4.8 Interrelation between changes made in watermark elements
During watermark embedding, it is di�cult to change the value of one element of
the extracted watermark, without changing the values of its neighbors. This results
primarily from the fact that any one frequency in the DFT can e�ect several values
of g1(�), so changing that frequency can e�ect several elements of the watermark.
Because of this, it is di�cult to embed a watermark that varies wildly from one
element to the next.
We reduce this problem by replicating elements of the desired watermark to
obtain a lower-frequency watermark. For example, if the watermarks are extracted
by computing 74 samples of g1(�) (after removing the samples that contain the
\bumps" discussed in 4.4.3), then we would de�ne our desired watermark as a
vector of 37 values, and duplicate each of its 37 values to obtain a length 74 vector.
4.5 Experimental Results
The following results were obtained by extracting a length 90 vector from the image
and neglecting the 16 samples surrounding the peak (assumed to correspond to
the DFT cross artifact). This leaves a descriptor that is 74 samples in length. The
detection process involves a comparison of the watermark with all 90 cyclic rotations
of the extracted descriptor. In this section we examine the false positive behavior,
e�ectiveness, and robustness of the proposed scheme. False positive measurements
were collected on 10,000 unwatermarked images3, and e�ectiveness and robustness
measurements were collected on 2,000 watermarked images except that scale up
3The images used in this test were all di�erent from, but from the same database as the 10,000images that were used to generate the whitening �lter.

137
with cropping used only 947 images and JPEG compression used 1909.
4.5.1 Probability of False Positive
We begin our evaluation of the new watermarking method by �nding the relationship
between the threshold and the probability of false positive. A false positive or false
detection occurs when the detector incorrectly concludes that an unwatermarked
image contains a given watermark. Thus, the probability of false positive is de�ned
as
Pfp = P fDmax > Tg (4.17)
where Dmax is a detection value obtained by running the detector on a randomly
selected, unwatermarked image and T is the detection threshold. The subscript max
speci�es the maximum detection value from all of the cyclical shifts examined.
This probability is estimated empirically by applying the detector to 10,000 un-
watermarked images from [21], testing for 10 di�erent binary watermarks in each.
The 10 resulting histograms are shown in Figure 4-9(a) superimposed on one an-
other. The probability of false positive is then plotted in Figure 4-10(b) as a function
of threshold. Again, each trace corresponds to one of the 10 watermarks.
Figure 4-9(a) indicates that most detection values from unwatermarked images
fall between 0.2 and 0.4. This might seem surprising, since we might expect un-
watermarked images to yield detection values closer to zero. The reason the values
are so high is that each one is the maximum of 90 di�erent correlation coe�cients,
computed during the cyclical search (see section 4.3.1, step 3). This means that
Pfp = P fDmax > Tg = P f(D0 > T ) or (D1 > T ) or : : : (D89 > T )g (4.18)
where D0:::D89 are the 90 correlation coe�cients computed during the search. Each
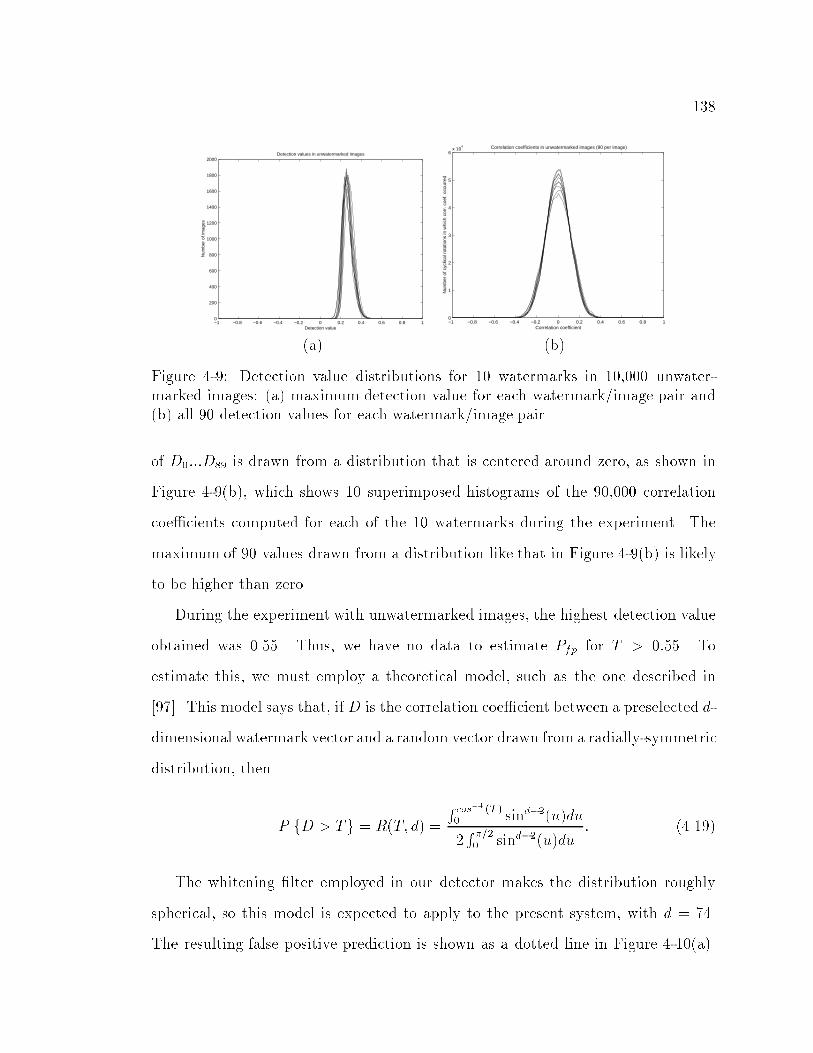
138
−1 −0.8 −0.6 −0.4 −0.2 0 0.2 0.4 0.6 0.8 10
200
400
600
800
1000
1200
1400
1600
1800
2000Detection values in unwatermarked images
Detection value
Num
ber
of im
ages
−1 −0.8 −0.6 −0.4 −0.2 0 0.2 0.4 0.6 0.8 10
1
2
3
4
5
6x 10
4 Correlation coefficients in unwatermarked images (90 per image)
Num
ber
of c
yclic
al r
otat
ions
in w
hich
cor
r. c
oef.
occu
rred
Correlation coefficient
(a) (b)
Figure 4-9: Detection value distributions for 10 watermarks in 10,000 unwater-marked images: (a) maximum detection value for each watermark/image pair and(b) all 90 detection values for each watermark/image pair.
of D0:::D89 is drawn from a distribution that is centered around zero, as shown in
Figure 4-9(b), which shows 10 superimposed histograms of the 90,000 correlation
coe�cients computed for each of the 10 watermarks during the experiment. The
maximum of 90 values drawn from a distribution like that in Figure 4-9(b) is likely
to be higher than zero.
During the experiment with unwatermarked images, the highest detection value
obtained was 0.55. Thus, we have no data to estimate Pfp for T > 0:55. To
estimate this, we must employ a theoretical model, such as the one described in
[97]. This model says that, if D is the correlation coe�cient between a preselected d-
dimensional watermark vector and a random vector drawn from a radially-symmetric
distribution, then
P fD > Tg = R(T; d) =
R cos�1(T )0 sind�2(u)du
2R �=20 sind�2(u)du
: (4.19)
The whitening �lter employed in our detector makes the distribution roughly
spherical, so this model is expected to apply to the present system, with d = 74.
The resulting false positive prediction is shown as a dotted line in Figure 4-10(a).

139
0 0.1 0.2 0.3 0.4 0.5 0.6 0.7 0.8 0.9 110
−8
10−7
10−6
10−5
10−4
10−3
10−2
10−1
100
Correlation coefficients in unwatermarked images (90 per image)
Threshold
Pro
babi
lity
of e
xcee
ding
thre
shol
d
0 0.1 0.2 0.3 0.4 0.5 0.6 0.7 0.8 0.9 110
−8
10−7
10−6
10−5
10−4
10−3
10−2
10−1
100
Detection values in unwatermarked images
Threshold
Pro
babi
lity
of e
xcee
ding
thre
shol
d
(a) (b)
Figure 4-10: False positive rates measured with 10,000 unwatermarked images, (a)individual correlation coe�cients and (b) �nal detection value. Each solid trace cor-responds to one of 10 di�erent watermark vectors. Dashed line represents theoreticalestimates.
The model predicts the probability that one correlation coe�cient is greater than the
threshold, not the probability that the maximum of several coe�cients is greater.
Thus, it predicts P fDi > Tg ; i 2 [0:::89], rather than P fDmax > Tg. Figure 4-
10(a) indicates how well the model predicted P fDi > Tg in our experiment.
We obtain an estimated upper bound on P fDmax > Tg by observing that
P fQ0 or Q1 or : : :Qn�1g � min
1;Xi
P fQig!
(4.20)
When Qi corresponds to the event (Di > T ), and n = 90, we obtain
P fDmax > Tg � min(1; 90 �R(T; 74)) : (4.21)
This prediction is shown in Figure 4-10(b) as a dotted line.
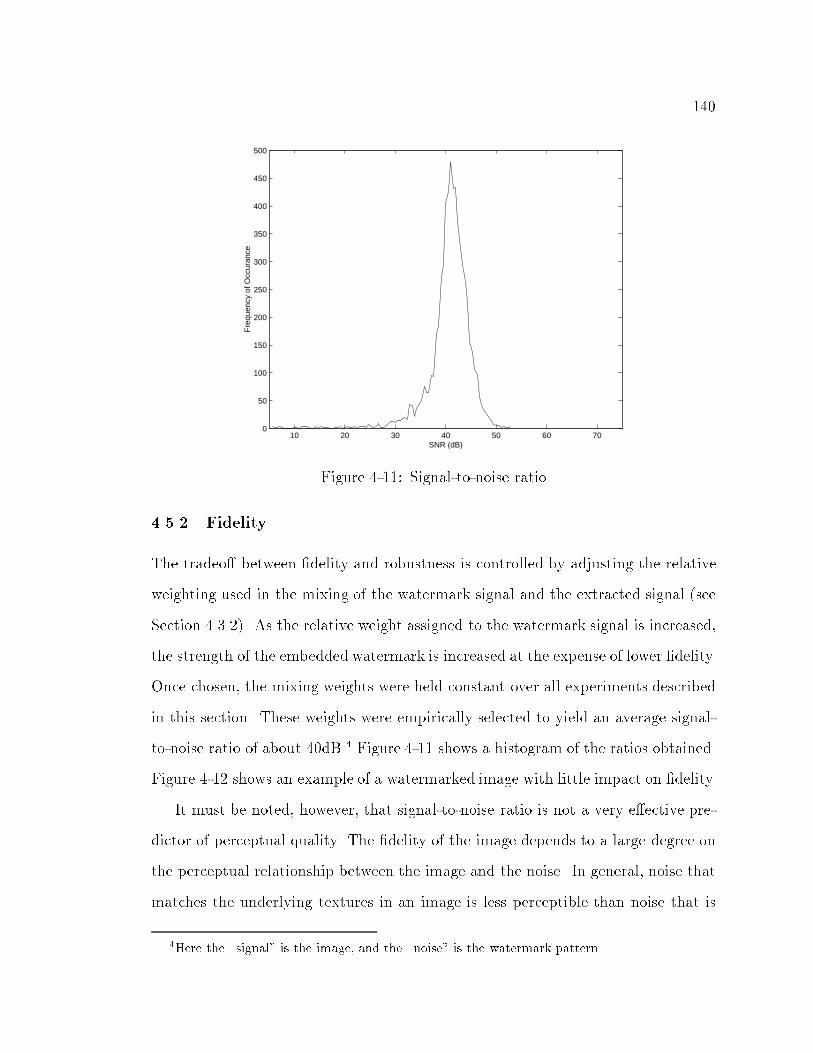
140
10 20 30 40 50 60 700
50
100
150
200
250
300
350
400
450
500
Fre
quen
cy o
f Occ
uran
ce
SNR (dB)
Figure 4-11: Signal-to-noise ratio
4.5.2 Fidelity
The tradeo� between �delity and robustness is controlled by adjusting the relative
weighting used in the mixing of the watermark signal and the extracted signal (see
Section 4.3.2). As the relative weight assigned to the watermark signal is increased,
the strength of the embedded watermark is increased at the expense of lower �delity.
Once chosen, the mixing weights were held constant over all experiments described
in this section. These weights were empirically selected to yield an average signal-
to-noise ratio of about 40dB.4 Figure 4-11 shows a histogram of the ratios obtained.
Figure 4-12 shows an example of a watermarked image with little impact on �delity.
It must be noted, however, that signal-to-noise ratio is not a very e�ective pre-
dictor of perceptual quality. The �delity of the image depends to a large degree on
the perceptual relationship between the image and the noise. In general, noise that
matches the underlying textures in an image is less perceptible than noise that is
4Here the \signal" is the image, and the \noise" is the watermark pattern.

141
Figure 4-12: Watermarking with little impact on �delity
very di�erent from the image, even at the same signal-to-noise ratios.
The present system generates watermark patterns by making small percentage
adjustments to the powers of frequencies in the image's spectrum, so the resulting
noise pattern is usually similar to the textures in the image. Thus, when we water-
mark an image that contains a homogeneous texture, the watermark is well-hidden.
But when we mark an image that contains widely varying textures, the mark can
become visible. Figure 4-13 illustrates the problem. The watermark strength in
this �gure was increased so that the problem should be visible after printing in a
journal.
Solving the �delity problem in non-homogeneous images would require a modi�-
cation to the algorithm that attenuates or shapes the watermark according to local
texture characteristics. This has been left for future work.
4.5.3 E�ectiveness
The e�ectiveness of a watermarking scheme is measured as the probability that
the output of the watermark embedder will contain the watermark, subject to con-
straints on the �delity of the marked image and the detection threshold or prob-
ability of false positive. The e�ectiveness of the current scheme is measured and
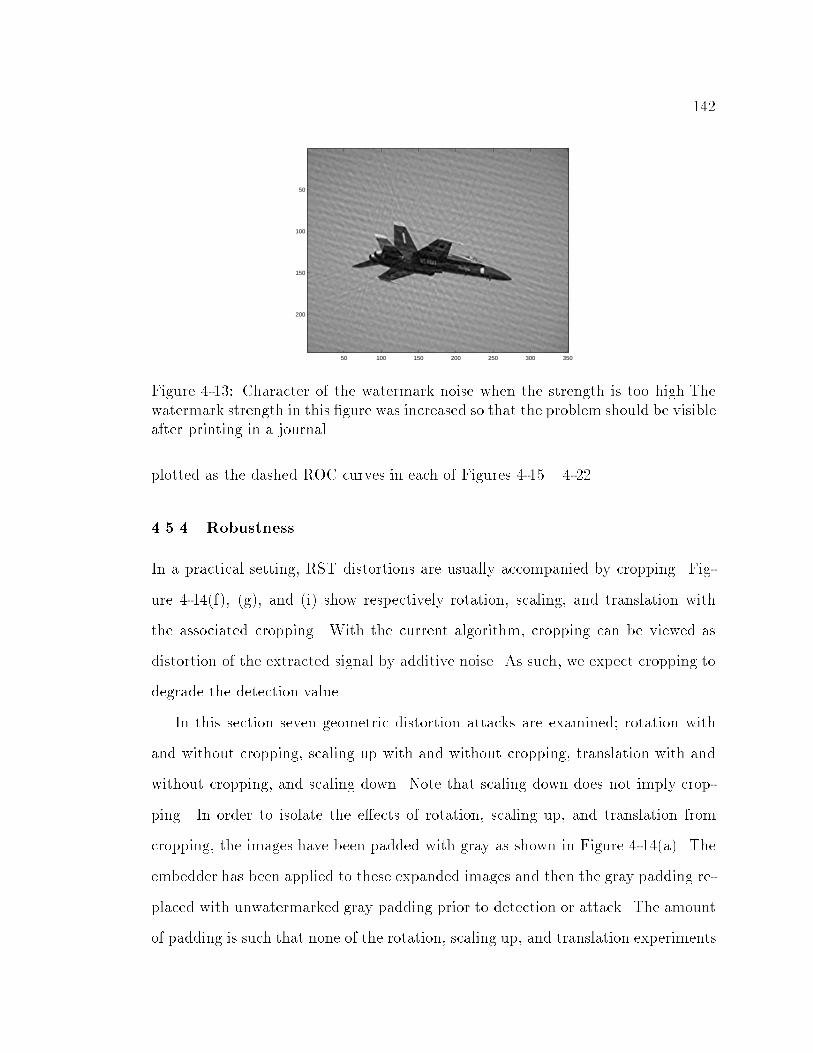
142
50 100 150 200 250 300 350
50
100
150
200
Figure 4-13: Character of the watermark noise when the strength is too high.Thewatermark strength in this �gure was increased so that the problem should be visibleafter printing in a journal.
plotted as the dashed ROC curves in each of Figures 4-15 { 4-22.
4.5.4 Robustness
In a practical setting, RST distortions are usually accompanied by cropping. Fig-
ure 4-14(f), (g), and (i) show respectively rotation, scaling, and translation with
the associated cropping. With the current algorithm, cropping can be viewed as
distortion of the extracted signal by additive noise. As such, we expect cropping to
degrade the detection value.
In this section seven geometric distortion attacks are examined; rotation with
and without cropping, scaling up with and without cropping, translation with and
without cropping, and scaling down. Note that scaling down does not imply crop-
ping. In order to isolate the e�ects of rotation, scaling up, and translation from
cropping, the images have been padded with gray as shown in Figure 4-14(a). The
embedder has been applied to these expanded images and then the gray padding re-
placed with unwatermarked gray padding prior to detection or attack. The amount
of padding is such that none of the rotation, scaling up, and translation experiments

143
a b c d
e f g h i
Figure 4-14: Examples of geometric attacks: (e) and (a) are the original and paddedoriginal respectively, (b)-(d) attacks without cropping, and (f)-(i) attacks with crop-ping
cause image data to be cropped. The only data that is cropped is unwatermarked
padding. Thus, the di�erences between the detection values prior to rotation and
those after rotation can be attributed solely to the rotation as the associated crop-
ping of unwatermarked padding does not e�ect the detection value.
The detection value prior to attack is used to measure the e�ectiveness of the
watermarking scheme. This e�ectiveness is likely to be reduced in the padded
examples since a portion of the watermarked image (the watermarked gray padding)
has been replaced with non-watermarked padding. However, the purpose of the
experiments based on these padded geometric attacks, shown in Figure 4-14(b)-(d),
is to isolate the e�ects due to geometric distortions from those due to cropping.
4.5.4.1 Rotation
Two experiments were performed to test the watermark's robustness against rota-
tion. The �rst experiment was designed to isolate the e�ects of rotation from all
other types of attack. The second was a more realistic test of the e�ects of rotation
with cropping.

144
Each trial of the �rst test comprised the following steps:
1. Pad an image with neutral gray, increasing its size. The amount of padding
was chosen to allow rotation without any part of the original image going
outside of the image boundaries (Figure 4-14(a)).
2. Embed a randomly-selected watermark in the padded image.
3. Replace the padding with neutral gray again. This removes any watermark
information from the neutral gray area.
4. Run the watermark detector on the image to obtain a detection value before
rotation.
5. Rotate the image by a predetermined angle, and crop to the original size.
Figure 4-14(b) shows what an image looks like after this step. Note that only
the padding is cropped, so we do not crop o� any of the watermark pattern.
6. Run the watermark detector on the image to obtain a detection value after
rotation.
Since the padding that's cropped o� during rotation contains no watermark
pattern, any di�erence between the \before" value obtained in step 4 and the \after"
value obtained in step 6 can only result from the e�ects of rotation.
This experiment was performed on 2,000 images with rotations of 4�, 8�, 30�, and
45�. We limited this test to a maximum rotation of 45� because rotations beyond
45� are equivalent to smaller rotations after a rotation of 90�. An image that has
been rotated 90� yields exactly the same extracted vector as an unrotated image,
so a rotation of greater than 45� should behave the same as a smaller rotation.
As indicated in Figure 4-15(a), the di�erent rotations yielded essentially the same
results. Figure 4-15(b) shows receiver-operating-characteristic (ROC) curves before
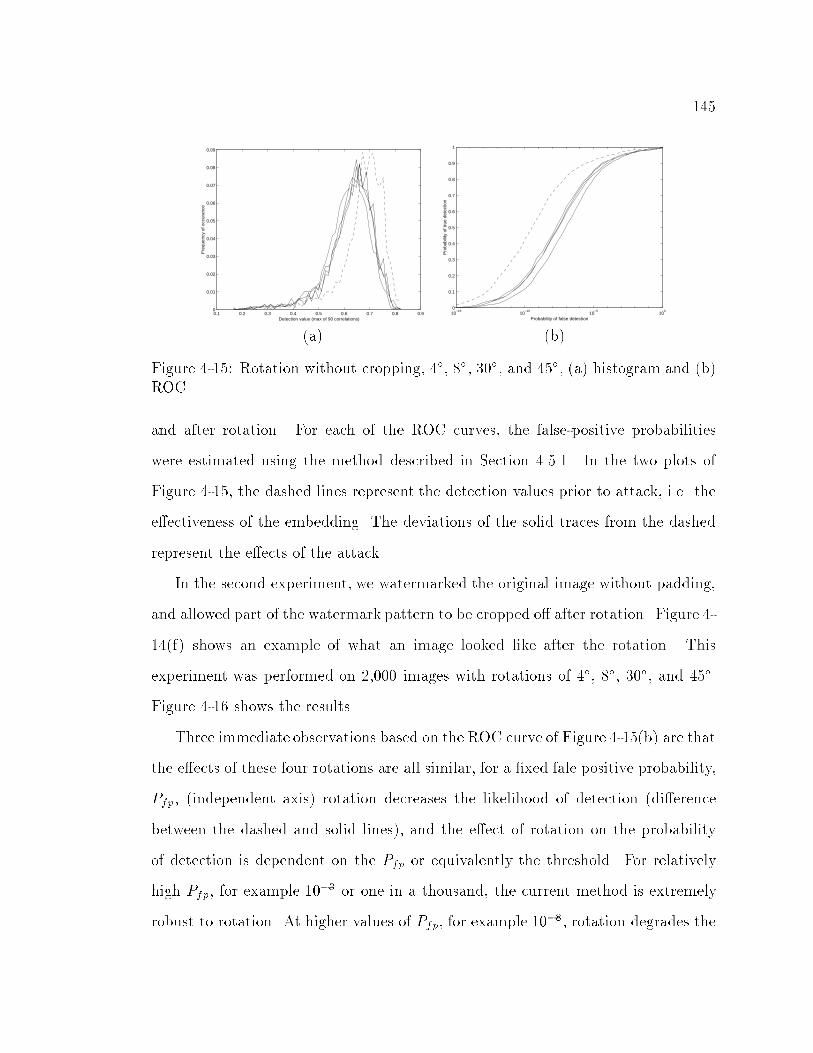
145
0.1 0.2 0.3 0.4 0.5 0.6 0.7 0.8 0.90
0.01
0.02
0.03
0.04
0.05
0.06
0.07
0.08
0.09
Fre
quen
cy o
f occ
uran
ce
Detection value (max of 90 correlations)10
−1510
−1010
−510
00
0.1
0.2
0.3
0.4
0.5
0.6
0.7
0.8
0.9
1
Pro
babi
lity
of tr
ue d
etec
tion
Probability of false detection
(a) (b)
Figure 4-15: Rotation without cropping, 4�, 8�, 30�, and 45�, (a) histogram and (b)ROC
and after rotation. For each of the ROC curves, the false-positive probabilities
were estimated using the method described in Section 4.5.1. In the two plots of
Figure 4-15, the dashed lines represent the detection values prior to attack, i.e. the
e�ectiveness of the embedding. The deviations of the solid traces from the dashed
represent the e�ects of the attack.
In the second experiment, we watermarked the original image without padding,
and allowed part of the watermark pattern to be cropped o� after rotation. Figure 4-
14(f) shows an example of what an image looked like after the rotation. This
experiment was performed on 2,000 images with rotations of 4�, 8�, 30�, and 45�.
Figure 4-16 shows the results.
Three immediate observations based on the ROC curve of Figure 4-15(b) are that
the e�ects of these four rotations are all similar, for a �xed fale positive probability,
Pfp, (independent axis) rotation decreases the likelihood of detection (di�erence
between the dashed and solid lines), and the e�ect of rotation on the probability
of detection is dependent on the Pfp or equivalently the threshold. For relatively
high Pfp, for example 10�3 or one in a thousand, the current method is extremely
robust to rotation. At higher values of Pfp, for example 10�8, rotation degrades the

146
0.1 0.2 0.3 0.4 0.5 0.6 0.7 0.8 0.90
0.02
0.04
0.06
0.08
0.1
0.12
Fre
quen
cy o
f occ
uran
ce
Detection value (max of 90 correlations)10
−1510
−1010
−510
00
0.1
0.2
0.3
0.4
0.5
0.6
0.7
0.8
0.9
1
Pro
babi
lity
of tr
ue d
etec
tion
Probability of false detection
4 degrees
8 degrees
(a) (b)
Figure 4-16: Rotation with cropping, 4�, 8�, 30�, and 45�, (a) histogram and (b)ROC
detection value more signi�cantly. Figure 4-16(b) further shows that the cropping
that accompanies rotation has a signi�cant, negative impact on detection (downward
shift of the solid lines in Figure 4-16(b) from those in Figure 4-15(b)), and the
deterioration of the detection value is more dependent on rotation angle (di�erent
rotations result in di�erent amounts of cropping).
These ROC curves emphasize the importance of the baseline measurement (dashed
lines), which serves as an upper bound on robustness. They also show that each
of the two experiments begin from a di�erent baseline. In the second experiment,
the rotation attack is applied to images that have been much more e�ectively wa-
termark. The lower e�ectiveness of the �rst experiment represents the cropping of
watermarked data that occurs when the watermarked gray padding is replaced with
unwatermarked gray padding. Recall that these somewhat arti�cial embedding con-
ditions are in place to isolate the e�ects of rotation from any further degradation
that may occur due to the cropping that normally accompanies rotation.
These results demonstrate that the current watermark, designed to be invariant
to rotations, does exhibit a resilience to rotation. This watermark has not been
explicitly designed to withstand cropping and the results highlight this fact.

147
0.1 0.2 0.3 0.4 0.5 0.6 0.7 0.8 0.90
0.01
0.02
0.03
0.04
0.05
0.06
0.07
0.08
0.09
Fre
quen
cy o
f occ
uran
ce
Detection value (max of 90 correlations)10
−1510
−1010
−510
00
0.1
0.2
0.3
0.4
0.5
0.6
0.7
0.8
0.9
1
Pro
babi
lity
of tr
ue d
etec
tion
Probability of false detection
(a) (b)
Figure 4-17: Scaling up without cropping, 5%, 10%, 15%, and 20%, (a) histogramand (b) ROC
4.5.4.2 Scale
To test robustness to scaling, we performed three experiments. The �rst and second
test the e�ect of scaling up, with and without cropping. The third tests the e�ect
of scaling down, with padding.
In the �rst scaling test, the steps performed for each trial were the same as those
for the �rst rotation step, with the exception that instead of rotating the image we
scaled the image up. Figure 4-14(c) shows an example of an image that has been
scaled up after padding and watermarking. The test was performed on 2,000 images
at scales 5%, 10%, 15%, and 20% larger than the original. The results are shown in
Figure 4-17.
The second test was the same as the �rst except without padding the images
before scaling, so part of the image was cropped o� after scaling. Figure 4-14(g)
illustrates the attack. The test was performed on 947 images at scales of 5%, 10%,
15%, and 20% larger than the original. The results are shown in Figure 4-18.
For the test of reduced scaling, we do not have to be concerned with cropping.
Rather, after watermarking and scaling, the image is padded back to its original
size. Since cropping is not an issue here, we only performed one version of this
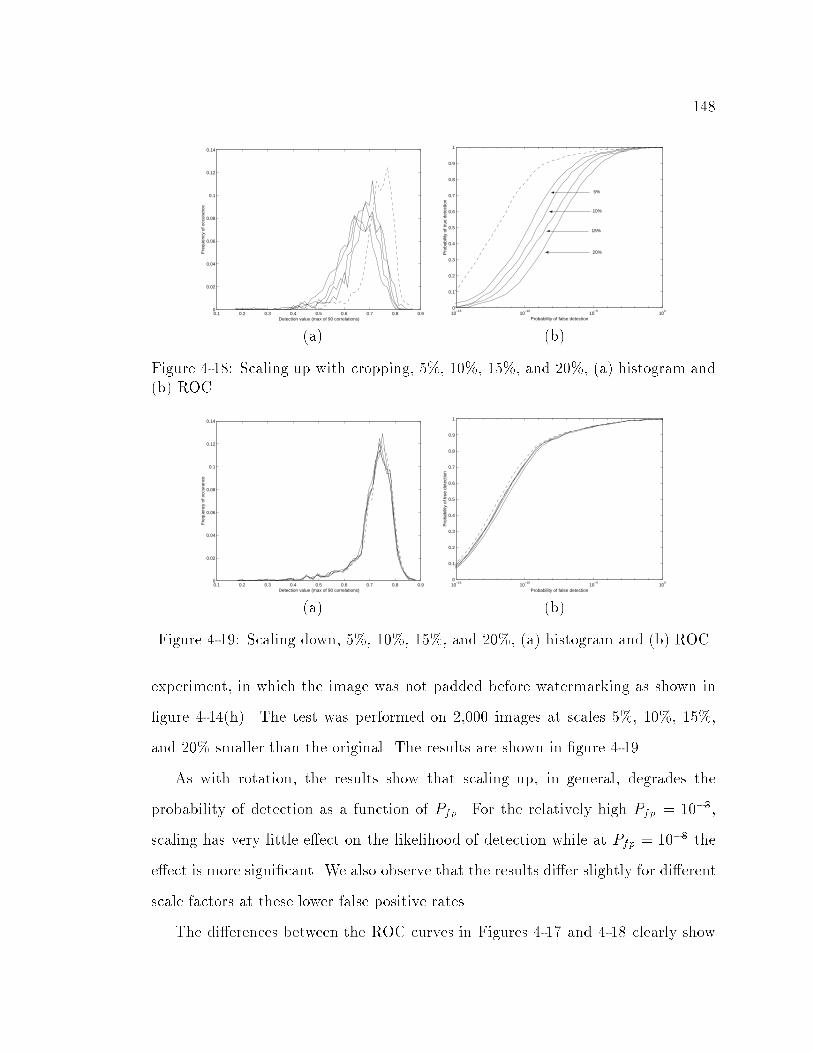
148
0.1 0.2 0.3 0.4 0.5 0.6 0.7 0.8 0.90
0.02
0.04
0.06
0.08
0.1
0.12
0.14
Fre
quen
cy o
f occ
uran
ce
Detection value (max of 90 correlations)10
−1510
−1010
−510
00
0.1
0.2
0.3
0.4
0.5
0.6
0.7
0.8
0.9
1
Pro
babi
lity
of tr
ue d
etec
tion
Probability of false detection
5%
10%
15%
20%
(a) (b)
Figure 4-18: Scaling up with cropping, 5%, 10%, 15%, and 20%, (a) histogram and(b) ROC
0.1 0.2 0.3 0.4 0.5 0.6 0.7 0.8 0.90
0.02
0.04
0.06
0.08
0.1
0.12
0.14
Fre
quen
cy o
f occ
uran
ce
Detection value (max of 90 correlations)10
−1510
−1010
−510
00
0.1
0.2
0.3
0.4
0.5
0.6
0.7
0.8
0.9
1
Pro
babi
lity
of tr
ue d
etec
tion
Probability of false detection
(a) (b)
Figure 4-19: Scaling down, 5%, 10%, 15%, and 20%, (a) histogram and (b) ROC
experiment, in which the image was not padded before watermarking as shown in
�gure 4-14(h). The test was performed on 2,000 images at scales 5%, 10%, 15%,
and 20% smaller than the original. The results are shown in �gure 4-19.
As with rotation, the results show that scaling up, in general, degrades the
probability of detection as a function of Pfp. For the relatively high Pfp = 10�3,
scaling has very little e�ect on the likelihood of detection while at Pfp = 10�8 the
e�ect is more signi�cant. We also observe that the results di�er slightly for di�erent
scale factors at these lower false positive rates.
The di�erences between the ROC curves in Figures 4-17 and 4-18 clearly show

149
the severe degradation due to the cropping that normally accompanies scaling. As
expected, the e�ect of this cropping increases with the scale factor because higher
scale factors imply more cropping.
Figure 4-19 shows that a decrease in scale has virtually no e�ect for Pfp > 10�7
or so and for lower Pfp the degradation is only slight.
The current watermark was designed to be invariant to changes in scale and
these results demonstrate an excellent resilience to a decrease in scale and good
resilience to an increase in scale. Again, these results highlight the negative impact
of cropping.
4.5.4.3 Translation
We expect translation alone to have no e�ect on the watermark, since the water-
mark is computed from the magnitudes of the Fourier coe�cients. To test this, we
performed two experiments.
The �rst experiment was similar to the �rst rotation and scaling experiments, in
that the image was padded before watermarking and the padding was replaced after
watermarking. We then translated the image by cropping gray o� the top and right,
and padding gray onto the bottom and left. Figure 4-14(d) shows an example of such
a translated image. The experiment was performed on 2,000 images at translations
of 5%, 10%, and 15% of the image size. The results are shown in Figure 4-20.
The second translation test was performed without padding the image before
translation, so that part of the watermark pattern is cropped during translation.
Figure 4-14(i) shows an example of this attack. Again, the experiment was per-
formed on 2,000 images at translations of 5%, 10%, and 15% of the image size. The
results are shown in Figure 4-21.
The results of the �rst experiment show that translation has negligible e�ect

150
0.2 0.3 0.4 0.5 0.6 0.7 0.8 0.9 10
0.02
0.04
0.06
0.08
0.1
0.12
Fre
quen
cy o
f occ
uran
ce
Detection value (max of 90 correlations)10
−1510
−1010
−510
00
0.1
0.2
0.3
0.4
0.5
0.6
0.7
0.8
0.9
1
Pro
babi
lity
of tr
ue d
etec
tion
Probability of false detection
(a) (b)
Figure 4-20: Translation without cropping, 5%, 10%, and 15%, (a) histogram and(b) ROC
0.1 0.2 0.3 0.4 0.5 0.6 0.7 0.8 0.90
0.02
0.04
0.06
0.08
0.1
0.12
Fre
quen
cy o
f occ
uran
ce
Detection value (max of 90 correlations)10
−1510
−1010
−510
00
0.1
0.2
0.3
0.4
0.5
0.6
0.7
0.8
0.9
1
Pro
babi
lity
of tr
ue d
etec
tion
Probability of false detection
5%
10%
15%
(a) (b)
Figure 4-21: Translation with cropping, 5%, 10%, and 15%, (a) histogram and (b)ROC

151
0.1 0.2 0.3 0.4 0.5 0.6 0.7 0.8 0.90
0.01
0.02
0.03
0.04
0.05
0.06
0.07
0.08
0.09
0.1
Fre
quen
cy o
f occ
uran
ce
Detection value (max of 90 correlations)10
−1510
−1010
−510
00
0.1
0.2
0.3
0.4
0.5
0.6
0.7
0.8
0.9
1
Pro
babi
lity
of tr
ue d
etec
tion
Probability of false detection
100
90
80
70
(a) (b)
Figure 4-22: JPEG compression, QF = 100, 90, 80, and 70, (a) histogram and (b)ROC
on probability of detection. This means that the second test is more a test of
robustness to cropping than to translation, and we see the same sort of pattern that
was observed in the second rotation and scaling experiments.
4.5.5 JPEG compression
While the purpose of the present watermark design is to survive RST transforma-
tions, it is, of course, important that the watermarks also survive other common
types of image processing. We therefore conducted a test of robustness to JPEG
compression.
After watermarking, images were JPEG compressed at quality factors of 100,
90, 80, and 70. The test was performed on 1,909 images. Figure 4-22 shows the
results.
The results show that the likelihood of detection decreases with the amount of
compression noise introduced and that this decrease is dependent on the Pfp. For
relatively high Pfp = 10�3 JPEG at QF = 70 yields a robustness of about 75%. At
lower Pfp the results degrade signi�cantly.

152
4.5.6 Summary of the Experimental Results
Experimental results on a database of over 2,000 images demonstrate that the
method is resilient to either rotations, scale changes or translations. The degree
of resilience changes as a function of the probability of false positive. The results
also demonstrate the weakness of this method to cropping and JPEG compression,
attacks against which no steps have been taken in the design.
4.6 Properties of the Print-and-Scan Process
After the print-and-scan process, distortion occurs in both the pixel values and
the geometric boundary of the rescanned image. The distortion of pixel values is
caused by (1) the luminance, contrast, gamma correction and chromnance variations,
and (2) the blurring of adjacent pixels. These are typical e�ects of the printer and
scanner, and while they are perceptible to the human eye, they a�ect the visual
quality of a rescanned image.
Distortion of the geometric boundary in the PS process is caused by rotation,
scaling, and cropping (RSC). Although it does not introduce signi�cant e�ects on the
visual quality, it may introduce considerable changes at the signal level, especially
on the DFT coe�cients of the rescanned image.
It should be noted that, in general image editing processes, geometric distortion
cannot be adequately modeled by the well-known rotation, scaling, and translation
(RST) e�ects, because of the design of today's Graphic User Interface (GUI) for the
scanning process. From Figure 4-23, we can see that users can arbitrarily select a
range for the scanned image. We use \cropping" to describe this operation, because
the rescanned images are cropped from an area in the preview window, including
the printed image and background. The RST model, which has been widely used in
pattern recognition, is usually used to model the geometric distortion on the image

153
Figure 4-23: Typical control windows of scanning processes. Users have the freedomto control scanning parameters, as well as can arbitrarily crop the scanned image.[source: Microtek ScanWizard]
of an observed object. In those cases, the meaning of RST is based on a �xed window
size, which is usually pre-determined by the system. However, in the PS process, the
scanned image may cover part of the original picture and/or part of the background,
and may have an arbitrarily cropped size. These changes, especially that of image
size, will introduce signi�cant changes of the DFT coe�cients. Therefore, instead
of RST, a RSC model is more appropriate to represent the PS process. We will
discuss this in more detail in Section 4.7.
4.7 Modeling of the Print-and-Scan Process
In this section, we �rst propose a hypothetical model of the pixel value distor-
tions. To our knowledge, there is no existing appropriate model in the literature to
describe the pixel value distortions in PS process. Therefore, we propose the fol-
lowing hypothetical model based on our experiments and [40][142]. Although more

154
experiments are needed to verify its validity, we have found this model is appropriate
in our experiments using di�erent printers and scanners, as it shows several charac-
teristics of rescanned images. In Section 4.7.2, we analyze the geometric distortion
in the PS process, and then focus on the changes of DFT coe�cients for invariants
extraction. These models can be applied to general geometric distortions, although
a special case (the PS process) is considered here.
4.7.1 Pixel Value Distortion
We are interested in modeling the variation of luminance values of color pixels
before and after the PS process, because we only use luminance as the main place for
embedding information (e.g., watermarking) or extracting features in our system.
Readers who are interested in color variation can �nd extensive references in [119].
Our focus is on the popular consumer PS devices such as color inkjet printers and
atbed scanners.
Consumer printers are based on halftoning, which exploits the spatial lowpass
characteristics of the human visual system. Color halftone images utilize a large
number of small colored dots. Varying the relative positions and areas of the dots
produces di�erent colors and luminance values. The lowpass property is usually
shown in the spread function of the scanner.
Discrete images are converted to continuous images after printing. In the con-
tinuous physical domain, assume we have a virtual �nite support image, x, which
is reconstructed from the original discrete image, x0,
x(t1; t2) =
8><>:PP
x0[n1; n2]�(t1� n1T01; t2 � n2Tp2); t1 2 [�T12 ;
T12 ]; t2 2 [�T2
2 ;T22 ]
0; elsewhere;
(4.22)
where To1 and To2 are the inverse of DPI (dots per inch) values in the t1 and t2
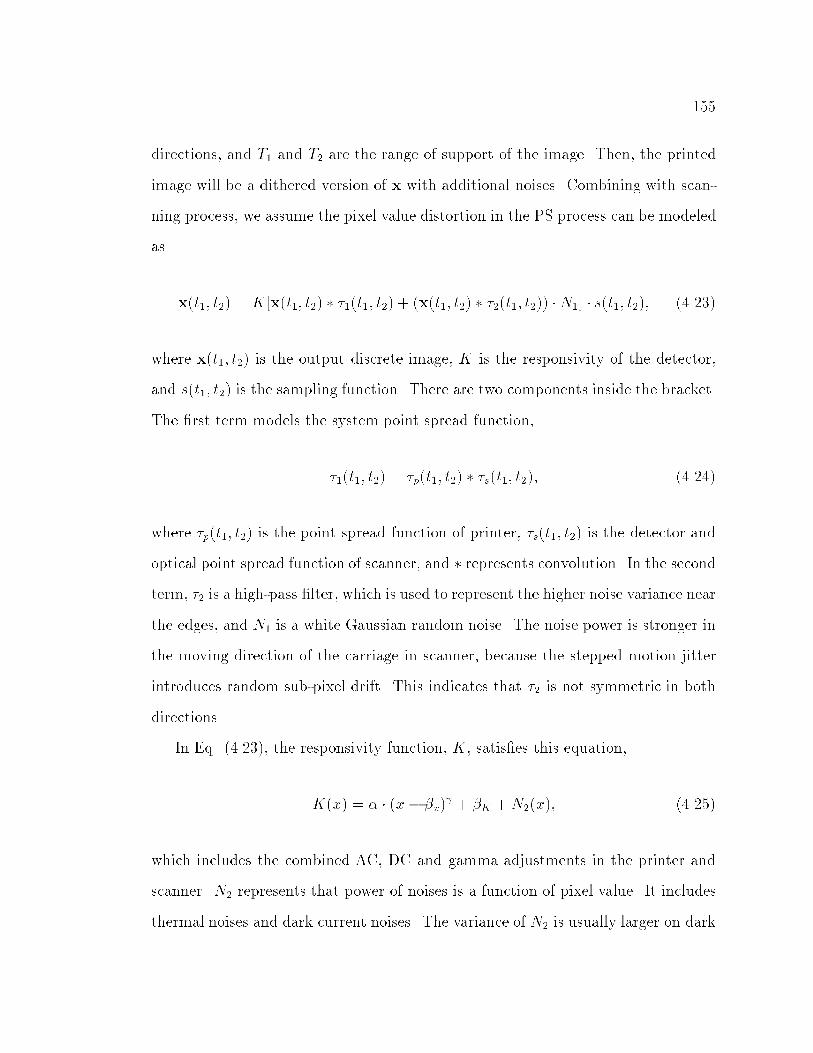
155
directions, and T1 and T2 are the range of support of the image. Then, the printed
image will be a dithered version of x with additional noises. Combining with scan-
ning process, we assume the pixel value distortion in the PS process can be modeled
as
x(t1; t2) = K[x(t1; t2) � �1(t1; t2) + (x(t1; t2) � �2(t1; t2)) �N1] � s(t1; t2); (4.23)
where x(t1; t2) is the output discrete image, K is the responsivity of the detector,
and s(t1; t2) is the sampling function. There are two components inside the bracket.
The �rst term models the system point spread function,
�1(t1; t2) = �p(t1; t2) � �s(t1; t2); (4.24)
where �p(t1; t2) is the point spread function of printer, �s(t1; t2) is the detector and
optical point spread function of scanner, and � represents convolution. In the secondterm, �2 is a high-pass �lter, which is used to represent the higher noise variance near
the edges, and N1 is a white Gaussian random noise. The noise power is stronger in
the moving direction of the carriage in scanner, because the stepped motion jitter
introduces random sub-pixel drift. This indicates that �2 is not symmetric in both
directions.
In Eq. (4.23), the responsivity function, K, satis�es this equation,
K(x) = � � (x� �x) + �K +N2(x); (4.25)
which includes the combined AC, DC and gamma adjustments in the printer and
scanner. N2 represents that power of noises is a function of pixel value. It includes
thermal noises and dark current noises. The variance of N2 is usually larger on dark

156
pixels, because sensors are less sensitive to their low re ectivity.
From this model, we can analyze the low-pass �ltering properties on the Fourier
coe�cients and describe the high noise variances in the high band coe�cients. Some
tests of its validity are shown in Section 4.9.
4.7.2 Geometric Distortion
In general, the scanning process follows a customary procedure. First, a user
places a picture (or the printed original image) on the atbed of the scanner. If the
picture is not well placed, this step may introduce a small orientation, or a rotation
of 90�, 180� or 270� on the scanned image with a small orientation1. Then, the
scanner scans the whole atbed to get a low-resolution preview of the image. After
this process, the user selects a cropping window to decide an appropriate range of
the picture. Usually, it includes only a part of the original image, or the whole
picture with additional background (a.k.a. zero padding). The scanner then scans
the picture again with a higher resolution to get a scanned image. The size of this
image is usually di�erent from the original, because the resolution in the scanner
and the printer may be di�erent. The �nal scanned discrete image is obtained by
sampling the RSC version of the printing-distorted image with additional scanning
noise.
Images are discretized at both ends of the PS process, while they are continuous
in the intermediate stages of a printout. We should notice that images are �rst
reconstructed to be continuous, then manipulated, and sampled again. Therefore,
a continuous-domain de�nition of geometric distortions will be more appropriate.
Examples of the images after general geometric distortions are shown in Figure 4-24.
In this section, we propose a general model, including multi-stage RSC in the
continuous spatial domain, and discuss how to simplify it. We also show the change

157
Figure 4-24: General geometric distortion of images: (a) original, (b) rotation andcropping with background and the whole image, (c) rotation and croppin with back-ground and part of the image, (d) rotation and cropping with part of the image, (e)scaling, (f) croppin without background, (g) cropping with background, (h) scalingand cropping, and (i) rotation, scaling, and cropping

158
of Fourier coe�cients after RSC. Since DFT is usually used for frequency-domain
analysis of discrete images, we will discuss the impact of RSC in the DFT domain,
and then show how to choose an appropriate method to calculate DFT coe�cients
for invariants extraction.
4.7.2.1 Continuous-domain models for geometric distortion and the def-
inition of RSC
Considering a general case of the geometric distortion introduced by multiple
stages of rotation, scaling, and cropping, the distorted image can be represented as
xG = G � x; (4.26)
where G is the geometric distortion operator. For instance, G may equal to
RRSCSRCSRSSC:::, where R, S and C, are the operators of rotation, scaling
and cropping, respectively.
We �rst show the individual e�ect of RSC. If the image is rotated by � counter-
clockwisely, i.e., xR = R � x, then
xR(t1; t2) = x(t1 cos � � t2 sin �; t1 sin � + t2 cos �)
! X(f1 cos � � f2 sin �; f1 sin � + f2 cos �) = XR(f1; f2)(4.27)
where X is the Fourier transform of x. If the original image is scaled by �1 in the
t1-axis and �2 in the t2-axis, i.e., xS = S � x, then
xS(t1; t2) = x(t1�1;t2�2) ! X(�1f1; �2f2) = XS(f1; f2): (4.28)
We de�ne cropping as the process that crops the image in a selected area (which
may include part of background) at GUI window. Cropping introduces three e�ects

159
Table 4.1: Change of Fourier coe�cients after operations in the continuous spatialdomain.
on the image: (1) translation of the origin point of the image, (2) change of the
support of image, and (3) information loss in the discarded area. They can be
considered as a combination of translation and masking. It is well known that
translation introduces only phase shift in the frequency domain. Masking includes
the second and the third e�ects. In the continuous domain, the e�ect of changing
support is not evident, because Fourier transform uses an in�nite support, and
ignores it. However, in the discrete domain, changing the support of image will
change the image size. This results in signi�cant e�ects on DFT coe�cients. We
will further discuss it in Section 4.7.2.2.
Changes of Fourier coe�cients introduced by information loss can be considered
in two ways. First, the cropped image could be a multiplication of the original
image with a masking window, which introduces blurring (with the sinc function)
in the Fourier domain. The other method is to consider the cropped image, xC,
as a subtraction of the discarded area, x�C, from the original image, x. Then, this
equation,
jXC(f1; f2)j = jX(f1; f2)�X �C (f1; f2)j (4.29)
represents the cropping e�ect in the continuous Fourier domain. We �nd that the
second method is a better way to describe the cropping e�ect. From Eqs. (4.27),
(4.28) and (4.29), we can see that rotation and/or scaling in the spatial domain re-
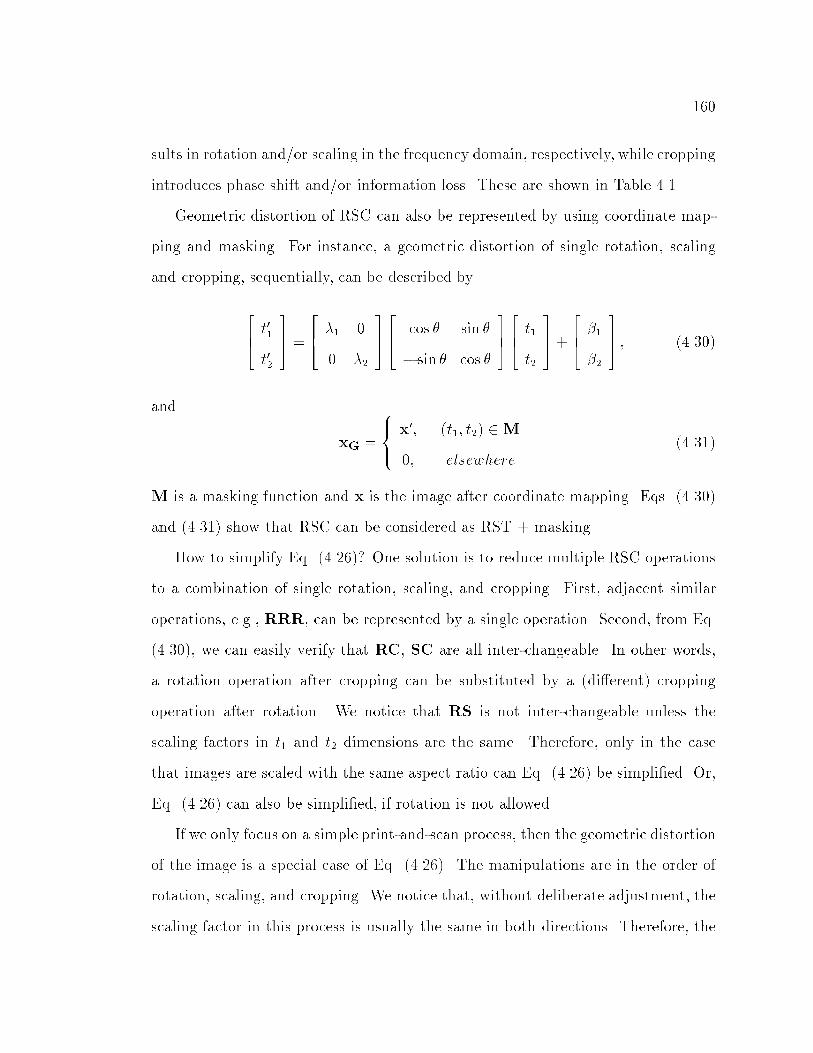
160
sults in rotation and/or scaling in the frequency domain, respectively, while cropping
introduces phase shift and/or information loss. These are shown in Table 4.1.
Geometric distortion of RSC can also be represented by using coordinate map-
ping and masking. For instance, a geometric distortion of single rotation, scaling
and cropping, sequentially, can be described by
264 t01
t02
375 =
264 �1 0
0 �2
375264 cos � sin �
� sin � cos �
375264 t1
t2
375+
264 �1
�2
375 ; (4.30)
and
xG =
8><>:x0; (t1; t2) 2M0; elsewhere
(4.31)
M is a masking function and x is the image after coordinate mapping. Eqs. (4.30)
and (4.31) show that RSC can be considered as RST + masking.
How to simplify Eq. (4.26)? One solution is to reduce multiple RSC operations
to a combination of single rotation, scaling, and cropping. First, adjacent similar
operations, e.g., RRR, can be represented by a single operation. Second, from Eq.
(4.30), we can easily verify that RC, SC are all inter-changeable. In other words,
a rotation operation after cropping can be substituted by a (di�erent) cropping
operation after rotation. We notice that RS is not inter-changeable unless the
scaling factors in t1 and t2 dimensions are the same. Therefore, only in the case
that images are scaled with the same aspect ratio can Eq. (4.26) be simpli�ed. Or,
Eq. (4.26) can also be simpli�ed, if rotation is not allowed.
If we only focus on a simple print-and-scan process, then the geometric distortion
of the image is a special case of Eq. (4.26). The manipulations are in the order of
rotation, scaling, and cropping. We notice that, without deliberate adjustment, the
scaling factor in this process is usually the same in both directions. Therefore, the

161
geometric distortion of PS process in the continuous domain can be described by
Eq. (4.30) with the �1 = �2. In the continuous Fourier domain, the changes are
a combination of Eqs. (4.27), (4.28), and (4.29). Unlike scaling, cropping usually
results in a di�erent image size that does not keep the aspect ratio of the original.
4.7.2.2 Discrete-domain models for geometric distortion
We �rst de�ne the geometric distortions in the discrete domain. The discretized
image is sampled from distorted continuous image, xG. As we have mentioned,
geometric distortion is better described in the continuous domain. Therefore, when
we refer to a rotated discrete image, that means the image is converted to the
continuous domain, then rotated, and sampled again using the original sampling
rate. In practice, discrete images may not be really converted to the continuous
domain, but it is possible to use interpolation to approximate this operation. The
same de�nition applies to scaling and cropping. It should be noted that, because
using a �xed sampling rate on the scaled continuous image is the same as using
a di�erent sampling rate on the original image, \change of sampling rate" and
\scaling" indicate the same operation in the discrete-domain models.
It is well known that, in practical implementation, DFT coe�cients can be ob-
tained by using radix-2 FFT with zero padding. Some other fast methods of cal-
culating DFT without using radix-2 FFT are also available. For example, Matlab
calculates DFT coe�cients by using the original size without zero padding. One
of the two methods is usually used for calculating 2-D DFT of the sampled image.
They are shown in Figures 4-25(a) and 4-25(c). Figures 4-25(b) and 4-25(d) show
some alternatives mentioned in the literature. All of these methods can be used
to obtain DFT coe�cients. However, di�erent calculation methods introduce dif-
ferent responses to the coe�cients after geometric distortion. Unfortunately, this

162
Figure 4-25: Four common methods to calculate DFT coe�cients. The length andwidth of DFT window are: (a) the image size, (b) a �xed large rectangle, (c) thesmallest rectangle with radix-2 width and height, or (d) the smallest square includingthe whole image.
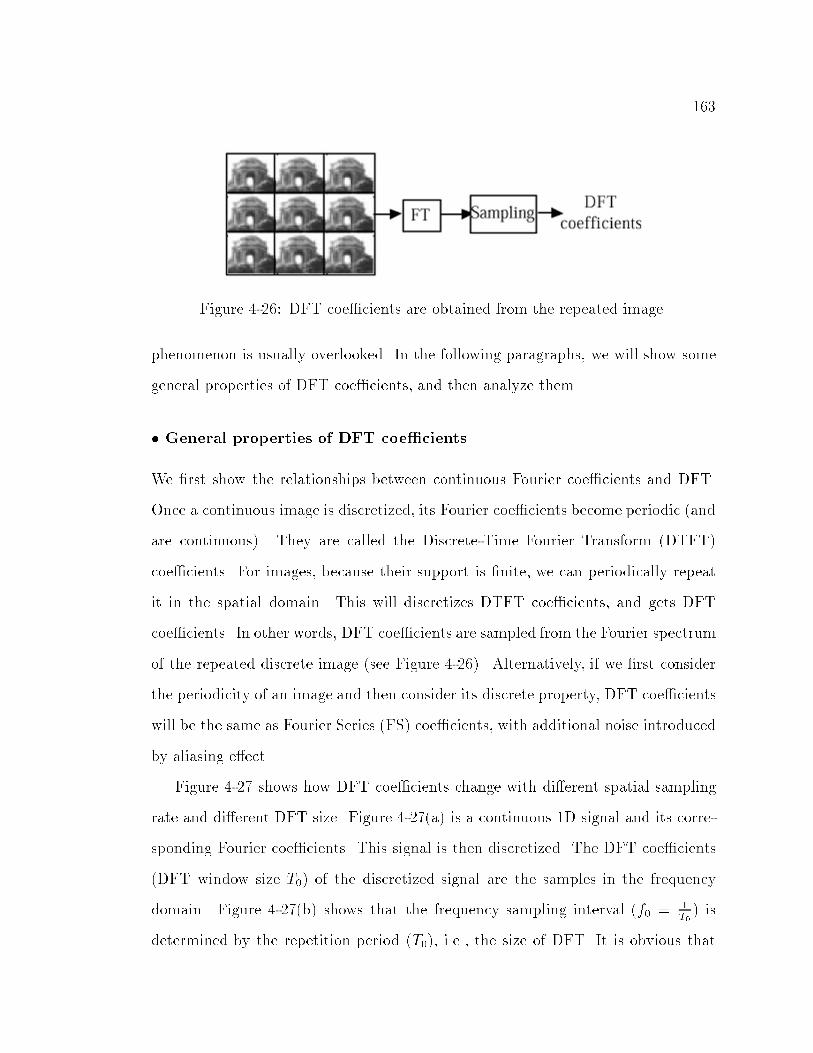
163
Figure 4-26: DFT coe�cients are obtained from the repeated image.
phenomenon is usually overlooked. In the following paragraphs, we will show some
general properties of DFT coe�cients, and then analyze them.
� General properties of DFT coe�cients
We �rst show the relationships between continuous Fourier coe�cients and DFT.
Once a continuous image is discretized, its Fourier coe�cients become periodic (and
are continuous). They are called the Discrete-Time Fourier Transform (DTFT)
coe�cients. For images, because their support is �nite, we can periodically repeat
it in the spatial domain. This will discretizes DTFT coe�cients, and gets DFT
coe�cients. In other words, DFT coe�cients are sampled from the Fourier spectrum
of the repeated discrete image (see Figure 4-26). Alternatively, if we �rst consider
the periodicity of an image and then consider its discrete property, DFT coe�cients
will be the same as Fourier Series (FS) coe�cients, with additional noise introduced
by aliasing e�ect.
Figure 4-27 shows how DFT coe�cients change with di�erent spatial sampling
rate and di�erent DFT size. Figure 4-27(a) is a continuous 1D signal and its corre-
sponding Fourier coe�cients. This signal is then discretized. The DFT coe�cients
(DFT window size T0) of the discretized signal are the samples in the frequency
domain. Figure 4-27(b) shows that the frequency sampling interval (f0 = 1T0) is
determined by the repetition period (T0), i.e., the size of DFT. It is obvious that
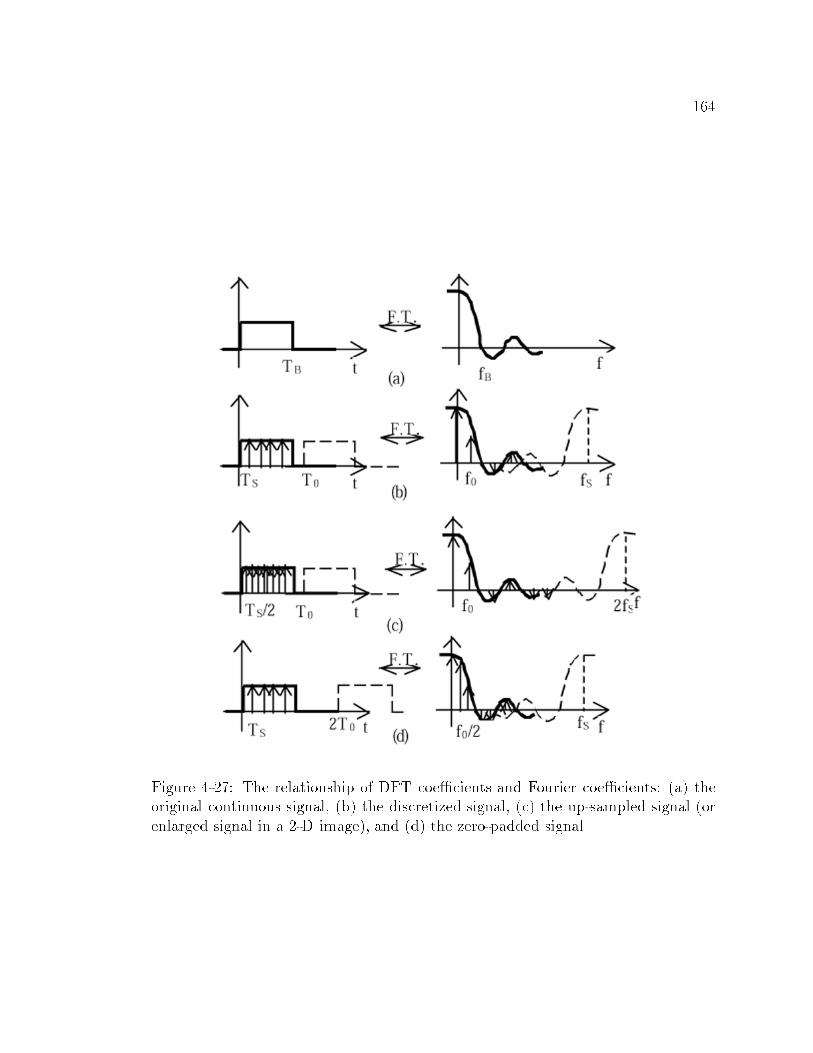
164
Figure 4-27: The relationship of DFT coe�cients and Fourier coe�cients: (a) theoriginal continuous signal, (b) the discretized signal, (c) the up-sampled signal (orenlarged signal in a 2-D image), and (d) the zero-padded signal
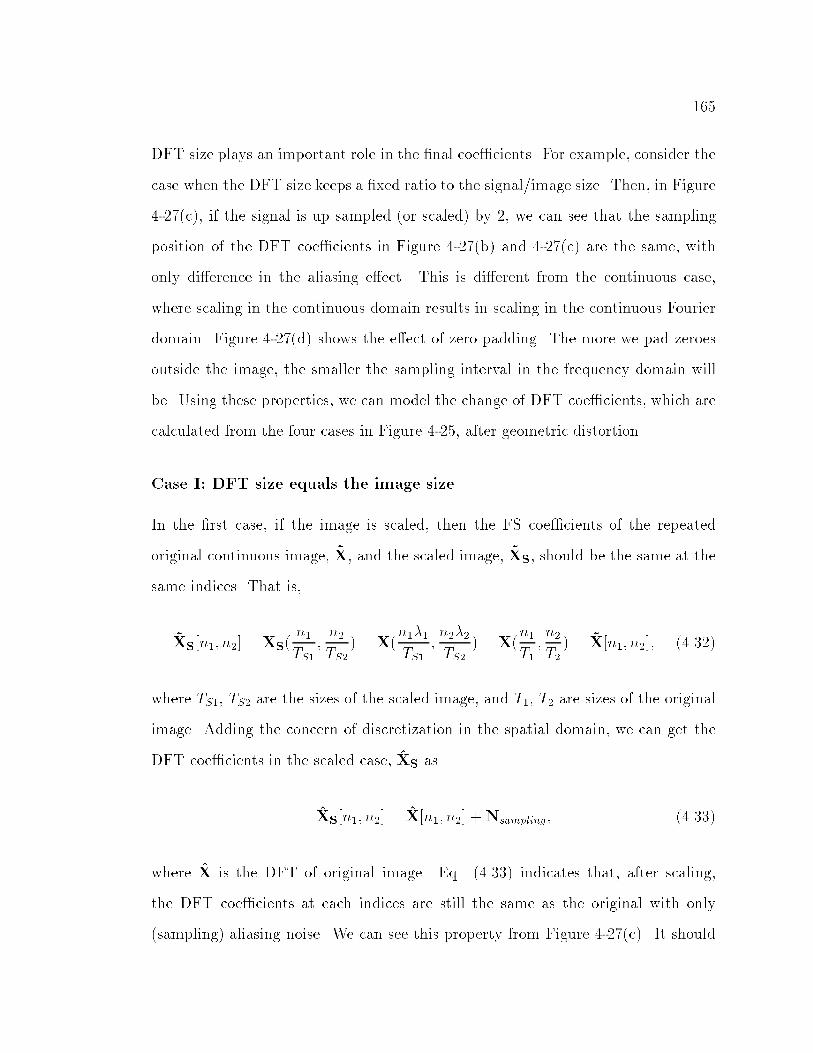
165
DFT size plays an important role in the �nal coe�cients. For example, consider the
case when the DFT size keeps a �xed ratio to the signal/image size. Then, in Figure
4-27(c), if the signal is up sampled (or scaled) by 2, we can see that the sampling
position of the DFT coe�cients in Figure 4-27(b) and 4-27(c) are the same, with
only di�erence in the aliasing e�ect. This is di�erent from the continuous case,
where scaling in the continuous domain results in scaling in the continuous Fourier
domain. Figure 4-27(d) shows the e�ect of zero padding. The more we pad zeroes
outside the image, the smaller the sampling interval in the frequency domain will
be. Using these properties, we can model the change of DFT coe�cients, which are
calculated from the four cases in Figure 4-25, after geometric distortion.
Case I: DFT size equals the image size
In the �rst case, if the image is scaled, then the FS coe�cients of the repeated
original continuous image, ~X, and the scaled image, ~XS, should be the same at the
same indices. That is,
~XS[n1; n2] = XS(n1TS1
;n2TS2
) = X(n1�1TS1
;n2�2TS2
) = X(n1T1;n2T2) = ~X[n1; n2]; (4.32)
where TS1, TS2 are the sizes of the scaled image, and T1, T2 are sizes of the original
image. Adding the concern of discretization in the spatial domain, we can get the
DFT coe�cients in the scaled case, XS as
XS[n1; n2] = X[n1; n2] +Nsampling; (4.33)
where X is the DFT of original image. Eq. (4.33) indicates that, after scaling,
the DFT coe�cients at each indices are still the same as the original with only
(sampling) aliasing noise. We can see this property from Figure 4-27(c). It should
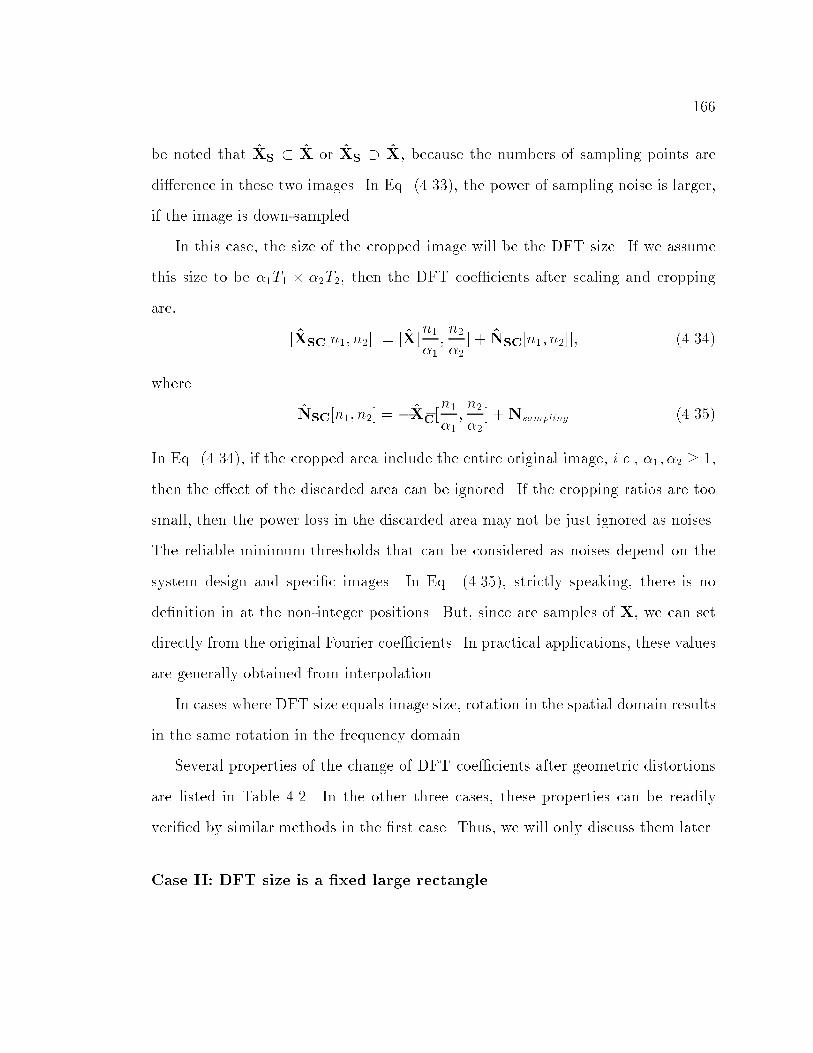
166
be noted that XS � X or XS � X, because the numbers of sampling points are
di�erence in these two images. In Eq. (4.33), the power of sampling noise is larger,
if the image is down-sampled.
In this case, the size of the cropped image will be the DFT size. If we assume
this size to be �1T1 � �2T2, then the DFT coe�cients after scaling and cropping
are,
jXSC[n1; n2]j = jX[n1�1;n2�2] + NSC[n1; n2]j; (4.34)
where
NSC[n1; n2] = �X�C[n1�1;n2�2
] +Nsampling (4.35)
In Eq. (4.34), if the cropped area include the entire original image, i.e., �1; �2 � 1,
then the e�ect of the discarded area can be ignored. If the cropping ratios are too
small, then the power loss in the discarded area may not be just ignored as noises.
The reliable minimum thresholds that can be considered as noises depend on the
system design and speci�c images. In Eq. (4.35), strictly speaking, there is no
de�nition in at the non-integer positions. But, since are samples of X, we can set
directly from the original Fourier coe�cients. In practical applications, these values
are generally obtained from interpolation.
In cases where DFT size equals image size, rotation in the spatial domain results
in the same rotation in the frequency domain.
Several properties of the change of DFT coe�cients after geometric distortions
are listed in Table 4.2. In the other three cases, these properties can be readily
veri�ed by similar methods in the �rst case. Thus, we will only discuss them later.
Case II: DFT size is a �xed large rectangle

167
Table 4.2: Change of DFT coe�cients after operations in the discrete spatial do-main.
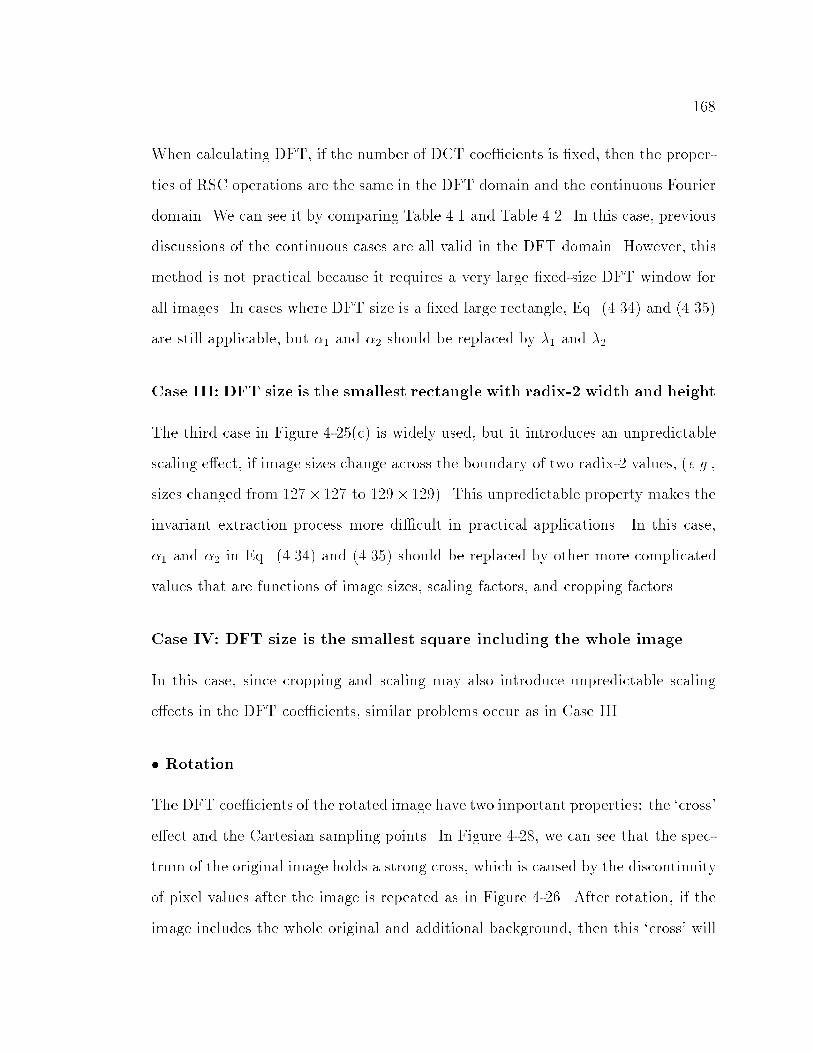
168
When calculating DFT, if the number of DCT coe�cients is �xed, then the proper-
ties of RSC operations are the same in the DFT domain and the continuous Fourier
domain. We can see it by comparing Table 4.1 and Table 4.2. In this case, previous
discussions of the continuous cases are all valid in the DFT domain. However, this
method is not practical because it requires a very large �xed-size DFT window for
all images. In cases where DFT size is a �xed large rectangle, Eq. (4.34) and (4.35)
are still applicable, but �1 and �2 should be replaced by �1 and �2.
Case III: DFT size is the smallest rectangle with radix-2 width and height
The third case in Figure 4-25(c) is widely used, but it introduces an unpredictable
scaling e�ect, if image sizes change across the boundary of two radix-2 values, (e.g.,
sizes changed from 127� 127 to 129� 129). This unpredictable property makes the
invariant extraction process more di�cult in practical applications. In this case,
�1 and �2 in Eq. (4.34) and (4.35) should be replaced by other more complicated
values that are functions of image sizes, scaling factors, and cropping factors.
Case IV: DFT size is the smallest square including the whole image
In this case, since cropping and scaling may also introduce unpredictable scaling
e�ects in the DFT coe�cients, similar problems occur as in Case III.
� Rotation
The DFT coe�cients of the rotated image have two important properties: the `cross'
e�ect and the Cartesian sampling points. In Figure 4-28, we can see that the spec-
trum of the original image holds a strong cross, which is caused by the discontinuity
of pixel values after the image is repeated as in Figure 4-26. After rotation, if the
image includes the whole original and additional background, then this `cross' will

169
Figure 4-28: The spectrum of rotated-and-zero-padded image and rotated-croppedimage
also rotate with the image. However, if the rotated image is cropped as in Figure 4-
28, then this cross will not be rotated, while other coe�cients are rotated. In other
words, the shape of the support of image decides the angle of `cross'. We found
that this phenomenon becomes less noticeable, if images are subtracted by their
mean values before calculating DFT coe�cients. Observing from Figure 4-27(b)
and 4-27(d), we can see the spectrum of a cropping mask The larger the distance of
repetition period and the support of mask, the larger the magnitudes of the sidelobe
pulses would be. Since these pulses convolve with all the DFT coe�cients in the
frequency domain, large DFT coe�cients domain the values along the angle of the
mask. In implementation, we have to notice this e�ect, and in acknowledge that
some DFT values may be a�ected near the angle of mask.
DFT coe�cients of a discrete rotated image are sampled from the Cartesian grid
points of the rotated original continuous spectrum. Therefore, they are not the ro-
tated original DFT coe�cients. Two methods can be used to solve this problem in

170
practical cases. The �rst is to calculate DTFT coe�cients at the rotated grid point
positions. They are exactly the same sampling points as in the original. However,
these calculations are time-consuming. The other method is to interpolate from the
DFT coe�cients. This method can take advantage of FFT, and can get reasonable
results in experiments. To improve the accuracy, zero-padding may be applied to
the image to conduct interpolation from denser frequency samples. In implementa-
tion, we chose to interpolate coe�cients from the magnitudes of DFT coe�cients,
because phase shifting (introduced by translation) could have signi�cantly changed
the complex coe�cients.
4.8 Extracting Invariants in the Print-and-Scan Process
� Using scaled images for the DFT-domain analysis
Using DFT as a frequency analysis tool, we can manipulate images a priori to make
their DFT coe�cients more predictable after geometric distortions. Here are two
examples. We scale images uniformly or non-uniformly to a standard size (e.g.,
256 � 256), and then apply radix-2 FFT. (In the uniform scaling cases, we may
need to pad zeros outside the scaled image.) From Eq. (4.33), we know that scaling
introduces almost no e�ect on the DFT coe�cients, if images are not extensively
down-sampled.
As we discussed in Section 4.7.2.1, uniform scaling can be combined with the
original single RSC in the PS process, and it still results in single RSC. Therefore,
if both original and distorted images are uniformly scaled to a �xed size before
calculating DFT, their DFT coe�cients should demonstrate the same properties
shown in the continuous Fourier domain. Therefore, we can conclude that the DFT
coe�cients obtained by this method only su�er single rotation, scaling, phase shift,
and noises in the PS process. (Here, scaling and phase shifting in the DFT domain
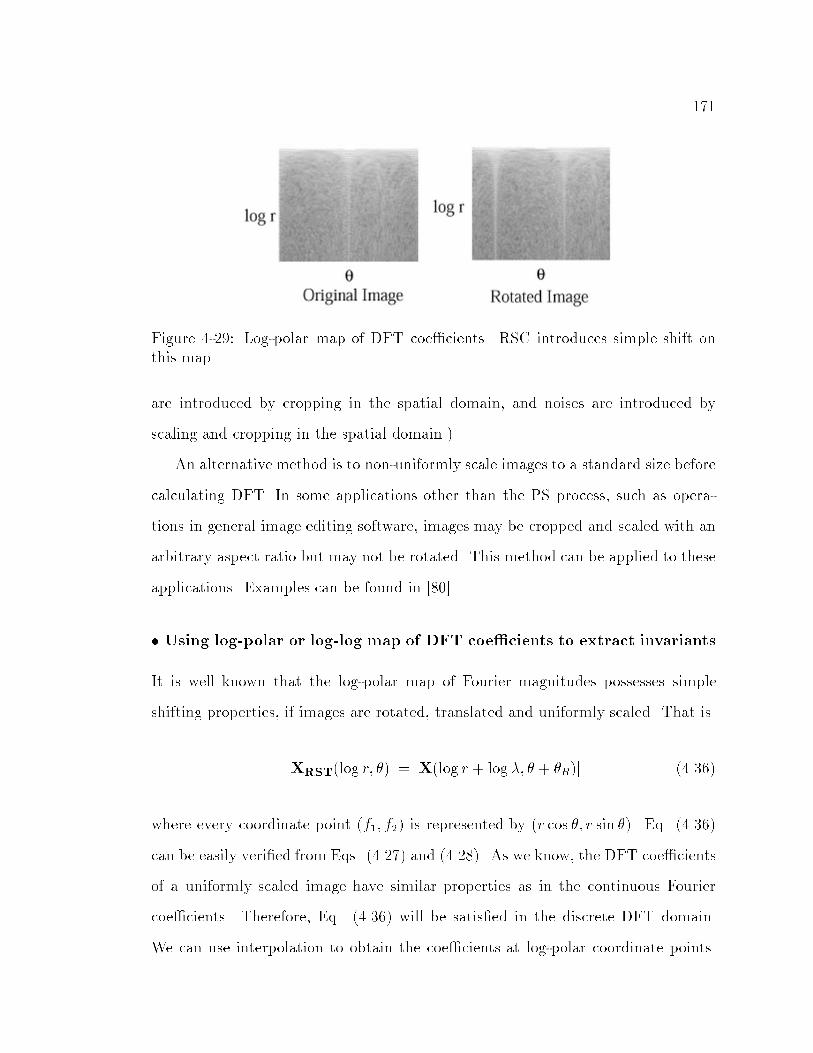
171
Figure 4-29: Log-polar map of DFT coe�cients. RSC introduces simple shift onthis map.
are introduced by cropping in the spatial domain, and noises are introduced by
scaling and cropping in the spatial domain.)
An alternative method is to non-uniformly scale images to a standard size before
calculating DFT. In some applications other than the PS process, such as opera-
tions in general image editing software, images may be cropped and scaled with an
arbitrary aspect ratio but may not be rotated. This method can be applied to these
applications. Examples can be found in [80].
� Using log-polar or log-log map of DFT coe�cients to extract invariants
It is well known that the log-polar map of Fourier magnitudes possesses simple
shifting properties, if images are rotated, translated and uniformly scaled. That is
jXRST(log r; �)j = jX(log r + log �; � + �R)j (4.36)
where every coordinate point (f1; f2) is represented by (r cos �; r sin �). Eq. (4.36)
can be easily veri�ed from Eqs. (4.27) and (4.28). As we know, the DFT coe�cients
of a uniformly scaled image have similar properties as in the continuous Fourier
coe�cients. Therefore, Eq. (4.36) will be satis�ed in the discrete DFT domain.
We can use interpolation to obtain the coe�cients at log-polar coordinate points.

172
Examples of the log-polar maps of Figures 4-28(a) and 4-28(b) are shown in Figure
4-29.
Since the log-polar map of the rescanned image is a translated version of the
original (with noises), it is natural to expect that the 2D DFT magnitudes of this
map should be invariant. Therefore, any function of them is expected to be invariant,
and served as a feature vector. However, in practical cases, the noises introduced
by scanning and cropping are too large to ignore. Also, in the discrete image cases,
the invariant-magnitude property of Eq. (4.36) is valid only if images are cyclically
shifted (because DFT is calculated from the repeated image, see Figure 4-26). This
cyclic shift only happens at the axis of �, but not at the axis of log r. Therefore,
DFT magnitudes of this map usually do not possess a su�cient invariance.
An alternative method for generating feature vector has been developed in Sec-
tion 4.3, and is summarized as follows. The basic idea is to project all log-polar
coe�cients along each angle, so that we can obtain a 1D signal that is invariant in
the PS process except the cyclic shift introduced by rotation. The feature extrac-
tion process is shown in Figure 4-30. Images are �rst scaled to a standard size (e.g.,
256 � 256), then zero-padded to double the size (e.g., 512 � 512). We can get the
magnitudes of log-polar coe�cients (Fm) from DFT coe�cients. The purpose of
these steps is to get more accurate jFmj. The next step is to sum up the log values
of jFmj along each angle from rl to ru, which includes mid-band coe�cients. Log
values of jFmj are taken so that the summation will not be dominated by principal
values, and the utilization of mid-band coe�cients is for watermarking. This sig-
nal is then divided to two parts, and each value is summed up with the value at its
orthogonal direction. There are two reasons. First, the resulted signal will be invari-
ant if the rescanned image is rotated by 90�, 180�, or 270�. Second, its distribution
will be more like white Gaussian, which is important to embedding watermark. The

173
Figure 4-30: Extract invariants from log-polar map of DCT coe�cients.
174
�nal feature vector is the AC component of this signal, which excludes the coe�-
cients near the angle of the axes. This feature vector is very robust. We show some
experimental results in Section 5. As mentioned above, rotation introduces cyclic
shift to this feature vector. Therefore, in practical PS process, tests should base on
shifting the original feature vector within a range, (e.g., �5�).In addition to the method in Section 4.3, some other methods may be applied
to extract invariants. The 1D DFT magnitude of the previous feature vector is an
example, which is rotation invariant but less robust. Another example is to use a
similar step, but sum up values along each r or log r. The resulted feature vector will
be invariant to non-uniform scaling, rotation, and cropping to the scaled size. As we
mentioned, in some cases, non-uniformly scaling and cropping is a more demanding
process. We can use the log-log map instead of the log-polar map, because it only
su�ers simple shifting properties after general scaling and cropping [80].
4.9 Experiments
� Pixel value Distortion
We tested our models using the EPSON Stylus EX Inkjet printer and the HP Scanjet
4C scanner, both common commercial products. Five di�erent images are tested,
and they showed similar results. Here is an example. A color image of 384 � 256
was printed on the inkjet paper, with the physical size of 5:32" � 3:54". Then it
was scanned with 75 dpi [size: 402 � 266]. To isolate the inference of pixel value
distortion, we crop, scale, and estimate its sub-pixel translation to register this
image to the original. Experimental results are shown in Figures 4-31(a)- 4-31(e).
We can see that the noises in the rescanned image are not like additive Gaussian
noises. Instead, they depend on pixel values and the spatial distribution of pixels. In
Figure 4-31(c), we show the mapping of the pixel values from the original image and

175
Figure 4-31: Pixel value distortion of rescanned image. (a) original image [384x256],(b) rescanned image [402x266], (c) corresponding pixel mapping and modeling, (d)noise in the spatial domain after gamma correction, (e) noise in the frequency do-main after gamma correction

176
the registered rescanned image. We can see that Eq. (4.25) can suitably model the
distribution of mapping function. We use optimum estimation methods to estimate
(�; ; �x; �K), which are (8.3, 0.6, 35, 20). The MSE of estimation noise is 73.58. At
Figure 4-31(d), we show the di�erence between the original pixels and the gamma-
corrected pixel values of the rescanned image. We can see that noises are larger in
the edges and the dark areas. The former satis�es N1 in Eq. (4.23), and the latter
shows N2 in Eq. (4.25). In Figure 4-31(e), we show the di�erence of the frequency
spectrum of original image and gamma-corrected image. We can clearly see the
lowpass �ltering and high frequency noises in the spectrum.
The above experiment shows the e�ectiveness of our model of Eq. (4.23), (4.24)
and (4.25). In the practical applications, however, if the original image is not
available for registration, then we can not estimate the gamma corrected model. In
that case, we can use a linear model, i.e., = 1, in Eq. (4.25). In Figure 4-31(c),
we can see the result of a linear model, which uses linear regression. The MSE of
this model is 124.08. We can see that noises are larger when pixels are very bright
or very dark. Noise distribution in the spatial domain is similar to Figure 4-31(d),
but with larger variances in the bright areas Distribution of noises in the frequency
domain is similar to Figure 4-31(e).
We also tested our models by scanning a photo 10 times, and comparing di�er-
ences. The noise distribution satis�ed N1 in Eq. (4.23) of our model. Furthermore,
we tested some of the cheapest consumer inkjet printers and scanners (which cannot
print or scan images higher than 300 dpi), and found their quality is so bad that
individual color halftone dots look very distinct in the rescanned image. In these
cases, the rescanned images have to be further blurred by users to obtain merely
acceptable images. Our hypothetical models are found sustainable with a lowpass
�lter of very low cuto� frequency.

177
� Geometric Distortion
We use the famous Lenna image [512 � 512] as an example to show the properties
of the described feature vector. The experimental results are shown in Figure 4-32.
Correlation coe�cients, �, of the feature vector extracted from the original image
and the distorted image are used to measure the invariance. In our experience, if
� > 0:6, then the extracted feature vector will be invariant enough to be applied
to public watermarking. It should be noted that no information from the original
image is needed for the feature vectors of rescanned image. In these experiments,
(rl; ru; �l; �u) = (34; 100; 8�; 81�).
In Figure 4-32(a), we show that the extracted feature vector is very robust to
scaling. Testing is based on di�erent scaling factors, � from 0.1 to 2.0. We found
that � > 0:98 for all � > 0:25. In other words, the feature vector extracted from a
scaled image which is larger than 128x128 is almost the same as the original. Only if
� < 0:12, i.e., 0.014 of the original area, then the correlation coe�cient, �, becomes
smaller than 0.6.
In Figure 4-32(b), we test its robustness against JPEG compression. The testing
results are so good that � > 0:988 for all quality factors > 30, and � > 0:947 for all
quality factors > 10.
In Figure 4-32(c), the cropped area only includes part of the original and no
background (a.k.a., strict cropping). We tested three ways: uniform, non-uniform,
and one-side cropping. Uniform cropping means that the cropping ratios at both
axes are the same. We choose cropping factors 0:6 � �1 = �2 � 1, and show the
result by the ratio of cropped area, i.e., �1��2. Non-uniform cropping uses di�erent
cropping ratios at axes. Their cropping factors are randomly chosen between 0:6 and
1. The one-side cropping method sets �2 = 1, and �1 from 0:6 to 1. These methods
result in di�erent image shapes, which a�ect the feature extraction process. For

178
Figure 4-32: Robustness test of the extracted feature vector: (a) scaling, (b) JPEG,(c) strict cropping, (d) general cropping, (e) rotation with general cropping, and (f)rotation, strict cropping, scaling, and JPEG or brigtness/contrast adjustment, and(g) RSC, pixel distortion and noise.

179
instance, the largest size, i.e., max(width; height), of the distorted image after one-
side cropping remains the same as the original. Because images are uniformly scaled
to a standard size (256� 256) in the feature extraction process, the distorted image
will be a subset of the original image. Therefore, only information loss results in
the change of DFT coe�cients. We can see that information loss is still acceptable
if the ratio of cropped area > 0:6. The other two cases introduce scaling in the
DFT coe�cients, in addition to the information loss. We see that their correlation
coe�cients are smaller. But, no matter which method is used, a ratio of cropping
area > 0:6 is usually acceptable.
In Figure 4-32(d), we show the test results of general cropping including back-
ground. We can see that � < 0:6 if the ratio of cropped area > 2:5. Distortions
come from the scaling of DFT coe�cients in the extraction process. Although it
only introduces shifting in the log-polar map of the DFT coe�cients, the loss of
coe�cients shifted outside the calculated range is too large to ignore. Experimental
results are not good in this case. However, this kind of cropping is not common,
and we can always crop the image again to obtain a better feature vector.
Figure 4-32(e) shows the experimental results of rotation. Images are rotated
within �3�, and then cropped to the original size. Because the extracted feature
vector su�ers cyclic shift, tests are based on the largest � calculated by shifting the
original feature vector in a range of �5�. All � values are all acceptable in these
cases. To compare the extracted feature vector, we show the results of another
method that uses the DFT magnitudes of the feature vector. This method does not
require any cyclic test of the feature vector, but it is not as robust as the previous
method.

180
� Geometric distortion + pixel value distortion
Figure 4-32(f) shows that the proposed feature vector is robust to a combined attack
of rotation, scaling, cropping, JPEG, brightness and contrast adjustments. In this
test, the image is rotated within �3�, strictly cropped with the largest area that
does not cover background, scaled with �1 = �2 = 0:4, and then either JPEG
compressed (qf = 75) or brightness/contrast adjusted (� = 1:2, = 1, �x = 0,
�K = 10). Compared to Figure 4-32(e), we can see that distortion of feature vectors
are mostly introduced by rotation and cropping, while the e�ects of scaling, JPEG
compression, brightness/contrast adjustments are negligible. In Figure 4-32(g), we
show the result of a combination of RSC and our pixel value distortion model. The
parameters estimated in Figure 4-31 are used in these experiments: (�; ; �x; �K) =
(8:3; 0:6; 35; 20). We use an additive Gaussian noise (� = 8:5) in these tests. Because
it is distributed in all bands, it will be worse than the real situations in which noises
only a�ect uncalculated high-band. We observed that noises have larger e�ect in
downsized images. Comparing to Figure 4-32(f), we can see that their results are
similar.
We tested the practical rescanned images in Figures 4-31(a) and 4-31(b), and
obtained their correlation coe�cient, � = 0:915. Applying the proposed feature
vectors for watermarking, we have tested a large database of 20,000 color images
from the Corel image library. Their results have proved the invariant properties of
the feature vector (shown in Section 4.5). Also, a very low false positive rate in
those experiments helped prove that the feature vectors from di�erent images are
mutually uncorrelated.

181
4.10 Conclusion
Geometric distortions continue to be a major weakness for many watermarking
methods. We described a solution to the common problems of rotation, scale, and
translation. This solution is related to earlier proposals in the pattern recognition
literature regarding invariants of the Fourier-Mellin transform. However, unlike
those proposals, we do not explicitly derive an invariance relationship.
Instead of creating a truly RST invariant signal, we create a signal that changes
in a trivial manner as a result of rotation, scale, or translation. The calculation of
this projection is performed by taking the Fourier transform of the image, performing
a log-polar resampling and then integrating along the radial dimension. We note
that an alternative implementation can be performed using the Radon transform
[12]. We have investigated this implementation but do not report it here.
The one-dimensional watermark has a many-to-one mapping to the two-dimensional
image space. This is advantageous, especially when the embedder is based on the
principle of communications with side information. Our implementation is a very
simple example of this principle and we believe that future work can lead to signif-
icant improvements.
Experimental results on a database of over 2,000 images demonstrate that the
method is resilient to either rotations, scale changes or translations. The degree
of resilience changes as a function of the probability of false positive. The results
also demonstrate the weakness of this method to cropping and JPEG compression,
attacks against which no steps have been taken in the design.
Future work will focus on more e�ective embedding and RST resilient water-
marking designed to survive cropping and compression. Improvements in e�ective-
ness are possible in the approximate inversion of the log-polar resampling and in
the distribution of the di�erence signal to the log-polar coe�cients. Methods based
182
on gradient descent will be investigated. Also, the current technique of uniform
distribution does not fully exploit the visual properties of the host image.
We will examine techniques for building crop resistant watermarks that rely
on �rst subdividing the image into a number of possibly overlapping tiles. The
RST resilient watermark is then embedded in each of these tiles. The detection
algorithm is applied to each tile and the results averaged together. With appropriate
constraints on the tiling and the symmetry of the watermark this technique may
provide the desired resilience to cropping.
Our contribution in this chapter also includes the new, extensive work on mod-
eling the changes that digital images undergo in the print-and-scan process. We
propose a model for the pixel value distortion, de�ne the RSC-based geometric dis-
tortions, analyze the change of DFT coe�cients after geometric distortion, and de-
scribe methods to extract invariant feature vector. Preliminary experimental testing
of the pixel value distortion, as well as experimental analyses of the feature vector
in Section 4.5, have indicated the e�ectiveness of the proposed models. In addition
to the image watermarking applications, the proposed model may be used for other
applications, such as image registration or authentication.
183
Chapter 5
Theoretical Watermarking Capacity of Images
5.1 Introduction
In watermarking schemes, multimedia data is considered as a communication
channel to transmit messages. Users decode messages from the received data, which
may have been distorted. In this chapter, we address the following important ques-
tion: how much information can be reliably transmitted as watermarks without
causing noticeable quality losses, under some distortions in the watermarked im-
ages? Our objective is to �nd theoretical bounds of image watermarking capacity
based on the information theory and the characteristics of human vision systems.
A general watermarking model has been shown in Figure 1-3. If we ignore
security issues, watermarking capacity is a�ected by invisibility and robustness re-
quirements, as shown in Figure 1-5. There are three dimensions involved in this
�gure { visual quality, robustness, and amount of embedded information. Fixing
any dimension, there exist tradeo� relationships between the other two dimensions.
We say a watermark scheme is robust if we can extract embedded bits with an er-
ror probability deterministically equal to or statistically approaching zero. Visual
quality represents the quality of watermarked image. In general, if we want to make
the message bits more robust against attacks, a longer codeword or larger codeword

184
amplitudes will be necessary. However, visual quality degradation will become more
signi�cant. Similarly, given a �xed visual quality, there exists a trade-o� between
the information quantity of the embedded message and robustness. For instance,
the fewer the message bits are embedded, the more redundant the codeword can be.
Therefore, the codeword has better error correction capability against noises. It is
our objective in this chapter to �nd the theoretic bounds of these trade-o� curves.
5.1.1 Analysis of Watermarking Capacity Issues
In this subsection, we �rst analyze the characteristics of three watermarking ca-
pacity parameters: amount of embedded information, visual quality, and robustness.
Then, in subsequent sections, we will present several analytic methods for analyzing
the watermarking capacity.
� How many message bits are transmitted in the watermark?
As shown in Figure 1-5, messages are the information that the source want to trans-
mit or preserve via watermarking. Messages are �rst encoded as codewords, which
are embedded as a watermark. For example, a single bit message may be encoded
as a pseudo-random sequence. The amount of message bits transmitted through
watermarking is di�erent from the length of codeword. Di�erent applications may
require di�erent message lengths.
For copyright protection, two kinds of approaches have been proposed. The
�rst approach considers copyright protection as a detection problem, in which the
decision is made based on the correlation value between the extracted watermark and
the original watermark bases. The second types of methods decode the transmitted
message based on estimation, where the decoder estimates the message bits based on
projection values of the received signal on several pre-agreed bases. In this method,

185
transmitting n message bits requires minimally n orthogonal bases. Although some
authors called the �rst case 1-bit watermarking and the latter n-bit watermarking
[44], the actual amount of information transmitted in the �rst case is not 1 bit.
Instead, it should be considered log2(M) where M is the number of bases used in
the watermarking process. It is neither 1 bit nor the length of basis. On the other
hand, the information transmitted in the second case is n bits.
For authentication, the embedded watermark is not used for transmitting mes-
sages but for detecting forgery. If the authentication output is only an indication
of whether this image is altered, then the transmitted information is 1 bit. If the
authenticator can localize the altered area as small as mx �my pixels, then we can
consider that, at least, Ixmx� Iy
mybits of information are transmitted, where Ix � Iy
is the image size.
� What kind of changes are invisible?
There has been much work in analyzing the \visibility" or \noticeability" of changes
made to a digital image. We can roughly categorize them into three types. They
vary in the extent of utilization of the Human Vision System (HVS) model.
Works of Type I consider that the just-noticeable changes are uniform in all
coe�cients in a speci�c domain, such as the spatial domain, frequency domain,
or some transform domain. PSNR is a typical measure used in these works for
assessing image quality. Works of Type II apply the human vision model to some
extent. Works of Type III attempts to fully apply the HVS model to predict the
visibility of changes.
The fact that some coe�cient changes are not noticeable is due to the masking
e�ect. The maximumun-noticeable changes (or equivalently the minimal noticeable
changes) are sometimes called masks or the Just-Noticeable Distortion (JND). We

186
Figure 5-1: Binary noise pattern with strength equal to Chou's JND bounds
Figure 5-2: Sinusoidal pattern with strength smaller than or equal to Chou's JNDbounds

187
should note that the meaning of \JND" is not consistent throughout the early
literatures and some recent papers (especially later than 1997). In early literatures,
the word \JND" is used as a measurement unit to indicate the visibility of the
changes to a pixel or the whole image in two images[88, 133]. The measurement
JND is a posterior measurement (i.e., after changes are made). In some recent
papers, JND is used to predict the maximum amount of invisible changes in a
speci�c pixel or a transform coe�cient of an image [18]. This is a measure made
prior to the change. We found that several watermarking papers use the latter
concept. However, no rigorous physical and psychological experiments have ever
shown the existence of such a priori distortion estimation. In reality, whether a
distortion is visible depends on both the image content and the distortion pattern.
Therefore, a distortion model depending on the image content only may not be
capable of predicting the visibility of distortion. An example is shown in Figure 5-1
and 5-2. We can see that di�erent change patterns introduce di�erent degrees of
visibility (result in Figure 5-2 is more noticeable) although the additive changes are
all within Chou's JND bounds [18].
Human Vision System models have been studied for over 30 years. These mod-
els were explored to describe human vision mechanisms such as spatial frequency-
orientation channels, dependence of sensitivity on local contrast, adaptation, mask-
ing, spatial summation, and channel summation. In the literature, the most com-
plete result involving the �elds of image processing, image science, and vision science
are two HVS models proposed by Lubin [88] and Daly [31]. Their models are built
by matching many empirical experiments designed by vision scientists. Usually,
these experiments are made by using grating (unidirectional sinusoidal signal) with
a �xed contrast, instead of complex, natural image data. Although whether the re-
sults of these experiments can be directly applied to complex image data is still an
188
open issue [102], Lubin's and Daly's models could match these experimental results
in a very good extent.
HVS models indicate that masking e�ects have di�erent in uences in di�er-
ent positions either in the spatial pixel domain, frequency domain, or frequency-
orientation domain. Also, general distortions such as lossy compression, blurring,
ringing, etc. do not generate uniform noises in these domains. Therefore, there
are obvious limitations in using Type I analysis models to predict the visibility
of changes. However, in practical applications, Type I analysis may be more com-
putable and can be used to provide a generic lower bound for watermarking capacity.
It is lower bound because Type I analysis usually utilizes the minimum of all the
invisible change values of pixels or transform coe�cients.
In image coding literatures, some research has applied human vision mechanism
to some extent. We categorize them under the Type II approach. Works in [133, 135]
include a series approaches in designing the quantization steps for the block-based
DCT coe�cients or wavelet coe�cients . In [133], Watson et. al. proposed a content
adaptive quantization method which applies some human vision mechanisms, such
as local contrast and masking. These models are used to adaptively adjust quantiza-
tion steps in each 8� 8 block. In [135], they designed a quantization matrix for the
wavelet coe�cients that was conceptually similar to the role of the Quality Factor
50 matrix in JPEG. That matrix was not content dependent, and was determined
by their initial limited experiments (with 3-5 people). They did try to estimate
a content-adaptive quantization matrix, but no experiments were shown. These
works may be useful for optimizing image coding parameters. However, much of
characteristics in Human Vision Models derived from rigorous vision science experi-
ments was not utilized. JPEG 2000 has considered this as an optional functionality
[61]. An advantage of using wavelet coe�cients or block-based DCT coe�cients is

189
that decomposition is complete and orthogonal. Therefore, capacity estimations in
individual coe�cients can be summed up. We will discuss them in more details in
Section 5.3.
� How robust is the watermark?
The robustness of a watermark is hard to de�ne. It depends on what kind of ap-
plications the watermark is designed for. For instance, if a watermark is used for
copyright protection, it has to survive di�erent types of attacks, including �ltering,
noise, geometric distortion, non-linear distortion, digital-to-analog and analog-to-
digital conversion, transcoding, etc. How to design a watermark to satisfy these
requirements is still an open issue. A more feasible approach is to design water-
marking methods that are robust in speci�c environments. One example is our
work described in Chapter 4 that focuses on distortions caused by the print-and-scan
processes. If a watermark is used for authentication, then acceptable manipulations
may be explicitly constrained, e.g., JPEG compression, as discussed in Chapter 3.
Depending on the availability of the source image in watermark decoding, wa-
termarks can be private or public. With a private watermark, because the source
image is also available in the decoder, the distorted watermarked image can usually
be resynchronized and compared to the original image. Therefore, most distortions
can be modeled as additive noises. In this case, watermarking capacity is much
easier to �nd. In the case of public watermarking, there are many di�erent designs,
as we have discussed in Chapter 4. It is hard to �nd a universal model for public
watermarking. In this case, we may ignore the geometric distortion that cannot be
resolved due to the lack of source image and consider pixel value distortion only.
Another issue is that in an environment with �nite states (e.g., discrete value
coe�cients) and bounded-magnitude noises, transmission error can be actually zero,
190
instead of stochastically approaching zero. For example, if quantization (with a
maximum quantization step) is the only source of distortion, since the added noise
is �nite, we can actually �nd the zero-error capacity of a digital image. We will
prove this in Section 5.2.
5.1.2 Prior Works Based on the Information Theory
Previous works on watermarking capacity directly apply the work of Shannon
[116] and Costa [20]. If the whole image has uniform watermark (or said codeword)
power constraint and noise power constraint in all pixel locations, then the capac-
ity problem of private watermarking is the same as the one solved by Shannon in
his original information theory paper in 1948 [116]. With the same constraints,
the capacity problem of public watermarking is the same as the problem that was
described by Costa in 1983 [20]. In both cases, the capacity is the same. That is,
C =1
2log2(1 +
P
N) (bits=sample) (5.1)
where P and N are the uniform power constraints of watermark and noise, respec-
tively. With these uniform constraints, the image can be considered as a communi-
cation channel. Shannon also showed that the channel capacity is the same if the
signal values are discrete [116].
In earlier watermarking works, public watermarking is sometimes considered as
a special case of private watermarking while the power of source image is included
as part of noise [23]. Therefore, intuitively, we can treat the source image as a noise
in calculating the capacity. Costa's paper in 1983 [20] seemed to show that the
capacity of public watermarking was the same as the private watermarking cases
where the power of the source image can be excluded. Some recent watermarking
papers have developed works based on this �nding [19]. However, it is still an open
191
issue whether the above claim is theoretically correct. The reason is that, in Costa's
work [20], the design of codewords has to depend on the source signal if we want to
achieve the same capacity regardless of the existence of the source signal. In other
words, codewords have to be specially designed for a speci�c source signal, and the
codewords need to be transmitted to the decoder as well. In addition, in Shannon's
theory, the channel capacity can only be achieved when the codeword length is
in�nite. Therefore, we think it is still too early to claim that, with uniform power
constraint, public watermarking has the same capacity as private watermarking
[19, 20].
Furthermore, we have shown, the Human Vision System (HVS) model tells us
that di�erent pixel locations have di�erent sensitivity of noise. In other words, the
power constraints of watermarks are actually not uniform. Also, general distortions
such as lossy compression, blurring, ringing, etc. do not generate uniform noises
in all pixel positions. Therefore, Shannon's and Costa's theories cannot be directly
applied to estimate the watermark capacity.
Several works including Servetto [114] and Akansu [109], did consider the vari-
ant properties in di�erent locations. They considered each pixel as an independent
channel and then calculated the capacity based on the theory of Parallel Gaussian
Channels (PGC) [22]. However, there are controversial issues with this treatment.
Compared to the PGC model, images do not have the temporal dimension in each
channel. In Shannon's channel capacity theory, the maximum information trans-
mission rate of a noisy channel can be achieved only if the codeword length is large
enough (i.e., the number of samples in each channel is long enough). But given a
single image, if we consider each pixel as a channel, then there is only one sample
available in each channel and therefore it is impossible to achieve the estimated
capacity.

192
The theoretical capacity analysis of an Arbitrarily Varying Channel (AVC) [28]
looks more promising for this variant state problem. However, this theory dealt
with cases in which the source power constraint in time (or in space) was described
statistically, which is not the case for watermarking. An image may be a vary-
ing channel, but its power constraints on watermark are determined by the HVS
model, and thus are not varying stochastically. Therefore, we have to develop a new
information-theoretical framework for analyzing the watermarking capacity based
on discrete-value and variant-state cases. We will present such a framework in Sec-
tion 5.3.
5.1.3 Focus of this Chapter
In this chapter, we will investigate watermarking capacity in three directions:
1. Watermarking capacity based on content-independent constraints on the mag-
nitudes of watermarks and noises. In Section 5.2, we will show that, in the case
that the noise magnitudes are constrained, a capacity bound with \determinis-
tic" zero error can be actually achieved. Speci�cally, we will �nd the zero-error
capacity for private and public watermarking in a magnitude-bounded noisy
environment. An example case is that, assuming the added noise is due to
quantization (as in JPEG), we can calculate the zero-error capacity based on
the setting of the magnitude constraints on watermark and noise. Note that
we consider all pixels, watermarks and noises are discrete values, which occur
in realistic cases.
2. Watermarking capacity based on domain-speci�c masking e�ects. In Section
5.3, we �rst show the capacity of private watermarking in which the power
constraints are not uniform. Then, we apply several domain-speci�c HVS
approximation models to estimate the power constraints and then show the

193
theoretical watermarking capacity of an image in a general noisy environment.
3. Watermarking capacity issues based on actual Human Vision System models.
In Section 5.4, we �rst describe in details the most sophisticated Human Vision
Systems developed by Daly and Lubin. Then, we discuss issues and possible
directions in applying these models to estimation of the watermarking capacity.
5.2 Zero-Error Watermarking Capacity of Digital Image
In this section, we will show that, in an environment with �nite states and bounded
noises, transmission error can be actually zero, instead of approaching zero as con-
templated in Shannon's channel capacity theory. We can �nd the zero-error capacity
of a digital image if quantization is the only source of distortion such as in JPEG
and the largest applicable quantization steps are determined in advance.
Shannon de�ned the zero-error capacity of a noisy channel as the least upper
bound of rates at which it is possible to transmit information with zero probability
of error [117]. In contrast, here we will show that rather than a probability of
error approaching zero with increasing code length, the probability of error can
be actually zero under the conditions described above. This property is especially
needed in applications that no errors can be tolerated. For instance, in multimedia
authentication, it is required that no false alarm occur under manipulations such as
JPEG compression.
In this section, we will show that the semi-fragile watermarking method that we
proposed in Chapter 3 is, in fact, one way of achieving the zero-error capacity. We
will also show two sets of curves that represent the zero-error capacity. Although
our discussion in this section will focus on image watermarking subject to JPEG
manipulation, the zero-error capacity we showed here can be extended to other
domains, such as the wavelet domain, as long as the noise magnitude is constrained.

194
5.2.1 Number of channels in an image
Here we consider the case that the maximal acceptable level of lossy compression is
pre-determined. In such case, the maximal magnitude of added noise is bounded.
As we mentioned in Section 5.1, JPEG is a bounded distortion process. Maximum
distortion of each DCT coe�cient is determined by the quantization step size. Since
JPEG uses the same quantization table in all blocks, maximum distortion just de-
pends on the position in the block and is the same for all coe�cients from di�erent
blocks but at the same position.
Assume a digital image X has M � N pixels that are divided into B blocks.
Here, in the blocked-based DCT domain, X may be considered as
� Case 1: a variant-state discrete memoryless channel (DMC). Transmission
utilizes this channel for M �N times.
� Case 2: a product of 64 static-state DMCs, in which all coe�cients in the same
position of blocks form a DMC. Each channel can be at most transmitted B
times. In other words, the maximum codeword length is B for each channel.
� Case 3: a product ofM�N static-state DMCs, in which each coe�cient forms
a DMC. Each channel can be at most transmitted once.
In most information theory research works, channel is usually considered as
invariant in time and has uniform power and noise constraint. This is usually
valid in communication. To the best our knowledge, time variant cases have been
addressed in [1, 28, 29], called Arbitrarily Varying Channel (AVC). However, such
a work on AVC may not be adequate to the watermarking problem because the
channel does not vary in a statistically arbitrary way. We think that Case 2 is the
best candidate for the capacity analysis problem if the image is only manipulated by
JPEG. Assuming no error correction codes are used in this zero-error environment,
195
the codes in Case 2 will be sensitive to local changes. Any local changes may cause
loss of the whole transmitted information in each channel. In applications that
information bits have to be extracted separately from each block, Case 3 may be
the best candidate. For instance, in the authentication case, some blocks of the
image may be manipulated. By treating each coe�cient as a separate channel (as
in Case 3), we can detect such manipulations in a local range.
5.2.2 Zero-Error Capacity of a Discrete Memoryless Channel and a Dig-
ital Image
The zero-error capacity of discrete memoryless channel can be determined by ap-
plying adjacency-reducing mapping on the adjacency graph of the DMC (Theorem
3 in [117]). For a discrete-value channel, Shannon de�ned that two input letters
are adjacent if there is a common output letter which can be caused by either of
these two [117]. Here, in the JPEG cases, a letter means an integer value within the
range of the DCT coe�cient. An adjacency-reducing mapping means a mapping of
letters to other letters, i! �(i), with the property that if i and j are not adjacent
in the channel (or graph) then �(i) and �(j) are not adjacent. In other words, it
tries to reduce the number of adjacent states in the input based on the adjacency
of their outputs. Adjacency means that i and j can be mapped to the same state
after transmission. We should note that the problem of determining such a mapping
function for an arbitrary graph is still wide open. Also, it is sometimes di�cult to
determine the zero-error capacity of even some simple channels [65]. For instance,
it took more than 20 years and a brilliant idea of Lovasz [87] to show the Shannon's
lower bound on the zero-error capacity for the pentagon graph was tight.
Fortunately, we can �nd an adjacency-reducing mapping and the zero-error ca-
pacity in the JPEG case. Assume the just-noticeable-change on a DCT coe�cient is

196
Figure 5-3: Adjacency-reducing mapping of discrete values in the appearance ofquantization noise
197
12Qw
1 and the largest applicable JPEG quantization step to this coe�cient is Qm,
then the zero-capacity of this channel will be
C(Qw; Qm) = log2(bQw
Qmc+ 1) (5.2)
Eq. (5.2) can be proved by using the adjacency-reducing mapping as in [117].
Figure 5-3 shows an example to reduce adjacency points. Given a Qm, which is
the maximum quantization step that may be applied to the coe�cient Sw, then the
possible value Sw at the receiver end will be constrained in a range of Qm possible
states. According to Shannon's adjacency-reducing mapping, we can �nd that the
non-adjacent states have to separate from each other for a minimum of Qm. For
instance, assume the value of S is i, then its closest non-adjacency states of i are
i+Qm and i�Qm. To �nd out the private watermarking capacity, we assume that
all the states within the range of [i� 12Qw; i+
12Qw) are invisible. Therefore, there are
Qw candidate watermarking states in this range. Since we have shown that the non-
adjacent states have to separate from each other by Qm, then there will be bQw
Qmc+1
applicable states in the Qw ranges that can be used to represent information without
noticeable change. Therefore, from the information theory, we can get the capacity
of this channel in Eq. (5.2). For instance, in Figure 5-3, Qw = 11 and Qm = 5.
Using Eq. (5.2), we can obtain the capacity rate to be 1:59 bits=sample.
Eq. (5.2) is a bound for private watermarking with known source values S in the
receiver. However, in the public watermarking cases, S is not known at the receiver
end, i.e. i is unknown. In this case, the number of applicable states in the just-
noticeable range, [i� 12Qw; i+
12Qw), will be larger than or equal to bmax(Qw�Qm;0)
Qmc+1.
1Note that Qw can be uniform in all coe�cients in the same DCT frequency position, or theycan be non-uniform if some human perceptual properties are applied. This is an open issue asdiscussed in Section 5.1. For Case 2, we assume the uniform property, while whether Qw is uniformor non-uniform does not a�ect our discussion in Case 3.

198
In other words, if Qw � Qm, then there is either bQw
Qmc+1 or bQw
Qmc applicable states.
If Qw < Qm, then there may be no applicable state or only 1 state. Therefore, we
can get the minimum capacity of public watermarking in this case,
~C(Qw; Qm) = log2(bmax(Qw �Qm; 0)
Qmc+ 1): (5.3)
In Case 2, information is transmitted through B parallel channels, whose ca-
pacity can be summed up [22]. The total zero-error capacity of an image surviving
JPEG compression is, therefore,
C = bB �X�2V
~C�(Qw;Qm)c (5.4)
where V is a subset of f1::64g. Intuitively, V is equals to the set of f1::64g. However,in practical situation, even though the changes are all within the JND of each
coe�cient, the more coe�cients changed the more possible the changes are visible.
Also, not always all the 64 coe�cients can be used. We found that V = f1::28gis a empirical reliable range that all coe�cients are quantized as recommended in
the JPEG standard by using some commercial software such as Photoshop and xv2
Therefore, we suggest to estimate the capacity based on this subset. An empirical
solution of Qw is Q50, as recommended as invisible distortion bound in the JPEG
standard. Although practical invisible distortion bounds may vary depending on
viewing conditions and image content, this bound is considered valid in most cases
[129]. Figure 5-4 shows the zero-error capacity of a gray-level 256 � 256 image.
In Case 3, we want to extract information through each transmission channel.
Because the transmission can only be used once in this case, the information each
2Some application software may discard all the f29::64gth DCT coe�cients regardless of theirmagnitudes.

199
01020304050607080901000
2
4
6
8
10
12
14
16x 10
4
Zer
o−E
rror
Cap
acity
(bi
ts)
Acceptable JPEG Quality Factor
The Zero−Error Capacity (Image: 256 X 256, Channel Case 2)
Qw=Q50
Qw=Q25
Qw=Q75
28672 bits
Figure 5-4: The Zero-Error Capacity of a 256 � 256 gray-level image for channelcase 2

200
01020304050607080901000
2
4
6
8
10
12
14
16x 10
4
Zer
o−E
rror
Cap
acity
(bi
ts)
Acceptable JPEG Quality Factor
The Zero−Error Capacity (Image: 256 X 256, Channel Case 3)
Qw=Q50
Qw=Q25
Qw=Q75
28672 bits
Figure 5-5: The Zero-Error Capacity of a 256 � 256 gray-level image for channelcase 3

201
channel can transmit is therefore b ~Cc. Similar to the previous case, summing up the
parallel channels, then we can get the zero-error capacity of public watermarking in
Case 3 to be
C = B �X�2Vb ~C�(Qw;Qm)c (5.5)
A �gure of Eq. (5.5) is shown in Figure 5-5. These bits can be restored independently
at each utilized coe�cient. In other words, changes in a speci�c block would only
a�ect its hidden information in that block.
5.2.3 Figures of Zero-Error Capacity Curve of Digital Images
In Figure 5-4 and Figure 5-5, we show the zero-error capacity of any 256 � 256
gray level image. Three di�erent just-noticeable changes in the DCT coe�cients
are used. The curve Qw = Q50 is the just-noticeable distortion suggested by JPEG.
In Figure 5-4, we can see that if the image is quantized by a JPEG quality factor
larger or equal to 75, (i.e., Qm � Q75 =12Q50) then the zero-error capacity of this
image is at least 28672 bits, which is equal to 28 bit=block. This is a bound due
to an empirical constraint that only the �rst 28 DCT coe�cients are used in our
calculation. It means that we can embed 28 bits of information in 28 coe�cients
of a block, and the message can be reconstructed without any error if the image is
distorted by JPEG with quality factor larger or equal to 75. We can notice that
when 75 < m � 72, the capacity is not zero because some of their quantization
steps in the quantization table are still the same as Q75.
Comparing Eq. (5.5) with Theorem 4 in Chapter 3, we can see that Theorem 4
has utilized the zero-error capacity by embedding information similar to Case 3. The
only di�erence is that, in SARI, because we �x the ratio of Qw = 2Qm, we embed
one bit in each used channel. Therefore, the embedding rate is smaller or equal to

202
28 bits for each block3. Our experiments have shown that the previous estimated
capacity bound can be achieved in realistic applications. More experimental results
of this zero-error capacity analysis will be shown in [85].
5.3 Watermarking Capacity based on Domain-Speci�ed
Masking E�ect
In this section, we investigate the watermarking capacity based domain-speci�ed
masking e�ects. We �rst derive the capacity of private watermarking when that
power and noise constraints are not uniform across samples, i.e., the capacity issue
in a variant state channel. Then, we apply domain-speci�c HVS models to esti-
mate the power constraints of watermarks. We will apply four models: Watson's
DCT perceptual adaptive quantization method, Watson's wavelet quantization ta-
ble, JPEG default quantization table and Chou's JND pro�le. We will show the
theoretical private watermarking capacity based on these four methods.
5.3.1 Capacity of a Variant State Channel
We consider an image as a channel with spatial-variant states, in which the power
constraint of each state is determined by HVS model or masking e�ect in some
special domains. In this way, each coe�cient is considered as an independent random
variable with its own noise distribution. We will not consider a coe�cient as a
communication channel [109, 114] or sub-channel [67] because a channel usually
indicates its reuse temporally, spatially, or in other domains.
Let X1;X2; ::;Xn be the changes of the coe�cients in a discrete image due to
watermarking. We �rst assume these values are continuous, and later we will show
3Because the length of recover bits are variant depending on the image content, some coe�cientsare not used for embedding
203
that the capacity is the same if they are quantized to discrete values. The power con-
straint of these values are the masking bounds determined by the source coe�cient
values S1; S2; :::; Sn. We de�ne a masking function f s.t. E(XXT ) � f(S) where
X = [X1;X2; ::;Xn]T and S = [S1; S2; ::; Sn]T . Refer to Figure 1-3, SW = S+X. In
the receiver end, consider Y = SW�S = X+Z where Z are the noises added to the
coe�cients during transmission. Then, the maximum capacity of these multivariant
symbols is
C = maxp(X):E(XXT )�f(S)
I(X;Y) given p(Z) (5.6)
where p(:) represents any probability distribution and I(:; :) represents mutual in-
formation.
From Eq. (5.6), because we can assume X and Z are independent, then
I(X;Y) = h(Y)� h(YjX) = h(Y) � h(Z); (5.7)
where h(:) represents the di�erential entropy. According to Theorem 9.6.5 in [22],
8Y 2 Rn with zero mean and covariance K = E(YYT ), the di�erential entropy of
Y, i.e., h(Y) satis�es the following
h(Y) � 1
2log(2�e)njKj; (5.8)
with equality i� Y � N (0;K) and j:j is the absolute value of the determinant. Here,
this theorem is valid no matter what the range of K is.
Therefore, from Eq. (5.7), (5.8) and jKj = jE(YYT )j = jE(XXT ) + E(ZZT )j,we can see that
C =1
2log(2�e)njf(S) + E(ZZT )j � h(Z): (5.9)
where we assume f(S) is diagonal and nonnegative s.t. jE(XXT ) + E(ZZT )j �

204
jf(S) + E(ZZT )j. This assumption means that embedded watermark values are
mutually independent.
Eq. (5.9) is the watermarking capacity in a variant-state channel without spec-
ifying any type of noise. It is the capacity given a noise distribution. If we look at
Eq. (5.9) and Theorem 9.6.5 in [22] again, for all types of noises, we can �nd that
C will be at least
Cmin = 12log(2�e)
njf(S) + E(ZZT )j � 12 log(2�e)
njE(ZZT )j= 1
2jf(S) + E(ZZT )�1 + Ij:
(5.10)
when the noise is Gaussian distributed. If we further assume that noises are also
independent in samples, then the watermarking capacity will be
Cmin =nXi=1
1
2log(1 +
PiNi
) (5.11)
where Pi and Ni are the power constraints in the i� th coe�cient, respectively. It isinteresting that even though we use the multivariants to derive Eq. (5.11) instead
of using Parallel Gaussian Channels, their results are the same in this special case.
For discrete values, we can apply Theorem 9.3.1 in [22], which shows the entropy
of an n-bit quantization of a continuous random variable X is approximately h(X)+
n. Because, in general, only one kind of quantization would be used, in Eq. (5.6),
we can see that the mutual information I will be the same because n will be deleted.
Therefore, the capacity shown in Eq. (5.11) is still valid in the discrete value case.
5.3.2 Masking E�ect in Speci�c Domains
General human vision mechanisms show that masking e�ects are decided by lumi-
nance, contrast, and orientation. Luminance masking, with its basic form of We-
ber's e�ect, describes that the brighter the background is, the higher the luminance

205
masking threshold will be. Detection threshold for a luminance pattern typically
depends upon the mean luminance of the local image region. It is also known as
light adaptation of human cortex. Contrast masking refers to the reduction in the
visibility of one image component by the presence of another. This masking is
strongest when both components are of the same spatial frequency, orientation, and
location. Human vision mechanisms are sharply tuned to orientations. Orientation-
selective channels in the human visual system were revealed through both human
psychophysical means [15] and physical experiments on the visual cortex of cats
[50, 51] and monkeys [106, 34].
Watson el. al. applied the two properties to coe�cients in several di�erent do-
mains [104, 133, 134, 135]. Watson's model for DCT thresholds can be summarized
as follows. First, an original just-noticeable-change, called mask, is assumed to be
the same in all blocks. Then, these values are all adjusted by the DC values of the
blocks, called luminance masking, and by the coe�cients themselves, called contrast
masking. Assume the original mask values are tij; i; j = 0::7 in all blocks, then, for
the block k, set
tijk = tij(c00k�c00
)aT (5.12)
where c00k is the DC value of the block k and �c00 is the DC value corresponding to
the mean luminance of the display (�c00 = 128 � 8 = 1024 for an 8-bit gray level
representation). The parameter aT is suggested by Ahumada and Peterson as 0:649
[2]. After luminance masking, we can then perform contrast masking to get the
just-noticeable-change mask values, mijk, in the block k as
mijk = max(tijk; jcijkjwij t1�wij
ijk ) (5.13)
where wij is an exponent between 0 and 1. A typical empirical value of wij = 0:7
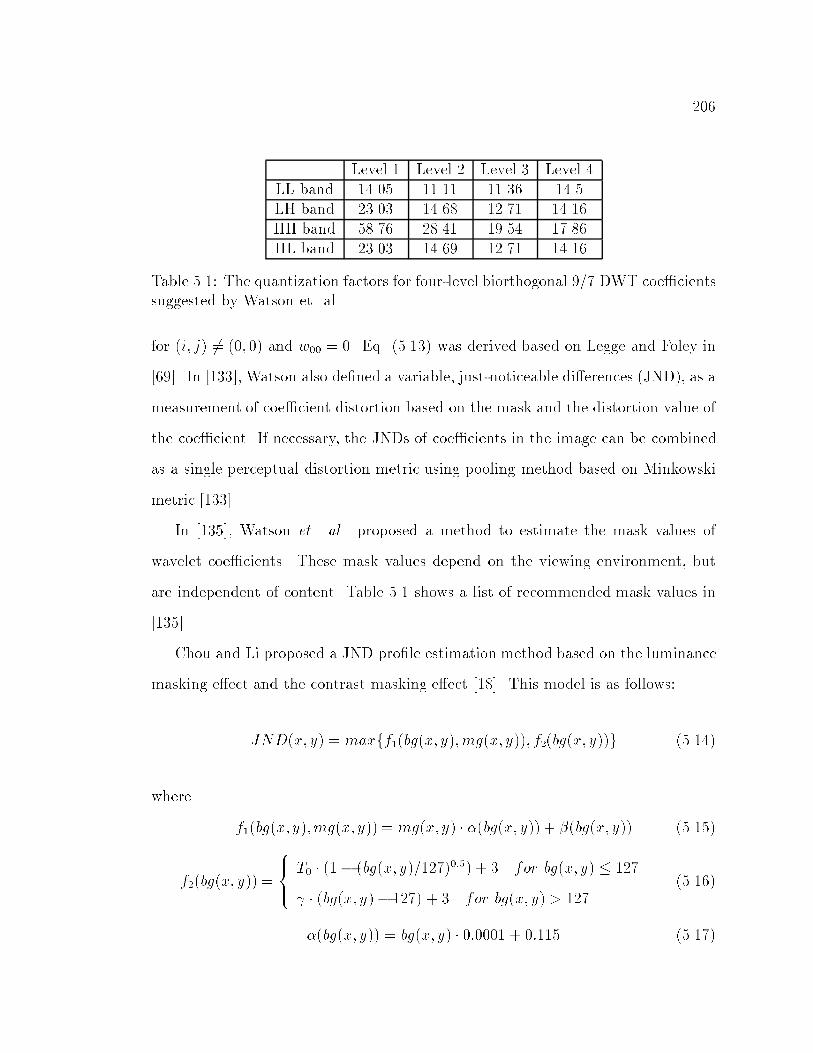
206
Level 1 Level 2 Level 3 Level 4LL band 14.05 11.11 11.36 14.5LH band 23.03 14.68 12.71 14.16HH band 58.76 28.41 19.54 17.86HL band 23.03 14.69 12.71 14.16
Table 5.1: The quantization factors for four-level biorthogonal 9/7 DWT coe�cientssuggested by Watson et. al.
for (i; j) 6= (0; 0) and w00 = 0. Eq. (5.13) was derived based on Legge and Foley in
[69]. In [133], Watson also de�ned a variable, just-noticeable di�erences (JND), as a
measurement of coe�cient distortion based on the mask and the distortion value of
the coe�cient. If necessary, the JNDs of coe�cients in the image can be combined
as a single perceptual distortion metric using pooling method based on Minkowski
metric [133].
In [135], Watson et. al. proposed a method to estimate the mask values of
wavelet coe�cients. These mask values depend on the viewing environment, but
are independent of content. Table 5.1 shows a list of recommended mask values in
[135].
Chou and Li proposed a JND pro�le estimation method based on the luminance
masking e�ect and the contrast masking e�ect [18]. This model is as follows:
JND(x; y) = maxff1(bg(x; y);mg(x; y)); f2(bg(x; y))g (5.14)
where
f1(bg(x; y);mg(x; y)) = mg(x; y) � �(bg(x; y)) + �(bg(x; y)) (5.15)
f2(bg(x; y)) =
8><>:
T0 � (1� (bg(x; y)=127)0:5) + 3 for bg(x; y) � 127
� (bg(x; y)� 127) + 3 for bg(x; y) > 127(5.16)
�(bg(x; y)) = bg(x; y) � 0:0001 + 0:115 (5.17)

207
1 2 3 4 5 6 7 8 9 100
0.5
1
1.5
2
2.5x 10
5
Standard Deviation of Noise
Em
bedd
ing
Cap
acity
(bi
ts)
Data Hiding Capacity of the 256x256 Lenna Image
Watson wavelet maskWatson DCT mask JPEG QF50 mask Chou mask
Figure 5-6: The estimated watermarking capacity based on four domain-speci�edmasks
�(bg(x; y)) = � � bg(x; y) � 0:01 (5.18)
The experimental result of the parameters are, T0 = 17, = 3128
, and � = 12. In this
model, bg(x; y) is the average background luminance, and mg(x; y) is the contrast
value calculated from the output of high-pass �ltering at four directions. f1 and f2
model the contrast and luminance masking e�ects, respectively.
5.3.3 Experiments of Watermarking Capacity Based on Domain-Speci�ed
Masking E�ects
In Figure 5-6, We show the estimated watermarking capacity based on Watson's
DCT masking model, Watson's wavelet coe�cient quantization table, JPEG recom-
mended quantization table (i.e., Q50) and Chou's JND pro�le. These four di�erent

208
kinds of just-noticeable-change masks provide estimation of the watermarking power
constraint Pi in Eq. (5.11). Noises are assumed to be white Gaussian with its stan-
dard deviation from the range of [1; ::; 10]. From Figure 5-6, we can see that the
theoretical watermarking capacity indicates that this image can embed tens of thou-
sand bits in the private watermarking cases. For instance, in the case where the
standard deviation of noise is equal to 5 (PSNR = 34 dB), the theoretical estimated
value are 84675, 102490, 37086, and 33542 bits, in the order of Watson's DCT
mask, Watson's wavelet mask, JPEG quantization table, and Chou's JND pro�le,
respectively.
5.4 Watermarking Capacity based on Human Vision Sys-
tem Model
In this section, we are interested in more complicated HVS, unlike the approximate
ones used in the previous section. Speci�cally, we �rst introduce and compare two
Human Vision System models that are developed by Lubin and Daly. Then, we will
discuss how to calculate watermarking capacity based on these models. Because
of the complexity of these models, there are some practical obstacles in directly
applying them. Therefore, we do not be able to derive analytical results and show
numerical results as prior sections. Instead, we point out interesting implications of
these models and possible approaches for future works.
5.4.1 Human Vision Model
On interesting aspect of the HVS model is to predict whether an error in a picture
is visible to an observer. The capability of allowing such an invisible error was later
called \masking e�ect" [131]. This is primarily due to the optics of the eye, the
sampling aperture of the cone photoreceptor, and both passive and active neural
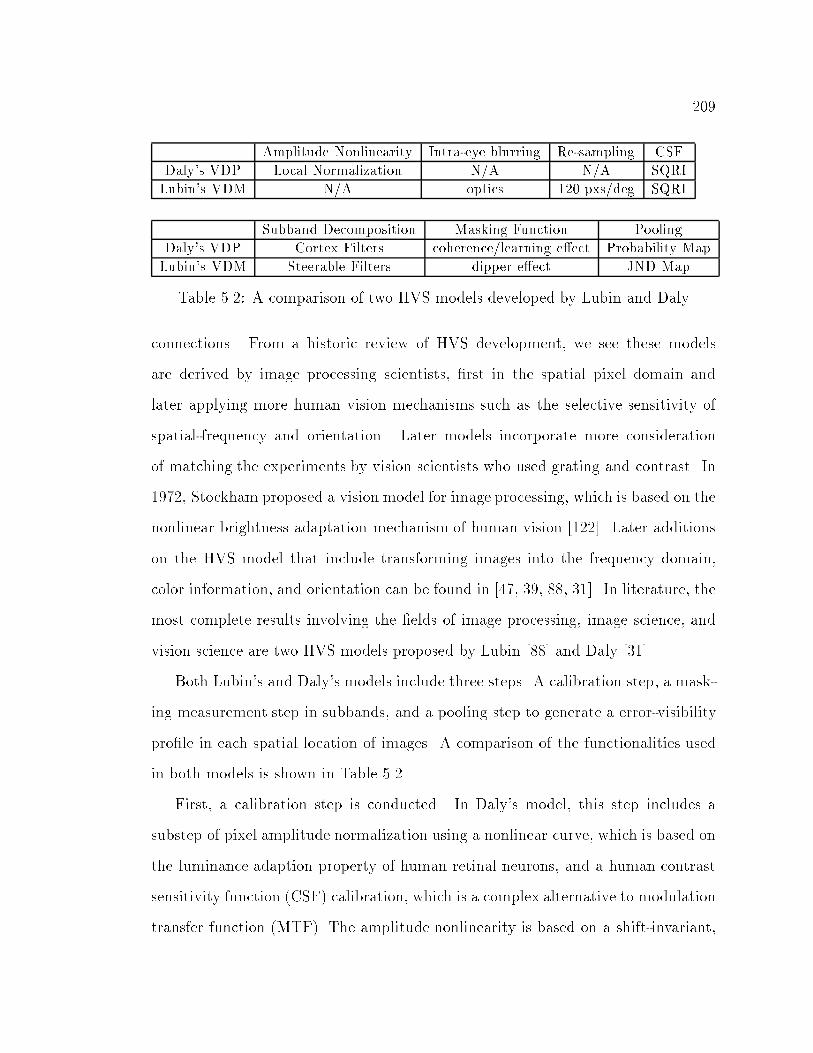
209
Amplitude Nonlinearity Intra-eye blurring Re-sampling CSF
Daly's VDP Local Normalization N/A N/A SQRI
Lubin's VDM N/A optics 120 pxs/deg SQRI
Subband Decomposition Masking Function Pooling
Daly's VDP Cortex Filters coherence/learning e�ect Probability Map
Lubin's VDM Steerable Filters dipper e�ect JND Map
Table 5.2: A comparison of two HVS models developed by Lubin and Daly
connections. From a historic review of HVS development, we see these models
are derived by image processing scientists, �rst in the spatial pixel domain and
later applying more human vision mechanisms such as the selective sensitivity of
spatial-frequency and orientation. Later models incorporate more consideration
of matching the experiments by vision scientists who used grating and contrast. In
1972, Stockham proposed a vision model for image processing, which is based on the
nonlinear brightness adaptation mechanism of human vision [122]. Later additions
on the HVS model that include transforming images into the frequency domain,
color information, and orientation can be found in [47, 39, 88, 31]. In literature, the
most complete results involving the �elds of image processing, image science, and
vision science are two HVS models proposed by Lubin [88] and Daly [31].
Both Lubin's and Daly's models include three steps. A calibration step, a mask-
ing measurement step in subbands, and a pooling step to generate a error-visibility
pro�le in each spatial location of images. A comparison of the functionalities used
in both models is shown in Table 5.2.
First, a calibration step is conducted. In Daly's model, this step includes a
substep of pixel amplitude normalization using a nonlinear curve, which is based on
the luminance adaption property of human retinal neurons, and a human contrast
sensitivity function (CSF) calibration, which is a complex alternative to modulation
transfer function (MTF). The amplitude nonlinearity is based on a shift-invariant,

210
simple point normalization curve derived by Daly et. al. [115]. The name \contrast"
is basically used in the visual sensitivity experiments using gratings. In a complex
image, the contrast is referred to as the value of spatial frequency coe�cients. The
CSF used in Daly's model is derived from the SQRI method of Barten [7, 8]. It was
described in [8] as:
CSF (�) = a� exp(�b�)(1 + c exp(b�))1
2 (5.19)
where � is the angular spatial frequency in cycles/degree (cpd), and
a =540(1 + 0:7=L)�0:2
1 + 12=[w(1 + �=3)2]; (5.20)
b = 0:3(1 + 100=L)0:15; (5.21)
c = 0:06: (5.22)
where L and w are display luminance in cd=m2 and display width in degrees. In
Lubin's model, the calibration step includes a blurring function, which simulates
the intra-eye optical point spread function (PSF) when the �xation distance di�ers
from the image distance (i.e., a calibration of myopia or hyperopia), and a sampling
function to scale the image to a �xed square grid of 120 pixels/degree, which simu-
lates the �xed density of cones in the fovea, based on the biological experiments on
monkeys [146].
The second step of the models consider the masking functions. In both models,
masking functions are applied to the intensity of spatial-frequency coe�cients ob-
tained by orientation-related �lter banks. Daly uses Watson's cortex �lters [132],
which are performed in the DFT domain, as the �lter bank. The basic idea of cor-
tex �lters is to divide the whole DFT spectrum into 5 circular subbands, and each
subband is divided into 6 orientation bands. The boundary of subbands are step

211
functions convolved with Gaussian. These, with the orientation-independent base
band, give a total of 31 subbands. Lubin uses the steerable myramid �lters [63]
as the �lter bank. These �lters are similar to an extended wavelet decomposition.
They includes the 7 spatial-frequency decomposition and 4 orientation decomposi-
tion, with a total of 28 subbands. After subband decomposition, masking functions
are applied to predict the tolerable changes in both models. Daly uses a masking
function that is controlled by the type of image (noise-like or sine-waves) and the
number of learning (i.e., the visibility of a �xed change pattern would increase if the
viewer observes it for multiple times). Lubin uses a masking function considering
the dipper e�ect [99]. This masking function is,
T (ei) =(k + 2)jeijn
kjeijn�w + jeijm + 1; (5.23)
where ei is the coe�cient value in subbands, n = 1:5, m = 1:1, w = 0:068, and
k = 0:1. In Lubin's model, he applied the CSF (Eq. 5.19) in the subbands before
this masking function, and called the two steps as a \transducer" stage. We should
notice that this is an important di�erence between Lubin's model fromDaly's model,
in which CSF is applied in the DFT coe�cients of the image. CSF and masking
functions are the most important parameters in deciding the masking e�ect of im-
ages. CSF can be interpreted as a calibration function which is used to normalize
the di�erent perceptual importance in di�erent spatial-frequency location. Masking
functions determine how much change is allowed in each spatial-frequency location
based on its value. We should note that masking function actives like a normaliza-
tion function in predict the just-noticeable-change masks from the magnitude in a
non-linear way.
The third step of the models is a mechanism to convert the measures of coe�cient
distortions into a number to indicate the human visual discretion capability toward

212
two images. The Daly's model shows a map of the probability of visibility. The
Lubin's model shows a map of the JND unit value of each pixel, e.g., a JND value of
1 in a location means the change in this position is at about the visibility threshold.
The distance measure is calculated based on the Minkowski metric of the output of
masking function:
Dj = fmXk=1
jTj;k(s1)� Tj;k(s2)jQg1
Q (5.24)
where j indexes over spatial position, k indexes over the 28 frequencies and orien-
tations, s1 and s2 are the two input images, T is the transducer output, and Q is a
parameter set to 2:4. The Daly's model emphasizes threshold accuracy by duplicat-
ing psychophysical results concerning the visual system. The Lubin's model focuses
on modeling the physiology of the visual pathway. An experimental comparison of
these two HVS models can be found in [70]. In their tests, the Lubin's model was
somewhat more robust giving better JND maps and requiring less re-calibration.
The Lubin's model had better execution speed than the Daly's model but at the
expense of using signi�cantly more memory.
5.4.2 Capacity Measurements and Future Directions
We tried to measure the capacity based on Lubin's HVS model, because: 1) it has
better experimental results in [70] and 2) there is no physical evidence showing that
human eyes perform Fourier Transform [102] as in Daly's model. Lubin's wavelet-
like steerable pyramid �lters may be closer to the real physical function of human
vision, in which high frequency components are a�ected by only adjacent areas
instead the whole image as in DFT. To �nd out the capacity, we �rst need to rescale
the image to 512 � 512. Then, we apply the 3rd-order directional derivatives of a
circular-symmetric function as the steerable pyramid �lter bank [63] to �lter the
rescaled image. We then get 28 subband images. To estimate the just-noticeable-
213
change from the masking output of image s1, i.e., Tj;k(s1), we �rst assume that all
these 28 images introduce the same distortion in the masking function output. That
means Tj;k(s2) = Tj;k(s1)� ( 128)
1
2:4 if D = 1 in Eq. (5.24). After we get Tj;k(s2), we
can estimate the just-noticeable magnitudes using some numerical method to get it
from Eq. (5.23), and then normalize it based on the CSF (Eq. (5.19)).
Theoretically, we can use Eq. (5.10) to estimate the capacity, because Eq. (5.10)
was valid in the non-orthogonal multivariant cases. We can then draw the capacity
�gures using similar methods as in Section 5.3. Some simple values have been
calculated. However, to draw the whole �gure, we found that this may not be
realistic and is not computationally feasible because of its non-linearly in Eq. (5.23)
and non-orthogonality in subband decomposition. This is a main reason why current
HVS model may not be a good candidate in estimating the watermarking capacity.
From the discussion of the two most complete HVS models, we found that al-
though they are constructed based on extensive physical and psychological experi-
ments, we might be able to modify some model components so that they are more
suitable for watermark capacity analysis. For instance, to satisfy the orientation-
selective property of human vision, Lubin and Daly used speci�c �lters, which were
not justi�ed with strong evidence. Because these orientation �lters are main rea-
son why the decomposed coe�cients are not orthogonal, as an alternative, we may
choose LH, HH, and HL bands of wavelet decomposition to substitute these orien-
tation �lters and derive its corresponding CSF and masking function based on the
experiments in the vision �eld. We think this research will help us in designing a
generic image quality assess method as well as estimating watermarking capacity.
214
5.5 Conclusion
In this chapter, we have presented several approaches to the challenging problem
in estimating the theoretical bounds of image watermarking capacity. We analyze
this problem with three considerations: the amount of embedded information, invis-
ibility and robustness. First, we derived and demonstrated the zero-error capacity
for public watermarking in environments with magnitude-bounded noise.4 Because
this capacity can be realized without using the in�nite codeword length and can
actually accomplish zero error, it is very useful in real applications. This work has
also provided an theoretical framework for our semi-fragile watermarking work in
Chapter 3, which has achieved the maximum amount of information that can be
embedded if quantization is the only distortion noise to images.
In the second part of this chapter, we change the �nite magnitude constraints to
power constraints on watermark and noise. These constraints can be variant based
on HVS. We have calculated the capacity of private watermarking with its power
constraint estimated by domain-speci�c masking function. We analyzed the capacity
by considering image pixels as multivariant, instead of parallel Gaussian channels.
Using this model, the power constraint and noise constraint can be di�erent in
di�erent positions, which is an important characteristic of human vision.
In the third part, we have introduced and compared the details of two compli-
cated Human Vision Systems. We have pointed out the commonalities and major
di�erences of these two models. We have also discussed and shown the di�culties
in directly applying these HVS models to analyze watermarking capacity. Based on
our analysis, we proposed potential future directions in which these models may be
4Note that the zero-error capacity exist because the magnitude of noises is bounded. Capacityis calculated by considering coe�cients as multivariate. The power constraints of watermarkingsignal and noises need not be uniform.

215
modi�ed to estimate watermark capacity.
There are still many issues about watermarking capacity not addressed in this
chapter. For instance, in the second part, we still do not know how to estimate
the capacity of public watermarking (with or without geometric distortion). As we
mentioned in Section 5.1, it is still an open issue whether Costa's capacity is valid
for public watermarking.
216
Chapter 6
Conclusions and Future Work
A new economy based on information technology has emerged. People create,
sell, and interact with multimedia content. The Internet provides a ubiquitous
infrastructure for e-commerce; however, it does not provide enough protection for
its participants. Lacking adequate protection mechanisms, content providers are
reluctant to distribute their digital content, because it can be easily re-distributed.
Content receivers are skeptical about the source and integrity of content. Current
technology in network security protects content during one stage of transmission.
But, it cannot protect multimedia data through multiple stages of transmission,
involving both people and machines. These concerns have hindered the universal
acceptance of digital multimedia. At the same time, they also stimulate a new
research �eld: multimedia security.
In this thesis, we have successfully developed a robust digital signature algo-
rithm and a semi-fragile watermarking algorithm. These algorithms help design
the Self-Authentication-and-Recovery Images (SARI) system, demonstrating unique
authentication capacities missing in existing systems. SARI is a semi-fragile water-
marking technique that gives \life" to digital images. Like a gecko can recover its
cut tail, a watermarked SARI image can detect malicious crop-and-replacement ma-
nipulations and recover an approximated original image in the altered area. Another
217
important feature of SARI is its compatibility to JPEG lossy compression. SARI
authenticator is the only system that can sensitively detect malicious changes while
accepting alteration introduced by JPEG lossy compression. The lowest acceptable
JPEG quality factor depends on an adjustable watermarking strength controlled
in the embedder. SARI images are secure because the embedded watermarks are
dependent on their own content (and on their owner).
Extending the robust digital signature technique to video, we have also devel-
oped the �rst video authentication system that can accept some video transcoding
operations but is able to reject malicious attacks.
We have also successfully developed a public watermarking, surviving pixel value
distortion as well as geometric distortion. The watermark is embedded by shaping
a 1-dimensional signal obtained by �rst taking the Fourier transform of the image,
resampling the Fourier magnitudes into log-polar coordinates, and then summing a
function of those magnitudes along the log-radius axis. We can therefore compensate
for rotation with a simple search, and compensate for scaling by using the correlation
coe�cient as the detection metric. Our tests of false positive and robustness on
more than 2,000 images have shown that the watermark is robust to rotation, scale
and translation. In addition, we have tested its robustness to cropping and JPEG
compression. We have also discussed and presented its applications for the print-
and-scan applications.
In addition, we have addressed the important question of how much information
can be reliably transmitted as watermarks without causing noticeable quality losses,
while being robust to some manipulations. We demonstrated the zero-error capacity
for public watermarking in a magnitude-bounded noisy environment. We studied
the capacity of private watermarks, based on predictable human vision properties
in speci�c domains. We showed the capacity by deriving the capacity in a spatial-

218
variant discrete channel, and estimated the distortion bounds by several domain-
speci�c models. We also included some preliminary studies with respect to the
watermarking capacity issues based on Human Vision System models.
� Future Related Research Issues
There are many more topics waiting to be solved in the �eld of multimedia security.
We brie y describe some of them in the following.
In the area of public watermarking schemes for multimedia copyright protection,
we need to (1) model multimedia signal distortion after various D/A transcoding
processes and compression schemes, and (2) design public watermarking schemes
for various multimedia formats based on the above distortion models and feature
vector shaping.
For multimedia authentication, open issues include:
� Content-based Multimedia Authentication: The objective here is to develop
multimedia authentication methods based on content analysis techniques. The
focus should be on the mechanism of authenticating multimedia data using
di�erent representation layers and the stability of automatic feature extrac-
tion.
� Document Authentication: Documents include combinations of text, pictures,
and graphics. This task may include two directions: authentication of digi-
tal documents after they are printed-and-scanned, and authentication of pa-
per documents after they are scanned-and-printed or photocopied. The �rst
direction is to develop watermarking or digital signature techniques for the
continuous- tone images, color graphs, and text. The second direction is to
develop half-toning techniques that can hide information in the bi-level half-
tone document representations.

219
� Audio Authentication: The idea here is to study the state-of-the-art speech
and speaker recognition techniques, and to embed the speaker (or his/her
vocal characteristics) and speech content in the audio signal. This research
also includes the development of audio watermarking techniques surviving
lossy compression.
� Image/Video/Graph Authentication: This project will focus on developing au-
thentication techniques to accept new compression standards (such as JPEG-
2000) and general image/video processing operations, and reject malicious
manipulations.
Another interesting application is �ngerprinting, which embeds multiple receiver
identi�cations as tracing evidence in content distribution. The di�culties are to de-
sign co-existing watermarks and to enlist the cooperation of the web server providers.
Development of such a system will involve two aspects. The �rst aspect is to design
multiple watermarking techniques. It may be derived from the existing TDMA,
FDMA, and CDMA methods. The second aspect is to develop software for the web
server and to design protocols for tracing illegal distribution.
For information hiding applications, interesting issues exist in developing high
capacity information hiding techniques in the digital domain as well as in the tradi-
tional domain such as printed documents or magnetic audio/video tapes. It may be
used for any purpose, i.e., hidden annotation in controlling the usage of multimedia
content. Related issues exist in broadcast monitoring.
For multimedia security infrastructure issues, there have been extensive discus-
sion in the MPEG-4 and MPEG-21 communities on developing universal infrastruc-
tures for multimedia data. In our view, the infrastructure development involves
several parts. The �rst part is to develop authentication and copyright protection
protocols in cooperation with the Public Key Infrastructure (PKI) used for net-
220
work security. The second part is to design protocols for speci�c applications such
as MPEG-4 video or JPEG-2000 images/documents. The third part is to develop
compatible watermarking methods for hidden annotations or copyright declaration.
In addition to multimedia security projects, ideas in several directions have been
derived throughout our research and are not covered in this thesis due to space
constraint. For instance, we have investigated the possibility in using the self-
authentication-and-recovery images for error concealment in wireless and Internet
transmission. We think that the SARI technique may be a promising solution in
solving the complex session control problem in multimedia multicasting system or
the high re-transimission delay in a network with high packet loss rate. Through
the research of human vision models in Chapter 5, we have also found the important
relationships of the models that may help in developing a simple and good image
quality measurement model in the future.
Our works in developing watermarking and digital signature techniques for mul-
timedia authentication and copyright protection have demonstrated that, although
there are still a lot of open issues, trustworthy multimedia data is a realistic achiev-
able goal.

221
References
[1] R. Ahlswede, \Arbitrarily Varying Channels with States Sequence Known to
the Sender," IEEE Trans. on Information Theory, Vol. 32, No. 5, pp. 621-629,
September 1986.
[2] A. J. Ahumada Jr. and H. A. Peterson, \Luminance-Model-Based DCT Quan-
tization for Color Image Compression," SPIE Human, Vision, Visual Process-
ing, and Digital Display III, 1992.
[3] S. Alliney, \Digital Analysis of Rotated Images," IEEE Trans. on Pattern
Analysis and Machine Intelligence, Vol. 15, pp. 499-504, 1993.
[4] J. Altmann and H. J. P. Reitbock, \A Fast Correlation Method for Scale- and
Translation-Invariant Pattern Recognition," IEEE Trans. on Pattern Analysis
and Machine Intlligence, Vol. 6, No. 1, pp. 46-57, 1984.
[5] J. Altmann, \On the Digital Implementation of the Rotation-Invariant
Fourier-Mellin Transform," Journal of Information Processing and Cybernet-
ics, pp. 13-36, 1987.
[6] M. Barni, F. Bartolini, A. De Rosa, and A. Piva, \Capacity of the Watermark-
Channel: How Many Bits Can Be Hidden Within a Digital Image?," SPIE
Conf. on Security and Watermarking of Multimedia Contents, Vol. 3657, pp.
437-448, San Jose, January 1999.

222
[7] P. Barten, \The SQRI Method: a New Method for the Evaluation of Visible
Resolution on a Display," Proceedings of the Society for Information Display,
Vol. 28/3, pp. 253-262, 1987.
[8] P. Barten, \Subjective Image Quality of High-De�nition Televesion Pictures,"
Proceedings of the Society for Information Display, Vol. 31/3, pp. 239-243,
1990.
[9] P. Bas, J.-M. Chassery and F. Davoine, \A Geometrical and Frequential Wa-
termarking Scheme using Similarities," SPIE Conf. on Security and Water-
marking of Multimedia Contents, Vol. 3657, pp. 264-272, San Jose, January
1999.
[10] D. Bearman, and J. Trant, \Authenticity of Digital Resources: Towards a
Statement of Requirements in the Research Process," D-Lib Magazine, June
1998.
[11] S. Bhattacharjee and M. Kutter, \Compression Tolerant Image Authentica-
tion," IEEE International Conf. on Image Processing, Chicago, October 1998.
[12] R. N. Bracewell, \The Fourier Transform and Its Applications",McGraw-Hill,
1986.
[13] G. W. Braudaway, K. A. Magerlein and F. Mintzer, \Protecting Publicly-
Available Images with a Visible Image Watermark," IBM T.J. Watson Re-
search Center Research Report, RC 20336, January 1996.
[14] P. J. Brightwell, S. J. Dancer and M. J Knee, \Flexible Switching and Editing
of MPEG-2 Video Bitsreams," International Broadcasting Convention, Ams-
terdam, Netherlands, pp. 547-552, September 1997.

223
[15] F. W. Campbell and J. J. Kulikowski, \Orientational Selectivity of the Human
Visual System," J. Physiol. (London), No. 187, pp. 437-445, 1966.
[16] D. Casasent and D. Psaltis, \Position, Rotation, and Scale Invariant Optical
Correlation," Applied Optics, Vol. 15, No. 7, pp. 1795-1799, 1976.
[17] D. Casasent and D. Psaltis, \New Optical Transforms for Pattern Recogni-
tion," Proc. of the IEEE, Vol. 65, No. 1, pp.77-84, 1977.
[18] C.-H. Chou and Y.-C. Li, \A Perceptually Tuned Subband Image Coder Based
on the Measure of Just-Noticeable-Distortion Pro�le," IEEE Trans. on Cir-
cuits and Systems on Video Technology, VOl. 5, No. 6, pp. 467-476, December
1995.
[19] J. Chou, S. S. Pradhan and K. Ramchandran, \On the Duality between
Data Hiding and Distributed Source Coding," Proceedings of the 33rd An-
nuanl Asilomar Conf. on Signals, Systems, and Computers, Paci�c Grove,
CA, November 1999.
[20] M. H. M. Costa, \Writing on Dirty Paper," IEEE Trans. on Information
Theory, Vol. IT-29, No. 3, pp. 439-441, May 1983.
[21] Corel Stock Photo Library 3, Corel Corportation, Ontario, Canada.
[22] T. M. Cover and J. A. Thomas, \Elements of Information Theory," John Wiley
& Sones, Inc., 1991.
[23] I. J. Cox, J. Kilian, T. Leighton and T. Shamoon, \Secure Spread Spectrum
Watermarking for Multimedia,"NEC Research Institute Technical Report, 95-
10, 1995.

224
[24] I. J. Cox, J. Kilian, T. Leighton and T. Shamoon, \Secure Spread Spectrum
Watermarking for Images, Audio and Video," IEEE Trans. on Image Process-
ing, Vol. 6, No. 12, pp. 1673-1687, December 1997.
[25] I. J. Cox and M. L. Miller, \A Review of Watermarking and the Importance
of Perceptual Modeling,"Proceedings of SPIE, Human Vision & Electronic
Imaging II, Vol. 3016, pp. 92-99, 1997.
[26] I. J. Cox, M. L. Miller and A. McKellips, \Watermarking as Communications
with Side Information," Proceedings of the IEEE, Vol. 87, No. 7, pp. 1127-
1141, 1999.
[27] S. Craver, N. Memon, B. L. Yeo and M. Yeung, \Can Invisible Watermarks
Resolve Rightful Ownerships?," IBM T.J. Watson Research Center Research
Report, RC 20509, July 1996.
[28] I. Csiszar and P. Narayan, \Capacity and Decoding Rules for Classes of Arbi-
trarily Varying Channels," IEEE Trans. on Information Theory, Vol. 35, No.
4, pp. 752-769, July 1989.
[29] I. Csiszar and P. Narayan, \Capacity of the Gaussian Arbitrarily Varying
Channel," IEEE Trans. on Information Theory, Vol. 37, No. 1, pp. 18-26,
January 1991.
[30] G. Csurka, F. Deguillaume, J. J. K. O'Ruanaidh and T. Pun, \A Bayesian Ap-
proach to A�ne Transformation Resistant Image and Video Watermarking,"
Proc. of the 3rd Int. Information Hiding Workshop, pp. 315-330, 1999.
[31] S. Daly, \The Visible Di�erences Predictor: An Algorithm for the Assessment
of Image Fidelity," Digital Images and Human Vision, A. B. Watson, ed., pp.
179-206, MIT Press, 1993.

225
[32] E. De Castro and C. Morandi, \Registration of Translated and Rotated Im-
ages using Finite Fourier Transforms," IEEE Trans. on Pattern Analysis and
Machine Intelligence, Vol. 9, pp. 700-703, 1987.
[33] G. Depovere, T. Kalker and J.-P. Linnartz, \Improved Watermark Detection
using Filtering before Correlation," IEEE Intl. Conf. on Image Processing,
Vol. 1, pp. 430-434, Chicago, October 1998.
[34] R. L. De Valois, E. W. Yund and N. Hepler, \The Orientation and Direction
Selectivity of Cells in Macaque Visual Cortex," Vision Research, Vol. 22, pp.
531-544, 1982.
[35] W. Di�e and M. E. Hellman, \New Directions in Cryptography," IEEE Trans.
on Information Theory, Vo. IT-22, No. 6, pp.644-654, November 1976.
[36] W. Di�e and M. E. Hellman, \New Directions in Cryptography," IEEE Trans.
on Information Theory, Vol. 22, No. 6, pp.644-654, Nov 1976.
[37] W. Ding and B. Liu, \Rate Control of MPEG Video Coding and Recording
by Rate-Quantization Modeling," IEEE Trans. on Circuits and Systems for
Video Technology, Vol. 6, No. 1, pp. 12-19, Feb 1996.
[38] A. Eleftheriadis and D. Anastassiou, \Constrained and General Dynamic Rate
Shaping of Compressed Digital Video," Proceedings of the 2nd IEEE Interna-
tional Conference on Image Processing (ICIP 95), Arlington, VA, USA, Oct
1995.
[39] O. D. Faugeras, \Digital Color Image Processing within the Framework of a
Human Visual Model," IEEE Trans. on Acoustics, Speech, and Signal Pro-
cessing, Vol. 27, pp. 380-393, 1979.

226
[40] X. Feng, J. Newell and R. Triplett, \Noise Measurement Technique for Docu-
ment Scanners," SPIE vol. 2654 Solid State Sensor Arrays and CCD Cameras,
Jan. 1996.
[41] M. Ferraro and R. M. Caelli, \Lie Transform Groups, Integral Transforms,
and Invariant Pattern Recognition," Spatial Vision, Vol. 8, No. 1, pp. 33-44,
1994.
[42] J. Fridrich, \Image Watermarking for Tamper Detection," IEEE International
Conf. on Image Processing, Chicago, October 1998.
[43] J. Fridrich, \Methods for Detecting Changes in Digital Images," IEEE Work-
shop on Intelligent Signal Processing and Communication Systems, Mel-
bourne, Australia, November 1998.
[44] J. Fridrich and M. Goljan, \Comparing Robustness of Watermarking Tech-
niques," Proc. of SPIE Security and Watermarking of Multimedia Contents,
Vol. 3657, pp. 214-225, San Jose, CA, January 1999.
[45] G. L. Friedman, \The Trustworthy Digital Camera: Restoring Credibility
to the Photographic image," IEEE Trans. on Consumer Electronics, Vol.39,
No.4, pp.905-910, November 1993.
[46] R. Gennaro and P. Rohatgi, \How to Sign Digital Streams," Proceeding of
CRYPTO 97, Santa Barbara, CA, USA, August 1997.
[47] C. F. Hall and E. L. Hall, \A Nonlinear Model for the Spatial Characteristics
of the Human Visual System," IEEE Trans. on Systems, Man. and Cyber.
Vol. 7, pp. 161-170, 1977.
[48] B. G. Haskell, A. Puri and A. N. Netravali, \Digital Video: An Introduction
to MPEG-2," Chapman & Hall, 1997.
227
[49] M. K. Hu, \Visual Pattern Recognition by Moment Invariants," IEEE Trans.
on Information Theory, Vol. IT-8, pp. 179-187, 1962.
[50] D. H. Hubel and T. N. Wiesel, \Receptive Fields of Single Neurons in the
Cat's Striate Cortex," J. Physiol. (London), No. 148, pp. 574-591, 1959.
[51] D. H. Hubel and T. N. Wiesel, \Receptive Fields, Binocular Interaction and
Functional Architecture in the Cat's Visual Cortex," J. Physiol. (London),
No. 160, pp. 106-154, 1962.
[52] IETF Networking Group, \Internet X.509 Public Key Infrastructure Certi�-
cate Management Protocols," Internet Engineering Task Force (IETF), RFC
2510, http://www.ietf.org /html.charters/pkix-charter.html, March 1999.
[53] Independent JPEG Group's free JPEG software. http://www.ijg.org.
[54] International Business Machines, \Public Key Infrastructure: The PKIX Ref-
erence Implementation Project," IBM
SecureWay White Paper, http://www.ibm.com/security/html/wp-pkix.pdf ,
August 1998.
[55] S. Jacobs and A. Eleftheriadis, \Streaming Video Using Dynamic Rate Shap-
ing and TCP Flow Control," Visual Communication and Image Representa-
tion Journal, Jan 1998.
[56] A. Jaimes and S.-F. Chang, \A Conceptual Framework for Indexing Visual
Information at Multiple Levels," SPIE Internet Imageing 2000, San Jose, CA,
January 2000.
[57] A. K. Jain, \Fundamentals of Digital Image Processing," Prentice-Hall Inc.,
pp. 80-99, 1989.

228
[58] N. S. Jayant and P. Noll, \Digital Coding of Waveforms," Prentice-Hall, 1984.
[59] N. F. Johnson and Z. Duric and S. Jajodia, \Recovery of Watermarks from
Distorted Images," Proc. of the 3rd Int. Information Hiding Workshop, pp.
361-375, 1999.
[60] http://www.faqs.org/faqs/jpeg-faq
[61] JPEG, \JPEG 2000 Part I Final Committee Draft Version 1.0," ISO/IEC
JTC1/SC 29 WH1, April 2000.
[62] T. Kalker, G. Deprovere, J. Haitsma and M. J. Maes, \Video Watermark-
ing System for Broadcast Monitoring," Proceedings of the ICIP, pp.103-112,
October 1999.
[63] A. Karasaridis and E. Simoncelli, \A Filter Design Technique for Steerable
Pyramid Image Transforms," IEEE International Conf. on ASSP, Atlanta,
GA, May 1996.
[64] C. Kaufman, R. Perlman and M. Speciner, \Network Security: Private Com-
munication in a Public World," Prentice-Hall Inc., pp.129-162, 1995.
[65] J. Korner and A. Orlitsky, \Zero-Error Information Theory," IEEE Trans. on
Information Theory, Vol. 44, No. 6, October 1998.
[66] D. Kundur and D. Hatzinakos, \Digital Watermarking for Telltale Tamper-
Proo�ng and Authentication," Proceedings of the IEEE { Special Issue on
Identi�cation and Protection of Multimedia Information, Vol. 87, No. 7, pp.
1167-1180, July 1999.
[67] D. Kundur, \Water-Filling for Watermarking?," IEEE Intl. Conf. on Multi-
media & Expo, New York, June 2000.

229
[68] M. Kutter, \Watermarking Resistance to Translation, Rotation, and Scaling,"
SPIE Conf. on Multimedia Systems and Applications, Vol. 3528, pp. 423-31,
1998.
[69] G. E. Legge and J. M. Foley, \Contrast Maskin in Human Vision," Journal of
the Optical Society of America, Vol. 70, No. 12, pp. 1458-1471, 1980.
[70] B. Li, G. W. Meyer and R. V. Klassen, \A Comparison of Two Image Quality
Models," SPIE Conf. on Human Vision and Electronic Imaging III, Vol. 3299,
San Jose, January 1998.
[71] C.-Y. Lin and S.-F. Chang, \An Image Authenticator Surviving DCT-based
Variable Quantization Table Compressions," CU/CTR Technical Report 490-
98-24, November 1997.
[72] C.-Y. Lin and S.-F. Chang, \A Robust Image Authentication Method Distin-
guishing JPEG Compression from Malicious Manipulation," CU/CTR Tech-
nical Report 486-97-19, Dec 1997; also appear on IEEE Trans. on Circuit and
System for Video Technology, 2001.
[73] C.-Y. Lin and S.-F. Chang, \A Robust Image Authentication Method Surviv-
ing JPEG Lossy Compression," SPIE Storage and Retrieval of Image/Video
Databases, San Jose, January 1998.
[74] C.-Y. Lin and S.-F. Chang, \A Watermark-Based Robust Image Authentica-
tion Method Using Wavelets," ADVENT Project Report, Columbia Univer-
sity, April 1998.
[75] C.-Y. Lin and S.-F. Chang, \Generating Robust Digital Signature for Im-
age/Video Authentication,"Multimedia and Security Workshop at ACM Mul-
timedia 98, Bristol, UK, Sep 1998.

230
[76] C.-Y. Lin and S.-F. Chang, \Issues and Solutions for Authenticating MPEG
Video," SPIE Conf. on Security and Watermarking of Multimedia Contents,
Vol. 3657, pp. 54-65, San Jose, January 1999.
[77] C.-Y. Lin and S.-F. Chang, \Issues and Solutions for Authenticating MPEG
Video," Proc. of SPIE Security and Watermarking of Multimedia Contents,
Vol. 3657, San Jose, CA, January 1999.
[78] C.-Y. Lin and S.-F. Chang, \Issues and Solutions for Video Content Authen-
tication," CU/ADVENT Technical Report, Jan 1999.
[79] C.-Y. Lin, \Bibliography of Multimedia Authentication Research Papers,"
web page at http : ==www:ctr:columbia:edu= cylin=auth=bibauth:html.
[80] C.-Y. Lin, \Public Watermarking Surviving General Scaling and Cropping:
An Application for Print-and-Scan Process," Multimedia and Security Work-
shop at ACM Multimedia 99, Orlando, FL, October 1999.
[81] C.-Y. Lin and S.-F. Chang, \Distortion Modeling and Invariant Extraction
for Digital Image Print-and-Scan Process," Intl. Symp. on Multimedia Infor-
mation Processing, Taipei, December 1999.
[82] C.-Y. Lin, M. Wu, M. L. Miller, I. J. Cox, J. Bloom and Y. M. Lui, \Geomet-
ric Distortion Resilient Public Watermarking for Images," SPIE Security and
Watermarking of Multimedia Content II, San Jose, pp. 90-98, January 2000.
[83] C.-Y. Lin, M. Wu, Y. M. Lui, J. Bloom, M. L. Miller and I. J. Cox, \Rota-
tion, Scale, and Translation Resilient Public Watermarking for Images," IEEE
Trans. on Image Processing, 2001.
231
[84] C.-Y. Lin and S.-F. Chang, \Semi-Fragile Watermarking for Authenticating
JPEG Visual Content," SPIE Security and Watermarking of Multimedia Con-
tent II, San Jose, pp. 140-151, January 2000.
[85] C.-Y. Lin and S.-F. Chang, \Zero-Error Data Hiding Capacity of Ditial Im-
ages," IEEE Intl. Conf. on Information Technology: Coding and Computing,
Las Vegas, April 2001.
[86] F. Lin and R. D. Brandt, \Towards Absolute Invariants of Images under Trans-
lation, Rotation, and Dilation," Pattern Recognition Letters, Vol. 14, No. 5,
pp. 369-379, 1993.
[87] L. Lovasz, \On the Shannon Capacity of a Graph," IEEE Trans. on Informa-
tion Theory, Vol. IT-25, No. 1, pp. 1-7, January 1979.
[88] J. Lubin, \The Use of Psychophysical Data and Models in the Analysis of Dis-
play System Performance," Digital Images and Human Vision, A. B. Watson,
ed., pp. 163-178, MIT Press, 1993.
[89] B. M. Macq and J. J. Quisquater, \Cryptology for Digital TV Broadcasting,"
Proceedings of the IEEE, vol. 83, No. 6, pp. 944-957, June 1995.
[90] M. J. Maes and C. W. van Overveld, \Digital Watermarking by Geometric
Warping," IEEE Intl. Conf. on Image Processing, Vol. 2, pp. 424-426, 1998.
[91] K. Matsui and K. Tanaka, \Video-Steganography: How to Secretly Embed a
Signature in a Picture," IMA Intellectual Property Project Proceedings, Vol.
1, pp. 187-206, 1994.
[92] M. McGuire, \An Image Registration Technique for Recovering Rotation,
Scale and Translation Parameters," Technical Report 98-018, NEC Research
Institute, 1998.
232
[93] N. D. Memon and P. W. Wong, \Protecting Digital Media Content," Com-
munications of the ACM, Vol. 41, No. 7, July 1998.
[94] N. D. Memon and P. Wong, \Secret and Public Key Authentication Water-
marking Schemes that Resist Vector Quantization Attack," SPIE Intl. Conf.
on Security and Watermarking of Multimedia Contents II, Vol. 3971, San Jose,
CA, January 2000.
[95] N. D. Memon and J. Fridrich, \Further Attacks on the Yeung-Mintzer Fragile
Watermark," SPIE Intl. Conf. on Security and Watermarking of Multimedia
Contents II, Vol. 3971, San Jose, CA, January 2000.
[96] J. Meng and S.-F. Chang, \CVEPS { A Compressed Video Editing and Pars-
ing System," Proceedings of ACM Multimedia 96, Boston, MA, USA, Nov
1996.
[97] M. L. Miller and J. A. Bloom, \Computing the Probablity of False Watermark
Detection," Proceedings of the Third Intl. Workshop on Information Hiding,
1999.
[98] M. L. Miller, I. J. Cox and J. A. Bloom, \Informed Embedding Exploiting
Image and Detector Information during Watermark Insertion," IEEE Intl.
Conf. on Image Processing, Vol. 3, pp.1-4, September 2000.
[99] J. Nachmias and R. V. Sansbury, \Grating Contrast: Discrimination May Be
Better than Detection," Vision Research, Vol. 14, pp. 1039-1042, 1974.
[100] J. J. K. O'Ruanaidh and T. Pun,\Rotation, Scale and Translation Invariant
Spread Spectrum Digital Image Watermarking," Signal Processing, Vol. 66,
No. 3, pp. 303-317, 1998.
233
[101] The Oxford English Dictionary, 2nd Ed., Oxford Univ., pp. 795-796, 1989.
[102] E. Peli, \Contrast in Comples Images," Journal of Optical Society of America,
A/Vol. 7, No. 10, pp. 2032-2040, October 1990.
[103] S. Pereira and T. Pun, \Fast Robust Template Matching for A�ne Resistant
Image Watermarks," Proc. of the 3rd Int. Information Hiding Workshop, pp.
207-218, 1999.
[104] H. A. Peterson, A. J. Ahumada, and A. B. Watson, \An Improved Detection
Model for DCT Coe�cient Quantization," Proceedings of SPIE, Vol. 1913, pp.
191-201, 1993.
[105] F.A.P. Petitcolas and R.J. Anderson and M.G. Kuhn, \Attacks on Copyright
Marking Systems," Workshop on Information Hiding, Portland, OR, 15-17
April 1998.
[106] G. C. Phillips and H. R. Wilson, \Orientation Bandwidths of Spatial Mecha-
nisms Measured by Masking," Journal of Optical Society of America, A/Vol.
1, No. 2, February 1984.
[107] C. I. Podilchuk and W. Zeng, \Image-Adaptive Watermarking using Visual
Models," IEEE Trans. on Selected Areas of Communications, Vol. 16, No. 4,
pp. 525-539, 1998.
[108] M. P. Queluz, \Content-based Integrity Protection of Digital Images," SPIE
Conf. on Security and Watermarking of Multimedia Contents, Vol. 3657, pp.
85-93, San Jose, January 1999.
[109] M. Ramkumar and A. N. Akansu, \A Capacity Estimate for Data Hiding in
Internet Multimedia," Symposium on Content Security and Data Hiding in
Digital Media, NJIT, Jersey City, May 1999.

234
[110] P. M. Rongen and M. J. Maes and C. W. van Overveld, \Digital Image Wa-
termarking by Salient Point Modi�cation Practical Results," SPIE Conf. on
Security and Watermarking of Multimedia Contents, Vol. 3657, pp. 273-282,
San Jose, January 1999.
[111] L. L. Scharf, \Statistical Signal Processing { Detection, Estimation, and Time
Series Analysis," Addison Wesley Inc., pp. 103-178, 1991.
[112] M. Schneider and S.-F. Chang, \A Robust Content Based Digital Signature
for Image Authentication," IEEE International Conf. on Image Processing,
Laussane, Switzerland, October 1996.
[113] B. Schneier, \Applied Cryptography,"John Willey & Sons. Inc., pp.461-502,
1996.
[114] S. D. Servetto, C. I. Podilchuk and K. Ramchandran, \Capacity Issues in Dig-
ital Image Watermarking," IEEE Intl. Conf. on Image Processing, Chicago,
October 1998.
[115] M. I. Sezan, K. L. Yip, and S. Daly, \Uniform Perceptual Quantization: Ap-
plications to Digital Radiography," IEEE Trans. on System, Man, and Cyber-
netics, Vol. 17, No. 4, pp. 622-634, 1987.
[116] C. E. Shannon, \A Mathematical Theory of Communication," Bell System
Technical Journal, Vol. 27, pp. 373-423, 623-656, 1948.
[117] C. E. Shannon, \The Zero-Error Capacity of a Noisy Channel," IRE Trans.
on Information Theory, IT-2: 8-19, 1956.
[118] C. E. Shannon, \Channels with Side Information at the Transmitter," IBM
Journal of Research and Development, pp. 289-293, 1958.

235
[119] G. Sharma and H. Trussell, \Digital Color Imaging," IEEE Trans. on Image
Processing, Vol. 6, No.7, July 1997.
[120] Y. Sheng and H. H. Arsenault, \Experiments on Pattern Recognition using
Invariant Fourier-Mellin Descriptors," J. Opt. Soc. Am. A, pp. 771-776, 1986.
[121] S. D. Silvey, \Statistical Inference," Chapman & Hall Inc., pp. 94-107, 1975.
[122] T. G. Stockham, Jr., \Image Processing in the Context of a Visual Model,"
Proceedings of the IEEE, Vol. 60, No. 7, July 1972.
[123] H. S. Stone and B. Tao and M. McGuire, \Analysis of Image Registration
Noise Due to Rotationally Dependent Aliasing," Technical Report 99-057R,
NEC Research Institute, 1999.
[124] Q. Sun, D. Zhong, S.-F. Chang and A. Narasimhalu, \VQ-based Digital Sig-
nature Scheme for Multimedia Content," SPIE Intl. Conf. on Security and
Watermarking of Multimedia Contents II, Vol. 3971, San Jose, CA, January
2000.
[125] P. N. Tudor and O. H. Werner, \Real-Time Transcoding of MPEG-2 Video
Bit Streams," International Broadcasting Convention (IBC 97), Amsterdam,
Netherlands, pp. 286-301, Sep 1997.
[126] Unzign, \http://altern.org/watermark."
[127] R. G. van Schyndel, A. Z. Trikel, and C. F. Osborne, \A Digital Watermark,"
IEEE International Conf. on Image Processing, Austin, Texas, Nov 1994.
[128] E. Viscito and C. Gonzales, \A Video Compression Algorithm with Adaptive
Bit Allocation and Quantization," SPIE Visual Communication and Image
Processing 91, Vol. 1605, 1991.

236
[129] G. K. Wallace, \The JPEG Still Picture Compression Standard," Communi-
cations of the ACM, Vol.34(4). pp. 30-44, April 1991.
[130] S. Walton, \Image Authentication for a Slippery New Age," Dr. Dobb's Jour-
nal, pp. 18-26, April 1995.
[131] A. B. Watson, \Estimation of Local Spatial Scale," Journal of the Optical
Society of America, A 4, pp. 1579-1582, 1987.
[132] A. B. Watson, \The Cortex Transform: Rapid Computation of Simulated
Neural Images," Computer Vision, Graphics, and Image Processing, Vol. 39,
pp. 311-327, 1987.
[133] A. B. Watson, \DCT Quantization Matrices Visually Optimized for Individual
Images," Proceeding of SPIE, Vol. 1913, pp. 202-216, 1993.
[134] A. B. Watson, \Perceptual optimization of DCT Color Quantization Matri-
ces," IEEE International Conf. on Image Processing, Austix, TX, November
1994.
[135] A. B. Watson, G. Y. Yang, J. A. Solomon, and J. Villasenor, \Visibility of
Wavelet Quantization Noise," IEEE Trans. on Image Processing, Vol. 6, No.
8, August 1997.
[136] The Webster's New 20th Century Dictionary.
[137] H. Wechsler and G. L. Zimmerman, \2-D Invariant Object Recognition Us-
ing Distributed Associative Memory," IEEE Trans. on Pattern Analysis and
Machine Intelligence, Vol. 10, No. 6, pp. 811-821, 1988.
[138] O. H. Werner, \Generic Quantiser for Transcoding of Hybrid Video," Proceed-
ings of the 1997 Picture Coding Symposium, Berlin, Germany, Sep 1997.
237
[139] P. Wohlmacher, \Requirements and Mechanisms of IT-Security Including As-
pects of Multimedia Security," Multimedia and Security Workshop at ACM
Multimedia 98, Bristol, UK, Sep 1998.
[140] R. B. Wolfgang and E. J. Delp, \A Watermark for Digital Images", IEEE
International Conf. on Image Processing, Laussane, Switzerland, Oct 1996.
[141] R. B. Wolfgang, C. I. Podilchuk and E. J. Delp, \Perceptual Watermarks
for Digital Images and Video," Proceedings of the IEEE, Vol. 87, No. 7, pp.
1108-1126, 1999.
[142] H. Wong, W. Kang, F. Giordano and Y. Yao, \Performance Evaluation of
A High-Quality TDI-CCD Color Scanner," SPIE vol. 1656 High-Resolution
Sensors and Hybrid Systems, Feb 1992.
[143] M. Wu and B. Liu, \Watermarking for Image Authentication," IEEE Proc. of
ICIP, Chicago, Oct 1998.
[144] L. Xie, K. Maeno, Q. Sun, C.-Y. Lin and S.-F. Chang, \Benchmark-
ing for SARI Image Authentication System," http://www.ctr.columbia.edu/
sari/benchsari, Oct. 2000.
[145] M. Yeung and F. Mintzer, \An Invisible Watermarking Technique for Image
Veri�cation," IEEE International Conf. on Image Processing, Santa Barbara,
October 1997.
[146] R. W. Young, \The Renewal of Rod and Cone Outer Segments in the Rhesus
Monkey," Journal of Cell Biology, Vol. 49, pp. 303-318, 1971.
[147] H. Yu, \Content-Based Graph Authentication," Multimedia and Security
Workshop at ACM Multimedia 99, Orlando, FL, USA, October 1999.
238
[148] J. Zhao and E. Koch, \Embedding Robust Label into Images for Copy-
right Protection," Proc. of the International Congress on Intellectual Property
Rights for Specialized Information, Knowledge and New Technologies, Vienna,
Austria, August 1995.
[149] B. Zhu, M. D. Swanson, and A. H. Tew�k, \Transparent Robust Authen-
tication and Distortion Measurement Technique for Images," The 7th IEEE
Digital Signal Processing Workshop, pp. 45-48, Sep 1996.


![Cvow~ C@yrigh$ Reservednaca.central.cranfield.ac.uk/reports/arc/rm/2683.pdfThe Application of AerofoH the Exact Design By M. ]3. GLAUERT, M.A., of the Aerodynamics Division, N.P.L.](https://static.fdocuments.us/doc/165x107/5fd8b92d3255050d3e3ddc22/cvow-cyrigh-the-application-of-aerofoh-the-exact-design-by-m-3-glauert-ma.jpg)


