
All PPS Meeting Performance Measurement Updates Division ......Dec 09, 2016 · Measurement Years...
47
December 9, 2016 All PPS Meeting Performance Measurement Updates Greg Allen, Director Division of Program Development and Management
Transcript of All PPS Meeting Performance Measurement Updates Division ......Dec 09, 2016 · Measurement Years...

December 9, 2016
All PPS MeetingPerformance Measurement Updates
Greg Allen, Director Division of Program Development and Management

2
• DSRIP Performance Dashboards Payment Tile – Greg Allen• Performance Measurement MY1, MY2 interim results – Greg Allen• Changes to DSRIP measures in MY2 – Melissa Lurie, Office of Quality & Patient Safety• Financial implications of measure changes – Greg Allen• Network Provider HUBs – Greg Allen• Medicaid data file releases – Greg Allen• Reference Slides
Draft Agenda
December 2016

• Webinar held on November 17, 2016. Slide deck and recording can be found on the DSRIP Digital Library.
• Allows users to view and drill to specifics on:o Payments earned, lost, and still
available for past and future payment periods.
o How payments are allocated across DSRIP projects, measures, and requirements.
o How the PPS has historically performed on “at-risk” measures or requirements
3December 2016
DSRIP Performance Dashboard Payment Tile

4December 2016
Performance Measurement Recap MY1, MY2 interim results

5December 2016
Mar
Apr
May
Jun
Jul
Aug
Sep
Oct
Nov
Dec
Jan
Feb
Mar
Apr
May
Jun
Jul
Aug
Sep
Oct
Nov
Dec
Jan
Feb
Mar
Apr
May
Jun
Jul
Aug
Sep
Oct
Nov
Dec
Jan
Feb
Mar
Apr
May
Jun
Jul
Aug
Sep
Oct
Nov
Dec
Jan
Feb
Mar
Apr
May
Jun
Jul
Aug
Sep
Oct
Nov
Dec
Jan
Feb
Mar
Apr
May
Jun
Jul
Aug
Sep
Oct
Nov
Dec
Jan
Feb
Mar
Apr
May
Jun
Jul
Aug
1-1 1-2 1-3
2-1 2-2
3-1 3-2
4-1 4-2
5-1 5-2
Dem
onst
ratio
n Y
ears
(DY
)
DY 0
Pay
men
t(D
Y-P
aym
ent
Num
ber)
2017
Mea
sure
men
t Y
ears
(MY
)(D
omai
ns 2
- 4)
2014
DY 5
2015 2016
MY 5
MY 1MY 2
MY 3MY 4
2020
DY 1DY 2
DY 3DY 4
2018 2019
DSRIP is currently in Demonstration Year 2 (DY2) and Measurement Year 3 (MY3).• Performance is measured during the MY and affects future Pay for Performance (P4P) payments in
subsequent Demonstration Years (DY).
Source: Achievement Value Guide for PPSs: https://www.health.ny.gov/health_care/medicaid/redesign/dsrip/webinars_presentations.htm
December 2016

6December 2016
38% of available P4P dollars are tied to performance in MY3.
• Performance results from MY3 affect $729M in net project valuation**.o MY3 P4P payments are split
between payments in DY3 (payment 2 - $392M) and DY4 (payment 1 - $337M).
• All unearned dollars tied to MY3 performance results will roll in to the High Performance Fund (HPF) in MY4.o Unearned dollars will be
available to all PPSs who meet HP targets.
$842M $857M $991M
$548M
$167M
$40M
$460M
$737M
$675M
$-
$400M
$800M
$1,200M
$1,600M
DY1 DY2 DY3 DY4 DY5
Non-P4P payments
P4P payments
DSRIP Net Project Valuation by DY*
MY3 Performance (Affects the June 2018 and January 2019 payments).
*Source: Achievement Value Guide for PPSs: https://www.health.ny.gov/health_care/medicaid/redesign/dsrip/webinars_presentations.htm** These number reflect the movement of PQI/PQI P4P dollars to P4R in MY2 and MY3.

7December 2016
MY1 Official Results

8December 2016
• MY1 targets are established by:o Regular Performance: using 10% improvement over baseline towards the statewide goal.o High Performance (HP): using 20% improvement over baseline or met/exceeded the statewide goal.
MY1 concluded in June 2015 and performance results showed the need for improvement.
• No P4P funds were tied to measures in MY1. MY1 performance sets the MY2 targets.
• Potential penalties related to performance of statewide milestones would reduce the overall funding beginning in DY3.
Measure type Total performancemeasures*
Total targets achieved Total measures improved but not achieved
Regular Performance 705 192 (27%) 151 (21%)
High Performance 225 40 (18%) 97 (43%)
*Includes all measures that will be P4P at any point throughout DSRIP. Data source: DSRIP Performance Dashboards

9December 2016
MY1 -Two PPSs achieved greater than 50% of their performance measure targets
% of performance measure targets met* # of PPSsGreater than 50% 241% - 50% 231% - 40% 321% - 30% 1020% or less 8
• The majority of PPSs (18/25) achieved 30% or less of their performance measure targets in MY1.• MY1 performance results are not an indicator of future performance, as Performing Provider
Systems (PPSs) were in the network formation stage during this measurement period.
MY1 results are helpful to understand how PPSs are trending from the baseline, but they are not necessarily indicative of future performance.* Measures include only the Domain 2 & 3 performance measures where all 25 PPSs had comparable data. Data Source: Medicaid Analytics Performance Portal (MAPP) – official MY0 and MY1 Attribution for Performance results.
Top range Bottom range

10December 2016
MY1 Key findings – MY1 High Performance measure results.
Measure Name # PPSs that met HP Target
% PPSs that met HP Target
Turns P4P in:*
Antidepressant Medication Management - Effective Continuation Phase Treatment 11 / 25 44% DY2Antidepressant Medication Management - Effective Acute Phase Treatment 10 / 25 40% DY2Cardiovascular Monitoring for People with Cardiovascular Disease and Schizophrenia^ 8 / 25 32% DY2Diabetes Monitoring for People with Diabetes and Schizophrenia^ 3 / 25 12% DY2Follow-up After Hospitalization for Mental Illness - within 7 days 3 / 25 12% DY2Potentially Preventable Readmissions 2 / 25 8% DY3Follow-up After Hospitalization for Mental Illness - within 30 days 1 / 25 4% DY2Potentially Preventable Emergency Department Visits (for persons with BH diagnosis) 1 / 25 4% DY2Potentially Preventable Emergency Room Visits 1 / 25 4% DY3Antipsychotic Use in Persons with Dementia 0 / 1 0% DY2
• The majority of PPSs did not meet their High Performance Annual Improvement Targets in MY1. • The measures where the most PPSs met their MY1 High Performance targets were:
o Antidepressant Medication Management - Effective Continuation Phase Treatment,o Antidepressant Medication Management - Effective Acute Phase Treatment, ando Cardiovascular Monitoring for People with Cardiovascular Disease and Schizophrenia.
* DY = Demonstration Year^ The denominator for this measure is less than 30 for some Performing Provider System's, therefore the rates may not be stable due to small numbers. Sources: OQPS, P4P OQPS Mega chart_PPS and Measure Summaries v2.xlsm, accessed on 8/29/2016 and DOH website.
Top three measures Bottom three measures
11December 2016
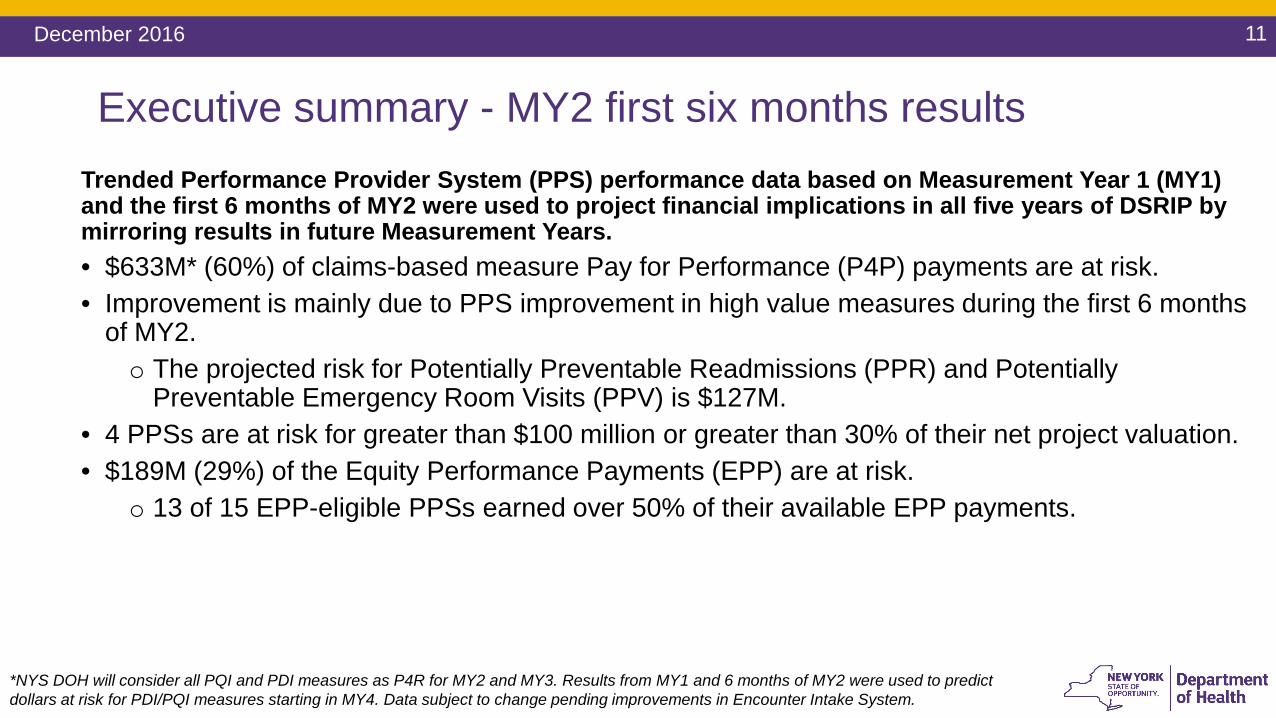
Trended Performance Provider System (PPS) performance data based on Measurement Year 1 (MY1) and the first 6 months of MY2 were used to project financial implications in all five years of DSRIP by mirroring results in future Measurement Years. • $633M* (60%) of claims-based measure Pay for Performance (P4P) payments are at risk.• Improvement is mainly due to PPS improvement in high value measures during the first 6 months
of MY2.o The projected risk for Potentially Preventable Readmissions (PPR) and Potentially
Preventable Emergency Room Visits (PPV) is $127M. • 4 PPSs are at risk for greater than $100 million or greater than 30% of their net project valuation.• $189M (29%) of the Equity Performance Payments (EPP) are at risk.
o 13 of 15 EPP-eligible PPSs earned over 50% of their available EPP payments.
*NYS DOH will consider all PQI and PDI measures as P4R for MY2 and MY3. Results from MY1 and 6 months of MY2 were used to predict dollars at risk for PDI/PQI measures starting in MY4. Data subject to change pending improvements in Encounter Intake System.
Executive summary - MY2 first six months results

12December 2016
• 37% of regular performance claims based P4P measures are on track for achievement in MY2.o 27% were achieved in MY1.
• 25% of high performance measures are on track for achievement in MY2.o 18% were achieved in MY1.
Measure type Total performancemeasures*
Total measures on track for achievement
Total measures improved but not on track
Regular Performance 705 263 (37%) 132 (19%)
High Performance 225 57 (25%) 98 (44%)
*Includes all measures that will be P4P at any point throughout DSRIP. Data source: DSRIP Performance Dashboards. This period included data that is subject to change pending improvements in the Encounter Intake System.
PPSs show improvement during the first 6 months of MY2 on claims based P4P measures.
13December 2016
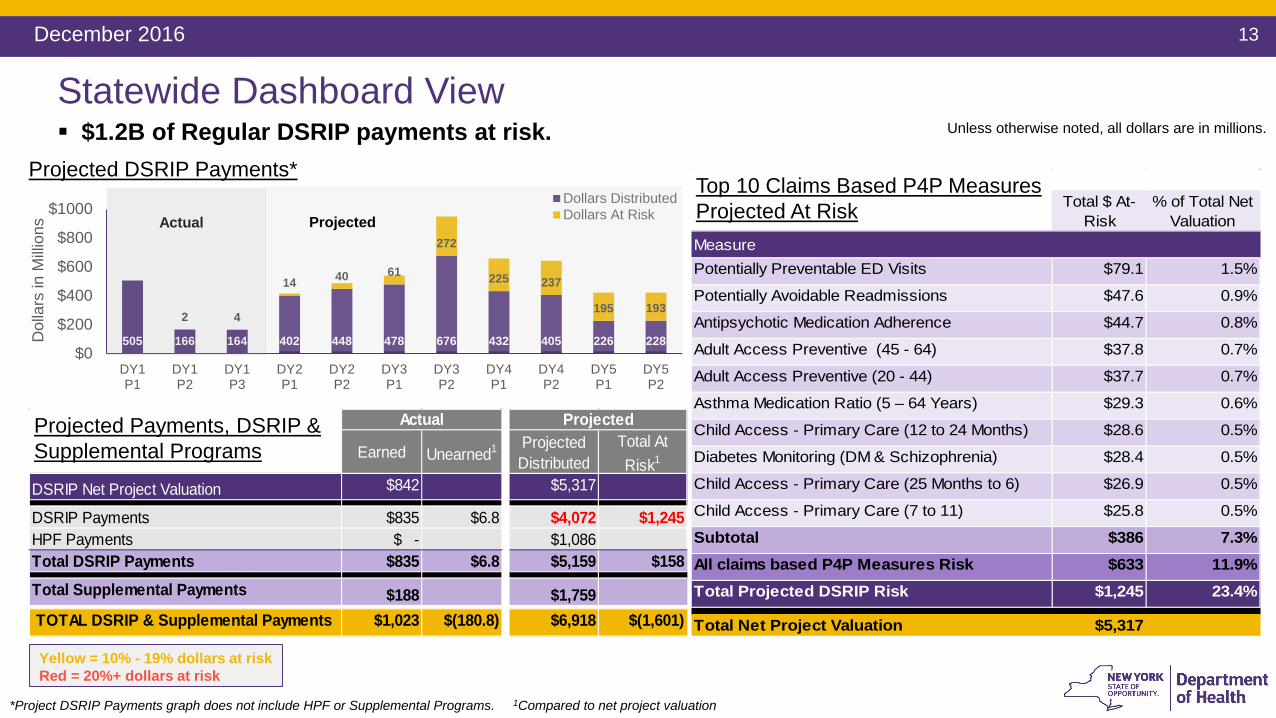
Statewide Dashboard View $1.2B of Regular DSRIP payments at risk.
Yellow = 10% - 19% dollars at riskRed = 20%+ dollars at risk
Total $ At-Risk
% of Total Net Valuation
MeasurePotentially Preventable ED Visits $79.1 1.5%
Potentially Avoidable Readmissions $47.6 0.9%
Antipsychotic Medication Adherence $44.7 0.8%
Adult Access Preventive (45 - 64) $37.8 0.7%
Adult Access Preventive (20 - 44) $37.7 0.7%
Asthma Medication Ratio (5 – 64 Years) $29.3 0.6%
Child Access - Primary Care (12 to 24 Months) $28.6 0.5%
Diabetes Monitoring (DM & Schizophrenia) $28.4 0.5%
Child Access - Primary Care (25 Months to 6) $26.9 0.5%
Child Access - Primary Care (7 to 11) $25.8 0.5%
Subtotal $386 7.3%All claims based P4P Measures Risk $633 11.9%Total Projected DSRIP Risk $1,245 23.4%
Total Net Project Valuation $5,317
Top 10 Claims Based P4P Measures Projected At Risk
Earned Unearned1 Projected Distributed
Total At Risk1
DSRIP Net Project Valuation $842 $5,317
DSRIP Payments $835 $6.8 $4,072 $1,245 HPF Payments $ - $1,086 Total DSRIP Payments $835 $6.8 $5,159 $158 Total Supplemental Payments $188 $1,759 TOTAL DSRIP & Supplemental Payments $1,023 $(180.8) $6,918 $(1,601)
Actual Projected
*Project DSRIP Payments graph does not include HPF or Supplemental Programs. 1Compared to net project valuation
Projected Payments, DSRIP & Supplemental Programs
Unless otherwise noted, all dollars are in millions.
505 166 164 402 448 478 676 432 405 226 228
2 4
14 40 61
272
225 237
195 193
$0
$200
$400
$600
$800
$1000
DY1P1
DY1P2
DY1P3
DY2P1
DY2P2
DY3P1
DY3P2
DY4P1
DY4P2
DY5P1
DY5P2
Dol
lars
in M
illion
s
Projected DSRIP Payments*Dollars DistributedDollars At RiskActual Projected

14December 2016
Most improving high value claims based P4P measures in the first six months of MY2.• 17 measures were identified with the highest P4P Net Project Valuation.
o At least two thirds of PPSs improved on 10 of the 21 high value claims based measures.Measure Applicable
PPSsPPSs
improvingPercent
improving↓ Total P4P $ available*
Potentially Preventable ED Visits (BH) 25 24 96% $45 MPQI 90 - Overall Composite 25 22 88% $58 MChild Access - Primary Care (7 to 11) 25 21 84% $28 MPDI 90 - Pediatric Composite 25 20 80% $58 MDiabetes Screening (Antipsychotic Medication) 25 20 80% $45 MChild Access - Primary Care (12 to 19) 25 20 80% $28 MPotentially Preventable ED Visits 25 19 76% $113 MPotentially Avoidable Readmissions 25 19 76% $113 MCV Monitoring (CV & Schizophrenia) 12 9 75% $28 MDiabetes Monitoring (DM & Schizophrenia) 24 16 67% $44 M
*Includes all P4P dollars available throughout the five years of DSRIP. This period included data that is subject to change pending improvements in the EIS. Source: Achievement Value Guide for PPSs: https://www.health.ny.gov/health_care/medicaid/redesign/dsrip/webinars_presentations.htm and DSRIP Performance Dashboards
Measure is P4P in MY2

15December 2016
Measure ApplicablePPSs
PPSs improving
Percent improving↓
Total P4P $ available*
Asthma Medication Ratio (5 – 64 Years) 13 4 31% $29 M
Adult Access Preventive (45 - 64) 25 5 20% $38 M
Adult Access Preventive (20 - 44) 24 1 4% $38 M
Child Access - Primary Care (12 to 24 Months) 25 1 4% $28 M
Antipsychotic Medication Adherence 25 0 0% $45 M
*Includes all P4P dollars available throughout the five years of DSRIP. This period included data that is subject to change pending improvements in the EIS. Source: Achievement Value Guide for PPSs: https://www.health.ny.gov/health_care/medicaid/redesign/dsrip/webinars_presentations.htm and DSRIP Performance Dashboards
Least improving high value claims based P4P measures in the first six months of MY2.• Less than one third of PPSs are improving on 5 of the 17 high value claims based measures.
Measure is P4P in MY2

16December 2016
Changes to DSRIP Measures in MY2

17December 2016
(a) Meaningful Use Certified Providers
Who Have a Participating Agreement
&
(b) Meaningful Use Certified Providers
Who Conduct Bidirectional Exchange
Meaningful Use Certified Providers (Electronic Health Records)

18December 2016
Measurement Year 1 Measurement Year 2Agency Responsible for Collecting Data
NYSDOH SHIN-NY New York e Health Collaborative (NYeC)
Method/Tool E-mail to 8 RHIOs Electronic survey to 8 RHIOs (facilitated by NYeC)
Participating Agreement question
“Does your qualified entity have a participant agreement with the provider? (yes/no)”
“Does the RHIO have a participating agreement with this provider at this payee location?’
Bidirectional Exchange question
“Does the qualified entity participate in bidirectional exchange with the provider? (yes/no)”
“Does this provider make the information in their electronic health records available to the SHIN-NY? (yes/no)”
AND
“Does this provider access information through the SHIN-NY? (yes/no)”
Collection Time August 2015 (MY1) August 2016 (MY2); annually thereafter
Baseline Year No(MY1 results should not be compared to MY2-MY5)
Yes(P4R all years)

19December 2016
RetirementPotentially Preventable Readmissions for Skilled Nursing Facilities
Replacement MeasureAntipsychotic Use Among Persons with Dementia for Long Stay Residents
Nursing Home Project (3.a.v.) Measure Changes

20December 2016
DSRIP Measure Description of Measure Change as of MY2Retirement of Potentially Preventable Readmissions for Skilled Nursing Facilities
Replacement Measure: Antipsychotic Use for Persons with Dementia for Long Stay Residents
Calculate new:(1) Performance Goal(2) Annual Improvement Target
MY0 results will remain as the baseline.
Only one PPS chose the project (3.a.v) associated with this measure
Measure changes: Potentially Preventable Readmissions
for Skilled Nursing Facilities

21December 2016
RetirementCholesterol Management for Patients with Cardiovascular Conditions (HEDIS 2015)
Replacement MeasureStatin Therapy for Patients with Cardiovascular Disease (HEDIS 2016)
National Center for Quality Assurance Measure Changes

22
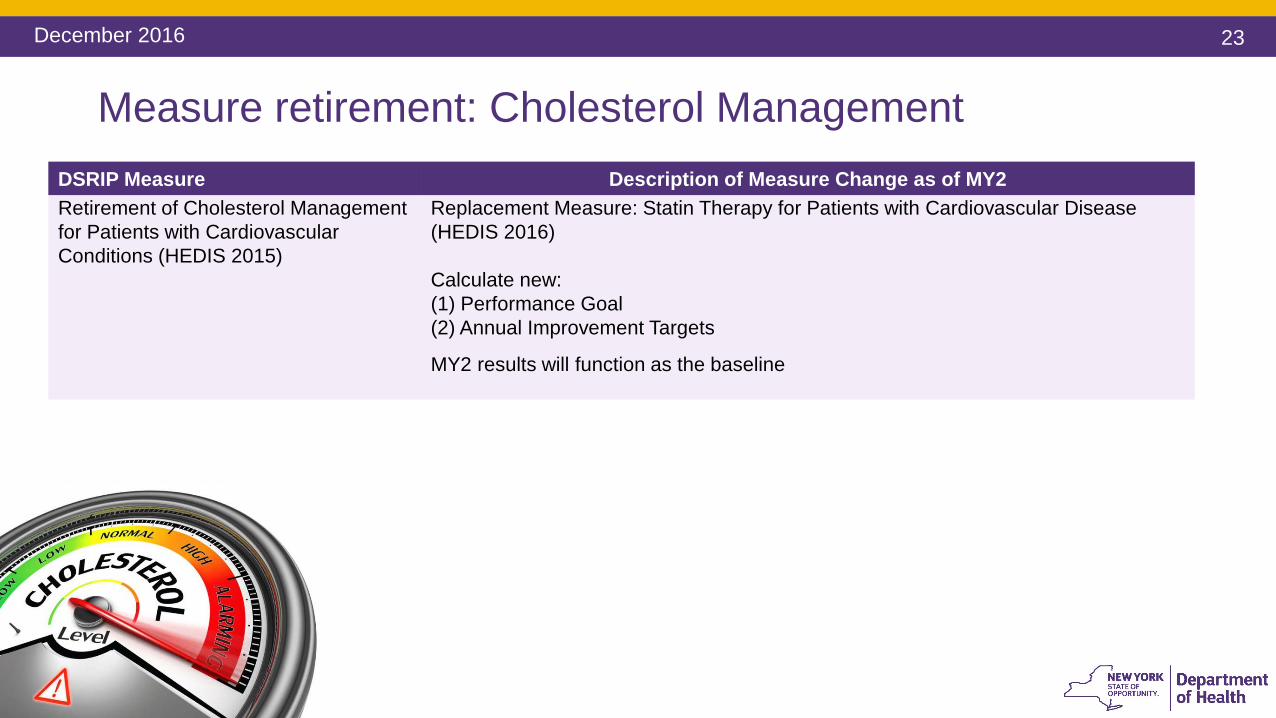
Retirement of Cholesterol Management for Patients with Cardiovascular Conditions (HEDIS 2015)
To bring HEDIS up to date with current evidence, NCQA retired this measure:
http://www.ncqa.org/portals/0/homepage/cmc.pdf
December 2016
23December 2016
DSRIP Measure Description of Measure Change as of MY2Retirement of Cholesterol Management for Patients with Cardiovascular Conditions (HEDIS 2015)
Replacement Measure: Statin Therapy for Patients with Cardiovascular Disease (HEDIS 2016)
Calculate new:(1) Performance Goal(2) Annual Improvement Targets
MY2 results will function as the baseline
Measure retirement: Cholesterol Management

24December 2016
RetirementPQI 13 Angina without Procedure Admission Rate
Replacement MeasurePQI 8 Congestive Heart Failure Admission Rate
Agency for Healthcare Research & Quality Measure Changes

25
Retirement of PQI 13:Angina without Procedure Admission Rate
AHRQ Quality Indicators Version 6.0 (2016) will not include Prevention Quality Indicator (PQI) 13.
New evidence and uses of PQI13 have raised concerns regarding its validity.
http://www.qualityindicators.ahrq.gov/News/PQI13_Retirement_Announcement.pdf
December 2016

26December 2016
DSRIP Measure Description of Measure Change as of MY2Retirement of PQI 13 Congestive Heart Failure Admission Rate
Replacement Measure: PQI 8 Angina without Procedure Admission Rate
PQI 8 results only available for project 3.b.i./3.b.ii for MY2-MY5.
Calculate new:(1) Performance Goal(2) Annual Improvement Targets
MY3 results will function as the baseline.
** MY4 will be the first year in which the measure is P4P **
Measure retirement: PQI 13

27December 2016
PQI 90 version 2removes PQI 13
Agency for Healthcare Research & Quality Measure Changes
PQI 90 – Prevention Quality Overall Composite
includes PQI 13

28December 2016
DSRIP Measure Description of Measure Change as of MY2PQI 90 version 2 Remove PQI 13 from calculation
Calculate new:(1) Measure Result(2) Performance Goal(2) Annual Improvement Targets
MY3 results will function as the baseline.
** MY4 will be the first year in which the measure is P4P **
Measure changes: PQI 90
29December 2016
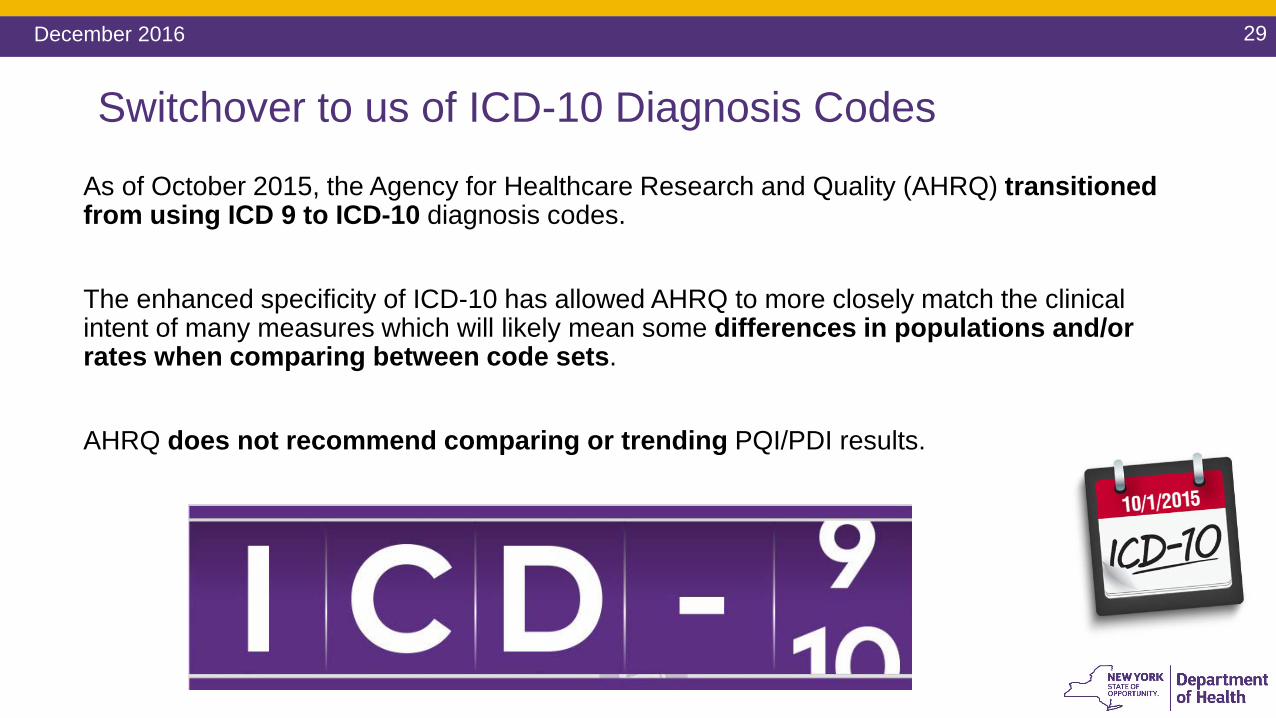
As of October 2015, the Agency for Healthcare Research and Quality (AHRQ) transitioned from using ICD 9 to ICD-10 diagnosis codes.
The enhanced specificity of ICD-10 has allowed AHRQ to more closely match the clinical intent of many measures which will likely mean some differences in populations and/or rates when comparing between code sets.
AHRQ does not recommend comparing or trending PQI/PDI results.
Switchover to us of ICD-10 Diagnosis Codes

30December 2016
DSRIP Measure Description of Measure Change for MY2 & MY3
Prevention Quality Indicators (PQIs) &
Pediatric Quality Indicators (PDIs)
PQI 90 (overall composite)PQI 1 (diabetes short term complication)PQI 7(hypertension)PQI 8 (heart failure admission)PQI 9 (low birth weight)PQI 15 (younger adult asthma)PDI 90 (pediatric composite) PDI 14 (pediatric asthma)
For MY2 (July 2015 - June 2016):DOH will use a combination of the AHRQ ICD-9 compatible version and the AHRQ QI 6.0 ICD-10 compatible version to calculate PQI/PDI measure results.************************************************************************************************************************************************************************************
For MY3 (July 2016 - June 2017)All PQIs/PDIs measure results will be calculated using AHRQ QI 6.0 ICD-10 version.
MY3 becomes new baseline year.
MY3 measure results should not be compared/trended to previous year results.
Recalculate for all PQIs/PDIs:(1) Performance Goals (2) Annual Improvement Targets
** MY4 will be the first year in which the measure is P4P **
Measure changes: Effect of ICD-10 Switchover
31December 2016
Financial Implications of Measure Changes

32
Implications of ICD-10 on PQI/PDI• The impact of the transition to ICD-10 on these measures means that the measures
cannot turn P4P as they were originally scheduled.o Domain 3 disease specific measures were scheduled to be P4P in MY2.o Domain 2 composite measures were scheduled to be P4P in MY3.
• Proposal: All measures impacted by this transition will now become P4P in MY4. o Baselines will be set using MY3 results (July 2016 - June 2017) o All dollars associated with PDI/PQI measures will now be Pay For Reporting (P4R)
until MY4.

33December 2016
MY2 MY2 MY3 MY3
DY2 P2 DY3 PP1 DY3 PP2 DY4 PP1 Total PQI/PDI Moved to P4R
Domain 2 $100,873,339 $48,935,146 $440,416,311 $288,888,016
Total P4P $0 $0 $391,481,166 $252,777,014
Total P4R $100,873,339 $48,935,146 $48,935,146 $36,111,002
PQI/PDI P4P $66,886,536 $43,188,231 $110,074,767
% P4P PQI/PDI 17% 17% 17%
Domain 3 $92,312,239 $144,453,278 $144,453,278 $170,555,622 $551,774,417
Total P4P $65,515,938 $110,356,766 $110,356,766 $147,104,224 $433,333,692
Total P4R $26,796,301 $34,096,513 $34,096,513 $23,451,398
PQI/PDI P4P $25,268,402 $42,562,759 $42,562,759 $19,811,224 $130,205,144
% P4P PQI/PDI 39% 39% 39% 13% 30%
Pay For Performance Dollars Tied to PDI/PQI

34December 2016
Network Provider Hubs
Impact of Partner Removals and Additions and Provider Hubs

35
DSRIP Network Provider Hubs
Phase Timeline FeaturesPhase 1.0 Late February 2017 • Ability to categorize Providers
into Hubs (1:1)• Visibility of Accountable Layers
in DSRIP Performance Dashboards for MC PCPs
Phase 2.0 Spring 2017 • Sub-Hubs• Usability Enhancements
Phase 3.0 Summer 2017 • Assigning Providers to Multiple Hubs
• Ability to drill down beyond the MC PCP
• Usability Enhancements
December 9, 2016
As a result of Listening Tours, DOH is starting a phased roll out the functionality to group providers by Hub. Below is the phased approach to address the needs of the PPS.

36
DSRIP Network Provider HubsPhase Date CommentPhase 1.1 December 5, 2016 • The deadline for PPS to submit their Hub Designation Form to be
uploaded into the Provider Network Tool. • After this deadline passes, PPS will have to create Hubs
individually in the Provider Network Tool.Phase 1.2 January 20, 2017 • The deadline for PPS to assign a provider to a specific Hub in the
Provider Network Tool. • Please note, the current phase only allows a one-to-one
relationship between the provider and Hub.• Not all providers need to be assigned to a Hub.
Phase 1.3 Late February 2017 • Hubs will be visible in the DSRIP Dashboards to view performance by Hub
• All DSRIP dashboard users will be able to drill from the Hub layer to the underlying MC PCPs that are included in the Hub. The non-PCP providers will not be included in the Hubs in Phase 1.
December 9, 2016

37
DSRIP Network Provider HubsYOU GET A THREE WEEK EXTENSION TO FINISH YOUR HUB DESIGNATION FORMS!!
December 9, 2016

38
DSRIP Network Provider HubsHere are some things to keep in mind when filling out your Hub Designation Form.
Reminder Number 1: Do not use special characters in your Hub name or Hub Short Name.Reminder Number 2: Your Hub Short Name should be 30 characters or less.Reminder Number 3: Do not leave the Hub Name or Short Name blank. They are required fields.Reminder Number 4: Do not use formulas, such as v-lookups, in your spreadsheet.Reminder Number 5: Up to 50 Hubs are allowed in this phase.Full Hub Designation Instructions will be sent in the PPS Communication on Monday December 12
December 9, 2016

39
DSRIP Network Provider Hubs DemonstrationsMonthly PPS Performance Measurement Workgroup Meetings will include demonstrations on how to use Hub functionality
Date Topic
December 14, 2016 Adding Providers to Hubs in the Provider Network Tool
January 2017 Editing Provider Assignments and Hubs in the Provider Network Tool
February 2017 Viewing Hub Information in the Performance Dashboards
These demonstrations should be viewed by all PPSs, regardless of if you have submitted a Hub Designation Form, as Hubs can be created individually at any time in the Provider Network Tool.
December 9, 2016

40December 2016
Swim lane distribution by PPSFuture provider network changes may impact swim lane distribution.
0% 10% 20% 30% 40% 50% 60% 70% 80% 90% 100%
Westchester Medical Center
The New York and Presbyterian Hospital
SUNY at Stony Brook University Hospital
Staten Island
Sisters of Charity Hospital
SBH Health System
Samaritan Medical Center
Refuah Community Health Collaborative
New York University Lutheran Medical Center
New York City Health and Hospitals Corporation
New York - Presbyterian/Queens
Nassau Queens
Mount Sinai
Montefiore Medical Center
Millennium Collaborative Care
Maimonides Medical Center
Finger Lakes
Central New York Care Collaborative
Care Compass Network
Bronx-Lebanon Hospital Center
Bassett Medical Center
Alliance for Better Healthcare
Albany Medical Center
Advocate Community Partners
Adirondack Health Institute
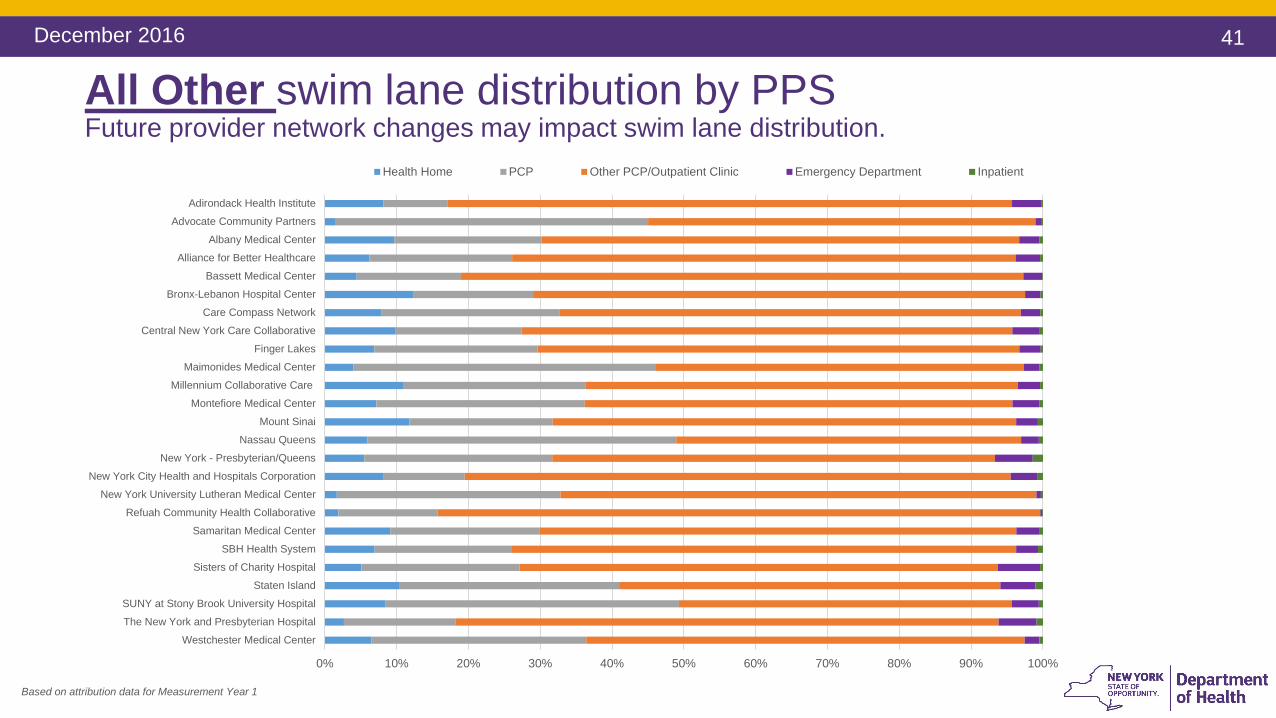
Based on attribution data for Measurement Year 1
All Other No Services Behavioral Health Developmental Disabilities Long Term Care
41
0% 10% 20% 30% 40% 50% 60% 70% 80% 90% 100%
Westchester Medical Center
The New York and Presbyterian Hospital
SUNY at Stony Brook University Hospital
Staten Island
Sisters of Charity Hospital
SBH Health System
Samaritan Medical Center
Refuah Community Health Collaborative
New York University Lutheran Medical Center
New York City Health and Hospitals Corporation
New York - Presbyterian/Queens
Nassau Queens
Mount Sinai
Montefiore Medical Center
Millennium Collaborative Care
Maimonides Medical Center
Finger Lakes
Central New York Care Collaborative
Care Compass Network
Bronx-Lebanon Hospital Center
Bassett Medical Center
Alliance for Better Healthcare
Albany Medical Center
Advocate Community Partners
Adirondack Health Institute
Based on attribution data for Measurement Year 1
Health Home PCP Other PCP/Outpatient Clinic Emergency Department Inpatient
All Other swim lane distribution by PPSFuture provider network changes may impact swim lane distribution.
December 2016

42December 2016
Swim lane distribution remains stable over timeFuture provider network changes may impact swim lane distribution.
0%
10%
20%
30%
40%
50%
60%
70%
80%
90%
100%
All Other
Long Term Care
DevelopmentalDisabilities
BehavioralHealth

43
• Current supplemental attribution data files for the period 4/1/15-3/31/16 were released December 7 to those 17 PPS who had approved SSPs prior to Nov 29.
• PPS who receive data files for the first time receive a full 12 month claims history.
• Previous data files released June 1 reflected attribution from 7/1/14-6/30/15.
• Supplemental files released Sept 16 reflected attribution from 1/1/15 through 12/31/15.
• Data Destruction Attestations associated with the “shred files” need to be returned every cycle before accessing future data files.
• Next production of data files expected early January 2017. The January release will contain IPA/CPA version 2.0 which will include HH enrollment data.
• Managed Care Plan current membership rosters with attributed PPS identified created for SFTP with MCP identified users for those with approved DEAAs.
December 2016
Medicaid data files releases

44
Reference Slides

December 2016
Setting the Performance Goal
Statewide goal for each DSRIP quality measure
use Medicaid managed care data (zip code level)
goal set to be the 90th percentile (equal to 10th percentile for measures where a lower result is desirable)
when data unavailable – default is 0%/100% (will be reset at next MY)

46Date (Change in Slide Master – Title and Content)
Setting Performance Goals: Alternate Method for Preventable Measures
STEP1Best performing PPS PPS MY1 result = A
STEP 2(Best performing PPS MY1
result x 0.20) = B
STEP 3A - B = PG
Preventable (PQI/PDI) measures use an alternate method to set PG PQI 8 (replaced PQI 13) PQI 90 version 2 (PQI 13 removed)
PG = Lowest PPS MY1 result - (Lowest PPS MY1 result X 0.20)