ALL IN A DAY’S WORK - AnnualReports.com · 25% – North America 17% – South America 5% –...
19
2014 ANNUAL REPORT ALL IN A DAY’S WORK
-
Upload
hoangxuyen -
Category
Documents
-
view
213 -
download
0
Transcript of ALL IN A DAY’S WORK - AnnualReports.com · 25% – North America 17% – South America 5% –...

2014 ANNUAL REPORT
ALL IN A DAY’S WORK

1
Martin Richenhagen — Chairman, President and Chief Executive Officer
Like our farmers and producers, we’re focused on making every day at AGCO a productive day. In 2014, this involved innovating new technologies, forging stronger relationships, extending our global reach and investing in what we believe is a future filled with opportunity.
ALL IN A DAY’S WORKFellow Shareholders

2 3
farmers to take full advantage of the growing amount
of data they now have available. Through Fuse, AGCO
is well-positioned to benefit from the technological
revolution now taking place in the agricultural
equipment industry.
Strategic Priorities Remain in PlaceDespite the market challenges, our priorities remain
unchanged, focusing on margin performance and cash
generation, while providing superior products and services
to our customers. Balancing near-term cost reductions
with continued investment in longer-term growth initiatives
is our goal. In addition to adjusting our costs and workforce
to better match the current demand environment, our
ongoing cost reduction efforts focused on materials and
direct labor productivity remain intact. Through our AGCO
Production Systems initiatives, we are improving direct labor
efficiency through our investments in new manufacturing
technology and continuous improvement efforts. Our
Global Purchasing Excellence (GPE) program, which
transformed our factory-based purchasing function into
new global commodity-based purchasing teams, is also
attacking material costs. These commodity-based teams
have better market and product knowledge, which, along
with global sourcing expertise, helps us make better
purchasing decisions and lower costs.
Growing AGCO around the world also remains a major
focus. We are continuing to pursue growth opportunities
with our GSI business. Inefficiencies in handling crops
after harvest create significant opportunities for our grain
storage and handling business, especially in the developing
markets. On the protein production side of the business,
increasing global protein consumption presents a major
opportunity. Significant differences in productivity levels
exist based upon degree of use of modern pork and chicken
production practices, including genetics, nutrition, health,
housing, feeding and environmental control. We also are
targeting growth for our traditional agricultural equipment
products. Tremendous opportunity exists for our equipment
to help improve yields in emerging agricultural regions
around the world. Africa, Brazil and Eastern Europe all
present significant growth opportunities. We are investing
in new products, improved distribution and enhanced
dealer service capabilities to capture growth in these areas.
In addition, there are opportunities to grow outside our
tractor business. AGCO is a global leader in tractor sales,
and we are working to leverage our strong brands with
new and improved harvesting products and enhanced
distribution capabilities.
More Potential AheadAGCO has grown significantly during the past decade,
and I’m proud to be part of our organization’s progress.
We have accomplished a great deal, with much yet to
achieve to realize our full potential. AGCO is in an excellent
position to help agriculture meet the daunting challenge
of feeding a growing planet. Our high-tech solutions are
making professional farmers more productive, and this
bodes well for all of our stakeholders.
In closing, I want to thank our customers and dealers
for their business and support, our shareholders for their
confidence in our Company and over 20,000 employees
worldwide for their dedication. It is AGCO’s people who
are turning our vision into reality everywhere we do
business, every day.
Martin Richenhagen Chairman, President and Chief Executive Officer
Despite the market challenges, our priorities remain unchanged, focusing on margin performance and cash generation, while providing superior products and services to our customers.
Fellow Shareholders:Our vision at AGCO is to provide high-tech solutions for
professional farmers feeding the world. As we design,
manufacture and support equipment that increases farmers’
efficiency and productivity, we also help solve one of our
planet’s greatest challenges – feeding a population that
is expected to grow from 7 billion today to nearly 10 billion
by 2050. To meet this demand, farmers will have to grow
as much food over the next 50 years as they have over
the full course of recorded history. To support this effort,
AGCO must be at its best.
2014 PerformanceThe past year was a challenging year for our industry and
AGCO due to weakened market demand. The record grain
harvest in the U.S., combined with healthy crop production
across Western Europe and Brazil, resulted in increased
grain inventories, which pressured soft commodity prices.
Deteriorating farm economics negatively impacted farmer
sentiment, and we experienced softer industry equipment
demand in all major markets.
We took aggressive actions to manage our working capital
and align our cost structure with weaker market conditions.
Our disciplined inventory reduction program resulted in year-
end inventories below 2013 levels, on a constant currency
basis, despite falling demand. These and other actions
helped make AGCO a leaner, more focused company better
positioned for leadership in our competitive industry.
AGCO completed 2014 generating net sales of $9.7 billion,
which was approximately 10 percent below 2013 levels.
Adjusted net income for 2014 was $4.70 per share,
excluding restructuring and other infrequent expenses
of $0.34 per share. Our financial discipline enabled us to
generate over $130 million in free cash flow after funding
significant investments in new product development,
Tier 4 emission compliance and a new factory in China.
Focused on Shareholder Returns With a healthy balance sheet, AGCO completed a
$500 million share repurchase plan during 2014.
I am also pleased to report that a new $500 million
plan was authorized in December 2014 to support future
repurchases. We expect to generate strong cash flow
in 2015 and beyond to fund this plan. This new share
repurchase program demonstrates our commitment
to driving attractive returns for our shareholders. Going
forward, we also are committed to taking a disciplined
approach to maintaining our investment-grade credit
rating and growing our dividend.
Over the past decades, we have worked to have the right
products and the right technology to compete effectively in
today’s dynamic marketplace. To support this commitment,
we have put initiatives in place to grow our sales, improve
distribution and reduce expenses in order to enhance
margins and produce higher returns on invested capital.
Precision Farming InnovationIncreasingly, farmers are operating their farms like modern
factories as they accelerate the use of precision farming
and fleet management technology to improve productivity.
Consequently, adoption rates for our Fuse® Technologies
products have increased dramatically over the last 18 months.
Our customers view Fuse guidance and telemetry as top-of-
the-line technology, and they will expect AGCO to lead the
way to further enhance these established technologies.
They also will expect us to deliver new technology solutions
that help them manage their operations. From implement
control to monitoring and improved mobility, AGCO plans
to continue to deliver new products in 2015 and beyond.
We expect to also begin to integrate technology products
and services to create complete solutions that allow
...we have put initiatives in place to grow our sales, improve distribution and reduce expenses in order to enhance margins and produce higher returns on invested capital.
54
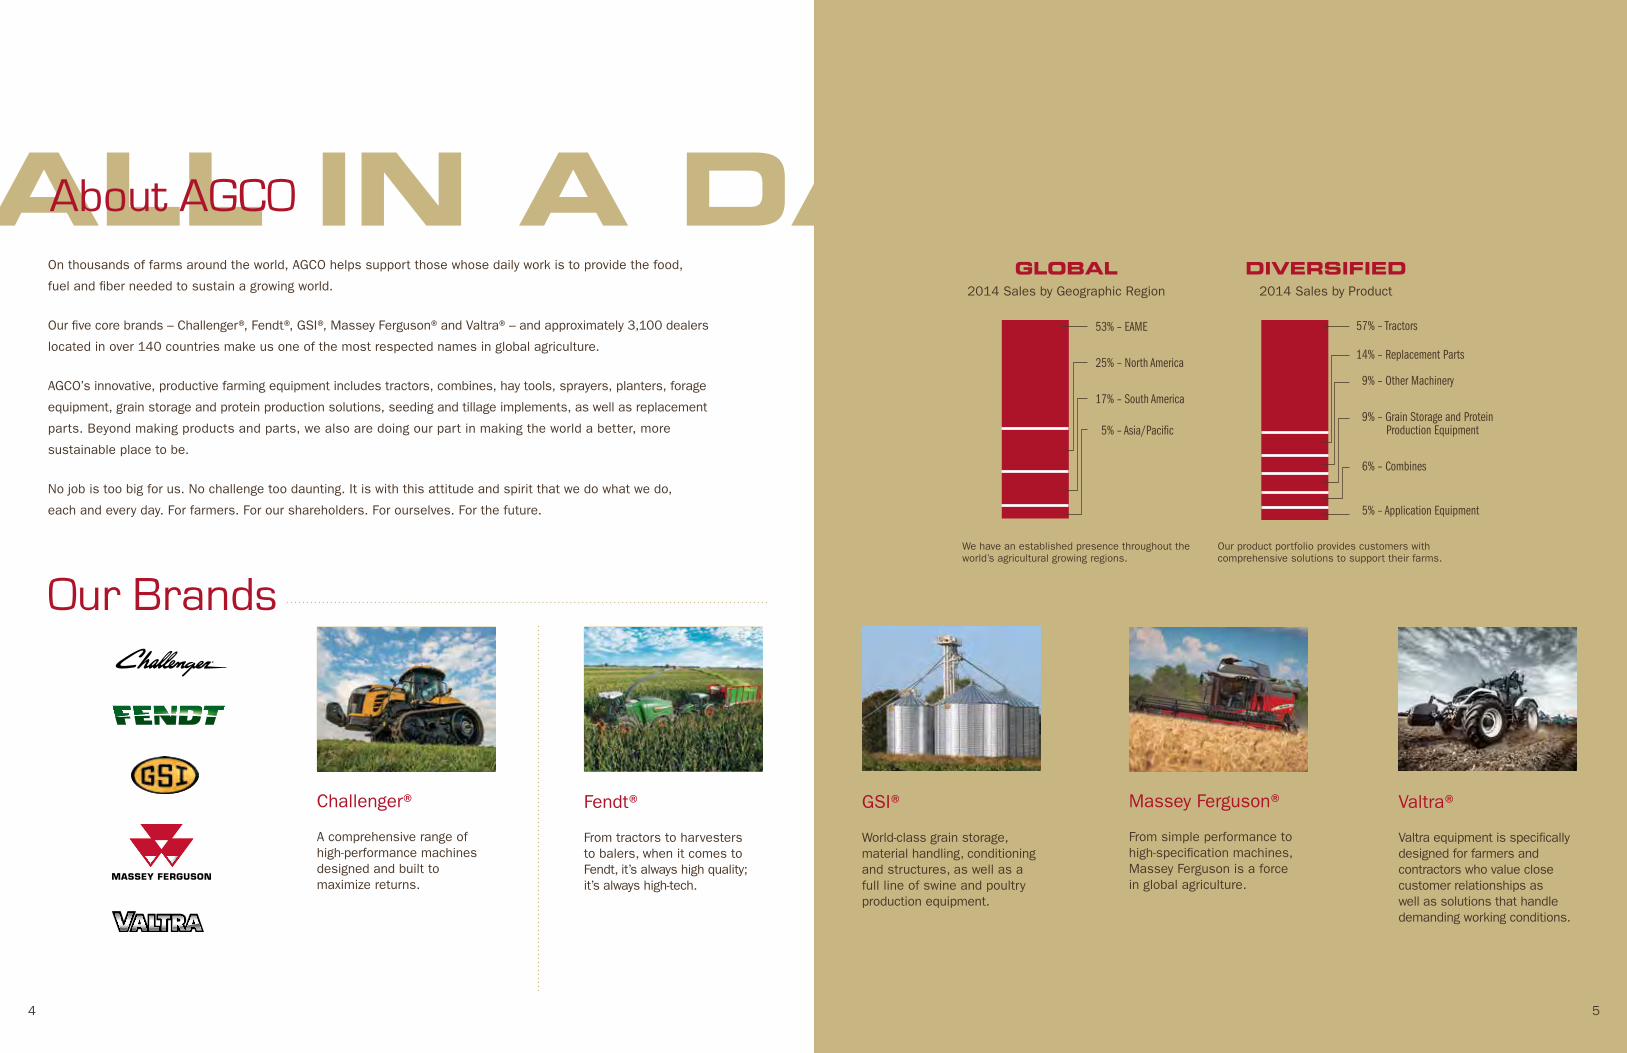
On thousands of farms around the world, AGCO helps support those whose daily work is to provide the food,
fuel and fiber needed to sustain a growing world.
Our five core brands – Challenger®, Fendt®, GSI®, Massey Ferguson® and Valtra® – and approximately 3,100 dealers
located in over 140 countries make us one of the most respected names in global agriculture.
AGCO’s innovative, productive farming equipment includes tractors, combines, hay tools, sprayers, planters, forage
equipment, grain storage and protein production solutions, seeding and tillage implements, as well as replacement
parts. Beyond making products and parts, we also are doing our part in making the world a better, more
sustainable place to be.
No job is too big for us. No challenge too daunting. It is with this attitude and spirit that we do what we do,
each and every day. For farmers. For our shareholders. For ourselves. For the future.
GLOBAL DIVERSIFIED2014 Sales by Geographic Region 2014 Sales by Product
53% – EAME
25% – North America
17% – South America
5% – Asia/Pacific
We have an established presence throughout the world’s agricultural growing regions.
Our product portfolio provides customers with comprehensive solutions to support their farms.
57% – Tractors
14% – Replacement Parts
9% – Other Machinery
9% – Grain Storage and Protein Production Equipment
6% – Combines
5% – Application Equipment
ALL IN A DAY’S WORKAbout AGCO
Our Brands
Challenger®
A comprehensive range of high-performance machines designed and built to maximize returns.
GSI®
World-class grain storage, material handling, conditioning and structures, as well as a full line of swine and poultry production equipment.
Fendt®
From tractors to harvesters to balers, when it comes to Fendt, it’s always high quality; it’s always high-tech.
Massey Ferguson®
From simple performance to high-specification machines, Massey Ferguson is a force in global agriculture.
Valtra®
Valtra equipment is specifically designed for farmers and contractors who value close customer relationships as well as solutions that handle demanding working conditions.

6 7
Less downtime means more profit potential for
farmers and more food for the world. This is why
we are so focused on offering farmers the technology,
service, resources and equipment that they need
to maximize uptime.
ALL IN A DAY’S WORKSOWING EFFICIENCIESWE ESTIMATE THAT FARMER DOWNTIME HAS IMPROVED BY
SINCE 200431

8 9
We maintain a strong level of investment
in research, engineering and development
to ensure that farmers have the
leading-edge technology required to
maximize productivity and profitability.
We also are dedicated to delivering
the best value to farmers by leveraging
manufacturing processes and tools that
reduce costs and time-to-market while
increasing reliability and quality. In 2014,
this effort resulted in the introduction of
a new family of mid-sized tractors based
on a modular design and more flexible
manufacturing approach.
This new global series of tractors
consolidates five manufacturing
platforms for mid-sized tractors and
sources major components from our
new AGCO plant in China. The series
comprises a range of modular engines,
transmissions, rear axles, cabs and
operator stations. The modular design
allows for combinations of units that
provide a broad spectrum of modern,
cost-efficient tractors, ranging from a
simple three-cylinder, 55-horsepower
machine for African markets to a
four-cylinder Tier 4/Stage IV-compliant,
130-horsepower cab tractor for
European and North American markets.
This new family of tractors also
includes full brand differentiation and
unique positioning to retain traditional
character and operating features
and will replace the diverse portfolio
of products sold in a large number
of our world markets. It will offer
farmers and producers a modern,
competitive and consistent choice
of products while allowing us to build
and assemble locally in all-important
markets, together with leveraging
the sourcing of critical components
and the production volumes globally
in low-cost country environments.
At AGCO, we work hard to have the right products and the right technology to compete effectively in today’s dynamic marketplace.
MAXIMIZING OPERATIONAL EFFICIENCY
A Better Way to Build
Utilizing common components is a more effective and
efficient way that we can offer more competitive solutions
and advance our business and relationships through:
Improving Sustainability and Innovation
This improved way of thinking allows our
engineers throughout the globe to provide more
game-changing innovation in less time. Likewise,
we can positively affect our sustainability – both
from an environmental and financial standpoint.
ENHANCED SPEEDAND EFFICIENCY
IMPROVED TOOLS ANDPARTS AVAILABILITY
SUPERIOR INNOVATION
INCREASED SUSTAINABILITY
The Massey Ferguson Global Series, which debuted in 2014, has been developed to provide dependable operation across a wide range of applications to meet farmer needs.

10 11
BY 2030, DEMAND FOR FOOD WILL BE
60%HIGHER THAN TODAY*
An increasing global population is driving food demand,
much of which is for protein. As incomes rise in emerging
markets, so too does meat consumption. This drives more
demand for grain production in the form of feedstock in
addition to grain for food.
ALL IN A DAY’S WORKHARVESTING OPPORTUNITIES
* Source: Solving the Global Food Challenge, 2013.

12 13
AGCO is already a global leader in
tractor sales, and we have a significant
opportunity to leverage our reputable
brands with new and improved
harvesting products and improved
distribution capabilities. Consider Brazil,
where farm production is expanding.
Today, Brazil’s Mato Grosso region is
responsible for nearly 50 percent of
the country’s grain production. Over
the next 10 years, that production is
expected to increase more than
70 percent, with the planted area
growing by more than 40 percent
compared with the most recent
growing season. Because farming in
Brazil is done mostly by very large
professional operations, AGCO is
working to add new dealers and making
investments to localize production of
an extended line of high-horsepower
tractors and combines in the country.
We’re also improving parts availability
to ensure that our dealers are providing
timely service to our retail customers.
In Africa, our strategy is focused
on improving distribution and parts
support, as well as providing farmers
with the tools they need to farm more
efficiently, including on-farm training;
expanding product offerings; leveraging
our production capability in Algeria;
and promoting international investment
by sponsoring an annual Africa Summit
in Berlin. Our 50+ years of experience
through Massey Ferguson on the
African continent enables us to
leverage alliances with governments
and foreign investors and to provide
leadership in improving agricultural
practices. Last year, Martin Richenhagen,
AGCO’s Chairman, President and
CEO, was appointed to the U.S.
President’s Advisory Council on Doing
Business in Africa, which will advise
the President through the Secretary of
Commerce on strengthening commercial
engagement between the United
States and Africa.
EXTENDING OUR GLOBAL REACH
We continue to work to expand our presence around the world, including key global growth markets such as South America, Africa, Russia and China.
Eighteen Valtra combine harvesters run through soybean fields at Campo Novo do Parecis, Mato Grosso, Brazil. The farmer is one of the most prominent in the region owning more than 55,000 hectares, with 20,000 hectares for corn and soy farming.
The “Future Farm” Debuts in Zambia
In 2015, we’re officially opening our Future Farm concept in
Zambia with a goal to establish new standards for agricultural
education in Africa. The farm will educate customers, dealers
and distributors on agricultural solutions that meet local
needs and how to develop a sustainable food production
system by utilizing agricultural resources more efficiently.

14 15
IN 2020, ONE FARMER WILL NEED TO FEED
200PEOPLE*
Compare that to a generation ago. In 1980, one farmer
needed to feed just 76 people. With a limited amount
of arable land to cultivate, farmers are dependent on
more efficient technologies and agribusiness techniques
to meet this daunting task.
ALL IN A DAY’S WORKMAXIMIZING YIELD
* Source: 2013 Iron Solutions, Inc.

16 17
Across the globe, efforts are underway
to boost farm productivity. These
efforts center on the use of improved
fertilizer and feed technology, upgraded
storage and handling capabilities
and the adoption of precision farming
practices. In today’s world, precision
farming is essential to reducing costs
and improving efficiencies and results.
No wonder the precision agriculture
market is growing by 13 percent
in the U.S. and by double that rate
outside the U.S., where the need to
improve productivity is even greater.
To meet the increasing demand
for precision agriculture, we have
focused our business priorities
on machinery and, increasingly,
the technology that enhances that
machinery. We call our strategic
approach to precision farming Fuse
Technologies, which is designed to
leverage farming data that boosts
agricultural productivity and
profitability. We’re also helping our
dealers transform themselves into
proactive service providers. This
entails providing service packages
based on operational and machine
data that can help customers optimize
their farms by reducing downtime,
cutting waste and improving yields.
Fuse’s approach to precision farming
is differentiated by offering solutions
for mixed fleets and across product
categories; working to ensure data
privacy by separating agronomy data
from machine data; providing mobile
functionality and diagnostic services
that give farmers the flexibility to
manage their operations when, where
and how they want; and delivering
an open approach that leverages
best-in-class partnerships with other
key companies in the industry.
INNOVATING LEADING-EDGE TECHNOLOGY
Our next generation approach to precision agriculture gives mixed fleet farming operations improved access to their farm data so they can make more informed business decisions to enhance productivity and profitability. A key goal of the Fuse connected strategy has
been to build industry partnerships. In 2014, we announced collaborations with DuPont Pioneer and Appareo Systems, LLC, to enhance data collection and transfer, wireless communication, advanced sensors and intelligent machine control.
Maximizing Technology Investments
As technology increases its hold in the agricultural industry,
AGCO’s customers will need more support and more expertise
to learn the best ways to optimize their operations. That’s why
AGCO is arming dealers with the information they need to
provide effective service to their customers. In addition, AGCO
launched the global Fuse Contact Center that helps customers
set up, calibrate and receive operational support on AGCO
precision and machine communication technology products.

18 19
FARMING EMISSIONS WILL DECREASE
90%*
BY 2015
It’s a farmer’s job to care for the land. More fuel-efficient
equipment helps farmers conserve natural resources,
lower operating costs and meet emission regulations –
all while providing the heavy-duty power needed to get
the job done.
ALL IN A DAY’S WORKGROWING RESPONSIBLY
* Engine Particulate Matter and Nitrous Oxide emissions for new machinery, per U.S. EPA.

20 21
We believe that by working smarter
and leaner, we can minimize not
only our own environmental footprint,
but also the impact of agricultural
operations around the world. That’s
why we’re pleased with our progress
against our internal sustainability
targets and goals during 2014.
2013 progress was reported in our
third annual Sustainability Report,
which we invite you to download
at www.agcocorp.com.
Enhancing energy usage is an important
goal for us, and the key to achieving
an enterprise-wide energy target
begins with our facilities around the
world. We’ve developed a program to
help local operational and maintenance
managers reduce energy usage as we
all work toward an overall 10 percent
energy intensity reduction by 2017.
The program consists of easy ways
to identify, plan and implement
energy-reduction projects with little
or no direct project costs, along with
strategies to share best practices
among manufacturing sites.
Today, 17 AGCO sites are participating
in the program. Combined, they have
implemented projects that have
resulted in more than $300,000 in
annual energy savings and identified
additional projects expected to yield
in excess of $2.5 million in savings.
Just as important, the program
is proving to be an excellent way
to engage employees in an energy-
efficient culture.
CULTIVATING CHANGE IN OUR BUSINESS
As we focus on high-tech solutions to help farmers satisfy the world’s growing need for food, fuel and fiber, we’re also looking for ways to make sustainability part of every area of our organization.
Our “Focus” program is a great example of how we’re working to foster health and safety on the job. Focus emphasizes continuous improvement and individual responsibility and is built around five principles: involvement; prevention; continuous improvement; education and training; promotion and communication. Focus has contributed to the overall reduction of workplace injuries.
Leading with Biomass Solutions
Biomass is organic material that can be processed into
electricity, heat and fuel. There is enough biomass in the
U.S. to produce the amount of electricity needed to run half
of the homes in the U.S. annually. For over five years, AGCO
Biomass Solutions has been refining harvesting practices
and equipment solutions – along with the resulting biomass
feedstock – for optimum efficiency and reliability. We’re
also working with researchers at institutions such as Iowa
State and Oklahoma State, as well as supporting industry
leaders at DuPont; POET LLC and Abengoa, S.A., to improve
biomass feedstock supply chain logistics.

22 23
BOARD OF DIRECTORS
Martin H. RichenhagenChairman, President and Chief Executive Officer AGCO
Roy V. ArmesExecutive Chairman, President and CEO Cooper Tire and Rubber Company
Michael C. ArnoldPresident and CEO Ryerson Inc.
P. George BensonFormer PresidentCollege of Charleston
Wolfgang DemlFormer President and Chief Executive Officer BayWa Corporation
Luiz Fernando FurlanFormer Minister of Development, Industry and Foreign Trade of Brazil
George E. MinnichFormer Senior Vice President and CFO ITT Corporation
Gerald L. Shaheen Former Group President Caterpillar Inc.
Mallika SrinivasanChairman and CEO Tractors and Farm Equipment Limited (TAFE)
Hendrikus VisserChairman Royal Huisman Shipyards N.V.
Executive CommitteeMartin H. Richenhagen, ChairmanP. George BensonWolfgang DemlGeorge E. MinnichGerald L. ShaheenHendrikus Visser
Audit CommitteeGeorge E. Minnich, ChairmanMichael C. ArnoldP. George BensonHendrikus Visser
Compensation CommitteeGerald L. Shaheen, ChairmanRoy V. ArmesLuiz Fernando FurlanGeorge E. Minnich
Finance CommitteeHendrikus Visser, ChairmanGeorge E. MinnichGerald L. Shaheen
Governance CommitteeP. George Benson, ChairmanMichael C. ArnoldWolfgang DemlMallika Srinivasan (Guest)Hendrikus Visser
Succession Planning CommitteeWolfgang Deml, ChairmanRoy V. Armes Luiz Fernando FurlanMartin H. RichenhagenGerald L. ShaheenMallika Srinivasan
AGCO 2014 BOARD COMMITTEES
SENIOR MANAGEMENT
Martin H. RichenhagenChairman, President andChief Executive Officer
Roger N. BatkinVice President,General Counsel and Corporate Secretary
Andrew H. BeckSenior Vice President,Chief Financial Officer
Andre M. Carioba*Former Senior Vice President,General Manager, South America
Gary L. CollarSenior Vice President,General Manager, Asia Pacific
Robert B. CrainSenior Vice President, General Manager, Americas
Helmut R. EndresSenior Vice President,Engineering
Eric P. HansotiaSenior Vice President,Global Harvesting and Advanced Technology Solutions
Lucinda B. SmithSenior Vice President,Global Business Services
Rob SmithSenior Vice President,General Manager, Europe, Africa and Middle East
Hans-Bernd VeltmaatSenior Vice President,Chief Supply Chain Officer
Thomas F. WelkeSenior Vice President,Global Grain and Protein, GSI
OFFICERS & DIRECTORS
* Mr. Carioba retired from the Company effective December 31, 2014.

2524
AGCO ALL IN A DAY’S WORK 2014 AWARDS 2014 AWARDS AGCO ALL IN A DAY’S WORK AGCO ALL IN A DAY’S WORK 2014 AWARDS 2014 AWARDS AGCO ALL IN A DAY’S WORK AGCO ALL IN A DAY’S WORK 2014 AWARDS 2014 AWARDS AGCO ALL IN A DAY’S WORK AGCO ALL IN A DAY’S WORK 2014 AWARDS 2014 AWARDS AGCO ALL IN A DAY’S WORK AGCO ALL IN A DAY’S WORK 2014 AWARDS 2014 AWARDS AGCO ALL IN A DAY’S WORK AGCO ALL IN A DAY’S WORK 2014 AWARDS 2014 AWARDS AGCO ALL IN A DAY’S WORK AGCO ALL IN A DAY’S WORK 2014 AWARDS 2014 AWARDS AGCO ALL IN A DAY’S WORK AGCO ALL IN A DAY’S WORK 2014 AWARDS 2014 AWARDS AGCO ALL IN A DAY’S WORK AGCO ALL IN A DAY’S WORK 2014 AWARDS 2014 AWARDS AGCO ALL IN A DAY’S WORK AGCO ALL IN A DAY’S WORK 2014 AWARDS 2014 AWARDS AGCO ALL IN A DAY’S WORK AGCO ALL IN A DAY’S WORK 2014 AWARDS 2014 AWARDS AGCO ALL IN A DAY’S WORK AGCO ALL IN A DAY’S WORK 2014 AWARDS 2014 AWARDS AGCO ALL IN A DAY’S WORK AGCO ALL IN A DAY’S WORK 2014 AWARDS 2014 AWARDS AGCO ALL IN A DAY’S WORK AGCO ALL IN A DAY’S WORK 2014 AWARDS 2014 AWARDS AGCO ALL IN A DAY’S WORK AGCO ALL IN A DAY’S WORK 2014 AWARDS 2014 AWARDS AGCO ALL IN A DAY’S WORK AGCO ALL IN A DAY’S WORK 2014 AWARDS 2014 AWARDS AGCO ALL IN A DAY’S WORK AGCO ALL IN A DAY’S WORK 2014 AWARDS
In 2014, history repeated itself as AGCO
worked with other industry partners to enable
Manon Ossevoort (Tractor Girl) to fulfill a
lifelong goal of driving a tractor to the South
Pole. The feat reprised a similar one by
Sir Edmund Hillary, who made history by
driving a Ferguson TE20 tractor fitted with
tracks to the South Pole in 1958 – the first
time it was ever done. Massey Ferguson was
the official tractor supplier to Antarctica2. We
provided a 110-horsepower MF 5610,
specially prepared to weather the harsh
conditions. AGCO Parts sent a stock of spare
parts for essential maintenance during the
mission, and Fuse Technologies provided a
special version of AgCommand® to track
and monitor the tractor’s performance.
Learn more at www.antarcticatwo.com.
Prior to its successful overland trek to the South Pole, the MF 5610 tractor underwent extensive cold-weather testing.
AGCO2014
AWARDS
2014 Women in Manufacturing STEP (Science, Technology, Engineering and Production) Award – Washington, D.C., U.S.- Erin Cuellar, Production Supervisor, Beloit, KS, U.S. - Carla Gasparin, Manager, Product Management, ATS Integration/Harvesting, Duluth, GA, U.S. - Peggy Gulick, Director, Continuous Improvement, Jackson, MN, U.S. - Kitae Kim, Global Sustainability Manager, Duluth, GA, U.S.
Challenger MT700E Series, AE50 – Outstanding Innovations Award American Society of Agricultural and Biological Engineers
Challenger MT775E Tracked Tractor – Tractor of the Year FinalistEIMA 2014 International Agricultural and Gardening Machinery Exhibition – Bologna, Italy
Challenger MT800E Steerable 3-Point Hitch – Technical Innovation Award EIMA 2014 International Agricultural and Gardening Machinery Exhibition – Bologna, Italy
Fendt 933 Vario Profi Plus – Silver MedalAGROSALON – Moscow, Russia
Fendt New Flat-Sealing Hydraulic Coupling System and Integrated Tyre Pressure Regulation System VarioGrip – Novedad Técnica FIMA – Zaragoza, Spain
Fendt 800 Vario Tractor Tier 4 Final and Fendt 9490 X Combine – Innovation Award Polagra-Premiery International Fair of Agricultural Mechanization – Poznan, Poland
AGCO’s Fuse Technologies and Sustainability – The New Economy Award 2014 Cleantech: Best Agribusiness and Agricultural Solutions
Massey Ferguson MF 8737 Tractor – Tractor of the Year Finalist EIMA 2014 International Agricultural and Gardening Machinery Exhibition – Bologna, Italy
Massey Ferguson MF 9812 Planter and MF 5611 Tractor – International Premium Awards AGROmashExpo – Budapest, Hungary
Massey Ferguson MF 5612 Tractor – Gold Medal Polagra-Premiery International Fair of Agricultural Mechanization – Poznan, Poland
Massey Ferguson MF 6600 Tractor – Silver Award IMMA Awards (International Machinery Manufacturers Awards), Cereals Event – Nr Lincoln, Lincs, UK
Agricultural Machinery TOP50 Awards- Massey Ferguson MF 7624 Tractor – Comprehensive Golden Award- Massey Ferguson MF 1844N Small Square Baler – Market Leading Award
China Association of Agricultural Machinery Manufacturers (CAAMM), the Chinese Society for Agricultural Machinery (CSAM) and Farm Machinery Magazine – Tianjin, China
Massey Ferguson MF 7180 Tractor – Tractor of the Year 2014 Award, Special CategoryAgrishow – São Paulo, Brazil
Valtra A750 Tractor – Gerdau Melhores da Terra 2014 AwardExpointer – Rio Grande do Sul, Brazil
Valtra’s N103.4 HiTech Dual Fuel Tractor – Silver MedalAGROSALON – Moscow, Russia
Valtra S Series Tractor with TwinTrac – Exhibition MedalKa Pasesi – Kaunas, Lithuania
Valtra S354 Tractor – Gold MedalPolagra-Premiery International Fair of Agricultural Mechanization – Poznan, Poland
Valtra T Series Tractor – New Product AwardAgromek Show – Herning, Denmark
A sampling of honors for AGCO products and people

26 27
2014
Net cash provided by operating activities $ 438.4
Less:
Capital expenditures (301.5)
Free cash flow $ 136.9
2014 2013 2012 2011 2010
Net income per common share — diluted $ 4.36 $ 6.01 $ 5.30 $ 5.95 $ 2.29
Restructuring and other infrequent expenses (2)(3) 0.34 — — — 0.03
Tax adjustments (4) — — (0.27) — —
Impairment charge (2)(5) — — 0.22 — —
GSI acquisition (2)(6) — — — (1.47) —
Net income per common share — adjusted $ 4.70 $ 6.01 $ 5.25 $ 4.48 $ 2.32
Years Ended December 31 (in millions, except per share amounts) 2014 2013 2012 2011 2010
Operating Data:
Net sales $ 9,723.7 $ 10,786.9 $ 9,962.2 $ 8,773.2 $ 6,896.6
Gross profit 2,066.3 2,390.6 2,123.2 1,776.1 1,258.7
Income from operations 646.5 900.7 693.2 610.3 324.2
Net income 404.2 592.3 516.4 585.3 220.2
Net loss (income) attributable to noncontrolling interests 6.2 4.9 5.7 (2.0) 0.3
Net income attributable to AGCO Corporation and subsidiaries $ 410.4 $ 597.2 $ 522.1 $ 583.3 $ 220.5
Net income per common share — diluted $ 4.36 $ 6.01 $ 5.30 $ 5.95 $ 2.29
Cash dividends declared and paid per common share $ 0.44 $ 0.40 $ — $ — $ —
Weighted average shares outstanding — diluted 94.2 99.4 98.6 98.1 96.4
As of December 31 (in millions, except number of employees) 2014 2013 2012 2011 2010
Balance Sheet Data:
Cash and cash equivalents $ 363.7 $ 1,047.2 $ 781.3 $ 724.4 $ 719.9
Total assets 7,395.9 8,438.8 7,721.8 7,257.2 5,436.9
Total long-term debt, excluding current portion 997.6 938.5 1,035.6 1,409.7 443.0
Stockholders’ equity 3,496.9 4,044.8 3,481.5 3,031.2 2,659.2
Other Data:
Number of employees 20,828 22,111 20,320 19,294 14,740
The Consolidated Statements of Operations should be read in conjunction with the Company’s Management’s Discussion and Analysis of Financial Condition and Results of Operations and the Company’s audited Consolidated Financial Statements and the accompanying Notes to Consolidated Financial Statements, which are included in the Company’s Annual Report on Form 10-K.
SELECTED FINANCIAL DATA
Years Ended December 31 2014 2013 2012
Net sales $ 9,723.7 $ 10,786.9 $ 9,962.2
Cost of goods sold 7,657.4 8,396.3 7,839.0
Gross profit 2,066.3 2,390.6 2,123.2
Selling, general and administrative expenses 995.4 1,088.7 1,041.2
Engineering expenses 337.0 353.4 317.1
Restructuring and other infrequent expenses 46.4 — —
Impairment charge — — 22.4
Amortization of intangibles 41.0 47.8 49.3
Income from operations 646.5 900.7 693.2
Interest expense, net 58.4 58.0 57.6
Other expense, net 49.1 40.1 34.8
Income before income taxes and equity in net earnings of affiliates 539.0 802.6 600.8
Income tax provision 187.7 258.5 137.9
Income before equity in net earnings of affiliates 351.3 544.1 462.9
Equity in net earnings of affiliates 52.9 48.2 53.5
Net income 404.2 592.3 516.4
Net loss attributable to noncontrolling interests 6.2 4.9 5.7
Net income attributable to AGCO Corporation and subsidiaries $ 410.4 $ 597.2 $ 522.1
Net income per common share attributable to AGCO Corporation and subsidiaries:
Basic $ 4.39 $ 6.14 $ 5.38
Diluted $ 4.36 $ 6.01 $ 5.30
Cash dividends declared and paid per common share $ 0.44 $ 0.40 $ —Weighted average number of common and common equivalent
shares outstanding:Basic 93.4 97.3 97.1
Diluted 94.2 99.4 98.6
CONSOLIDATED STATEMENTS OF OPERATIONS(in millions, except per share data)
(2) After tax. (3) The restructuring and other infrequent expenses recorded during 2014 related primarily to severance and other related costs associated with the rationalization of the Company’s
operations in the United States, Brazil, Argentina, Europe and China. (4) During the fourth quarter of 2012, the Company recorded a non-cash tax gain associated with the recognition of certain U.S. deferred tax assets from the reversal of its U.S. deferred
tax valuation allowance and the recognition of certain U.S. research and development tax credits.(5) During the fourth quarter of 2012, the Company recorded an impairment charge of approximately $22.4 million with respect to goodwill and certain other identifiable intangible
assets associated with the Company’s Chinese harvesting business.(6) During 2011, the Company recorded a tax benefit of approximately $149.3 million and acquisition expenses of approximately $5.8 million associated with the GSI acquisition.
The above notes are more fully described in the Company’s audited Consolidated Financial Statements and Notes to its Consolidated Financial Statement, which are included in the Company’s Annual Report on Form 10-K.
The following is a reconciliation of free cash flow to net cash provided by operating activities for the year ended December 31, 2014 (in millions):
(1) The Company makes reference to adjusted earnings per share, as reconciled below:

28 29
Years Ended December 31 2014 2013 2012
Cash flows from operating activities:
Net income $ 404.2 $ 592.3 $ 516.4Adjustments to reconcile net income to net cash provided by operating activities:
Depreciation 239.4 211.6 180.6Deferred debt issuance cost amortization 2.7 3.5 3.5Impairment charge — — 22.4Amortization of intangibles 41.0 47.8 49.3Amortization of debt discount — 9.2 8.7Stock compensation (credit) expense (10.8) 34.6 36.8Equity in net earnings of affiliates, net of cash received (25.4) (19.0) (25.7)Deferred income tax provision (benefit) 3.6 21.7 (36.4)Other 2.5 0.3 0.6Changes in operating assets and liabilities, net of effects from purchase of businesses:
Accounts and notes receivable, net (103.9) (36.2) 40.6Inventories, net 111.4 (356.9) (160.9)Other current and noncurrent assets 29.1 7.0 (71.8)Accounts payable (219.4) 54.7 (61.7)Accrued expenses (71.2) 123.4 154.5Other current and noncurrent liabilities 35.2 103.0 9.5
Total adjustments 34.2 204.7 150.0Net cash provided by operating activities 438.4 797.0 666.4
Cash flows from investing activities:Purchases of property, plant and equipment (301.5) (391.8) (340.5)Proceeds from sale of property, plant and equipment 2.8 2.6 0.9Purchase of businesses, net of cash acquired (130.3) (9.5) (2.9)Investments in consolidated affiliates, net of cash acquired — — (20.1)Investments in unconsolidated affiliates (3.9) (10.0) (15.8)Restricted cash and other — — 3.7
Net cash used in investing activities (432.9) (408.7) (374.7)
Cash flows from financing activities:Proceeds from debt obligations 1,689.4 1,135.9 926.3Repayments of debt obligations (1,588.8) (1,194.0) (1,148.8)Purchases and retirement of common stock (499.7) (1.0) (17.6)Repurchase or conversion of convertible senior subordinated notes (201.2) — —Payment of dividends to stockholders (40.8) (38.9) —Payment of minimum tax withholdings on stock compensation (13.2) (17.0) (0.3)Purchase of or distribution to noncontrolling interests (6.1) (3.1) (1.0)Payment of debt issuance costs (1.4) (0.1) (0.2)Excess tax benefit related to stock compensation — 11.4 —Other (0.2) — —
Net cash used in financing activities (662.0) (106.8) (241.6)Effects of exchange rate changes on cash and cash equivalents (27.0) (15.6) 6.8(Decrease) increase in cash and cash equivalents (683.5) 265.9 56.9Cash and cash equivalents, beginning of year 1,047.2 781.3 724.4Cash and cash equivalents, end of year $ 363.7 $ 1,047.2 $ 781.3
The Consolidated Statements of Cash Flows should be read in conjunction with the Company’s Management’s Discussion and Analysis of Financial Condition and Results of Operations and the Company’s audited Consolidated Financial Statements and the accompanying Notes to Consolidated Financial Statements, which are included in the Company’s Annual Report on Form 10-K.
December 31 2014 2013
ASSETS
Current Assets:
Cash and cash equivalents $ 363.7 $ 1,047.2
Accounts and notes receivable, net 963.8 940.6
Inventories, net 1,750.7 2,016.1
Deferred tax assets 217.2 241.2
Other current assets 232.5 272.0
Total current assets 3,527.9 4,517.1
Property, plant and equipment, net 1,530.4 1,602.3
Investment in affiliates 424.1 416.1
Deferred tax assets 25.8 24.4
Other assets 141.1 134.6
Intangible assets, net 553.8 565.6
Goodwill 1,192.8 1,178.7
Total assets $ 7,395.9 $ 8,438.8
LIABILITIES AND STOCKHOLDERS’ EQUITY
Current Liabilities:
Current portion of long-term debt $ 94.3 $ 110.5
Convertible senior subordinated notes — 201.2
Accounts payable 670.2 960.3
Accrued expenses 1,244.1 1,389.2
Other current liabilities 208.3 150.8
Total current liabilities 2,216.9 2,812.0
Long-term debt, less current portion 997.6 938.5
Pensions and postretirement health care benefits 269.0 246.4
Deferred tax liabilities 238.8 251.2
Other noncurrent liabilities 176.7 145.9
Total liabilities 3,899.0 4,394.0
Commitments and contingencies
Stockholders’ Equity:
AGCO Corporation stockholders’ equity:Preferred stock; $0.01 par value, 1,000,000 shares authorized, no shares issued or outstanding in 2014 and 2013 — —
Common stock; $0.01 par value, 150,000,000 shares authorized, 89,146,093 and 97,362,466 shares issued and outstanding at December 31, 2014 and 2013, respectively 0.9 1.0
Additional paid-in capital 582.5 1,117.9
Retained earnings 3,771.6 3,402.0
Accumulated other comprehensive loss (906.5) (510.7)
Total AGCO Corporation stockholders’ equity 3,448.5 4,010.2
Noncontrolling interests 48.4 34.6
Total stockholders’ equity 3,496.9 4,044.8
Total liabilities and stockholders’ equity $ 7,395.9 $ 8,438.8
The Consolidated Balance Sheets should be read in conjunction with the Company’s Management’s Discussion and Analysis of Financial Condition and Results of Operations and the Company’s audited Consolidated Financial Statements and the accompanying Notes to Consolidated Financial Statements, which are included in the Company’s Annual Report on Form 10-K.
CONSOLIDATED STATEMENTS OF CASH FLOWS(in millions)
CONSOLIDATED BALANCE SHEETS(in millions, except share amounts)

30 31
Balance, December 31, 2011 97,194,732 $ 1.0 $ 1,073.2 $ 2,321.6 $ (240.2) $ (156.1) $ (4.3) $ (400.6) $ 36.0 $ 3,031.2 $ —Net income (loss) — — — 522.1 — — — — 3.0 525.1 (8.7)Issuance of restricted stock 13,986 — 1.0 — — — — — — 1.0Stock options and SSARs exercised 16,287 — (0.3) — — — — — — (0.3)Stock compensation — — 35.8 — — — — — — 35.8Investments by redeemable noncontrolling interest — — — — — — — — — — 17.6Distribution to noncontrolling interest — — — — — — — — (1.7) (1.7)Changes in noncontrolling interests — — — — — — — — (4.0) (4.0)Purchases and retirement of common stock (409,007) — (17.6) — — — — — — (17.6)Defined benefit pension plans, net of taxes:
Prior service cost arising during year — — — — (2.5) — — (2.5) — (2.5)Net actuarial loss arising during year — — — — (28.2) — — (28.2) — (28.2)Amortization of prior service cost included in net periodic pension cost — — — — 0.4 — — 0.4 — 0.4Amortization of net actuarial losses included in net periodic pension cost — — — — 7.6 — — 7.6 — 7.6
Deferred gains and losses on derivatives, net — — — — — — 5.0 5.0 — 5.0Reclassification to temporary equity – Equity component of convertible senior subordinated notes — — (9.2) — — — — — — (9.2) 9.2Change in cumulative translation adjustment — — — — — (61.1) — (61.1) — (61.1) (1.6)Balance, December 31, 2012 96,815,998 1.0 1,082.9 2,843.7 (262.9) (217.2) 0.7 (479.4) 33.3 3,481.5 16.5Net income (loss) — — — 597.2 — — — — 4.4 601.6 (9.3)Payment of dividends to shareholders — — — (38.9) — — — — — (38.9)Issuance of restricted stock 12,059 — 0.6 — — — — — — 0.6Issuance of performance award stock 491,692 — (14.7) — — — — — — (14.7)SSARs exercised 61,941 — (2.2) — — — — — — (2.2)Stock compensation — — 34.0 — — — — — — 34.0Excess tax benefit of stock awards — — 11.4 — — — — — — 11.4Conversion of 1¼% convertible senior subordinated notes 286 — — — — — — — — —Distribution to noncontrolling interest — — — — — — — — (3.1) (3.1)Changes in noncontrolling interest — — (2.3) — — — — — — (2.3) 2.3Purchases and retirement of common stock (19,510) — (1.0) — — — — — — (1.0)Defined benefit pension plans, net of taxes:
Net actuarial gain arising during year — — — — 45.2 — — 45.2 — 45.2Amortization of prior service cost included in net periodic pension cost — — — — 0.6 — — 0.6 — 0.6Amortization of net actuarial losses included in net periodic pension cost — — — — 10.7 — — 10.7 — 10.7
Deferred gains and losses on derivatives, net — — — — — — (0.9) (0.9) — (0.9)Reclassification to temporary equity – Equity component of convertible senior subordinated notes — — 9.2 — — — — — — 9.2 (9.2)Change in cumulative translation adjustment — — — — — (86.9) — (86.9) — (86.9) (0.3)Balance, December 31, 2013 97,362,466 1.0 1,117.9 3,402.0 (206.4) (304.1) (0.2) (510.7) 34.6 4,044.8 —Net income (loss) — — — 410.4 — — — — 0.1 410.5 (6.3)Payment of dividends to shareholders — — — (40.8) — — — — — (40.8)Issuance of restricted stock 14,907 — 0.9 — — — — — — 0.9Issuance of performance award stock 367,100 — (11.8) — — — — — — (11.8)SSARs exercised 30,477 — (1.2) — — — — — — (1.2)Stock compensation — — (11.7) — — — — — — (11.7)Shortfall in tax benefit of stock awards — — (0.2) — — — — — — (0.2)Conversion of 1¼% convertible senior subordinated notes 1,437,465 — — — — — — — — —Investment by noncontrolling interest — — — — — — — — 16.1 16.1Distribution to noncontrolling interest — — — — — — — — (2.4) (2.4)Changes in noncontrolling interest — — (11.8) — — — — — — (11.8) 6.6Purchases and retirement of common stock (10,066,322) (0.1) (499.6) — — — — — — (499.7)Defined benefit pension plans, net of taxes:
Net loss recognized due to settlement — — — — 0.4 — — 0.4 — 0.4Net gain recognized due to curtailment — — — — (0.4) — — (0.4) — (0.4)Net actuarial loss arising during year — — — — (54.8) — — (54.8) — (54.8)Amortization of prior service cost included in net periodic pension cost — — — — 0.6 — — 0.6 — 0.6Amortization of net actuarial losses included in net periodic pension cost — — — — 7.3 — — 7.3 — 7.3
Deferred gains and losses on derivatives, net — — — — — — 0.1 0.1 — 0.1Change in cumulative translation adjustment — — — — — (349.0) — (349.0) — (349.0) (0.3)Balance, December 31, 2014 89,146,093 $ 0.9 $ 582.5 $ 3,771.6 $ (253.3) $ (653.1) $ (0.1) $ (906.5) $ 48.4 $ 3,496.9 $ —
Common Stock Accumulated Other Comprehensive Loss
Shares AmountAdditional
Paid-in CapitalRetained Earnings
Defined Benefit Pension Plans
Cumulative Translation Adjustment
Deferred (Losses) Gains on
Derivatives
Accumulated Other
Comprehensive Loss
Noncontrolling Interests
Total Stockholders’
EquityTemporary
Equity
The Consolidated Statements of Stockholders’ Equity should be read in conjunction with the Company’s Management’s Discussion and Analysis of Financial Condition and Results of Operations and the Company’s audited Consolidated Financial Statements and the accompanying Notes to Consolidated Financial Statements, which are included in the Company’s Annual Report on Form 10-K.
CONSOLIDATED STATEMENTS OF STOCKHOLDERS’ EQUITY(in millions, except share amounts)

32
FORWARD-LOOKING STATEMENTS
This annual report includes forward-looking statements,
including the statements in the Chairman’s Message
and other statements in this report regarding market
demand, population growth, farm productivity, new product
and technology introductions, strategic initiatives and
their effects, energy savings, cash flows, credit rating
maintenance, dividend growth, margin performance and
general economic conditions. These statements are subject
to risks that could cause actual results to differ materially
from those suggested by the statements, including:
Our financial results depend entirely upon the agricultural
industry, and factors that adversely affect the agricultural
industry generally, including declines in the general economy,
increases in farm input costs, lower commodity prices and
changes in the availability of credit for our retail customers,
will adversely affect us. The poor performance of the general
economy has adversely impacted our sales and may continue
to have an adverse impact on our sales in the future, the
extent of which we are unable to predict, and there can
be no assurance that our results will not continue to be
affected by the weakness in global economic conditions.
Our success depends on the introduction of new products,
which requires substantial expenditures and may not be
well received in the marketplace.
We face significant competition, and if we are unable to
compete successfully against other agricultural equipment
manufacturers, we would lose customers and our revenues
and profitability would decline.
Most of our sales depend on the retail customers’ obtaining
financing, and any disruption in their ability to obtain financing,
whether due to economic downturns or otherwise, will
result in the sale of fewer products by us. A large portion
of the retail sales of our products is financed by our retail
finance joint ventures with Rabobank, and any difficulty
on Rabobank’s part to fund the venture would adversely
impact sales if our customers would be required to utilize
other retail financing providers. We depend on suppliers for
raw materials, components and parts for our products, and
any failure by our suppliers to provide products as needed,
or by us to promptly address supplier issues, will adversely
impact our ability to timely and efficiently manufacture
and sell products.
A majority of our sales and manufacturing takes place outside
the United States, and, as a result, we are exposed to risks
related to foreign laws, taxes, economic conditions, labor
supply and relations, political conditions and governmental
policies. These risks may delay or reduce our realization of
value from our international operations.
Volatility with respect to currency exchange rates and
interest rates can adversely affect our reported results
of operations and the competitiveness of our products.
We are subject to extensive environmental laws and
regulations, and our compliance with, or our failure to comply
with, existing or future laws and regulations could delay
production of our products or otherwise adversely affect
our business.
We are subject to raw material price fluctuations, which
can adversely affect our manufacturing costs.
We disclaim any obligation to update forward-looking
statements except as required by law.
© 2015 AGCO CorporationAll rights reserved. Incorporated in Delaware. An Equal Opportunity Employer.AGCO®, Fendt®, GSI®, Massey Ferguson®, Valtra® and their respective logos as well as corporate and product identity used herein are trademarks of AGCO or its subsidiaries and may not be used without permission. Challenger® is a registered trademark of Caterpillar, Inc. and may not be used without permission.
Performance Graph The graph shown (above) is a line graph presentation of the Company’s cumulative stockholder returns on an indexed basis as compared to the S&P Mid-Cap 400 Index and a self-constructed peer group of the companies listed in footnote 1 to the performance graph (“Peer Group”). Returns for the Company in the graph are not necessarily indicative of future performance.
Assumes $100 invested on January 1, 2009. Assumes dividends reinvested. Year ending December 31, 2014.(1) Based on information for a self-constructed peer group of companies that includes: Caterpillar Inc., CNH Industrial NV, Cummins Inc., Deere & Company, Eaton Corporation Plc.,
Ingersoll-Rand Plc., Navistar International Corporation, PACCAR Inc., Parker-Hannifin Corporation and Terex Corporation.
Comparison of Cumulative Total Return
350
300
250
200
150
100
50
02009 2010 2011 2012 2013 2014
AGCO Corporation
US$
Custom Peer Group1
S&P Midcap 400 Index
SHAREHOLDER INFORMATION
Corporate Headquarters4205 River Green ParkwayDuluth, Georgia 30096 U.S.+1-770-813-9200
Transfer Agent & RegistrarComputershare Trust Company, N.A.211 Quality Circle, Suite 210College Station, Texas 77845 U.S. +1-800-962-4284
Stock ExchangeAGCO Corporation common stock (trading symbol is “AGCO”) is traded on the New York Stock Exchange.
Independent Registered Public Accounting FirmKPMG LLPAtlanta, Georgia U.S.
Form 10-KThe Form 10-K Annual Report filed with the Securities and Exchange Commission is available in the “Investors” Section of our corporate website (www.agcocorp.com), under the heading “SEC Filings,” or upon request from the Investor Relations Department at corporate headquarters.
Annual MeetingThe annual meeting of the Company’s stockholders will be held at 9:00 a.m. ET on April 23, 2015 at the offices of AGCO Corporation, 4205 River Green Parkway, Duluth, Georgia 30096 U.S.
Follow us on Twitter @agcocorp.
33

ALL IN A DAY’S WORK
4205 River Green ParkwayDuluth, GA 30096
(770) 813-9200www.AGCOcorp.com
AGCO AGCO AGCOAGCO AGCO AGCO AGCO AGCO
AGCO AGCO AGCOAGCO AGCO AGCO AGCO AGCO
AGCO AGCO AGCO AGCO AGCO AGCO AGCO
AGCO AGCO AGCO AGCO AGCO AGCO AGCO AGCO
AGCO AGCO AGCO AGCO AGCO AGCO AGCO AGCO
AGCO AGCO AGCO AGCO AGCO AGCO AGCO AGCO
AGCO AGCO AGCO AGCO AGCO AGCO AGCO AGCO
AGCO AGCO AGCOAGCO AGCO AGCO AGCO AGCO
AGCO AGCO AGCO AGCO AGCO AGCO AGCO AGCO
AGCO AGCO AGCO AGCO AGCO AGCO AGCO AGCO
AGCO AGCO AGCO AGCO AGCO AGCO AGCO AGCO
AGCO AGCO AGCO AGCO AGCO AGCO AGCO AGCO
AGCO AGCO AGCO AGCO AGCO AGCO AGCO AGCO
AGCO AGCO AGCOAGCO AGCO AGCO AGCO AGCO
AGCO AGCO AGCO AGCO AGCO AGCO AGCO AGCO
AGCO AGCO AGCO AGCO AGCO AGCO AGCO AGCO
AGCO AGCO AGCO AGCO AGCO AGCO AGCO AGCO
AGCO AGCO AGCO AGCO AGCO AGCO AGCO AGCO
AGCO AGCO AGCO AGCO AGCO AGCO AGCO AGCO
AGCO AGCO AGCOAGCO AGCO AGCO AGCO AGCO
AGCO
ALL IN A DAY’S WORKAGCO AGCO AGCO ALL IN A DAY’S WORKAGCO AGCO AGCO AGCO AGCO AGCO AGCO AGCOALL IN A DAY’S WORKAGCO AGCO AGCO AGCO AGCO ALL IN A DAY’S WORKALL IN A DAY’S WORK
2014 ANNUAL REPORT