Alkali feldspars: Structural state determined from ... · feldspar can be properly interpreted only...
12
American Mineralogist, Volume 7I, pages1285-1296, 1986 Alkali feldspars:Structural state determined from composition and optic axial angle2V Snu-CnuN Su,r P.Lur- H. Rrnrr, F. DoNr,o Br,oss Department of Geological Sciences, Virginia Polytechnic Institute and StateUniversity, Blacksburg, Virgrnia 24061, U.S.A. AssrRAcr For the entire homogeneous alkali feldsparseries, the Al content (>tr) of the T, tetrahedral sites is a measureof structural state: >tl = 2t, for monoclinic and 2t, = (t,o * t,m) for triclinic specimens. >tr can be conveniently estimated from V* (one-half of the optic axial arryle 2V") and Xo. (mole fraction of KAlSi,Or) by using a simple determinative diagram or the equation s+- zLl - bo + btxo, I brXo,sinzV*'f brsin2V* ao+ atxo,+ arXo,sin2V*l arsin2V*' Three sets of coefficients(multiplied by 1000 in the following table) account for three regions of 2Vr-Xo, space:caseA, Xo, < 0.6; case B, X* ) 0.6 and O.A.P. (optic axial plane) perpendicular or approximately perpendicular to (010); and caseC, X", > 0.6 and O.A.P. parallelto (010). Case as at d2 d3 bo b, b2 b3 A 4.08 -2.35 0.95 -r.28 r.52 -0.18 -r.74 2.88 B r.69 1.63 -2.33 0.69 0.1 l 2.r7 -2.70 3.46 c -r.69 -1.63 -0.70 2.38 -0.11 -2.17 -0.53 3.57 Testedusing data for 109 alkali feldspars whose2t, values were independentlyestimated from lattice parametersand/or mean T-O bond lengths from crystal-structureanalyses, this model estimates >tr within +0.02 for 830/o and +0.04 for 970lo of them. This precision is the same as that from various models that rely on lattice parametersfor estimation of )1,, e.9., b-c, b-C,20(060)-20(204) merhods, etc. The model was developed by assuming that the principal refractive indices-symbolized as na,nb, and n. and defined as the principal refractive indices for light vibrating parallel or nearly parallel to crystallographicaxes a, b, and c, respectively-vary linearly with >1, for the high sanidine-low microcline series and for the low albite-high albite (or analbite) series. However, for the high albite-high sanidine solid-solution series, as well as the low albite-low microcline series, neither density nor principal refractive indices vary linearly across the entire composition range, but they closely approached linearity in segments between 0.0 < Xo. < 0.6 and 0.6 < Xo. s 1.0. INrnooucrroN Quantitative measures of the structural state of alkali feldsparshave been employed in geologicinvestigations for many years. Kroll and Ribbe (1983, p. 95) listed 30 studies in the period 1975 to 1982 thar involved use of unit-cell parameters for that purpose.Wright and Stewart (1968) introduced the now familiar b-c plot, which was quantified by Stewart and Ribbe (1969) in terms of >t, : 21, or (t,o + t,m), depending on whether the feldspar is monoclinic C2/ m or ticlinic CT. [The symbolst,, t,o, and t,m indicate the fractional Al content of the T,, T,O, and T,m tetrahedralsites in the structure ofthe alkali feldspar.l Kroll and Ribbe (in prep.) have summarized the more ' Permanentaddress: Institute of Geology, ChineseAcademy ofSciences,Beijing, the People's Republic ofChina. recentequations for determining structural statefrom lat- tice parameters. However, separating feldsparfrom rocks and indexing X-ray powder-difraction patterns for least- squaresrefinement of unit-cell parametersis tedious at best.Short cuts involving d-spacings ofa certain few peaks in a powder pattern were introduced by Hewlett (1959), refined by Wright (1968), and have been put in equation form by Kroll and Ribbe (in prep.). All the while and for decades preceding the development of X-ray methods, use of optic axial angle 2V as a quantitative measureof structural state (where composition is known) has tanta- lized petrologists.Stewart (1974) concluded that 2V de- pended "on the Al content of the T, sites" (21,) in iso- compositional series, and Su et al. (1984) confirmed this quantitatively for the K-rich low microcline-high sanidine series. The very careful work of Bertelmann et al. (1985) 0003404x/86/l I l2-l 285$02.00 I 285
Transcript of Alkali feldspars: Structural state determined from ... · feldspar can be properly interpreted only...
American Mineralogist, Volume 7 I, pages 1285-1296, 1986
Alkali feldspars: Structural state determined from composition andoptic axial angle 2V
Snu-CnuN Su,r P.Lur- H. Rrnrr, F. DoNr,o Br,ossDepartment of Geological Sciences, Virginia Polytechnic Institute and State University, Blacksburg, Virgrnia 24061, U.S.A.
AssrRAcr
For the entire homogeneous alkali feldspar series, the Al content (>tr) of the T, tetrahedralsites is a measure of structural state: >tl = 2t, for monoclinic and 2t, = (t,o * t,m) fortriclinic specimens. >tr can be conveniently estimated from V* (one-half of the optic axialarryle 2V") and Xo. (mole fraction of KAlSi,Or) by using a simple determinative diagramor the equation
s + -z L l -
bo + btxo, I brXo,sinzV*'f brsin2V*ao+ atxo,+ arXo,sin2V*l arsin2V*'
Three sets of coefficients (multiplied by 1000 in the following table) account for threeregions of 2Vr-Xo, space: case A, Xo, < 0.6; case B, X* ) 0.6 and O.A.P. (optic axialplane) perpendicular or approximately perpendicular to (010); and case C, X", > 0.6 andO.A.P. parallel to (010).
Case as at d2 d3 bo b, b2 b3
A 4.08 -2.35 0.95 -r .28 r .52 -0.18 -r .74 2.88B r .69 1.63 -2.33 0.69 0.1 l 2.r7 -2.70 3.46c - r .69 -1 .63 -0 .70 2 .38 -0 .11 -2 .17 -0 .53 3 .57
Tested using data for 109 alkali feldspars whose 2t, values were independently estimatedfrom lattice parameters and/or mean T-O bond lengths from crystal-structure analyses,this model estimates >tr within +0.02 for 830/o and +0.04 for 970lo of them. This precisionis the same as that from various models that rely on lattice parameters for estimation of)1,, e.9., b-c, b-C,20(060)-20(204) merhods, etc.
The model was developed by assuming that the principal refractive indices-symbolizedas na, nb, and n. and defined as the principal refractive indices for light vibrating parallelor nearly parallel to crystallographic axes a, b, and c, respectively-vary linearly with >1,for the high sanidine-low microcline series and for the low albite-high albite (or analbite)series. However, for the high albite-high sanidine solid-solution series, as well as the lowalbite-low microcline series, neither density nor principal refractive indices vary linearlyacross the entire composition range, but they closely approached linearity in segmentsbetween 0.0 < Xo. < 0.6 and 0.6 < Xo. s 1.0.
INrnooucrroN
Quantitative measures of the structural state of alkalifeldspars have been employed in geologic investigationsfor many years. Kroll and Ribbe (1983, p. 95) listed 30studies in the period 1975 to 1982 thar involved use ofunit-cell parameters for that purpose. Wright and Stewart(1968) introduced the now familiar b-c plot, which wasquantified by Stewart and Ribbe (1969) in terms of >t, :21, or (t,o + t,m), depending on whether the feldspar ismonoclinic C2/ m or ticlinic CT. [The symbols t,, t,o, andt,m indicate the fractional Al content of the T,, T,O, andT,m tetrahedral sites in the structure ofthe alkali feldspar.lKroll and Ribbe (in prep.) have summarized the more
' Permanent address: Institute of Geology, Chinese AcademyofSciences, Beijing, the People's Republic ofChina.
recent equations for determining structural state from lat-tice parameters. However, separating feldspar from rocksand indexing X-ray powder-difraction patterns for least-squares refinement of unit-cell parameters is tedious atbest. Short cuts involving d-spacings ofa certain few peaksin a powder pattern were introduced by Hewlett (1959),refined by Wright (1968), and have been put in equationform by Kroll and Ribbe (in prep.). All the while and fordecades preceding the development of X-ray methods,use of optic axial angle 2V as a quantitative measure ofstructural state (where composition is known) has tanta-lized petrologists. Stewart (1974) concluded that 2V de-pended "on the Al content of the T, sites" (21,) in iso-compositional series, and Su et al. (1984) confirmed thisquantitatively for the K-rich low microcline-high sanidineseries. The very careful work of Bertelmann et al. (1985)
0003404x/86/l I l2-l 285$02.00 I 285

- HA-HS reg ress ion l i nes- - - LA -LM ossumed l r ends
t286 SU ET AL,: ALKALI FELDSPARS-STRUCTURAL STATE FROM Xe AND 2Il
oq)()
E. E t s
o
(J
o l 5
(DE.
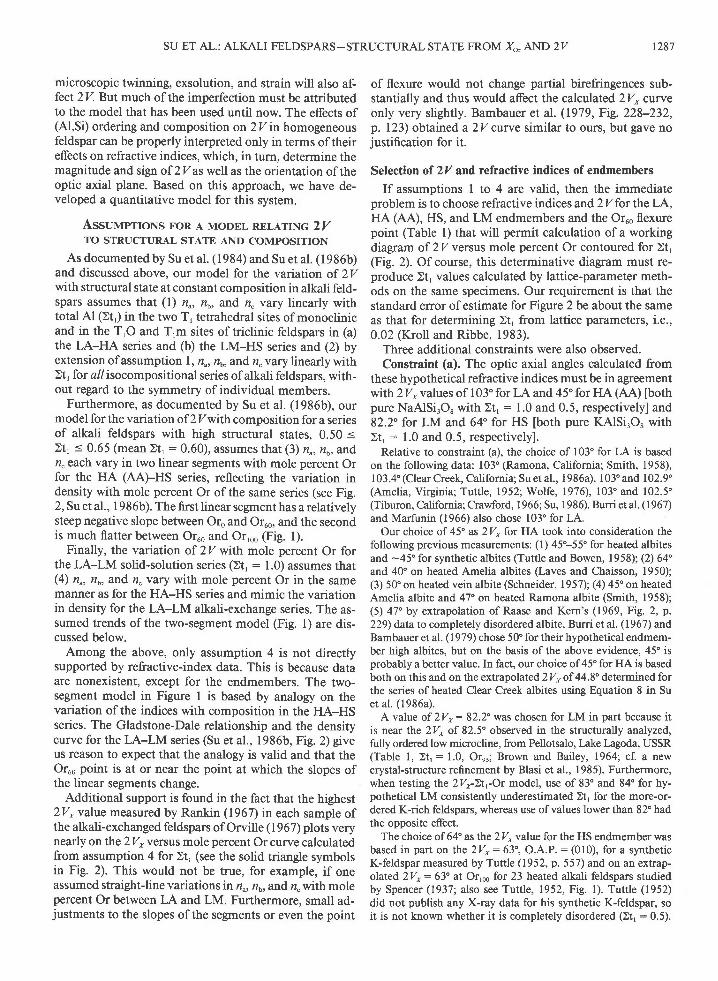
m o l % O rFig. 1. Variation trends ofrefractive indices ofalkali feldspars
vs. mole percent Or. Solid lines are the observed trends for HA-HS series with >tr :0.60 from Su et al. (1986b). Dashed linesare the assumed trends for LA-LM series with )t, : 1.00.
demonstrated the interdependence of composition, >tr,and 2V* for a limited range of monoclinic K-rich feld-spars, 0.69 - Xo, < 0.82.
This paper attempts to relate quantitatively the rela-tionships among compositions (Or), structural states ()t,)and optic axial angles (214 for the entire range of homo-geneous alkali feldspars. In order to do this, the opticalproperties of the limiting series around the periphery ofthe quadrilateral on a b-c plot-i.e., low albite-low mi-crocline (LA-LM) series, high albite (analbiteFhigh san-idine [HA (AAIHS] series, LA-HA (AA) series, and LM-HS series-were first established.
Optical properties of the limiting series ofalkali feldspars
The assumption that refractive indices vary linearly with2tr: 2t, or (t,o * t,m) in the LM-HS series was sub-stantiated by Su et al. (198a). Fortunately, for purposesof comparison with this order-disorder series, the refrac-tive indices of the LA-HA series were also found to varylinearly with >tr (Su et al., 1985, 1986a). Preliminaryoptical and X-ray investigation of the highly disorderedhigh albite-high sanidine (HA-HS) solid-solution series(Warner et al., 1984) led to somewhat misleading conclu-sions that since have been superseded by studies describedby Su et al. (1986b).
In all three ofthese studies, nn no, and ncwere definedas the principal refractive indices for light vibrating par-allel or nearly parallel to the a, b, and c crystallographicaxes, respectively (Su et al., 19841' Bloss, 1985). Accord-ingly , n^: n. for all alkali feldspars; fla : flp and n" : n,for those high-temperature, monoclinic, K-rich sanidineswhose optic axial planes (O.A.P.) are parallel to (0 l0); andflr: fl, and n. : nu for all the triclinic and some of themonoclinic alkali feldspars whose optic axial planes areperpendicular or approximately perpendicular to (010).Use ofthe symbols n", no, and n.forthe principal refractive
indices obviates the confusion that has long surroundedthe variation ofoptical properties ofdifferent series in thesystem NaAISi3Os-KAlSi3O'. It has been particularly use-ful in delineating the variation of the optic axial angle 2V,which must vary sigmoidally with >tr if the refractiveindices vary linearly with >tr within an isocompositionalorder-disorder series or if they vary linearly with molepercent Or within an alkali-exchange or a solid-solutionseries offeldspars that have a particular structural state.
The LA-LM solid-solution series has eluded detailedoptical investigation because no natural single crystalsexist except for nearly pure endmembers. However, 2Vhas been measured on a few minute grains of alkali-ex-changed specimens whose lattice parameters were deter-mined by X-ray powder diffractometry (Rankin, 1967, onspecimens of Orville, 1967). The assumptions involvedin arriving at a variation trend for the refractive indicesof this series relative to Or content will be discussed later.
Variation of2V with cornposition and structural state
The optic angle 2V is of particular interest for the alkalifeldspars. Minor substitutions of [(Ca,Ba,Sr) + Al] for
[(Na,K) + Si] and Fe3+ for Al all tend to increase therefractive indices (Hewlett, I 9 59; Plas, I 966; Smith, I 974),but efects on birefringences (and tfiis 2I) are relativelysmall. Although some scatter possibly due to these effectswas unaccounted for, Stewart (1974, updated by Stewartand Ribbe, 1983) found that a plot ofthe b and c unit-cell parameters for more than 80 alkali feldspars whose2V values were known could be contoured with straightlines for 2V rather well. Because the b-c plot has long beenestablished as a quantitative indicator of structural state(21,) for the entire range of alkali feldspars (Stewart andRibbe, 1969), it is obvious that there exists some 4zan-titative relationship among zv,>tr, and Or. This was im-plied by Tuttle (1952) and again by Hewlett (1959), bothof whom used optical data from Spencer (1937) as wellas their own.
Smith (1974, Fig. 8-5, p. 380) plotted 2v as a functionof mole percent Or for synthetic and for perthitic, non-perthitic, and heated natural alkali feldspars. In so doing,he traced the approximate location of the solvus androughly indicated (with straight lines) the limiting HA-HS and LA-LM series, as did Bambauer et al. (1979, Fig.223-232,p.123). Smith's Figure 8-6 (p. 383) summarizesthe 2 Zversus mole percent Or data of Wright and Stewart(1968) and Rankin (1967) for natural and ion-exchangedalkali feldspars. Smith asked, "Is it possible to go furtherand make a quantitative structural interpretation of the2V,Or diagam? Unquestionably, there is a strong ten-dency for the vertical position on the diagram to correlatewith Si,Al order-disorder, but it seems the correlation issomewhat imperfect." Certainly part of the imperfectionmay have resulted from compositional impurities and frompoorly characterized specimens [for example, wide rangesof 2V on grains from an alkali-exchanged powder mustindicate that either bulk composition and/or structuralstate differ from grain to grain (cf. Rankin, 1967)1. Sub-
microscopic twinning, exsolution, and strain will also af-fect 2V. But much of the imperfection must be attributedto the model that has been used until now. The effects of(Al,Si) ordering and composition on 2V in homogeneousfeldspar can be properly interpreted only in terms of theireffects on refractive indices, which, in turn, determine themagnitude and sign of 2V as well as the orientation of theoptic axial plane. Based on this approach, we have de-veloped a quantitative model for this system.
Assuvrr"rroNs FoR A MoDEL nor,.lrrNc 2ZTO STRUCTURAL STATE AND COMPOSITION
As documented by Su et al. (198a) and Su et al. (1986b)and discussed above, our model for the vaiation of 2Vwith structural state at constant composition in alkali feld-spars assumes that (l) nu, no, and n. vary linearly withtotal Al (21,) in the two T, teqahedral sites of monoclinicand in the T,O and T,m sites of triclinic feldspars in (a)the LA-HA series and (b) the LM-HS series and (2) byextension of assumption | , nu, no, and n.vary linearly with)t, for a//isocompositional series of alkali feldspars, with-out regard to the symmetry of individual members.
Furthermore, as documented by Su et al. (1986b), ourmodel for the variation of 2 Zwith composition for a seriesof alkali feldspars with high structural states, 0.50 <>tr < 0.65 (mean 21, : 0.60), assumes that (3) nu, no, andn.each vary in two linear segments with mole percent Orfor the HA (AAFHS series, reflecting the variation indensity with mole percent Or of the same series (see Fig.2, Su et al., 1986b). The first linear segment has a relativelysteep negative slope between Oro and Or.o, and the secondis much flatter between Oruo and Or,oo (Fig. l).
Finally, the variation of 2V wrth mole percent Or forthe LA-LM solid-solution series @t, : 1.0) assumes that(4) n^, nr, and n"vary with mole percent Or in the samemanner as for the HA-HS series and mimic the variationin density for the LA-LM alkali-exchange series. The as-sumed trends of the two-segment model (Fig. l) are dis-cussed below.
Among the above, only assumption 4 is not directlysupported by refractive-index data. This is because dataare nonexistent, except for the endmembers. The two-segment model in Figure I is based by analogy on thevariation of the indices with composition in the HA-HSseries. The Gladstone-Dale relationship and the densitycurve for the LA-LM series (Su et al., 1986b, Fig. 2) giveus reason to expect that the analogy is valid and that theOruo point is at or near the point at which the slopes ofthe linear segments change.
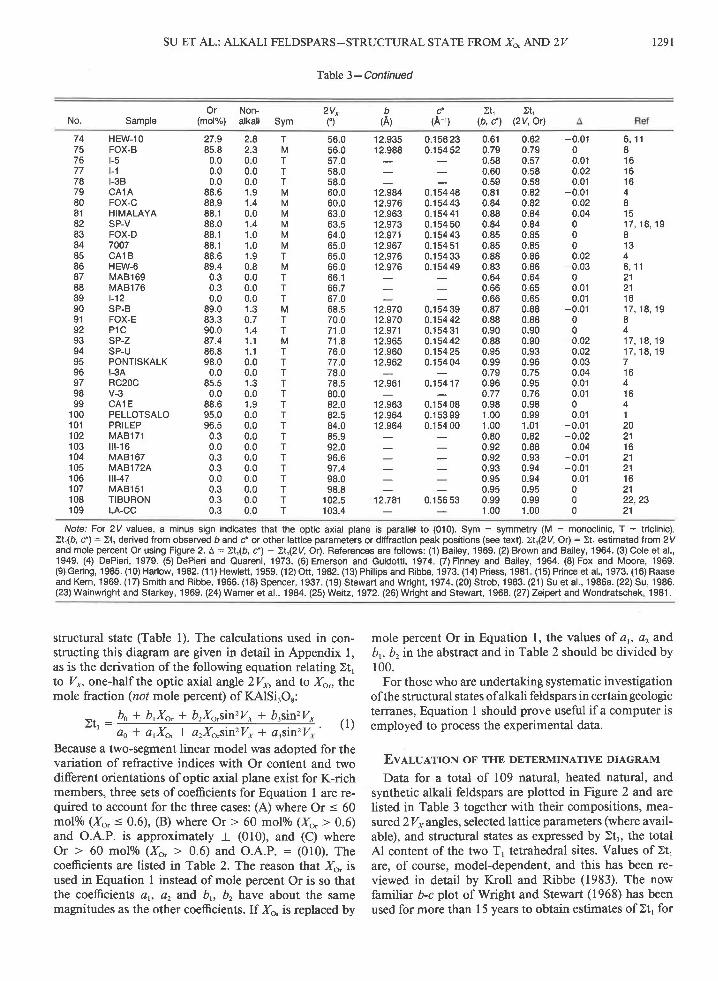
Additional support is found in the fact that the highest2V,value measured by Rankin (1967) in each sample ofthe alkali-exchanged feldspars of Orville (1967) plots verynearly on the 2 Z* versus mole percent Or curve calculatedfrom assumption 4 for 2t, (see the solid triangle symbolsin Fig. 2). This would not be true, for example, if oneassumed straight-line variations in nu, no,a\dn. with molepercent Or between LA and LM. Furthermore, small ad-justments to the slopes of the segments or even the point
r287
of flexure would not change partial birefringences sub-stantially and thus would affect the calculated 2V" cuweonly very slightly. Bambauer et al. (1979, Fig. 228-232,p. 123) obtained a 2V cuwe similar to ours, but gave nojustification for it.
Selection of 2V and refractive indices of endmembers
If assumptions I to 4 are valid, then the immediateproblem is to choose refractive indices and 2Vfor theLA,HA (AA), HS, and LM endmembers and the Oruo flexurepoint (Table l) that will permit calculation of a workingdiagram of 2 Z versus mole percent Or contoured for )t,(Fig. 2). Of course, this determinative diagram must re-produce )t, values calculated by lattice-parameter meth-ods on the same specimens. Our requirement is that thestandard error of estimate for Figure 2 be about the sameas that for determining )t, from lattice parameters, i.e.,0.02 (Kroll and Ribbe, 1983).
Three additional constraints were also observed.Constraint (a). The optic axial angles calculated from
these hypothetical refractive indices must be in agreementwith2V*values of 103'for LA and 45'for HA (AA) [bothpure NaAlSi.O8 urith )t, : 1.9 and 0.5, respectivelyl and82.2 for LM and 64'for HS [both pure KAlSi.O' with2t, : 1.6 and 0.5, respectively].
Relative to constraint (a), the choice of 103'for LA is basedon the following data: 103" (Ramona, California; Smith, 1958),I 03.4' (Clear Creek, California; Su et al., I 986a), I 03" and I 02.9'(Amelia, Virginia; Tuttle, 1952; Wolfe, 1976), 103" and 102.5'(Tiburon, California; Crauford, I 966; Su, 1 986). Burri et al . (1967)and Marfunin (1966) also chose 103" for LA.
Our choice of 45o as 2V* for HA took into consideration thefollowing previous measurements: (l) 45'-55'for heated albitesand -45'for synthetic albites (Tuttle and Bowen, 1958); (2) 64'and 40'on heated Amelia albites (Laves and Chaisson, 1950);(3) 50'on heated vein albite (Schneider,1957); (4) 45" on heatedAmelia albite and 47o on heated Ramona albite (Smith, 1958);(5) 47" by extrapolation of Raase and Kern's (1969, Fig. 2, p.229) data to completely disordered albite. Burri et al. (1967) andBambauer et al. (1979) chose 50" for their hypothetical endmem-ber high albites, but on the basis of the above evidence, 45' isprobably a better value. In fact, our choice of45" for HA is basedboth on this and on the extrapolated2V* of 44.8 determined forthe series ofheated Clear Creek albites using Equation 8 in Suet al. (1986a).
A value of zvr: 82.2' was chosen for LM in part because itis near the 2V, of 82.5" observed in the structurally analyzed,fiilly ordered low microcline, from Pellotsalo, Lake I-agoda, USSR(Table l, 2t,: 1.6, Or,,; Brown and Bailey, 1964; cf. a newcrystal-structure refinement by Blasi et a1., 1985). Furthermore,when testing the 2V,,-2t,-Or model, use of 83' and 84' for hy-pothetical LM consistently underestimated )t, for the more-or-dered K-rich feldspars, whereas use ofvalues lower than 82'hadthe opposite efect.
The choice of 64'as the 2V*value for the HS endmember wasbased in part on the 2V*: 63', O.A.P. : (010), for a syntheticK-feldspar measured by Tuttle (1952, p.557) and on an extrap-olated.2Vr:63" at Or'oo for 23 heated alkali feldspars studiedby Spencer (1937; also see Tuttle, 1952, Fig. l). Tuttle (1952)did not publish any X-ray data for his synthetic K-feldspar, soit is not known whether it is completely disordered (>tr : 0.5).
SU ET AL.: ALKALI FELDSPARS-STRUCTURAL STATE FROM Xo, AND 2Z

r 288
-80
-60
-40
-20
o
SU ET AL.: ALKALI FELDSPARS-STRUCTURAL STATE FROM X, AND 2Il
Monocl in icTr ic l in icOrv i l le (1967) LA-LM ser ies
o -
x
AI
9ot l
o-<o
oAA
oo-l
?
o-<o
aanrar rl,40 0.5
80
roo
t20
Spencer (1937) mentioned that some of the feldspars he heatedhad not reached equilibrium. Therefore, the 63o value might notrepresent a completely disordered HS endmember. Ultimately,the choice of 64o was made in the process of testing olur 2Vi-Ztr-Or model (as discussed below). It was found that if 63" is chosen,the model tends to underestimate slightly the )t, of sanidineswith O.A.P. : (010), i.e., the )1, values read from an early versionofFigure 2 were usually lower than )t, calculated from latticeparameters. However, if 64" is chosen, a noticeably (though onlyslightly) better fit resulted for sanidines.
Conshaint (b). Hypothetical nu, no, and n. values chosenfor each endmember must exactly reproduce the 2Vrval-ues in constraint (a) and agree with observed or extrap-olated refractive indices accepted for HA (AA), LA, LS,and LM to within the standard error of routine measure-ments.
Discussion of constraint (b) is complicated by the fact that the32 specimens in the HA-HS series investigated by Su et al. (1986b)have an average structural state of)tt:0.60 rather than 0.50for the (hypothetically) completely disordered series. The indicesfor the endmembers of the 2t, : 6.60 series are predicted fromthe regression equations given in Table 3 ofSu et al. (1986b),but the hypothetical values used in constructing Figure 2 (seeTable 1) had to be slightly adjusted from the predicted indices.Adjustments to the indices amount to 10.0003 or less and arewell within the standard errors of estimates of the regressionequations and also within twice the standard error (2o :0.0006)
for careful refractive-index measurement using conventionaldouble-variation methods.
For the LA-LM series, data are only available for the LA andLM endmembers. The refractive indices and the calctiated 2V*values chosen for the hypothetical LA are very close to the arith-metic means obtained for the four natural low albites listed as
^i::r--- 0.6
mol % OrFig. 2. Plot of 2V, versus mole percent Or contoured for )t,: AA : analbite, i.e., a disordered albite with t'o : trm and tzo :
trm, which will invert to monoclinic symmetry at temperatures above 980'C; other symbols as elsewhere in text. The 109 data fromTable I are plotted here. Solid triangles represent the largest 2V*valtte measured by Rankin (1967) on each ofthe compositions inthe LA-LM alkali-exchange series ofOrville (1967).

SU ET AL.: ALKALI FELDSPARS-STRUCTURAL STATE FROM Xe AND 2Z r289
Table 1. Optical data of some natural and heated alkali feldspars and extrapolated values for endmembers from other sources
(mol%) Description2V,f)
1 .00
0 9 9
1.00
0.3
0.5
0.8
1 . 1
0.0
6 0 0
95.0
98.0
100.0
0.0
0.0
60.0
60.0
100.0
100.0
0 .0
60.0
100.0
0.0
0.2
1 . 2
0.2
0.0
0.0
0.0
0 .0
0 .0
0.0
0.0
0.0
0.0
0.0
0.0
0.0
0 .0
0.0
103.4
't02.5
102.9
103.0
103.0
89.2
82.5
77.O
82.2
60.3
33.4
-44.1
45.0
-21 .4
-64.0
5
7 , 8
3 , 9
4
Low albiteClear Creak, CaliforniaLow albiteTiburon, CaliforniaLow albiteAmelia, VirginiaLow albiteRamona, CaliforniaLow albiteHypotheticalNa microclineHypotheticalLow microclinePEIIATSAIO, USSRLow microclinePontiskalk, SwitzerlandLow microclineHypotheticalHigh albiteExtrapolatedHigh albite (analbite)HypotheticalNa high sanidineExtrapolatedNa high sanidineHypotheticalHigh sanidineExtrapolatedHigh sanidineHypotheticalHigh albiteHypotheticalNa high sanidineHypotheticalHigh sanidineHypothetical
1 .5288(1)
1.5290(2)
1.5290(2)
1.s286(3)
1.5289
1 .5194
1 .51 78(?)
1 .51 78(?)
1 .5183
1.s276(8)
1.5276
1 s1 88(8)
1 .5186
1 .5179(8)
1.5176
1.5273
1 .5185
1.5174
1.5329(2)
1 .5331(2)
1.5330(2)
1.s326(3)
1.5329
1.5226
1.5217(?',)
1.5218(?l
1 5217
1.5345(6)
1.5344
1.5238(8)
1.5238
1.5225(81
1.5227
1.5348
't.5242
1.5229
1.5394(2)
1 .5395(1)
1.5388(2)
1.s388(3)
1.5393
1.5257
1.5247(?)
1.5243(?)
1.5243
1.5264(8)
1.5267
1.5242(91
1.5243
1.5217(S)
1s220
1.5361
't.5240
1.5214
1.00
1.00
1.00
0.99
1.00
0.60
0.60
0.60
0.60
U.bU
0.60
0.50
0.50
0.50
ivote.'These data are used as reference values in selecting retractive indices and optic angles of "hypothetical" endmembers or Ors members. Thevalues for the "hypothetical" reference points are the ones used to construct Figure 2. References are as Jollows: (1) Bailey, 1969. (2) Finney andBailey, 1964. (3) Harlow and Brown, 1980. (4) Smith, 1958. (5) Su et al., 1986a. (6) Su et al., 1986b. (7) Su, 1986. (8) Wainwright and Starkey, 1968.(9) Wolfe, 1976.
reference values in Table l. Only two sets ofrefractive indiceswere available for LM, one from the aforementioned Pellatsalomicrocline and the other from the Pontiskalk formation, Swit-zerland (>tr : 0.99, Orn,, Finney and Bailey, 1964). Since thecomposition of Pontiskalk microcline is closer to Or,oo, its ro andn" values were assigned to hypothetical LM. However, in orderto obtain a calculated 2V*of82.2', a hypothetical n" value hadto be chosen that is 0.0005 higher than that of the Pontiskalkmicrocline.
The index values for hypothetical HA and HS at >t, :9.56were obtained by linear extrapolation from LA and LM throughthe HA and HS points at 2t, : 9.60 (assumptions I and 2) toreproduce 2V*valtes of45'and 64". See Table 1.
Conshaint (c). Hypothetical n^, nb, and r?c values for theflexures at 0160 must agree within the related standarderors of estimates with those predicted by the regressionequations in Table 3 ofSu et al. (1986b) for the 2t, : 0.60series.
Constraint (c) was easily accommodated by the values listedin Table 1. However, the corresponding values for Oruo in the)t,: 1.6 series (Table l) were chosen rather subjectively fromthe LA-LM curves in Figure l. Their values were confirmed bythefactthat2Vx: 89o agrees reasonably well with Rankin's (1967)value of 86'for Orrr. The reference n^, n , and n" indices for Oruo
at )t, :0.5 were obtained by linear extrapolation of their re-spective values at >tr : 1.0 and 0.6, based on assumptions I and2 (see App. I for detailed mathematical treatments).
CoNsrnucuoN oF THE DETERMINATIvE DIAGRAM
A 2 Z" versus Or diagram (Fig. 2) was contoured for 2t,using the refractive indices for the hypothetical LA, HA(AA), HS, and LM endmembers and 0160 of low and high
Table 2. Coefficients of Equation 1 for calculating >tl from Xo,and 2vx
Coef-ficient Case A Case B Case C
26 0.004 08-0.002 35
0.000 95-0.001 28
0.001 52-0.000 18-0.00174
0.002 88
0.001 690.001 63
-0.002 330.000 69
0.000 110.00217
-0.002 700.003 46
-0.001 69-0.001 63-0.000 70
0.002 38-0.000 11-0.002 17-0.000 53
0.003 57b2
D3
Note.'Case A, Xo, < 0.6, case B, Xo. > 0.6 and O.A.P. (-) f (010),and case C, Xo, > 0.6 and O.A.P. : (010). For derivation, see Appendix 1.

1290 SU ET AL.: ALKALI FELDSPARS-STRUCTURAL STATE FROM xo, AND 2Z
Table3. Alkal i feldspars,theircomposit ions,2yxvalues,anddirectandreciprocal cel l edges bandc*, andAl contentof theT,tetrahedral sites, >tl
No. SampleOr Non- 2V,
(mol%) alkali Sym f)
h ^ r S + S +
(A) (A ') @, d) (2v,ot) A Ref
1 5A12 1813 SAN.SP-C4 51433-45 7002H6 SAGT-N7 SANN-R8 SANI.R9 SVGS-N
10 sv-17711 S1A33-312 SV-105013 S1A43-414 51444-215 SAND-R16 SANG-N17 SAAT-R18 51443-319 S1A33-220 2A421 SV-85022 HEW-1123 SlA43-224 SATO-R25 S1A44-126 700227 284-228 S1A33-129 284-130 2815-231 51443-132 SAGA-R33 SANU-N34 SVGI-N35 HEW-1236 STOT-R37 HEW-238 HEW-139 2815-140 sv-o41 SV-1742 29-643 HEW-1344 2811-245 281246 2813147 28'3148 SP-A49 2811-150 1909-26151 HEW-352 P2B53 GC-254 HEW-1555 HEW456 HEW-s57 SP-C58 P50-5659 BENSON60 FOX-8661 FOX-4662 PUYE63 SP-D64 FOX-1865 SP-F66 FOX-8267 P2A68 MT.GIBELE69 A1D70 43971 MAB17772 SH107073 DQ-1
94.0 2.092.0 2.090.8 1 .190.0 1.085.0 0.585.0 1.085.0 1.085.0 1.085.0 1.087.0 2.089.0 1.082.O 2.090.0 1 .089.0 1 .085.0 1 085.0 1.085.0 1 .088.0 1 .09 1 . 0 1 . 093 0 2.0820 2.079.0 5.390.0 1 .085.0 1 .089.0 1 .085.4 1.093.0 2.O9 1 . 0 1 . 093.0 2.095.0 2.090.0 1 .085.0 1 .085.0 1 .085.0 1.079.2 3.085.0 1 .074.0 1.077.4 2.993.0 2.O82.O 2.O87.0 2.094.0 2.066.7 1.792.0 2.O94.0 2.092.0 2.092.0 2 095 4 2.O95.0 2.059.8 3.169.8 3.193.1 1 .532.5 0.853.6 4.757.6 3.467.7 5 390.5 1 187.7 0.495.0 0.079.0 5.080.9 3.142.0 1 .282.3 1.481.7 2.774.5 1.577.9 5.493.1 1 .522.3 6.990.4 1.444.1 3.90.3 0.0
88.0 0.025.2 6.5
-50.0-45.0-44.5-44.0-42.6-42.0-42.O-41.5-41 .5-41 .0-39.0-38.4-38.0-34 0-33.8-33.8-33.6-31 .0-30.0-30.0-29.5-28.0-28.O-26.3-24.0-22.0-22.O-20.0-20.o- 16 .0- 15 .0- 1 1 . 8- 1 1 . 8- 1 1 . 8- 10 .0-9.0
0 .00.00.05.29 .0
20.022.025.026.028.034.034.835.035.336.038.040.942.042.O43.043.644.O44.545.045.04 C , C
46.248.049.049.049.049.253.0s3.353.6cc.c56.0
MMMMMMMMMMMMMMMMMMMMMMMMMMMMMMMMMMMMMMMMMMMMMMMMMMMMTMMMMMMMMMMMMMMTTMTMT
13.032 0.1550313.031 0.154 9813.030 0.1550613.032 0.1549813.033 0.155 1013.033 0.1550113.033 0.1550113.033 0.1550113.033 0.1550113.037 0.1549613.032 0.1549813.034 0.1 55 0213.026 0 .1549113.023 0.1 54 9413.026 0.1549413.026 0.1549413.026 0.1549413.019 0.154 9613.025 0.1549013.017 0.154 8813.026 0.1549813.015 0.155 0013.025 0.154 9113.026 01549213.021 0.1548713.015 0.154 9713.018 0.154 8013.024 0.154 8313.017 0.154 8913.014 0.154 7313.020 0.1548413.019 0 .1548813.019 0 .1548813.019 0.154 8813.018 0 .155 1513.019 0 .1548813.010 0 .155 1113.017 0 .1550813.011 0 .1547813.023 0.1548613.028 0.1548113.008 0.1547113.010 0 .1550613.003 0.1547313.005 0 .1546613.004 0.154 6912997 0.1546212.989 0.154 6213.003 0.1545813.004 0.1552813.002 0.1550012.995 0.154 6012.966 0.156 0512s84 0.155 3712.999 0.155 2912.998 0.1552212.996 0.154 6912.995 0.154 6512.997 0.154 5112.996 0.154 6812.994 0.154 6512.974 0.155 6612.982 0.154 8812.994 0.1546612.976 0.155 0412.994 0.154 6912.989 0.154 5512.936 0.1 56 4212.9U 0.154 5312.993 0.155 74
12.983 0.1545812.953 0.156 25
0.55 0.550.57 0 560.55 0.560.56 0.560.54 0.540.55 0.550.55 0.550.55 0.55u.cc u,cc0.55 0.560.56 0.580.54 0.550.59 0.580.60 0.s90.59 0.580.59 0.580.59 0.580.61 0.600.60 0.610.63 0.620.58 0.580.61 0.570.60 0.620.59 0.600.62 0.620.62 0.610.64 0.640.61 0.640.63 0.650.66 0.660.63 0.640.62 0.630.62 0.630.62 0.630.57 0.610.62 0.630.60 0.590.59 0.610.66 0.660.61 0.630.61 0.650.69 0.690.61 0.590.70 0.690.71 0.700.70 0.700.74 0.710.76 0.730.73 0.730.59 0.610.65 0.650.75 0.730.55 0.550.63 0.620.60 0.630.62 0.670.73 0.750.74 0.740.76 0.760.73 0.720.74 0.720.60 0.600.73 0.73o.74 0.740.72 0.730.73 0.740.78 0.780.56 0.570.81 0.790.59 0.650.58 0.550.79 0.790.54 0.62
00.01
-0.01000000
-0.01-o.o2-0.01
0.010.010.010.010.010.01
-0.010.0100.04
-0.02-0.01
00.010
-0.03-0.02
0-0.01-0.01-0.01-0.01-0.04-0.01
0.01-0.02
0-0.02-0.04
00.020.010.0100.030.030
-0.0200.0200.01
-0.03-0.05-0.02
000.014.02000
-0.01-0.01
0-0.01
o.0:2-0.06
0.030
-0.08
1 41 432713,24oIoI25271 22727Ioo27271 41 26 , 1 127o27l 2
1 4271 41 427
I6 , 1 196 , 1 16 , 1 11 41 2251 46 , 1 11 41 41 41 41 7 , 1 8 , 1 91 413,246 , 1 149 , 2 36 , 1 16 , 1 16 , 1 11 7 , 1 8 , 1 926268I261 7 , 1 8 , 1 9I1 7 , 1 8 , 1 98410,22413,24216 , 1 1c
SU ET AL.: ALKALI FELDSPARS-STRUCTURAL STATE FROM Xo, AND 2Z
Table 3-Continued
r29l
No. SampleOr Non-
(mol%) alkali Symh F
(A) (A-,)s+ s+2r1 2r1
(b, d) (2v, or)2V,f)
7475T O
78798081828384858687888990q l
92939495OA
979899
1001 0 1102103104105106107108109
HEW-10FOX.Bt-5t-1t-38CA lAFOX-CHIMALAYASP-VFOX.D7007CA1 BHEW-6MAB169MAB176t-12SP.BFOX-EP 1 CSP-ZSP-UPONTISKALKr-3ARC20Cv-3CAl EPELLOTSALOPRILEPMAB171i l t -16MAB167MAB172AIt-47MAB151TIBURONLA.CC
27.985.80 .00.00 .0
88.68 8 988 188.088.188.188.689.40.30.30.0
89.083.390.087.486.8q n n
0.085.50.0
88.69 5 096.50.30.00.30.30.00.30.30.3
s6.056.057.058.058.060.060.063.063.564.065.065.066.066,166.767.068.570.071.O71.876.077.078.078.580.082.082.584.085.992.096.697.498.098.8
102.5103.4
2.8 T2.3 M0.0 T0.0 T0.0 T1 . 9 M1 . 4 M0.0 M1 . 4 M1 . 0 M1 . 0 M1 . 9 T0.8 M0.0 T0.0 T0.0 T1 . 3 Mo.7 T1 . 4 T1 . 1 M1 . 1 T0.0 T0.0 T1 . 3 T0.0 T1 . 9 T0.0 T0.0 T0.0 T0.0 T0.0 T0.0 T0.0 T0.0 T0.0 T0.0 T
12.935 0.1 56 23 0.6112.988 0.154 52 0.79
0.580.600.59
12.984 0.15448 0.8112.976 0.154 43 0.8412.963 0j54 41 0.8812.973 0.154 50 0.8412.971 0.15443 0.8512.967 0.15451 0.8512.976 0.15433 0.8812.976 0.15449 0.83
0.640.660.66
12.970 0.154 39 0.8712.970 0.15442 0.8812.971 0.15431 0.9012.965 0.15442 0.8812.960 0.15425 0.9512.962 0.15404 0.99
0.7912.961 0.154 17 0.96
0.7712.963 0.15408 0.9812.964 0.1 53 99 1 .0012.964 0.1 54 00 1 .00
0.800.920.920.930.950.95
12.781 0.156 53 0.991.00
0.62 -0.01 6, 110.79 0 I0.57 0.01 160.58 0.02 160.58 0.01 160.82 -0.01 40.82 0.02 I0.84 0.04 150 . 8 4 0 1 7 , 1 8 , 1 90.85 0 80.85 0 130.86 0.02 40.86 -0.03 6, 110.64 0 210.65 0.01 210.65 0.01 160.88 -0.01 17, 18, 190.88 0 80.90 0 40 .90 -0 .02 17 , 18 ,190.93 0 .02 17 ,18 ,190.96 0.03 70.75 0.04 160.95 0.01 40.76 0.01 160.98 0 40.99 0.01 11.01 -0.01 200.82 -0.02 210.88 0.04 160.93 -0.01 210.94 -0.01 210.94 0.01 160.95 0 210.99 0 22,231.00 0 21
ivote.' For 2y values, a minus sign indicates that the optic axial plane is parallel to (010). Sym : symmetry (M : monoclinic, T : triclinic)>tj(b, c.) : >tl derived from observed D and C or other lattice parameters or diffraction peak positions (see text). >tl2y, Ot): >t estimated frcm 2Vand mofe percent Or using Figure 2. A : Et,(b, d) - >tl2v, Or). References are follows: (1) Bailey, 1969. (2) Brown and Bailey, 1 964. (3) Cole et al.,1949. (4) DePier i ,1979. (5)DePier i and Ouareni ,1973. (6)Emerson and Guidot t i , 1974.(7) Finney and Bai ley,1964. (8)Fox and Moore,1969.(9)Gering, 1985. (10)HaAow, 1982. (11)Hewlett, 1959. (12)Ott, 1982. (13) Phillips and Ribbe, 1973. (14)Priess,1981.05) Prince et al., 1973. (16)Raaseand Kern, 1969. (17) Smith and Ribbe, 1966. (18) Spencer, 1937. (19) Stewart and Wright, 1974. (20) Strob, 1983. (21) Su et al., 1986a.(22) Su, 1986.(23) Wainwright and Starkey, 1969. (24) Warner et al., 1984. (25) Weitz, 1972. (26) Wright and Stewart, 1968. (27) Zeipert and Wondratschek, 1981.
structural state (Table l). The calculations used in con-structing this diagram are given in detail in Appendix 1,as is the derivation of the following equation relating 2t,to ,/x, one-half the optic axial angle 2V*, and to Xo., themole fraction (not mole percent) of KAlSirOr:
,, _ bo + b,Xo, + brXo,sin2V* + brsin2V, /r\o r r - . ( r , ,
Because a two-segment linear model was adopted for thevariation of refractive indices with Or content and twodifferent orientations ofoptic axial plane exist for K-richmembers, three sets of coefficients for Equation I are re-quired to account for the three cases: (A) where Or < 60molo/o (X". - 0.6), (B) where Or > 60 mol0/o (Xo. > 0.6)and O.A.P. is approximately I (010), and (C) whereOr > 60 molo/o (Xo. > 0.6) and O.A.P. : (010). Thecoemcients are listed in Table 2. The reason that X- isused in Equation I instead of mole percent Or is so thatthe coefficients at, a2 and br, b, have about the samemagnitudes as the other coeftcients. If X* is replaced by
mole percent Or in Equation l, the values of at, a2andbr, brin the abstract and in Table 2 should be divided by100.
For those who are undertaking systematic investigationof the structural states of alkali feldspars in certain geologicterranes, Equation I should prove useful ifa computer isemployed to process the experimental data.
Ev.qlultroN oF THE DETERMINATTvE DIAGRAM
Data for a total of 109 natural, heated natural, andsynthetic alkali feldspars are plotted in Figure 2 and arelisted in Table 3 together with their compositions, mea-stred 2V * angles, selected lattice parameters (where avail-able), and structural states as expressed by 2tr, the totalAl content of the two T, tetrahedral sites. Values of 2t'are, of course, model-dependent, and this has been re-viewed in detail by Kroll and Ribbe (1983). The nowfamiliar b-c plot of Wright and Stewart (1968) has beenused for more than l5 years to obtain estimates of 2t, for
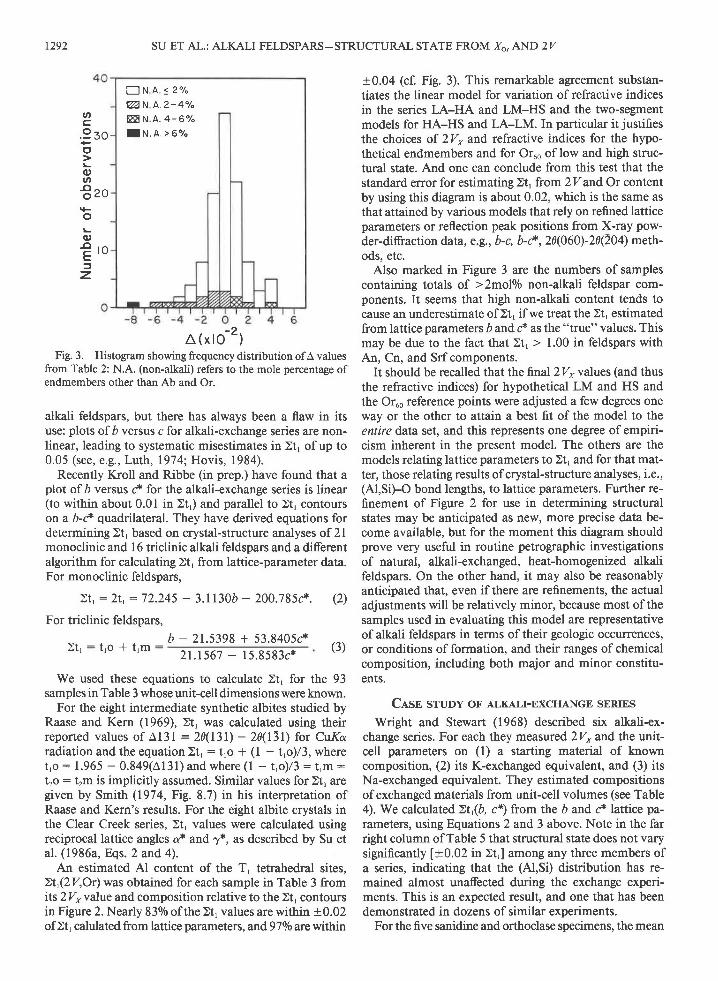
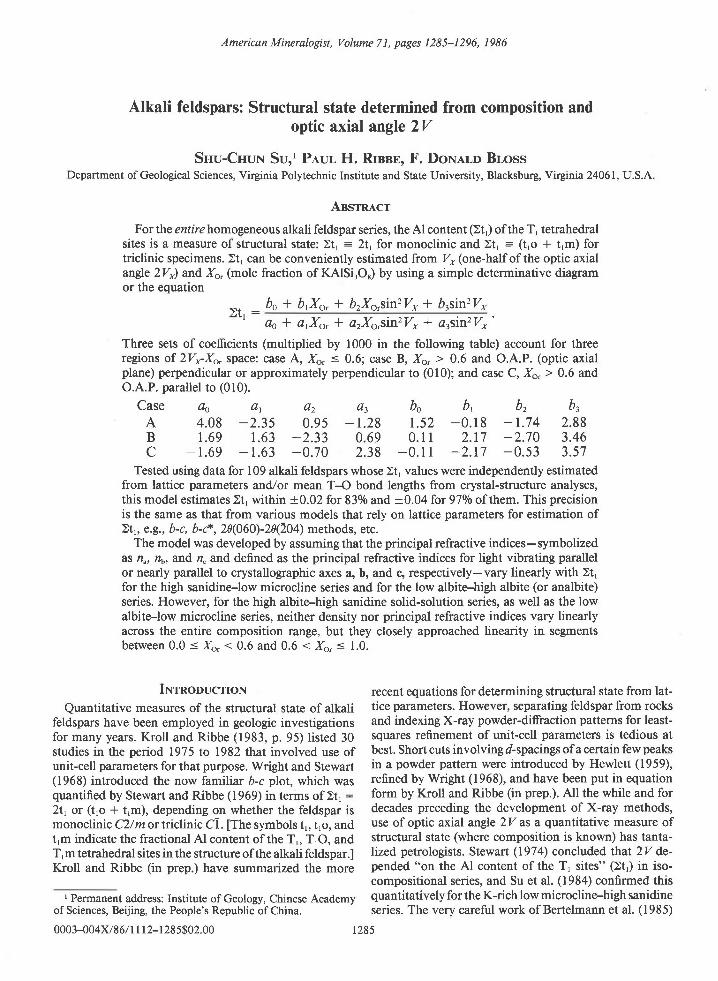
E N A s 2 %a N A . 2 - 4 " hE N A . 4 - 6 %I N . A , > 6 7 "
t292
l ( x to -2)Fig. 3. Histogram showing frequency distribution ofA values
from Table 2: N.A. (non-alkali) refers to the mole percentage ofendmembers other than Ab and Or.
alkali feldspars, but there has always been a flaw in itsuse: plots ofb versus c for alkali-exchange series are non-linear, leading to systematic misestimates in )1, of up to0.05 (see, e.g., Luth, 1974; Hovis, 1984).
Recently Kroll and Ribbe (in prep.) have found that aplot ofb versus C for the alkali-exchange series is linear(to within about 0.01 in 2t,) and parallel to >tr contourson a b-C quadrilateral. They have derived equations fordetermining )t, based on crystal-structure analyses of 2lmonoclinic and l6 triclinic alkali feldspars and a differentalgorithm for calculating 21, from lattice-parameter data.For monoclinic feldspars,
2t,: 2t,: 72.245 - 3.l l30b - 200.785C. (2)
For triclinic feldspars,
b - 2 1 . 5 3 9 8 + 5 3 . 8 4 0 5 c *)1, : t 'o * t 'm :
21.1567 - 15.8583c*
We used these equations to calculate 2t, for the 93samples inTable 3 whose unit-celldimensionswere known.
For the eight intermediate synthetic albites studied byRaase and Kern (1969), 2t, was calculated using theirreported values of A13l = 20(l3l) - 20(l-31) for CuKaradiation and the equation )t, : t,o + (1 - t,o)/3, wheret,o : 1.965 - 0.849(Al3l) and where (l - t,o/3 : trrr :t2o: l2m is implicitly assumed. Similar values for >tr aregiven by Smith (1974, Fig. 8.7) in his interpretation ofRaase and Kern's results. For the eight albite crystals inthe Clear Creek series, )t, values were calculated usingreciprocal lattice angles a* and,y*, as described by Su etal. (1986a, Eqs. 2 and 4).
An estimated Al content of the T, tetrahedral sites,Ztr(2V,Or) was obtained for each sample in Table 3 fromits2vxvalve and composition relative to the )1, contoursin Figure 2. Nearly 830/o of the 2t, values are within +0.02of>t, calulated from lattice parameters, and 970lo are within
SU ET AL.: ALKALI FELDSPARS-STRUCTURAL STATE FROM Xo, AND 2Z
oc.9 so+o
(Dan
€zoo(t)
l l r nE ' "f
z.
+0.04 (cf. Fig. 3). This remarkable agreement substan-tiates the linear model for variation of refractive indicesin the series LA-HA and LM-HS and the two-segmentmodels for HA-HS and LA-LM. In particular it justifies
the choices of 2V, and refractive indices for the hypo-thetical endmembers and for Oruo of low and high struc-tural state. And one can conclude from this test that thestandard error for estimating 2t' from 2V and Or contentby using this diagram is about 0.02, which is the same asthat attained by various models that rely on refined latticeparameters or reflection peak positions from X-ray pow-der-diffraction data, e.9., b-c, b-C, 20(060)-20(204) meth-ods, etc.
Also marked in Figure 3 are the numbers of samplescontaining totals of >2molo/o non-alkali feldspar com-ponents. It seems that high non-alkali content tends tocause an underestimate of >tr if we treat the )t' estimatedfrom lattice parameters b and C as the "true" values. Thismay be due to the fact that >t' > 1.00 in feldspars withAn, Cn, and Srf components.
It should be recalled that the final2Vrvalues (and thusthe refractive indices) for hypothetical LM and HS andthe Oruo reference points were adjusted a few degrees oneway or the other to attain a best fit of the model to theentire data set, and this represents one degree ofempiri-cism inherent in the present model. The others are themodels relating lattice parameters to 2t' and for that mat-ter, those relating results of crystal-structure analyses, i.e.,(Al,SiFO bond lengths, to lattice parameters. Further re-finement of Figure 2 for use in determining structuralstates may be anticipated as new, more precise data be-come available, but for the moment this diagram shouldprove very useful in routine petrographic investigationsof natural, alkali-exchanged, heat-homogenized alkalifeldspars. On the other hand, it may also be reasonablyanticipated that, even ifthere are refinements, the actualadjustments will be relatively minor, because most of thesamples used in evaluating this model are representativeof alkali feldspars in terms of their geologic occulrences,or conditions of formation, and their ranges of chemicalcomposition, including both major and minor constitu-ents.
Clsn sruov oF ALKALT-EXCHANGE sERIES
Wright and Stewart (1968) described six alkali-ex-change series. For each they measured 2V* and the unit-cell parameters on (l) a starting material of knowncomposition, (2) its K-exchanged equivalent, and (3) itsNa-exchanged equivalent. They estimated compositionsof exchanged materials from unit-cell volumes (see Table4). We calculated Zt,(b, c*) from the b and c* lattice pa-rameters, using Equations 2 and 3 above. Note in the farright column of Table 5 that structural state does not varysignificantly [+0.02 in 2t,] among any three members ofa series, indicating that the (Al,Si) distribution has re-mained almost unaffected during the exchange experi-ments. This is an expected result, and one that has beendemonstrated in dozens of similar experiments.
For the five sanidine and orthoclase specimens, the mean
(3)

SU ET AL.: ALKALI FELDSPARS-STRUCTURAL STATE FROM Xo. AND 2Z 1293
Table 4. Compositional, optical, and structural state data for six feldspars that were alkali-exchanged by Wright and Stewart(1 968)
2V, (.) >tj(2v, Ot)
Sample (b, c)Or
(mol%)
Puye sanidinePuye sanidine + KCIPuye sanidine + NaClP50-56 orthoclaseP50-56 orthoclase + KCIP50-56 orthoclase + NaClBenson orthoclaseBenson orthoclase + NaCl + KCIBenson orthoclase + NaClSH1 070 orthoclaseSH1070 orthoclase + KCISH1 070 orthoclase+ NaClSpencer-B orthoclaseSpencer-B orthoclase + NaClSpencer-U microclineSpencer-U microcline + KCISpencer-U microcline + NaCl
42O E
286O R
8Y C
97
49.019.052.052.O42.O67.05 1 . 545.567.060.048.574.5
72.071.086.0
0.570.550.500.720.730.620.74o.740.64
0.620.700.540.770.750.660.790.770.670.820.780.72
40.5-52.0
42.54 1 . 53s.06 1 . 5J / , C
38.564.050.048.0oo.c
45.5-17 .0
48.044.539.065.044.542.066.055.548.0ov,c
68.475.071.O70.082.5
0.60 0.600.63 0.610.52 0.620.74 0.740.74 0.740.65 0.710.76 0.760.75 0.760.66 0.720.80 0.790.78 0.790.68 0.760.87 0.870.74 0.850.88 0.950.90 0.940.79 0.96
88OA
4891 184940
0.770.780.65
0.720.870.880.75
0.760.890.910.82
72.569.0o / . 378.5
Note; The range and the mean value ol 2v,for each sample and the corresponding >t1 values estimated from Figure 2 using 2yx and Or are listed.These are compared to >t1 estimated from lattice parameters b and d, using Equations 2 and 3.
values of >tr(2V, Or), i.e., those determined from 2V andmole percent Or using Figure 2, agree within 10.02 with2t,(b, C) for the natural and K-exchanged specimens only.For all the Na-exchanged members, however, mean)tr(2V,Or) is systematically less than2t,(b, C) bV 0.06 to as muchas 0. I l. A possible explanation for these discrepancies isthe fact that the starting material is monoclinic and theNa-exchanged member triclinic. By analogy with the san-idine-microcline transformation, one might expect poly-synthetic albite and/or pericline twins to develop withinversion. If the Na-exchanged member is submicroscop-ically twinned, the optical properties will be diferent fromits untwinned equivalent (Marfunin, 1966, Table 21, p.140; see also Smith, l974,Table 8-1, p.372).
With a program by Hauser and Wenk (1976) as mod-
Table 5. Effects of submicroscopic twinning on 2 V, (indegrees) of high albite
Twin law Ab-Pe 2Vr ^(2v)
ified by B. J. Cooper, we calculated the effects of bothsubmicroscopic albite and pericline twinning on 2V* ofalbite using the refractive indices and optic orientation ofa high albite (21, :0.59, specimen MAB-177 describedby Su et al., 1986b, Table l). The results in Table 5 in-dicate that 2V, could be reduced by up to 20', implyingthat a crystal is more disordered than it actually is, de-pending on the degree and type or mix of types of sub-microscopic twinning.
This "comfortable" conclusion is, however, open toquestion, because the intermediate microcline (SpencerU, Table 4), that started as triclinic and presumably is nomore twinned afterNa-exchange than before, also showstoo low a 2V* valve and thus appears to be significantlymore disordered than is indicated by Zt,(b, C). Of course,additional twinning may have been introduced by theexchange process. Even for unexchanged and K-ex-changed Spencer (J, note that there is poor agreementbetween >1t(2V, Or) [: 0.88, 0.90] and >t,(b, C) t: 0.951and that the )t,(b, C) value is further than the 2t'(2V, Or)value from )t, : 0.91 calculated by Kroll and Ribbe (1983,Table 3, p. 65) from a structural analysis by Bailey (1969).The fact that the original Spencer U specimen is not ho-mogeneous but contains two phases (Stewart and Wright,1974)mayhave some bearing on the confusion surround-ing this specimen.
AcxNowr,nlcMENTS
This work was supported in part by National Science Foun-dation Grant EAR 83-08308 to F.D.B. and P.H.R. S.C.S. grate-fully acknowledges financial support from N.S.F. and a Cun-ningham Fellowship awarded by Virginia Polytechnic Instituteand State University. Prof. H. Wondratschek of UniversitiitKarlsruhe, West Germany, and especially Dr. D. B. Stewart ofthe U.S. Geotogical Survey, Reston, Virginia, provided manyconstructive comments during the course of this research. Wethank B. J. Cooper, Sam Houston State University, Huntsville,Texas, for providing the modified Hauser-Wenk program.
NoneAlbite
Albite-pericline
100 0 09 0 1 0 08 0 2 0 07 0 3 0 06 0 4 0 05 0 5 0 090 0 108 0 0 2 07 0 0 3 06 0 0 4 05 0 0 5 040 40 1030 30 2025 25 25
000000000nn
1 02025
cJ.o
49.244.539.52 R l
33.249.845.942.139.238.035.136.937.8
0.04.49 .1
14.118 .520.43 .87.7
1 1 . 514.415 .618 .516.715 .8
Notei The host material is MAB-177, a high albite with >tl : 0.59 (seeSu et al., 1986a, Table 1). Host: percentage of untwinned host individ-ual; Ab : percentage of albiteJaw twin individual; Pe : percentage ofpericlinelaw twin individual; Ab-Pe : percentage of albite-pericline-lawtwin individual. A(2yx) is the difference between the 2vx ol untwinnedcrystal and that of twinned crystal.

1294
RnpnnnNcrsBailey, S.W. (1969) Refinement of an intermediate microcline
structure. American Mineralogist, 5 4, | 5 40-l 5 45.Bambauer, H.U., Taborszky, F., and Trochim, H.D. (1979) Op-
tical determination of rock-forming minerals. Part l. Deter-minative tables. Schweizerbart'sche Verlagsbuchhandlung,Stuttgart, 188 p.
Bertelmann, D., Fijrtsch, 8., and Wondratschek, H. (1985) ZumTemperverhalten von Sanidinen: Die Ausnahmerolle der Ei-felsanidin-Megakristalle. Neues Jahrbuch fiir Mineralogie, Ab-handlungen, 152, 123-141.
Blasi, A., DePol Blasi, C., and Z,anazzi, P.F. (1985) Pellotsalomaximum low microcline: Its structure re-refinement and min-eralogical implications. European Union of Geosciences Meet-ing III, Strasbourg, France, April 1-14, 1985, Program withAbstracts, V26.
Bloss, F.D. (1985) Labelling refractive index curves for mineralseries. American Mineralogist, 7 0, 428432.
Brown, B.E., and Bailey, S.W. (1964) The structure of maximummicrocline. Acta Crystallographica, I 7, I 39 l-1 400.
Burri, C., Parker, R.L., and Wenk, E. (1967) Die optische Ori-entierung der Plagioklase-Unterlagen und Diagramme zurPlagioklase-bestimmung nach der Drehtische-methode. Birk-hiiuser, Basel und Stuttgart, 334 p.
Cole, W.F., S<irum, H., and Kennard, O. (1949) The crystal struc-tures of orthoclase and sanidinized orthoclase. Acta Crystal-lographica, 2,28V287.
Crawford, M.L. (1966) Composition of plagioclase and associ-ated minerals in some schists from Vermont, U.S.A., and SouthWestland, New Zealand, with inferences about the peristeritesolvus. Contributions to Mineralogy and Petrology, 13,269-294.
DePieri, R. (1979) Cell dimensions, optic axial angle and struc-tural state in triclinic K-feldspar ofthe Adamello massif, north-ern Italy. Memorie de Scienze Geologiche, Padova, 32.
DePieri, R., and Quareni, S. (1973) The crystal structure of ananorthoclase: An intermediate alkali feldspar. Acta Crystal-lographica, 829, | 483-1487 .
Emerson, R.W., and Guidotti, C.F. (1974) New X-ray and chem-ical data on Hewlett's 1959 feldspar suite. American Miner-alogist, 59, 615-617.
Finney, J.J., and Bailey, S.W. (1964) Crystal structure of an au-thigenic maximum microcline. Zeitschrift fiir Kristallographie,t19,413436.
Fox, P.8., and Moore, J.M., Jr. (1969) Feldspars from Adamantpluton, British Columbia. Canadian Journal ofEarth Sciences,6. tr99-t209.
Gering, E. (1985) Silizium/Aluminium-Ordnung und Kristall-perfektion von Sanidinen. Dissertation, Universitiit Karlsruhe.
Harlow, G.E. (1982) The anorthoclase structures: The effects oftemperature and composition. American Mineralogist, 67, 97 5-996.
Harlow, G.E., and Brown, G.8., Jr. (1980) Low albite: An X-rayand neutron diftaction study. American Mineralogist, 65, 98G995.
Hauser, J., and Wenk, H.-R. (1976) Optical properties of com-posite crystals (submicroscopic domains, exsolution lamellae,solid solution). Zeitschrift fiir Kristallographie, 143, 188-219.
Hewlett, C.G. (1959) Optical properties of potassic feldspars.Geological Society of America Bulletin, 70, 5 1 l-538.
Hovis, G.L. (1984) Characterization of Al-Si distributions inalkali feldspars. Geological Society of America Abstracts withPrograms, 16,544.
Kroll, H., and Ribbe, P.H. (1983) Lattice parameters, compo-sition and (Al,Si) order in alkali feldspars. Mineralogical So-ciety of America Reviews in Mineralogy, 2, 2nd edition, 57-100.
Laves, F., and Chaisson, U. (1950) An X-ray investigation ofthe"high"-"1o*" albite relations. Journal of Geology, 58, 58,1-592.
Luth, W.C. (1974) Analysis of experimental data on alkali feld-
SU ET AL.: ALKALI FELDSPARS-STRUCTURAL STATE FROM Xo. AND 2Z
spars: Unit cell parameters and solvi. In W.S. MacKenzie andJ. Zussman, Eds. The feldspars, 249-296. Manchester Uni-versity Press, Manchester.
Marfunin, A.S. (1966) The feldspars: Phase relations, opticalproperties, and geological distribution. (Transl. from the Rus-sian edition, 1962.) Israel Program for Scientific Translations,Jerusalem, 317 p.
Orville, P.M. (1967) Unit-cell parameters of the microcline-lowalbite and the sanidine-high albite solid solution series. Amer-ican Mineralogist, 52, 55-86.
Ott, G. (1982) R<intgenographische Strukturverfeinerungen angetemperten Eifelsanidinen zur Feststellung ihres Ordnungszu-standes. Diplomarbeit, Universitet Karlsruhe, West Germany.
Phillips, M.W., and Ribbe, P.H. (1973) The structures of mono-clinic potassium-rich feldspars. American Mineralogist, 58, 263-270.
Plas, L. van der (1966) The identification of detrital feldspars.Elsevier, Amsterdam, 305 p.
Priess, U. ( I 98 I ) Untersuchungen zur Tief-Hoch-Umwandlungvon Fe-hiiltigen Orthoklas-Kristallen aus Madagascar. NeuesJahrbuch liir Mineralogie, Abhandlungen, l4I, 17-29.
Prince, E., Donnay, G., and Martin, R.F. (1973) Neutron dif-fraction refinement of an ordered orthoclase structure. Amer-ican Mineralogist, 58, 500-507.
Raase, P., and Kern, H. (1969) Uber die Synthese von Albitenbei Temperaturen von 250 bis 700"C. Contributions to Min-eralogy and Petrology, 21, 225-237 .
Rankin, D.W. (1967) Axial angle determinations in Orville'smicrocline-low albite solid solution series. American Miner-alogist, 52, 414417.
Schneider, T.R. (1957) Rtintgenographic und optische Unter-suchung der Um wandung. Albit-Analbit-Monalbit. Zeitschriftfiir Kristallographie, 109, 245-27 l.
Smith, J.R. (1958) Optical properties of heated plagioclases.American Mineralogist, 43, ll7 9-l 194.
Smith, J.V. (1974) Feldspar minerals. I. Crystal structure andphysical properties. Springer-Verlag, Heidelberg, 672 p.
Smith, J.V., and Ribbe, P.H. (1966) X-ray-emission microanal-ysis of rock-forming minerals. III. Alkali feldspars. Journal ofGeology, 76,197-216.
Spencer, E. (1937) The potash-feldspars I. Thermal stability.Mineralogical Magazine, 24, 453494.
Stewart, D.B. (1974) Optic axial angle and extinction angles ofalkali feldspars related by cell parameters to AVSi order andcomposition. In W.S. MacKenzie and J. Zussman, Eds. Thefeldspars, 145-1 6 l. Manchester University Press, Manchester.
Stewart, D.B., and Ribbe, P.H. (1969) Structural explanation forvariations in cell parameters of alkali feldspar with AVSi or-dering. American Journal of Science, 267-A', 144462.
- ( I 983) Optical properties of feldspars. Mineralogical So-ciety of America Reviews in Mineralogy, 2, 2nd Edition, 121-I 39 .
Stewart, D.B., and Wright, T.L. ( 1974) Al/Si order and symmetryofnatural alkali feldspars, and the relationship of strained cellparameters to bulk composition. Bulletin de la Soci6t6 frangaisede Min6ralogie et de Cristallographie, 97, 356-377.
Strob, W. ( I 983) Strukturverfeinerung eines Tief-Mikroklins, Zu-sammenhange zwischen <T-O> Abstanden und (Al,Si)-Ord-nungsgrad und metrische Variation in einer Tief-Albit/Tief-Mikroklin-Mischkristallreihe. Diplomarbeit, WestfiilischeWilhelms-Universitiit, Mifurster, West Germany.
Su, S.C. (1986) Alkali feldspars: Ordering, composition and op-tical properties. Ph.D. dissertation, Virginia Polytechnic In-stitute and State University, Blacksburg.
Su, S.C., Bloss, F.D., Ribbe, P.H., and Stewart, D.B. (1984) Opticaxial angle, a precise measure of (Al,Si) ordering in T, tetra-hedral sites of K-rich alkali feldspars. American Mineralogist,69,44M48.
Su, S.C., Ribbe, P.H., Bloss, F.D., and Goldsmith, J.R. (1985)Structural states and properties of a low-high albite series ofsingle crystals. Geological Society of America Abstracts withPrograms, 17,729.
Su, S.C., Ribbe, P.H., Bloss, F.D., and Goldsmith, J.R. (1986a)Optical properties ofsingle crystals in the order-disorder serieslow albite-high albite. American Mineralogist, 7 l, 1384-1392.
Su, S.C., Ribbe, P.H., Bloss, F.D., and Warner, J.K. (1986b)Optical properties ofa high albite-high sanidine solid-solutionseries. American Mineralogist, 7 l, 1393-1398.
Tuttle, O.F. (1952) Optical studies on alkali feldspars. AmericanJournal ofScience, Bowen volume, 553-568.
Tuttle, O.F., and Bowen, N.L. (1958) Origin of granite in lightof experimental studies in the system NaAlSirOs-KAlSi3O8-SiOr-HrO. Geological Society of America Memoir 74, 153 p.
Wainwright, J.E.N., and Starkey, J. (1969) Crystal structure of ametamorphic low albite. (abs.) Geological Society of AmericaSpecial Paper 121,310.
Warner, J.K., Su, S.C., Ribbe, P.H., and Bloss, F.D. (198a) Op-tical properties of the analbite-high sanidine solid solutionseries. Geological Society of America Abstracts with Programs,16,68 '7 .
Weitz, G. (1972) Die Struktur des Sanidins bei verschiedenenOrdnungsgraden. Zeitschrift fiir Kristallographie, 136, 418-426.
Wolfe, H.E. (1976) Optical and X-ray study of the low plagio-clases. M.S. thesis, Virginia Polytechnic Institute and StateUniversity. Blacksburg.
Wright, T.L. (1968) X-ray and optical study of alkali feldspars:II. An X-ray method for determining the composition andstructural state from measurement of 20 values for three re-flections. American Mineralogist, 53, 88-104.
WriCht, T.L., and Stewart, D.B. (1968) X-ray and optical studyofalkali feldspars: I. Determination ofcompositions and struc-tural state from refined unit-cell parametercand2V. AmericanMineralogist, 53, 38-87.
Tnipert, C., and Wondratschek, H. (1981) Ein ungew0hnlichesTemperverhalten bei Sanidin von Volkesfeld/Eifel. NeuesJahrbuch flir Mineralogie Monatshefte, 407415.
Mlxuscnrrr REcETVED Aprur 23, 1986Mexuscnrpr AccEprED Aucusr 6, 1986
AppnNrrx 1. Carrrn.lrrox oF 2l/-OR DTAcRAMcoNTouRED FOR >tr
Because a two-segment linear model with inflection point atOruo was used to delineate the variations ofrefractive indices ofalkali feldspar series with the same structural state, calculationswere carried out separately for the ranges Oro-Oruo and 0160-Or,oo. For the latter, two orientations of the optic axial plane(O.A.P.) were also treated separately. The refractive indices ofendmembers and Oruo members are those listed in Table l. Sym-bols used in the following derivations are Or : mole percentKAISi3O8(X..: Orl100); )t, : Al content of T, sites; and A, B,C: principal refractive indices most nearly parallel to crystal-lographic directions q b, c, respectively, at given )t, and Or. Inthe following equations, superscripts indicate the values of)t,,and subscripts the values of mole percent Or. E.g., 06(z)uo is n.at >tr : 0.6 and Or : 60, and ' o(nb)o. is no at )t, : 1.0 and givenOr.
Case A: Or < 60l. Refractive indices for the series with >t, : 1.6.
'o(n")*: 'o(zJo * (,o(nJuo - '0(z)o)01160, (Al)' o(no)o. : 'o(no)o * ('o(no)oo - 'o(no)o)Or/60, (42),o(n")o, :, o(n")o * ('o(nJuo -'0(n")o)Orl60. (A3)
2. Refractive indices for the series with >tl : 0.6.ou(rdo,: ou(nJo * (ou(nJuo - 06(n)o)Orl60, (A4)ou(no)o,: ou(no)o t (ou(no)uo - 06(no)o)Orl60, (A5)ou(nJo,: ou(n")o * (ou(nJuo - 06(n)o)Or/60. (A6)
r295
3. Refractive indices at )t' and Or.
a : z\n"\6,: 'o(n.)o.
- (ou(nJ* - ''o(nJ")()t, - 1.0)/0.4,
B : , t(nJa: 'o(no)-(A7)
- (ou(zo)o. - 'o(no)o)(Zt, - 1.0)/0.4, (A8)
c : o'(n")".
: 'o(n")o, - (ou(nJoJ - 'O(nJ*X2t, - 1.0)/0.4. (A9)
4. Optic axial angle 2V* atDt, and Or.
2V': 2 tin-tY@-=-E=\@'=-E=1. (Al0)
Case B: Or > 60 and O.A.P. (-) f (010)
1. Refractive indices for the series with >tr : 1.0.
'o(n )o, : 'o(r.)uo * ('o(n"),oo - 'o(nJuoXOr - 60)/40, (Al l)'o(no)o, : 'o(no)uo * ('o(no),oo - 'o(no)uo)(Or - 60)/40, (Al2)'o(r,Jo, : 'o(r?Juo * ('o(/rJ,oo - 'o(nJuo)(Or - 60)/40. (Al3)
2. Refractive indices for the series with >t, : 9.6.
ou(rJo,: ou(n,)uo * (ou(rJ,oo - 06(n)uo)(Or - 60)/40, (A14)ou(no)o.: ou(no)uo * (ou(no),* - o6(noLoXOr - 60)/40, (A15)ou(n")* : ou(nJuo * (ou(nJ,* - 06(n)uo)(Or - 60)/40. (,{16)
3. Refractive indices at 2t' and Or.
A :, , ,(n)o,: 'o(n.)o,
- (ou(nJo, - 'o(rJo,X2t' - 1.0)/0.4, (Al7)
B: o ' (no)o,
: 'o(no)-
- (ou(zo)o. - 'o(reo)o)@t, - l.O)/0.4, (Al8)
C : r,,(n,)o,
: 'o(n")*
- (ou(zJo, - 'o(nJoJ()t, - 1.0)/0.4. (A19)
4. Optic axial angle 2V* at Ot and )t'.
2V,:2stuFtv@=r=-En@-=-B=r. (A20)
Case C: Or > 60 and O.A.P.: (0f0)
In this case, the equations for A, B, and Chave the same formsas A17, Al8, and Al9, respectively, but C > B. Thus,
2 v , : 2 s i n - ' f f i . ( A 2 l )
The above calculations were undertaken at increments of Imolo/o Or from 0 to 100 and for )t, at increments of 0.01 from0.5 to 1.0 to EetZVx values at each (Or, >tr) point. Then2V*was plotted versus mole percent Or and contoured for )tr, asseen in Figure 2.
Dnnrv.l,noN oF EeuATroN I IN THE TExr
Case A: Or < 60
Substituting Equations Al and ,{4 into A7, AZ and A5 intoA8, A3 and A6 into A9, we can express the three principal re-fractive indices ,4, B, and C as functions of >tr and Or:
A: l;(>t,,ot),B :j;(>tbor),C: f,(Zt,,Or).
(422)(A23)(424)
Because the birefringences of alkali feldspars are very low(.0.01 1), the following approximate equation for c.alculatirry2Vfrom refractive indices can be used:
SU ET AL.: ALKALI FELDSPARS-STRUCTURAL STATE FROM Xe AND 2Z
sin2Zx: (B - q/@ - A). (425)
t296
Substituting A22, 423, and, A24 into A25 and rearranging theterms, we can express >tr as a function of sin2V, and X*.
SU ET AL.: ALKALI FELDSPARS-STRUCTURAL STATE FROM XG AND 2Z
(426)
where
ao : o6(n)o - 'o (nJo - ou(no)o * to (no) . ,
a, : 5/3IPu(nJuo - ou(rJo) - (ou(nJuo - ou(ro)o) - ('o(nJuo- 'o(n")o) * ('o(no)uo - 'o(nJo)],
a, : 5/3[( ,o(nJuo - ,o( /?Jo) - ( 'o(no)uo - ,o(no)o)- (ou(n^)uo - ou(nJo) r (ou(no)uo - ou(rJJl,
at : to(n)o - ou(nJo -'o(no)o * ou(no).,
bo : eo+ 2/5( to(n")o - ,o(no)o),
b, : ar + 2/31(to(n)uo- 'o(zJo) - ( 'o(no)uo - 'o(nJo)] ,
bz : dz+ 2 /31 ( t o (no )uo - ' o (no )o ) - ( ' o ( r Juo - ' o (nJo ) ] ,
b t : a t+ 2 /5 ( t o (n )o - , o ( zJo ) .
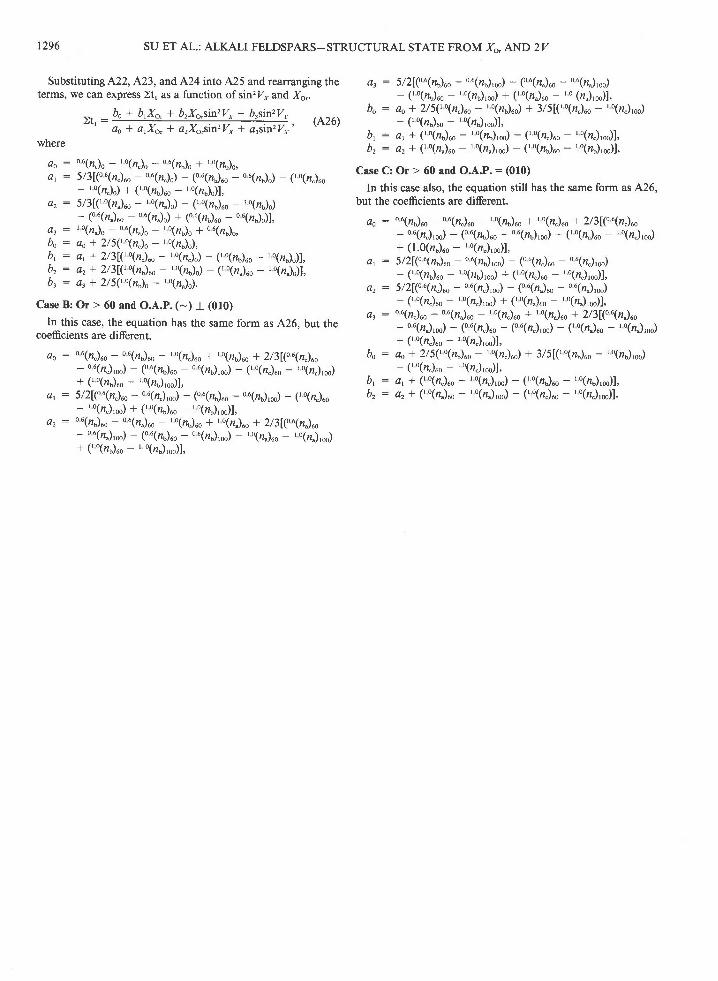
Case B: Or > 60 and O.A.P. (-) r (010)In this case, the equation has the same form as A26, but the
coemcients are different.
ao : o6(n)o - ou(no)uo -, o(n")uo *,o(no)uo + 2/31(o6(n.)uo- ou(rrJ,oo) - (ou(zolo - ou(no),oo) - (to(nJuo - to(nJ,oo)
* ('o(no)uo - to(no),oo)],
a' : 5/21(o6(nJuo - ou(r?J,*) - (ou(no)uo - ou(no),*) - ('o(nJuo- 'o(rJ'oo) * ('o(no)uo - 'o(no),oo)],
a, : o6(tto)"o - ou(r.)uo -, o(no)uo *' o(tduo + 2/3[(o6(n)uo- ou(z")too) - (ou(no)uo - ou(no)roo) -to(nJuo - to(n"),oo)
* ('o(no)uo - t o(zo),oo)1,
bo- btxo,* brXo;in2V*+ brsin2V*-')
ao I arXo, I arXo,sin,V^ I arsin2V*'
a, : 5/21(ou(no)uo - ou(no),oo) - (ou(rJ* - ou(/,J,oo)- ( 'o(zoLo - 'o(no),oo) * ( 'o(nJuo - 'o (nJ,oo)] ,
bo : ao+ 2/5(to(n")uo - 'o(no)uo) + 3/5[(r0(n")uo - 'o(nJ,oo)
- ('o(no)uo - 'o(rJ'.)],
b, : ar t ( 'o(nolo - to(no)roo) - ( 'o(rJuo - 'o(nJr*) ] ,
bz : az+ ('o(rJuo - to(n"),oo) - ('o(no)uo - to(no),oo)],
Case C: Or > 60 and O.A.P.: (0f0)
In this case also, the equation still has the same form as A26,
but the coefrcients are different.
,h : ou(tto).. - ou(nJuo -'o(nJuo * to(n")uo + 2/31(o6(n)uo- ou(nJ'oo) - (ou(no).. - ou(no)roo) - ('o(nJuo - 'o(rrJtoo)
+ (1.0(zo)uo - 'o(nJ,*)],
a, : 5/2\(ou(nJuo -ou(no)'oo) - (ou(nJuo - ou(nJ'oo)- ('o(noLo - 'o(no),oo) * ('o(nJuo - 'o(nJroo)],
a, : 5/21(ou(n")uo - ou(r"),oo) - (ou(nJuo - ou(zJ,oo)- ( 'o(nJuo - 'o(n") 'oo) * ( 'o(nJuo - 'o(rJ,oo)] ,
a, : ou(n")uo - ou(nJuo - 'o(nJuo *to(nJuo + 2/31(o6(n)uo- ou(r,.)'oo) - (ou(nJuo - (ou(/tJ'oo) - ('o(nJuo -'o(nJ,oo)
+ ('o(r?Juo - 'o(/d,oo)],
bo : ao+ 2/5( to(n)uo - 'o(nJuo) + 3/5[( 'o(no)uo - 'o(no),oo)- ( 'o(rJ- - 'o(nJ 'oo)] ,
br : ar + ('o(n")uo - to(nJ,oo) - ('o(ro)uo - to(rio),oo)],
bz : t t z * ( ' o (nJuo - ' o (nJ , * ) - ( ' o (nJuo - ' o (nJ ' * ) ] .