alkali Electrolysis Supporting Information efficient ... · S1 Supporting Information Cable-like...
59
S1 Supporting Information Cable-like Ru/WNO@C Nanowires for Simultaneously High- efficient Hydrogen Evolution and Low-energy Consumption Chlor- alkali Electrolysis Lu-Nan Zhang, a Zhong-Ling Lang,* a Yong-Hui Wang, a Hua-Qiao Tan,* a Hong-Ying Zang, a Zhen-Hui Kang* b and Yang-Guang Li* a a Key Laboratory of Polyoxometalate Science of Ministry of Eduction, Faculty of Chemistry, Northeast Normal University, Changchun, 130024 (P.R. China) b Jiangsu Key Laboratory for Carbon-based Functional Materials and Devices, Institute of Functional Nano and Soft Materials (FUNSOM), Soochow University, Suzhou 215123, China. * Corresponding authors E-mail adress: [email protected] (Z.L. Lang), [email protected] (H.Q. Tan), [email protected] (Z.H. Kang), [email protected]. (Y.G. Li). Postal address: Northeast Normal University, Renmin Street No. 5268, Changchun, Jilin Province, 130024, P. R. China Soochow University, Suzhou 215123, China. Table of contents Section Page Experimental Section and other Supplements S2-S7 Supporting Figures S8-S50 Supporting Tables S51-S56 References S57-S59 Electronic Supplementary Material (ESI) for Energy & Environmental Science. This journal is © The Royal Society of Chemistry 2019
Transcript of alkali Electrolysis Supporting Information efficient ... · S1 Supporting Information Cable-like...
S1
Supporting Information
Cable-like Ru/WNO@C Nanowires for Simultaneously High-
efficient Hydrogen Evolution and Low-energy Consumption Chlor-
alkali Electrolysis Lu-Nan Zhang,a Zhong-Ling Lang,*a Yong-Hui Wang,a Hua-Qiao Tan,*a Hong-Ying Zang,a Zhen-Hui Kang*b and Yang-Guang Li*a
a Key Laboratory of Polyoxometalate Science of Ministry of Eduction, Faculty of
Chemistry, Northeast Normal University, Changchun, 130024 (P.R. China)b Jiangsu Key Laboratory for Carbon-based Functional Materials and Devices,
Institute of Functional Nano and Soft Materials (FUNSOM), Soochow University,
Suzhou 215123, China.*Corresponding authors
E-mail adress: [email protected] (Z.L. Lang), [email protected] (H.Q.
Tan), [email protected] (Z.H. Kang), [email protected]. (Y.G. Li).
Postal address: Northeast Normal University, Renmin Street No. 5268, Changchun,
Jilin Province, 130024, P. R. China
Soochow University, Suzhou 215123, China.
Table of contents
Section Page
Experimental Section and other Supplements S2-S7
Supporting Figures S8-S50
Supporting Tables S51-S56
References S57-S59
Electronic Supplementary Material (ESI) for Energy & Environmental Science.This journal is © The Royal Society of Chemistry 2019

S2
Experimental Section and other Supplements
Analysis of Energy Consumption in Chlor-alkali Industry
According to W=V×1000/(1.492×η), in which “W” represents the electricity
consumption per ton of NaOH produced, “V” is referred to the cell voltage and “η” is
cathodic current efficiency, the tons of alkali electric consumption will be reduced by
67 kW·h/tNaOH for every 100 mV reduction of electrode overpotential. As a result,
more than $345 million would be saved annually around the world (the annual output
of NaOH is calculated to be 70 million tons, the cost is calculated at $ 0.074/kW·h
electricity).
Chemicals and Reagents
Ruthenium trichloride (RuCl3), poly(vinylpyrrolidone) (PVP, MW ≈ 24000), Ru
powder, Ru/C (5 wt%) and Nafion solution (5 wt%) are purchased from Aladdin.
Pt/C (20 wt%), urea, tungsten hexachloride (WCl6), glucose (C6H12O6), sodium
sulfate (Na2SO4), potassium hydroxide (KOH), potassium sulfate (K2SO4), potassium
dihydrogen phosphate (KH2PO4), sodium chloride (NaCl), graphite powder, sodium
hydroxide (NaOH) and anhydrous ethanol (EtOH) are purchased from Macklin. All
chemicals and solvents are used without further purification. Water (18.2 MΩ cm, 25
°C) used throughout our experiments is treated with a Millipore system. W18O49
nanowires used as precursor was synthesized according to a previous literature
procedure. Both RuO2/IrO2-coated Ti-mesh and low carbon steel electrodes are
purchased from Suzhou Shuertai industrial technology Co., LTD (China)
[https://m.tb.cn/h.3paVNqX].

S3
The preparation of precursor W18O49 NWs
The precursor W18O49 NWs were synthesized according to a modified reported
method. A mixture of 0.001 g of PVP and 0.3 g of WCl6 was dissolved in 400 mL of
ethanol. The obtained solution was transferred into a Teflon-lined stainless steel
autoclave and kept at 180 °C for 24 h. After the autoclave cooled to room temperature
naturally, W18O49 NWs were obtained by centrifugation and washed with deionized
water and ethanol several times.
The preparation of control samples
In order to demonstrate the role of N-doped carbon shells in Ru/WNO@C (Ru
wt%=3.37%) electrocatalyst, N doped carbon (labeled with N-C) and carbon (labeled
with C) have been prepared.
Synthesis of N-C
Pure urea was heated to 500 oC for 2 h with a heating rate of 2 oC min-1 in air, the as-
obtained C3N4 powder was then heated to 800 oC for 6 h in N2 atmosphere with a
ramp rate of 5 °C min-1.
Synthesis of C
Carbon without nitrogen (C) is obtained by the pyrolysis of glucose (C6H12O6) at 800
oC for 6 h with a heating rate of 5 °C min-1 in N2.
Materials characterization
The morphologies of the samples were characterized using field-emission scanning
electron microscopy (FESEM) on a Hitachi SU-8010 apparatus, transmission electron
microscopy (TEM) on a JEOL-2100F instrument and high angle annular dark-field
scanning TEM (HAADF-STEM) on a HF5000 at Dalian Institute of Chemical
S4
Physics, Chinese Academy of Sciences, China. The powder X-ray diffraction (PXRD)
measurements were carried out on a Rigaku D/max-IIB X-ray diffractometer with Cu-
Kα radiation (λ=1.5418Å). Raman spectrum was recorded on a Raman S3
spectrometer (JY, Labram HR 800). The element composition and valence states of
samples were studied on an ESCALAB 250 spectrometer (Thermo Electron Corp.)
with Al Kα radiation (hυ = 1486.6 eV) as the excitation source. The interrelated
energy dispersive X-ray detector (EDAX) spectra were achieved by using a SU8000
ESEM FEG microscope. The nitrogen sorption measurement was obtained on an
ASAP 2020 (Micromeritics, USA). The ICP-AES elemental analyses were performed
on a Prodigy Leeman ICP-AES spectrometer. The evolved gases during HER were
detected by gas chromatograph (Shimadzu, GC-2014C with a thermal conductivity
detector).
Electrochemical measurements
All electrochemical performance was measured using a CHI760E electrochemical
workstation (CH Instruments, China). The electrochemical performance was firstly
tested with a typical three-electrode system at room temperature. A modified glassy
carbon electrode (GCE, d=3 mm) was used as the working electrode, a saturated
calomel electrode was served as the reference electrode, and a carbon rod as the
counter electrode. All potentials were referenced to a reversible hydrogen electrode
(RHE) according to ERHE=ESCE+EΘSCE+0.059×pH. The linear sweep voltammetry
(LSV) measurements were tested with a scan rate of 5 mV s-1. All of the HER
polarization curves were iR-corrected according to the following equation: Ecorrected =

S5
Emeasured - iRs. Where Ecorrected is the iR-corrected potential, Emeasured and i are
experimentally measured potential and current, respectively. The LSV curves were
replotted as overpotential (η) versus the logarithm of the current density (log |j|) to
determine Tafel plots according to Tafel equation η = b log j + a. Electrochemical
impedance spectra (EIS) tests were carried out over a frequency range from 0.01 to
100 kHz and an amplitude of 10 mV. The EIS spectra were fitted by the Z-SimpWin
software. The electrochemical surface areas (ECSA) were obtained from cyclic
voltammetry curves (CVs) recorded in a potential range with no faradic current at
different scan rates from 25 to 200 mV s-1. The ECSA is evaluated by the double-
layer capacitance (Cdl) proportional to it. The value of Cdl was estimated by plotting
the Δj (ja - jc) at a certain voltage against the scan rate, where the slope is twice Cdl.
The range of voltage was from -1.1 to -0.9 V (vs. SCE, in 1 M KOH), -0.5 to -0.3 V
(vs. SCE, in 1 M PBS) and -0.1 to 0.1 V (vs. SCE, in 0.5 M H2SO4), respectively.
Electrochemical stability was measured using continuous cyclic voltammetric sweeps
at 0.1 V s-1 between -1.0 V and -1.2 V (vs. SCE) in 1 M KOH, between -0.6 V and -
0.8 V (vs. SCE) in 1 M PBS, and between -0.2 V and -0.4 V (vs. SCE) in 0.5 M
H2SO4. The long-term I-T curves were measured under fixed overpotentials in
different electrolytes. The activities of hydrogen evolution in chlor-alkali electrolysis
were measured in simulated chlor-alkali industrial electrolyte (3 M NaCl + 3 M
NaOH, pH = 14.4) at different temperature (20 °C to 90 °C). The simulated chlor-
alkali process (overall sodium chloride solution electrolysis) was performed in a
homemade two-electrode system with Ru/WNO@C (Ru wt%=3.37%) coated on

S6
carbon paper as the cathode for HER (hydrogen evolution reaction) and RuO2/IrO2-
coated Ti-plate as the anode catalyst for ClER (chlorine evolution reaction). For
comparison, the 20% Pt/C coated on carbon paper, low carbon steel and bare carbon
paper were also evaluated as reference cathodes. The long-term chronopotentiometric
(CP) measurement was studied at a constant cathodic current density of 10 mA cm-2
for 25 h. The electrolyte of the anode cell is supersaturated NaCl aqueous to ensure
sufficient chlorine source with the continuous ClER process, and the electrolyte of the
cathode cell is the aqueous solution of 3 M NaCl and 3 M NaOH. The two reaction
cells are separated by a cation exchange membrane to ensure the passage of Na+. All
the electrochemical measurements are represented with IR compensation.
Preparation of the working electrodes
The working electrode was prepared as follows: 2 mg of catalyst was dispersed in 200
μl of 0.5 wt% Nafion EtOH solution (the mass ratio of 5 wt% Nafion solution to
EtOH is 1:9). After fully sonication for at least 2 h, 4 μl of the homogeneous working
electrode ink was dropped onto the surface of a glassy carbon electrode (GCE) with a
diameter of 3 mm, leading to an approximate catalyst loading of 0.566 mg cm-2. The
electrode was then dried in air.
Carbon paper (1 cm × 2 cm) was used as the support of catalysts when the two-
electrode system was performed to simulate the chlorine-alkali process. Carbon
papers were sequentially degreased in 0.5 M H2SO4 for 0.5 h at 80 °C, cleaned
thoroughly in DI water and absolute ethanol, respectively. Then 50 μl of the ink was
drop cast onto the sides of carbon cloth (2 × 1 cm × 0.3 cm = 0.6 cm2) after dried in
S7
air at ambient temperature, the catalyst loading is 0.833 mg cm-2. Finally, the carbon
paper was dried naturally in air.
Preparation of electrolytes
0.5 M H2SO4 (pH = 0.30), 0.05 M H2SO4 + 0.45 M Na2SO4 (pH = 1.24), 5 mM
H2SO4 + 0.49 M Na2SO4 (pH = 2.77), 0.5 mM H2SO4 + 0.49 M Na2SO4 (pH = 3.83),
0.05 mM H2SO4 + 0.49 M Na2SO4 (pH = 4.93), 5 μM H2SO4 + 0.49 M Na2SO4 (pH =
5.80), 0.5μM H2SO4 +0.49 M Na2SO4 (pH = 6.25), 1 M KOH (pH = 14.00), 0.1 M
KOH + 0.6 M K2SO4 (pH = 12.76), 0.01 M KOH + 0.66 M K2SO4 (pH = 11.6), 1 mM
KOH + 0.66 M K2SO4 (pH = 10.46), 0.1 mM KOH + 0.66 M K2SO4 (pH = 9.77),
0.01 mM KOH + 0.66 M K2SO4 (pH = 9.25), 1 μM KOH + 0.66 M K2SO4 (pH = 8.9).
1 M PBS was prepared by dissolving 1.361 g KH2PO4 in 10 mL deionized water, and
the pH of the mixture was adjusted to 7.00 with 1 M KOH.
The simulated chlor-alkali industrial electrolyte (3 M NaCl + 3 M NaOH): 120 g
NaOH and 175.5 g NaCl were dissolved in deionized water, and the total volume of
the solution is 1000 mL (pH = 14.4).
Supporting Figures

S8
Fig. S1 (a) PXRD pattern and (b) TEM image of precursor W18O49 NWs.

S9
Fig. S2 (a)-(b) TEM images of WNO@C; (c)-(d) TEM images of Ru/WNO@C (Ru
wt%=0.46%); (e)-(f) TEM images of Ru/WNO@C (Ru wt%=1.01%).
S10
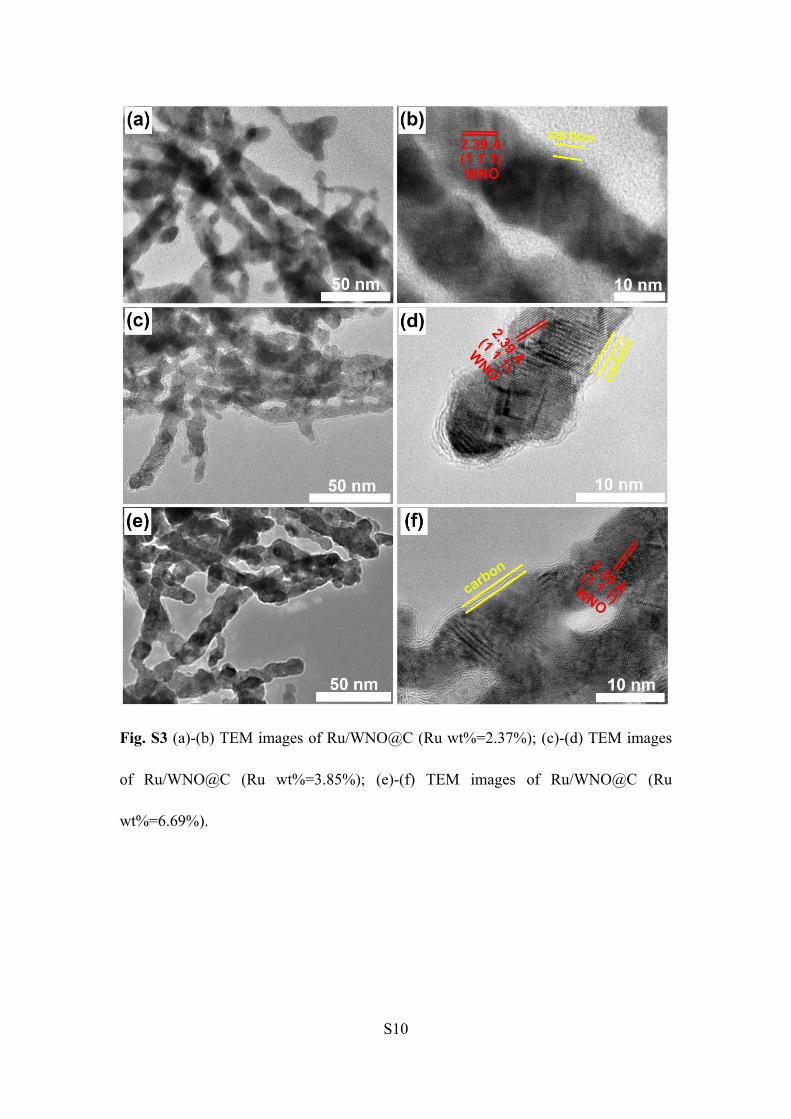
Fig. S3 (a)-(b) TEM images of Ru/WNO@C (Ru wt%=2.37%); (c)-(d) TEM images
of Ru/WNO@C (Ru wt%=3.85%); (e)-(f) TEM images of Ru/WNO@C (Ru
wt%=6.69%).

S11
Fig. S4 PXRD patterns of WNO@C and series of Ru/WNO@C with different Ru
mass loading.
Fig. S5 PXRD pattern of Ru NPs@C. The average grain size of Ru NPs@C was
calculated to be 38.34 nm using Debye-Scherrer method.
S12
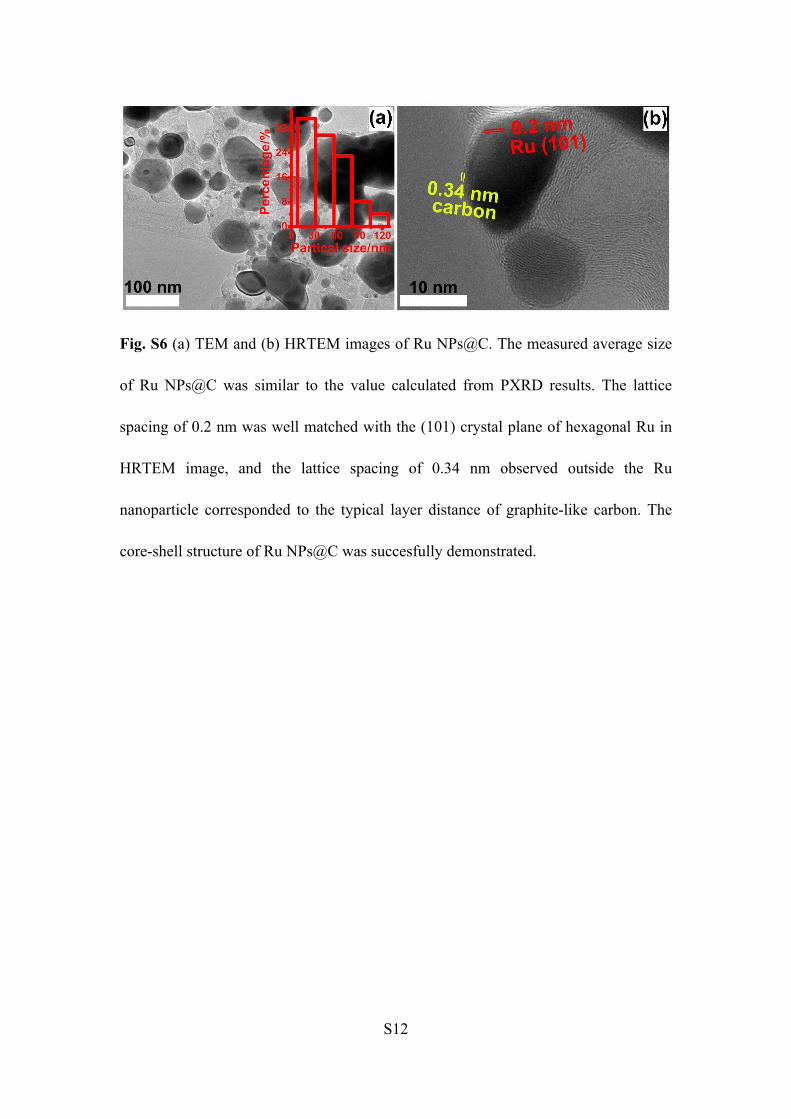
Fig. S6 (a) TEM and (b) HRTEM images of Ru NPs@C. The measured average size
of Ru NPs@C was similar to the value calculated from PXRD results. The lattice
spacing of 0.2 nm was well matched with the (101) crystal plane of hexagonal Ru in
HRTEM image, and the lattice spacing of 0.34 nm observed outside the Ru
nanoparticle corresponded to the typical layer distance of graphite-like carbon. The
core-shell structure of Ru NPs@C was succesfully demonstrated.
S13

S14
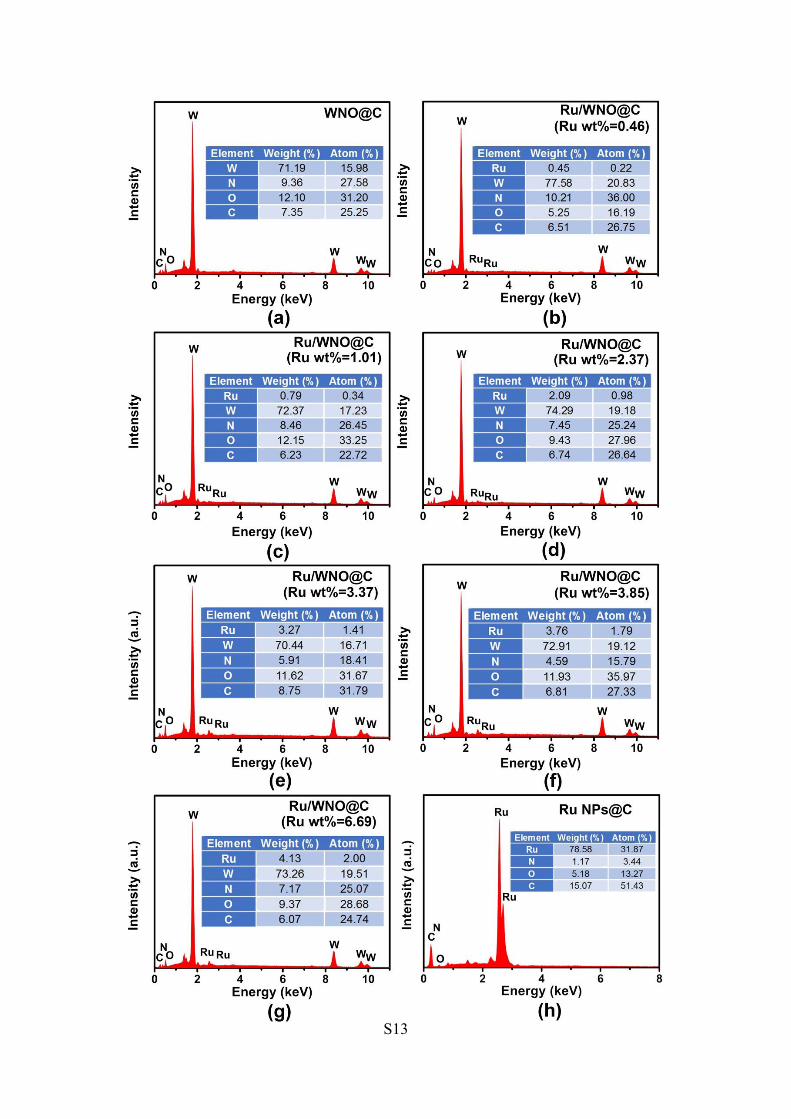
Fig. S7 EDAX spectra of (a) WNO@C, (b)-(g) series of Ru/WNO@C with different
Ru mass loading and (h) Ru NPs@C.
Fig. S8 XPS full-scan spectrum of Ru/WNO@C (Ru wt%=3.37%).
Fig. S9 XPS full-scan spectra of Ru NPs@C and WNO@C.

S15
Fig. S10 The high-resolution (a) N 1s and (b) C 1s spectra of Ru NPs@C. The high-
resolution N 1s spectrum shows three peaks at 398.17, 400.02 and 401.05 eV,
corresponding to pyridinic N, pyrrolic N and graphitic N, respectively; The high-
resolution C 1s and Ru 3d spectrum dispalys two peaks at 280.40 and 284.49 eV,
which can be assigned to Ru 3d5/2 and Ru 3d3/2, respectively. The peaks at 284.48 and
285.33 eV are attributed to C=C/C-C and C-N bonds, respectively. These XPS data
clearly prove that there is N doping in the carbon layers of Ru NPs@C.
Fig. S11 The high-resolution C 1s spectrum of WNO@C. The peaks located at 284.44,
284.96, 285.94 and 288.56 eV are attributed to C=C/C-C, C-N, C-O and C=O,

S16
respectively. The existence of C-N demonstrates the N doping in carbon.
Fig. S12 (a) W 4f, (b) N 1s and (c) O 1s high-resolution spectra of Ru/WNO@C (Ru
wt%=3.37%) and WNO@C; (d) Ru 3p spectra of Ru/WNO@C (Ru wt%=3.37%),
RuCl3 and Ru NPs@C.

S17
Fig. S13 the N2 adsorption-desorption isotherms of Ru/WNO@C (Ru wt%=3.37%)
and WNO@C. Ru/WNO@C (Ru wt%=3.37%) exhibits similar BET surface area with
WNO@C, proving that the introduction of ruthenium did not cause obvious
agglomeration. The typical IV hysteresis-loop of Ru/WNO@C (Ru wt%=3.37%)
demonstrates the mesoporous structure. Such a mesoporous structure could expose
more catalytic active sites and promote the infiltration of reactants and electrolyte.S1

S18
Fig. S14 Fourier transform infrared (FTIR) spectrum of Ru/WNO@C (Ru
wt%=3.37%) shows stretching vibrations of O-H (3157.96 cm-1), C=O (1598.8 cm-1)
and C=C (1399.14 cm-1) functional groups, indicating the presence of hydrophilic
groups (-COOH and -OH) on the surface of catalyst.S2
Fig. S15 Raman spectrum of Ru/WNO@C (Ru wt%=3.37%). The peaks located at
251, 684 and 796 cm-1 are ascribed to the WNO phase.S3-S4
Fig. S16 The LSV curves of Ru/WNO@C (Ru wt%=3.37%) in 1 M KOH with and
S19
without iR-compensation.
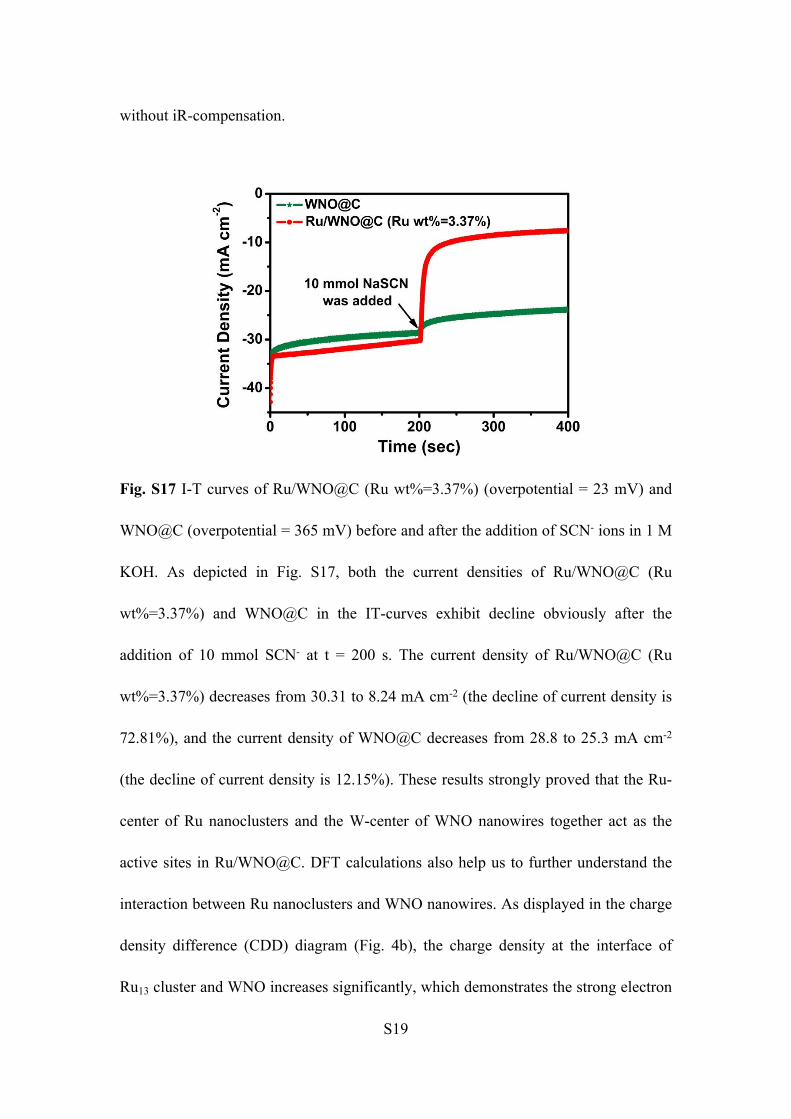
Fig. S17 I-T curves of Ru/WNO@C (Ru wt%=3.37%) (overpotential = 23 mV) and
WNO@C (overpotential = 365 mV) before and after the addition of SCN- ions in 1 M
KOH. As depicted in Fig. S17, both the current densities of Ru/WNO@C (Ru
wt%=3.37%) and WNO@C in the IT-curves exhibit decline obviously after the
addition of 10 mmol SCN- at t = 200 s. The current density of Ru/WNO@C (Ru
wt%=3.37%) decreases from 30.31 to 8.24 mA cm-2 (the decline of current density is
72.81%), and the current density of WNO@C decreases from 28.8 to 25.3 mA cm-2
(the decline of current density is 12.15%). These results strongly proved that the Ru-
center of Ru nanoclusters and the W-center of WNO nanowires together act as the
active sites in Ru/WNO@C. DFT calculations also help us to further understand the
interaction between Ru nanoclusters and WNO nanowires. As displayed in the charge
density difference (CDD) diagram (Fig. 4b), the charge density at the interface of
Ru13 cluster and WNO increases significantly, which demonstrates the strong electron

S20
interaction between Ru and WNO in the composite electrocatalyst. Combined with
the experimental results and DFT calculation, we infer that the interaction at the
interface between WNO and Ru nanocluster optimizes the electronic property and
produces synergistic effect, which endows the Ru/WNO@C with suitable adsorbed
free energy of hydrogen (ΔGH*) and low barrier of water dissociation (ΔGB), as well
as fast electron transfer ability. Moreover, the current density of Ru/WNO@C (Ru
wt%=3.37%) reduces to 8.24 mA cm-2 after the addition of SCN-, indicating that the
carbon and nitrogen elements might also contribute to the HER activity besides Ru
and W-center. The HER performance of carbon (C) and nitrogen-doped carbon (N-C)
in 1 M KOH has been tested to verify this speculation in Fig S19 in supporting
information.
Fig. S18 PXRD patterns of C and N-C. The PXRD patterns of N-C and C show
similar characteristic peaks of graphite carbon.
S21
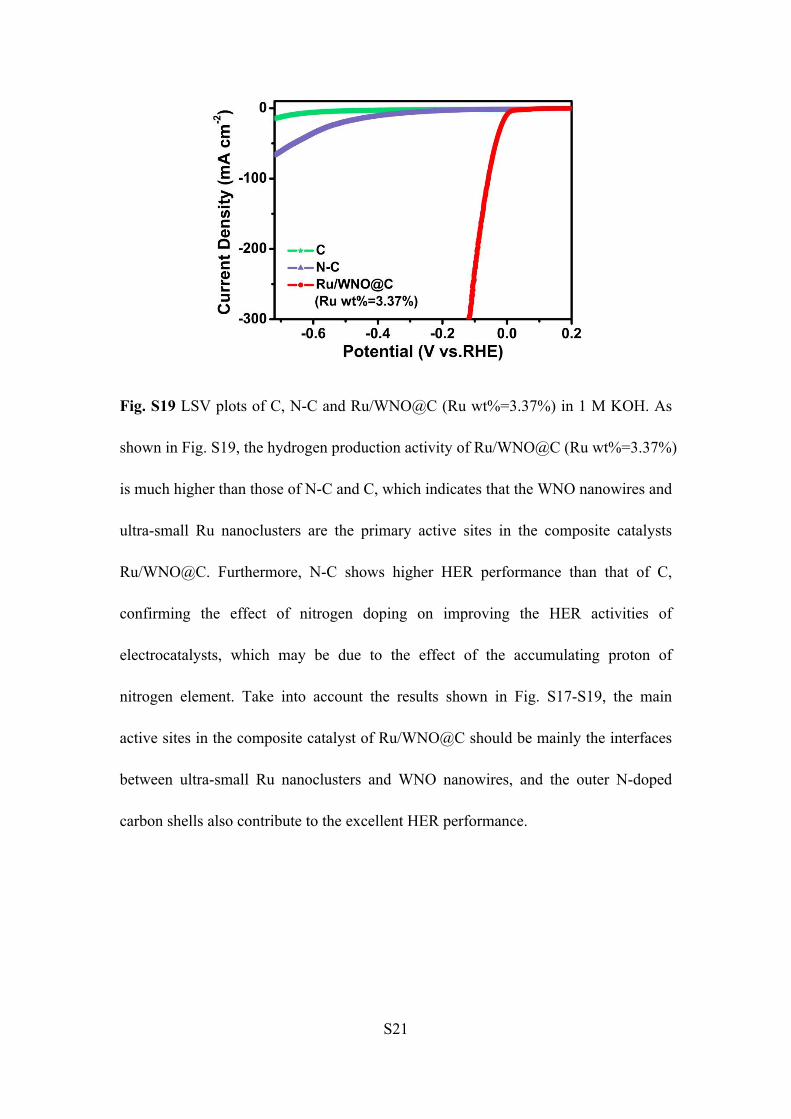
Fig. S19 LSV plots of C, N-C and Ru/WNO@C (Ru wt%=3.37%) in 1 M KOH. As
shown in Fig. S19, the hydrogen production activity of Ru/WNO@C (Ru wt%=3.37%)
is much higher than those of N-C and C, which indicates that the WNO nanowires and
ultra-small Ru nanoclusters are the primary active sites in the composite catalysts
Ru/WNO@C. Furthermore, N-C shows higher HER performance than that of C,
confirming the effect of nitrogen doping on improving the HER activities of
electrocatalysts, which may be due to the effect of the accumulating proton of
nitrogen element. Take into account the results shown in Fig. S17-S19, the main
active sites in the composite catalyst of Ru/WNO@C should be mainly the interfaces
between ultra-small Ru nanoclusters and WNO nanowires, and the outer N-doped
carbon shells also contribute to the excellent HER performance.

S22
Fig. S20 (a) HER polarization curves of WNO@C and Ru/WNO@C (different Ru
content) in 1 M KOH; (b) corresponding Tafel plots of Ru/WNO@C (different Ru
content) in 1 M KOH; (c) mass activities of Ru/WNO@C (different Ru content) in 1
M KOH; (d) specific activities and mass activities of Ru/WNO@C (different Ru
content) at overpotential of 50 mV in 1 M KOH.

S23
Fig. S21 Powder XRD patterns of (a) Ru/WOx@C-500, (b) Ru/WNO@C-600, (c)
Ru/WNO@C-700 and (d) Ru/WC/W2C/WNO@C-900. When pyrolysis temperature
is 500 oC, W18O49 can not be converted into WNO, and the composite of amorphous
carbon and WOx was obtained. WNO could be obtained when pyrolysis temperature
rises to 600 and 700 oC, Ru/WNO@C-700 shows better crystallinity than
Ru/WNO@C-600. The pyrolysis temperature rising to 900 oC leads to the partially
carbonization of W18O49, resulting in the composite of WC, W2C and WNO. The
Ru/RuOx peak was not found in the PXRD patterns of all these catalysts pyrolyzed at
different temperatures.

S24
Fig. S22 EDAX spectra of (a) Ru/WOx@C-500, (b) Ru/WNO@C-600, (c)
Ru/WNO@C-700 and (d) Ru/WC/W2C/WNO@C-900.

S25
Fig. S23 (a) SEM image and (b) TEM image of Ru/WOx@C-500; (c)-(h) STEM
image and EDAX elemental mapping of (d) Ru, (e) W, (f) N, (g) O and (h) C in
Ru/WOx@C-500. The Ru/WOx@C-500 does not exhibit the nanowire morphology of
the precursor, which is due to the presence of a large amount of carbon due to the
relatively low pyrolysis temperature.

S26
Fig. S24 (a) SEM image and (b) TEM image of Ru/WNO@C-600; (c)-(h) STEM
image and EDAX elemental mapping of (d) Ru, (e) W, (f) N, (g) O and (h) C in
Ru/WNO@C-600.

S27
Fig. S25 (a) SEM image and (b) TEM image of Ru/WNO@C-700; (c)-(h) STEM
image and EDAX elemental mapping of (d) Ru, (e) W, (f) N, (g) O and (h) C in
Ru/WNO@C-700. As shown in Fig. S24-S25, Ru/WNO@C-600 and Ru/WNO@C-
700 exhibit nanowire morphology.

S28
Fig. S26 (a) SEM image and (b) TEM image of Ru/WC/W2C/WNO@C-900; (c)-(h)
STEM image and EDAX elemental mapping of (d) Ru, (e) W, (f) N, (g) O and (h) C
in Ru/WC/W2C/WNO@C-900. The Ru/WC/W2C/WNO@C-900 failed to retain well
the nanowire morphology while exists partially agglomeration when the pyrolysis
temperature rises to 900 oC.

S29
Fig. S27 (a) HER polarization curves of Ru/WOx@C-500, Ru/WNO@C-600,
Ru/WNO@C-700, Ru/WNO@C-800 (Ru wt%=3.37%) and Ru/WC/W2C/WNO@C-
900 and (b) corresponding Tafel plots in 1 M KOH. These experimental results show
that 800 oC is the optimal pyrolysis temperature.
S30
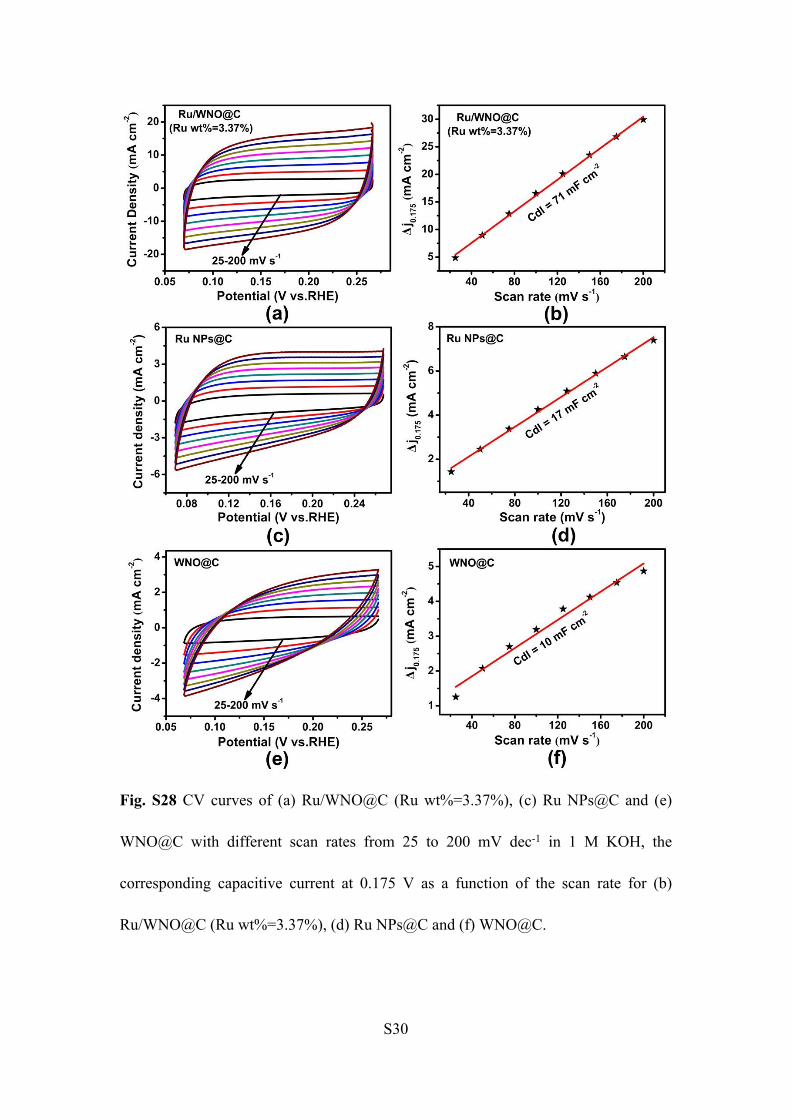
Fig. S28 CV curves of (a) Ru/WNO@C (Ru wt%=3.37%), (c) Ru NPs@C and (e)
WNO@C with different scan rates from 25 to 200 mV dec-1 in 1 M KOH, the
corresponding capacitive current at 0.175 V as a function of the scan rate for (b)
Ru/WNO@C (Ru wt%=3.37%), (d) Ru NPs@C and (f) WNO@C.

S31
Fig. S29 Electrochemical impedance spectra (EIS) of Ru/WNO@C (Ru wt%=3.37%)
measured with overpotentials from 50 to 250 mV in 1 M KOH. Inset: two-time-
constant model equivalent circuit used for data fitting of EIS spectra.
Fig. S30 I-T curve of Ru/WNO@C (Ru wt%=3.37%) at a fixed overpotential of 5 mV.
S32
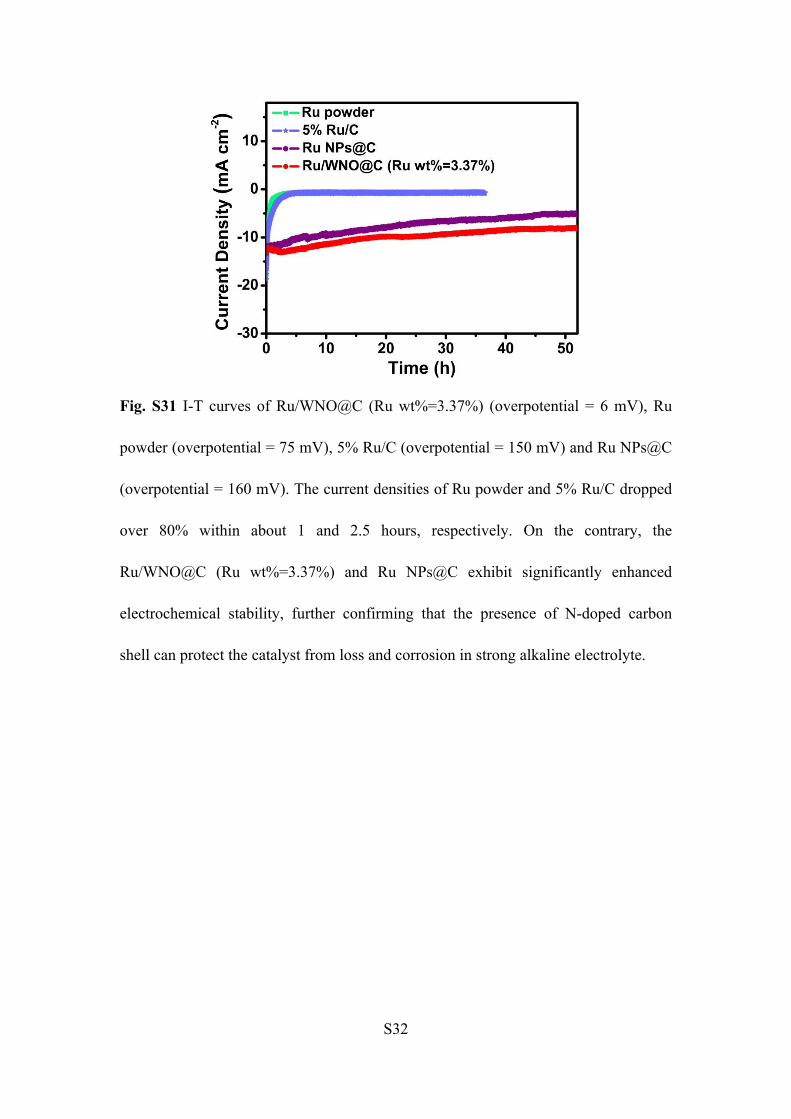
Fig. S31 I-T curves of Ru/WNO@C (Ru wt%=3.37%) (overpotential = 6 mV), Ru
powder (overpotential = 75 mV), 5% Ru/C (overpotential = 150 mV) and Ru NPs@C
(overpotential = 160 mV). The current densities of Ru powder and 5% Ru/C dropped
over 80% within about 1 and 2.5 hours, respectively. On the contrary, the
Ru/WNO@C (Ru wt%=3.37%) and Ru NPs@C exhibit significantly enhanced
electrochemical stability, further confirming that the presence of N-doped carbon
shell can protect the catalyst from loss and corrosion in strong alkaline electrolyte.
S33
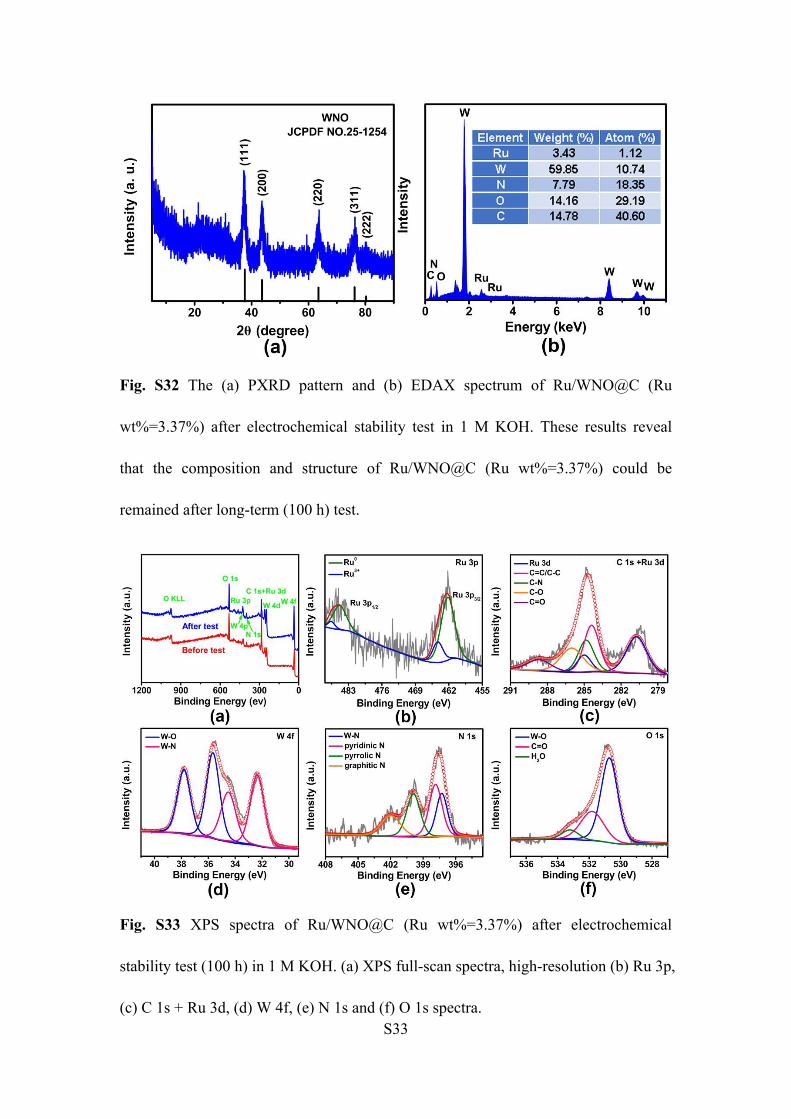
Fig. S32 The (a) PXRD pattern and (b) EDAX spectrum of Ru/WNO@C (Ru
wt%=3.37%) after electrochemical stability test in 1 M KOH. These results reveal
that the composition and structure of Ru/WNO@C (Ru wt%=3.37%) could be
remained after long-term (100 h) test.
Fig. S33 XPS spectra of Ru/WNO@C (Ru wt%=3.37%) after electrochemical
stability test (100 h) in 1 M KOH. (a) XPS full-scan spectra, high-resolution (b) Ru 3p,
(c) C 1s + Ru 3d, (d) W 4f, (e) N 1s and (f) O 1s spectra.

S34
Fig. S34 TEM image of Ru/WNO@C (Ru wt%=3.37%) after long-term (100 h)
electrochemical stability test in 1 M KOH. The image demonstrates that the
morphology of Ru/WNO@C (Ru wt%=3.37%) catalyst shows negligible change after
electrochemical test.
Fig. S35 Illustration of the optimized model (2×2 supercell) with Ru13, WNO, and
carbon layer included. The model with carbon layer adsorbed upon the Ru13/WNO
which interacted through the Ru side (a) was computed to 1.60 eV more stable than
that down to the WNO side (b). Color code: W (light blue), N (yellow), Ru (purple),
O (red), and C (gray).
S35
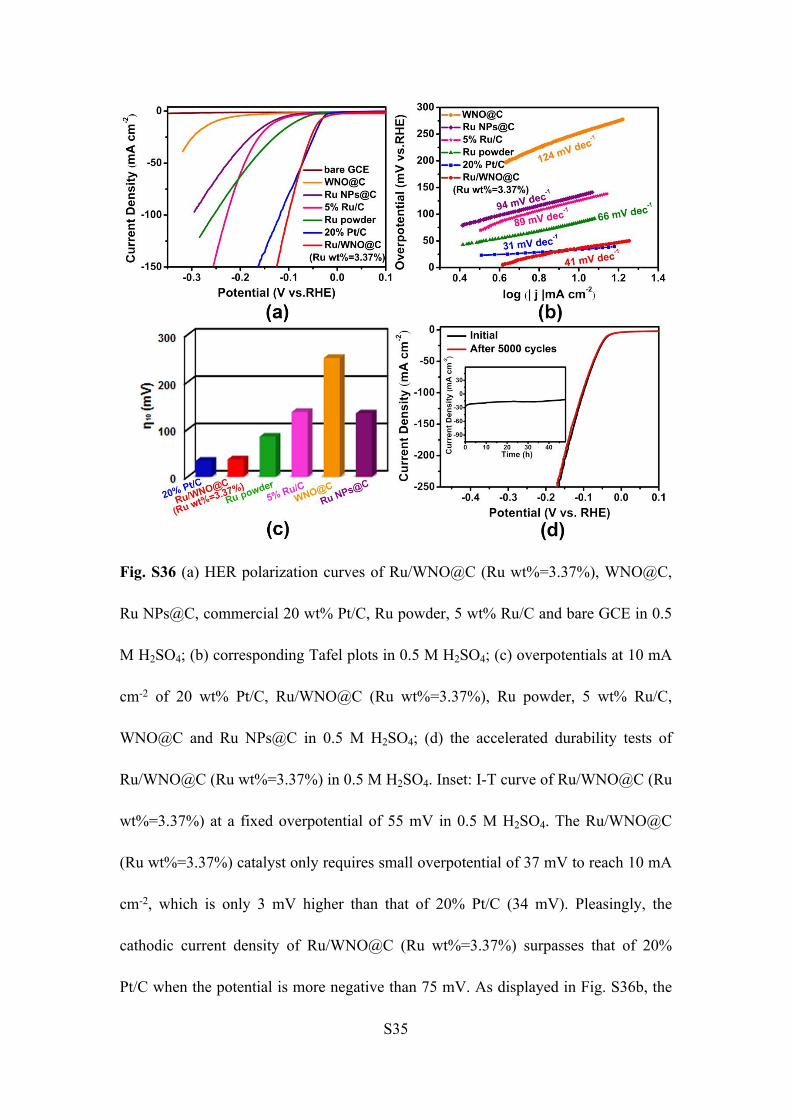
Fig. S36 (a) HER polarization curves of Ru/WNO@C (Ru wt%=3.37%), WNO@C,
Ru NPs@C, commercial 20 wt% Pt/C, Ru powder, 5 wt% Ru/C and bare GCE in 0.5
M H2SO4; (b) corresponding Tafel plots in 0.5 M H2SO4; (c) overpotentials at 10 mA
cm-2 of 20 wt% Pt/C, Ru/WNO@C (Ru wt%=3.37%), Ru powder, 5 wt% Ru/C,
WNO@C and Ru NPs@C in 0.5 M H2SO4; (d) the accelerated durability tests of
Ru/WNO@C (Ru wt%=3.37%) in 0.5 M H2SO4. Inset: I-T curve of Ru/WNO@C (Ru
wt%=3.37%) at a fixed overpotential of 55 mV in 0.5 M H2SO4. The Ru/WNO@C
(Ru wt%=3.37%) catalyst only requires small overpotential of 37 mV to reach 10 mA
cm-2, which is only 3 mV higher than that of 20% Pt/C (34 mV). Pleasingly, the
cathodic current density of Ru/WNO@C (Ru wt%=3.37%) surpasses that of 20%
Pt/C when the potential is more negative than 75 mV. As displayed in Fig. S36b, the

S36
corresponding Tafel slope is calculated to be 41 mV dec-1, which is slightly higher
than that of 20% Pt/C, suggesting the HER process occurred via the Volmer-
Heyrovsky mechanism. The overpotentials at 10 mA cm-2 of 20% Pt/C, Ru/WNO@C
(Ru wt%=3.37%), Ru powder, 5% Ru/C, WNO@C and Ru NPs@C in 0.5 M H2SO4
have been summarized in Fig. S36c, the η10 of Ru/WNO@C (Ru wt%=3.37%) is only
slightly higher than that of 20% Pt/C, while much lower than those of the other
catalysts, demonstrating the satisfactory electrocatalytic activity of Ru/WNO@C (Ru
wt%=3.37%) in 0.5 M H2SO4. The accelerated durability tests and long-term I-T tests
of Ru/WNO@C (Ru wt%=3.37%) in 0.5 M H2SO4 were also performed (Fig. S36d),
and the results reveal that the composite catalyst possesses remarkable durability in
acidic media.

S37
Fig. S37 (a) CV curves of Ru/WNO@C (Ru wt%=3.37%) with different scan rates
from 25 to 200 mV s-1 in 0.5 M H2SO4; (b) the corresponding capacitive current at
0.25 V as a function of the scan rate for Ru/WNO@C (Ru wt%=3.37%); (c)
electrochemical impedance spectra (EIS) of Ru/WNO@C (Ru wt%=3.37%) measured
with overpotentials from 50 to 250 mV in 0.5 M H2SO4. Inset: two-time-constant
model equivalent circuit used for data fitting of EIS spectra; (d) faradaic efficiency of
Ru/WNO@C (Ru wt%=3.37%) towards HER in 0.5 M H2SO4 at several
overpotentials. The Ru/WNO@C (Ru wt%=3.37%) possesses large Cdl value of 69
mF cm-2, low electrochemical impedance of 8.20 Ω at overpotential of 150 mV and
high Faraday Efficiency close to 100% in 0.5 M H2SO4, proving the excellent kinetics
of Ru/WNO@C (Ru wt%=3.37%) in acid electrolyte.
S38
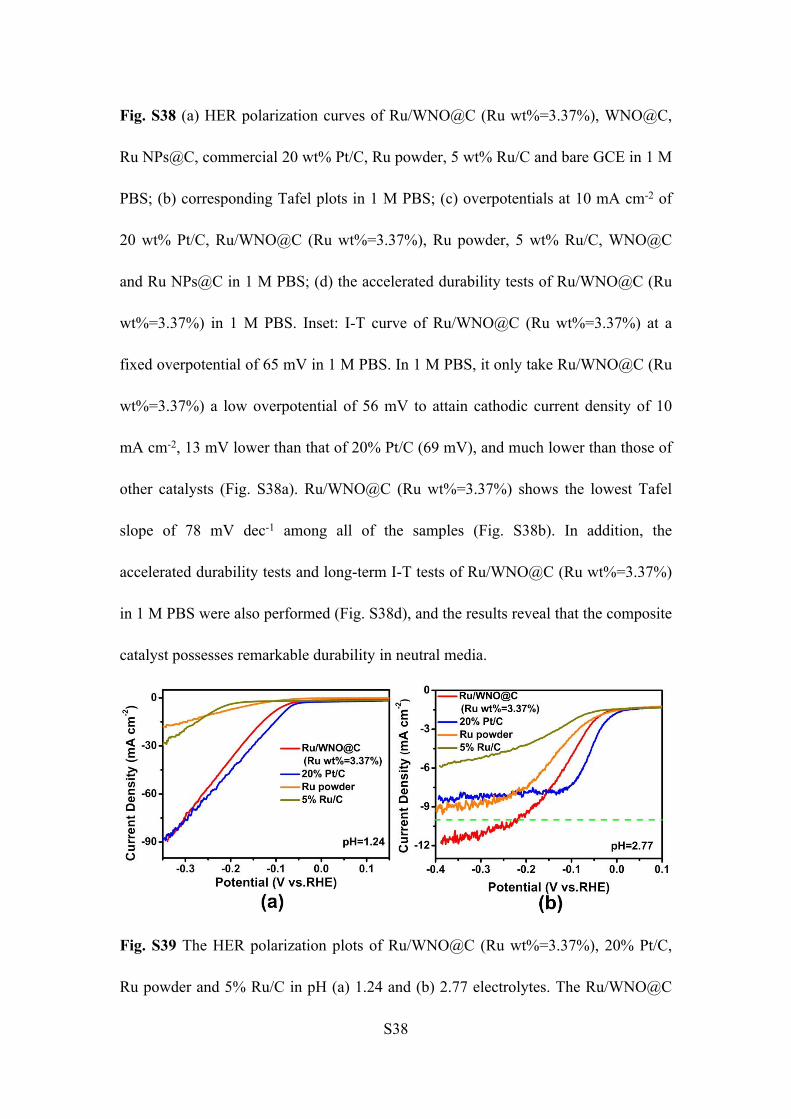
Fig. S38 (a) HER polarization curves of Ru/WNO@C (Ru wt%=3.37%), WNO@C,
Ru NPs@C, commercial 20 wt% Pt/C, Ru powder, 5 wt% Ru/C and bare GCE in 1 M
PBS; (b) corresponding Tafel plots in 1 M PBS; (c) overpotentials at 10 mA cm-2 of
20 wt% Pt/C, Ru/WNO@C (Ru wt%=3.37%), Ru powder, 5 wt% Ru/C, WNO@C
and Ru NPs@C in 1 M PBS; (d) the accelerated durability tests of Ru/WNO@C (Ru
wt%=3.37%) in 1 M PBS. Inset: I-T curve of Ru/WNO@C (Ru wt%=3.37%) at a
fixed overpotential of 65 mV in 1 M PBS. In 1 M PBS, it only take Ru/WNO@C (Ru
wt%=3.37%) a low overpotential of 56 mV to attain cathodic current density of 10
mA cm-2, 13 mV lower than that of 20% Pt/C (69 mV), and much lower than those of
other catalysts (Fig. S38a). Ru/WNO@C (Ru wt%=3.37%) shows the lowest Tafel
slope of 78 mV dec-1 among all of the samples (Fig. S38b). In addition, the
accelerated durability tests and long-term I-T tests of Ru/WNO@C (Ru wt%=3.37%)
in 1 M PBS were also performed (Fig. S38d), and the results reveal that the composite
catalyst possesses remarkable durability in neutral media.
Fig. S39 The HER polarization plots of Ru/WNO@C (Ru wt%=3.37%), 20% Pt/C,
Ru powder and 5% Ru/C in pH (a) 1.24 and (b) 2.77 electrolytes. The Ru/WNO@C

S39
(Ru wt%=3.37%) catalyst requires 109 mV to achieve current density of 10 mA cm-2
in pH 1.24 electrolyte (Fig. S39a), which is slightly larger than that of 20% Pt/C (87
mV). Similar to the phenomenon in 0.5 M H2SO4, the current density of Ru/WNO@C
(Ru wt%=3.37%) would outperform 20% Pt/C when the potential is higher than 315
mV. In 2.77 pH electrolyte (Fig. S39b), although 20% Pt/C shows a smaller onset
potential than Ru/WNO@C (Ru wt%=3.37%), the current density of 20% Pt/C
remains constant at 8 mA cm-2 while Ru/WNO@C (Ru wt%=3.37%) could reach 12
mA cm-2.
Fig. S40 The HER polarization plots of Ru/WNO@C (Ru wt%=3.37%), 20% Pt/C,
Ru powder and 5% Ru/C in pH (a) 3.83, (b) 4.93 (c) 5.8 and (d) 6.25 electrolytes.

S40
Fig. S41 The HER polarization plots of Ru/WNO@C (Ru wt%=3.37%), 20% Pt/C,
Ru powder and 5% Ru/C in pH (a) 8.9, (b) 9.25, (c) 9.77, (d) 10.46, (e) 11.6 and (f)
12.76 electrolytes.
S41
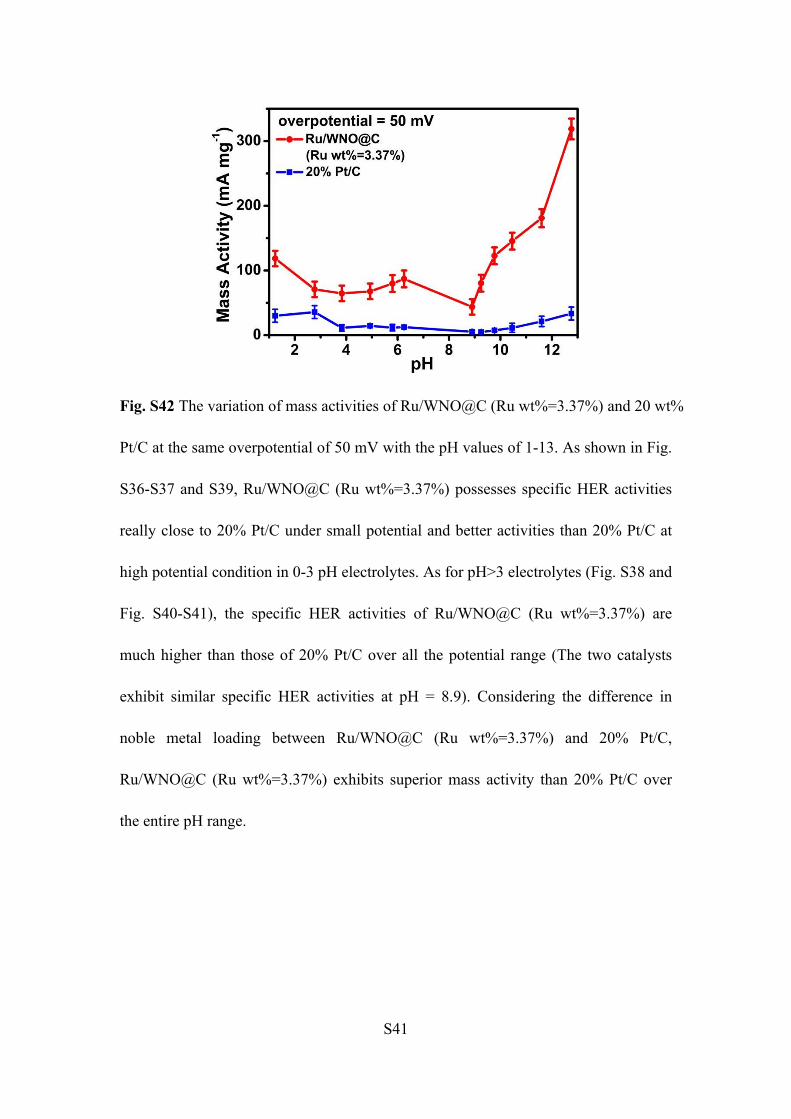
Fig. S42 The variation of mass activities of Ru/WNO@C (Ru wt%=3.37%) and 20 wt%
Pt/C at the same overpotential of 50 mV with the pH values of 1-13. As shown in Fig.
S36-S37 and S39, Ru/WNO@C (Ru wt%=3.37%) possesses specific HER activities
really close to 20% Pt/C under small potential and better activities than 20% Pt/C at
high potential condition in 0-3 pH electrolytes. As for pH>3 electrolytes (Fig. S38 and
Fig. S40-S41), the specific HER activities of Ru/WNO@C (Ru wt%=3.37%) are
much higher than those of 20% Pt/C over all the potential range (The two catalysts
exhibit similar specific HER activities at pH = 8.9). Considering the difference in
noble metal loading between Ru/WNO@C (Ru wt%=3.37%) and 20% Pt/C,
Ru/WNO@C (Ru wt%=3.37%) exhibits superior mass activity than 20% Pt/C over
the entire pH range.
S42
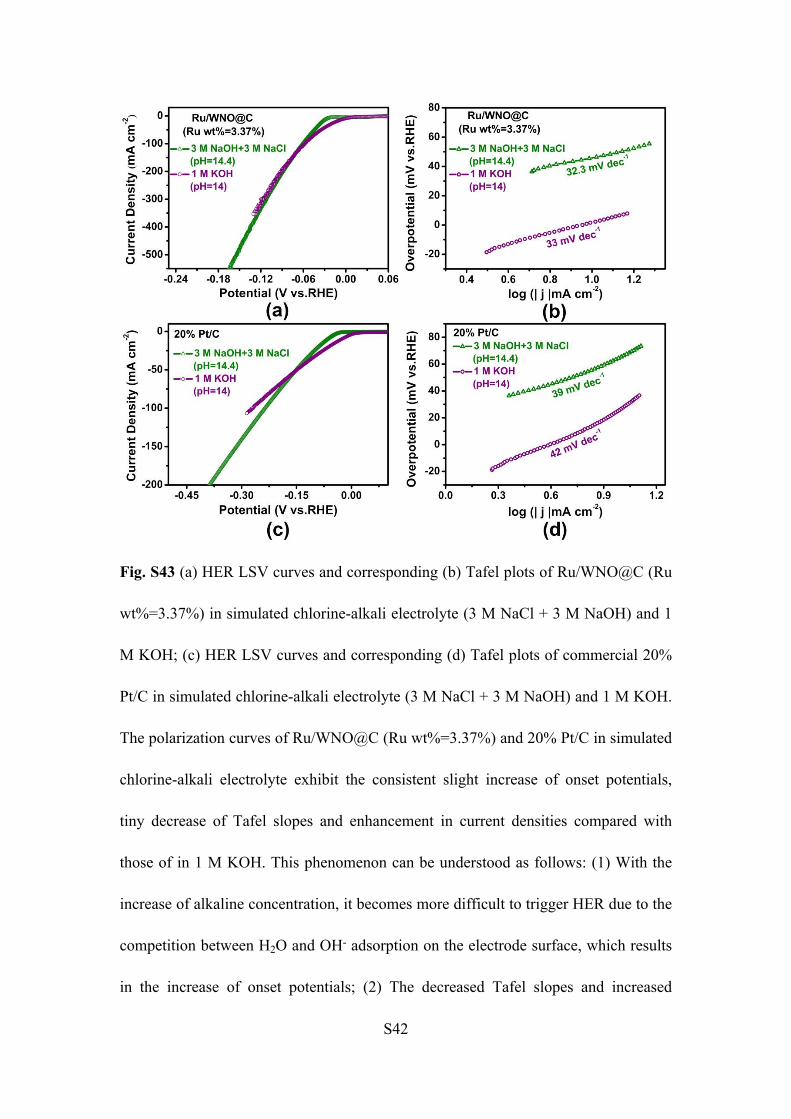
Fig. S43 (a) HER LSV curves and corresponding (b) Tafel plots of Ru/WNO@C (Ru
wt%=3.37%) in simulated chlorine-alkali electrolyte (3 M NaCl + 3 M NaOH) and 1
M KOH; (c) HER LSV curves and corresponding (d) Tafel plots of commercial 20%
Pt/C in simulated chlorine-alkali electrolyte (3 M NaCl + 3 M NaOH) and 1 M KOH.
The polarization curves of Ru/WNO@C (Ru wt%=3.37%) and 20% Pt/C in simulated
chlorine-alkali electrolyte exhibit the consistent slight increase of onset potentials,
tiny decrease of Tafel slopes and enhancement in current densities compared with
those of in 1 M KOH. This phenomenon can be understood as follows: (1) With the
increase of alkaline concentration, it becomes more difficult to trigger HER due to the
competition between H2O and OH- adsorption on the electrode surface, which results
in the increase of onset potentials; (2) The decreased Tafel slopes and increased
S43
current densities should be attributed to the accelerated ion transfer rate derived from
the proper increase of concentration of supporting electrolyte.
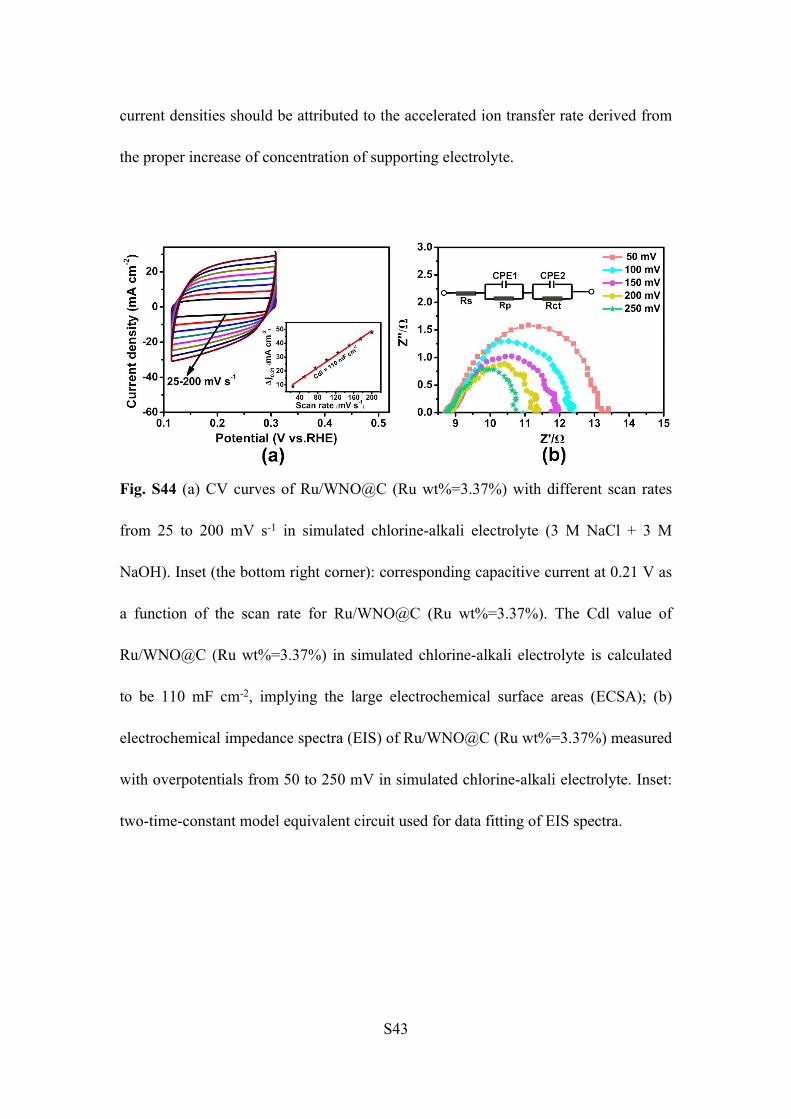
Fig. S44 (a) CV curves of Ru/WNO@C (Ru wt%=3.37%) with different scan rates
from 25 to 200 mV s-1 in simulated chlorine-alkali electrolyte (3 M NaCl + 3 M
NaOH). Inset (the bottom right corner): corresponding capacitive current at 0.21 V as
a function of the scan rate for Ru/WNO@C (Ru wt%=3.37%). The Cdl value of
Ru/WNO@C (Ru wt%=3.37%) in simulated chlorine-alkali electrolyte is calculated
to be 110 mF cm-2, implying the large electrochemical surface areas (ECSA); (b)
electrochemical impedance spectra (EIS) of Ru/WNO@C (Ru wt%=3.37%) measured
with overpotentials from 50 to 250 mV in simulated chlorine-alkali electrolyte. Inset:
two-time-constant model equivalent circuit used for data fitting of EIS spectra.
S44
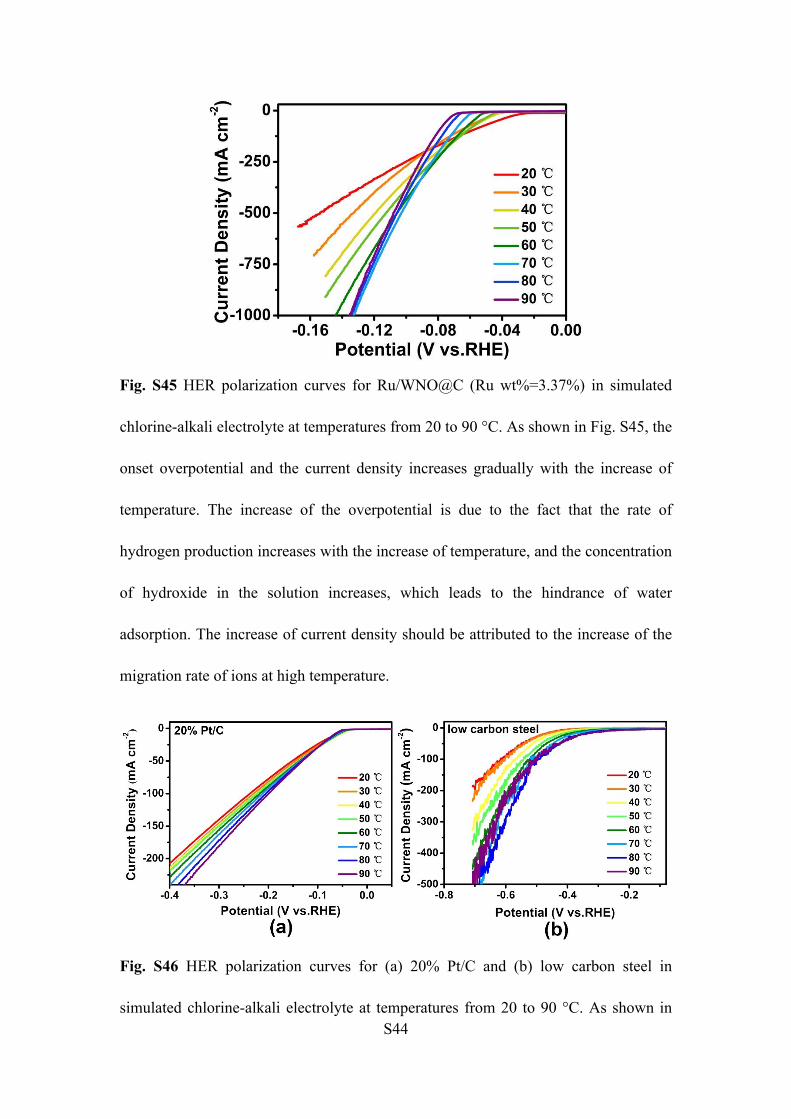
Fig. S45 HER polarization curves for Ru/WNO@C (Ru wt%=3.37%) in simulated
chlorine-alkali electrolyte at temperatures from 20 to 90 °C. As shown in Fig. S45, the
onset overpotential and the current density increases gradually with the increase of
temperature. The increase of the overpotential is due to the fact that the rate of
hydrogen production increases with the increase of temperature, and the concentration
of hydroxide in the solution increases, which leads to the hindrance of water
adsorption. The increase of current density should be attributed to the increase of the
migration rate of ions at high temperature.
Fig. S46 HER polarization curves for (a) 20% Pt/C and (b) low carbon steel in
simulated chlorine-alkali electrolyte at temperatures from 20 to 90 °C. As shown in
S45
the Fig. S46, the overpotential of low carbon steel and 20% Pt/C catalysts does not
change obviously with the increase of temperature, indicating the slow rates of H+
consumption, further proving the relatively poor intrinsic hydrogen production
activity of low carbon steel and 20% Pt/C.
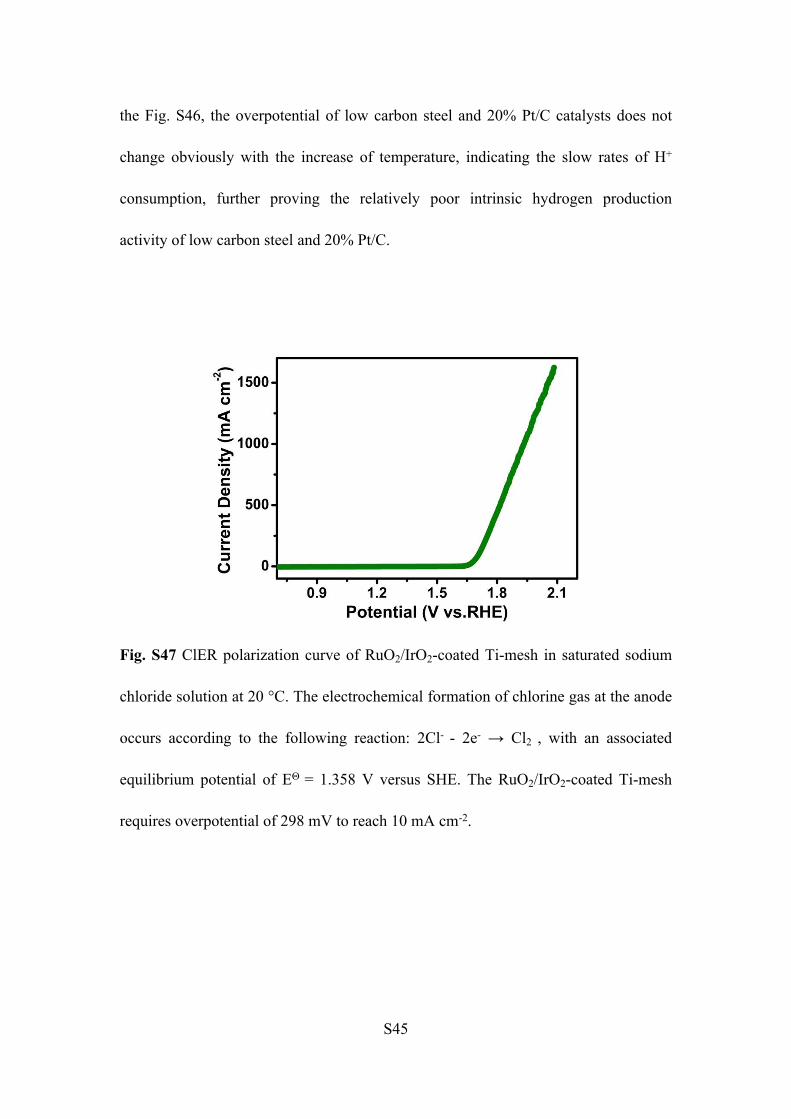
Fig. S47 ClER polarization curve of RuO2/IrO2-coated Ti-mesh in saturated sodium
chloride solution at 20 °C. The electrochemical formation of chlorine gas at the anode
occurs according to the following reaction: 2Cl- - 2e- → Cl2 , with an associated
equilibrium potential of EΘ = 1.358 V versus SHE. The RuO2/IrO2-coated Ti-mesh
requires overpotential of 298 mV to reach 10 mA cm-2.
S46
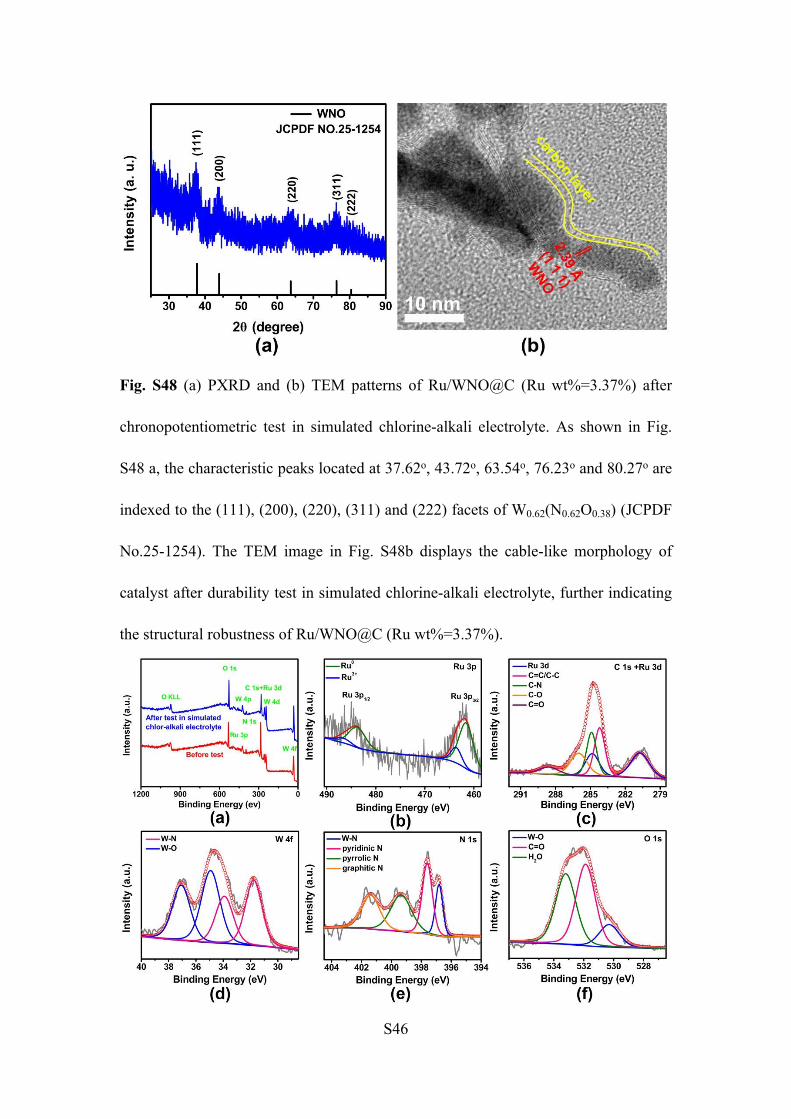
Fig. S48 (a) PXRD and (b) TEM patterns of Ru/WNO@C (Ru wt%=3.37%) after
chronopotentiometric test in simulated chlorine-alkali electrolyte. As shown in Fig.
S48 a, the characteristic peaks located at 37.62o, 43.72o, 63.54o, 76.23o and 80.27o are
indexed to the (111), (200), (220), (311) and (222) facets of W0.62(N0.62O0.38) (JCPDF
No.25-1254). The TEM image in Fig. S48b displays the cable-like morphology of
catalyst after durability test in simulated chlorine-alkali electrolyte, further indicating
the structural robustness of Ru/WNO@C (Ru wt%=3.37%).

S47
Fig. S49 XPS spectra of Ru/WNO@C (Ru wt%=3.37%) after chronopotentiometric
test in simulated chlorine-alkali electrolyte. (a) XPS full-scan spectra, (b) Ru 3p, (c) C
1s + Ru 3d, (d) W 4f, (e) N 1s and (f) O 1s. These results demonstrate that the
element composition and the valence states of Ru/WNO@C (Ru wt%=3.37%) show
negligible changes after durability test in simulated chlorine-alkali electrolyte.
Fig. S50 PXRD pattern of S-0.92 (sample-0.92). In the preparation of Ru/WNO@C
(with different Ru mass loading), the mass of urea and W18O49 NWs added was 10 g
and 0.1 g, respectively. While the mass of RuCl3 aqueous solution (1%) was 0.115,
0.23, 0.575, 0.92, 1.15 and 1.725 g, respectively. The series obtained solids with
different ruthenium mass loading were denoted as S-0.115, S-0.23, S-0.575, S-0.92,
S-1.15 and S-1.725, respectively. Take the S-0.92 of the optimal electrocatalyst
Ru/WNO@C (Ru wt%=3.37%) as an example, the PXRD pattern only exhibits strong

S48
diffraction peaks of urea, while the peaks of W18O49 and RuCl3 are very weak, which
is due to the relatively low content of W18O49 and RuCl3 in the S-0.92.
Fig. S51 PXRD patterns of S-0.115, S-0.23, S-0.575, S-0.92, S-1.15 and S-1.725.

S49
Fig. S52 EDAX spectra of (a) S-0.115, (b) S-0.23, (c) S-0.575, (d) S-0.92, (e) S-1.15
and (f) S-1.725.

S50
Fig. S53 (a) PXRD pattern and (b) SEM image of 3.37% Ru/C.

S51
Supporting TablesTable S1. The ICP and EDAX results of WNO@C and Ru/WNO@C (different Ru mass loading).
CatalystsRu content (wt%)Characterization methods
ICP EDAX
WNO@C 0 0Ru/WNO@C
(Ru wt%=0.46%) 0.46 0.37
Ru/WNO@C(Ru wt%=1.01%) 1.01 0.79
Ru/WNO@C(Ru wt%=2.37%) 2.37 1.71
Ru/WNO@C(Ru wt%=3.37%) 3.37 3.33
Ru/WNO@C(Ru wt%=3.85%) 3.85 3.76
Ru/WNO@C(Ru wt%=6.69%) 6.69 4.13

S52
Table S2. Comparison of HER performance in 1 M KOH for Ru/WNO@C (Ru wt%=3.37%) with other HER elecrocatalysts.
Catalyst η10
(mV)
Tafel Slope
(mV dec-1)
Ref.
Ru/WNO@C (Ru
wt%=3.37%)2 33 This work
Co1/PCN 89 52 S2
S-RP/C 17 34 S5
Ru@CN 32 53 S6
Mo2N–Mo2C/HGr 154 152 S7
Co-substituted Ru 13 29 S8
RuCoP 23 37 S9
Rh NP/C 7 19 S10
Pt3Ni3 15 ~ S11
Ru@C2N 17 38 S12
NP-MoS2/CC 78 51.6 S13
FePSe3/NC 118.5 88 S14
Mo2C@NC@Pt 47 57 S15
NiO/Ru@Ni 39 75 S16
Ni-Ni0.19 42 125 S17
Ir@CON 13.5 29 S18
NC/Vo-WON 16 33 S19
FeCoNi-HNTAs 58 37.5 S20
S53
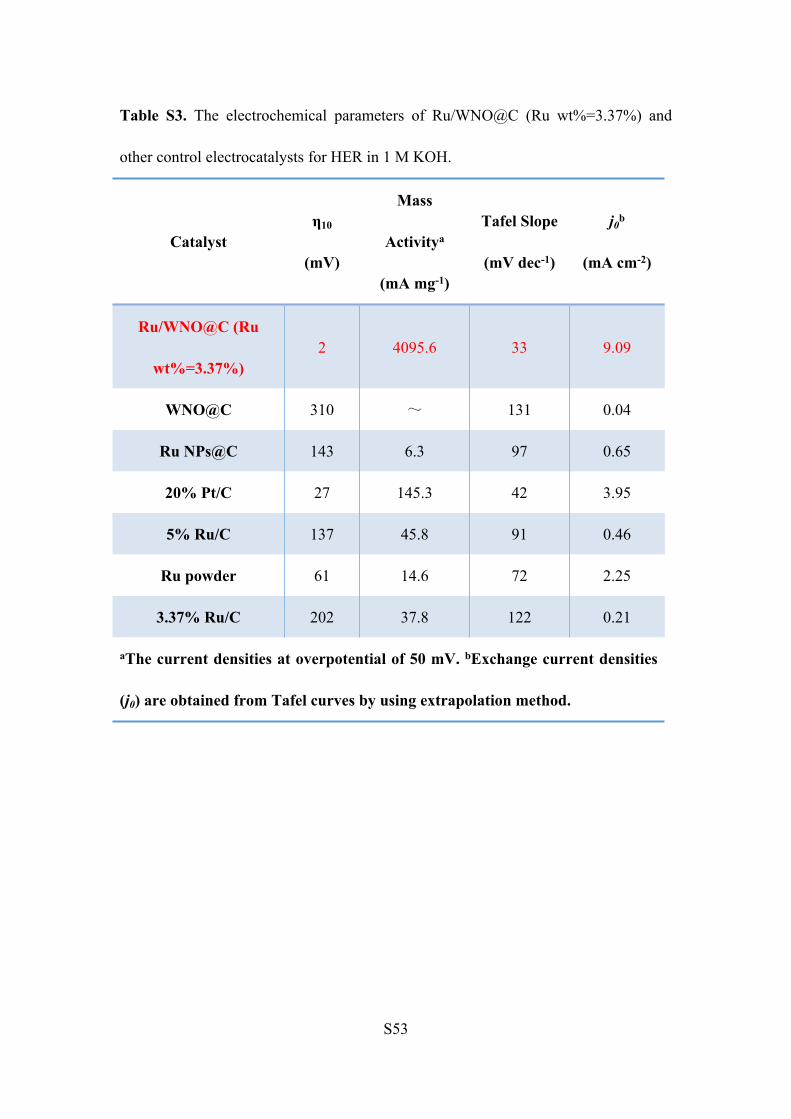
Table S3. The electrochemical parameters of Ru/WNO@C (Ru wt%=3.37%) and
other control electrocatalysts for HER in 1 M KOH.
Catalystη10
(mV)
Mass
Activitya
(mA mg-1)
Tafel Slope
(mV dec-1)
j0b
(mA cm-2)
Ru/WNO@C (Ru
wt%=3.37%)2 4095.6 33 9.09
WNO@C 310 ~ 131 0.04
Ru NPs@C 143 6.3 97 0.65
20% Pt/C 27 145.3 42 3.95
5% Ru/C 137 45.8 91 0.46
Ru powder 61 14.6 72 2.25
3.37% Ru/C 202 37.8 122 0.21
aThe current densities at overpotential of 50 mV. bExchange current densities
(j0) are obtained from Tafel curves by using extrapolation method.
S54
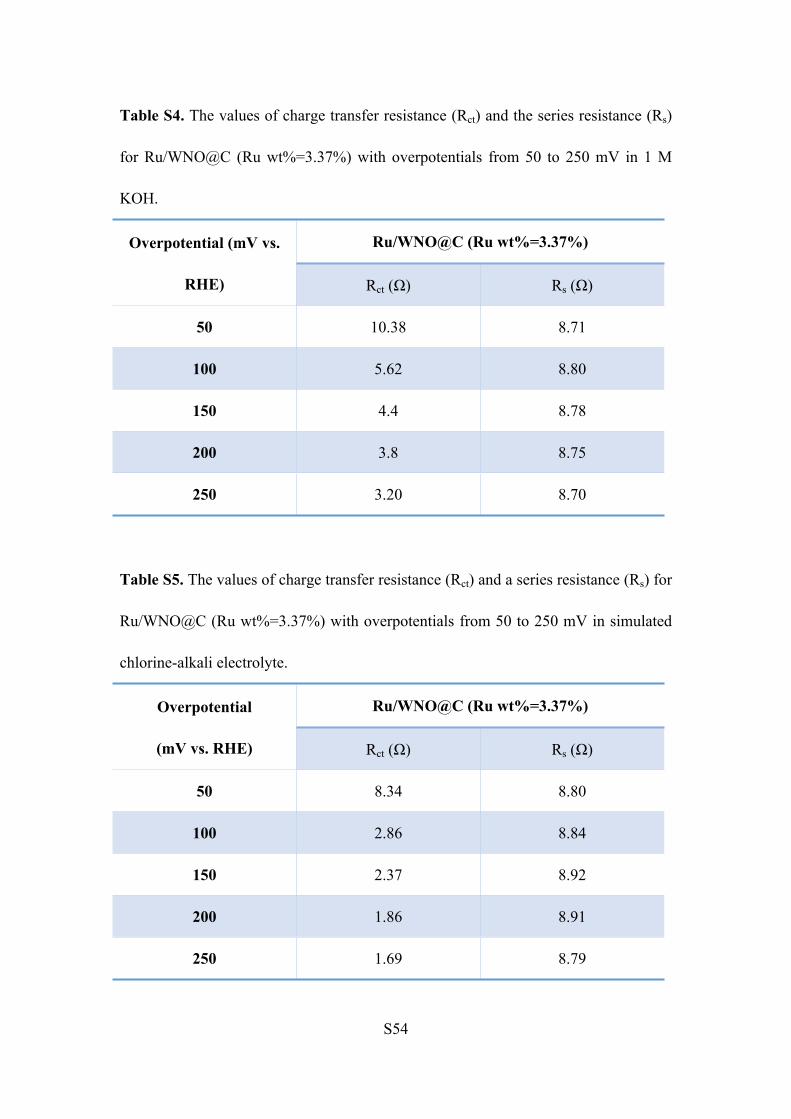
Table S4. The values of charge transfer resistance (Rct) and the series resistance (Rs)
for Ru/WNO@C (Ru wt%=3.37%) with overpotentials from 50 to 250 mV in 1 M
KOH.
Ru/WNO@C (Ru wt%=3.37%)Overpotential (mV vs.
RHE) Rct (Ω) Rs (Ω)
50 10.38 8.71
100 5.62 8.80
150 4.4 8.78
200 3.8 8.75
250 3.20 8.70
Table S5. The values of charge transfer resistance (Rct) and a series resistance (Rs) for
Ru/WNO@C (Ru wt%=3.37%) with overpotentials from 50 to 250 mV in simulated
chlorine-alkali electrolyte.
Ru/WNO@C (Ru wt%=3.37%)Overpotential
(mV vs. RHE) Rct (Ω) Rs (Ω)
50 8.34 8.80
100 2.86 8.84
150 2.37 8.92
200 1.86 8.91
250 1.69 8.79
S55
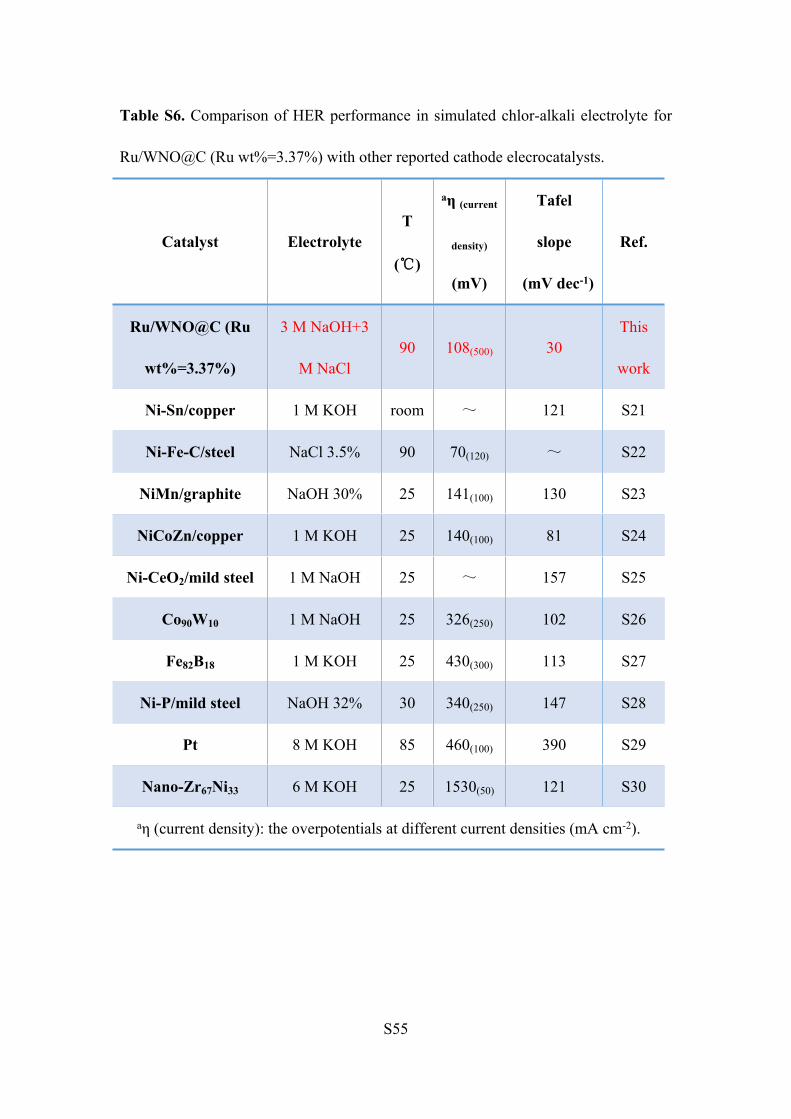
Table S6. Comparison of HER performance in simulated chlor-alkali electrolyte for
Ru/WNO@C (Ru wt%=3.37%) with other reported cathode elecrocatalysts.
Catalyst ElectrolyteT
(℃)
aη (current
density)
(mV)
Tafel
slope
(mV dec-1)
Ref.
Ru/WNO@C (Ru
wt%=3.37%)
3 M NaOH+3
M NaCl90 108(500) 30
This
work
Ni-Sn/copper 1 M KOH room ~ 121 S21
Ni-Fe-C/steel NaCl 3.5% 90 70(120) ~ S22
NiMn/graphite NaOH 30% 25 141(100) 130 S23
NiCoZn/copper 1 M KOH 25 140(100) 81 S24
Ni-CeO2/mild steel 1 M NaOH 25 ~ 157 S25
Co90W10 1 M NaOH 25 326(250) 102 S26
Fe82B18 1 M KOH 25 430(300) 113 S27
Ni-P/mild steel NaOH 32% 30 340(250) 147 S28
Pt 8 M KOH 85 460(100) 390 S29
Nano-Zr67Ni33 6 M KOH 25 1530(50) 121 S30
aη (current density): the overpotentials at different current densities (mA cm-2).

S56
Table S7. The electrochemical parameters of Ru/WNO@C (Ru
wt%=3.37%)//RuO2/IrO2-coated Ti-mesh and other control couples.
Couple Cell voltage at 10 mA cm-2 (V)
Ru/WNO@C (Ru wt%=3.37%)//RuO2/IrO2-
coated Ti-mesh2.48
20% Pt/C//RuO2/IrO2-coated Ti-mesh 2.52
low carbon steel//RuO2/IrO2-coated Ti-mesh 2.8
bare carbon paper//RuO2/IrO2-coated Ti-
mesh3.1
S57
References
[S1] Y. Y. Ma, Z. L. Lang, L. K. Yan, Y. H. Wang, H. Q. Tan, K. Feng, Y. J. Xia, J.
Zhong, Y. Liu, Z. H. Kang and Y. G. Li, Energy Environ. Sci., 2018, 11, 2114.
[S2] L. L. Cao, Q. Q. Luo, W. Liu, Y. Lin, X. K. Liu, Y. J. Cao, W. Zhang, Y. E. Wu,
J. L. Yang, T. Yao and W. Q. Shi, Nature Catalysis, 2019, 2, 134.
[S3] F. Xu, A. Fahmi, Y. M. Zhao, Y. D. Xia and Y. Q. Zhu, Nanoscale, 2012, 4,
7031.
[S4] V. Chakrapani, J. Thangala, M. K. Sunkara, Int J Hydrogen Energy, 2009, 34,
9050.
[S5] J. Yu, Y. N. Guo, S. X. She, S. S. Miao, M. Ni, W. Zhou, M. L. Liu and Z. P.
Shao, Adv. Mater., 2018, 30, 1800047.
[S6] J. Wang, Z. Z. Wei, S. J. Mao, H. R. Li and Y. Wang, Energy Environ. Sci., 2018,
11, 800.
[S7] H. Yan, Y. Xie, Y. Jiao, A. Wu, C. Tian, X. Zhang, L. Wang, H. Fu, Adv. Mater.,
2018, 30, 1704156.
[S8] J. J. Mao, C. T. He, J. J. Pei, W. X. Chen, D. S. He, Y. Q. He, Z. B. Zhuang, C.
Chen, Q. Peng, D. S. Wang and Y. D. Li, Nat. Commun., 2018, 9, 4958.
[S9] J. Y. Xu, T. F. Liu, J. J. Li, B. Li, Y. F. Liu, B. S. Zhang, D. H. Xiong, I.
Amorim, W. Li and L. F. Liu, Energy Environ. Sci., 2018, 11, 1819.
[S10] Q. Wang, M. Ming, S. Niu, Y. Zhang, G. Y. Fan and J. S. Hu, Adv. Energy
Mater. 2018, 8, 1801698.
[S11] P. T. Wang, K. Z. Jiang, G. M. Wang, J. L. Yao and X. Q. Huang, Angew.

S58
Chem. Int. Ed. Edition., 2016, 55, 12859.
[S12] J. Mahmood, F. Li, S. M. Jung, M. S. Okyay, I. Ahmad, S. J. Kim, N. Park, H.
Y. Jeong and J. B. Baek, Nat. Nanotechnol., 2017, 12, 441.
[S13] K. A. Sun, L. Y. Zeng, S. H. Liu, L. Zhao, H. Y. Zhu, J. C. Zhao, Z. Liu, D. W.
Cao, Y. C. Hou, Y. Q. Liu, Y. Pan, C. G. Liu, Nano Energy, 2019, 58, 862.
[S14] J. Yu, W. J. Li, H. S. Zhang, F. Zhou, R. M. Li, C. Y. Xu, L. M. Zhou, H.
Zhong and J. Wang, Nano Energy, 2019, 57, 222.
[S15] J. Q. Chi, J. Y. Xie, W. W. Zhang, B. Dong, J. F. Qin, X. Y. Zhang, J. H. Lin, Y.
M. Chai and C. G. Liu, ACS Appl. Mater. Interfaces, 2019, 11, 4047.
[S16] C. L. Zhong, Q. W. Zhou, S. W. Li, L. Cao, J. C. Li, Z. H. Shen, H. X. Ma, J. G.
Liu, M. H. Lu and H. G. Zhang, J. Mater. Chem. A, 2019, 7, 2344.
[S17] Y. B. Li, X. Tan, S. Chen, X. Bo, H. J. Ren, S. C. Smith and C. Zhao, Angew.
Chem. Int. Ed., 2019, 58, 461.
[S18] J. Mahmood, M. A. R. Anjum, S. H. Shin, I. Ahmad, H. J. Noh, S. J. Kim, H. Y.
Jeong, J. S. Lee and J. B. Baek, Adv. Mater. 2018, 30, 1805606.
[S19] B. Zhang, J. G. Hou, Y. Z. Wu, S. Y. Cao, Z. W. Li, X. W. Nie, Z. M. Gao and
L. C. Sun, Adv. Energy Mater., 2019, 10, 1803693.
[S20] H. Y. Li, S. M. Chen, Y. Zhang, Q. H. Zhang, X. F. Jia, Q. Zhang, L. Gu, X. M.
Sun, L. Song and X. Wang, Nat. Commun., 2018, 9, 2452.
[S21] J. Vijayakumar, S. Mohan, S. A. Kumar, S. R. Suseendiran and S. Pavithra, Int
J Hydrogen Energy, 2013, 38, 10208.
[S22] L. J. Song and H. M. Meng, Int J Hydrogen Energy, 2010, 35, 10060.

S59
[S23] A. O. Yuce, A. Doner and G. Kardas, Int J Hydrogen Energy, 2013, 38, 4466.
[S24] R. Solmaz and G. Kardas, Int J Hydrogen Energy, 2011, 36, 12079.
[S25] Z. Zheng, N. Li, C. Q. Wang, D. Y. Li, Y. M. Zhu and G. Wu, Int J Hydrogen
Energy, 2012, 37, 13921.
[S26] F. Rosalbino, D. Maccio, A. Saccone and G. Scavino, Int J Hydrogen Energy,
2014, 39, 12448.
[S27] C. I. Muller, T. Rauscher, A. Schmidt, T. Schubert, T. Weißgarber, B. Kieback
and L. Rontzsch, Int J Hydrogen Energy, 2014, 39, 8926.
[S28] S. M. A. Shibli and J. N. Sebeelamol, Int J Hydrogen Energy, 2013, 38, 2271.
[S29] D. M. F. Santos, C. A. C. Sequeira, D. Maccio, A. Saccone and J. L. Figueiredo,
Int J Hydrogen Energy, 2013, 38, 3137.
[S30] L. Mihailov, T. Spassov and M. Bojinov, Int J Hydrogen Energy, 2012, 37,
10499.


![Efficient Photovoltaics Supporting Information - Royal Society of Chemistry · 2017-03-17 · Supporting Information A New Fluoropyrido[3,4-b]pyrazine Based Polymer for Efficient](https://static.fdocuments.us/doc/165x107/5e9803bfcc7cc5780210caa4/efficient-photovoltaics-supporting-information-royal-society-of-2017-03-17-supporting.jpg)