
Alkali Earth Metal (Ca, Sr, Ba) Based Thermostable Metal ... · Synthesis of Alkali Earth Metal...
63
1 `` Alkali Earth Metal (Ca, Sr, Ba) Based Thermostable Metal Organic Frameworks (MOFs) for Proton Conduction (Supporting Information: 63 pages) Tanay Kundu, Subash Chandra Sahoo and Rahul Banerjee* † Physical/Materials Chemistry Division, National Chemical Laboratory, Dr. Homi Bhabha Road, Pune 411008, India E-mail: [email protected] Fax: + 91-20-25902636; Tel: + 91-20-25902535 Section S1. Synthesis of Alkali Earth Metal based MOFs (Ca-SBBA, Sr-SBBA and Ba-SBBA) S-2 Section S2. IR Spectroscopy of all the MOFs under different condition S-4 Section S3. Single crystal X-ray diffraction data collection, structure solution and refinement procedures S-10 Section S4. PXRD patterns of all three MOFs under different condition S-22 Section S5. Thermal stability of the MOFs and the Thermal Gravimetric Analysis (TGA) and Differential Scanning Calorimetry (DSC) data S-33 Section S6. Proton conductivity measurement of all the MOFs S-41 Electronic Supplementary Material (ESI) for Chemical Communications This journal is © The Royal Society of Chemistry 2012
Transcript of Alkali Earth Metal (Ca, Sr, Ba) Based Thermostable Metal ... · Synthesis of Alkali Earth Metal...

1 ``
Alkali Earth Metal (Ca, Sr, Ba) Based Thermostable Metal Organic Frameworks (MOFs) for Proton Conduction
(Supporting Information: 63 pages)
Tanay Kundu, Subash Chandra Sahoo and Rahul Banerjee*†
Physical/Materials Chemistry Division, National Chemical Laboratory, Dr. Homi
Bhabha Road, Pune 411008, India E-mail: [email protected] Fax: + 91-20-25902636; Tel: + 91-20-25902535
Section S1. Synthesis of Alkali Earth Metal based MOFs (Ca-SBBA, Sr-SBBA and Ba-SBBA) S-2 Section S2. IR Spectroscopy of all the MOFs under different condition S-4 Section S3. Single crystal X-ray diffraction data collection, structure solution and refinement procedures S-10 Section S4. PXRD patterns of all three MOFs under different condition S-22 Section S5. Thermal stability of the MOFs and the Thermal Gravimetric Analysis (TGA) and Differential Scanning Calorimetry (DSC) data S-33 Section S6. Proton conductivity measurement of all the MOFs S-41
Electronic Supplementary Material (ESI) for Chemical CommunicationsThis journal is © The Royal Society of Chemistry 2012

2 ``
Section S1. Synthesis of Alkali Earth Metal based MOFs (Ca-SBBA, Sr-SBBA and Ba-SBBA)
All reagents and solvents for synthesis and analysis were commercially available and
used as received. The Fourier transform (FT) IR spectra (KBr pellet) were taken on a
PERKIN ELMER FT-IR SPECTRUM (Nicolet) spectrometer. Powder X-ray diffraction
(PXRD) patterns were recorded on a Phillips PNAlytical diffractometer for Cu Kα
radiation (λ = 1.5406 Å), with a scan speed of 2° min–1 and a step size of 0.02° in 2θ.
Thermo-gravimetric experiments (TGA) were carried out in the temperature range of 25–
700 °C on a SDT Q600 TG-DTA analyzer under N2 atmosphere at a heating rate of 10 °C
min–1.
Synthesis of Ca-SBBA: 1mL 0.2M DMF stock solution of Ca(NO3)2.4H2O was mixed
with 1mL 0.2M DMF stock solution of SBBA in a 5 mL screw capped vial and sonicated
for 10 minutes. The vial was then heated at 100 0C for 48h. The block shaped colorless
crystals were washed with DMF and collected by filtration. FT-IR : (KBr 4000-600cm-
1): 3369(br), 3051(w), 1656(s), 1591(s), 1545(s), 1384(s), 1158(s), 1095(s), 744(s),
660(s), Elemental Analysis: C23 N3 O9 H29 S1 Ca1 = [Ca(SBBA).(DMF)2].DMF:
Calcd. C, 49.02; H, 5.15; N, 7.46. Found C, 49.41; H, 5.72; N, 7.23.
Synthesis of Sr-SBBA: 1mL 0.2M DMF stock solution of Sr(NO3)2 was mixed with
1mL 0.2M DMF stock solution of SBBA in a 5 mL screw capped vial and sonicated for
30 minutes. The vial was then heated at 100 0C for 96h. The needle shaped colorless
crystals were washed with DMF and collected by filtration. FT-IR: (KBr 4000-600cm-1):
3463(br), 3051(w), 1659(s), 1598(s), 1560(s), 1383(s), 1098(w), 1290(s), 1161(s),
1098(s), 783(s), 730(s), Elemental Analysis: C82 H88 N8 O36 S4 Sr5 =
[Sr5(SBBA)4.(HCOO)2.(DMF)8].2DMF : Calcd. C, 42.72; H, 4.16; N, 5.66. Found C,
42.41; H, 4.09; N, 5.47.
Electronic Supplementary Material (ESI) for Chemical CommunicationsThis journal is © The Royal Society of Chemistry 2012

3 ``
Elemental analysis (activated) = C82 H88 N8 O36 S4 Sr5 = Sr5(SBBA)4.(HCOO)2.8DMF:
Calcd. C, 42.30; H, 3.81; N, 4.81; Found C, 42.39; H, 3. 91; N, 4.93.
Synthesis of Ba-SBBA: 1mL 0.2M DEF stock solution of Ba(NO3)2 was mixed with
1mL 0.2M DEF stock solution of SBBA in a 5 mL screw capped vial and sonicated for
20 minutes. The vial was then heated at 100 0C for 72h. The colorless rod shaped crystals
were washed with DEF and collected by filtration. FT-IR : (KBr 4000-600cm-1):
2880(br), 1596(s), 1538(s), 1367(s), 1288(s), 1098(w), 1037(m), 783(s), 722(s),
Elemental Analysis: C48 H56 Ba2 N4 O16 S2 = Ba2(SBBA)2.4DEF: Calcd. C, 44.86; H,
4.44; N, 4.36. Found C, 44.39; H, 4.46; N, 4.39.
Electronic Supplementary Material (ESI) for Chemical CommunicationsThis journal is © The Royal Society of Chemistry 2012

4 ``
Section S2. IR Spectroscopy of all the MOFs
IR Spectra of Ca-SBBA:
Figure S1: IR Spectroscopy of as-synthesized Ca-SBBA.
Figure S2: IR Spectroscopy of Ca-SBBA after humidification for 24h.
Electronic Supplementary Material (ESI) for Chemical CommunicationsThis journal is © The Royal Society of Chemistry 2012

5 ``
Figure S3: Comparison of IR Spectroscopy of as-synthesized Ca-SBBA with humidified one showing structural retention with inclusion of water molecule.
Figure S4: Comparison of IR Spectroscopy of as-synthesized Ca-SBBA with the phase
transformed material at 500 0C, which shows same structural and metal-ligand connectivity retention upon removal of solvent molecules. Characteristic peaks of DMF (1260, 1504, 1660 etc.) are absent in phase transformed sample.
Electronic Supplementary Material (ESI) for Chemical CommunicationsThis journal is © The Royal Society of Chemistry 2012

6 ``
IR Spectra of Sr-SBBA:
Figure S5: IR Spectroscopy of as-synthesized Sr-SBBA.
Figure S6: IR Spectroscopy of Sr-SBBA after humidification for 24h.
Electronic Supplementary Material (ESI) for Chemical CommunicationsThis journal is © The Royal Society of Chemistry 2012

7 ``
Figure S7: Comparison of IR Spectroscopy of as-synthesized Sr-SBBA with humidified one showing structural retention with inclusion of water molecule.
Figure S8: Comparison of IR Spectroscopy of as-synthesized Sr-SBBA with the phase
transformed material at 500 0C, which shows same structural and metal-ligand connectivity retention upon removal of solvent molecules.
Electronic Supplementary Material (ESI) for Chemical CommunicationsThis journal is © The Royal Society of Chemistry 2012

8 ``
IR Spectra of Ba-SBBA:
Figure S9: IR Spectroscopy of as-synthesized Ba-SBBA.
Figure S10: IR Spectroscopy of Ba-SBBA after humidification for 24h.
Electronic Supplementary Material (ESI) for Chemical CommunicationsThis journal is © The Royal Society of Chemistry 2012

9 ``
Figure S11: Comparison of IR Spectroscopy of as-synthesized Ba-SBBA with humidified one showing structural change with inclusion of water molecule.
Figure S12: Comparison of IR Spectroscopy of as-synthesized Ba-SBBA with the phase
transformed material at 500 0C, which shows same structural and metal-ligand connectivity retention upon removal of solvent molecules.
Electronic Supplementary Material (ESI) for Chemical CommunicationsThis journal is © The Royal Society of Chemistry 2012

10 ``
Section S3. Single crystal X-ray diffraction data collection, structure
solution and refinement procedures.
General Data Collection and Refinement Procedures:
Data was collected on a Bruker SMART APEX three circle diffractometer
equipped with a CCD area detector and operated at 1500 W power (50 kV, 30 mA) to
generate Mo Kα radiation (λ = 0.71073 Å) or Cu Kα radiation (λ = 1.54184 Å). The
incident X-ray beam was focused and monochromated using Bruker Excalibur Gobel
mirror optics. The crystal reported in this paper was mounted on nylon CryoLoops
(Hampton Research) with Paraton-N (Hampton Research).
Initial scans of each specimen were performed to obtain preliminary unit cell
parameters and to assess the mosaicity (breadth of spots between frames) of the crystal to
select the required frame width for data collection. Bruker SMART1 software was used
suite to carry out overlapping φ and ω scans at detector (2θ) settings (2θ = 28). Following
data collection, reflections were sampled from all regions of the Ewald sphere to
redetermine unit cell parameters for data integration and to check for rotational twinning
using CELL_NOW2. In no data collection was evidence for crystal decay encountered.
Following exhaustive review of collected frames the resolution of the dataset was judged.
Data were integrated using Bruker SAINT3 software with a narrow frame algorithm and a
0.400 fractional lower limit of average intensity. Data were subsequently corrected for
absorption by the program SADABS4. The space group determination and tests for
merohedral twinning were carried out using XPREP3.
Electronic Supplementary Material (ESI) for Chemical CommunicationsThis journal is © The Royal Society of Chemistry 2012

11 ``
The structure was solved by direct methods and refined using the SHELXTL 975
software suite. Atoms were located from iterative examination of difference F-maps
following least squares refinements of the earlier models. Final models were refined
anisotropically (if the number of data permitted) until full convergence was achieved.
The structure was examined using the Adsym subroutine of PLATON6 to assure that no
additional symmetry could be applied to the models. All ellipsoids in ORTEP diagrams
are displayed at the 50% probability level unless noted otherwise. Crystallographic data
(excluding structure factors) for the structures are reported in this paper have been
deposited with the CCDC as deposition No. CCDC 850219 - CCDC 850221. Copies of
the data can be obtained, free of charge, on application to the CCDC, 12 Union Road,
Cambridge CB2 lEZ, U.K. [fax: þ 44 (1223) 336 033; e-mail: [email protected]].
1. Bruker (2005). APEX2. Version 5.053. Bruker AXS Inc., Madison,Wisconsin,
USA.
2. Sheldrick, G. M. (2004). CELL_NOW. University of Göttingen, Germany.
Steiner, Th. (1998). Acta Cryst. B54, 456–463.
3. Bruker (2004). SAINT-Plus (Version 7.03). Bruker AXS Inc., Madison,
Wisconsin, USA.
4. Sheldrick, G. M. (2002). SADABS (Version 2.03) and TWINABS (Version
1.02).University of Göttingen, Germany.
5. Sheldrick, G. M. (1997). SHELXS ‘97 and SHELXL ‘97. University of Göttingen,
Germany.
6. A. L. Spek (2005) PLATON, A Multipurpose Crystallographic Tool, Utrecht
University, Utrecht, The Netherlands.
Electronic Supplementary Material (ESI) for Chemical CommunicationsThis journal is © The Royal Society of Chemistry 2012

12 ``
Ca-SBBA (MONOCLINIC)
Experimental and Refinement Details for Ca-SBBA
A Colorless block like crystal (0.3 × 0.2× 0.1 mm3) of Ca-SBBA was placed in
0.7 mm diameter nylon CryoLoops (Hampton Research) with Paraton-N (Hampton
Research). The loop was mounted on a SMART APEX three circle diffractometer
equipped with a CCD area detector and operated at 1500 W power (50 kV, 30 mA) to
generate Cu Kα radiation (λ = 1.54184 Å) at 296(2) K. A total of 4407 reflections were
collected of which 3315 were unique. The range of θ was from 1.71 to 24.99. Analysis of
the data showed negligible decay during collection. The structure was solved in the
monoclinic P21/c space group, with Z = 4, using direct methods. All non-hydrogen atoms
were refined anisotropically with hydrogen atoms generated as spheres riding the
coordinates of their parent atoms. Final full matrix least-squares refinement on F2
converged to R1 = 0.0386 (F >2σF) and wR2
= 0.1045 (all data) with GOF = 1.028.
Sr-SBBA (TRICLINIC)
Experimental and Refinement Details for Sr-SBBA
A colorless needle like crystal (0.28 × 0.16× 0.08 mm3) of Sr-SBBA was placed
in 0.7 mm diameter nylon CryoLoops (Hampton Research) with Paraton-N (Hampton
Research). The loop was mounted on a SMART APEX three circle diffractometer
equipped with a CCD area detector and operated at 1500 W power (50 kV, 30 mA) to
generate Cu Kα radiation (λ = 1.54184 Å) at 293(2). A total of 11542 reflections were
collected of which 8511 were unique. The range of θ was from 3.26 to 73.36. Analysis of
the data showed negligible decay during collection. The structure was solved in the
Electronic Supplementary Material (ESI) for Chemical CommunicationsThis journal is © The Royal Society of Chemistry 2012

13 ``
monoclinic P-1 space group, with Z = 1, using direct methods. All non-hydrogen atoms
were refined anisotropically with hydrogen atoms generated as spheres riding the
coordinates of their parent atoms. Final full matrix least-squares refinement on F2
converged to R1 = 0.0825 (F >2σF) and wR2
= 0.2534 (all data) with GOF = 1.116.
Modeling of electron density within the voids of the frameworks did not lead to
identification of guest entities in Sr-SBBA structure due to the disordered contents of the
pores in the frameworks. As is a common strategy for improving x-ray data, increasing
the exposure time of the crystal to x-rays did not improve the quality of the high angle
data in these cases, as the intensity from low angle data saturated the detector and
minimal improvement in the high angle data was achieved. The only optimal crystals
suitable for analysis were generally small and weakly diffracting, and unfortunately,
larger crystals, which would usually improve the quality of the data, presented a lowered
degree of crystallinity and attempts to optimize the crystal growing conditions for large
high-quality specimens has not yet been fruitful. Electron density within void spaces,
which could not be assigned to any definite guest entity, was modeled as highly
disordered DMF molecules and isolated oxygen and carbon atoms, and the foremost
errors in all the models lies with assignment of guest electron density. To prove the
correctness of the atomic positions in the framework the application of the SQUEEZE
routine of A. Spek had been performed. The SQUEEZE structure is devoid of any solvent
entity, and matches well with the elemental analysis value of the evacuated Sr-SBBA
sample. We have provided the squeezed structure of Sr-SBBA. The formate anion
(O8,C44,O7), symmetry generated DMF (O12,C18,C19), disordered DMF (O13,C41,
Electronic Supplementary Material (ESI) for Chemical CommunicationsThis journal is © The Royal Society of Chemistry 2012

14 ``
C42, C43,N5) and (C20,C21,C39) were kept isotropic. Except these all atoms were made
anisotropic and the Ortep diagram is provided with 50% probability.
Ba-SBBA (TRICLINIC)
Experimental and Refinement Details for Ba-SBBA
A colorless rod shaped crystal (0.3 × 0. 2× 0.2 mm3) of Ba-SBBA was placed in
0.7 mm diameter nylon CryoLoops (Hampton Research) with Paraton-N (Hampton
Research). The loop was mounted on a SMART APEX three circle diffractometer
equipped with a CCD area detector and operated at 1500 W power (50 kV, 30 mA) to
generate Mo Kα radiation (λ = 0.71073 Å) at 296(2) K. A total of 12609 reflections were
collected of which 8752 were unique. The range of θ was from 1.71 to 24.99. Analysis of
the data showed negligible decay during collection. The structure was solved in the
triclinic P-1 space group, with Z = 2, using direct methods. All non-hydrogen atoms were
refined anisotropically with hydrogen atoms generated as spheres riding the coordinates
of their parent atoms. Final full matrix least-squares refinement on F2 converged to R1
=
0.0557 (F >2σF) and wR2 = 0.1413 (all data) with GOF = 1.074.
Electronic Supplementary Material (ESI) for Chemical CommunicationsThis journal is © The Royal Society of Chemistry 2012

15 ``
Table S1: Crystal data and structure refinement for all the MOFs:
Parameters Ca-SBBA [1] Ba-SBBA [2] Sr-SBBA [3]
Empirical formula C23 H29 Ca N3 O9 S C48 H56 Ba2 N4 O16 S2 C80 H76 Sr5N8 O36 S4
Formula weight 563.633 1283.77 2291.87
Temperature 296(2)K 296(2)K 293(2)K
Wavelength 1.54184Å 0.71073Å 1.54184Å
Crystal system Monoclinic Triclinic Triclinic
Space group P 21/c P ī P ī
Unit cell dimensions
a = 8.7220(3)Å b = 27.5302(8)Å c = 11.2194(3) Å
a = 13.985(2) Å b = 14.614(3) Å c = 16.700(3) Å
a = 13.9492(9) Å b = 15.6692(13) Å c = 15.9071(13) Å
Volume 2572.31(13) Å3 2784.1(9) Å3 2871.2(5) Å3
Z 4 2 1
Density (calculated) 1.455/m3 1.531 /m3 1.326 /m3
Absorption coefficient 3.361 1.548 4.247
F(000) 1184 1288 1154
Crystal size 0.30 × 0.20 × 0.10 mm3 0.30 × 0.20 × 0.20 mm3 0.28 × 0.16 × 0.08 mm3
Reflections collected 4407 12609 19525
Independent reflections 3315 8752 8511
Completeness ( to theta) 95 %(67.70) 98 %(27.56) 94.8 % (73.36)
Absorption correction Multi-scan Multi-scan Multi-scan
Goodness-of-fit on F2 1.028 1.074 1.116
Final R indices [I>2sigma(I)]
R1 = 0.0386, wR2 = 0.0936
R1 = 0.0557, wR2 = 0.1273
R1 = 0.0825, wR2 = 0.2336
R indices (all data) R1 = 0.0591, wR2 = 0.1045
R1 = 0.0837, wR2 = 0.1413
R1 = 0.0990, wR2 = 0.2534
Electronic Supplementary Material (ESI) for Chemical CommunicationsThis journal is © The Royal Society of Chemistry 2012

16 ``
Ortep Figures of all three MOFs:
Ortep Figure of Ca-SBBA:
Figure S13: Ortep Drawing of the assymetric unit of Ca-SBBA. Thermal ellipsoids set to 50% probability level. Ortep Figure of Ba-SBBA:
Figure S14: Ortep Drawing of the assymetric unit of Ba-SBBA. Thermal ellipsoids set to 50% probability level.
Electronic Supplementary Material (ESI) for Chemical CommunicationsThis journal is © The Royal Society of Chemistry 2012

17 ``
Ortep Figure of Sr-SBBA:
Figure S15: Ortep Drawing of the assymetric unit of Sr-SBBA. Thermal ellipsoids set to 50% probability level.
Electronic Supplementary Material (ESI) for Chemical CommunicationsThis journal is © The Royal Society of Chemistry 2012

18 ``
Packing Diagram of all three MOFs:
Packing Diagram of Ca-SBBA:
Figure S16: a) Coordination sites of SBBA in Ca-SBBA along crystallographic b axis. b) Polyhedral representation of the coordinated chain of Ca atoms. c) Formation of sheet like structure of Ca-SBBA through bridging Ca-Chains via SBBA ligands.
Electronic Supplementary Material (ESI) for Chemical CommunicationsThis journal is © The Royal Society of Chemistry 2012

19 ``
Figure S17: Packing diagram of Ca-SBBA along crystallographic a axis.
Electronic Supplementary Material (ESI) for Chemical CommunicationsThis journal is © The Royal Society of Chemistry 2012

20 ``
Packing Diagram of Sr-SBBA:
Figure S18: a) Coordination environment of Sr in Sr-SBBA. b) Polyhedral representation of the pentanuclear Sr structure linked through SBBA ligand. c) Ball and stick representation of the Sr-SBBA chains along crystallographic b axis.
Electronic Supplementary Material (ESI) for Chemical CommunicationsThis journal is © The Royal Society of Chemistry 2012

21 ``
Packing Diagram of Ba-SBBA:
Figure S19: a) Coordination environment of Ba in Ba-SBBA. b) Polyhedral representation of the Ba chains linked via SBBA ligand to form the spirane like structure. c) Ball and stick representation of the Ba-SBBA spranes arranged along crystallographic b axis.
Electronic Supplementary Material (ESI) for Chemical CommunicationsThis journal is © The Royal Society of Chemistry 2012

22 ``
Section S4. PXRD patterns of all three MOFs
PXRD pattern of Ca-SBBA:
Figure S20: Comparison of simulated (bottom) and experimental (top) PXRD pattern of Ca-SBBA showing considerable bulk purity of the crystalline phase.
PXRD pattern of Sr-SBBA:
Figure S21: Comparison of simulated (bottom) and experimental (top) PXRD pattern of Sr-SBBA showing considerable bulk purity of the crystalline phase.
Electronic Supplementary Material (ESI) for Chemical CommunicationsThis journal is © The Royal Society of Chemistry 2012
23 ``
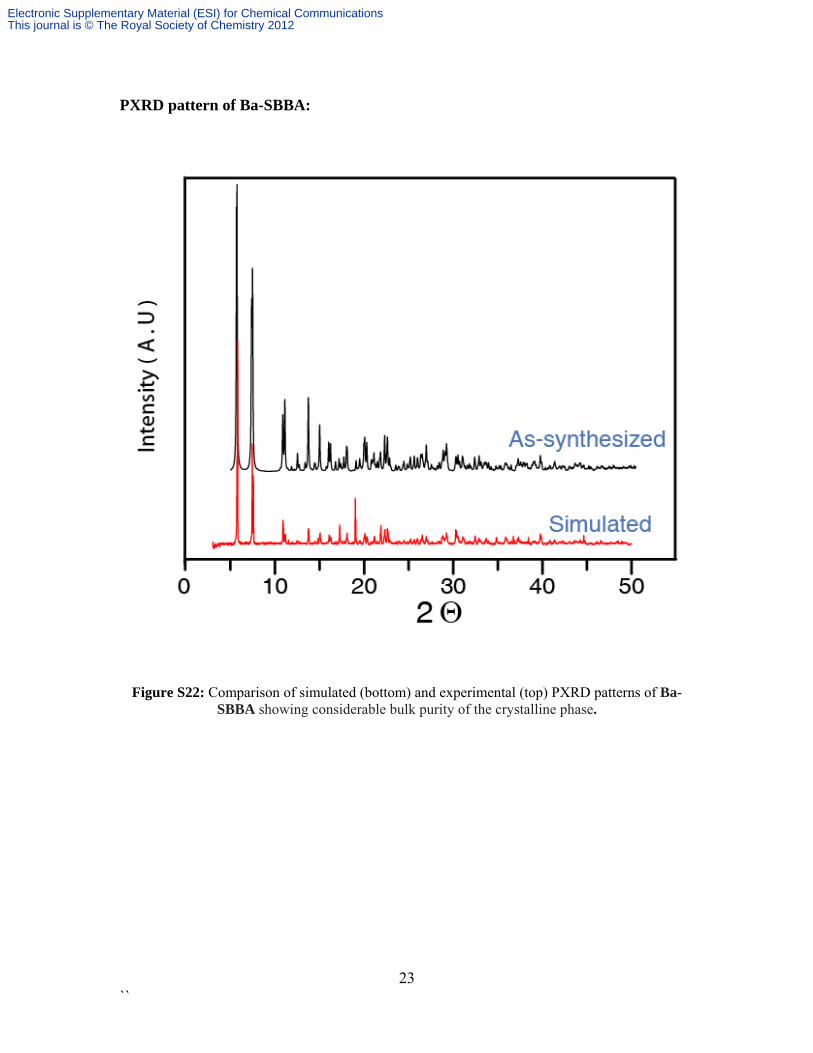
PXRD pattern of Ba-SBBA:
Figure S22: Comparison of simulated (bottom) and experimental (top) PXRD patterns of Ba-SBBA showing considerable bulk purity of the crystalline phase.
Electronic Supplementary Material (ESI) for Chemical CommunicationsThis journal is © The Royal Society of Chemistry 2012

24 ``
Solvent stability of Ca-SBBA, Sr-SBBA and Ba-SBBA under different solvents
Solvent stability of Ca-SBBA:
Figure S23: Powder XRD patterns of the solvent treated samples of Ca-SBBA with respect to each other and comparison with simulated ones.
Electronic Supplementary Material (ESI) for Chemical CommunicationsThis journal is © The Royal Society of Chemistry 2012

25 ``
Solvent stability of Sr-SBBA:
Figure S24: Powder XRD patterns of the solvent treated samples of Sr-SBBA with respect to each other and comparison with simulated ones.
Electronic Supplementary Material (ESI) for Chemical CommunicationsThis journal is © The Royal Society of Chemistry 2012

26 ``
PXRD of the Humidified samples of Ca-SBBA, Sr-SBBA and Ba-SBBA
Figure S25: Powder XRD patterns of the humidified samples of Ca-SBBA at definite time interval (e.g. 24h, 48h) and comparison with simulated and as-synthesized ones.
Electronic Supplementary Material (ESI) for Chemical CommunicationsThis journal is © The Royal Society of Chemistry 2012

27 ``
Figure S26: Powder XRD patterns of the humidified samples of Sr-SBBA at definite time interval (e.g. 24h, 48h) and comparison with simulated and as-synthesized ones.
Electronic Supplementary Material (ESI) for Chemical CommunicationsThis journal is © The Royal Society of Chemistry 2012

28 ``
Figure S27: Powder XRD patterns of the humidified samples of Ba-SBBA after 24h
showing amorphous nature due to collapse of the network architecture.
Electronic Supplementary Material (ESI) for Chemical CommunicationsThis journal is © The Royal Society of Chemistry 2012

29 ``
Figure S28: Powder XRD patterns of the Ca-SBBA before and after proton conductivity experiment and comparison with simulated ones reveal that Ca-SBBA maintain its architectural rigidity during proton conductivity experiment.
Figure S29: Powder XRD patterns of the Sr-SBBA before and after proton conductivity experiment and comparison with simulated ones reveal that Ca-SBBA maintain its architectural rigidity during proton conductivity experiment.
Electronic Supplementary Material (ESI) for Chemical CommunicationsThis journal is © The Royal Society of Chemistry 2012

30 ``
Variable temperature Powder XRD (VTPXRD) of Ca-SBBA:
Figure S30: Variable temperature Powder XRD patterns of Ca-SBBA from 25 °C to 500°C showing irreversible phase change at higher temperatures (above 100 °C).
Electronic Supplementary Material (ESI) for Chemical CommunicationsThis journal is © The Royal Society of Chemistry 2012

31 ``
Variable temperature Powder XRD (VTPXRD) of Sr-SBBA:
Figure S31: Variable temperature Powder XRD patterns of Sr-SBBA from 25 °C to 500°C showing irreversible phase change at higher temperatures (above 100 °C).
Electronic Supplementary Material (ESI) for Chemical CommunicationsThis journal is © The Royal Society of Chemistry 2012

32 ``
Variable temperature Powder XRD (VTPXRD) of Ba-SBBA:
Figure S32: Variable temperature Powder XRD patterns of Ba-SBBA from 25 °C to 500°C showing irreversible phase change at higher temperatures (above 100 °C).
Electronic Supplementary Material (ESI) for Chemical CommunicationsThis journal is © The Royal Society of Chemistry 2012

33 ``
Section S5. Thermal stability of Ca-SBBA, Sr-SBBA and Ba-SBBA with
Thermo Gravimetric Analysis (TGA) data TGA data for Ca-SBBA:
Figure S33: Thermal Gravimetric Analysis curve for Ca-SBBA showing the thermal stability of the framework upto 500 °C.
Electronic Supplementary Material (ESI) for Chemical CommunicationsThis journal is © The Royal Society of Chemistry 2012

34 ``
TGA data for Sr-SBBA:
Figure S34: Thermal Gravimetric Analysis curve for Sr-SBBA showing the thermal stability of the framework upto 500 °C.
Electronic Supplementary Material (ESI) for Chemical CommunicationsThis journal is © The Royal Society of Chemistry 2012

35 ``
TGA data for Ba-SBBA:
Figure S35: Thermal Gravimetric Analysis curve for Ba-SBBA showing the thermal stability of the framework upto 500 °C.
Electronic Supplementary Material (ESI) for Chemical CommunicationsThis journal is © The Royal Society of Chemistry 2012

36 ``
TGA of the Humidified Samples of Ca-SBBA and Sr-SBBA:
Figure S36: Thermal Gravimetric Analysis curve for humidified Ca-SBBA in comparison with as-synthesized one reveals the water content of the Ca-SBBA and lower weight loss in case of humidified sample as high molecular weight DMF molecules are being replaced by low molecular weight water molecules. However, both these frameworks exhibit identical thermal stability of the Ca-SBBA upto 500 °C.
Electronic Supplementary Material (ESI) for Chemical CommunicationsThis journal is © The Royal Society of Chemistry 2012

37 ``
Figure S37: Thermal Gravimetric Analysis curve for humidified Sr-SBBA in comparison with as-synthesized one reveals the water content of the Sr-SBBA and lower weight loss in case of humidified sample as high molecular weight DMF molecules are being replaced by low molecular weight water molecules. However, both these frameworks exhibit identical thermal stability of the Sr-SBBA upto 500 °C.
Electronic Supplementary Material (ESI) for Chemical CommunicationsThis journal is © The Royal Society of Chemistry 2012

38 ``
Differential Scanning Calorimetry (DSC) data:
DSC of Ca-SBBA:
Figure S38: DSC data for Ca-SBBA showing endothermic peak at ~120 °C correspond to phase change.
Electronic Supplementary Material (ESI) for Chemical CommunicationsThis journal is © The Royal Society of Chemistry 2012
39 ``
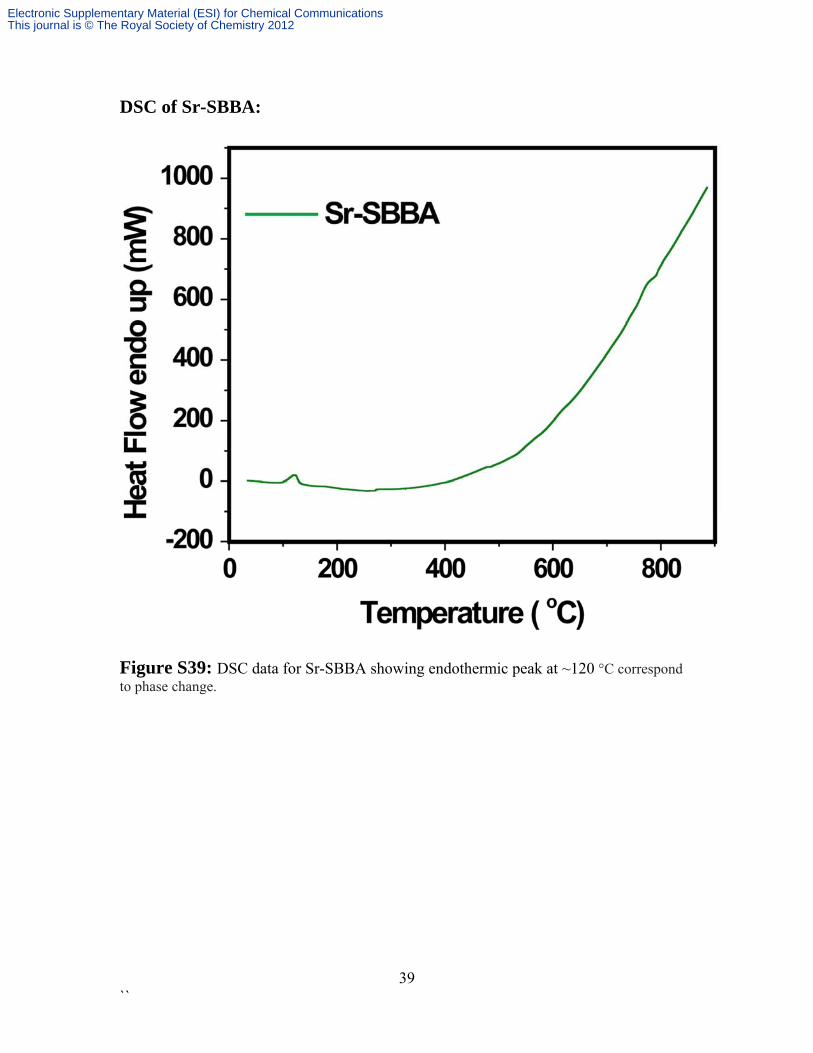
DSC of Sr-SBBA:
Figure S39: DSC data for Sr-SBBA showing endothermic peak at ~120 °C correspond to phase change.
Electronic Supplementary Material (ESI) for Chemical CommunicationsThis journal is © The Royal Society of Chemistry 2012

40 ``
DSC of Ba-SBBA:
Figure S40: DSC data for Ba-SBBA showing endothermic peak at ~90 °C correspond to phase change.
Electronic Supplementary Material (ESI) for Chemical CommunicationsThis journal is © The Royal Society of Chemistry 2012

41 ``
Section S6. Proton conductivity measurement of all the MOFs: Proton Conductivities were measured using Solartron 1287 Electrochemical Interface with 1255B frequency response analyzer via quasi-four-probe method. ~120mg of as-synthesized samples were pressed in a pellet maker to obtain uniform pellets of 0.37-0.38 mm, which was subject to humidification for 24h and subsequently measured the proton conductivity. Resistances were measured from the semicircle of the Nyquist plots. Proton conductivity was measured by the following equation; = L/(R.A) where = proton conductivity, L = thickness of the pellet, R = resistance of the pellet and A = area of the pellet = 4r2 where r = radius of the pellet. For high-temperature proton conductivity measurements, the pellets were inserted within a humidification chamber, which was encircled with a controlled heating coil attached with an automated temperature controller. The heat flow within the temperature controller was controlled by a dimerstat accordingly. The temperature of the chamber was measured by an infrared temperature sensor attachment, having a sensing accuracy of ±0.5 °C. For low-temperature proton conductivity measurements, the pellets were inserted within a humidification chamber, which was encircled with a water circulation coil attached with a chiller integrated with an automated temperature controller. The heat flow within the chamber was controlled by the chiller accordingly. The temperature of the chamber was measured by an infrared temperature sensor attachment, having a sensing accuracy of ±0.5 °C. Proton Conductivity of Ca-SBBA at ambient temperature:
Figure S41: Nyquist plot of Ca-SBBA at 298 K (room temperature) showing proton conductivity value of 8.58 10-6 S cm-1.
Electronic Supplementary Material (ESI) for Chemical CommunicationsThis journal is © The Royal Society of Chemistry 2012

42 ``
Proton Conductivity of Ca-SBBA at elevated temperatures:
Figure S42: Nyquist plot of Ca-SBBA at 299 K showing proton conductivity value of 8.38 10-6 S cm-1.
Figure S43: Nyquist plot of Ca-SBBA at 307 K showing proton conductivity value of 6.85 10-6 S cm-1.
Electronic Supplementary Material (ESI) for Chemical CommunicationsThis journal is © The Royal Society of Chemistry 2012

43 ``
Figure S44: Nyquist plot of Ca-SBBA at 309 K showing proton conductivity value of 6.51 10-6 S cm-1.
Figure S45: Nyquist plot of Ca-SBBA at 311K showing proton conductivity value of 5.99 10-6 S cm-1.
Electronic Supplementary Material (ESI) for Chemical CommunicationsThis journal is © The Royal Society of Chemistry 2012

44 ``
Figure S46: Nyquist plot of Ca-SBBA at 313K showing proton conductivity value of 5.54 10-6 S cm-1.
Figure S47: Nyquist plot of Ca-SBBA at 316 K showing proton conductivity value of 5.01 10-6 S cm-1.
Electronic Supplementary Material (ESI) for Chemical CommunicationsThis journal is © The Royal Society of Chemistry 2012

45 ``
Figure S48: Nyquist plot of Ca-SBBA at 318 K showing proton conductivity value of 4.73 10-6 S cm-1.
Figure S49: Nyquist plot of Ca-SBBA at elevated temperatures showing decreasing trend of proton conductivity values.
Proton Conductivity of Ca-SBBA at lower temperatures:
Electronic Supplementary Material (ESI) for Chemical CommunicationsThis journal is © The Royal Society of Chemistry 2012

46 ``
Figure S50: Nyquist plot of Ca-SBBA at 297 K showing proton conductivity value of 8.27 10-6 S cm-1.
Figure S51: Nyquist plot of Ca-SBBA at 293 K showing proton conductivity value of 7.45 10-6 S cm-1.
Electronic Supplementary Material (ESI) for Chemical CommunicationsThis journal is © The Royal Society of Chemistry 2012

47 ``
Figure S52: Nyquist plot of Ca-SBBA at 291 K showing proton conductivity value of 7.09 10-6 S cm-1.
Figure S53: Nyquist plot of Ca-SBBA at 290 K showing proton conductivity value of 6.89 10-6 S cm-1.
Electronic Supplementary Material (ESI) for Chemical CommunicationsThis journal is © The Royal Society of Chemistry 2012

48 ``
Figure S54: Nyquist plot of Ca-SBBA at 289 K showing proton conductivity value of 6.77 10-6 S cm-1.
Figure S55: Nyquist plot of Ca-SBBA at 287 K showing proton conductivity value of 6.21 10-6 S cm-1.
Electronic Supplementary Material (ESI) for Chemical CommunicationsThis journal is © The Royal Society of Chemistry 2012

49 ``
Figure S56: Nyquist plot of Ca-SBBA at lower temperatures showing decreasing trend of proton conductivity values.
Figure S57: Arrhenius plot of Ca-SBBA showing activation energy value of 0.23 eV. Least square fitting had been applied while calculating the slope.
Electronic Supplementary Material (ESI) for Chemical CommunicationsThis journal is © The Royal Society of Chemistry 2012

50 ``
Graphical representation of Proton Conductivity as a function of temperature in Ca-SBBA:
Figure S58: Proton conductivity as a function of temperature in case of Ca-SBBA which shows that proton conductivity increases upto 25 °C and then decreases and shows zero conductivity above 45 °C.
Electronic Supplementary Material (ESI) for Chemical CommunicationsThis journal is © The Royal Society of Chemistry 2012

51 ``
Proton Conductivity data for Sr-SBBA:
Proton conductivity of Sr-SBBA at ambient temperature:
Figure S59: Nyquist plot of Sr-SBBA at 298 K showing proton conductivity value of 4.4 10-5 S cm-1 under 98% relative humidity.
Electronic Supplementary Material (ESI) for Chemical CommunicationsThis journal is © The Royal Society of Chemistry 2012

52 ``
Proton Conductivity at elevated temperatures:
Figure S60: Nyquist plot of Sr-SBBA at 300 K showing proton conductivity value of 3.44 10-5 S cm-1 under 98% relative humidity.
Figure S61: Nyquist plot of Sr-SBBA at 303 K showing proton conductivity value of 2.49 10-5 S cm-1 under 98% relative humidity.
Electronic Supplementary Material (ESI) for Chemical CommunicationsThis journal is © The Royal Society of Chemistry 2012

53 ``
Figure S62: Nyquist plot of Sr-SBBA at 306 K showing proton conductivity value of 1.98 10-5 S cm-1 under 98% relative humidity.
Figure S63: Nyquist plot of Sr-SBBA at 309 K showing proton conductivity value of 1.57 10-5 S cm-1 under 98% relative humidity.
Electronic Supplementary Material (ESI) for Chemical CommunicationsThis journal is © The Royal Society of Chemistry 2012

54 ``
Figure S64: Nyquist plot of Sr-SBBA at 311 K showing proton conductivity value of 1.39 10-5 S cm-1 under 98% relative humidity.
Figure S65: Nyquist plot of Sr-SBBA at 313 K showing proton conductivity value of 1.20 10-5 S cm-1 under 98% relative humidity.
Electronic Supplementary Material (ESI) for Chemical CommunicationsThis journal is © The Royal Society of Chemistry 2012

55 ``
Figure S66: Nyquist plot of Sr-SBBA at elevated temperatures showing decreasing trend of proton conductivity values.
Electronic Supplementary Material (ESI) for Chemical CommunicationsThis journal is © The Royal Society of Chemistry 2012

56 ``
Proton Conductivity of Sr-SBBA at lower temperatures:
Figure S67: Nyquist plot of Sr-SBBA at 296 K showing proton conductivity value of 3.52 10-5 S cm-1 under 98% relative humidity.
Figure S68: Nyquist plot of Sr-SBBA at 295 K showing proton conductivity value of 3.19 10-5 S cm-1 under 98% relative humidity.
Electronic Supplementary Material (ESI) for Chemical CommunicationsThis journal is © The Royal Society of Chemistry 2012

57 ``
Figure S69: Nyquist plot of Sr-SBBA at 293 K showing proton conductivity value of 2.68 10-5 S cm-1 under 98% relative humidity.
Figure S70: Nyquist plot of Sr-SBBA at 291 K showing proton conductivity value of 2.33 10-5 S cm-1 under 98% relative humidity.
Electronic Supplementary Material (ESI) for Chemical CommunicationsThis journal is © The Royal Society of Chemistry 2012

58 ``
Figure S71: Nyquist plot of Sr-SBBA at 289 K showing proton conductivity value of 2.11 10-5 S cm-1 under 98% relative humidity.
Figure S72: Nyquist plot of Sr-SBBA at 287 K showing proton conductivity value of 1.91 10-5 S cm-1 under 98% relative humidity.
Electronic Supplementary Material (ESI) for Chemical CommunicationsThis journal is © The Royal Society of Chemistry 2012

59 ``
Figure S73: Nyquist plot of Sr-SBBA at lower temperatures showing decreasing trend of proton conductivity values.
Figure S74: Arrhenius plot of Sr-SBBA showing activation energy value of 0.56 eV. Least square fitting had been applied while calculating the slope.
Electronic Supplementary Material (ESI) for Chemical CommunicationsThis journal is © The Royal Society of Chemistry 2012

60 ``
Graphical representation of Proton Conductivity as a function of temperature in Sr-SBBA:
Figure S75: Proton conductivity as a function of temperature in case of Sr-SBBA which shows that proton conductivity increases upto 25 °C and then decreases and shows zero conductivity above 40 °C.
Electronic Supplementary Material (ESI) for Chemical CommunicationsThis journal is © The Royal Society of Chemistry 2012

61 ``
Table S2: Comparison of proton conductivity of Ca-SBBA and Sr-SBBA with other MOFs:
SL.No.
MOFs and CPs Proton conductivity (S cm-1)
Ea value (eV)
Conditions Reference
1 (NH4)2(adp)[Zn2(ox)3] · 3H2O
8 × 10⁻³ 0.63 25 °C and 98% RH
J. Am. Chem. Soc., 2009 , 131, 9906
2 1D Ferrous Oxalate Dihydrate
1.3 × 10⁻³ 0.37 25 °C and 98% RH
J. Am. Chem. Soc., 2009, 131, 3144.
3 (NH4)4[MnCr2(ox)6] 3 4H2O.
1.1 × 10⁻³ 0.23 25 °C and 98% RH
J. Am. Chem. Soc., 2011, 133, 15328.
4 Cucurbit[6]uril (CB[6]) 1.1 × 10⁻³ 0.39 25 °C and 98% RH
Angew. Chem. Int. Ed. 2011, 50, 7870.
5 (b-PCMOF2(Tz)0.45) 5 × 10⁻⁴ 0.51 150°C Nat. Chem. 2009, 1, 705.
6 Mg2(dobdc)3.0.35LiOiPr3. 0.25LiBF4. EC3. DEC
3.1 × 10⁻⁴ 0.14 27 0C J. Am. Chem. Soc., 2011, 133, 14522.
7 {NH(prol)3}[MIICrIII(ox)3] (MII ) =MnII, FeII, CoII)
1 × 10⁻⁴ 25 °C and 75% RH
J. Am. Chem. Soc., 2009, 131, 13516
8 (H5C2)2(dtoa) Cu 1 × 10⁻⁴ 25 °C and 80% RH
Bull. Chem. Soc. Jpn. 2010, 83, 42
9 [Zn(l-LCl)(Cl)](H2O)2 4.45 × 10⁻⁵ 0.34 28 °C and 98% RH
J. Am. Chem. Soc., 2011, 133, 17950.
10 Sr-SBBA 4.4 × 10⁻⁵ 0.56 25 °C and 98% RH
This Work
11 PCMOF-3 3.5 × 10⁻⁵ 0.17 25 °C and 98% RH
J. Am. Chem. Soc. 2010, 132, 14055.
12 Ca-SBBA 8.58 × 10⁻⁶ 0.23 25 °C and 98% RH
This Work
13 [M IL-53(Fe)-(COOH)2]
2.0 × 10⁻⁶ 0.21 25 °C and 98% RH
J. Am. Chem. Soc 2011, 133, 2034.
Electronic Supplementary Material (ESI) for Chemical CommunicationsThis journal is © The Royal Society of Chemistry 2012

62 ``
Effect of MOF integrity and particle size on proton conduction: The MOF integrity plays a vital role in proton conductivity. To study this effect, we have prepared the pellet with same amount of ligand (SBBA) and encountered no conductivity. Hence, we can say that MOF architecture plays a vital role in systematic arrangement of ligands in definite fashion with solvent molecule to aid proton conductivity. Also, while making pellet no distribution of particle size was observed, but conductivity values remain comparable.
Figure S76: Schematic representation of proton conductivity as a function of MOF integrity as the ligand alone fail to show proton conduction.
Electronic Supplementary Material (ESI) for Chemical CommunicationsThis journal is © The Royal Society of Chemistry 2012
63 ``
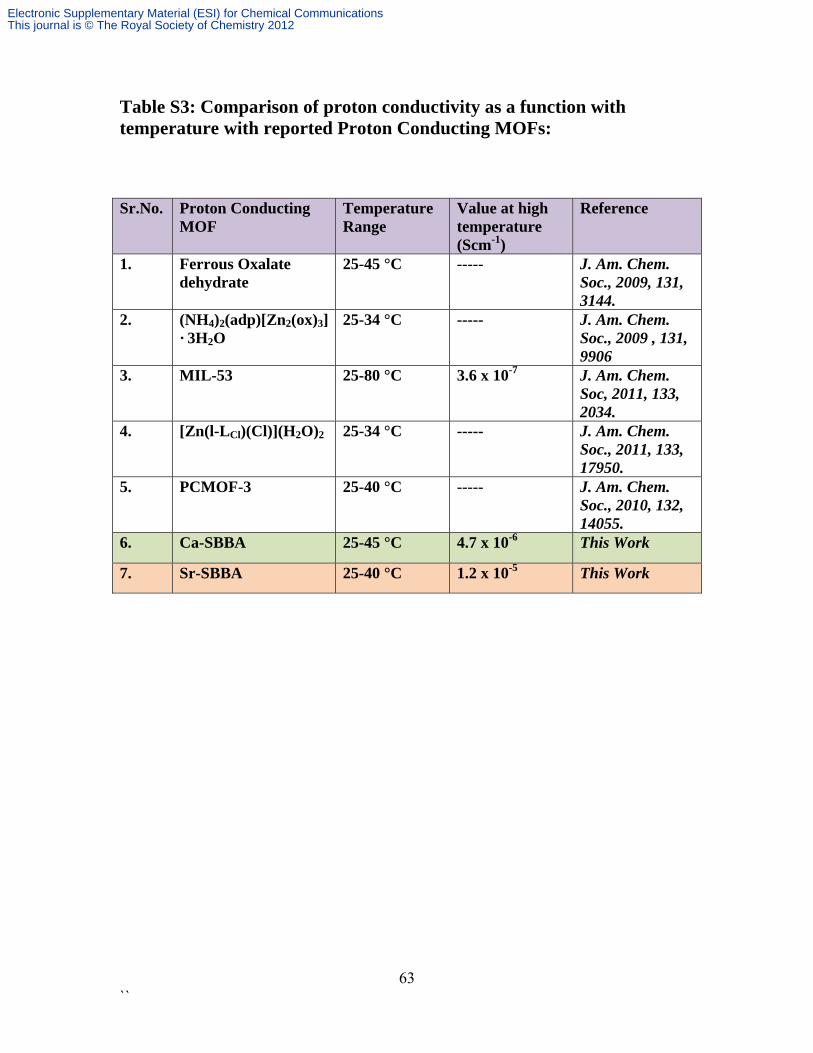
Table S3: Comparison of proton conductivity as a function with temperature with reported Proton Conducting MOFs: Sr.No. Proton Conducting
MOF Temperature Range
Value at high temperature (Scm-1)
Reference
1. Ferrous Oxalate dehydrate
25-45 °C ----- J. Am. Chem. Soc., 2009, 131, 3144.
2. (NH4)2(adp)[Zn2(ox)3] · 3H2O
25-34 °C ----- J. Am. Chem. Soc., 2009 , 131, 9906
3. MIL-53 25-80 °C 3.6 x 10⁻⁷ J. Am. Chem. Soc, 2011, 133, 2034.
4. [Zn(l-LCl)(Cl)](H2O)2 25-34 °C ----- J. Am. Chem. Soc., 2011, 133, 17950.
5. PCMOF-3 25-40 °C ----- J. Am. Chem. Soc., 2010, 132, 14055.
6. Ca-SBBA 25-45 °C 4.7 x 10⁻⁶ This Work
7. Sr-SBBA 25-40 °C 1.2 x 10⁻⁵ This Work
Electronic Supplementary Material (ESI) for Chemical CommunicationsThis journal is © The Royal Society of Chemistry 2012