Alignment of Multi-Sensor Data: Adjustment of Sampling...
31
Transcript of Alignment of Multi-Sensor Data: Adjustment of Sampling...
Alignment of Multi-Sensor Data: Adjustment
of Sampling Frequency and Time Shifts
Marcus VollmerInstitute of Bioinformatics, University Medicine Greifswald
Young-DZHK Retreat 2018
08 June 2018, Majuwie Greifswald
Outline
1 Multi-Sensor Data
2 Adjustment of Time Shifts
3 Correction of Sampling Frequency
4 Perspectives
Alignment of multi-sensor data | Marcus Vollmer 2
1. Multi-Sensor Data
1. Multi-Sensor Data
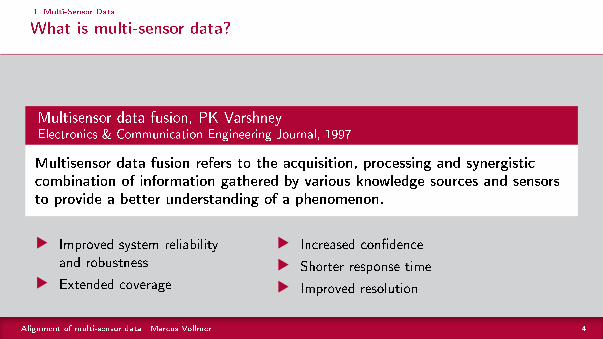
What is multi-sensor data?
Multisensor data fusion, PK VarshneyElectronics & Communication Engineering Journal, 1997
Multisensor data fusion refers to the acquisition, processing and synergistic
combination of information gathered by various knowledge sources and sensors
to provide a better understanding of a phenomenon.
t Improved system reliabilityand robustness
t Extended coveraget Increased con�dence
t Shorter response timet Improved resolution
Alignment of multi-sensor data | Marcus Vollmer 4

1. Multi-Sensor Data
Research team
Alignment of multi-sensor data | Marcus Vollmer 5

1. Multi-Sensor Data
Research team
GEFÖRDERT VOM
Alignment of multi-sensor data | Marcus Vollmer 5
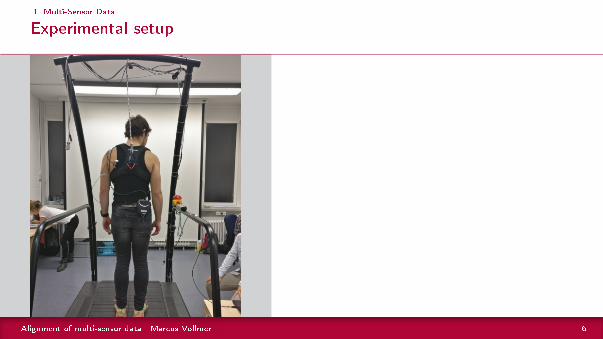
1. Multi-Sensor Data
Experimental setup
Alignment of multi-sensor data | Marcus Vollmer 6
1. Multi-Sensor Data
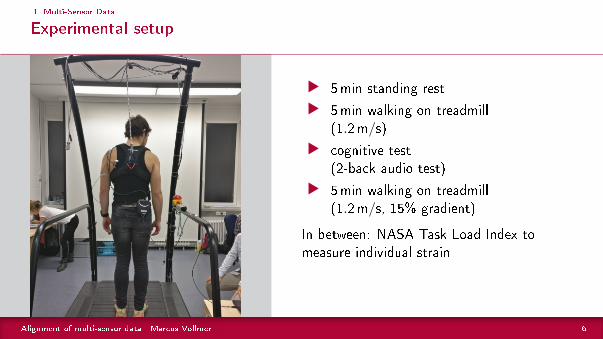
Experimental setup
t 5min standing rest
t 5min walking on treadmill(1.2m/s)
t cognitive test(2-back audio test)
t 5min walking on treadmill(1.2m/s, 15% gradient)
In between: NASA Task Load Index tomeasure individual strain
Alignment of multi-sensor data | Marcus Vollmer 6
1. Multi-Sensor Data
Experimental setup
Polar
Nexus
SOT
H
H
H H
S
S
S
SF F
FN
NNFaros
Hexoskin
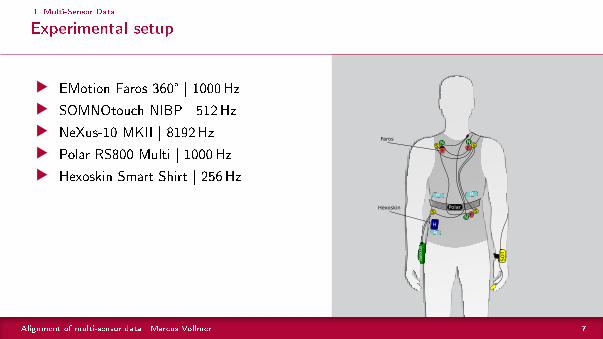
t EMotion Faros 360° | 1000Hz
t SOMNOtouch NIBP | 512Hz
t NeXus-10 MKII | 8192Hz
t Polar RS800 Multi | 1000Hz
t Hexoskin Smart Shirt | 256Hz
Alignment of multi-sensor data | Marcus Vollmer 7
1. Multi-Sensor Data
Experimental setup
Polar
Nexus
SOT
H
H
H H
S
S
S
SF F
FN
NNFaros
Hexoskin
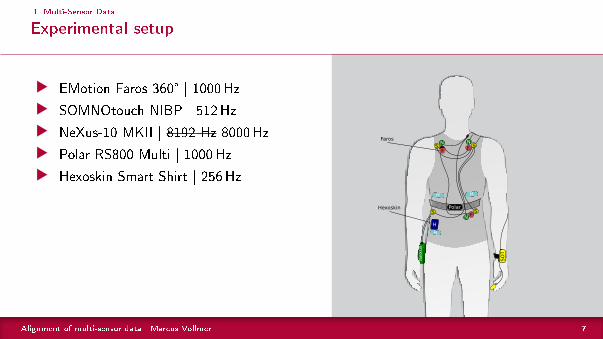
t EMotion Faros 360° | 1000Hz
t SOMNOtouch NIBP | 512Hz
t NeXus-10 MKII | 8192 Hz 8000Hz
t Polar RS800 Multi | 1000Hz
t Hexoskin Smart Shirt | 256Hz
Alignment of multi-sensor data | Marcus Vollmer 7
2. Adjustment of Time Shifts
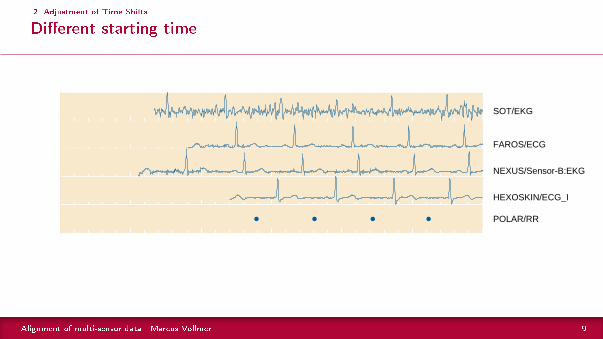
2. Adjustment of Time Shifts
Di�erent starting time
SOT/EKG
FAROS/ECG
NEXUS/Sensor-B:EKG
HEXOSKIN/ECG_I
POLAR/RR
Alignment of multi-sensor data | Marcus Vollmer 9

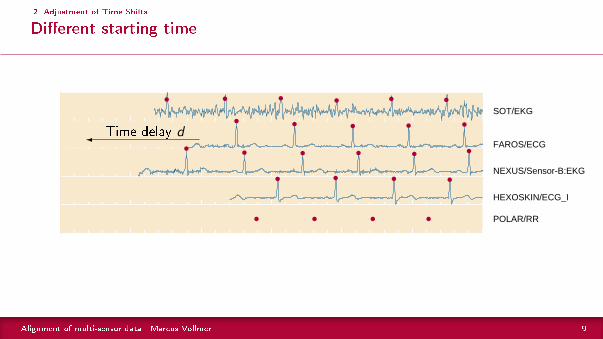
2. Adjustment of Time Shifts
Di�erent starting time
SOT/EKG
FAROS/ECG
NEXUS/Sensor-B:EKG
HEXOSKIN/ECG_I
POLAR/RR
Alignment of multi-sensor data | Marcus Vollmer 9
2. Adjustment of Time Shifts
Di�erent starting time
SOT/EKG
FAROS/ECG
NEXUS/Sensor-B:EKG
HEXOSKIN/ECG_I
POLAR/RR
Time delay d�
Alignment of multi-sensor data | Marcus Vollmer 9
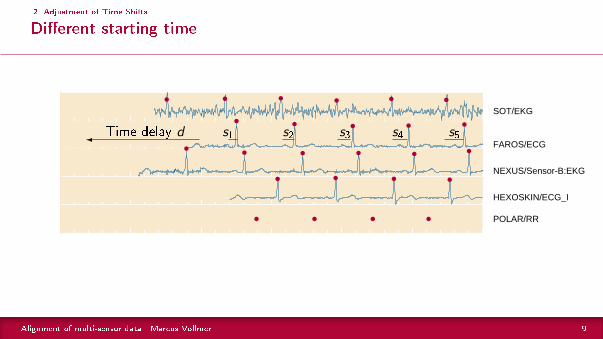
2. Adjustment of Time Shifts
Di�erent starting time
SOT/EKG
FAROS/ECG
NEXUS/Sensor-B:EKG
HEXOSKIN/ECG_I
POLAR/RR
Time delay d� s1 s2 s3 s4 s5
Alignment of multi-sensor data | Marcus Vollmer 9
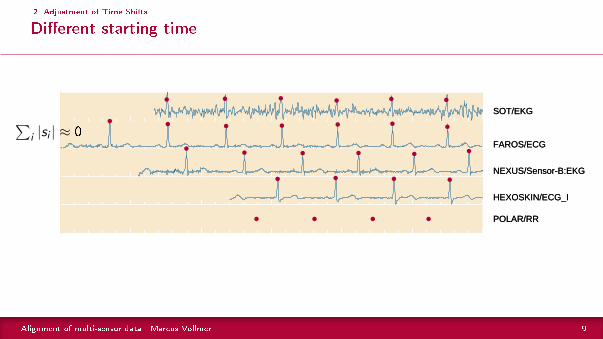
2. Adjustment of Time Shifts
Di�erent starting time
SOT/EKG
FAROS/ECG
NEXUS/Sensor-B:EKG
HEXOSKIN/ECG_I
POLAR/RR
SOT/EKG
FAROS/ECG
NEXUS/Sensor-B:EKG
HEXOSKIN/ECG_I
POLAR/RR
∑i |si | ≈ 0
Alignment of multi-sensor data | Marcus Vollmer 9
2. Adjustment of Time Shifts
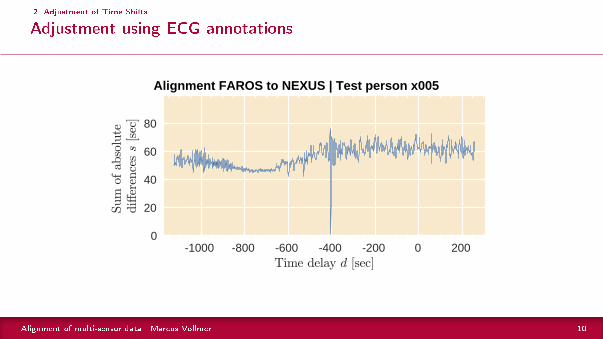
Adjustment using ECG annotations
-1000 -800 -600 -400 -200 0 2000
20
40
60
80
Alignment FAROS to NEXUS | Test person x005
Alignment of multi-sensor data | Marcus Vollmer 10
3. Correction of Sampling
Frequency
3. Correction of Sampling Frequency
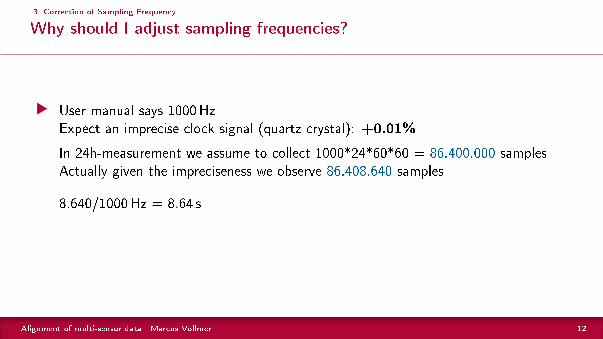
Why should I adjust sampling frequencies?t User manual says 1000Hz
Expect an imprecise clock signal (quartz crystal): +0.01%
In 24h-measurement we assume to collect 1000*24*60*60 = 86.400.000 samplesActually given the impreciseness we observe 86.408.640 samples
8.640/1000Hz = 8.64 s
t Identical signals are not aligned anymore
t Without adjustment wrong conclusions can be concluded:
Alignment of multi-sensor data | Marcus Vollmer 12
3. Correction of Sampling Frequency
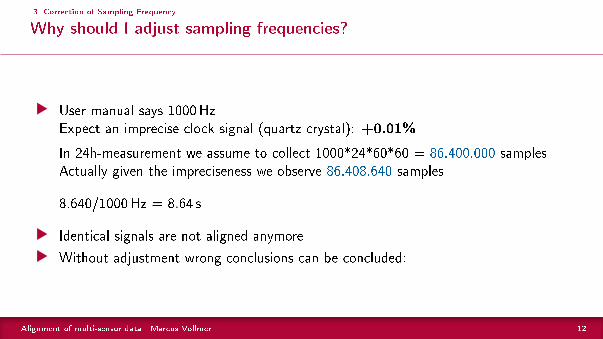
Why should I adjust sampling frequencies?t User manual says 1000Hz
Expect an imprecise clock signal (quartz crystal): +0.01%
In 24h-measurement we assume to collect 1000*24*60*60 = 86.400.000 samplesActually given the impreciseness we observe 86.408.640 samples
8.640/1000Hz = 8.64 s
t Identical signals are not aligned anymore
t Without adjustment wrong conclusions can be concluded:
Alignment of multi-sensor data | Marcus Vollmer 12
3. Correction of Sampling Frequency
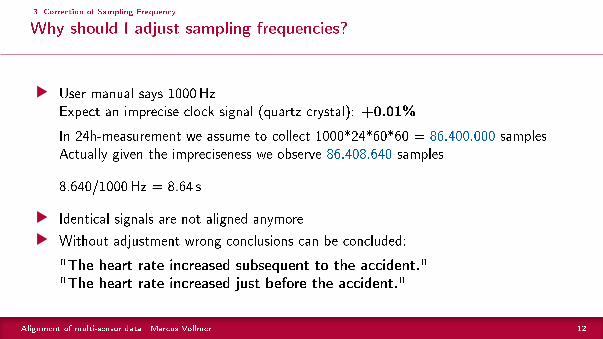
Why should I adjust sampling frequencies?t User manual says 1000Hz
Expect an imprecise clock signal (quartz crystal): +0.01%
In 24h-measurement we assume to collect 1000*24*60*60 = 86.400.000 samplesActually given the impreciseness we observe 86.408.640 samples
8.640/1000Hz = 8.64 s
t Identical signals are not aligned anymore
t Without adjustment wrong conclusions can be concluded:
"The heart rate increased subsequent to the accident."
"The heart rate increased just before the accident."
Alignment of multi-sensor data | Marcus Vollmer 12
3. Correction of Sampling Frequency
Linear adjustment of sampling frequencies
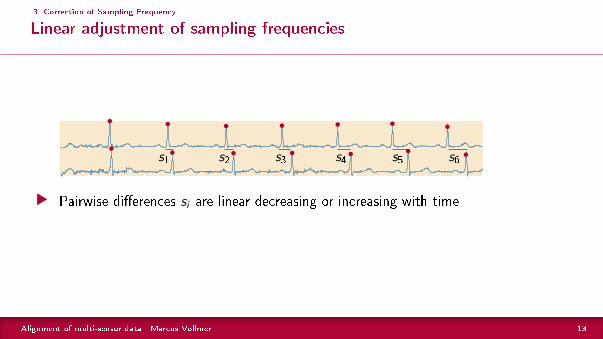
s1 s2 s3 s4 s5 s6
t Pairwise di�erences si are linear decreasing or increasing with time
Alignment of multi-sensor data | Marcus Vollmer 13
3. Correction of Sampling Frequency
Linear adjustment of sampling frequencies
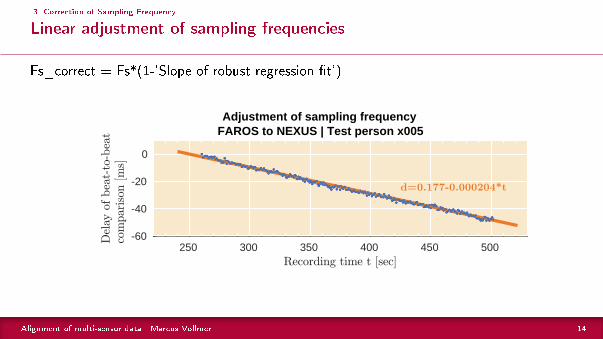
250 300 350 400 450 500-60
-40
-20
0
Adjustment of sampling frequencyFAROS to NEXUS | Test person x005
Fs_correct = Fs*(1-'Slope of robust regression �t')
Alignment of multi-sensor data | Marcus Vollmer 14
3. Correction of Sampling Frequency
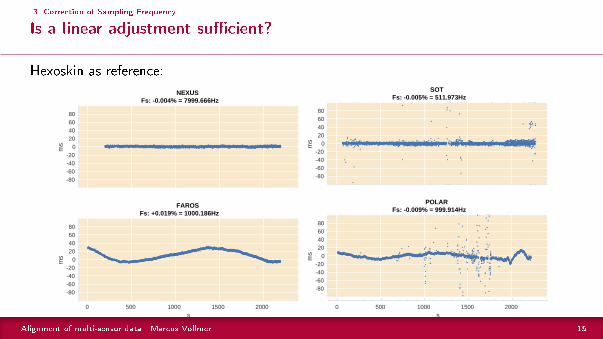
Is a linear adjustment su�cient?
Hexoskin as reference:
0 500 1000 1500 2000s
-80-60-40-20
020406080
ms
FAROSFs: +0.019% = 1000.186Hz
-80-60-40-20
020406080
ms
NEXUSFs: -0.004% = 7999.666Hz
0 500 1000 1500 2000s
-80-60-40-20
020406080
ms
POLARFs: -0.009% = 999.914Hz
-80-60-40-20
020406080
ms
SOTFs: -0.005% = 511.973Hz
Alignment of multi-sensor data | Marcus Vollmer 15

4. Perspectives
4. Perspectives
Bene�ts from multi-sensor data
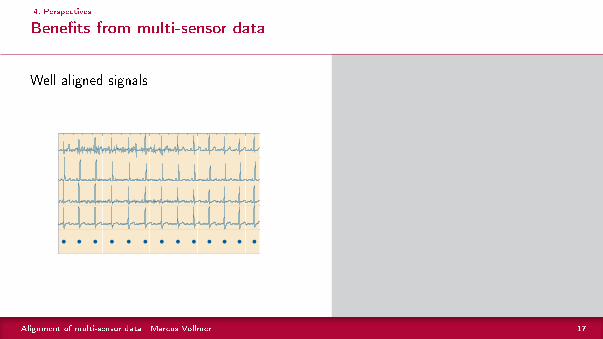
Well aligned signals
2.585 2.59 2.595 2.6
10 5
2.585 2.59 2.595 2.6
10 5
2.585 2.59 2.595 2.6
10 5
2.585 2.59 2.595 2.6
10 5
t Quality assurance
t Increased con�dence
t Backup signals(low signal quality, signal loss)
t Use of full signal variety(body movement, temperature,respiration)
t Comparison of manufacturersheart rate estimation
t Extraction of realistic noise
t Veri�cation/accuracy ofPolar RR Intervals
Alignment of multi-sensor data | Marcus Vollmer 17
4. Perspectives
Bene�ts from multi-sensor data
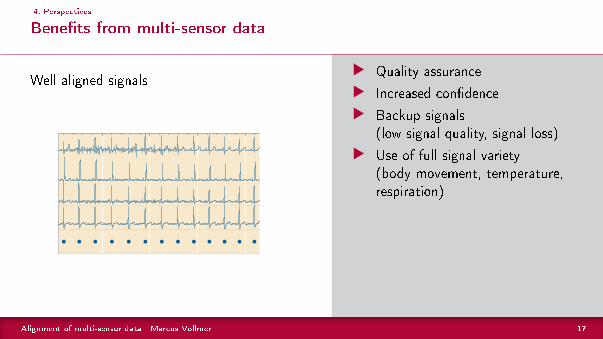
Well aligned signals
2.585 2.59 2.595 2.6
10 5
2.585 2.59 2.595 2.6
10 5
2.585 2.59 2.595 2.6
10 5
2.585 2.59 2.595 2.6
10 5
t Quality assurance
t Increased con�dence
t Backup signals(low signal quality, signal loss)
t Use of full signal variety(body movement, temperature,respiration)
t Comparison of manufacturersheart rate estimation
t Extraction of realistic noise
t Veri�cation/accuracy ofPolar RR Intervals
Alignment of multi-sensor data | Marcus Vollmer 17
4. Perspectives
Bene�ts from multi-sensor data
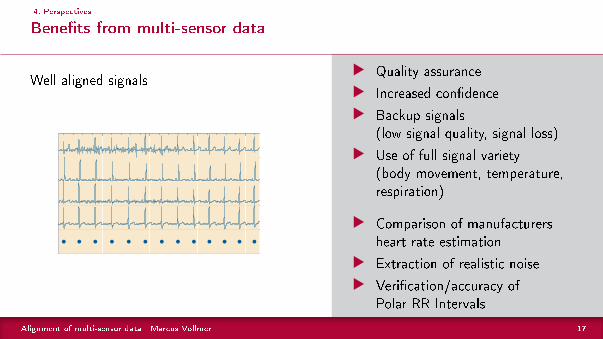
Well aligned signals
2.585 2.59 2.595 2.6
10 5
2.585 2.59 2.595 2.6
10 5
2.585 2.59 2.595 2.6
10 5
2.585 2.59 2.595 2.6
10 5
t Quality assurance
t Increased con�dence
t Backup signals(low signal quality, signal loss)
t Use of full signal variety(body movement, temperature,respiration)
t Comparison of manufacturersheart rate estimation
t Extraction of realistic noise
t Veri�cation/accuracy ofPolar RR Intervals
Alignment of multi-sensor data | Marcus Vollmer 17
4. Perspectives
Bene�ts from multi-sensor data
Well aligned signals
2.585 2.59 2.595 2.6
10 5
2.585 2.59 2.595 2.6
10 5
2.585 2.59 2.595 2.6
10 5
2.585 2.59 2.595 2.6
10 5
t Quality assurance
t Increased con�dence
t Backup signals(low signal quality, signal loss)
t Use of full signal variety(body movement, temperature,respiration)
t Comparison of manufacturersheart rate estimation
t Extraction of realistic noise
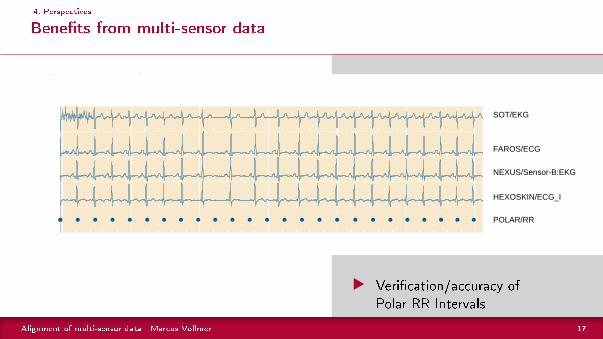
t Veri�cation/accuracy ofPolar RR Intervals
SOT/EKG
FAROS/ECG
NEXUS/Sensor-B:EKG
HEXOSKIN/ECG_I
POLAR/RR
Alignment of multi-sensor data | Marcus Vollmer 17
4. Perspectives
Future experiments
Alignment of multi-sensor data | Marcus Vollmer 18

Thank You for
Your Attention!