ALICE: A STUDY OF FINANCIAL HARDSHIP IN IDAHO · Andrew Abrahamson Madeline Leonard Dan Treglia,...
33
2018 REPORT IN IDAHO FINANCIAL HARDSHIP A STUDY OF ALICE: ALICE ® is an acronym for Asset Limited, Income Constrained, Employed. The United Way ALICE Project is a collaboration of United Ways in Connecticut, Florida, Hawai‘i, Idaho, Indiana, Iowa, Louisiana, Maryland, Michigan, New Jersey, New York, Ohio, Oregon, Texas, Virginia, Washington, and Wisconsin.
Transcript of ALICE: A STUDY OF FINANCIAL HARDSHIP IN IDAHO · Andrew Abrahamson Madeline Leonard Dan Treglia,...

2018REPORT
IN IDAHOFINANCIAL HARDSHIPA STUDY OFALICE:
ALICE® is an acronym for Asset Limited, Income Constrained, Employed.
The United Way ALICE Project is a collaboration of United Ways in Connecticut, Florida, Hawai‘i,Idaho, Indiana, Iowa, Louisiana, Maryland, Michigan, New Jersey, New York, Ohio, Oregon, Texas,Virginia, Washington, and Wisconsin.

i
Twin County United Way
United Way of Idaho Falls & Bonneville County, Inc.
United Way of Moscow/Latah County
United Way of North Idaho
United Way of South Central Idaho, Inc.
United Way of Southeastern Idaho
United Way of Treasure Valley, Inc. Note: In addition to the corporate sponsorships, this Report was made possible by these United Ways.
Learn more here: https://www.uwpnw.org/alice_in_pnw
THE UNITED WAYS OF IDAHO
NATIONAL ALICE ADVISORY COUNCILThe following companies are major funders and supporters of the United Way ALICE Project.
Aetna Foundation n AT&T n Atlantic Health System n Deloitte n Entergy Johnson & Johnson n KeyBank n Novartis Pharmaceuticals Corporation n OneMain Financial RWJBarnabas Health n Thrivent Financial Foundation n Union Bank & Trust n UPS n U.S. Venture

ii
LETTER TO THE COMMUNITY Dear Pacific Northwesterners,
Just three years ago, our region was first introduced to a population that many of us were aware of, if not part of: ALICE. ALICE households work hard, sometimes in two or three jobs, but still cannot afford to make ends meet. The first United Way ALICE Report helped identify and highlight the struggles of ALICE in the Pacific Northwest. But awareness is only the first step. We need to do more to help ALICE families achieve financial stability, which in turn strengthens our communities.
However, this won’t be an easy task. This Report shows that the percentage of people who are ALICE or living in poverty in the Pacific Northwest has increased in the past few years: up to 42 percent in Oregon, 40 percent in Idaho, and 39 percent in Washington. The truth is, nobody in these three states should be that surprised. Most of us, especially those living in urban areas, see people on a daily basis huddled in doorways or living in encampments under the freeways, and it’s hard not to notice the longer lines at local food banks. Yet what we see is just the tip of the iceberg. As this report shows, there are hundreds of thousands more who are one unexpected expense away from losing their home, or not being able to pay for heat, for food, or medical bills.
As upsetting as it is to see ALICE in front of us in our daily lives, in greater and greater numbers, I’m also hopeful that these experiences – backed up by the data in this Report – will motivate more of us to take action.
We must do more. And many of us have. Nonprofit organizations have been using these ALICE reports to help tell their stories and to get funding for programs that can positively impact this population. We have made strides in improving access to early education and reducing the burden of health care costs, which translates into improved situations for ALICE. Thanks to the Report, our member United Ways are more relevant in the conversation to end poverty. In fact, several have been appointed to serve on state or local government task forces, where they are in a position to influence policy.
Significant changes in our region are also a sign of hope; our cities are growing, communities are building, medium to large businesses are growing, and all these changes create jobs. We have also seen an increase in minimum wage in two of the three states. But as this report demonstrates, this progress hasn’t kept pace with the rising cost of the average household budget.
We have to do more. Whether as individuals or as part of an organization or government agency, we all need to figure out what part we can play. There are many ways to help, such as engaging with United Ways, volunteering with your faith community, working at a food bank, writing letters to your local, state, and federal legislators, or simply becoming more engaged and involved in your own neighborhood.
I hope that you’ll join me in rolling up our sleeves to get some work done to improve life for the people and communities of the Pacific Northwest.
Sincerely,
Jim Cooper, President & CEO, United Way of Pacific Northwest

iii
THE UNITED WAY ALICE PROJECTThe United Way ALICE Project provides a framework, language, and tools to measure and understand the struggles of a population called ALICE – an acronym for Asset Limited, Income Constrained, Employed. ALICE is the growing number of households in our communities that do not earn enough to afford basic necessities. This research initiative partners with state United Way organizations to present data that can stimulate meaningful discussion, attract new partners, and ultimately inform strategies for positive change.
Based on the overwhelming success of this research in identifying and articulating the needs of this vulnerable population, the United Way ALICE Project has grown from a pilot in Morris County, New Jersey in 2009, to the entire state of New Jersey in 2012, and now to the national level with 18 states participating. The Pacific Northwest United Ways are proud to join the more than 540 United Ways in these states that are working to better understand ALICE's struggles. Organizations across the country are also using this data to address the challenges and needs of their employees, customers, and communities. The result is that ALICE is rapidly becoming part of the common vernacular, appearing in the media and in public forums discussing financial hardship in communities nationwide.
Together, United Ways, government agencies, nonprofits, and corporations have the opportunity to evaluate current initiatives and discover innovative approaches that give ALICE a voice, and create changes that improve life for ALICE and the wider community.
To access reports from all states, visit UnitedWayALICE.org
States With United Way ALICE Reports
MarylandDistrict ofColumbia
Oregon
Nevada
California
Washington Montana
Idaho
North Dakota
Wyoming
South Dakota
Nebraska
Kansas
Minnesota
Wisconsin
Illinois
Missouri
Iowa
Oklahoma
Texas
ColoradoUtah
Arizona New MexicoArkansas Tennessee
Kentucky Virginia
Pennsylvania
Delaware
ConnecticutRhode Island
Massachusetts
New HampshireVermont Maine
New Jersey
New York
North Carolina
South Carolina
Indiana
Michigan
Ohio
Alabama
Georgia
Florida
MississippiLouisiana
Hawai‘i
Alaska
West Virginia

iv
THE ALICE RESEARCH TEAMThe United Way ALICE Project provides high-quality, research-based information to foster a better understanding of who is struggling in our communities. To produce the United Way ALICE Report for the Pacific Northwest, a team of researchers collaborated with a Research Advisory Committee, composed of 14 representatives from across the Pacific Northwest, who advised and contributed to the Report. This collaborative model, practiced in each state, ensures each Report presents unbiased data that is replicable, easily updated on a regular basis, and sensitive to local context. Working closely with United Ways, the United Way ALICE Project seeks to equip communities with information to create innovative solutions.
Lead ResearcherStephanie Hoopes, Ph.D. is the lead researcher and director of the United Way ALICE Project. Dr. Hoopes began this effort with a pilot study of a more accurate way to measure financial hardship in Morris County, New Jersey in 2009. Since then, she has overseen its expansion into a broad-based, state-by-state research initiative now spanning 18 states across the country. Her research on the ALICE population has garnered both state and national media attention.
Before joining United Way full time in 2015, Dr. Hoopes taught at Rutgers University and Columbia University. Dr. Hoopes has a doctorate from the London School of Economics, a master’s degree from the University of North Carolina at Chapel Hill, and a bachelor’s degree from Wellesley College.
Dr. Hoopes is on the board of directors of the McGraw-Hill Federal Credit Union, and she received a resolution from the New Jersey Assembly for her work on ALICE in 2016.
Research Support TeamAndrew Abrahamson Madeline Leonard Dan Treglia, Ph.D.
ALICE Research Advisory Committee for the Pacific NorthwestFred Abousleman, M.P.A. Oregon Cascades West Council of Governments
Charity Bergman United Way of North Central Washington
Mark Edwards, Ph.D. Oregon State University, School of Public Policy
Katie Fitzpatrick, Ph.D. Seattle University, Albers School of Business and Economics
Larry Geri, M.P.A. The Evergreen State College, Master of Public Administration Program
Patrick Jones, Ph.D. Eastern Washington University, Institute for Public Policy & Economic Analysis
Kim Matson Idaho Department of Health and Welfare
Jennifer McKinney, Ph.D. Seattle Pacific University, Sociology Department
Alivia Metts, B.S. The Metts Group
Ali Modarres, Ph.D. University of Washington, Tacoma, Urban Studies
Will Summers, B.S. Oregon Employment Department
Kathryn Tacke, M.A. Idaho Department of Labor
Aimee White, M.Ed. Custom Evaluation Services

v

vi
TABLE OF CONTENTSEXECUTIVE SUMMARY ..................................................................................................................................... 1
ALICE BY THE NUMBERS .................................................................................................................................5
THE HOUSEHOLD SURVIVAL BUDGET ............................................................................................................. 12
ALICE IN THE WORKFORCE ............................................................................................................................ 13
EMERGING TRENDS .......................................................................................................................................17
NEXT STEPS ..................................................................................................................................................23
ALICE
IN ID
AHO
INDEX OF FIGURESFigure 1. Household Income, Idaho, 2010 to 2016 ..................................................................................... 5
Figure 2. Household Income by Age of Head of Household, Idaho, 2010 to 2016 ..................................... 6
Figure 3. Households Below the ALICE Threshold, by Age and Race/Ethnicity, Idaho, 2010 to 2016 ...... 8
Figure 4. Single or Cohabiting (Under 65) Households, No Children, by Income, Idaho, 2010 to 2016 ......9
Figure 5. Families With Children by Income, Idaho, 2010 to 2016 ..........................................................10
Figure 6. Percent of Households Below the ALICE Threshold by County, Idaho, 2010 and 2016 ............ 11
Figure 7. Household Survival Budget, Idaho Average, 2016 ....................................................................12
Figure 8. Number of Jobs by Hourly Wage, Idaho, 2016 ...........................................................................13
Figure 9. Top 20 Occupations by Employment and Wage, Idaho, 2016 ....................................................14
Figure 10. Employment by Firm Size With Average Annual Wages, Idaho, 2016 .....................................15
Figure 11. Percent Employment by Firm Size, Idaho, 2016 .......................................................................16
Figure 12. Population Projection, Idaho, 2010 to 2040 ........................................................................... 17
Figure 13. Population Inflows and Outflows, Idaho, 2016 ........................................................................18

1UNITE
D WAY
ALIC
E REP
ORT –
IDAH
O
EXECUTIVE SUMMARYIn Idaho, nearly a quarter of a million households – 40 percent – could not afford basic needs such as housing, child care, food, health care, and transportation in 2016.
This update of the United Way ALICE Report for Idaho provides the most comprehensive look at the population called ALICE – an acronym for Asset Limited, Income Constrained, Employed. ALICE households have incomes above the Federal Poverty Level (FPL) but struggle to afford basic household necessities.
The Report describes the cost of basic needs for each county in Idaho, as well as the number of households earning below this amount – the ALICE Threshold – and focuses on how households have fared since the Great Recession ended in 2010.
Despite overall improvement in employment and gains in median incomes, the economic recovery in Idaho has been uneven. Many ALICE families continue to face challenges from low wages, reduced work hours, depleted savings, and increasing costs. For the many families who earned just above the ALICE Threshold in the past, the increases in the cost of living have pushed them below the Threshold and into financial hardship. In fact, the total number of Idaho households that cannot afford basic needs increased 14 percent from 2010 to 2016.
This report focuses on trends in Idaho that led to more families becoming unable to make ends meet. Key findings include:
• Households continue to struggle: Of Idaho’s 609,028 households, 14 percent lived in poverty in 2016 and another 26 percent were ALICE. Combined, 40 percent (246,326 households) had income below the ALICE Threshold, an increase of 14 percent since 2010.
• Basic cost of living still on the rise: The cost of basic household expenses increased steadily in Idaho to $53,664 for a family of four (two adults with one infant and one preschooler) and $19,824 for a single adult, significantly higher than the 2016 FPL of $24,300 for a family and $11,880 for a single adult. The cost of the family budget increased by 27 percent from 2010 to 2016, higher than the 9 percent national rate of inflation of during that time period.
• Changes in the workforce: Although unemployment rates are falling, ALICE workers are still struggling. Low-wage jobs dominate the landscape, with 70 percent of all jobs paying less than $20 per hour, while an increase in contract jobs and on-demand jobs has created less stability. Gaps in wages persist and vary based on the type of employer as well as the gender, education, race, and ethnicity of workers.
• Emerging trends: Several trends could change the economic landscape for ALICE families:
• The changing American household – The aging of baby boomers; the millennials, who are making different lifestyle and work choices than previous generations; and the shifting patterns of domestic and foreign migration are all changing the household composition. These trends change demands for goods and services, and will have the biggest impact on the infrastructure and on caring for the elderly.
• Market instability – A globally connected economy means that economic disruptions and natural disasters in one part of the world will increasingly have an impact on ALICE workers in the U.S., contributing to employment instability, shifting supply and demand, and disruption in traditional modes of operation.
• Health inequality – As advances in medical care outpace the ability of many households to afford them, there will be increasing disparities in health and longevity based on income.
The United Way ALICE Report for Idaho offers an enhanced set of tools for stakeholders to measure the real challenges ALICE households face in trying to make ends meet. This information is presented to enable communities to move beyond stereotypes of “the poor” and an outdated FPL and instead use unbiased data to inform programmatic and policy solutions for ALICE and communities, now and for the future.

2 UNITE
D WAY
ALIC
E REP
ORT –
IDAH
O
RESEARCH FRAMEWORKGLOSSARYALICE is an acronym that stands for Asset Limited, Income Constrained, Employed, comprising households with income above the Federal Poverty Level but below the basic cost of living. A household consists of all the people who occupy a housing unit, but does not include those living in group quarters such as a dorm, nursing home, or prison.
The Household Survival Budget calculates the actual costs of basic necessities (housing, child care, food, transportation, health care, a smartphone, and taxes) in Washington, adjusted for different counties and household types.
The ALICE Threshold is the average income that a household needs to afford the basic necessities defined by the Household Survival Budget for each county in Idaho. (Households earning below the ALICE Threshold include both ALICE and poverty-level households.)
DATA PARAMETERSThe ALICE measures presented in the United Way ALICE Report for Idaho are calculated for each county. Because Idaho is economically, racially, ethnically, and geographically diverse, state averages conceal significant differences between counties and within them, between municipalities. For example, the percent of households below the ALICE Threshold ranges from 32 percent in Ada and Caribuo Counties to 68 percent in Madison County.
The first United Way ALICE report measured change before and after the Great Recession, 2007 and 2010. This report focuses on the recovery, and measures change from the baseline of 2010 followed by the even years since – 2012, 2014, and 2016 – and highlights trends since the end of the Recession.
Using a variety of sources, this report examines issues surrounding ALICE households from different angles. Sources include the American Community Survey, the U.S. Department of Housing and Urban Development, the U.S. Department of Agriculture, the Bureau of Labor Statistics at the U.S. Department of Labor, the Internal Revenue Service, and Idaho Department of Health and Welfare. State, county, and municipal data is used to provide different lenses on ALICE households. The data are estimates; some are geographic averages, others are 1-, 3-, or 5-year averages depending on population size. Starting in 2014, 3-year averages were no longer produced by the American Community Survey, so data after that year for communities with populations of less than 65,000 are 5-year averages.
The ALICE methodology is reviewed every two years to accommodate changes in cost of living, sources, and best practices. This year, the primary change is the addition of the cost of a smartphone to the Household Survival Budget, because smartphones have become a regular part of life and essential for U.S. workers (Pew Research Center, 2017).
A full documentation of the sources and methodology for the report is provided in the Methodology Overview on the website: UnitedWayALICE.org. Details on each county’s household income and ALICE demographics, as well as further breakdown by municipality, are listed in the ALICE County Pages and Data File.

3UNITE
D WAY
ALIC
E REP
ORT –
IDAH
O
AT-A-GLANCE: IDAHO 2016 Point-in-Time Data
Population: 1,683,140 | Number of Counties: 44 | Number of Households: 609,028
How many households are struggling? ALICE, an acronym for Asset Limited, Income Constrained, Employed, comprises households that earn more than the Federal Poverty Level (FPL), but less than the basic cost of living for the state (the ALICE Threshold). Of Idaho’s 609,028 households, 87,976 earn below the FPL (14 percent) and another 158,350 (26 percent) are ALICE.
How much does ALICE earn?In Idaho, 70 percent of jobs pay less than $20 per hour, with two-thirds of those paying less than $15 per hour. Another 27 percent of jobs pay from $20 to $40 per hour. Less than 4 percent of jobs pay above $40 per hour.
What does it cost to afford the basic necessities?Despite a low rate of inflation nationwide – 9 percent from 2010 to 2016 – the bare-minimum Household Survival Budget increased by 21 percent for a single adult and 27 percent for a family of four. Affording only a very modest living, this budget is still significantly more than the Federal Poverty Level of $11,880 for a single adult and $24,300 for a family.
Idaho Average – 2016
SINGLE ADULT 2 ADULTS, 1 INFANT, 1 PRESCHOOLER
Monthly CostsHousing $500 $692Child Care $- $919Food $177 $586Transportation $346 $692Health Care $196 $728Technology $55 $75Miscellaneous $150 $407Taxes $228 $373
Monthly Total $1,652 $4,472ANNUAL TOTAL $19,824 $53,664Hourly Wage* $9.91 $26.83
*Full-time wage required to support this budget Source: American Community Survey; U.S. Department of Housing and Urban Development; U.S. Department of Agriculture; Bureau of Labor Statistics; Internal Revenue Service, and Idaho Department of Health and Welfare, 2016
14%
26%
60%
Poverty
ALICE
Above ALICEThreshold
0 50
100 150 200 250 300 350 400 450 500
Less Than $20
$20-$40 $40-$60 $60-$80 Above $80
Num
ber o
f Job
s (in
thou
sand
s)
0.2% 3%
27%
70%
0.3% Less Than$10
$15-$20
$10-$15
$30-$40
$20-$30

4 UNITE
D WAY
ALIC
E REP
ORT –
IDAH
O
AT-A
-GLA
NCE:
IDAH
O
Idaho Counties, 2016
COUNTY TOTAL HOUSEHOLDS % ALICE & POVERTYAda 167,026 32%Adams 1,655 44%Bannock 30,106 44%Bear Lake 2,395 37%Benewah 3,592 45%Bingham 14,712 44%Blaine 8,708 38%Boise 2,994 41%Bonner 17,109 48%Bonneville 38,464 34%Boundary 4,393 48%Butte 1,061 45%Camas 379 39%Canyon 69,859 45%Caribou 2,553 32%Cassia 7,717 50%Clark 287 61%Clearwater 3,668 44%Custer 1,801 45%Elmore 9,832 41%Franklin 4,226 46%Fremont 4,466 42%Gem 6,287 47%Gooding 5,476 52%Idaho 6,443 49%Jefferson 8,150 38%Jerome 7,647 51%Kootenai 58,875 39%Latah 15,218 49%Lemhi 3,698 49%Lewis 1,624 50%Lincoln 1,596 58%Madison 10,508 68%Minidoka 7,261 48%Nez Perce 16,127 36%Oneida 1,551 55%Owyhee 4,068 63%Payette 8,195 43%Power 2,465 48%Shoshone 5,660 44%Teton 3,725 40%Twin Falls 30,119 43%Valley 3,446 41%Washington 3,886 50%
4

5UNITE
D WAY
ALIC
E REP
ORT –
IDAH
O
ALICE BY THE NUMBERSIdahoans of all ages, races and ethnicities, urban or rural, single or married with children, can be ALICE or in poverty. This section drills down to reveal demographic differences of ALICE and poverty-level households by age, race and ethnicity, and household type over time. It also reports on important local variations that are often masked by state averages.
Overall population changes: In Idaho, the total number of households increased by 5 percent between 2010 and 2016 to 609,028. But the number of ALICE and poverty-level households increased even more, from 215,956 in 2010 to 246,326 in 2016, a 14 percent increase (Figure 1).
• Poverty: The number of households in poverty – defined in 2016 as those earning $11,880 for a single adult and $24,300 for a family of four – increased from 83,185 in 2010 to 87,976 in 2016, a 6 percent increase. The proportion of all households that were in poverty remained relatively flat at 14 percent during that period.
• ALICE: The number of ALICE households increased from 132,771 in 2010 to 158,350 in 2016, a 19 percent increase. The proportion of all ALICE households rose from 23 percent to 26 percent during that period.
Figure 1. Household Income, Idaho, 2010 to 2016
14% 15% 14% 14%
23% 24% 25% 26%
63% 61% 61% 60%
577,433 584,635 594,276 609,028
0
100,000
200,000
300,000
400,000
500,000
600,000
700,000
2010 2012 2014 2016
Hou
seho
lds
ALICEPoverty Above ALICE Threshold
Source: American Community Survey, 2010-2016, and the ALICE Threshold, 2010-2016; for additional data and ALICE Methodology, see UnitedWayALICE.org
HOUSEHOLDS BY AGETwo major population bubbles are changing communities across Idaho: The baby boomers are the largest generation, and as they age, their needs and preferences change. The second largest group is the millennials (adults born between 1980 and 1996, also known as Generation Y), who are making different lifestyle and work choices than previous generations. Between the two population bubbles is the smaller Generation X,
6 UNITE
D WAY
ALIC
E REP
ORT –
IDAH
O
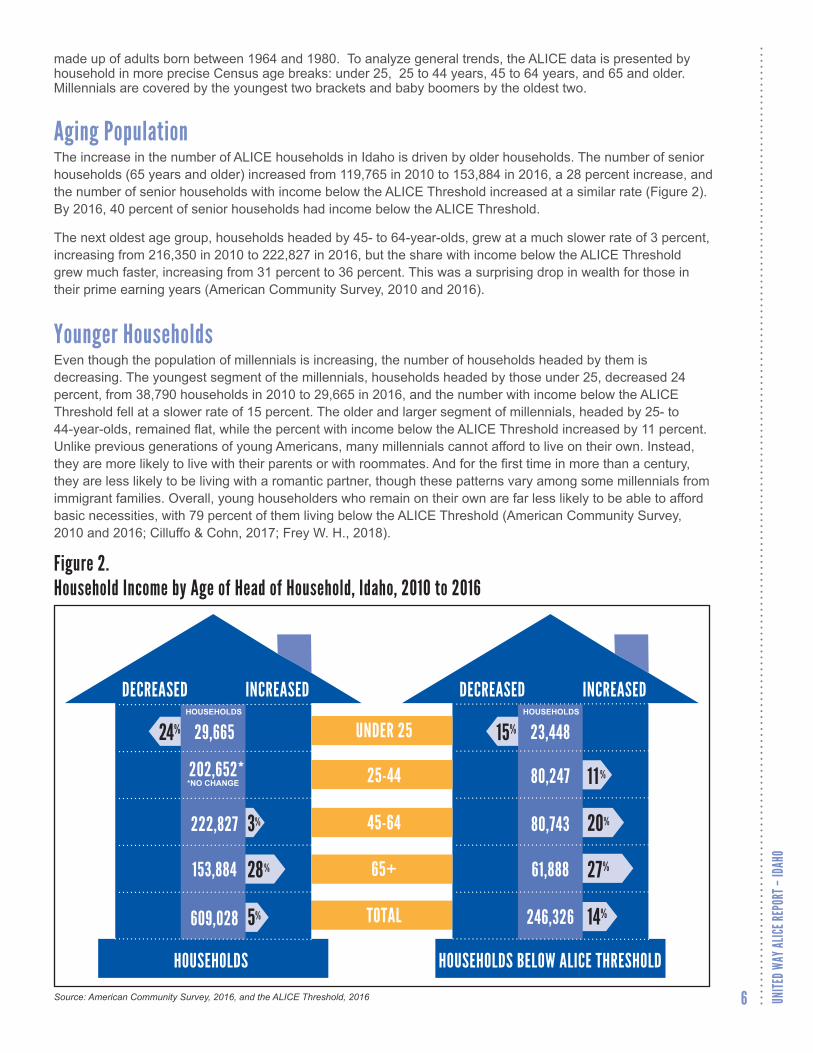
made up of adults born between 1964 and 1980. To analyze general trends, the ALICE data is presented by household in more precise Census age breaks: under 25, 25 to 44 years, 45 to 64 years, and 65 and older. Millennials are covered by the youngest two brackets and baby boomers by the oldest two.
Aging Population The increase in the number of ALICE households in Idaho is driven by older households. The number of senior households (65 years and older) increased from 119,765 in 2010 to 153,884 in 2016, a 28 percent increase, and the number of senior households with income below the ALICE Threshold increased at a similar rate (Figure 2). By 2016, 40 percent of senior households had income below the ALICE Threshold.
The next oldest age group, households headed by 45- to 64-year-olds, grew at a much slower rate of 3 percent, increasing from 216,350 in 2010 to 222,827 in 2016, but the share with income below the ALICE Threshold grew much faster, increasing from 31 percent to 36 percent. This was a surprising drop in wealth for those in their prime earning years (American Community Survey, 2010 and 2016).
Younger HouseholdsEven though the population of millennials is increasing, the number of households headed by them is decreasing. The youngest segment of the millennials, households headed by those under 25, decreased 24 percent, from 38,790 households in 2010 to 29,665 in 2016, and the number with income below the ALICE Threshold fell at a slower rate of 15 percent. The older and larger segment of millennials, headed by 25- to 44-year-olds, remained flat, while the percent with income below the ALICE Threshold increased by 11 percent. Unlike previous generations of young Americans, many millennials cannot afford to live on their own. Instead, they are more likely to live with their parents or with roommates. And for the first time in more than a century, they are less likely to be living with a romantic partner, though these patterns vary among some millennials from immigrant families. Overall, young householders who remain on their own are far less likely to be able to afford basic necessities, with 79 percent of them living below the ALICE Threshold (American Community Survey, 2010 and 2016; Cilluffo & Cohn, 2017; Frey W. H., 2018).
Figure 2. Household Income by Age of Head of Household, Idaho, 2010 to 2016
UNDER 25
TOTAL
25-44
45-64
65+
DECREASED INCREASED
14%
27%
15%24% 29,665
202,652**NO CHANGE
222,827
153,884
609,028
23,448
80,247
80,743
61,888
246,326
DECREASED INCREASED
HOUSEHOLDS BELOW ALICE THRESHOLDHOUSEHOLDS
28%
20%
11 %
3%
5%
HOUSEHOLDSHOUSEHOLDS
Source: American Community Survey, 2016, and the ALICE Threshold, 2016

7UNITE
D WAY
ALIC
E REP
ORT –
IDAH
O
HOUSEHOLDS BY RACE AND ETHNICITYBecause White (non-Hispanic) households are the largest racial group, making up 89 percent of households in Idaho, changes in income to this group drive statewide numbers, yet they often mask important changes in other ethnic groups. For example, the total number of households of color has grown at a faster rate than the total number of White households, contributing to a 5 percent increase in total households in Idaho from 2010 to 2016. The number of Hispanic, Asian, and Black households with income below the ALICE Threshold has grown at a faster rate as well, contributing to a 14 percent increase in the number of households below the Threshold.
The United Way ALICE Reports follow the primary U.S. Census classifications – White, Black, and Asian. In addition, people of any race can also be of Hispanic ethnicity; because these are two separate questions on the Census, race and ethnicity are overlapping categories. Other race/ethnicity categories have small samples and do not report income, so ALICE data is not available: Less than 1 percent of households in Idaho identify themselves as American Indian/Alaska Native, as “Some Other Race,” or as “Two or More Races” (American Community Survey, 2016).
A breakdown by race and age shows other important trends:
Hispanic, Asian, and Black households are increasing faster than White households: From 2010 to 2016, the number of White households in Idaho increased by 4 percent to 531,960, while the number of Hispanic households increased by 17 percent to 48,598, Asian households increased by 12 percent to 6,684, and Black households increased by 16 percent to 3,025.
Young households are decreasing overall: The number of White under-25 households fell by 26 percent from 2010 to 2016, causing a decrease in the overall number of young households in Idaho. At the same time the number of under-25 households in all race and ethnic groups fell. The number of Hispanic under-25 households decreased by 22 percent, Asian under-25 households decreased by 26 percent, and Black under-25 households decreased by 21 percent. This trend differed from national trends, which saw an increase in under-25 Hispanic and Asian households.
Senior households of all race and ethnic groups are increasing: White senior households are driving the overall growth in the senior population, increasing by 27 percent from 2010 to 2016, but other senior groups are experiencing significant growth as well: Hispanic senior households increased by 80 percent, Asian senior households by 36 percent, and Black senior households by 111 percent.
Below ALICE Threshold households increased across the board: The number of households living below the ALICE Threshold increased in most race and ethnic groups across ages except for younger households from 2010 to 2016 (Figure 3). The largest increases were among households 65 years and older, with White senior households below the ALICE Threshold increasing by 26 percent, Hispanic senior households by 74 percent, Asian senior households by 73 percent, and Black senior households by 1,755 percent. The over 1,000 percent increase in the number of Black senior households stands out, but in actuality, there are fewer than 340 Black senior households in the state of Idaho.

8 UNITE
D WAY
ALIC
E REP
ORT –
IDAH
O
Figure 3. Households Below the ALICE Threshold, by Age and Race/Ethnicity, Idaho, 2010 to 2016
TOTAL BELOW ALICE THRESHOLD
TOTAL HOUSEHOLDS
DECREASED INCREASED DECREASED INCREASED
BLACK HOUSEHOLDSWHITE HOUSEHOLDS
HOUSEHOLDS
UNDER 25
25-44
TOTAL BELOW ALICE THRESHOLD
45-64
65+
TOTAL HOUSEHOLDS
UNDER 25
25-44
45-64
65+
DECREASED INCREASED DECREASED INCREASED
ASIAN HOUSEHOLDSHISPANIC HOUSEHOLDS
HOUSEHOLDS
HOUSEHOLDS
HOUSEHOLDS
363
473
557
204
18,74314% 23%
56,752 26%
254,492
20%
17%
17%
531,960 4%
3%
89%
1,755%
16%
26%
28,426 30%
48,598 17%
1,597
3,025
110,366
68,631
12% 3,085
28%15,066
74%2,257
1,295
715
584
8,018 51%
288
2,882
6,684
33%
35%
16%
73%
23%
12%
Source: American Community Survey, 2010-2016, and the ALICE Threshold, 2010-2016

9UNITE
D WAY
ALIC
E REP
ORT –
IDAH
O
HOUSEHOLDS BY FAMILY TYPEDramatic changes are occurring in the living arrangements of Americans. After decades of declining marriage rates, along with rising levels of divorce, remarriage, and cohabitation, the married couple with two children family is no longer typical. Since the 1970s, American households have become smaller for a number of reasons: Fewer households have children, there are fewer married-couple households, and more people are living alone, especially at older ages. People are living in a wider variety of arrangements, including singles living alone or with roommates, and grown children living with parents. The share of American adults who have never been married is at a historic high. In Idaho, there are 276,218 households composed of single or cohabiting adults under the age of 65 with no children under age 18. They make up the largest group in Idaho, accounting for 45 percent of all households (Figure 4).
Figure 4. Single or Cohabiting (Under 65) Households, No Children, by Income, Idaho, 2010 to 2016
14% 14% 14% 14%
25% 26% 27% 27%
61% 60% 59% 59%
266,507 264,864 270,394 276,218
50,000
0
100,000
150,000
200,000
250,000
300,000
20122010 2014 2016
Above ALICE ThresholdALICEPoverty
Hou
seho
lds
Source: American Community Survey, 2016, and the ALICE Threshold, 2016
These single or cohabiting households without children under 18 are also the group with the largest number of households below the ALICE Threshold. In 2016, 113,428 of these households, 41 percent, had income below the ALICE Threshold (Figure 4), increasing from 39 percent in 2010.
Families With ChildrenAmong families with children, the roles of parents are changing, as fathers are doing more housework and child care, and mothers are doing more paid work outside the home. Nationally, 42 percent of mothers were sole or primary breadwinners, bringing in 50 percent or more of family earnings, and another 22 percent were co-breadwinners, earning 25 percent to 49 percent of earnings in 2015. Over the last 30 years, the number of stay-at-home fathers has doubled to 2.2 million, and the amount of housework fathers report doing has also doubled to nine hours a week (Glynn, 2016; Cohn & Caumont, 2016; Parker & Livingston, 2017; Livingston, 2014).

10 UNITE
D WAY
ALIC
E REP
ORT –
IDAH
O
The composition of families with children is also changing. There are increasing numbers of other types of families, including those with several cohabiting generations and those with lesbian, gay, bisexual, and transgender (LGBT) parents. Households with combined children from parents’ prior relationships are also on the rise. In fact, almost one in six children under the age of 18 now lives in a family with parents and children from previous relationships. More than a quarter of married LGBT couples are now raising children, and the number of same-sex marriages more than doubled nationally from just before the Supreme Court ruling in 2013, which required the federal government to recognize state-sanctioned marriages of same-sex couples, to the 2015 ruling that enabled same-sex marriage nationwide (Gates & Brown, 2015; Cohn & Caumont, 2016; Pew Research Center, 2015).
Idaho families saw the following changes from 2010 to 2016:
• Below ALICE Threshold: Of all Idaho families with children, there were 71,010 with income below the ALICE Threshold – 50 percent were married parent families, 38 percent were single female-parent families, and 12 percent were single male-parent families.
• Married families: The number of married parent families with children fell by 6 percent, from 2010 to 2016, while the number below the ALICE Threshold decreased by 8 percent (Figure 5).
• Single female-headed families: The number of single female-headed families with children fell by 7 percent, but the number below the ALICE Threshold increased slightly by 1 percent. As a result, the percent of single female-headed families below the ALICE Threshold increased from 75 percent to 82 percent.
• Single male-headed families: This smallest share of family types increased by 8 percent; the number with income below the ALICE Threshold increased even more, by 30 percent.
Figure 5. Families With Children by Income, Idaho, 2010 to 2016
TOTAL
DECREASED INCREASED
SINGLE FEMALE-HEADED
MARRIED PARENTS
SINGLE MALE-HEADED
FAMILIES
DECREASED INCREASED
FAMILIES BELOW ALICE THRESHHOLD
HOUSEHOLDS HOUSEHOLDS
131,399
32,9287%
14,599 8% 30%
9%
1%
178,926
6% 8%
6%
35,179
26,961
8,870
71,010
Source: American Community Survey, 2010-2016, and the ALICE Threshold, 2010-2016

11UNITE
D WAY
ALIC
E REP
ORT –
IDAH
O
ALICE BY COUNTY Contrary to stereotypes that suggest financial hardship only exists in inner cities, ALICE households live in urban, suburban, and rural areas and in every county in Idaho. The number of households with income below the ALICE Threshold increased across most counties from 2010 to 2016. But there is enormous variation among counties; the percent of households below the ALICE Threshold ranges from 32 percent in Ada and Caribou Counties to 68 percent in Madison County (Figure 6).
Figure 6. Percent of Households Below the ALICE Threshold by County, Idaho, 2010 and 2016
2010 2016
Boise Idaho Falls
Caldwell
Boise Idaho Falls
Caldwell
23% 68%
Percent Below ALICE Threshold
Source: American Community Survey, 2010 and 2016, and the ALICE Threshold, 2010 and 2016. Details on each county’s household income and ALICE demographics, as well as further breakdown by municipality, are listed in the ALICE County Pages and Data File at UnitedWayALICE.org

12 UNITE
D WAY
ALIC
E REP
ORT –
IDAH
O
THE HOUSEHOLD SURVIVAL BUDGETThe Household Survival Budget reflects the bare minimum cost to live and work in the modern economy. In Idaho, the average Household Survival Budget was $53,664 for a four-person family and $19,824 for a single adult in 2016 (Figure 7). The hourly wage necessary to support a family budget is $26.83, for one parent working 40 hours per week, 50 weeks per year (or $13.42 per hour each, if two parents work), and $9.91 per hour, full time, for a single adult. These costs continue to increase faster than the rate of inflation.
Figure 7. Household Survival Budget, Idaho Average, 2016
Idaho Average – 2016 Percent Change from 2010-2016
SINGLE ADULT2 ADULTS, 1 INFANT,
1 PRESCHOOLERSINGLE ADULT
2 ADULTS, 1 INFANT, 1 PRESCHOOLER
Monthly Costs Housing $500 $692 4% 5%
Child Care $- $919 N/A 10%
Food $177 $586 1% 10%
Transportation $346 $692 13% 14%
Health Care $196 $728 92% 78%
Technology* $55 $75 N/A N/A
Miscellaneous $150 $407 21% 27%
Taxes $228 $373 30% 118%
Monthly Total $1,652 $4,472 21% 27%
ANNUAL TOTAL $19,824 $53,664 21% 27%
Hourly Wage** $9.91 $26.83 21% 27%
*New to budget in 2016 **Wage working full-time required to support this budget
Source: U.S. Department of Housing and Urban Development, 2016; U.S. Department of Agriculture, 2016; Bureau of Labor Statistics, 2016; Internal Revenue Service; Tax Foundation; and Idaho Department of Health and Welfare, 2016. For the Methodology Overview and additional data, see our website: UnitedWayALICE.org
The cost of household basics in the Household Survival Budget – housing, child care, food, transportation, health care, technology, and taxes – increased by 21 percent for a single adult and 27 percent for a family of four from 2010 to 2016. In comparison, the rate of inflation nationally was 9 percent, while median earnings increased by 11 percent nationally, and 17 percent in Idaho. The rise in the Household Survival Budget in Idaho was driven primarily by the addition of technology, which includes a smartphone; and more than a 78 percent increase in health care cost, stemming primarily from the increase in out-of-pocket health care costs and a small portion from the addition of the Affordable Care Act penalty (for more details on health care costs, see the Methodology Overview) (Bureau of Labor Statistics, 2018; American Community Survey, 2010 and 2016).

13UNITE
D WAY
ALIC
E REP
ORT –
IDAH
O
ALICE IN THE WORKFORCEIdaho has experienced improvements in employment and productivity across the state, especially in the state’s key sectors: health care and social assistance; leisure and hospitality; trade, transportation, and warehousing; construction; financial services; and manufacturing. Strongest growth has been around urban centers, while rural counties continue to struggle, and in some cases remain below 2007 employment levels. Yet, for a range of reasons – including low wages, lack of full-time work, and a reduced share of profits going to workers – ALICE is not benefitting financially from seemingly positive economic trends (Shaul, 2018; Idaho Department of Labor, 2016).
LOW-WAGE JOBS Low-wage jobs continue to dominate the Idaho economy, especially in health care and social assistance and leisure and hospitality, making it more challenging for workers to find jobs with wages that can support even a basic household budget. With almost 650,000 total jobs in Idaho recorded by the Bureau of Labor Statistics in 2016, the job market has shown improvement since 2010. But 70 percent of these jobs pay less than $20 per hour, with two-thirds of those paying less than $15 per hour (Figure 8). A full-time job that pays $15 per hour grosses $30,000 per year, which is just over half of the Household Survival Budget for a family of four in Idaho (Bureau of Labor Statistics, 2016).
Figure 8. Number of Jobs by Hourly Wage, Idaho, 2016
0
50
100
150
200
250
300
350
400
450
500
Less Than $20 $20-$40 $40-$60 $60-$80 Above $80
Num
ber o
f Job
s (in
thou
sand
s)
0.2% 3%
27%
70%
0.3% Less Than
$10
$10 - $15
$15 - $20
$20 - $30
$30 $40-
Source: Bureau of Labor Statistics, Occupational Employment Statistics Wage Survey – All Industries Combined, 2016

14 UNITE
D WAY
ALIC
E REP
ORT –
IDAH
O
ALICE the Maintainer Many ALICE workers are employed in the service sector, but they also work in occupations that build and repair our infrastructure, as well as in jobs that educate and care for the workforce. Together, these workers were aptly described as “maintainers” by technology scholars Lee Vinsel and Andrew Russel in 2016 (Frey & Osborne, September 2013; Vinsel & Russell, 2016).
The top 20 occupations employing the most people in Idaho are predominantly maintainer jobs, which are more likely to pay low wages. In 2016, only two of the top 20 occupations – general and operations managers and registered nurses – paid enough to support the Household Survival Budget for a family of four, a minimum of $26.83 per hour (Figure 9).
The most common occupation in Idaho, retail sales, pays a wage that is well below what is needed to make ends meet. The more than 25,270 retail salespeople make an average of $11.04 per hour, or $22,080 if working full time year round. These jobs fall short of meeting the family Household Survival Budget by more than $31,000 per year. Even if two parents worked full time at this wage, they would fall short of the Household Survival Budget by more than $9,000 per year.
Figure 9. Top 20 Occupations by Employment and Wage, Idaho, 2016
2016 Percent Change 2010-2016
OCCUPATION NUMBER OF JOBSMEDIAN
HOURLY WAGENUMBER OF JOBS
MEDIAN HOURLY WAGE
Retail Salespersons 25,270 $11.04 29% 11%
Customer Service Reps 17,590 $13.71 53% 16%
Office Clerks 16,420 $13.70 -4% 14%
Cashiers 15,190 $9.36 2% 7%
Registered Nurses 12,330 $29.90 14% 6%
General and Operations Managers 12,250 $31.53 3% -1%
Heavy and Tractor-Trailer Truck Drivers 11,940 $18.33 1% 14%
Waiters and Waitresses 11,410 $8.90 24% 4%
Combined Food Prep, Including Fast Food 11,350 $8.92 11% 4%
Personal Care Aides 10,840 $10.20 182% 11%
Janitors and Cleaners 9,130 $10.96 2% 5%
Secretaries and Administrative Assistants 8,780 $14.65 61% 7%
Bookkeeping and Auditing Clerks 8,540 $16.76 6% 14%
Laborers and Movers, Hand 7,730 $12.60 10% 19%
Elementary School Teachers 7,190 N/A N/A N/A
Teacher Assistants 6,980 N/A N/A N/A
Nursing Assistants 6,820 $11.93 -10% 13%
Stock Clerks and Order Fillers 6,810 $11.43 15% 18%
Cooks, Fast Food 6,730 $8.55 101% 1%
First-Line Supervisors of Administrative Workers 6,550 $22.18 -7% 15%
Source: Bureau of Labor Statistics, Occupational Employment Statistics Wage Survey – All Industries Combined, 2010 and 2016

15UNITE
D WAY
ALIC
E REP
ORT –
IDAH
O
SMALL BUSINESSESOne of the key determinants of ALICE workers’ wages, benefits, and job stability is the size of their employer. Generally, large companies have greater resources to offer career growth opportunities, continuous employment, and better benefits. Small businesses, defined by the Bureau of Labor Statistics as firms with fewer than 500 workers, have been an important engine for growth in the U.S. economy, driving job creation, innovation, and wealth, and have traditionally grown to become medium or large employers. However, small businesses are more vulnerable to changes in demand, price of materials, and transportation costs, as well as to cyberattacks and natural disasters. As a result, their employees face more instability, reduced wages, and a greater risk of job loss. The past decade has been particularly tough for small businesses, with entrepreneurial growth in the U.S. largely down from the levels experienced in the 1980s and 1990s (Ewing Marion Kauffman Foundation, 2017; Haltiwanger & et., 2017).
Despite these struggles, small businesses employed 61 percent of the private sector workforce in 2016 in Idaho (Figure 10). The very smallest firms – those with fewer than 20 people – accounted for the largest share of small-business employment. Yet because small firms experience the greatest turnover of employees of any size firm, workers move in and out of employment, which can lead to periods of no wages.
Figure 10. Employment by Firm Size With Average Annual Wages, Idaho, 2016
$28,020
$31,068
$35,544
$37,272
$47,256
0
50,000
100,000
150,000
200,000
250,000
300,000
350,000
400,000
Small Firms Large Firms
Num
ber o
f Job
s
500+
250-499
50-249
20-49
0-19
Firm Size by Number of Employees
Source: U.S. Census; Quarterly Workforce Indicators, 2016
The wages of employees in the smallest firms are significantly lower than wages in larger firms (Figure 10). While wages have been increasing faster than the 9 percent national rate of inflation, they have not kept pace with the 27 percent increase in the cost of the family Household Survival Budget. From 2010 to 2016, full-time workers in firms with fewer than 20 employees saw their wages rise by 11 percent to $28,020, workers in companies with 20 to 49 employees saw their wages increase by 8 percent from 2010 to 2016 to $31,068, and workers in companies with 50 to 250 employees saw their wages increase by 18 percent from 2010 to 2016 to $35,544.
Full-time employees in firms with the highest wage levels also experienced increases in their wages. Those working in firms with 250 to 499 employees saw their wages rise by 19 percent to $37,272, and those working in companies with 500 or more employees saw these wages increase by 19 percent to $47,256.

16 UNITE
D WAY
ALIC
E REP
ORT –
IDAH
O
Wages vary widely by location and by sector; areas dominated by small companies tend to have lower wages and less job stability. In Figure 11, the map on the left shows the percent of workers in each county who are employed by the smallest firms (fewer than 20) and the map on the right shows the percent of workers in each county employed by the largest firms (500 or more), with lighter areas representing a lower percent of workers employed, and the darker areas representing a higher percentage. Rural counties in Idaho have a higher concentration of employment in firms with fewer than 20 employees, while large companies – those with 500 or more employees – are more concentrated in urban areas around Boise and Idaho Falls (U.S. Census, 2016).
Figure 11. Percent Employment by Firm Size, Idaho, 2016
Fewer Than 20 Employees 500 or More Employees
Boise Idaho Falls
Caldwell
Boise Idaho Falls
Caldwell
19% 76%Percent Employed
2% 58%Percent Employed
Source: U.S. Census; Quarterly Workforce Indicators, 2016
GIG ECONOMYAs the economy approached full employment (generally defined as an unemployment rate of less than 5 percent) in many areas of Idaho and across the country in 2016, ALICE workers were less likely to be unemployed. But their income still lagged behind the cost of living in most areas. In some cases, the problem is just low wages. But there is also the challenge of finding full-time, continuous employment. During the past decade there has been a shift away from traditional full-time, full-benefit jobs. In 2016, 15 to 33 percent of the workforce worked as a consultant or contingent worker, temp, freelancer, or contractor – within the so-called gig economy. According to some estimates, 100 percent of U.S. net employment growth in the last decade has come from alternative or contingent labor, but in Idaho the estimates are lower. While this sector is challenging to measure, there is clear evidence that more workers are experiencing gaps in employment and less regular schedules, and they are forgoing retirement plans, health insurance, and worker safety protections. Many gig economy workers struggle to afford ongoing monthly expenses and often don’t qualify for loans or other financial products that require regular income (Abraham, Haltiwanger, Sandusky, & Spletzer, 2016; Katz & Krueger, 2016; Freelancers Union & Elance-oDesk, 2016; Wald, 2014; Gaggl & Eden, 2015; U.S. Government Accountability Office, 2015; Idaho Department of Labor, 2018 ; Caza, Vough, & Moss, 2017).

17UNITE
D WAY
ALIC
E REP
ORT –
IDAH
O
EMERGING TRENDS While ALICE families in Idaho differ in their composition, challenges, and level of need, there are three broad trends that will impact the conditions they face in the next decade and opportunities to change their financial status: The changing American household, increasing market instability, and growing inequality of health. These trends will also have significant implications for local communities and the state as a whole.
THE CHANGING AMERICAN HOUSEHOLDDecades of shifting demographic trends have created changes in demand for housing, health care, transportation, and community services. These changes have implications for which families become ALICE households and where they live and work.
Growing Populations: Millennials, Baby Boomers, and ImmigrantsPopulation Growth: Both millennials and baby boomers are powerful demographic forces. Millennials have different lifestyle preferences than past generations, including living in urban areas, and delaying marriage and having children. The large boomer cohort encompasses a group that is working longer, involved in a wide array of activities, and is generally healthier than previous generations. Both prefer smaller and lower-cost housing options near community amenities such as public transportation, restaurants, and religious or social organizations. As they age, seniors also value proximity to health care facilities (Lampkin & Barrett, 2015; Frey W. H., 2018).
Idaho’s elderly population is projected to grow from 194,668 (12 percent) in 2010 to 438,990 (21 percent) by 2040, a 126 percent increase, one of the largest in the country (Figure 12). In contrast, demographers predict that the rest of the population will increase in numbers, but their percent of the overall population will actually decline. For example, 0- to 19-year-olds will grow from 475,281 (30 percent) in 2010 to 575,060 (28 percent) by 2040 and 20- to 64-year-olds will grow from 897,633 (58 percent) in 2010 to over 1 million (51 percent) by 2040 (Weldon Cooper Center for Public Service, 2016).
Figure 12. Population Projection, Idaho, 2010 to 2040
30% 29% 28% 28%
58% 53% 51% 51%
12% 18%
21% 21%
0
500,000
1,000,000
1,500,000
2,000,000
2,500,000
2010 2020 2030 2040
Popu
latio
n
19 and Under 20 - 64 65 and Over
Source: Weldon Cooper Center for Public Service, 2016

18 UNITE
D WAY
ALIC
E REP
ORT –
IDAH
O
Migration: The primary driver behind Idaho’s population growth is the migration of people from other states, mainly neighboring states in the West and Midwest, as well as from abroad. Though people moved in and out of the state, more people across all age groups moved into Idaho than left in 2016, a trend that has been increasing over the last decade. The largest inflows and outflows are from those under 18 and college-age students. The largest net inflow is among those in their mid-career years (50 to 64). Inflows include those who are foreign born, with the largest numbers among college-age students (Aisch, Gebeloff, & Quealy, 2014; American Community Survey, 2016).
In addition to growth, there is a shift in the population distribution across Idaho, with an increasing portion of the population living in urban areas, while the population in rural areas is projected to remain flat (Shaul, 2018).
Figure 13. Population Inflows and Outflows, Idaho, 2016
4,467 2,338 4,039 3,372 1,224
6,154 2,719
(20,000)
(15,000)
(10,000)
(5,000)
0
5,000
10,000
15,000
20,000
Under 18 18 to 24 Mid 20s 30s 40s Mid-Career Retired: 65+
Outflow
Inflow - Foreign
Inflow - Domestic
Net Migration
Source: American Community Survey, 2016
Immigration: International migration plays an increasing role in Idaho’s racial and ethnic composition. The rate of immigration has increased over time, with the total number of immigrants arriving in Idaho each year increasing from 6,201 in 2010 to 8,529 in 2016, a 38 percent increase. The largest number of immigrants are under 18 years, followed closely by immigrants who are college age (18-24) and working age (25-64), and a much smaller number of seniors (American Community Survey, 2010, 2016).
As a result, the foreign-born population of almost 100,000 residents represented 5.8 percent of Idaho’s total population in 2016, up from 5 percent in 2000. By 2016, 39 percent had become citizens, 34 percent were undocumented, and 28 percent were legal permanent residents. Recent immigrants in Idaho come from Latin America (58 percent), followed by Asia (21 percent), but they also hail from Africa, Europe, and Canada (Migration Policy Institute, 2014; Migration Policy Institute, 2016; American Community Survey, 2016).
• Impact on the labor force: Due to labor shortages in the agricultural business, especially in the southern part of Idaho, applications from businesses seeking foreign-born workers are growing. Nationally, the portion of the labor force that is foreign born has risen from about 11 percent to just over 16 percent in the last 20 years. Because the number of immigrants and their children are increasing faster than the domestic population, they will become a significant portion of the future workforce (National Academies of Sciences, Engineering, and Medicine, 2017; Russell, 2017).

19UNITE
D WAY
ALIC
E REP
ORT –
IDAH
O• Immigrants work in all sectors: Across the country, large numbers of immigrants work as private
household workers (45 percent) and in farming, fishing, and forestry occupations (46 percent), but they also work across all industry and occupational groups (Cilluffo & Cohn, 2017).
• Immigrants vary widely in education: Among adults age 25 and older, 37 percent of Idaho’s foreign-born population has less than a high school education, compared with 8 percent of the native population. However, a higher percentage of the foreign-born population has a graduate or professional degree (9 percent), compared to the native-born population (7 percent) (American Community Survey, 2016).
Implications of Demographic TrendsChanging infrastructure needs: Millennials prefer to live near urban centers with amenities and public transportation; seniors want to be near family, health care, and other services; and immigrants want to live near good schools, public transportation, and jobs. These trends are increasing the demand for smaller, lower-cost housing units in Idaho, and pushing up prices for these units, making it harder for all ALICE households to find and afford basic housing. In fact, according to the Boise/Ada County Homeless Coalition, a person living in Idaho earning minimum wage cannot afford any of the available housing units (Vitu, 2016; Tremblay, 2017).
Increased need for caregiving: In addition to the aging population, retirees are also adding to the growing senior population in Idaho. As they age there will be increased demand for geriatric health services, including assisted living facilities, nursing homes, and home health care. The challenges to ensure seniors get the care they need include a shortage of paid and unpaid caregivers, lack of training among caregivers, and the financial and emotional burden of caregiving on family members (Idaho Family Caregiver Task Force and the Idaho Caregiver Alliance, 2015).
• The caregiver support ratio: The number of potential caregivers aged 45 to 64 for each person aged 80 and older was 7.6 in 2010 nationally, and is projected to fall to 4 by 2030, and then to 3 in 2050 (AARP Public Policy Institute, 2015; Redfoot, Feinberg, & Houser, 2013).
• Health aides are ALICE: Personal care and home health aide occupations do not require much training, are not well regulated, and are not well paid. These workers are largely women, with one in four being immigrants, earning a median annual income of $19,000 (Bureau of Labor Statistics, 2016; Espinoza, 2017).
• Elder abuse: Low pay, poor training, and lack of oversight may lead to poor quality caregiving, including abuse and neglect – physical, mental, and financial – an issue that is on the rise in Idaho and across the country (MetLife Mature Market Institute, June 2011; U.S. Bureau of Justice Statistics, 2015).
• Caregiving takes a toll: While families of all income levels may choose to care for family members themselves, many ALICE caregivers are forced into the role because they cannot afford to hire outside care. Half of caregivers reported household income of less than $50,000 per year and said they had no choice in taking on caregiving responsibilities. Caregiving also adds direct costs to a household budget and can reduce income due to hours away from work or even the loss of a job. Due to the responsibility of making medical decisions as well as the amount of care required, caregivers also experience mental and physical strain (Dixon, 2017; MetLife Mature Market Institute, June 2011; AARP Public Policy Institute, 2015; Rainville, Skufca, & Mehegan, 2016; Ramchand, Tanielian, & et., 2014).

20 UNITE
D WAY
ALIC
E REP
ORT –
IDAH
O
MARKET INSTABILITY In a complex, integrated global economy, ALICE workers will experience even greater fluctuations in employment and changes in job requirements. Economic disruptions and natural disasters in one part of the world will increasingly have an impact on ALICE workers in the U.S., contributing to employment instability, shifting supply and demand, and disruption in traditional modes of operation. ALICE families, with few resources to weather these fluctuations, will suffer the most.
Shifting Risk to WorkersAs businesses seek new ways to improve productivity and reduce costs, they have increasingly shifted to a contingent workforce that enables them to scale up or down as needed. Yet, workers bear the brunt of this strategy, by experiencing unexpected gains or losses in work hours, which makes it difficult for ALICE households to pay bills regularly, make short term family plans (e.g., child care), or make long-term financial plans such as qualifying for a mortgage. It also reduces the responsibility of employers to provide benefits, such as health insurance and retirement plans. This increases costs to ALICE families and makes them more vulnerable if they have a health crisis or have to retire early. In addition, unpredictable wages can put employer or government benefits that are tied to work hours in jeopardy, including paid and unpaid time off, health insurance, unemployment insurance, public assistance, and work supports. For example, low-wage workers are 2.5 times more likely to be out of work than other workers, but only half as likely to receive unemployment insurance (Garfield, Damico, Stephens, & Rouhani, 2015; Watson, Frohlich, & Johnston, 2014; U.S. Government Accountability Office, 2007).
Changing Job MarketMany ALICE jobs are repetitive and will disappear due to automation – a widely-covered topic in the media. Less often discussed is that many new jobs will be created to build and repair the newly mechanized parts of this infrastructure, however workers filling these maintainer roles will be required to develop new sets of skills. In the face of rapidly rising computing power, an ability to work with data and work alongside machines will be necessary. The pace of change may be faster than anticipated. By one estimate, 50 percent of subject knowledge acquired during the first year of a four-year technical degree will be outdated by the time students graduate. Types of jobs that are predicted to emerge in the next 20 to 30 years include Augmented Reality Architects, Alternative Currency Bankers, Waste Data Managers, 3D Printing Engineers, Privacy Managers, Wind Turbine Repair Techs, Nano-Medics, Drone Dispatchers, Robotic Earthworm Drivers, Body Part and Limb Makers, Memory Augmentation Therapists, Mass Energy Storage Developers, and Self-Driving Car Mechanics (Frey T. , 2011; Mejia, 2017; Manyika J. , et al., 2016; OECD, 2016; World Economic Forum, 2016).
Increasing Exposure to Environmental HazardsThe impact of natural and man-made disasters is often felt more by ALICE families, where they work and where they live. In Idaho, more affordable homes are often located in areas vulnerable to the most common disasters – heavy snows, record rains, rising rivers, landslides, avalanches, wildfires, and earthquakes. These directly threaten the homes of ALICE families and jobs where ALICE works. For example, ALICE families who live in flood prone areas may suffer the financial cost of flooding damage, and an ALICE worker suffers lost wages when crops fail and there is less work (van Paasschen, 2017; NASA, 2018; Simenc, Beech, Butts, & Harrigfeld, 2011; Dentzer, 2017).

21UNITE
D WAY
ALIC
E REP
ORT –
IDAH
O
Lacking Financial ReservesWhat makes market instability especially difficult for ALICE families is their lack of financial resilience: More than three-quarters of U.S. workers live paycheck to paycheck at least some of the time, and nearly as many are in debt. They do not have savings or access to credit that might sustain them through a low period of income or an unexpected disaster. The 2011 Corporation for Enterprise Development survey found that 32 percent of Idaho households were “asset poor,” defined as not having enough net worth to subsist at the poverty level for three months without income. With no savings, an emergency can quickly spiral into a crisis with devastating consequences (CareerBuilder, 2017; McKernan, Ratcliffe, & Shanks, 2011; Corporation for Enterprise Development, 2012).
Growing Wealth DivideWealth inequality is growing faster than income inequality. Without adequate assets, families have little to no savings and few opportunities to improve their situation. When families can invest in education, new technology, a small business, or their own home, they can develop socially and economically. They can also finance a secure retirement. Conversely, families with low incomes and no assets cannot even access traditional loans. Alternatives exist in high-risk markets where interest rates are higher, yet there are greater risks of predatory lending practices – and default. In some cases, the consequence of not taking out these loans are worse than the risk of taking them. It may be more costly to forgo heat or necessary medical care, for example, than the financial cost of predatory lending. In many cases, borrowing costs are cheaper than fees for missing payments, such as heat reinstatement fees. Households of color have fewer assets than White households. Nationally (state data is not available), the median wealth of White households was eight times the median wealth of Black households in 2010 and grew to 13 times in 2013 (the most recent data available) (Kochhar & Cilluffo, 2017; Mayer & Jencks, 1989; McKernan, Ratcliffe, & Shanks, 2011; McKernan, Ratcliffe, & Vinopal, 2009; Mills & Amick, 2011; CareerBuilder, 2017).
THE WEALTH-HEALTH GAPThere has long been a real and significant divide in health by socio-economic status, largely because of differences in living conditions, but also because of disparities in the quality of health care. With advances in technology and medical care, that gap is projected to grow. It is well documented that people in lower-income groups do not live as long as those in higher-income groups. For example, the National Academies of Sciences, Engineering, and Medicine projects that of men born in 1960, the life expectancy of those in the lowest-income quintile will be 13 years shorter than for those in the highest-income quintile (76 years compared to 89 years). For women born in 1960, the life expectancy for those in the lowest-income group will be 14 years shorter than for those in the highest-income group (78 years compared to 92 years) (National Academies of Sciences, Engineering, and Medicine, 2015; Chetty, Stepner, Abraham, & al, 2016; Komlos & Kelly, 2016).
This gap is projected to increase further in two ways. First, there is a rise in precision medicine, or the ability to personalize medical treatments, products, and interventions, especially for cancer and rare disease treatments. Precision medicine can be expensive and not always covered by insurance. Second, biotechnology and genetic engineering may soon make it possible to upgrade health, beyond treatment of injury and disease. For example, there are medical advances that will enable families who can afford it to repair genes that cause diseases like cystic fibrosis or insert genes that offer lifelong protection against infections and Alzheimer’s disease. Still in the testing stages, none are covered by health insurance and all are extremely expensive (Harari, 2014; Komlos & Kelly, 2016; Regalado, 2015).
Furthermore, the health-wealth divide is exacerbated by the differences in the environments where families live. Those with the fewest resources live in areas with unhealthy living conditions, such as contaminated water and polluted air, because these homes are less expensive. The impact of pollution, toxic exposure, and disease compounds over time.

22 UNITE
D WAY
ALIC
E REP
ORT –
IDAH
O
Institutionalized racism and ongoing discrimination also factor into disproportionate exposure to adverse health conditions, as people of color have typically had less mobility and choice around where they live and in job opportunities. A 30-year analysis of 319 commercial hazardous-waste treatment and storage sites in the U.S. found a consistent pattern of placing hazardous waste facilities in low-income neighborhoods and neighborhoods with Black and Hispanic families (Mohai & Saha, 2015). A variety of large studies have also revealed an association between low socio-economic status and greater harm from air pollution. A comprehensive review from Harvard University researchers revealed that Black, Asian, and Hispanic individuals as well as Medicaid-eligible individuals of any race/ethnicity had a higher likelihood of death from any pollution-related cause compared to the rest of the population, with Black people almost three times as likely to die from exposure to air pollutants than other groups (Di, Wang, Zanobetti, & Wang, 2017).
DENTAL HEALTH DIVIDE Nowhere is the wealth-health divide starker than in the disparity in dental care. The wealthy have dental insurance (most often separate from health insurance) and access to care that provides resistance to tooth decay and breakage, jaw comfort, clear speech, and easier maintenance - all of which lead to better overall health. The wealthiest families spend thousands of dollars on supplemental dental care to achieve whiter, straighter, stronger smiles, which leads to more social and job opportunities (Jordan & Sullivan, 2017; Frakt, 2018; Otto, 2017).
Those with the lowest income rarely have dental insurance and generally forgo preventative care. They suffer from tooth decay and gum infection, which increases the risk of cancer and cardiovascular diseases, and can affect speech and communication, eating and nutrition, sleeping, learning, playing, and overall quality of life. In addition, crooked or yellow teeth can stigmatize people in social settings and reduce job prospects, and are associated with low educational achievement and social mobility. In fact, 29 percent of low-income respondents to a 2015 American Dental Association survey reported that the appearance of their mouth and teeth affected their ability to interview for a job (Jordan & Sullivan, 2017; Frakt, 2018; Otto, 2017; Health Policy Institute, 2015).
Idaho Smiles provides limited dental services, such as extractions and urgent dental care, for qualifying adults over 21. The Medicaid Enhanced Plan for adults (21 and older), pregnant women, and children, provides full dental benefits, such as teeth cleaning and fillings, with the exception of root canals and crowns, which are only covered for children (Center for Health Care Strategies, 2018; Idaho Department of Health and Welfare, 2018).
Medicare (Parts A and B), the federal health insurance for seniors, does not cover routine oral health and dental care, so Idaho provides some limited supplemental services for low-income seniors. Since dental problems increase with age, dental insurance or out-of-pocket dental care can be a large expense for many older Americans. In fact, many adults, unable to afford expensive root canals and crowns, simply have their teeth pulled. As a result, nearly 1 in 5 Americans older than 65 does not have a single real tooth (Jordan & Sullivan, 2017; Frakt, 2018; Otto, 2017; National Council on Aging, 2017).
Even those with dental coverage have difficulty accessing care in Idaho because there are 95 Health Professional Shortage Areas (HPSA), where there is a shortage of dentists. The U.S. Department of Health and Human Services estimates that only 51 percent of dental needs are met in Idaho (Kaiser Family Foundation, 2016).

23UNITE
D WAY
ALIC
E REP
ORT –
IDAH
O
NEXT STEPSThis report shows that working families are still struggling due to the mismatch between the basic cost of living and the wages of many jobs across the state. By making this clear, the ALICE data challenges persistent assumptions and stereotypes about people who can’t afford to pay their bills or are forced to visit a food bank – that they are primarily people of color, live only in cities, are unemployed, or are struggling as the result of some moral failing. The data on ALICE households shows that hardship in Idaho exists across boundaries of race, age, and geography.
With projected demographic changes and persistent barriers to stability, many ALICE and poverty-level families will continue to face hardship. In particular:
• At least 32 percent of households are asset poor and do not earn enough to save for emergencies or for the future.
• The majority of residents under 25 are unable to afford to live on their own, get married, have children, or move for new job opportunities.
• More seniors are aging without saving for retirement.
• There are fewer workers to meet the growing demand for senior caregiving.
• Income and wealth disparities persist by gender and race/ethnicity.
PRIORITY ISSUES FOR CONSIDERATIONEconomic change will also continue, and these changes will both provide opportunity and inflict costs. The distribution of opportunity and cost is not usually even or equitable. To have a positive impact on ALICE families, communities need to consider a range of system changes that would both help ALICE weather downturns in the short term and become more financially secure in the long term. While some of these are broad ideas that need to happen on a state-wide or national front, some can be considered in a local context.
EducationIncorporate technology training into basic public education throughout a person’s lifetime. Going forward, most jobs will require digital skills. Since 2004, the share of occupations that required high levels of digital skills more than doubled, from 10 to 22 percent. For ALICE workers to maintain employment over time, they will need technology training that is accessible and of high quality throughout their lifetime. Public K-12 schools can incorporate digital skills into all aspects of the curriculum for students, higher education can offer more focused programs, and companies can invest in training for their employees (Liu, 2017).
Financial StabilityCreate programs and infrastructure to help workers to weather fluctuations in the modern economy. The problem of fluctuating income for families is one of the biggest problems – for individuals, families, and the macro economy. The solutions will have to be big as well. Here are several approaches for policy makers to consider:
1
2

24 UNITE
D WAY
ALIC
E REP
ORT –
IDAH
O
• Access to credit: For those with low incomes, saving for emergencies is nearly impossible. Access to credit at low rates has proven to be effective to help ALICE workers and employers, especially small businesses, weather an emergency. Yet ALICE families do not always qualify for low rates, but when they do, they still need to have enough income to repay the loan or they risk greater long-term financial crises (Collins & Gjertson, 2013; Mayer & Jencks, 1989).
• Guaranteed income or allowance: Economists, theologians, and policy makers have proposed a minimum guaranteed income for all families for centuries, though proposals run the gamut of approaches. The idea has received more attention recently from the political left and the right as more workers face periods of low wages or unemployment (Murray, 2016; Schiller, 2017; Parijs & Vanderborght, 2017; Shaefer, Collyer, & et, 2018).
EmploymentRemove barriers to employment. Barriers to employment for ALICE workers include family care responsibilities, physical and mental health problems (including substance abuse), limited language skills, lack of reliable transportation, and lack of job skills. The research clearly points to effective solutions such as work programs that provide direct connections to employment (including apprenticeships), an individualized training approach (to address a wide range of challenges from soft skills to housing), and the development of career pathways over time through work and education. Successful outcomes require employers, government agencies and nonprofits to weave together programs and resources that provide a wide-reaching web of support (Van Horn, Edwards, & Greene; Yellen, 2017; Tessler, 2013; Office of Planning, Research & Evaluation, 2012).
Portable benefits: Benefits such as health insurance, retirement plans like a 401(k), or paid leave, could move with the worker from job to job, and across multiple jobs at once. These benefits can be delivered in multiple forms, through programs that are not connected to work or the employer at all, or through programs that involve employers. Some examples already exist in the construction industry and business associations, and legislators in New York and Washington are considering systems that would require online platforms so that employers could pay into workers’ benefit funds (Foster, Nelson, & Reder, 2016; Strom & Schmitt, 2016; Guillot, 2017; Quinton, 2017; Maxim & Muro, 2018).
Lifetime employment: Germany and Japan have long employed systems in which companies guarantee employment for large numbers of workers. To avoid layoffs, the practice allows for transfers and defined reductions in hours and wages in lean times (Noorderhaven, Sorge, & Koen, 2015).
EquityLevel the playing field for all. Biases against marginalized groups persist in the work place and the housing market despite positive shifts in public opinion and attitudes regarding differences in race and ethnicity, gender, sexual orientation, sexual identity, and disability.
Racial bias is among the most persistent, despite research confirming that the gaps in education, income, and wealth that now exist along racial lines in the U.S. have little to do with individual behaviors. Instead, these gaps reflect systemic policies and institutional practices that create different opportunities for people of different races and ethnicities. Discriminatory practices have been embedded in our social structures and legal system, especially in terms of housing policies, immigration practices, voting rights, school funding, and health care programs. To make a difference for ALICE families of color, changes need to
3
4

25UNITE
D WAY
ALIC
E REP
ORT –
IDAH
Obe made within institutions that impede equity in areas including the legal system, health care, housing, education, and jobs (Mishel, Bivens, Gould, & Shierholz, 2012; Shapiro, Meschede, & Osoro, 2013; Oliver & Shapiro, 2006; Leadership Conference on Civil Rights, 2000; Agency for Healthcare Research and Quality, 2015; Goldrick-Rab, Kelchen, & Houle, 2014; Sum & Khatiwada, 2010; Anti-Poverty Network of New Jersey, 2017).
For solutions to be effective, they must be as comprehensive and as interconnected as the problems are. Siloed solutions do not work. Because conditions vary across counties and states, the solutions to the challenges that ALICE and poverty-level families face will vary as well. Stakeholders – family, friends, nonprofits, and the government – will need to work together with innovation and vision, to bring structural change, beginning at the highest levels of economic policy and extending deep into the fabric of our communities.
Ultimately, if ALICE households can become financially stable, Idaho’s economy will be stronger and its communities more vibrant – improving life not just for ALICE but for everyone. The strategies detailed in this report address these interconnected consequences and provide a jumping-off point for new and better ideas that will serve working families across the state.

ALICE is a registered trademark of the United Way of Northern New Jersey.
© Copyright 2009–2018 United Way of Northern New Jersey. All rights reserved. No further use, copying, dissemination, distribution, or publication is permitted without the express written permission
of United Way of Northern New Jersey.