Algorithms for Mold Temperature Detection and System ...
27
Page | 1 Algorithms for Mold Temperature Detection and System Investigation Boying Li Master of Science Thesis TRITA-ITM-EX 2018:112 KTH Industrial Engineering and Management Machine Design SE-100 44 STOCKHOLM
Transcript of Algorithms for Mold Temperature Detection and System ...

Page | 1
Algorithms for Mold Temperature Detection and System Investigation
Boying Li
Master of Science Thesis TRITA-ITM-EX 2018:112
KTH Industrial Engineering and Management
Machine Design
SE-100 44 STOCKHOLM

Page | 2
Master of Science Thesis TRITA-ITM-EX 2018:112
Algorithms for Mold Temperature Detection and System Investigation
Boying Li
Approved
2018-02-01
Examiner
Ulf L Sellgren
Supervisor
Ulf L Sellgren
Commissioner
ABB AB
Contact person
Hongliang Yang
Abstract Recently ABB AB/Metallurgy has developed a novel temperature measuring system in the mold copper plate for continuous casting, named OptiMold Monitor, with the purpose of dynamically monitoring mold conditions and to control the FC Mold. The OptiMold Monitor temperature signals can be further analyzed for the information of the shape of the meniscus of the molten steel together with fluid flow symmetry and speed. Also, it can be analyzed for extracting information about how the steel has started to solidify in the mold and to detect solidification deficiencies such as cracks or risks of shell break-outs. Algorithms and Matlab codes developed by ABB for the thermal data analysis has perceived good insight into the results. The OptiMold Monitor system is currently being tested in Tata Steel IJmuiden steelworks. Algorithms for local cold and hot spot detection have been suggested for robust performance and to address the issue of false alarms. And the nail bed tests for meniscus profile and speed have been analyzed. Key words: Continuous casting; OptiMold Monitor; high-resolution measurements; online detection; algorithm

Page | 3
Master of Science Thesis TRITA-ITM-EX 2018:112
Algoritmer för temperaturdetektering och realtidsanalys av kontinuerlig gjutning
Boying Li
Godkänt
2018-02-01
Examinator
Ulf L Sellgren
Handledare
Ulf L Sellgren
Uppdragsgivare
ABB AB
Kontaktperson
Hongliang Yang
Sammanfattning ABB AB / Metallurgi har utvecklat ett nytt temperaturmätningssystem i gjutkopparplattan för kontinuerlig gjutning, benämnd OptiMold Monitor, med syfte att dynamiskt övervaka aktuell gjutningsstatus och för att styra FC Mold. Temperatursignalerna från OptiMold Monitor- kan analyseras vidare för ge informationen om formen av det smälta stålet tillsammans med fluidflödessymmetri och hastighet. Det kan också analyseras för att extrahera information om hur stålet har börjat stelna i formen och för att upptäcka stelningsdefekter som sprickor eller risker för utbrytning av skal. Algoritmer och Matlab-koder som utvecklats av ABB för termisk dataanalys har givit god inblick i resultaten. OptiMold Monitor-systemet testas för närvarande i stålverket Tata Steel IJmuiden. Algoritmer för lokal kylning och detektering av ”hot spots” har föreslagits för att ge robusta prestanda och att för att hantera risken för falska larm. Även resultat från nagelbäddstesterna för gjutprofil och hastighet har analyserats. Nyckelord: Kontinuerlig gjutning; OptiMold Monitor; högupplösta mätningar; realtidsupptäckt; algoritm

Page | 4
Acknowledgements
I would first like to thank my thesis supervisor, systems engineer Peter Rybing at ABB Metallurgy, who gave me valuable support and comments and steered me in the right direction of the thesis work, it is impossible for me to do the tasks without his help. I would also like to thank the experts who were involved in the thesis project at ABB Metallurgy, especially Martin Sedén who gave me great comments and answered my questions even on his parent leave. I really appreciate his kindness.
I would like to express my gratitude to my examiner at KTH, Ulf L Sellgren, for the useful comments, remarks and engagement through the learning process of my master thesis. Furthermore, I would like to thank the team leader Hongliang Yang at ABB Metallurgy for introducing me to the exciting topic at ABB. And always supports and encourages me like family. Otherwise, I would never have such a memorable experience in Västerås.
Finally, I would like to give my gratitude to my parents and to my boyfriend Jixiang who encourage me and care for me continuously, the support from them is powerful. This accomplishment would not have been possible without them. Thank you.
Author
Boying Li

Page | 5
Nomenclature
NF Narrow face of mold
SEN Submerged entry nozzle
Mold powder Powder lubricant added to casting mold
OptiMold Monitor
A novel temperature measuring system in the mold copper plate for continuous casting
FBG Fiber Bragg Gating
CC Continuous casting
FC Flow control
Argon flow Added to the nozzle during continuous casting to deter clogging with solid inclusions
Meniscus The top part of the mold, at the surface of liquid steel
TC Thermocouple
Tundish A vessel holds enough metal to provide a continuous flow to mold
Mold slag Forms when mold powder added to the top surface of the steel melts
BF Broad face
Taper Mould tapers are used to mitigate the contraction of the solidified shell during cooling
Stopper A device used to control the flow of steel from the tundish to the mold, functionality is similar to a sliding gate
Nail-board Rows of nails is inserted into a long board
Sticker The direct contact of the mold and the solidified shell caused by poor lubrication at the shell and mold boundary
Break-out The most catastrophic incident in the continuous casting process
LFC Longitudinal face crack
Sliding gate A device used to control the flow of steel from the tundish to the mold, functionality is similar to a stopper

Page | 6
Figure list
Figure 1 Continuous casting process
Figure 2 FC mold
Figure 3 A typical thermocouple
Figure 4 An extended view of FBG
Figure 5 Crack shown on GUI
Figure 6 Mechanism of sticker breakout
Figure 7 Temperature profile of sticker breakout
Figure 8 Sticker area detected by thermocouples
Figure 9 Temperature change rate of 3 TCs
Figure 10 Nail dipping into the molten steel
Figure 11 Nail bed sketch
Figure 12 Typical flow patterns
Figure 13 Single roll and double in slab casting
Figure 14 The meniscus height on the left side

Page | 7
Contents
Abstract ................................................................................................................................................... 2
Acknowledgement ................................................................................................................................... 4
Nomenclature .......................................................................................................................................... 5
1 Introduction ..................................................................................................................................... 9
1.1 Background .............................................................................................................................. 9
1.1.1 Introduction to continuous casting ...................................................................................... 9
1.1.2 Problems occurring during the process ............................................................................. 10
1.1.3 FC Mold and OptiMold Monitor ....................................................................................... 10
1.1.4 FBGs and thermocouples .................................................................................................. 12
1.2 Purpose and definitions......................................................................................................... 13
1.3 Delimitations ................................................................................................................................ 13
1.4 Method description ..................................................................................................................... 13
2 Crack detection .............................................................................................................................. 14
2.1 Problem definition ................................................................................................................. 14
2.2 Crack generation mechanism ....................................................................................................... 14
2.3 Crack map .................................................................................................................................... 14
3 Sticker detection ............................................................................................................................ 15
3.1 Problem definition and traditional detection method .......................................................... 15
3.2 Existing detect method.......................................................................................................... 16
3.2.1 Alternate sticker detection method used for TC's ............................................................ 16
3.2.2 Algorithm for sticker detection with higher measurement resolution ............................. 19
3.3 Summary of sticker investigation: ......................................................................................... 20
4 Meniscus flow profile ..................................................................................................................... 21
4.1 Introduction ........................................................................................................................... 21
4.2 Nail board dip test ................................................................................................................. 21
4.3 Flow pattern introduction ........................................................................................................... 22
4.4 Flow Pattern Prediction and Measurement .......................................................................... 23
4.5 Flow speed ............................................................................................................................. 24
4.6 Summary of meniscus profile and nail board measurements .............................................. 24
5 Conclusion and Future work .......................................................................................................... 26
6. References ......................................................................................................................................... 27

Page | 8

Page | 9
1 Introduction
1.1 Background
1.1.1 Introduction to continuous casting
Continuous casting, which is also called strand casting, is a process where the molten metal is solidified into a "semi-finished" billet, bloom, or slab for subsequent rolling in the finishing mills. In this report, all research is based on the slab casting. Continuous casting now is costing less, has an improved yield and higher quality. Since the product is produced in a standardized way and the process is controlled through automation, the metal slab is produced with lower cost and higher quality. The continuous casting process is the most frequently used way of casting steel due to the obvious advantages compared to the ingot casting.
Figure 1 Continuous casting process
The continuous casting process is shown in Fig. 1. Molten Steel from the ladle is buffered in the tundish, and then it exits down through a Submerged Entry Nozzle (SEN) and into the casting mold. Here, the molten steel flows in the molten pool, where it carries various amounts of superheat, non-metallic inclusion particles, and turbulence, which can affect the shape and stability of the free top molten steel surface(meniscus) [1]. The liquid then freezes against the water-cooled copper walls to form a thin solid shell, which is continuously withdrawn from the bottom of the mold at a casting speed that matches the flow of the incoming metal. Flow through the SEN is gravity driven by the pressure difference between the liquid levels of the tundish and the mold top free surfaces. The flow rate is controlled (using feedback from a level sensor) to maintain the liquid level in the mold as constant as possible. Usually, there are two technology choices to control the flow, sliding gate or stopper rod. A powder or granular material (mold powder) is added to the top surface, where it sinters and partially melts to form a liquid layer which now is known as mold flux that insulates the molten steel both thermally and chemically from the environment above and protects the steel

Page | 10
from re-oxidation. Except controlling heat transfer across the gap between the mold and the shell, the flux also acts as a lubricant which infiltrates into the gap to prevent the steel from sticking to the mold walls. To prevent the sticking, the mold is oscillated and forms oscillation marks on the outer surface of the solidified shell at the same time. At the meniscus, steel begins to solidify, and any surface defects in the shell initiate here.
1.1.2 Problems occurring during the process
During the continuous casting process, there are different types of defects that may occur and they have been studied for many decades. The problems include among others meniscus instabilities, meniscus freezing, excessive flow speeds, segregation, stickers, longitudinal cracks Such as longitude cracks, corner cracks, transverse depression, SEN clogging and so on which can result in detrimental inner or surface quality problems of slabs. A breakout is one of the most detrimental events associated with the continuous casting process, where the solidified shell ruptures and molten steel pours out. In addition to the serious safety hazards, breakouts also result in lost production time and significant yield penalties. When there is a breakout event, there is the most likely severe damage to the casting machine. If the breakout can be detected correctly, the false alarm rate can be controlled within an acceptable range, and the corresponding actions are taken, the economic payback is considerable. Break-outs can be classified into many types, one of which results from mold sticker and the other due to the longitude cracks’ occurrence. Sticking refers to the direct contact of the mold and the solidified shell caused by poor lubrication at the shell and mold boundary. When the casting speed is increased, the possibility of breakout increases since the developing shell thickness is reduced. A sticker detected by observing the temperature foot-print of the mold plate could be prevented by enhancing the slag flow from meniscus corresponding to the increase in casting speed and by detecting temperature profile. Melting characteristics and physicochemical properties of casting powders should also play a role in optimizing the lubrication of the mold walls [2].
1.1.3 FC Mold and OptiMold Monitor
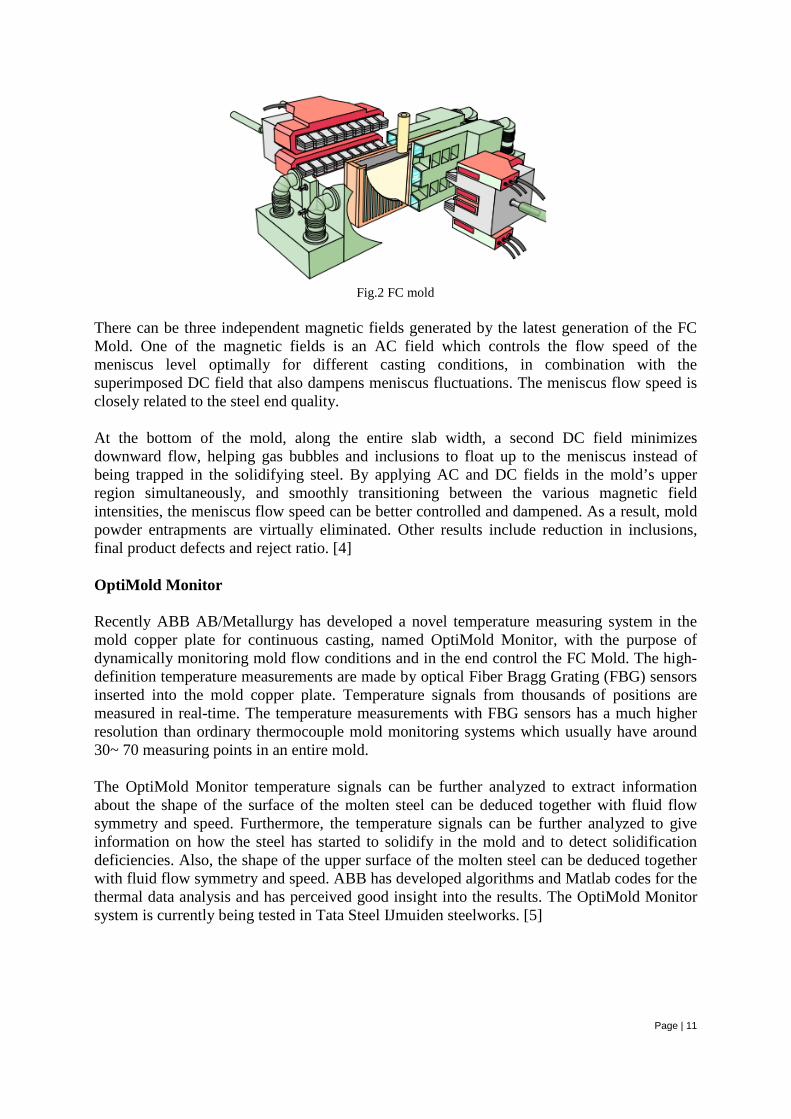
FC Mold Based on Kawasaki Steel’s operational experience of the Electromagnetic Brake (known as EMBR), the flow control mold (FC mold) has been developed. Shown as below in Fig. 2, the slab casting is controlled by two static magnetic fields which covers the whole width of the slab strand. One of the magnetic fields is located at the meniscus level and the other in the lower part of the mold [3].
Page | 11
Fig.2 FC mold
There can be three independent magnetic fields generated by the latest generation of the FC Mold. One of the magnetic fields is an AC field which controls the flow speed of the meniscus level optimally for different casting conditions, in combination with the superimposed DC field that also dampens meniscus fluctuations. The meniscus flow speed is closely related to the steel end quality. At the bottom of the mold, along the entire slab width, a second DC field minimizes downward flow, helping gas bubbles and inclusions to float up to the meniscus instead of being trapped in the solidifying steel. By applying AC and DC fields in the mold’s upper region simultaneously, and smoothly transitioning between the various magnetic field intensities, the meniscus flow speed can be better controlled and dampened. As a result, mold powder entrapments are virtually eliminated. Other results include reduction in inclusions, final product defects and reject ratio. [4] OptiMold Monitor Recently ABB AB/Metallurgy has developed a novel temperature measuring system in the mold copper plate for continuous casting, named OptiMold Monitor, with the purpose of dynamically monitoring mold flow conditions and in the end control the FC Mold. The high-definition temperature measurements are made by optical Fiber Bragg Grating (FBG) sensors inserted into the mold copper plate. Temperature signals from thousands of positions are measured in real-time. The temperature measurements with FBG sensors has a much higher resolution than ordinary thermocouple mold monitoring systems which usually have around 30~ 70 measuring points in an entire mold. The OptiMold Monitor temperature signals can be further analyzed to extract information about the shape of the surface of the molten steel can be deduced together with fluid flow symmetry and speed. Furthermore, the temperature signals can be further analyzed to give information on how the steel has started to solidify in the mold and to detect solidification deficiencies. Also, the shape of the upper surface of the molten steel can be deduced together with fluid flow symmetry and speed. ABB has developed algorithms and Matlab codes for the thermal data analysis and has perceived good insight into the results. The OptiMold Monitor system is currently being tested in Tata Steel IJmuiden steelworks. [5]
Page | 12
1.1.4 FBGs and thermocouples
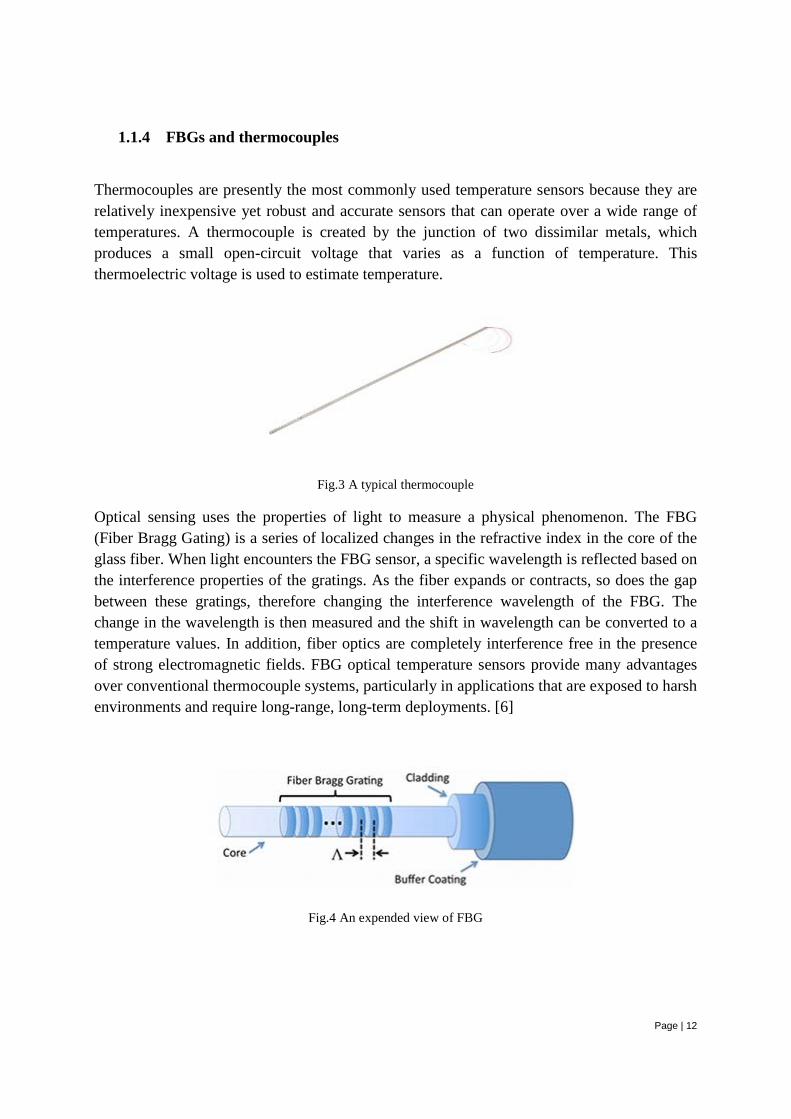
Thermocouples are presently the most commonly used temperature sensors because they are relatively inexpensive yet robust and accurate sensors that can operate over a wide range of temperatures. A thermocouple is created by the junction of two dissimilar metals, which produces a small open-circuit voltage that varies as a function of temperature. This thermoelectric voltage is used to estimate temperature.
Fig.3 A typical thermocouple
Optical sensing uses the properties of light to measure a physical phenomenon. The FBG (Fiber Bragg Gating) is a series of localized changes in the refractive index in the core of the glass fiber. When light encounters the FBG sensor, a specific wavelength is reflected based on the interference properties of the gratings. As the fiber expands or contracts, so does the gap between these gratings, therefore changing the interference wavelength of the FBG. The change in the wavelength is then measured and the shift in wavelength can be converted to a temperature values. In addition, fiber optics are completely interference free in the presence of strong electromagnetic fields. FBG optical temperature sensors provide many advantages over conventional thermocouple systems, particularly in applications that are exposed to harsh environments and require long-range, long-term deployments. [6]
Fig.4 An expended view of FBG

Page | 13
1.2 Purpose and definitions
1. Identify parameters that can be detected by Optimold Monitor sensors.
2. Outline algorithms for these to be used in the monitoring of the continuous casting process in the slabs mold.
3. Validate the estimated results by process measurements to ensure proper functionality of the Optimold Monitor.
1.3 Delimitations
1. Mold friction will not be analyzed
2. No CFD, thermal or other 3D simulation models will be set up
3. The algorithm for forecasting sticker and crack alarms will not be developed.
1.4 Method description
In this analysis project, inductive method has been chosen. Going from a large set of specific observations to a general, theoretical conclusion in this manner is called induction and the approach is, therefore, often called the inductive method. [7] From some slab information from TATA Steel, the data has been grouped and analyzed. The goal is to find a better way to monitor the slab condition and establish the correlation between analyzed results and continuous casting.

Page | 14
2 Crack detection
2.1 Problem definition
Longitudinal face cracks are one of many problems that can arise in thin-slab continuous casting. They can be caused by a variety of sources, including non-uniform heat transfer, mold level fluctuations, inadequate taper, excessive taper, and so on. Longitudinal depressions generally initiate at the meniscus [8]. If the cracks should be forecasted, the stress and strain analyses are necessary, since the input is real time temperature data, the simplest method of detecting the crack is to detect the abnormal temperature regions, important criteria for detecting the cracks is temperature dips. Optimold Monitor algorithm aims to detect the crack and give warnings and also restore the history of cracks as maps of slab sequences so that the cracks’ length, width, and position information can be traced. The figure below shows a typical temperature dip found in mold history.
2.2 Crack generation mechanism Slag streaks caused by uneven slag flow from meniscus into shell/mold boundary and uneven heat extraction to the mold along the width direction caused by them may cause a local delay of the shell formation, which may cause longitudinal facial cracks on the slab. [9]
2.3 Crack map
The detected crack information can be stored with a matrix, so the real time crack detecting information including the crack length and crack position could be shown online on the GUI. The figure below shows how a typical crack could look like on the GUI.
Figure.5 crack shown on GUI [Slab ID: R3523-206]

Page | 15
3 Sticker detection
3.1 Problem definition and traditional detection method
It is important to detect risks of break-outs so that some actions (e.g. decreasing the casting speed to heal the hole) can be taken. Continuous monitoring of temperature in specific regions of the mold provides a necessary resolution for a sticker alarm algorithm. The temperature-based detection system works on the principle that a localized heat transfer variation can be easily recognized. As shown in Fig.6, the following actions occur sequentially during a sticker:
1. A portion of the strand adheres to the mold wall near the meniscus. The thin shell tears due to the continuing withdrawal of the strand. 2. As molten metal fills the gap caused by the ripping, there is direct contact with the mold wall. A new shell immediately forms at this location.
Sticker breakouts initiate when molten steel at the meniscus sticks to the mold wall, instead of to the existing solidified shell. Each oscillation cycle, the two shells are pulled apart again. Their thin point of intersection then moves down the mold at some fraction of the casting speed, and eventually exits the mold. A breakout then occurs, as the pressure of the liquid contained inside the shell exceeds the strength of the thin spot in the shell, and ruptures an opening. Fortunately, this disastrous sequence of events can be detected by its characteristic pattern of temperature profile development. As shown in Fig. 7 the point of highest heat flux is found where the shell is thinnest, which is usually at the meniscus. Temperatures decrease below this point. During a sticker event, this maximum point moves down the mold wall at 30-50% of the casting speed. [10]
Figure.6 Mechanism of Sticker
An alarm is triggered with today's conventional thermocouple monitoring system typically, when the lower row of thermocouples indicates a reading that is hotter than the upper row of thermocouples for a specified time period, and increases or decreases at a specified rate, especially if adjacent thermocouple pairs (a pair being to TC's at the same horizontal potion,

Page | 16
but being displayed vertically) start to show the same behavior. Having identified the impending problem, the casting speed is decreased for some specified time period allowing the sticker to reattach or 'heal' to the moving shell, and hopefully avoid a breakout. [11]
Figure.7 Temperature profile of sticker [12]
3.2 Existing detect method
3.2.1 Alternate sticker detection method used for TC's
Another type of sticker detection method used in conventional TC-systems is described in [12]. This algorithm is based on three characteristics of temperature against time profile:
1. Temperature change rate. Significant rise and followed by a significant fall, the rise and fall have a certain temperature change rate and duration.
2. Time lag of abnormal changes for adjacent sensor temperatures.
The detected thermocouples and the sticking area are shown as Fig.8
Figure.8 Sticker area detected by thermocouples [12]
Page | 17
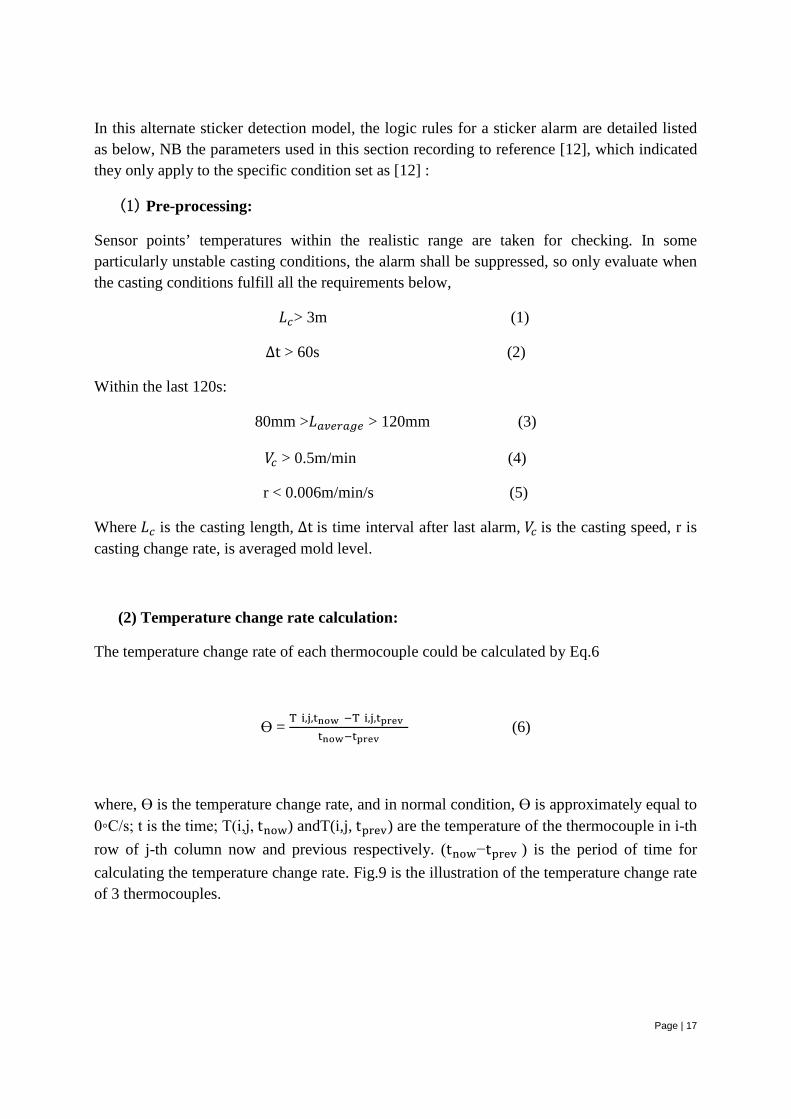
In this alternate sticker detection model, the logic rules for a sticker alarm are detailed listed as below, NB the parameters used in this section recording to reference [12], which indicated they only apply to the specific condition set as [12] :
(1) Pre-processing:
Sensor points’ temperatures within the realistic range are taken for checking. In some particularly unstable casting conditions, the alarm shall be suppressed, so only evaluate when the casting conditions fulfill all the requirements below,
𝐿𝐿𝑐𝑐> 3m (1)
∆t > 60s (2)
Within the last 120s:
80mm >𝐿𝐿𝑎𝑎𝑎𝑎𝑎𝑎𝑎𝑎𝑎𝑎𝑎𝑎𝑎𝑎 > 120mm (3)
𝑉𝑉𝑐𝑐 > 0.5m/min (4)
r < 0.006m/min/s (5)
Where 𝐿𝐿𝑐𝑐 is the casting length, ∆t is time interval after last alarm, 𝑉𝑉𝑐𝑐 is the casting speed, r is casting change rate, is averaged mold level.
(2) Temperature change rate calculation:
The temperature change rate of each thermocouple could be calculated by Eq.6
Ɵ = T(i,j,tnow)−T(i,j,tprev)
tnow−tprev (6)
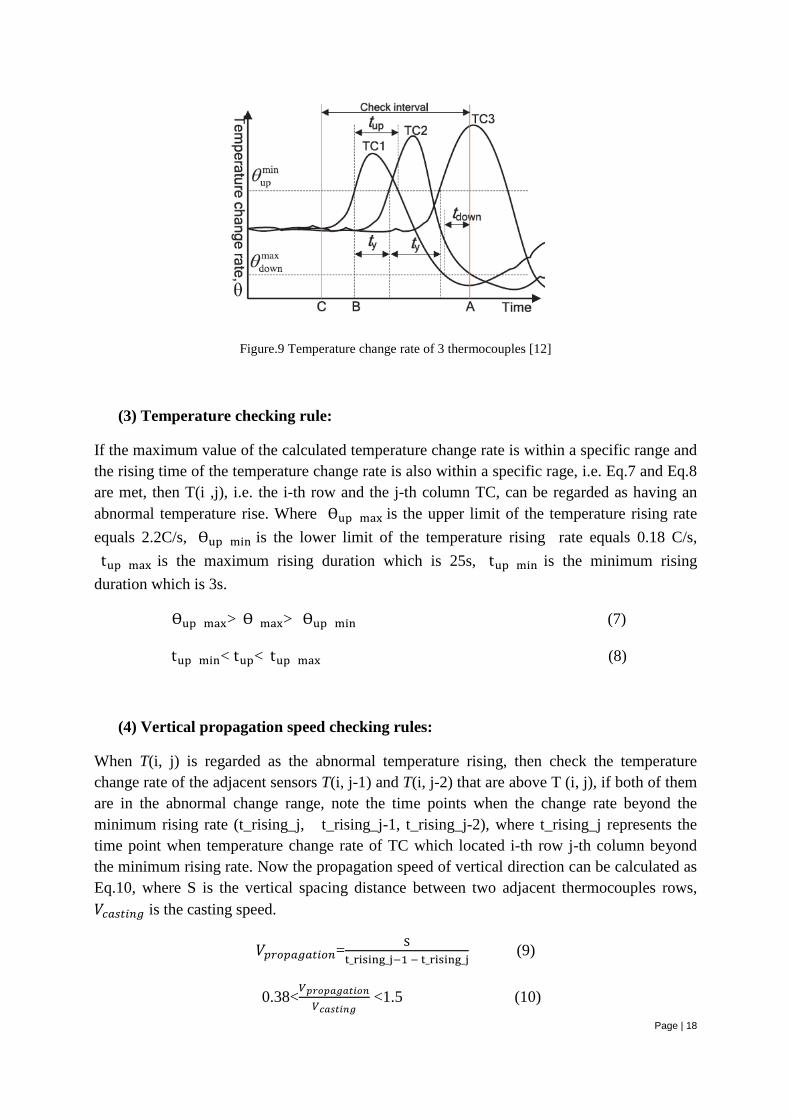
where, Ɵ is the temperature change rate, and in normal condition, Ɵ is approximately equal to 0◦C/s; t is the time; T(i,j, tnow) andT(i,j, tprev) are the temperature of the thermocouple in i-th row of j-th column now and previous respectively. (tnow−tprev ) is the period of time for calculating the temperature change rate. Fig.9 is the illustration of the temperature change rate of 3 thermocouples.
Page | 18
Figure.9 Temperature change rate of 3 thermocouples [12]
(3) Temperature checking rule:
If the maximum value of the calculated temperature change rate is within a specific range and the rising time of the temperature change rate is also within a specific rage, i.e. Eq.7 and Eq.8 are met, then T(i ,j), i.e. the i-th row and the j-th column TC, can be regarded as having an abnormal temperature rise. Where (Ɵup)max is the upper limit of the temperature rising rate equals 2.2C/s, (Ɵup)min is the lower limit of the temperature rising rate equals 0.18 C/s, (tup)max is the maximum rising duration which is 25s, (tup)min is the minimum rising duration which is 3s.
(Ɵup)max>(Ɵ)max> (Ɵup)min (7)
(tup)min< tup<(tup)max (8)
(4) Vertical propagation speed checking rules:
When T(i, j) is regarded as the abnormal temperature rising, then check the temperature change rate of the adjacent sensors T(i, j-1) and T(i, j-2) that are above T (i, j), if both of them are in the abnormal change range, note the time points when the change rate beyond the minimum rising rate (t_rising_j, t_rising_j-1, t_rising_j-2), where t_rising_j represents the time point when temperature change rate of TC which located i-th row j-th column beyond the minimum rising rate. Now the propagation speed of vertical direction can be calculated as Eq.10, where S is the vertical spacing distance between two adjacent thermocouples rows, 𝑉𝑉𝑐𝑐𝑎𝑎𝑐𝑐𝑐𝑐𝑐𝑐𝑐𝑐𝑎𝑎 is the casting speed.
𝑉𝑉𝑝𝑝𝑎𝑎𝑝𝑝𝑝𝑝𝑎𝑎𝑎𝑎𝑎𝑎𝑐𝑐𝑐𝑐𝑝𝑝𝑐𝑐= St_rising_j−1 − t_rising_j
(9)
0.38<𝑉𝑉𝑝𝑝𝑝𝑝𝑝𝑝𝑝𝑝𝑝𝑝𝑝𝑝𝑝𝑝𝑝𝑝𝑝𝑝𝑝𝑝𝑝𝑝𝑉𝑉𝑐𝑐𝑝𝑝𝑐𝑐𝑝𝑝𝑝𝑝𝑝𝑝𝑝𝑝
<1.5 (10)

Page | 19
(5) Temperature falling checking rule:
If the propagation speed check rule is met, then check point T (i, j-2) temperature change falling rate and duration. When the temperature begins to fall, if the temperature change rate is within the falling rate and the temperature falling state last for some duration, i.e. Eq.11 and Eq.12 are met, now the point T(i, j) can be marked as the abnormal sensor point, where (Ɵdown)max is the upper limit of the temperature falling rate which equals -0.17C/s, (Ɵdown)min is the lower limit of the temperature falling rate which equals -2 C/s, tdown min is the minimum falling duration which is 5s.
(Ɵdown)max> Ɵ > (Ɵdown)min (11)
tdown > = tdown min (12)
(6) The number of abnormal thermocouples in the column are obtained:
The number of abnormal thermocouples in the column can be obtained, which is namely the number of thermocouples of abnormal temperature rise, and marked as M. Along with the vertical detection in the column, the vertical detection in the adjacent column is carried out in the same way. And the number of abnormal thermocouples in the adjacent column is marked as N. If both M and N are bigger than 2, sticker alarm is released when the total number of M and N are bigger than 5.[12]
3.2.2 Algorithm for sticker detection with higher measurement resolution
Compared to thermocouples in the mold wall, optical Fiber Bragg Grating (FBG) sensors, inserted into the mold copper plate, have a much higher resolution than ordinary thermocouple mold monitoring systems. Utilized along both vertical and horizontal directions, a high-resolution temperature map and temperature change rate profile can be obtained, and the typical sticker pattern V-shape can be easily observed. The sticker detection algorithm described above can be improved, especially using the following two characteristics of temperature against time profile:
(1) Temperature change rate.
A significant rise is followed by a significant fall, the rise and fall have a certain temperature change rates and duration can be more easily detected by a high-resolution monitoring system.
(2) Time lag of abnormal changes for adjacent sensor temperatures.

Page | 20
The horizontal propagation speed and vertical propagation speed of the temperature disturbance can be quickly and easily detected by the high-resolution monitoring system.
A more refined sticker detection algorithm for high resolution measurement systems should aim for more details on origination and propagation. The visualization aspect should be incorporated for detection, but also to obtain feedback from the healing process. A risk with a more sophisticated method is that the number of false alarms will increase, this issue must also be raised.
The new algorithm could be based on the temperature against time rate profile, as it is known that when a sticker originates, the temperature change rate increases, and lasts for a duration before falling down. Based on the criteria, checking the temperature change rate, abnormal temperatures, and propagation speed simultaneously can pinpoint real stickers better, and help decrease the false alarm rate and make the detection more robust.
The transient temperature change rate can be calculated. Based on the temperature change rate against time profile, when the temperature change rate is within the sticker warning range, the abnormal rising position and time duration can be detected.
The propagation speed is perhaps the most important criteria for sticker detection using high-resolution measurements. Since the FBG sensors have a large amount of detection points and the resolution is high, both the horizontal and vertical propagation speed of a sticker can be detected easier than for a course installation of thermocouples. A rise in temperature should be followed vertically and quantified.
3.3 Summary of sticker investigation:
Temperature measurements from the fiber optical pilot installation have proven to show sticker events dearly, both of absolute temperature and temperature gradient animations show the sticking propagation and healing process clearly.
The temperature change rate profile shows several sensor points’ temperature change rate against time curves, those points are along the same fiber which is involved in a sticker area. From the measurements, it is clear to see that the temperature change rate is almost zero when casting process is normal. And when a sticker originates, there is a significant temperature rising followed by a significant falling. And the trend propagates along the casting direction.
Page | 21
4 Meniscus flow profile
4.1 Introduction Meniscus surface velocity of the molten steel has a strong coupling to the final product quality during the continuous casting of steel. Information of liquid steel flow patterns in mould could be achieved from meniscus steel velocities which can be measured. The liquid steel surface velocity is also a key factor that affects the final product’s quality: too high a surface velocity induces excessive turbulence and shear instability at the slag-steel interface and increases the possibility of slag entrainment; too low a surface velocity results in lack of heat transfer near narrow face and meniscus regions, which further could lead to freezing, hook formation and entrapment of slag or inclusion particles. Therefore, during continuous casting process, it is very important to measure and control meniscus steel velocities [13]. Based on meniscus shape profile, i.e. the meniscus height, surface level peak and trough position, the surface flow speed and flow pattern can be estimated. And the estimated results can be validated by velocity measurements in the meniscus using conventional methods. One of these methods is the nail board detection principle explained below.
4.2 Nail board dip test
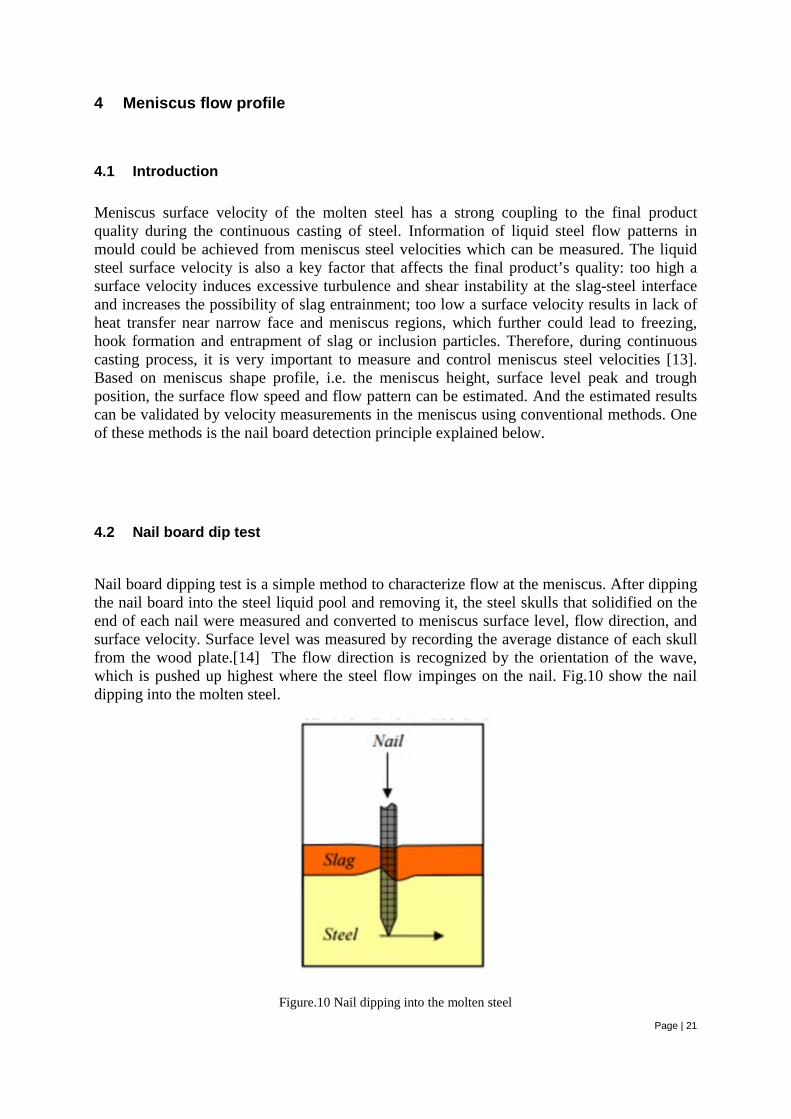
Nail board dipping test is a simple method to characterize flow at the meniscus. After dipping the nail board into the steel liquid pool and removing it, the steel skulls that solidified on the end of each nail were measured and converted to meniscus surface level, flow direction, and surface velocity. Surface level was measured by recording the average distance of each skull from the wood plate.[14] The flow direction is recognized by the orientation of the wave, which is pushed up highest where the steel flow impinges on the nail. Fig.10 show the nail dipping into the molten steel.
Figure.10 Nail dipping into the molten steel

Page | 22
The meniscus flow velocity and direction can be deduced from the difference between the maximum and minimum skull heights around the perimeter of each nail. Nail board sketch provided from TATA can be seen from fig.11, so the velocity results positions are clear.
Figure.11 Nail bed sketch
4.3 Flow pattern introduction
From the observations of the mold casting history, the flow pattern during the casting process can be characterized as different types regarding the surface flow velocity and the roll pattern. As shown in Fig.12 four common flow patterns can be seen, the top left flow should turn up at the meniscus closer to the SEN. The top right indicates good double roll with acceptable flow velocity. The bottom left flow trajectory is too jagged and needs to be made smoother to indicate "no flow". And the bottom right indicates good double roll with rather high local velocity.
Figure.12 Typical flow pattern Flow is governed primarily by the condition of the jet entering the mold cavity, then it is affected by many factors such as the amount of gas injection, the section size, the casting speed, and electromagnetic forces. When the meniscus surface is turbulent with high velocity, under this circumstance entrainment of mold slag is likely. With a lower surface flow velocity, slag entrainment is unlikely on this condition, but the meniscus might become too

Page | 23
cold and stagnant. In slab casting, the mold flow pattern varies between the two extremes shown in Fig.13.
Figure.13 Single roll and double roll in slab casting
Here is some clarification regarding Fig.13. With an upward directed jet exiting the nozzle or a large amount of argon gas injection, the flow will reach the top surface quickly and flows away from the nozzle towards the narrow faces before being turned downwards. This flow pattern is termed ‘single roll’. When the flow pattern is single roll, the surface velocities and level fluctuations are serious, so mold slag entrainment and surface defects can be likely, and single roll should be avoided.
With the SEN submerged into the mold cavity a more deeply with downward-angled entry ports of a bifurcated nozzle, then another type of flow pattern occurs. The submerged jet exits from SEN then travels across the width of the mold to impinge on the narrow faces which results in a split jet. Some of the flow travels upward towards the meniscus and back across the top surface towards the nozzle. The rest of the jet flows down the narrow faces deep into the liquid pool. Two large recirculating regions are formed in each symmetric half of the caster, so this flow pattern is termed ‘double roll’.
Depending on the caster and the SEN properties, different amounts of single or double roll can result. Sometimes, the flow pattern even alternates between the flow pattern alternates between the single and double roll archetypes or it may attain some intermediate condition. [15]
4.4 Flow Pattern Prediction and Measurement
The flow pattern in a given continuous casting mould can be determined in several different ways. Traditionally, some understanding has been deduced from physical models like using water to simulate the molten steel. Understanding has been deduced from physical mold models constructed to scale from transparent plastic using water to simulate the molten steel. And water models have been proven to be accurate for single phase. However, obtaining accurate flow patterns is very difficult in the multiphase system resembling steel argon since gas injection is significant, and some phenomena, such as slag layer behaviour, cannot be modelled quantitatively. Computational models based on solution of the Navier Stokes equations can include varieties of phenomena such as heat transfer, multi-phase flow, and solidification in steel casting. Significant effort is required for accurate calculations because these models need accurate property values, boundary conditions, numerical validation and plenty of computation time. [16]
Page | 24
In this report, the roll type criteria is investigated based on the position of minimum and maximum height of surface wave, since the simplest way to imply the shape profile of meniscus is to show the peak and trough positions, and the results of the meniscus profile criteria are compared with the nail bed results.
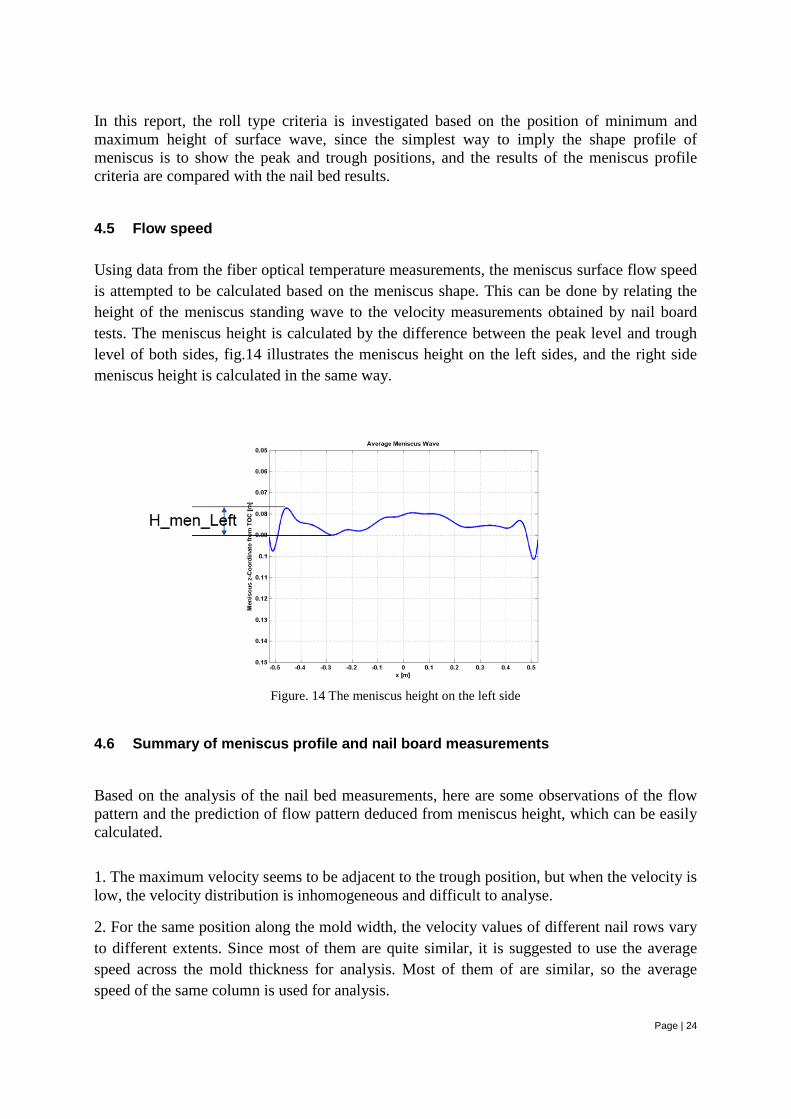
4.5 Flow speed Using data from the fiber optical temperature measurements, the meniscus surface flow speed is attempted to be calculated based on the meniscus shape. This can be done by relating the height of the meniscus standing wave to the velocity measurements obtained by nail board tests. The meniscus height is calculated by the difference between the peak level and trough level of both sides, fig.14 illustrates the meniscus height on the left sides, and the right side meniscus height is calculated in the same way.
Figure. 14 The meniscus height on the left side
4.6 Summary of meniscus profile and nail board measurements
Based on the analysis of the nail bed measurements, here are some observations of the flow pattern and the prediction of flow pattern deduced from meniscus height, which can be easily calculated.
1. The maximum velocity seems to be adjacent to the trough position, but when the velocity is low, the velocity distribution is inhomogeneous and difficult to analyse.
2. For the same position along the mold width, the velocity values of different nail rows vary to different extents. Since most of them are quite similar, it is suggested to use the average speed across the mold thickness for analysis. Most of them of are similar, so the average speed of the same column is used for analysis.

Page | 25
3. For high speed casting, double roll flow is observed. For lower casting speeds, a weaker flow is observed, but no single roll tendencies are seen.

Page | 26
5 Conclusion and Future work
In this thesis work, algorithms for mold monitoring have been investigated. Studies of crack and sticker detection methods have been carried out together with suggestions for new algorithms more suitable for a higher resolution monitoring system. Some correlations between meniscus height and flow speed and flow pattern from nail bed measurements have been analysed. Initial testing of the algorithms has been done in Matlab by looking at data from the fiber optical temperature monitoring system.
Due to the time limitation of the master thesis work, there are still many interesting and valuable areas that can be further developed and researched. Some suggestion for future work in order to improve OptiMold Monitor algorithms are summarized as below: 1. The corner crack detection algorithm can be developed, because corner cracks can result
in detrimental defects. 2. The horizontal propagation speed of a sticker will make the detection more robust. 3. There are many types of stickers with different causes and event developments. Different
algorithms are needed to handle the different types. 4. Validation data from the casting process is required to develop and tune the algorithms. 5. With more nail bed results, a better understanding of the relation between the meniscus
shape and the flow speeds and patterns can be built for a wider range of casting conditions.

Page | 27
6. References
[1] Hemy P, Smylie R, Srinivasan C. Analyzing Casting Problems by the On-line Monitoring of Continuous Casting Mold Temperatures[J]. JOM-e,(Journal of Metals–electronic edition)
[2] Nakato, Hakaru, et al. "Factors affecting the formation of shell and longitudinal cracks in mold during high speed continuous casting of slabs." Transactions of the Iron and Steel Institute of Japan 24.11 (1984): 957-965.
[3] Idogawa, Akira, et al. "Control of molten steel flow in continuous casting mold by two static magnetic fields imposed on whole width." Materials Science and Engineering: A 173.1-2 (1993): 293-297.
[4] ABB Automation Technologies AB Metallurgy Department, ‘FC Mold: Improved Coil Surface and Internal Quality for Conventional Slab Casting’
[5] Zhong, A. Y., Pan, H., Jacobsen, N., & Sedén, M. (2016). Production under scrutiny. Steel Times International, 40(2), 39.
[6] Hill, Kenneth O., and Gerald Meltz. "Fiber Bragg grating technology fundamentals and overview." Journal of
lightwave technology 1578 (1997): 1263-1276.
[7] Övind Andersson, Experiment – planning, Implementing and Interpreting, Wiley 2012
[8] Hibbeler, L. C., et al. "Longitudinal face crack prediction with thermo-mechanical models of thin slabs in funnel moulds." la metallurgia italiana 2 (2009).
[9] Nakato, Hakaru, et al. "Factors affecting the formation of shell and longitudinal cracks in mold during high speed continuous casting of slabs." Transactions of the Iron and Steel Institute of Japan 24.11 (1984): 957-965.
[10] Blazek, Kenneth E., and Ismael G. Saucedo. "Characterization of the formation, propagation, and recovery of sticker/hanger type breakouts." Isij International 30.6 (1990): 435-443.
[11] Thomas, Brian G. "On-line detection of quality problems in continuous casting of steel." Modeling, Control and Optimization in Ferrous and Nonferrous Industry, 2003 Materials Science and Technology Symposium. 2003.
[12] He, F., et al. "Development and application of mould breakout prediction system with online thermal map for steel continuous casting." Ironmaking & Steelmaking 42.3 (2015): 194-208.
[13] Liu, R., et al. "Measurement of Molten steel surface velocity with SVC and Nail dipping during continuous casting process." TMS Annual Meeting. 2011.
[14]Cho, Seong-Mook, et al. "Measurement of Transient Meniscus Flow in Steel Continuous Casters and Effect of Electromagnetic Braking." Minerals, Metals and Materials Society/AIME, 420 Commonwealth Dr., P. O. Box 430 Warrendale PA 15086 United States.[np]. Feb (2011).
[15] Thomas, Brian G. "Fluid flow in the mold." Chapter 14 (2003): 14-1.
[16] Bitog, J. P., et al. "Application of computational fluid dynamics for modeling and designing photobioreactors for microalgae production: a review." Computers and Electronics in Agriculture 76.2 (2011): 131-147.