ALGORITHMS AND FLOWCHARTS - Weeblyuosprince.weebly.com/.../5/6/1/15617180/algosflowcharts.pdfExample...
40
ALGORITHMS AND FLOWCHARTS By Miss Reham Tufail
Transcript of ALGORITHMS AND FLOWCHARTS - Weeblyuosprince.weebly.com/.../5/6/1/15617180/algosflowcharts.pdfExample...
ALGORITHMS AND
FLOWCHARTS
By
Miss Reham Tufail

ALGORITHMS AND FLOWCHARTS
A typical programming task can be divided into
two phases:
Problem solving phase
produce an ordered sequence of steps that describe
solution of problem
this sequence of steps is called an algorithm
Implementation phase
implement the program in some programming
language

Steps in Problem Solving
First produce a general algorithm (one can use pseudocode)
Refine the algorithm successively to get step by step detailed algorithm that is very close to a computer language.
Pseudocode is an artificial and informal language that helps programmers develop algorithms. Pseudocode is very similar to everyday English.

Pseudocode & Algorithm
Example 1: Write an algorithm to
determine a student’s final grade and
indicate whether it is passing or failing.
The final grade is calculated as the
average of four marks.
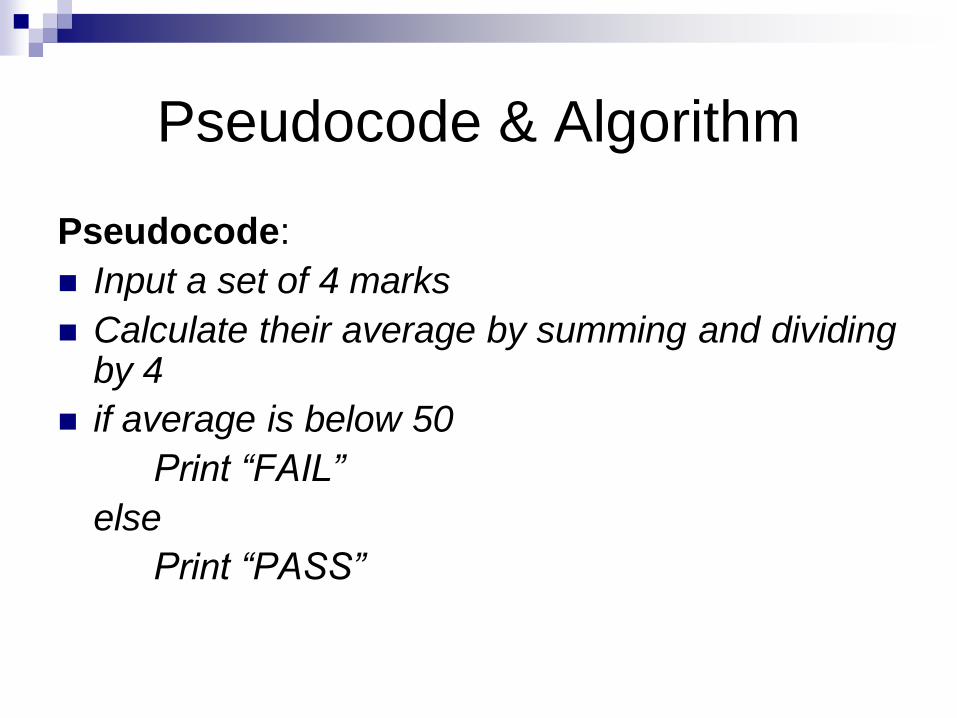
Pseudocode & Algorithm
Pseudocode:
Input a set of 4 marks
Calculate their average by summing and dividing by 4
if average is below 50
Print “FAIL”
else
Print “PASS”
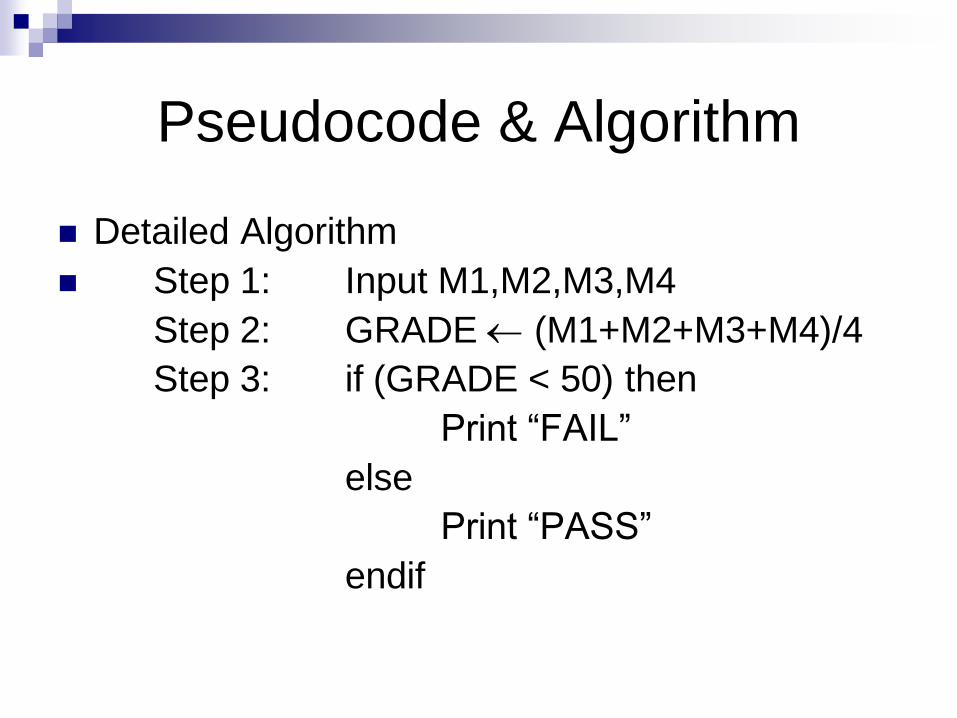
Pseudocode & Algorithm
Detailed Algorithm
Step 1: Input M1,M2,M3,M4
Step 2: GRADE (M1+M2+M3+M4)/4
Step 3: if (GRADE < 50) then
Print “FAIL”
else
Print “PASS”
endif

The Flowchart
(Dictionary) A schematic representation of a sequence of operations, as in a manufacturing process or computer program.
(Technical) A graphical representation of the sequence of operations in an information system or program. Information system flowcharts show how data flows from source documents through the computer to final distribution to users. Program flowcharts show the sequence of instructions in a single program or subroutine. Different symbols are used to draw each type of flowchart.

The Flowchart
A Flowchart
shows logic of an algorithm
emphasizes individual steps and their
interconnections
e.g. control flow from one action to the next
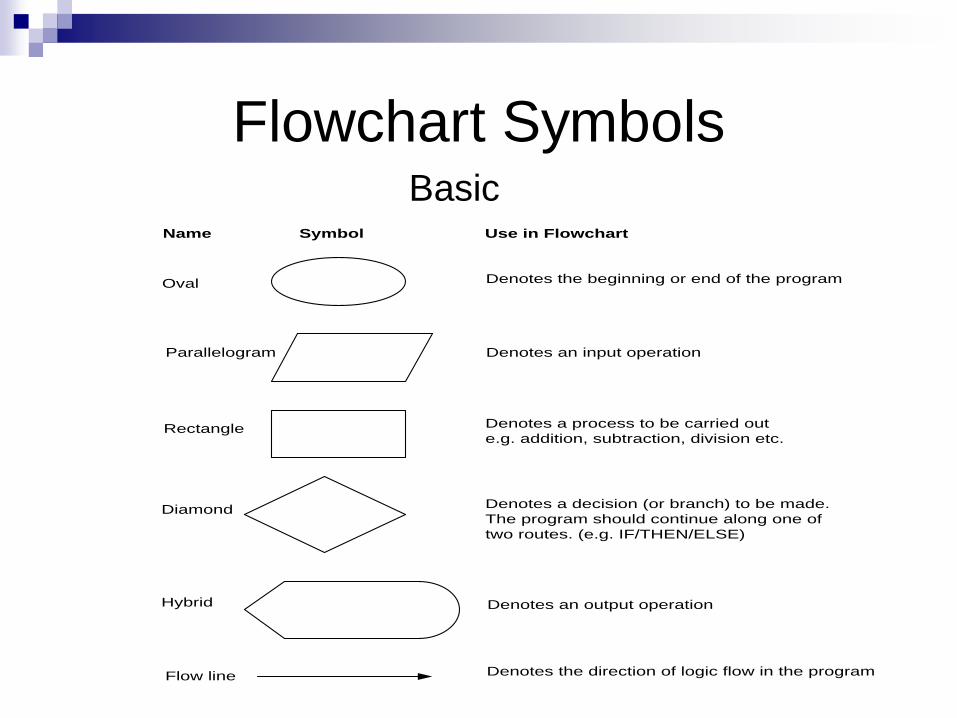
Flowchart Symbols Basic
Oval
Parallelogram
Rectangle
Diamond
Hybrid
Name Symbol Use in Flowchart
Denotes the beginning or end of the program
Denotes an input operation
Denotes an output operation
Denotes a decision (or branch) to be made.
The program should continue along one of
two routes. (e.g. IF/THEN/ELSE)
Denotes a process to be carried out
e.g. addition, subtraction, division etc.
Flow line Denotes the direction of logic flow in the program

Example
“PASS”
Step 1: Input M1,M2,M3,M4
Step 2: GRADE (M1+M2+M3+M4)/4
Step 3: if (GRADE <50) then
Print “FAIL”
else
Print “PASS”
endif
START
Input
M1,M2,M3,M4
GRADE(M1+M2+M3+M4)/4
IS
GRADE<5
0
“FAIL”
STOP
YN
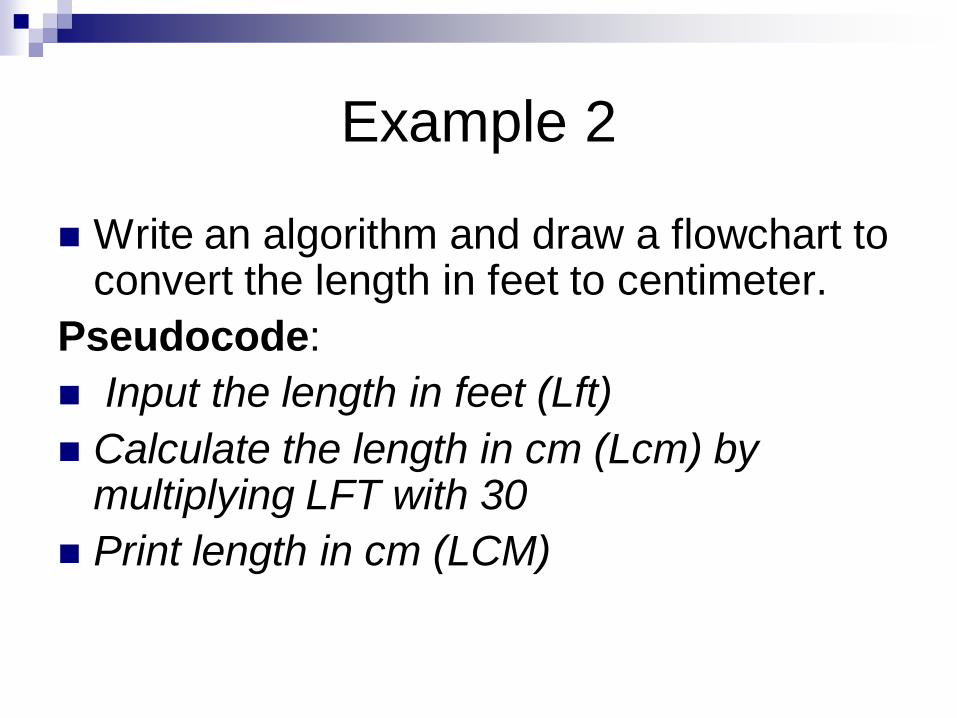
Example 2
Write an algorithm and draw a flowchart to convert the length in feet to centimeter.
Pseudocode:
Input the length in feet (Lft)
Calculate the length in cm (Lcm) by multiplying LFT with 30
Print length in cm (LCM)

Example 2
Algorithm
Step 1: Input Lft
Step 2: Lcm Lft x 30
Step 3: Print Lcm
START
Input
Lft
Lcm Lft x 30
Lcm
STOP
Flowchart
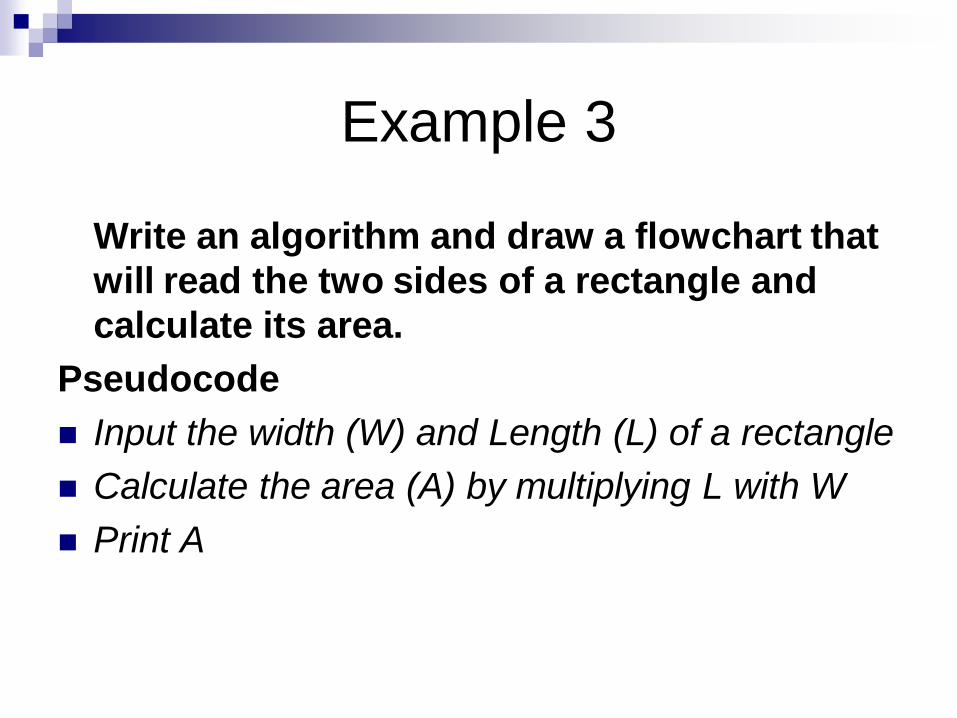
Example 3
Write an algorithm and draw a flowchart that
will read the two sides of a rectangle and
calculate its area.
Pseudocode
Input the width (W) and Length (L) of a rectangle
Calculate the area (A) by multiplying L with W
Print A
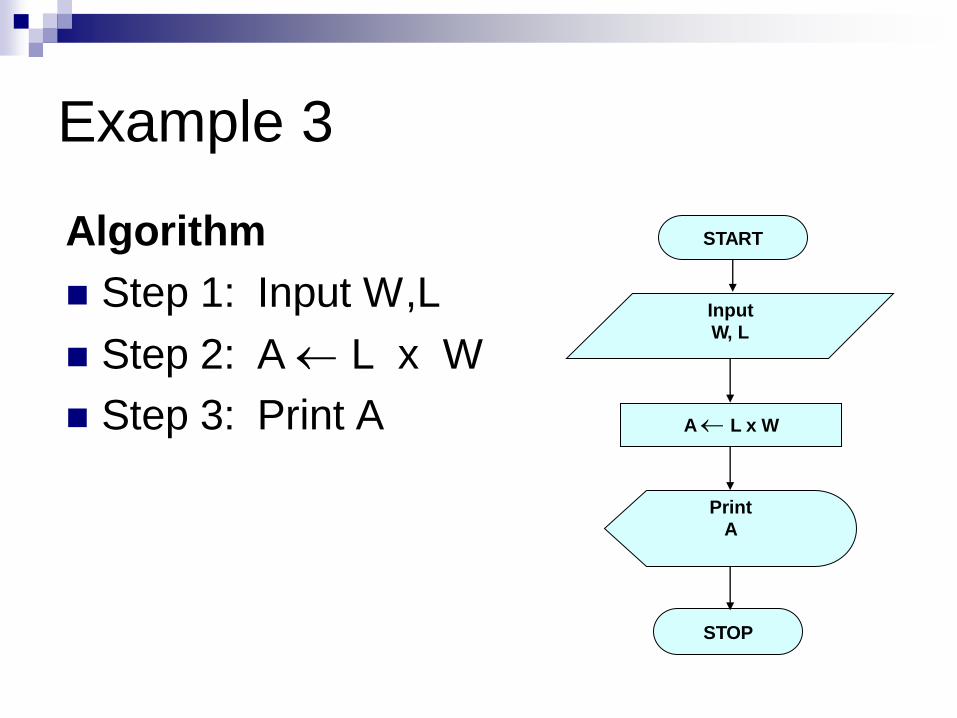
Example 3
Algorithm
Step 1: Input W,L
Step 2: A L x W
Step 3: Print A
START
Input
W, L
A L x W
A
STOP
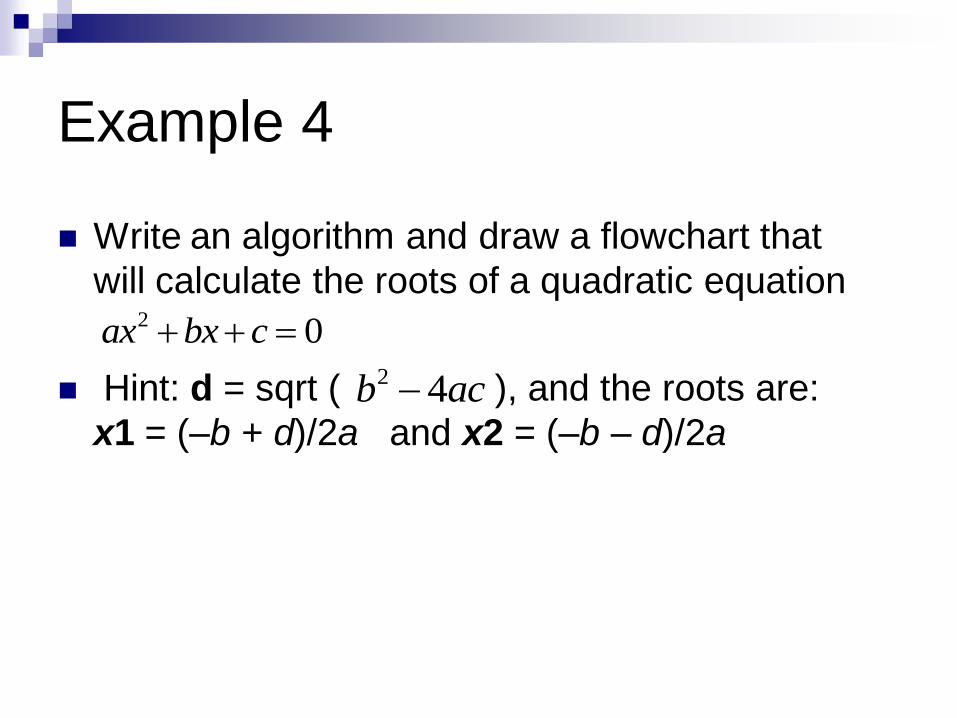
Example 4
Write an algorithm and draw a flowchart that
will calculate the roots of a quadratic equation
Hint: d = sqrt ( ), and the roots are:
x1 = (–b + d)/2a and x2 = (–b – d)/2a
2 0ax bx c 2 4b ac

Example 4
Pseudocode:
Input the coefficients (a, b, c) of the quadratic equation
Calculate d
Calculate x1
Calculate x2
Print x1 and x2

Example 4
Algorithm: Step 1: Input a, b, c
Step 2: d sqrt ( )
Step 3: x1 (–b + d) / (2 x a)
Step 4: x2 (–b – d) / (2 x a)
Step 5: Print x1, x2
START
Input
a, b, c
d sqrt(b x b – 4 x a x c)
x1 ,x2
STOP
x1 (–b + d) / (2 x a)
X2 (–b – d) / (2 x a)
4b b a c

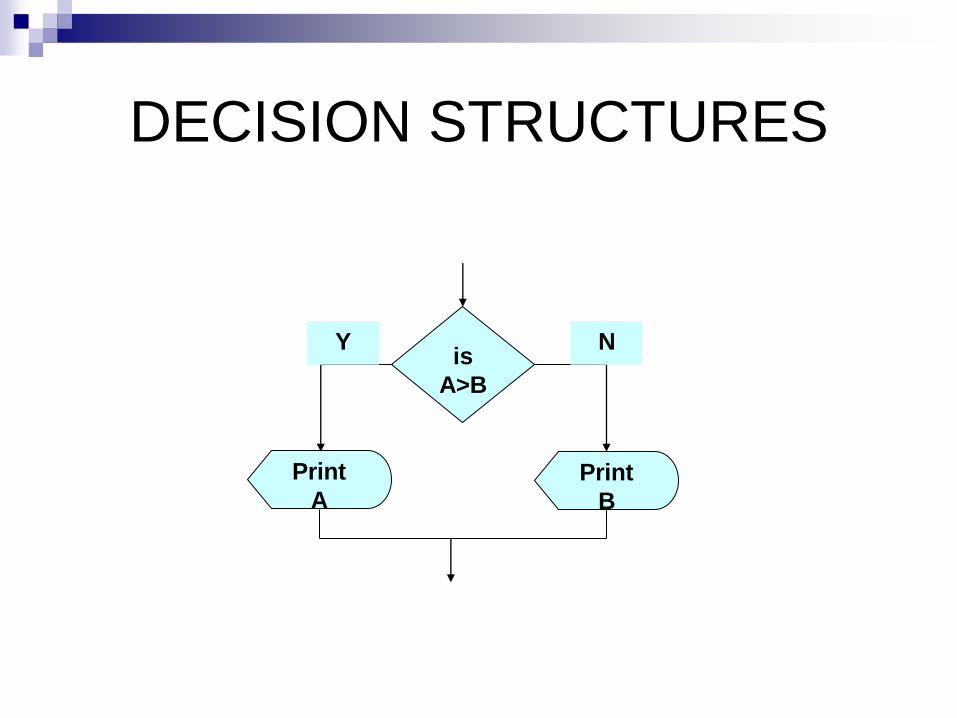
DECISION STRUCTURES
The expression A>B is a logical expression
it describes a condition we want to test
if A>B is true (if A is greater than B) we take the action on left
print the value of A
if A>B is false (if A is not greater than B) we take the action on right
print the value of B
DECISION STRUCTURES
is
A>B
B
A
Y N
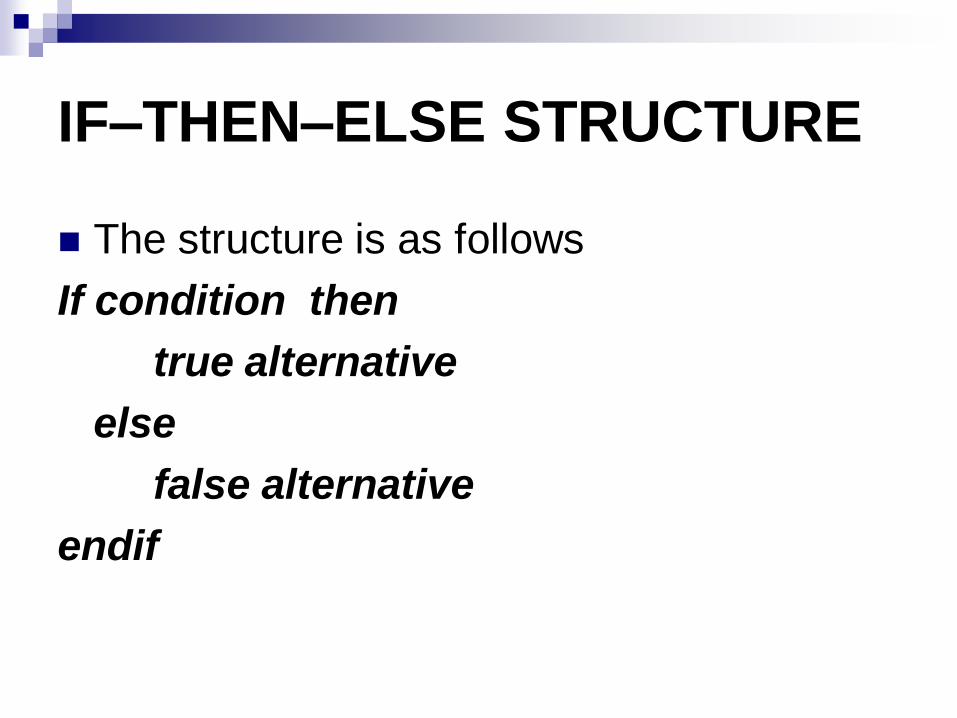
IF–THEN–ELSE STRUCTURE
The structure is as follows
If condition then
true alternative
else
false alternative
endif
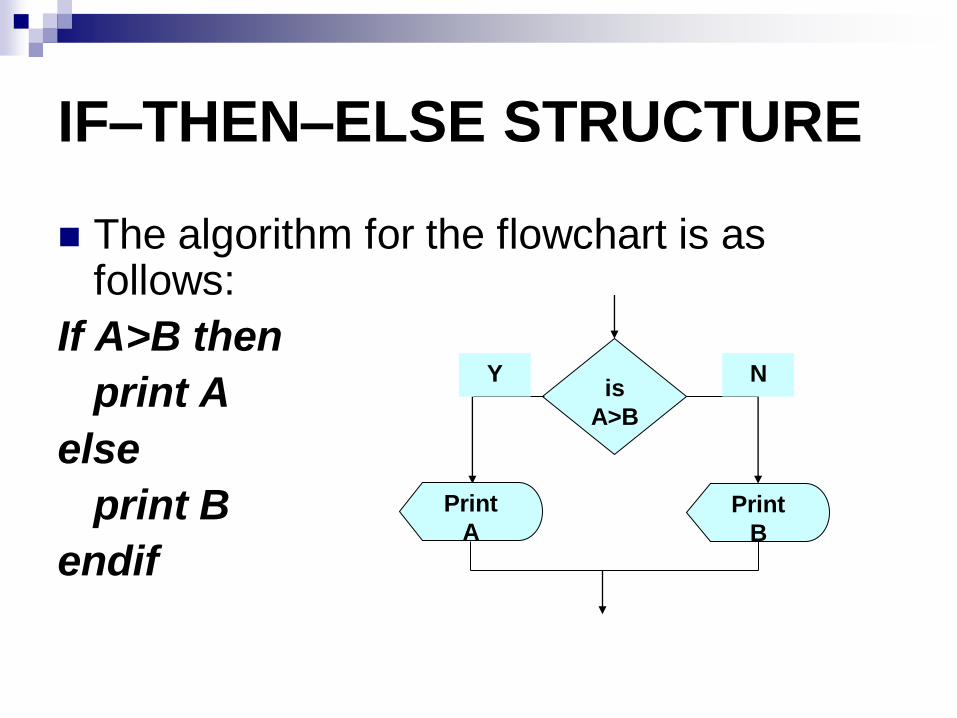
IF–THEN–ELSE STRUCTURE
The algorithm for the flowchart is as follows:
If A>B then
print A
else
print B
endif
is
A>B
B
A
Y N
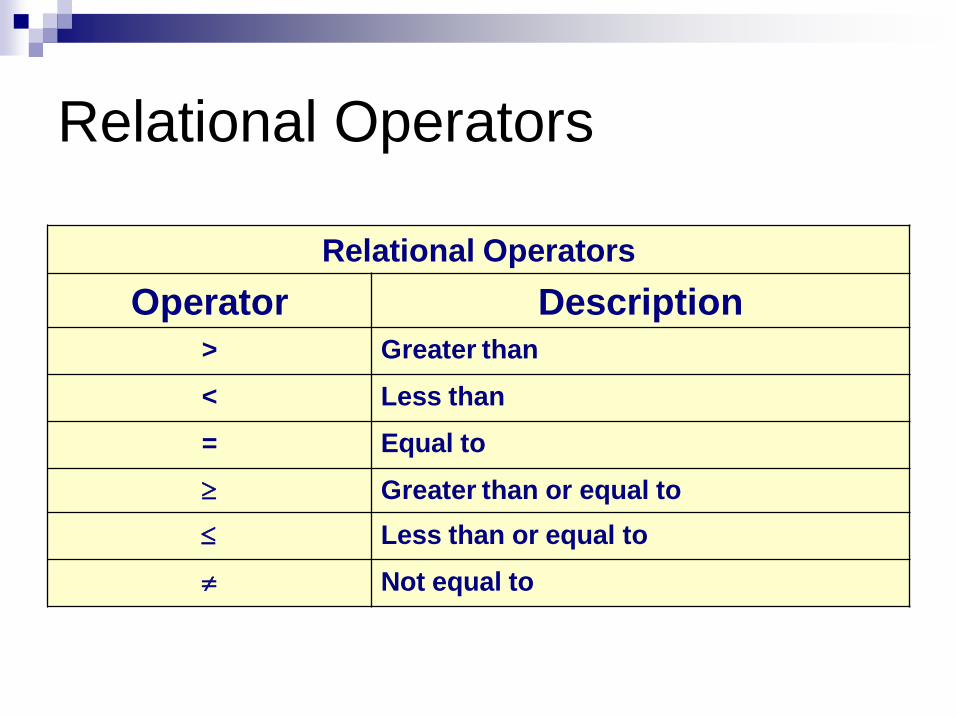
Relational Operators
Relational Operators
Operator Description> Greater than
< Less than
= Equal to
Greater than or equal to
Less than or equal to
Not equal to

Example 5
Write an algorithm that reads two values, determines the largest value and prints the largest value with an identifying message.
ALGORITHM
Step 1: Input VALUE1, VALUE2
Step 2: if (VALUE1 > VALUE2) then
MAX VALUE1
else
MAX VALUE2
endif
Step 3: Print “The largest value is”, MAX

Example 5
MAX VALUE1
“The largest value is”,
MAX
STOP
Y N
START
Input
VALUE1,VALUE2
MAX VALUE2
isVALUE1>VALUE2

NESTED IFS
One of the alternatives within an IF–
THEN–ELSE statement
may involve further IF–THEN–ELSE
statement
Example 6
Write an algorithm that reads three
numbers and prints the value of the largest
number.

Example 6Step 1: Input N1, N2, N3
Step 2: if (N1>N2) then
if (N1>N3) then
MAX N1 [N1>N2, N1>N3]
else
MAX N3 [N3>N1>N2]
endif
else
if (N2>N3) then
MAX N2 [N2>N1, N2>N3]
else
MAX N3 [N3>N2>N1]
endif
endif
Step 3: Print “The largest number is”, MAX

Example 6 (Assignment)
Flowchart: Draw the flowchart of the
above Algorithm.

While Loop
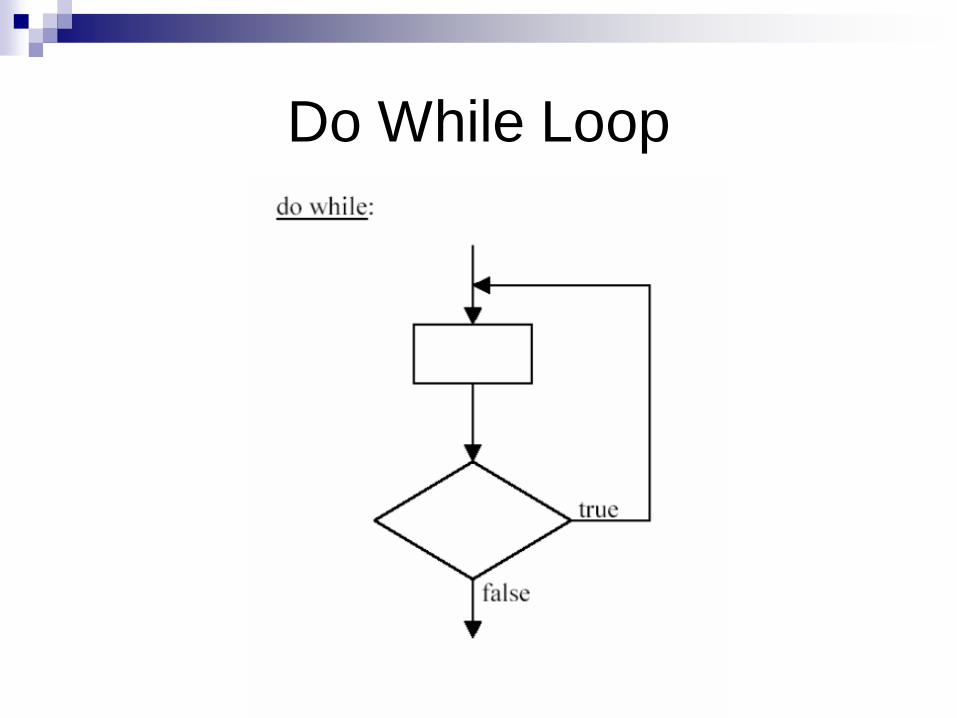
Do While Loop

For Loop
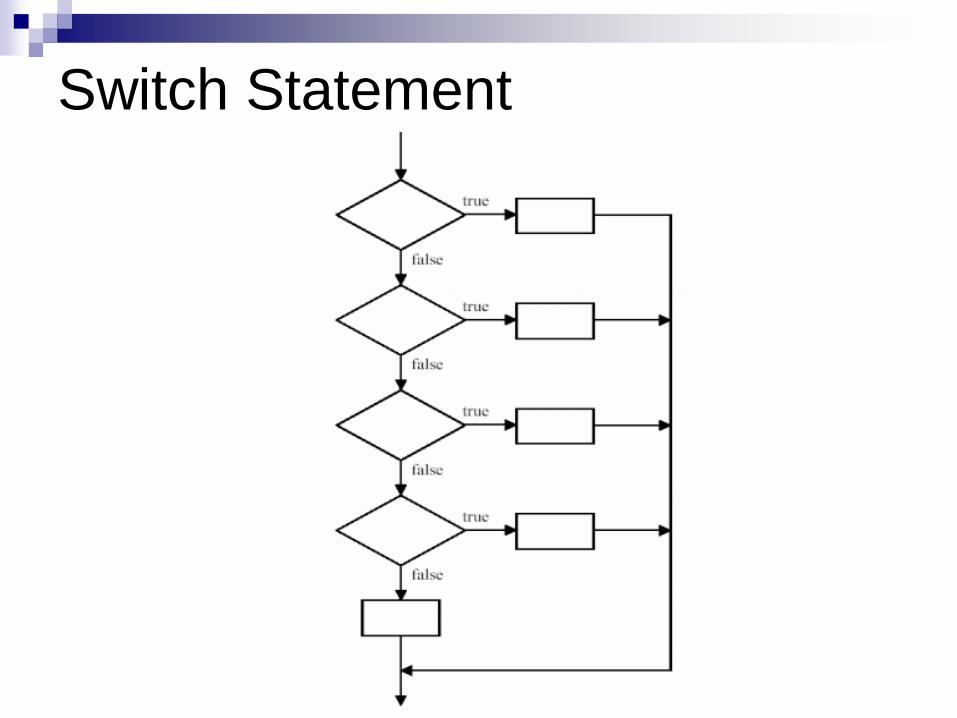
Switch Statement

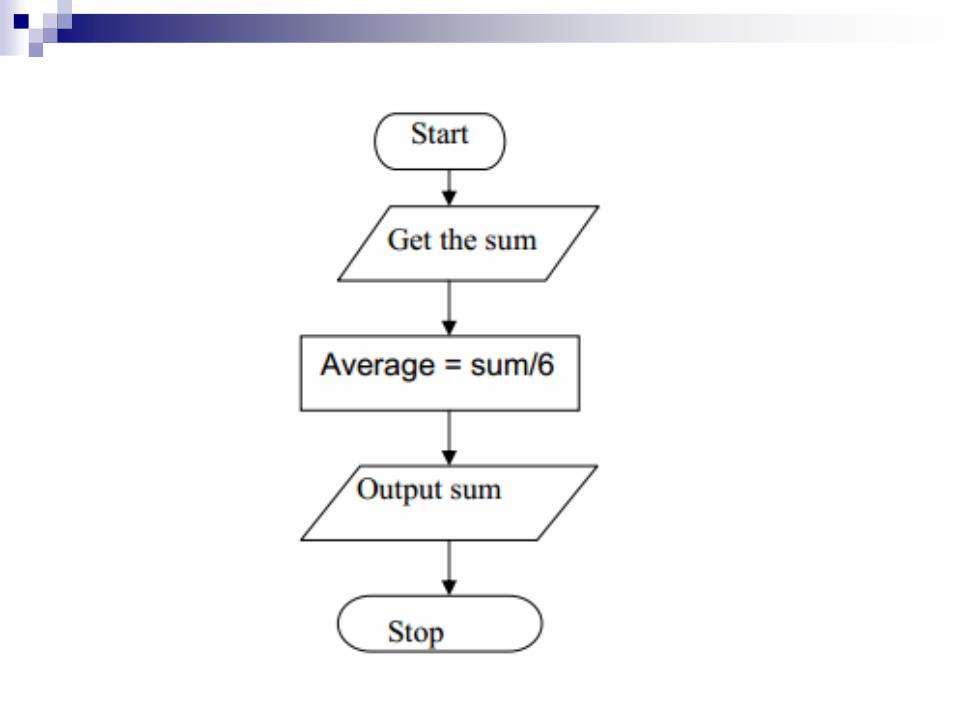
Class Exercises
You are required to design an algorithm
for finding the average of six numbers,
and the sum of the numbers is given.

Pseudocode
Start
Get the sum
Average = sum / 6
Output the average
Stop

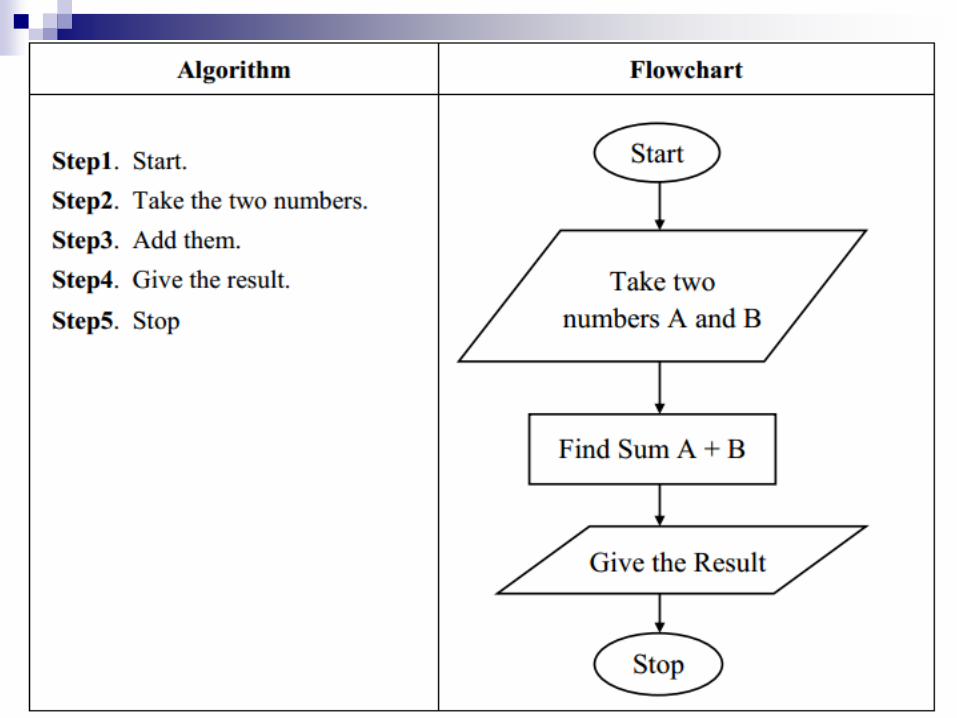
Class Exercises
Write algorithm and draw flowchart to “Add
two Numbers”.

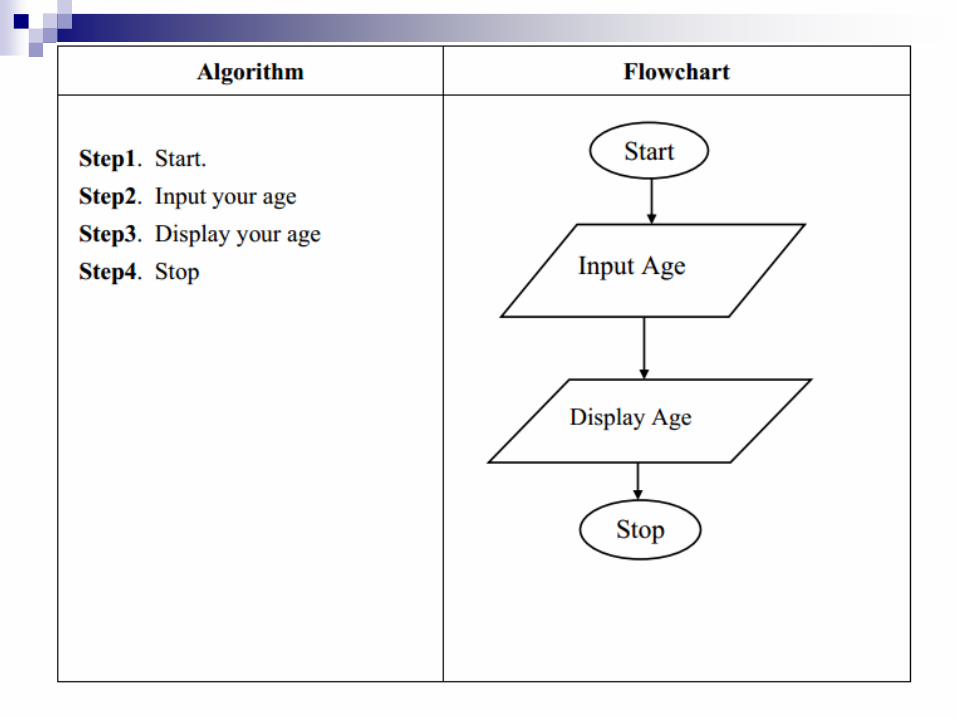
Class Exercises
Write algorithm and draw flowchart to
“Display your Age”

Assignment
Write an algorithm and draw a flowchart to
read 100 numbers and then display the
sum
Write an algorithm and draw a flowchart to
read two numbers then display the
smallest
Write (Display) the Sum, Average and
Product