Algebra I Sample Ques tions - EngageNY
42
R Al Regen lgebr Sam nts Ex ra I (C mple Fal xami Comm e Que ll 201 natio mon C stion 3 on in Core) ns
Transcript of Algebra I Sample Ques tions - EngageNY

RAlRegenlgebr
Sam
nts Exra I (C
mpleFal
1
xamiComm
e Quell 201
natiomon C
stion3
Algebra I S
on in Core)
ns
Sample Ques
stions
NRe
With theELA/Literassessmetheir clas(Commobetter urequired Like theinstructioshared frway the 2014 admthese saemscasse While ednot undequestionthink abinformat
What These adsample q(Commo
•
•
•
THETHE
ew Yoregents e adoption racy and Maent. Educatossrooms. Ton Core) quenderstand tto ensure th
sample quonal shifts dreely with stCCLS shouldministration
ample questessinfo@ma
ducators froergone the s used on t
bout contenion about ho
t’s Newdditional samquestions, bun Core). Spe
Are writteIntegratedAddress www.engclarificatioPresent represent
E STATE EDUE UNIVERSIT
k StateExaminof the Ne
athematics, ors around
o aid in this estions havthe instructhat all stude
uestions prdemanded btudents and d drive instrun of the Regtions will in
ail.nysed.gov
m around tsame exten
the State exnt, NOT to ow teachers
w in thesmple questiout also highl
ecifically, the
en to measud Algebra cuNew York
gageny.org/rons different atations)
UCATION DETY OF THE S
Commnation iew York P-the Board othe state htransition, ae been devtional shiftsents are on t
rovided in by the CCLS.
parents. Thuction and hgents Examinform futurv.
he state havnsive reviewxams. The s
show hows should adm
se Sampons have beelight some s
ese question
ure standardurriculum, bu
State Staresources/re
pproaches
2
EPARTMENT TATE OF NE
on Coren Algeb
-12 Commoof Regents
have begun additional saveloped to demandedrack to colle
the Spring They are t
he sample quhow studentination in Are test dev
ve helped cw, vetting, a
ample quesw operationminister the t
ple Queen developedspecific aspes:
ds that introdut is include
andards Claegents-exam
to assessin
/ EW YORK / A
e Sampbra I (Coon Core Leainitiated a sproviding C
ample Regehelp studen
d by the Coege and care
of 2013, teaching toouestions arets will be assAlgebra I (Coelopment e
craft these sand field tesstions were nal exams ltest.
estionsd for the sam
ects of the R
duce new cod in Algebra
arifications, ms-mathema
ng the sam
Algebra I S
ALBANY, NY
ple Queommonarning Stanshift in bothCommon Conts Examinants, parentsommon Coreer readiness
these questols for educae designed tosessed startiommon Corefforts and
sample quessting that odesigned toook exactly
me purpose Regents Exam
ontent that a I (Common
which cantics-algebra-
me standard
Sample Ques
12234
stions:n Core)ndards (CCLh instructionore instructioation in Alges, and educre and the s.
tions emphators and cao help clarifing with there). Feedbac
can be sen
stions, they occur with ao help educy or to pro
as the originmination in
is not part on Core) n be foun-i-standards
d (i.e., mu
stions
LS) in n and on in ebra I cators
rigor
hasize an be fy the June ck on nt to
have actual cators ovide
nal set of Algebra I
of the
d at s-
ultiple
Algebra I Sample Questions
3
Teachers should note the expectations outlined in these sample items and use this information to inform their instructional practices. For example, Question 10 requires stating the domain and range of a given function. Students may use a variety of notational conventions in their answer. Teachers are encouraged to teach students multiple ways of denoting sets. Another example is in Question 4. A domain is specified and students are required to graph only over this given domain. Again, this practice should be emphasized in the classroom when applicable.
How to Use the Sample Questions • Interpret how the standards are conceptualized in each question. • Note the multiple ways the standard is assessed throughout the sample questions. • Look for opportunities for mathematical modeling; i.e., connecting mathematics with
the real world by conceptualizing, analyzing, interpreting and validating conclusions in order to make decisions about situations in everyday life, society, or the workplace.
• Consider the instructional changes that will need to occur in your classroom. • Notice the application of mathematical ways of thinking to real world issues and
challenges. • Pay attention to the strong distractors in each multiple-choice question. • Don’t consider these questions to be the only way the standard will be assessed. • Don’t assume that the sample questions represent a mini-version of future State exams.
Format of the Mathematics Sample Questions Document The Mathematics Sample Questions document is formatted so that headings appear below each question to provide information for the teacher to help interpret the question, understand its alignment with the CCLS, and inform instruction. A list of the headings with a brief description of the associated information is shown below. Key: This is the correct response or, in the case of multiple-choice questions, the correct
option. Aligned to CCLS: This is the NYS P-12 Common Core Learning Standard measured by the
question. Secondary Standard: If applicable, this is the NYS P-12 Common Core Learning Standard that
supports the primary standard measured by the question. Mathematical Practices: If applicable, this is a list of Standards for Mathematical Practice
associated with the question. Note that in classroom use, the questions included here can be used to highlight a variety of practice standards.
Multiple Representation Codes: This is a list of the multiple representation codes associated
with the question.
Algebra I Sample Questions
4
Commentary: This is an explanation of how the question aligns with the listed content standard.
Rationale: For multiple-choice questions, this section provides the correct option and
demonstrates one method for arriving at that answer. For constructed-response questions, one possible solution is shown followed by the scoring rubric that is specific to the question. Note that there are often multiple approaches to solving each problem. The rationale section provides only one example. In some cases, a constructed-response question requires a student to solve the question using a specific strategy. Constructed-response questions are written in this manner when the question is designed to measure a standard that calls for a specific strategy.
Rubrics: The scoring rubrics provided should be used to evaluate the efficacy of different
methods used to arrive at a solution.

Algebra I Sample Questions
5
1 Which ordered pair is not in the solution set of 12
5y x> − + and 3 2≤ −y x ?
(1) (5,3) (2) (4,3) (3) (3,4) (4) (4,4)
Algebra I Sample Questions
6
Key: 2
Aligned to CCLS: A.REI.3
Mathematical Practice: 2
MRC: Pl, Pj, A6
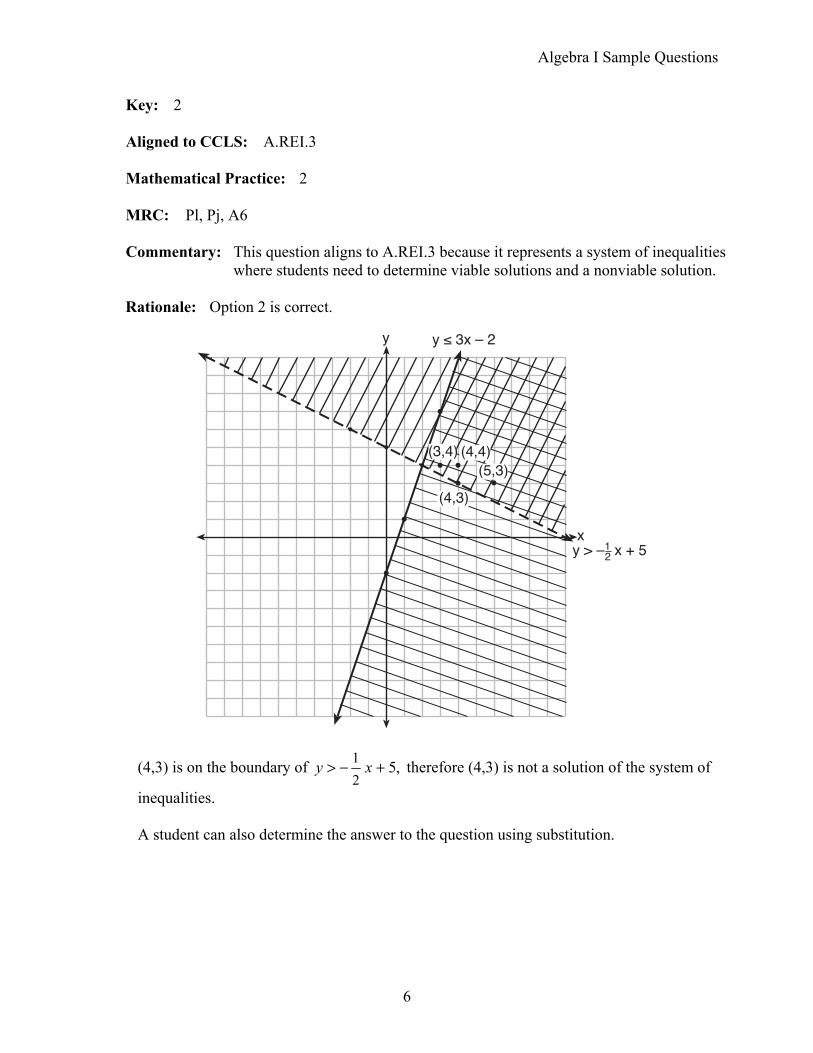
Commentary: This question aligns to A.REI.3 because it represents a system of inequalities where students need to determine viable solutions and a nonviable solution.
Rationale: Option 2 is correct.
(4,3) is on the boundary of 12
5,y x> − + therefore (4,3) is not a solution of the system of
inequalities.
A student can also determine the answer to the question using substitution.
Algebra I Sample Questions
7
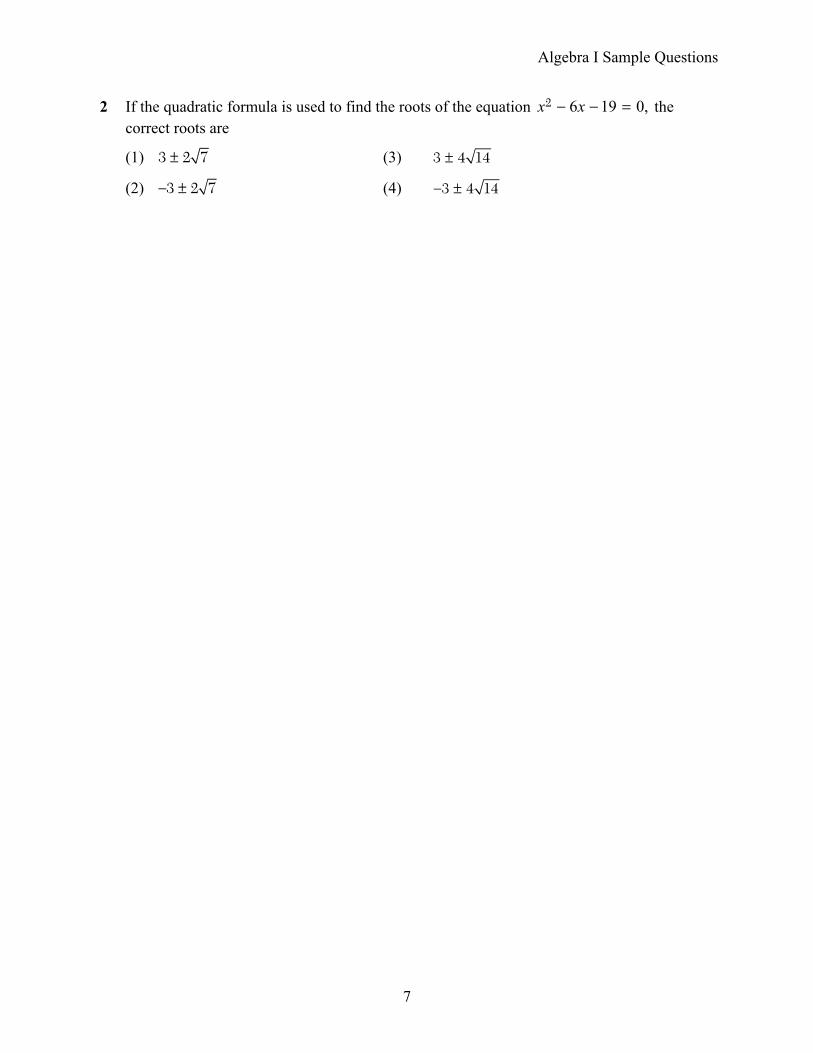
2 If the quadratic formula is used to find the roots of the equation 6 19 0,2 − − =x x the correct roots are
(1) ±3 2 7 (3) 3 4 14±
(2) − ±3 2 7 (4) 3 4 14− ±

Algebra I Sample Questions
8
Key: 1
Aligned to CCLS: A.REI.4b
Mathematical Practice: 6
MRC: Pa, Pd, Pl, Pn
Commentary: This question aligns to A.REI.4b and its NYS clarification (solutions may include simplifying radicals) because the student must solve a quadratic equation and understand the process of simplifying radicals.
Rationale: Option 1 is correct.
( ) ( ) ( ) ( )( )
42
6 6 4 1 19
2 1
6 36 762
6 1122
6 16 72
6 4 72
3 2 7
b b aca
x
x
x
x
x
x
x
− ± −
− − ± − − −
± +
±
±
±
±
=
=
=
=
=
=
=
2
2
i

Algebra I Sample Questions
9
3 Which statistic would indicate that a linear function would not be a good fit to model a data set?
Algebra I Sample Questions
10
Key: 3
Aligned to CCLS: S.ID.6c
Secondary Standards: S.ID.6a and S.ID.8
Mathematical Practices: 1 and 2
MRC: C2f, C3d
Commentary: This question aligns to S.ID.6c and its corresponding clarification (both correlation coefficient and residuals will be addressed in this standard) because the student must determine the fit of the data by interpreting a correlation coefficient and residual plots.
Rationale: Option 3 is correct. A correlation coefficient close to –1 or 1 indicates a good fit.
For a residual plot, there should be no observable pattern and a similar distribution of residuals above and below the x-axis.

Algebra I Sample Questions
11
4 On the set of axes below, graph the function represented by 3 2= xy − for the domain 6 10.x− ≤ ≤

Algebra I Sample Questions
12
Key: See graph in the rationale.
Aligned to CCLS: F.IF.7b
Mathematical Practice: 5
MRC: Pj, Pl
Commentary: This question aligns to F.IF.7b because the students will graph a cube root function.
Rationale:
The graph must be drawn for the given domain only. The graph must not include arrows.
Rubric:
[2] A correct graph is drawn for the given interval.
[1] One graphing error is made, such as the graph extending beyond the given interval.
or [1] One conceptual error is made.
[0] A zero response is completely incorrect, irrelevant, or incoherent or is a correct response that
was obtained by an obviously incorrect procedure.

Algebra I Sample Questions
13
5 Solve 8 20 122 + =m m for m by factoring.

Algebra I Sample Questions
14
Key: –3 and 12
Aligned to CCLS: A.SSE.3a
Secondary Standard: A.REI.4b
Mathematical Practices: 1 and 7
MRC: Pj, Pn
Commentary: This question aligns to A.SSE.3a and its NYS clarification (includes trinomials with leading coefficients other than 1) because it requires the student to factor a quadratic with a leading coefficient other than 1.
Rationale:
12
12
3
3 and
8 20 128 20 12 04(2 5 3) 04( 3)(2 1) 0
3 = 0 2 1 02
m
m mm m
m mm m
m mm m
m
−
= −
+ =+ − =+ − =
+ − =+ − == =
=
2
2
2
1
Rubric:
[2] –3 and 12
, and correct work is shown.
[1] Appropriate work is shown, but one computational or factoring error is made. or
[1] Appropriate work is shown, but one conceptual error is made. or
[1] Appropriate work is shown, but only one solution is found. or
[1] (4 2)(2 6)m m− + or an equivalent factored expression is written, but no further correct work is shown.
or [1] –3 and 1
2, but a method other than factoring is used.
or [1] –3 and 1
2, but no work is shown.
[0] A zero response is completely incorrect, irrelevant, or incoherent or is a correct response
that was obtained by an obviously incorrect procedure.

Algebra I Sample Questions
15
6 Ryker is given the graph of the function y = 12
x2 – 4. He wants to find the zeros of the function,
but is unable to read them exactly from the graph.
Find the zeros in simplest radical form.

Algebra I Sample Questions
16
Key: ±2 2
Aligned to CCLS: A.REI.4
Secondary Standard: F.IF.8a
Mathematical Practice: 7
MRC: Pa, Pl, Clk, C2b
Commentary: This item aligns to A.REI.4 and its clarification (solutions may include simplifying radicals) because it requires a student to choose an appropriate method of solving a quadratic function, and the solutions are simplified in radical form.
Rationale:
( )
12
122
0 2
8
4 0
8 = 0
8
2 2
x
x
xxxx
⎛ ⎞ =⎜ ⎟⎝ ⎠
=
− =
−
−
= ±
= ±
2
2
2
2
4
Rubric:
[2] ±2 2 , and correct work is shown.
[1] Appropriate work is shown, but one computational or simplification error is made. or
[1] Appropriate work is shown, but one conceptual error is made. or
[1] Appropriate work is shown, but the answer is written in decimal form. or
[1] ±2 2 , but no work is shown.
[0] A zero response is completely incorrect, irrelevant, or incoherent or is a correct response that was obtained by an obviously incorrect procedure.

Algebra I Sample Questions
17
7 Emma recently purchased a new car. She decided to keep track of how many gallons of gas she used on five of her business trips. The results are shown in the table below.
Miles Driven Number of Gallons Used
150 7 200 10 400 19 600 29
1000 51
Write the linear regression equation for these data where miles driven is the independent variable. (Round all values to the nearest hundredth.)

Algebra I Sample Questions
18
Key: 0.05 0.92= −y x
Aligned to CCLS: S.ID.6a
Mathematical Practices: 5
MRC: Pa, Pl
Commentary: This question aligns to S.ID.6a and its corresponding clarification (includes the use of the regression capabilities of the calculator) because it requires the student to write a linear regression equation for the given data while using the regression capabilities of the calculator.
Rationale: The linear regression equation, 0.05 0.92,= −y x was found using the regression
capabilities of the calculator.
Rubric:
[2] The equation 0.05 0.92= −y x or an equivalent equation is written.
[1] The expression 0.05 0.92−x is written. or
[1] One rounding error is made. or
[1] One conceptual error is made, such as using a regression equation other than linear.
[0] A zero response is completely incorrect, irrelevant, or incoherent or is a correct response that was obtained by an obviously incorrect procedure.
Algebra I Sample Questions
19
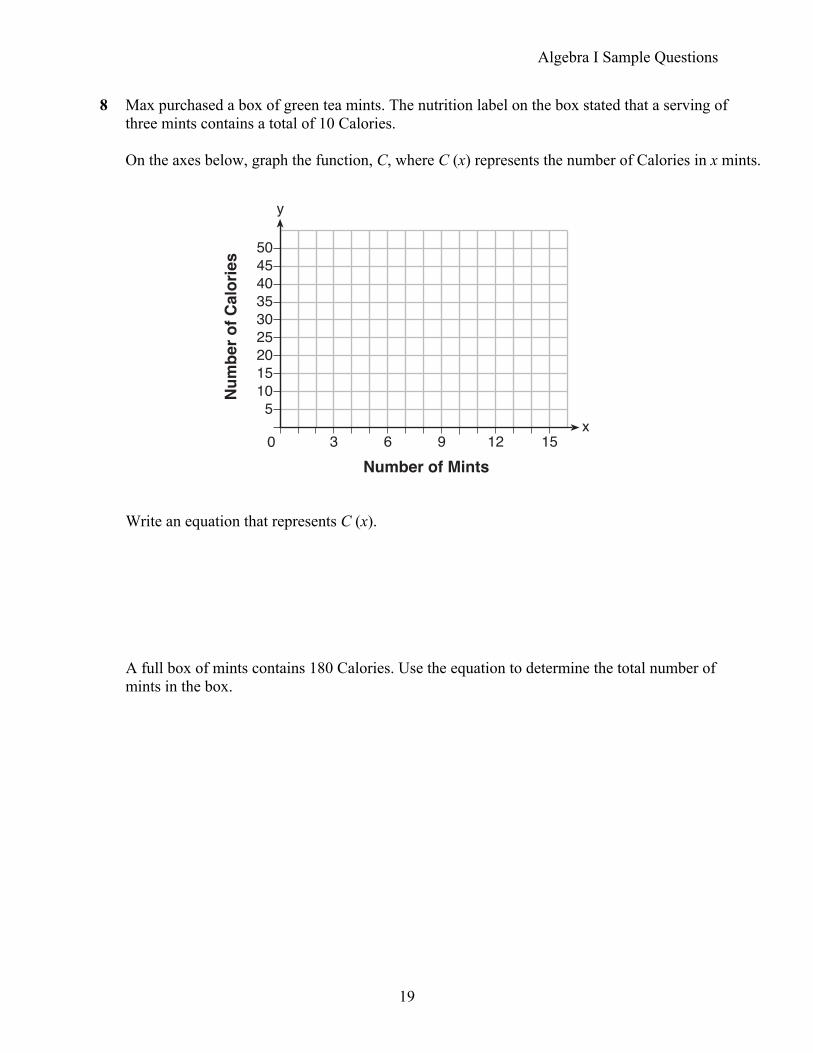
8 Max purchased a box of green tea mints. The nutrition label on the box stated that a serving of three mints contains a total of 10 Calories.
On the axes below, graph the function, C, where C (x) represents the number of Calories in x mints.
Write an equation that represents C (x).
A full box of mints contains 180 Calories. Use the equation to determine the total number of mints in the box.

Algebra I Sample Questions
20
Key: See graph in rationale.
( ) 103
C x x=
54 mints
Aligned to CCLS: A.CED.3
Secondary Standard: A.CED.1, F.IF.2
Mathematical Practice: 4
MRC: Pa, Pk
Commentary: This question aligns with A.CED.3 because students must write an equation, then use the equation to determine a viable solution.
Rationale:
The slope of the given line is 103
, therefore the equation representing C (x) is
( ) 103
101803
540 1054
C x x
x
xx
=
=
==
There are 54 mints in the box.
Algebra I Sample Questions
21
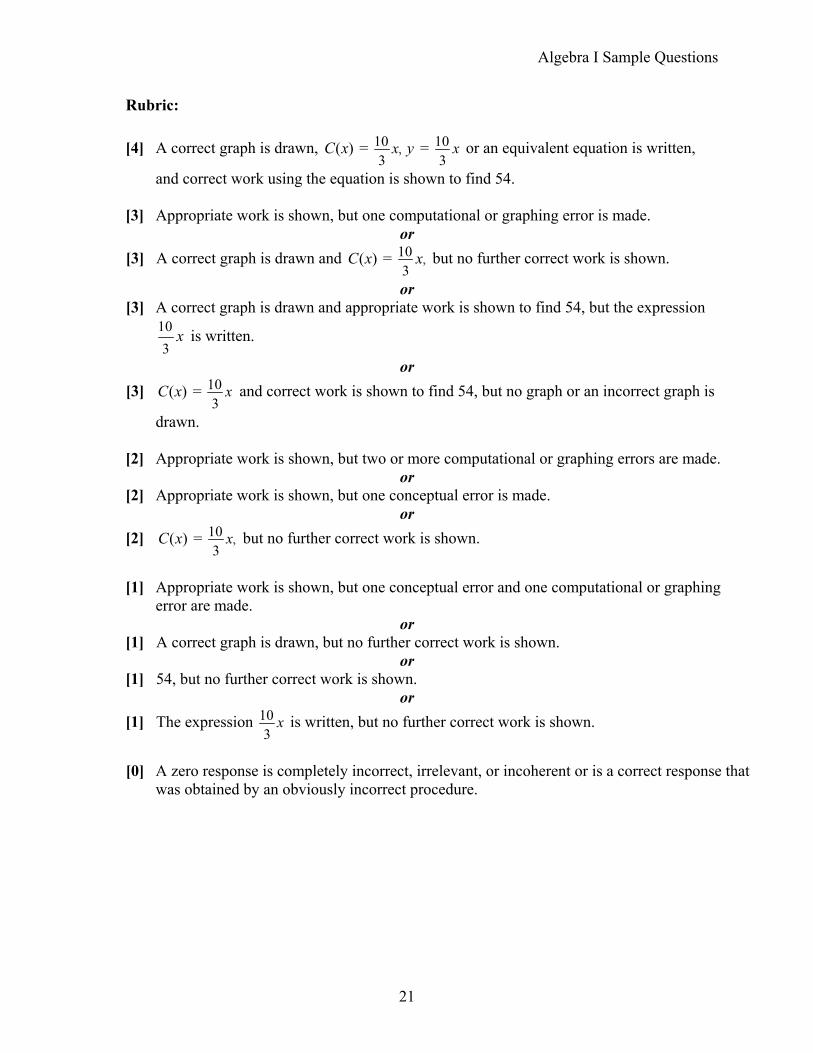
Rubric:
[4] A correct graph is drawn, 10 103 3
( ) = =x xC x y, or an equivalent equation is written,
and correct work using the equation is shown to find 54.
[3] Appropriate work is shown, but one computational or graphing error is made. or
[3] A correct graph is drawn and 103
( ) =C x x, but no further correct work is shown.
or [3] A correct graph is drawn and appropriate work is shown to find 54, but the expression
103
x is written.
or [3] 10
3( ) = xC x and correct work is shown to find 54, but no graph or an incorrect graph is
drawn.
[2] Appropriate work is shown, but two or more computational or graphing errors are made. or
[2] Appropriate work is shown, but one conceptual error is made. or
[2] 103
( ) = xC x , but no further correct work is shown.
[1] Appropriate work is shown, but one conceptual error and one computational or graphing
error are made. or
[1] A correct graph is drawn, but no further correct work is shown. or
[1] 54, but no further correct work is shown. or
[1] The expression 103
x is written, but no further correct work is shown.
[0] A zero response is completely incorrect, irrelevant, or incoherent or is a correct response that
was obtained by an obviously incorrect procedure.

Algebra I Sample Questions
22
9 David has two jobs. He earns $8 per hour babysitting his neighbor’s children and he earns $11 per hour working at the coffee shop.
Write an inequality to represent the number of hours, x, babysitting and the number of hours, y, working at the coffee shop that David will need to work to earn a minimum of $200.
David worked 15 hours at the coffee shop. Use the inequality to find the number of full hours he must babysit to reach his goal of $200.

Algebra I Sample Questions
23
Key: 8 200x y+ ≥11 5 hours
Aligned to CCLS: A.CED.3
Secondary Standard: A.REI.3
Mathematical Practices: 4
MRC: Pa, Pl
Commentary: This question aligns to A.CED.3 because the student must write an inequality
and interpret solutions as viable or nonviable options.
Rationale: 8 11 200x y+ ≥
8 11(15) 200x + ≥ 8 165 200x + ≥ 8 35x ≥
4.375x ≥ 5 hours
Rubric:
[4] 8 11 200+ ≥x y or equivalent, 5 and correct work is shown.
[3] Appropriate work is shown, but one computational or rounding error is made. or
[3] An incorrect inequality is written, but solved appropriately for the number of full hours of babysitting.
[2] Appropriate work is shown, but two or more computational or rounding errors are made.
or [2] Appropriate work is shown, but one conceptual error is made.
or [2] 8 20011+ ≥x y and 5 are stated, but no work is shown.
[1] Appropriate work is shown, but one conceptual error and one computational or rounding
error are made. or
[1] 8 20011+ ≥x y is written, but no further correct work is shown.
[0] A zero response is completely incorrect, irrelevant, or incoherent or is a correct response that was obtained by an obviously incorrect procedure.

Algebra I Sample Questions
24
10 On the set of axes below, graph the function 1 .y x= +
State the range of the function.
State the domain over which the function is increasing.

Algebra I Sample Questions
25
Key: See graph in the rationale. Range: [ ) {0, 0, 0y y y≥ ∞ ≥ ,, where y is a real number}, or all real numbers ≥ 0
Domain: ( ) {1, > − −1,∞ > −, 1,x x x where x is a real number}, or all real numbers > –1
Aligned to CCLS: F.IF.7b
Secondary Standard: F.IF.4 and F.IF.5
Mathematical Practice: 2
MRC: Pj, Pl
Commentary: This question aligns to F.IF.7b because students must draw the graph of an absolute value function.
Rationale:
The graph should be drawn to include the decreasing and increasing portions of the graph. Since a domain is not stated, arrows must be included on the graph of the function. The range of the function is [ ) {0, 0, 0y y y≥ ∞ ≥, , where y is a rational number}, or all real numbers ≥ 0. The function is increasing for ( ) {1, > − −1,∞ > −, 1,x x x where x is a real number}, or all real numbers > –1.

Algebra I Sample Questions
26
Rubric:
[4] A correct graph is drawn and range, 0y ≥ and domain, x > –1 or equivalent intervals are stated.
[3] Appropriate work is shown, but one graphing error is made.
or [3] A correct graph is drawn, but either the range or domain is missing or is incorrect.
[2] Appropriate work is shown, but two or more graphing errors are made.
or [2] Appropriate work is shown, but one conceptual error is made.
or [2] A correct graph is drawn, but no further correct work is shown.
or [2] Range, 0y ≥ and domain, x > –1 are stated, but no graph is drawn.
[1] Appropriate work is shown, but one conceptual error and one graphing error are made.
or [1] Range, 0y ≥ or domain, x > –1 is stated, but no graph is drawn.
[0] A zero response is completely incorrect, irrelevant, or incoherent or is a correct response
that was obtained by an obviously incorrect procedure.

Algebra I Sample Questions
27
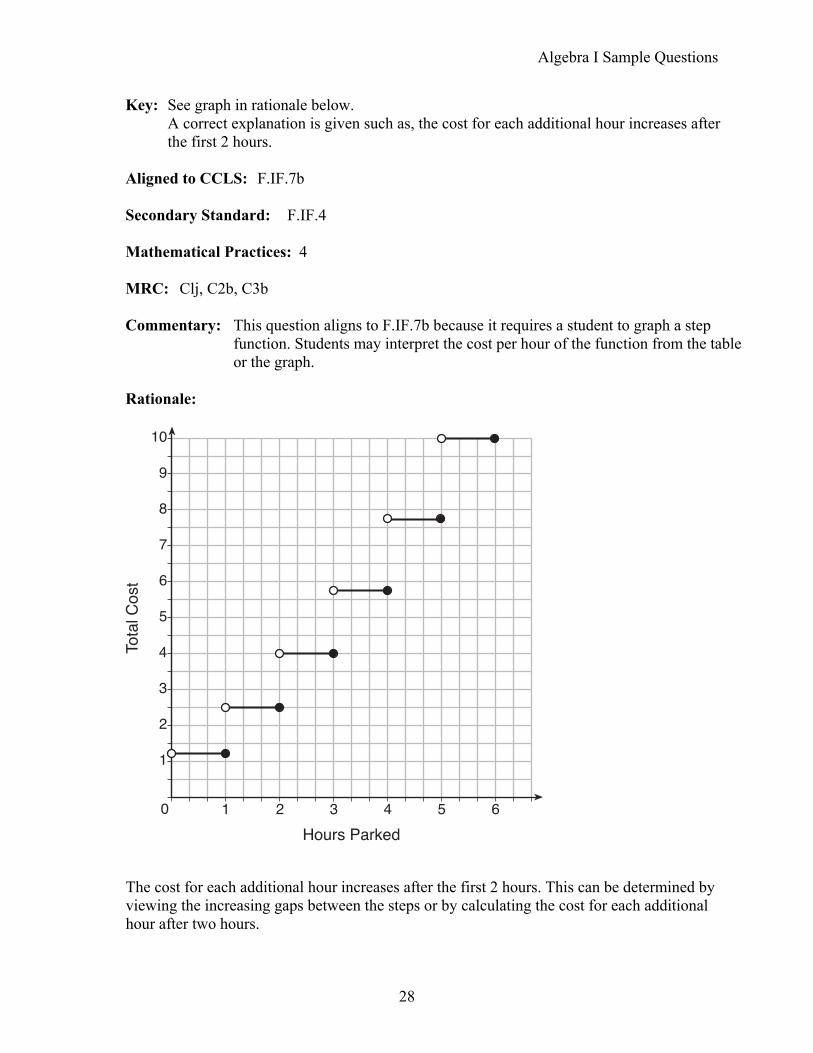
11 The table below lists the total cost for parking for a period of time on a street in Albany, N.Y. The total cost is for any length of time up to and including the hours parked. For example, parking for up to and including 1 hour would cost $1.25; parking for 3.5 hours would cost $5.75.
Hours Parked
Total Cost
1 1.25
2 2.50
3 4.00
4 5.75
5 7.75
6 10.00
Graph the step function that represents the cost for the number of hours parked.
Explain how the cost per hour to park changes over the six-hour period.
Algebra I Sample Questions
28
Key: See graph in rationale below. A correct explanation is given such as, the cost for each additional hour increases after the first 2 hours.
Aligned to CCLS: F.IF.7b
Secondary Standard: F.IF.4
Mathematical Practices: 4
MRC: Clj, C2b, C3b
Commentary: This question aligns to F.IF.7b because it requires a student to graph a step
function. Students may interpret the cost per hour of the function from the table or the graph.
Rationale:
The cost for each additional hour increases after the first 2 hours. This can be determined by viewing the increasing gaps between the steps or by calculating the cost for each additional hour after two hours.
Algebra I Sample Questions
29
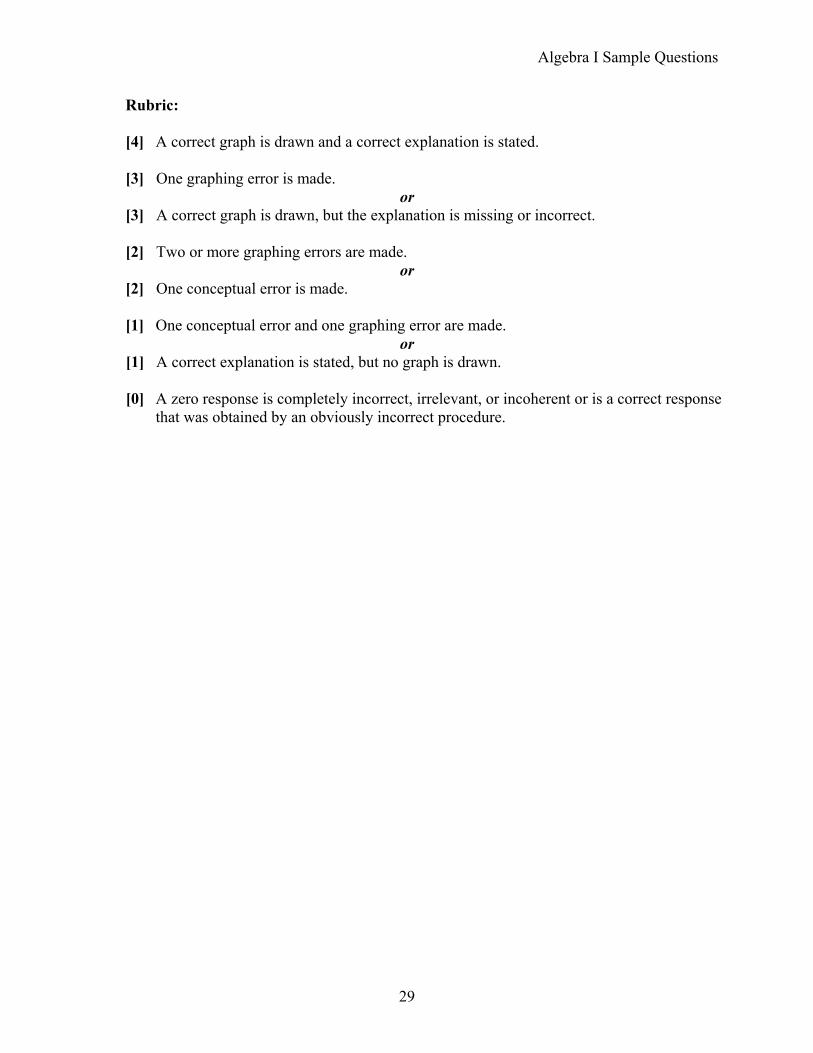
Rubric:
[4] A correct graph is drawn and a correct explanation is stated.
[3] One graphing error is made. or
[3] A correct graph is drawn, but the explanation is missing or incorrect.
[2] Two or more graphing errors are made. or
[2] One conceptual error is made.
[1] One conceptual error and one graphing error are made. or
[1] A correct explanation is stated, but no graph is drawn.
[0] A zero response is completely incorrect, irrelevant, or incoherent or is a correct response that was obtained by an obviously incorrect procedure.

Algebra I Sample Questions
30
12 At an office supply store, if a customer purchases fewer than 10 pencils, the cost of each pencil is $1.75. If a customer purchases 10 or more pencils, the cost of each pencil is $1.25.
Let c be a function for which c (x) is the cost of purchasing x pencils, where x is a whole number.
1.75 , if 0 9
( )1.25 , if 10
x xc x
x x⎧⎨⎩
≤ ≤=
≥
Create a graph of c on the axes below.
A customer brings 8 pencils to the cashier. The cashier suggests that the total cost to purchase 10 pencils would be less expensive. State whether the cashier is correct or incorrect. Justify your answer.

Algebra I Sample Questions
31
Key: See the graph in the rationale below. The cashier is correct with an appropriate explanation or work shown to justify the answer.
Aligned to CCLS: F.IF.7b
Mathematical Practices: 1 and 4
MRC: Pa, Pj
Commentary: This question aligns to F.IF.7b because a student has to graph a piecewise-
defined function.
Rationale:
The data points are not connected because the points represent discrete data and the values for the data can be included on the axes.
Data points can be connected or drawn as a straight line if plotting each individual data point would represent a line.
Since 8 pencils cost $14 and 10 pencils cost $12.50, the cashier is correct. The student can calculate the cost of pencils or use the graph to identify that 10 pencils are cheaper than 8 pencils.
Algebra I Sample Questions
32
Rubric:
[4] A correct graph is drawn and the cashier is correct or an equivalent answer is stated and a correct justification is written.
[3] Appropriate work is shown, but one graphing or computational error is made.
or [3] A correct graph is drawn but either the cashier’s statement or the justification is missing or
incorrect.
[2] Appropriate work is shown, but two or more graphing or computational errors are made. or
[2] Appropriate work is shown, but one conceptual error is made. or
[2] A correct graph is drawn, but no further correct work is shown.
[1] Appropriate work is shown, but one conceptual error and one graphing or computational error are made.
or [1] No graph is drawn. The cashier is correct is not stated, but an appropriate justification is given.
[0] No graph is drawn. The cashier is correct is stated and an incorrect, irrelevant, incoherent, or
no justification is written. or
[0] A zero response is completely incorrect, irrelevant, or incoherent or is a correct response that was obtained by an obviously incorrect procedure.

Algebra I Sample Questions
33
13 About a year ago, Joey watched an online video of a band and noticed that it had been viewed only 843 times. One month later, Joey noticed that the band’s video had 1708 views. Joey made the table below to keep track of the cumulative number of views the video was getting online.
Months Since First Viewing Total Views 0 843 1 1708 2 forgot to record 3 7124 4 14,684
5 29,787
6 62,381
a) Write a regression equation that best models these data. Round all values to the nearest hundredth. Justify your choice of regression equation.
b) As shown in the table, Joey forgot to record the number of views after the second month. Use the equation from part a to estimate the number of full views of the online video that Joey forgot to record.
Algebra I Sample Questions
34
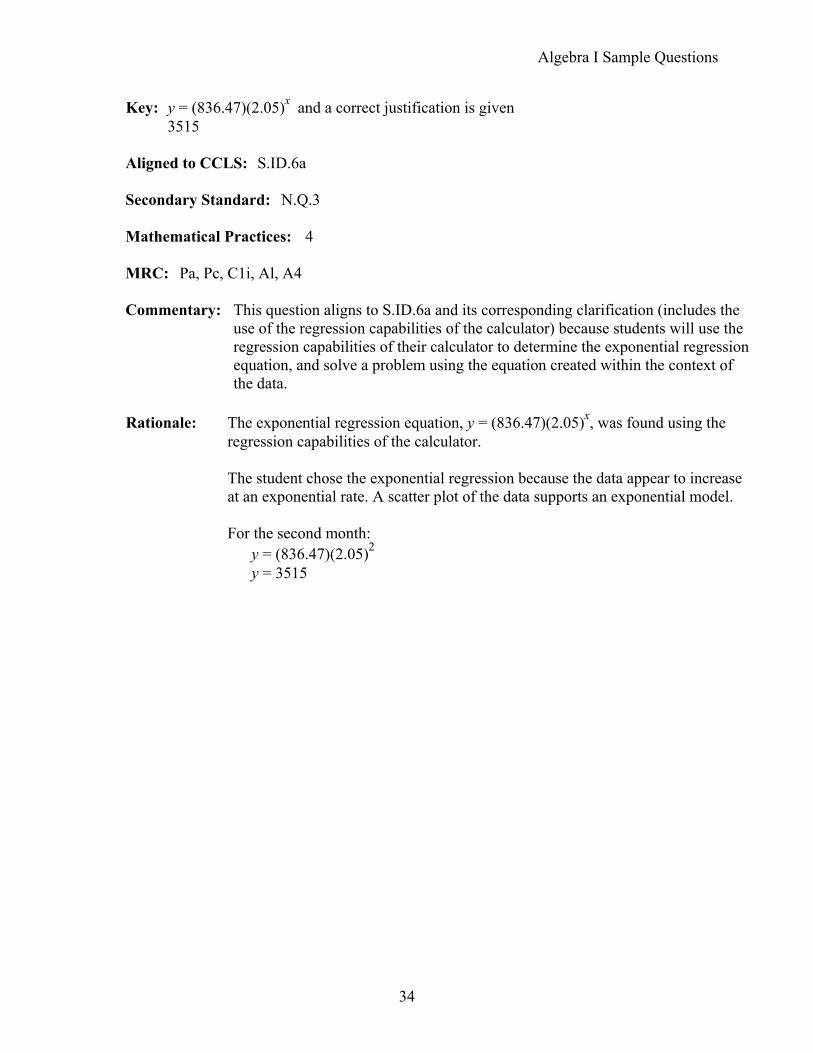
Key: y = (836.47)(2.05)x and a correct justification is given 3515
Aligned to CCLS: S.ID.6a
Secondary Standard: N.Q.3
Mathematical Practices: 4
MRC: Pa, Pc, C1i, Al, A4
Commentary: This question aligns to S.ID.6a and its corresponding clarification (includes the
use of the regression capabilities of the calculator) because students will use the regression capabilities of their calculator to determine the exponential regression equation, and solve a problem using the equation created within the context of the data.
Rationale: The exponential regression equation, y = (836.47)(2.05)x, was found using the
regression capabilities of the calculator.
The student chose the exponential regression because the data appear to increase at an exponential rate. A scatter plot of the data supports an exponential model.
For the second month:
y = (836.47)(2.05)2 y = 3515
Algebra I Sample Questions
35
Rubric:
[4] ( )2.05= 836.47y ,x a correct justification, and 3515 are written.
[3] Appropriate work is shown, but one computational or rounding error is made. or
[3] ( )2.05= 836.47y ,x but either the number of views or the justification is missing or incorrect.
or [3] The expression ( )2.05836.47 ,x a correct justification and 3515 are written.
[2] Appropriate work is shown, but two or more computational or rounding errors are made.
or [2] Appropriate work is shown, but one conceptual error is made.
or [2] ( )2.05= 836.47y x is written, but no further correct work is shown.
or [2] The expression ( )2.05836.47 x is written, but either the number of views or the justification
is missing or incorrect.
[1] Appropriate work is shown, but one conceptual error and one computational or rounding error are made.
or [1] The expression ( )2.05836.47 x is written, but no further correct work is shown.
or [1] 3515, but no further correct work is shown.
[0] A zero response is completely incorrect, irrelevant, or incoherent or is a correct response
that was obtained by an obviously incorrect procedure.
Algebra I Sample Questions
36
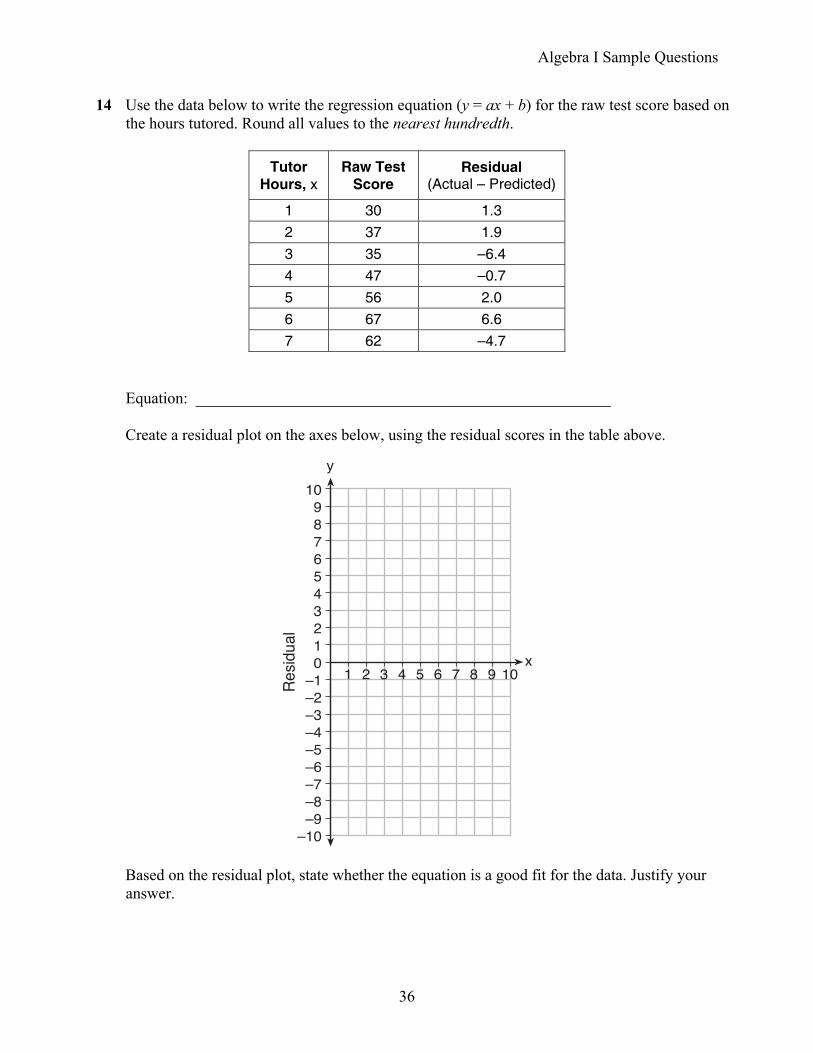
14 Use the data below to write the regression equation (y = ax + b) for the raw test score based on the hours tutored. Round all values to the nearest hundredth.
Tutor
Hours, x Raw Test
Score Residual
(Actual – Predicted)
1 30 1.3 2 37 1.9 3 35 –6.4 4 47 –0.7 5 56 2.0 6 67 6.6 7 62 –4.7
Equation: ____________________________________________________
Create a residual plot on the axes below, using the residual scores in the table above.
Based on the residual plot, state whether the equation is a good fit for the data. Justify your answer.

Algebra I Sample Questions
37
Key: y = 6.32x + 22.43 See the graph in the rationale. The equation is a good fit for the data with a correct justification.
Aligned to CCLS: S.ID.6b
Mathematical Practices: 4 and 5
MRC: Clb, C2f, C3b
Commentary: This question aligns to S.ID.6b because the residuals were plotted and analyzed
to assess the fit of the function. Students may have to calculate the residual using a calculator to create a residual plot.
Rationale: The regression equation y = 6.32x + 22.43 was found using the regression
capabilities of the calculator.
Based on the residual plot, the equation is a good fit for the data because the residual values are scattered without a pattern and are fairly evenly distributed above and below the x-axis.

Algebra I Sample Questions
38
Rubric:
[4] 6.32 22.43,y x= + a correct residual graph is drawn, and a correct justification is written.
[3] Appropriate work is shown, but one rounding or graphing error is made. or
[3] 6.32 22.43y x= + and a correct residual graph is drawn, but the justification is missing or is incorrect.
or [3] 6.32 22.43y x= + and a correct justification is written, but the residual graph is missing or is
incorrect. or
[3] The expression 6.32 22.43x + is written. A correct residual graph is drawn and a correct justification is written.
or [2] Appropriate work is shown, but two or more rounding or graphing errors are made.
or [2] Appropriate work is shown, but one conceptual error is made.
or [2] 6.32 22.43,y x= + but no further correct work is shown.
or [2] The expression 6.32 22.43x + is written and a correct residual graph is shown. The
justification is missing or is incorrect. or
[2] The expression 6.32 22.43x + is written and a correct justification is written. The residual graph is missing or is incorrect.
[1] Appropriate work is shown, but one conceptual error and one rounding or graphing
error are made. or
[1] A correct residual graph is drawn, but no further correct work is shown. or
[1] The expression 6.32 22.43x + is written, but no further correct work is shown.
[0] A zero response is completely incorrect, irrelevant, or incoherent or is a correct response that was obtained by an obviously incorrect procedure.

Algebra I Sample Questions
39
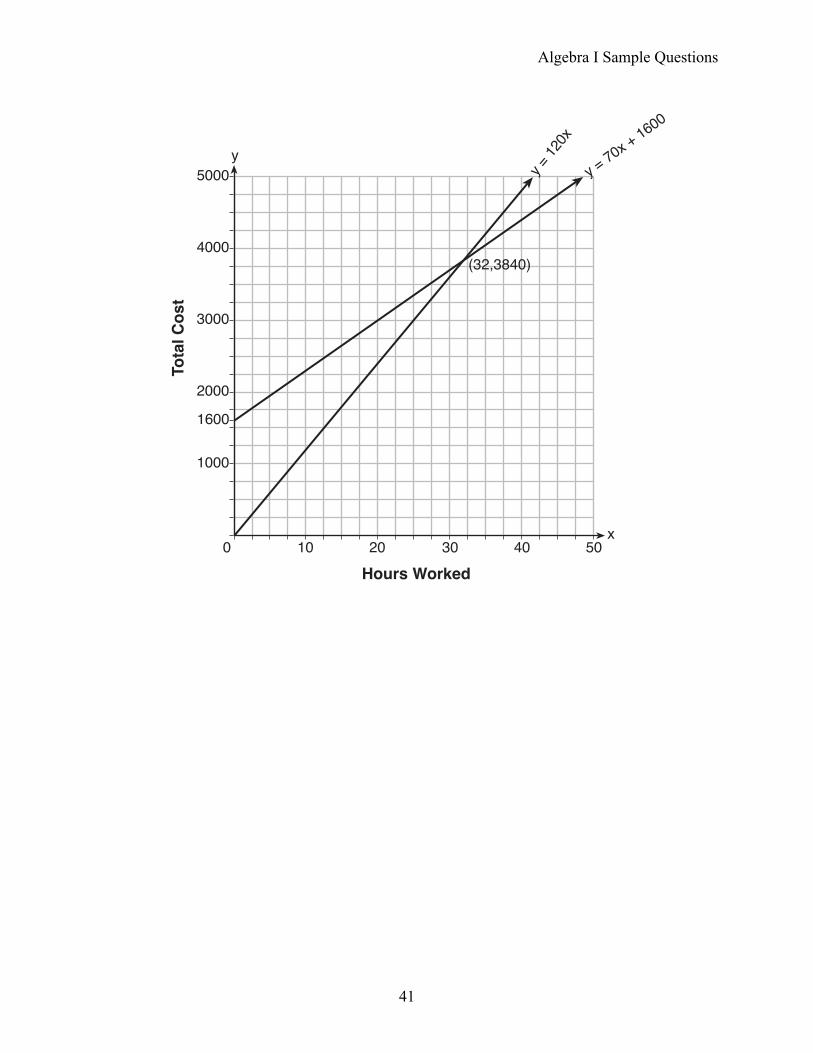
15 A local business was looking to hire a landscaper to work on their property. They narrowed their choices to two companies. Flourish Landscaping Company charges a flat rate of $120 per hour. Green Thumb Landscapers charges $70 per hour plus a $1600 equipment fee.
Write a system of equations representing how much each company charges.
Determine and state the number of hours that must be worked for the cost of each company to be the same. [The use of the grid below is optional.]
If it is estimated to take at least 35 hours to complete the job, which company will be less expensive? Justify your answer.

Algebra I Sample Questions
40
Key: y = 120x and y = 70x + 1600 32 hours Green Thumb Landscapers and a correct justification.
Aligned to CCLS: A.REI.6
Mathematical Practices: 4
MRC: Pa, Pj, C1k, A5
Commentary: The item aligns to A.REI.6 because it requires a student to write and solve
a system of linear equations in two variables.
( )( )
Flourish Landscaping Company120
Green Thumb Landscapers70 1600
120 70 160070 70
50 160050 50
32 hours
= 120 35 $4200
= 70 35 1600 $4050Green Thumb Landscapers would be less expensive.
y x
y x
x xx x
x
x
y
y
=
= +
= +− −
=
=
=
+ =
Rationale :
Additionally, as shown on the next page, a grid can be used to estimate the intersection of the two lines, while the exact point can be calculated. The graph also shows that Green Thumb Landscapers would be less expensive if the job takes at least 35 hours to complete.
Algebra I Sample Questions
41

Algebra I Sample Questions
42
Rubric:
[6] 120 and 70 1600y x y x= = + or equivalent, 32, and Green Thumb Landscapers with a correct justification written.
[5] Appropriate work is shown, but one computational or graphing error is made.
or [5] Appropriate work and justification are shown, but Green Thumb Landscapers is not stated.
or [5] Appropriate work is shown, but the justification is missing or incorrect.
[4] Appropriate work is shown, but two computational or graphing errors are made.
or [4] Appropriate work and justification are shown, but the number of hours is not stated or
stated incorrectly. or
[4] Appropriate work is shown, but Green Thumb Landscapers and justification are not stated.
[3] Appropriate work is shown, but three or more computational or graphing errors are made. or
[3] Appropriate work and justification are shown, but one conceptual error is made.
[2] Appropriate work is shown, but one conceptual error and one computational or graphing error are made.
or [2] Green Thumb Landscapers and an appropriate justification are stated, but no further
correct work is shown. or
[2] A correct system of equations is stated, but no further correct work is shown.
[1] Appropriate work is shown, but one conceptual error and two or more computational or graphing errors are made.
or [1] A correct graph is drawn, but no further correct work is shown.
or [1] 32, but no work is shown.
[0] Green Thumb Landscapers is stated, but no further correct work is shown.
or [0] A zero response is completely incorrect, irrelevant, or incoherent or is a correct response
that was obtained by an obviously incorrect procedure.