Alfalfa Yield and Quality Relationships Within Individual ... · PDF fileAlfalfa Yield and...
25
Geoff Brink, Marvin Hall, Glenn Shewmaker, Neal Martin, Dan Undersander, and Rick Walgenbach Alfalfa Yield and Quality Alfalfa Yield and Quality Relationships Within Relationships Within Individual Harvests Individual Harvests
Transcript of Alfalfa Yield and Quality Relationships Within Individual ... · PDF fileAlfalfa Yield and...
Geoff Brink, Marvin Hall, Glenn Shewmaker, Neal Martin,
Dan Undersander, and Rick Walgenbach
Alfalfa Yield and Quality Alfalfa Yield and Quality Relationships Within Relationships Within Individual HarvestsIndividual Harvests

May
122006
Our improving knowledge of the relationship between alfalfa yield and alfalfa quality has greatly influenced
when farmers harvest the crop.
June
101960
Cut first-crop alfalf
a todayCut first-cro
p alfalfa today

Consider this timeline of how alfalfa harvest management has evolved through the years.
Bud4Nutrient concentration**
1980’s
First flower4Nutrient yield*
1970’s
First flower3Nutrient yield*, persistence
1950-1960
Full flower1 – 2Persistence, yield
1920-1950
Growth stage at harvest
No. harvestsFarmer’sgoal
Time frame
Sheaffer, 1990* Total amount of nutrients harvested
** Favorable percentage of nutrients in the plant

We know that:We know that:When we give the plant more time to grow
before harvesting . . .. . . yield increases,. . . but at the expense of feed quality.
When we cut the plant early . . .. . . we capture a higher quality feed; . . . but this is at the expense of total yield.

This previous study clearly shows . . .This previous study clearly shows . . .
. . . you get a greater
monetary return (based on crop value) per acre
of alfalfa with higher yields.
Undersander, 2001

But yield and quality are opposed:But yield and quality are opposed:As yield increases (green bars) . . .. . . quality declines (orange line).
70
65
60
55
50
IVDM
D (%
)
Smith, 1960
Stage of growth at plant harvest
Quality measured as in-vitro dry
matter digestibility (IVDMD)
yield
quality
0.0
1.0
2.0
3.0
Vegeta
tive
Pre-bud
Bud1/1
0 bloom
Full bloom
Green pod
YIel
d(T
/A)

Previous studies on the tradePrevious studies on the trade--off off between yield and quality looked at between yield and quality looked at the crop on an annual basis. the crop on an annual basis.

We conducted a study to find out:We conducted a study to find out:
1. What is the trade-off between yield and quality during the growing season? Does it vary from one cutting to the next?

We conducted a study to find out:We conducted a study to find out:
2. When does harvest management have the greatest impact on potential milk production?

Study conducted at 3 locations:Study conducted at 3 locations:
South Central Idaho
Central Pennsylvania South Central Wisconsin
Study conducted on 2005 crop.

insect/disease resistance, fall dormancy 4, fast recovery
WL ResearchWL-346
lodging resistance, fall dormancy 4/5, fast recovery (reach late bud 3 - 5 days faster)
CalWestStandfast
disease resistance, fall dormancy 4, full season, fast recovery, traffic tolerance
ABIAffinity+Z
Advertised traitsSourceVariety
We planted 3 different varieties at We planted 3 different varieties at each location.each location.
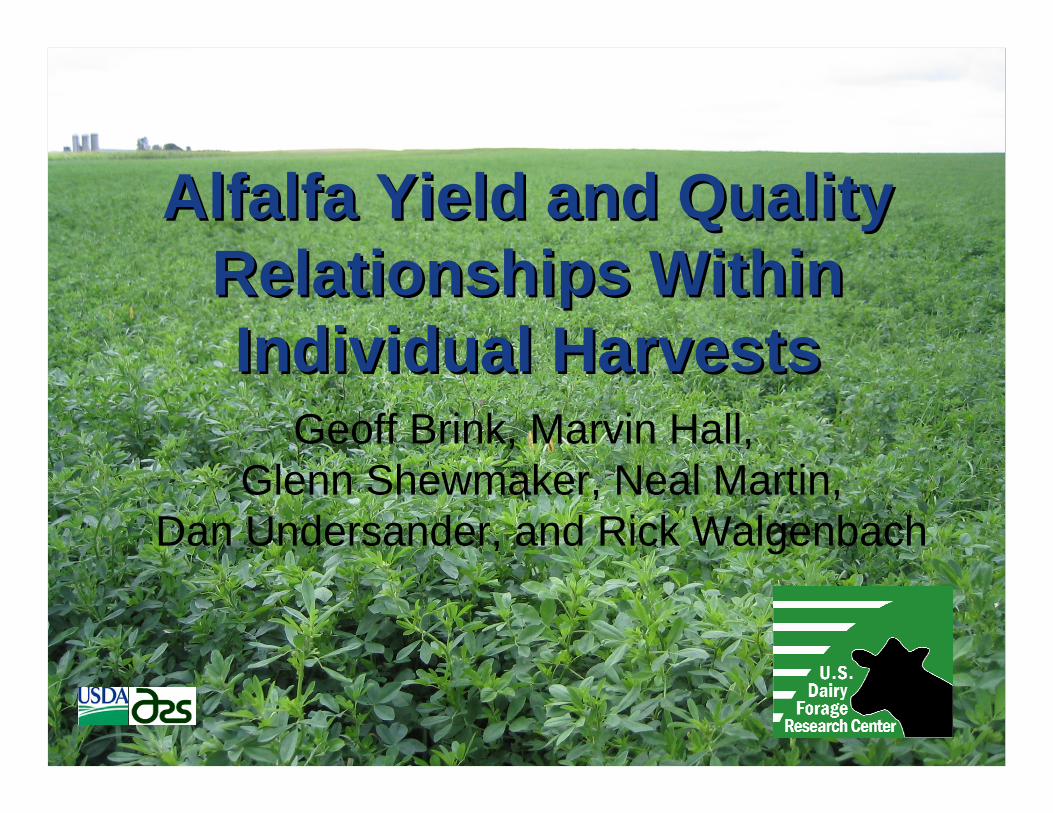
We set up a detailed cropping We set up a detailed cropping schedule at each location with:schedule at each location with:4 harvest periods
SpringEarly SummerLate SummerFall
And five cuts for each harvest period (each cut 5 days later than the first).

Spring
May 11 May 16 May 21 May 26 May 31
Fall
Sep 12 Sep 17 Sep 22 Sep 27 Oct 2
Early summer
Jun 18 Jun 23 Jun 28 Jul 3 Jul 8
Late summer
Aug 4 Aug 9 Aug 14 Aug 19 Aug 24
Cuttingdates
for eachharvestperiod

Harvest period
* No differences found among varieties
The results:The results:Yield was highest for the Springharvest period in all 3 locations.
0
1000
2000
3000
4000
Idaho Penn. Wisc.
Yiel
d (lb
/acr
e)
SpringEarly sum.Late sum.Fall
(Yield in this chart is for first cut in each
harvest period.)

NDFD for each harvest period **
* *No differences found among varieties
The results:The results:Quality* was highest for the Springharvest period for 2 of the 3 locations.
*Quality measured as Neutral
Detergent Fiber Digestibility
(NDFD) – the portion of the total
NDF that is actually digested.
40
45
50
55
60
Spring Earlysum.
Latesum.
Fall
Harvest period
ND
FD (%
)
IdahoPenn.Wisc.
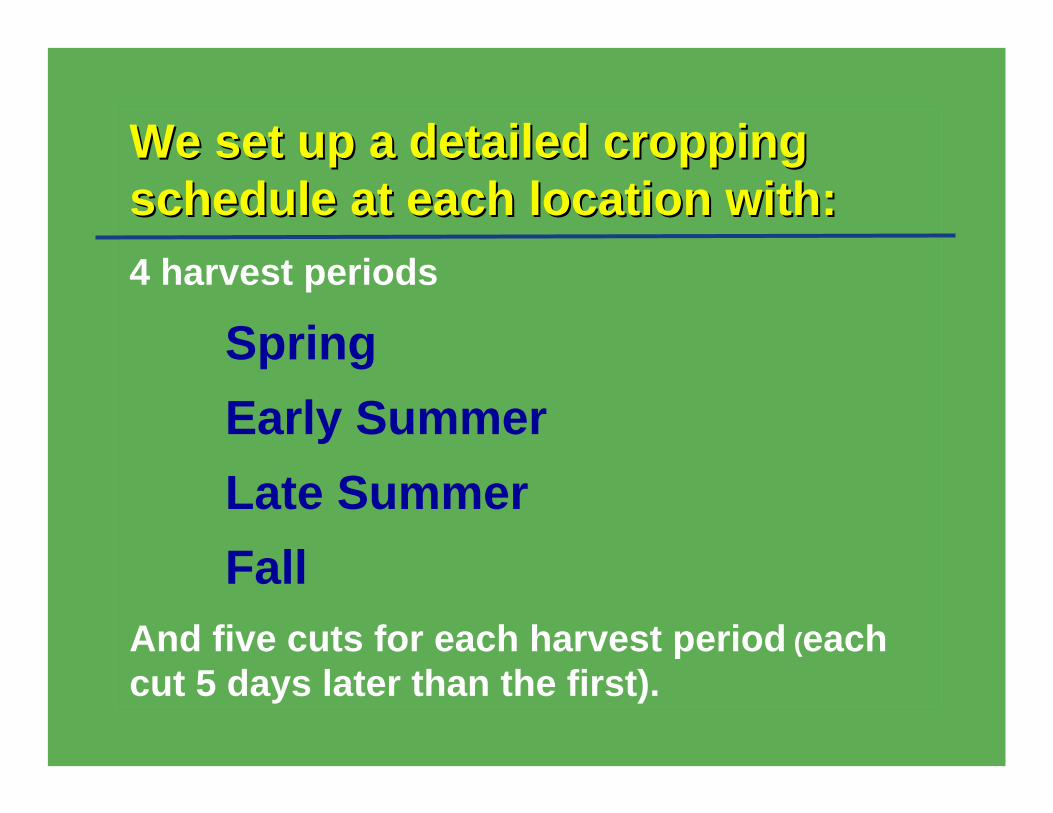
-2040
90100
25060
180Late summer
130290
WIPA
lb forage grown per dayHarvest period
-Fall
180Early summer
120Spring
ID
Rate of DM production after vegetative stage
The results:The results:In Idaho, forage production was dependent on and maximized under irrigation beginning in early summer.
In Pennsylvania and Wisconsin, the greatest rate of DM production occurred in the spring or early summer due to optimum temperatures and moisture.

- 0.4- 0.4
- 0.1- 0.2
- 0.6- 0.7
- 0.5Late summer
- 0.4- 0.2
WIPA
% NDFD change per dayHarvest period
-Fall
- 0.6Early summer
- 0.3Spring
ID
Rate of NDFD decline after vegetative stage
The results:The results:At all three locations, forage quality declined most rapidly in the early summer.
In Pennsylvania and Wisconsin, the decline in forage quality is slowest in late summer.

Milk2000
Another way to express the results is by using an index (Milk 2000) that combines forage yield and quality into a single term to estimate milk production.
Results are seen in the next 4 slides.
The results:The results:

Idaho
PennsylvaniaWisconsin
Milk per acre plateaus approximately 10 days after vegetative stage.
The results:The results: Spring harvestLbs. milk / acre vs. alfalfa maturity
Days after vegetative stage
Days after vegetative stage Days after vegetative stage
0
5000
10000
15000
20000
Veg 5 10 15 20
0
5000
10000
15000
20000
25000
Veg 5 10 15 200
5000
10000
15000
20000
Veg 5 10 15 20

Idaho
PennsylvaniaWisconsin
Milk/acre plateaus after 10 days, similar to spring harvest, in PA.Environments in ID and WI result in milk/acre increase due to increase in DM yield of crop.
The results:The results: Early summer harvestLbs. milk / acre vs. alfalfa maturity
Days after vegetative stage
Days after vegetative stageDays after vegetative stage0
5000
10000
15000
20000
Veg 5 10 15 200
5000
10000
Veg 5 10 15 20
0
5000
10000
15000
Veg 5 10 15 20
Idaho
PennsylvaniaWisconsin
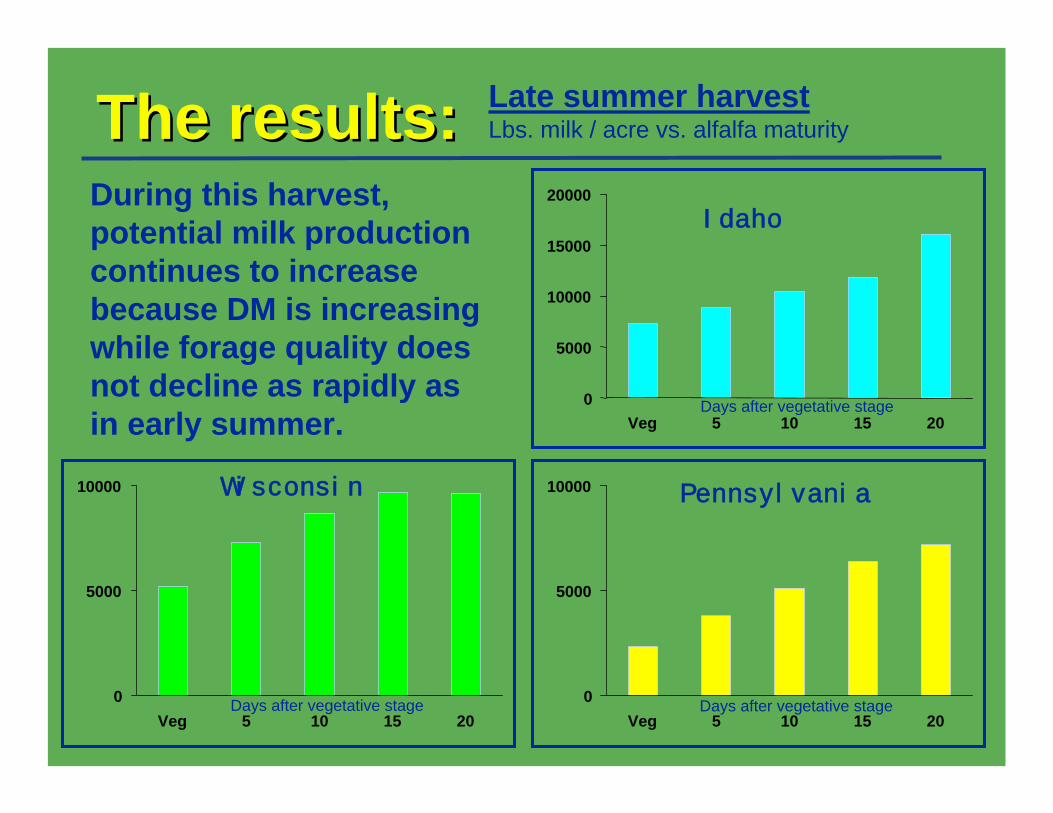
During this harvest, potential milk production continues to increase because DM is increasing while forage quality does not decline as rapidly as in early summer.
The results:The results: Late summer harvestLbs. milk / acre vs. alfalfa maturity
Days after vegetative stage
Days after vegetative stage Days after vegetative stage0
5000
10000
Veg 5 10 15 200
5000
10000
Veg 5 10 15 20
0
5000
10000
15000
20000
Veg 5 10 15 20

PennsylvaniaWisconsin
There was no fourth harvest in Idaho.
Potential milk production of alfalfa harvested in the fall is less predictable due to the relatively rapid decline in quality and the inconsistent effects of weather on yield.
The results:The results: Fall harvestLbs. milk / acre vs. alfalfa maturity
Days after vegetative stage Days after vegetative stage0
5000
10000
Veg 5 10 15 200
5000
Veg 5 10 15 20

SummarySummary1) Forage yield and quality are usually
highest in the spring.2) Under conventional management (no
irrigation), forage yield increases and forage quality declines most rapidly as alfalfa matures during the spring and early summer.

SummarySummary3) Harvesting within 10 days after
vegetative stage in the spring and early summer provides optimum milk production and dairy quality hay.
4) Harvest in late summer can be delayed because digestibility declines more slowly than in the spring and early summer..

This material courtesy of:
U.S. Dairy Forage Research CenterUSDA-Agricultural Research Service1925 Linden Dr. WestMadison, WI 53706608-890-0050Contact: [email protected]
http://ars.usda.gov/mwa/madison/dfrcMaterial may be copied and used for educational purposes.
Greener Horizons for Crops, Cows,
and Communities