Alex 2003 Quarterly Audit Summary Report - City of ... · Web viewDuring Q4FY17, the boilers...
67
Alexandria Arlington Resource Recovery Facility Fiscal Year 2017 Annual Operations Report August 2017 Prepared by: HDR Engineering, Inc. 5426 Bay Center Drive, Suite 400 Tampa, Florida 33609-3444
Transcript of Alex 2003 Quarterly Audit Summary Report - City of ... · Web viewDuring Q4FY17, the boilers...

Alexandria ArlingtonResource Recovery Facility
Fiscal Year 2017
Annual Operations Report
August 2017
Prepared by:HDR Engineering, Inc.
5426 Bay Center Drive, Suite 400Tampa, Florida 33609-3444

Table of ContentsSection No. Page No.
1.0 PURPOSE OF REPORT.......................................................................................42.0 EXECUTIVE SUMMARY.......................................................................................43.0 FACILITY INSPECTION AND RECORDS REVIEW.............................................64.0 FACILITY PERFORMANCE...............................................................................10
4.1 Utility and Reagent Consumptions............................................................25
4.2 Safety & Environmental Training...............................................................26
5.0 FACILITY MAINTENANCE.................................................................................285.1 Availability.................................................................................................28
5.2 Downtime Summary..................................................................................30
5.3 Facility Housekeeping...............................................................................31
6.0 ENVIRONMENTAL.............................................................................................326.1 Nitrogen Oxide Emissions.........................................................................32
6.2 Sulfur Dioxide Emissions..........................................................................32
6.3 Carbon Monoxide Emissions....................................................................33
6.4 Opacity......................................................................................................33
6.5 Daily Emissions Data................................................................................33
6.6 2017 Annual Stack Testing.......................................................................33
6.7 Ash System Compliance...........................................................................36
APPENDIX A FACILITY CEMS DATA..........................................................................38APPENDIX B PHOTOS.................................................................................................42
Front Cover Photos
Top: General Facility Photo from up EisenhowerMiddle: Administration Building Receptionist Area Lobby – Renovations CompleteBottom: SDA Hopper Nos. 2 and 3 from Economizer Deck
Alexandria/Arlington RRFAnnual Operations Report – Fiscal Year 2017 1 August 2017

List of TablesTable No. Page No. Table 1: Summary of Inspection Report Deficiencies.......................................................................................................................................8Table 2: Quarterly Performance Summaries..................................................................................................................................................18Table 3: Waste Delivery Classification...........................................................................................................................................................19Table 4: Facility Utility and Reagent Consumptions.......................................................................................................................................25Table 5: Quarterly Facility Unit Availabilities..................................................................................................................................................29Table 6: Boiler Downtime – Q4FY17..............................................................................................................................................................30Table 7: Turbine Generator Downtime – Q4FY17..........................................................................................................................................30Table 8: Facility Housekeeping Ratings – May 2017......................................................................................................................................31Table 9: Stack Test Results through 2017.....................................................................................................................................................35Table 10: Comparison of Statistical Results and Regulatory Thresholds for Metal Analytes.........................................................................36Table 11: Unit #1 Monthly Summary for Reportable Emissions Data.............................................................................................................39Table 12: Unit #2 Monthly Summary for Reportable Emissions Data.............................................................................................................40Table 13: Unit #3 Monthly Summary for Reportable Emissions Data..............................................................................................................41
List of ChartsChart No. Page No. Chart 1: Tons of Waste Processed.................................................................................................................................................................11Chart 2: Tons of Ash Produced per Ton of Waste Processed.........................................................................................................................12Chart 3: Ferrous Recovery Rate.....................................................................................................................................................................13Chart 4: Steam Production..............................................................................................................................................................................14Chart 5: 12-Month Rolling Steam Production..................................................................................................................................................15Chart 6: Steam Production Rate....................................................................................................................................................................16Chart 7: Calculated Waste Heating Value.......................................................................................................................................................17Chart 8: Cumulative Total Waste Delivery.....................................................................................................................................................20Chart 9: Gross Electrical Generation..............................................................................................................................................................20Chart 10: Gross Conversion Rate...................................................................................................................................................................21Chart 11: Net Conversion Rate.......................................................................................................................................................................22Chart 12: Net Conversion Rate.......................................................................................................................................................................23Chart 13: Gross Turbine Generator Conversion Rate.....................................................................................................................................24Chart 14: Net Turbine Generator Conversion Rate.........................................................................................................................................25Chart 15: Stack Test Results through 2017....................................................................................................................................................34Chart 16: Ash Toxicity Characteristic Leaching Procedure (TCLP) Results....................................................................................................36Chart 17: Quarterly Ash Test Results.............................................................................................................................................................37
List of Figures
Figure No. Page No. Figure 1: Ceiling panels deteriorated above Boiler Nos. 2 and 3 – New Deficiency......................................................................................43Figure 2: Pebble Lime Warning Sign deteriorated on SDA No. 3 Entrance Door – New Deficiency..............................................................43Figure 3: Fence falling over near Citizen’s Drop Roll-Off – New Deficiency...................................................................................................43Figure 4: Siding on north and east side of Facility dirty – New Deficiency.....................................................................................................43Figure 5: Viewport glass cracked on Boiler No. 3 Barn Door – New Deficiency.............................................................................................43Figure 6: Cooling Towers & Ash Trailer Canopy from SDA Deck No. 3.........................................................................................................43Figure 7: SDA No. 3 and Dolomitic Lime Silo.................................................................................................................................................44Figure 8: Scales and Facility Roadway from Turbine Generator Enclosure Roof...........................................................................................44Figure 9: SDA Hopper Nos. 2 and 3 from Economizer Deck.........................................................................................................................44Figure 10: Turbine Generator No. 2...............................................................................................................................................................44Figure 11: Ferrous Magnet............................................................................................................................................................................44Figure 12: Ammonia Storage Silo..................................................................................................................................................................44Figure 13: Cooling Tower and Stack..............................................................................................................................................................45Figure 14: White Goods Roll-off.....................................................................................................................................................................45Figure 15: Tipping Floor Entrance Road........................................................................................................................................................45Figure 16: Scales and Scale House................................................................................................................................................................45Figure 17: Citizen’s Drop off Roll-off..............................................................................................................................................................45Figure 18: South side of Facility from Eisenhower Sidewalk..........................................................................................................................45Figure 19: West side Roadway from Facility Entrance...................................................................................................................................46Figure 20: General Facility Photo from southeast up Eisenhower.................................................................................................................46Figure 21: TCLP Sampling in Progress..........................................................................................................................................................46Figure 22: Baghouse Aisle – No issues observed..........................................................................................................................................46Figure 23: SDA Hopper Double Dump Valve.................................................................................................................................................46Figure 24: Facility Upgrades – New Lighting, Floor Tiles, and Paint..............................................................................................................46Figure 25: Facility Upgrades – Covanta Break Room with New Floor Tiles and Paint...................................................................................47Figure 26: Facility Upgrades - New Concrete Slab at Facility Entrance.........................................................................................................47Figure 27: Facility Upgrades – Receptionist Area - New Lighting, Floor Tiles, Ceiling Tiles and Paint..........................................................47
Alexandria/Arlington RRFAnnual Operations Report – Fiscal Year 2017 2 August 2017

Figure 28: Facility Upgrades – New Conference Room just off Main Entrance..............................................................................................47Figure 29: Facility Upgrades – Receptionist Area – Alternate View...............................................................................................................47Figure 30: New LED Light Fixtures throughout Turbine Generator Enclosure...............................................................................................47
Definition of Abbreviations & Acronyms
Alexandria/Arlington RRFAnnual Operations Report – Fiscal Year 2017 3 August 2017

Alexandria/Arlington Waste-to-Energy FacilityAnnual Operations Report – Fiscal Year 2017
Alexandria/Arlington RRFAnnual Operations Report – Fiscal Year 2017 4 August 2017
Abbreviation/Acronym DefinitionAPC Air Pollution ControlApr AprilAug AugustAvg AverageBtu British thermal unitCAAI Covanta Alexandria Arlington, Inc.CEMS Continuous Emissions Monitoring SystemCO Carbon MonoxideDec DecemberECOM Emergency CommunicationsFeb FebruaryFMG Facility Monitoring GroupFY Fiscal Yeargal GallonGAT Guaranteed Annual TonnageHCl Hydrochloric (Hydrogen Chlorides)HDR HDR Engineering IncHHV Estimated Waste Heating Value (Btu/lb)ID Induced DraftJan JanuaryJul JulyJun Juneklbs Kilo-pounds (1,000 lbs)kWhr Kilowatt hours (1,000 watt-hours)lbs PoundsLOA Letter of AgreementMar MarchMax MaximumMay MayMin MinimumMSW Municipal Solid WasteMWhr Megawatt hoursNo NumberNOV Notice of ViolationNov NovemberNOx Nitrogen OxideOct OctoberOSHA Occupational Safety and Health AdministrationPDS Potomac Disposal Servicesppm Parts per millionppmdv Parts per million dry volumePSD Prevention of Significant DeteriorationQ1 First QuarterQ2 Second QuarterQ3 Third QuarterQ4 Fourth QuarterRE Reportable ExemptRNE Reportable Non-ExemptSDA Spray Dryer AbsorberSep SeptemberSO2 Sulfur DioxideTCLP Toxicity Characteristic Leaching ProcedureVADEQ Virginia Department of Environmental QualityWL Warning Letteryr YearYTD Year to date

1.0 Purpose of Report
HDR Engineering, Inc. (HDR) was authorized by the Facility Monitoring Group
(FMG) to conduct quarterly inspections and provide quarterly reports regarding
the operation and maintenance of the Covanta Alexandria/Arlington Waste-to-
Energy Facility (Facility) for the 2017 calendar year. This report is prepared for
the fourth quarter of the 2017 fiscal year and summarizes Facility operations
between April 1, 2017 and June 30, 2017, as well as the entire fiscal year. This
report identifies the fiscal year beginning on July 1, 2016 as FY17 and the
quarter beginning on April 1, 2017 as Q4FY17.
This report is based upon HDR’s experience in the waste-to-energy industry,
upon site observation visits and previous reports provided by HDR, and upon
data provided by Covanta Alexandria / Arlington, Inc. (CAAI), the Facility owner
and operator.
2.0 Executive Summary
CAAI operated the Facility in an acceptable manner and in accordance with
established waste-to-energy industry practices during Q4FY17. The operation of
the Facility, maintenance, safety, and overall cleanliness continue to be above
average. Environmental performance was excellent with no reportable
environmental excursions throughout the quarter. Note that as of June 30, 2017,
the CAAI Facility has operated 1,296 days without an environmental excursion.
During Q4FY17, the boilers experienced four (4) instances of unscheduled
downtime totaling 52.1 hours, and the turbine generators experienced no
unscheduled downtime. Boiler No. 2 experienced one (1) instance of scheduled
downtime totaling 17.8 hours for routine cleaning during Q4FY17. During the
quarter, the boilers experienced no standby time, and Turbine Generator No. 2
experienced 7.3 hours of standby time while Boiler No. 2 was down. Note that
standby time is not factored into overall availability. A detailed listing of
downtime is provided in Section 5.2 of this report.
Alexandria/Arlington RRFAnnual Operations Report – Fiscal Year 2017 5 August 2017

Average waste processed during the quarter was 1,022.2 tons per day, or
104.8% of nominal facility capacity. Waste deliveries averaged 1,036.4 tons per
day, which is 1.4% higher than the burn rate. The capacity utilization of 104.8%
is comparable to that of mature, well run waste to energy facilities.
For FY17, average waste processed was 957.6 tons per day, or 98.2% of
nominal facility capacity of 975 tons per day. Waste deliveries averaged 955.1
tons per day, which is 0.3% less than the annual burn rate. The annual capacity
utilization of 98.2% compares very favorably to industry averages.
Performance trends for various measurements are presented in Section 4. In
general, the Facility continues to demonstrate reasonable consistency in month
to month performance throughout the most recent three-year period tracked for
detailed comparisons.
During the quarter, MSW processed slightly increased (0.7%) from the
corresponding quarter in FY16; steam production increased (1.1%), and
electricity generated (gross) increased (0.9%) from the corresponding quarter in
FY16. The increase in steam generation is attributable to the increase (1.4%) in
waste heating value, offset by more boiler downtime (14.4 additional hours). The
increase in electricity generated (gross) in Q4FY17, is attributable to higher
steam production, offset by slightly more downtime (0.6 additional hours)
experienced by the turbine generators.
During FY17, MSW processed slightly decreased 0.1% from FY16; steam
production slightly increased 0.1%, and electricity generated (gross) increased
1.5% compared to FY16. The increase in steam generation was attributable to
the increase (1.8%) in the calculated average waste heating value, offset by
more (117.3 additional, hours) scheduled, unscheduled, and standby downtime
experienced by the boilers. The increase in gross electrical generation in FY17
as compared to FY16 is attributable to the increase in steam production, offset by
more (173.0 additional hours) scheduled, unscheduled, and standby downtime
experienced by the turbine generators. Also note that 2016 was a Leap Year
Alexandria/Arlington RRFAnnual Operations Report – Fiscal Year 2017 6 August 2017

and FY16 had an additional day of operations, when compared to the FY17.
This negatively biases processed tonnage, steam production, and electrical
generation when comparing FY17 to FY16. CAAI continued to throttle back the
boiler steam load as necessary in FY17 to stay below the steam production limit.
3.0 Facility Inspection and Records Review
In May 2017, HDR met with the Facility management and other plant personnel
to discuss Facility operations and maintenance, acquire data and reports,
perform an independent visual inspection of the operating Facility, photograph
areas of interest, and perform a review of recent Facility activity. This visit was
coordinated with the scheduled FMG meeting. At the time of the inspection,
HDR reviewed CAAI records, discussed performance issues with CAAI staff, and
provided a verbal report and performance statistics at the May 2017 FMG
meeting. HDR maintains a running tabulation of the status of corrective actions
and plant performance trends. CAAI provides the following documents for each
month:
Facility Monthly Operating Reports Monthly Continuous Emissions Monitoring System (CEMS) Reports
Table 1 summarizes maintenance, repair, and plant condition issues reported
during this and prior reporting periods. An “A” indicates an issue of the highest
priority and worthy of immediate attention. Such items are usually safety or
operability issues. A “B” indicates that the issue needs to be dealt with as quickly
as possible, but is not urgent. These items will usually result in a process
improvement or will help avoid future “urgent” issues. A “C” indicates that the
issue should be dealt with at the earliest convenience, but is not a priority issue.
This category might include issues related to aesthetics, non-urgent
maintenance, or housekeeping improvements which are not safety related.
Note that HDR inspections are generally performed while equipment is operating,
and are not intended to address the internal condition, performance or life
Alexandria/Arlington RRFAnnual Operations Report – Fiscal Year 2017 7 August 2017

expectancy of mechanical, electrical and electronic equipment and structures.
HDR inspections are only performed quarterly, generally representing findings on
the day of the inspection. CAAI is responsible, without limitation, for operations,
maintenance, environmental performance and safety and should not rely on HDR
observations or inspection reports which are overviews of Facility external
conditions only.
Alexandria/Arlington RRFAnnual Operations Report – Fiscal Year 2017 8 August 2017

Table 1: Summary of Inspection Report Deficiencies*A is highest priority & demands immediate attention: B needs attention, but is not urgent; C can be addressed at earliest opportunity & is not urgent.
Item No. Inspection Report Deficiencies Issue Reported Priority* HDR Recommendation Status Open /
Closed
1
Corrosion on ceiling panels in Turbine Generator Enclosure
August 2014 C
Sand, Prime, Paint and Preserve, and replace deteriorated panels as necessary
HDR observed the corroded/deteriorated sections had been primed, but no panels were replaced. CAAI reports that it plans to replace panels in 1 to 2 years.
Open
2
Deteriorated purlin east wall in Tipping Floor Enclosure
November 2014 C
Replace deteriorated purlin CAAI reports that it will replace sections of the east wall of the Tipping Floor Enclosure as a 2016 Budget Item.
Open
3 Induced Draft Fan No. 1 Lagging deteriorated, west side of CEMS Enclosure
May 2015 C Replace deteriorated Induced Draft Fan Lagging Status Unchanged Open
4 Pot hole, southeast corner of Ash Trailer Canopy August 2015 C Repair road surface Status Unchanged Open
5 Chemical storage container deteriorated, north of Main Vibrating Pan, at ground elevation
February 2016 C Replace storage container Complete Closed
6 Underside of grating deteriorated, upper elevations of all three economizers
August 2016 C Replace economizer grating in upper elevations Status Unchanged Open
7 Pavement spider-cracking at Tipping Floor Entrance November 2016 C Resurface section of pavement at Tipping Floor Entrance Status Unchanged Open
8 Concrete slab damaged that Citizen’s Drop-off Roll-off is on
November 2016 C Repair concrete slab Status Unchanged Open
9 Pothole where Tipping Floor Exit Road enters Eisenhower Avenue
November 2016 C Repair pothole Complete Closed
10Corrosion on Scale House
November 2016 CConduct proper painting preservation measures on corroded spots of Scale House
Status Unchanged Open
11 Housing Damaged of Self Contained Breathing Apparatus (SCBA) – North Charging Floor Entrance
February 2017 C Replace SCBA Enclosure Complete Closed
12 Tipping Floor Center Bay concrete apron eroded and rebar exposed
February 2017 C Resurface eroded section of Tipping Floor near refuse pit Status Unchanged Open
Alexandria/Arlington RRFAnnual Operations Report – Fiscal Year 2017 9 August 2017
Item No. Inspection Report Deficiencies Issue Reported Priority* HDR Recommendation Status Open /
Closed
13Ceiling panels deteriorated above Boiler Nos. 2 and 3–– See Figure 1 (Appendix B) May 2017 C
Replace deteriorated ceiling tiles and conduct painting preservation measures
Status Unchanged Open
14 Pebble Lime Warning Sign deteriorated on SDA No. 3 Entrance Door –– See Figure 2 (Appendix B)
May 2017 A Replace sign Status Unchanged Open
15 Fence falling over near Citizen’s Drop Roll-Off –– See Figure 3 (Appendix B)
May 2017 C Re-align and secure fence Status Unchanged Open
16 Siding on north and east side of Facility dirty –– See Figure 4 (Appendix B)
May 2017 C Pressure Wash Siding Status Unchanged Open
17 Viewport glass cracked on Boiler No. 3 Barn Door –– See Figure 5 (Appendix B)
May 2017 A Replace viewport glass Status Unchanged Open
Alexandria/Arlington RRFAnnual Operations Report – Fiscal Year 2017 10 August 2017

4.0 Facility Performance
Monthly operating data provided by CAAI indicates that 93,024 tons of MSW
were processed during Q4FY17, and a total of 94,315 tons of MSW including
4,842 tons of Special Handling Waste were received. Total ash production
during the quarter was 18,451 tons, which represents 19.8% of the waste
processed by weight. The average uncorrected steam production rate for
Q4FY17 was 3.04 tonssteam/tonwaste, which is higher (1.8%) than the corresponding
quarter in FY16. The increase in this metric is attributable to the 1.4% increase
in the average waste heating value (HHV) calculated by CAAI.
On an annual basis, 349,516 tons of MSW were processed during FY17, and a
total of 348,616 tons of MSW and 13,411 tons of Special Handling Waste were
received. Total ash production during FY17 was 71,208 tons, which represents
20.4% of the waste processed. The average uncorrected steam production rate
for FY17 was 3.0 tonssteam/tonwaste, and slightly higher (0.2%) than the
corresponding period last year. The slight increase in this metric is attributable to
the increase (1.8%) in the calculated average waste heating value that was
experienced in FY17, as compared to FY16.
Alexandria/Arlington RRF
Annual Operations Report – August 2017 11 August 2017

Chart 1: Tons of Waste Processed
Chart 1 illustrates that Q4FY17 waste processed was slightly lower (0.7%) than
the corresponding quarter, Q4FY16.
CAAI reported that 457 tipping floor/MSW internal inspections were conducted
during the quarter and 10 notices of violation (NOVs) were issued to haulers for
the following issues:
April 2017 – Nine (9) NOVs were issued for:
o Two (2) NOVs for trash on trucks
o One (1) NOV for excessive metal in the load
o One (1) NOV for jumping in line
o Five (5) for blocking intersection to Tipping Floor
May 2017 – No NOVs issued
June 2017 – One (1) NOV issued for excessive metal in the load
Alexandria/Arlington RRF
Annual Operations Report – August 2017 12 August 2017

Chart 2: Tons of Ash Produced per Ton of Waste Processed
Chart 2 illustrates that the average ash production rate in Q4FY17 was slightly
lower (0.2%) at 19.8% of processed waste, compared to the corresponding
quarter in FY16 when the rate was 20.0%.
The annual ash production rate for FY17 was identical to FY16 at 20.4%. This
result compares very favorably with industry averages which are generally in the
range of 25-28%.
Alexandria/Arlington RRF
Annual Operations Report – August 2017 13 August 2017

Chart 3: Ferrous Recovery Rate
Chart 3 depicts the monthly ferrous metal recovery rate as a percentage of
processed MSW tonnage. In Q4FY17, 2,805 tons of ferrous metals were
recovered, which is 1.9% higher than the corresponding quarter in FY16 and
equivalent to 3.0% of processed waste.
In FY17, 9,036 tons of ferrous metals were recovered, which is 5.6% lower than
FY16 and equivalent to 2.6% of processed waste. CAAI attributes the significant
decline to an increase in recycling rates resulting in less metal in the MSW.
CAAI indicated that in late March 2017, it made adjustments to the length of the
main pan to decrease the gap between the pan and the ferrous magnet. The
adjustments to the pan resulted in an increased trend in ferrous recovery for the
last quarter of FY17.
Alexandria/Arlington RRF
Annual Operations Report – August 2017 14 August 2017

Chart 4: Steam Production
In Chart 4, the total steam production for Q4FY17 was 566,152 klbs., and higher
(1.1%) than the corresponding quarter in FY16. The increase in steam
generation is attributable to the increase (1.4%) in waste heating value, offset by
more boiler downtime (14.4 additional hours).
Annual steam production for FY17 was 2,120,115 klbs., or 0.1% higher than
FY16 which produced 2,118,125 klbs. The increase in steam generation was
attributable to the increase (1.8%) in the calculated average waste heating value,
offset by more (117.3 additional, hours) scheduled, unscheduled, and standby
downtime experienced by the boilers.
Alexandria/Arlington RRF
Annual Operations Report – August 2017 15 August 2017

Chart 5: 12-Month Rolling Steam Production
Chart 5 depicts the 12-month rolling steam production total for the period ending
in June 2017. According to the Title V permit, the annual steam production for
the Facility shall not exceed 1,170,400 tons on the basis of an average value of
3.34 lbs of steam per lb of MSW processed, calculated monthly as the sum of
each consecutive 12 month period. The Facility was in compliance with the 12-
month rolling steam production total every month in FY17. The 12-month rolling
total for steam production ending in June 2017 was 1,167,383 tons which is
99.7% of the limit. Chart 5 clearly shows that Facility throughput, and in turn,
steam and electricity production are being throttled to stay ever so slightly below
the steam production limit nearly every month.
Alexandria/Arlington RRF
Annual Operations Report – August 2017 16 August 2017

Chart 6: Steam Production Rate
\
In Chart 6, the conversion of raw waste tonnages into “reference tons” is another
way of analyzing steam production, and helps to determine whether changes are
related to boiler performance or to fuel issues. “Reference tons” are adjusted to
account for the calculated average fuel heating value, so that lower Btu fuel raw
tonnages are adjusted upwards and vice versa. In Q4FY17, this metric tracked
slightly higher (0.3%) at 2.77 tonssteam/tonref,, compared to the corresponding
quarter in FY16. This trend shows a very slight improvement of boiler
performance compared to the prior three (3) quarters in FY17, but still
significantly lower than two (2) years ago.
The annual steam production rate for FY17 was 2.75 tonssteam/tonref, which is
lower (1.6%) than FY16. This chart shows that for the last first eight (8) months
of FY17, a downtrend was experienced in the normalized steam production rate
compared to the same period during the prior two (2) years. Although an
improvement was experienced during Q4FY17, this trend should continue to be
monitored to determine if it is indicative of poorer boiler performance, an
aberration during scheduled outage periods, or some other currently unexplained
cause.
Alexandria/Arlington RRF
Annual Operations Report – August 2017 17 August 2017

Chart 7: Calculated Waste Heating Value
Chart 7 illustrates that Q4FY17 calculated average waste heating value was
higher (1.4%) at 4,946 Btu/lb than the corresponding quarter Q4FY16, which
averaged 4,877 Btu/lb.
In FY17, the annual average waste heating value was higher (1.8%) at 4,959
Btu/lb than FY16, which averaged 4,873 Btu/lb. Note that the FY17 annual
average heating value of 4,959 Btu/lb is 10.2% higher than the facility design
value of 4,500 Btu/lb. This disparity in average heating value of the fuel
compared to the original design value established in the 1980’s is one of the
reasons that the annual capacity utilization is in excess of 100% and
considerably higher than similar facilities that generally operate in the 90% range
(see Section 2.0).
Alexandria/Arlington RRF
Annual Operations Report – August 2017 18 August 2017

Table 2: Quarterly Performance Summaries
MonthWaste
Processed (tons)
Waste Diverted
(tons)
Ash Shipped
(tons)
Special Handling
(Supplemental)(tons)
Ferrous Recovered
(tons)
Steam Produced
(klbs)
Net Electrical
Generation(MWhr)
Q4FY15
Quarterly Totals 93,695 0 18,870 1,842 2,541 559,721 36,175
April -15 30,646 0 6,182 613 848 179,434 12,784May -15 31,160 0 6,701 531 889 195,150 11,786June - 15 31,889 0 5,987 698 804 185,137 11,605
Q4FY16
Quarterly Totals 93,652 0 18,703 2,262 2,753 559,883 40,207
April -16 30,356 0 6,289 996 932 188,882 13,853May -16 31,530 0 6,380 605 936 189,239 13,541June – 16 31,766 0 6,034 661 885 181,762 12,813
Q4FY17
Quarterly Totals 93,024 0 18,451 4,842 2,805 566,152 40,625
April -17 30,423 0 6,255 1,420 966 189,608 13,778May -17 31,350 0 6,285 1,705 945 191,859 13,849June - 17 31,251 0 5,911 1,717 894 184,685 12,998
FY17 Totals 349,516 0 71,208 13,411 9,036 2,120,115 150,935FY16 Totals 349,881 0 71,401 8,567 9,571 2,118,125 148,529FY15 Totals 348,686 0 71,019 5,413 9,864 2,109,442 145,085
Table 2 presents the production data provided to HDR by CAAI for Q4FY17 on both a monthly and quarterly basis. For purposes of comparison, data for Q4FY15 and Q4FY16 are also shown, as well as FY15, FY16 and FY17 totals.In comparing quarterly totals, the data shows:
Less waste was processed in Q4FY17 than Q4FY16 and Q4FY15 More steam was generated in Q4FY17 than Q4FY16 and Q4FY15 More electricity was generated in Q4FY17 than Q4FY16 and Q4FY15 Significantly more supplemental waste was received in Q4FY17 than
Q4FY16 and Q4FY15.Please note that the total steam generation figures presented in Table 2 do not correlate with the annual steam production limit from the Facility Permit; such limits apply on a rolling average monthly basis, and not a fiscal year basis. It is also worth noting that the quantity of waste processed during Q4FY17 continues to be limited by the steam production permit restrictions (refer to Chart 5).
Alexandria/Arlington RRF
Annual Operations Report – August 2017 19 August 2017

Table 3: Waste Delivery Classification
Jul Aug Sep Oct Nov Dec Jan Feb Mar Apr May Jun Totals % of Total
FY13
Jurisdiction Waste 19,413 18,357 16,632 17,625 18,838 16,195 - - - - - - 107,058 30.76%Spot Waste tons 10,516 11,326 10,610 10,317 9,330 9,558 - - - - - - 61,656 17.72%
City Waste - - - - - - 1,683(1) 1,287 1,444 2,382 2,286 1,919 11,000 3.16%County Waste - - - - - - 2,442(1) 2,100 2,372 3,381 3,932 3,309 17,536 5.04%
Municipal Solid Waste - - - - - - 25,019(1) 23,637 21,661 27,066 25,794 24,930 148,107 42.56%Supplemental Waste 151 11 80 25 234 405 363 365 76 403 281 271 2,665 0.77%
MSW Totals 29,928 29,683 27,241 27,942 28,167 25,753 29,507 27,388 25,552 33,231 32,293 30,429 348,022 100.00%Jul Aug Sep Oct Nov Dec Jan Feb Mar Apr May Jun Totals % of Total
FY14
City Waste 2,065 1,693 1,702 1,924 1,566 1,780 1,529 1,231 1,556 2,256 2,203 1,883 21,389 6.11%County Waste 3,459 3,079 2,784 3,091 2,707 2,802 2,568 1,957 2,272 3,326 3,987 3,387 35,419 10.12%
Municipal Solid Waste 26,167 23,604 22,034 23,354 21,879 25,531 23,869 22,523 23,198 25,414 27,206 24,812 289,590 82.75%Supplemental Waste 546 676 248 410 188 268 275 192 231 253 151 110 3,548 1.01%
MSW Totals 32,237 29,053 26,768 28,779 26,340 30,380 28,241 25,903 27,256 31,249 33,546 30,193 349,946 100.00%Jul Aug Sep Oct Nov Dec Jan Feb Mar Apr May Jun Totals % of Total
FY15
City Waste 1,814 1,497 1,699 1,737 1,518 1,770 1,411 1,209 1,648 2,155 2,059 2,045 20,562 5.91%County Waste 3,297 2,868 2,973 3,095 2,508 2,852 2,358 1,833 2,411 3,269 3,652 3,572 34,687 9.96%
Municipal Solid Waste 26,661 24,466 21,887 21,241 21,678 27,906 24,611 20,915 24,094 25,189 23,126 25,667 287,442 82.57%Supplemental Waste 141 275 329 521 764 529 389 351 272 613 531 698 5,413 1.55%
MSW Totals 31,913 29,106 26,888 26,595 26,468 33,057 28,769 24,308 28,424 31,225 29,369 31,982 348,105 100.00%Jul Aug Sep Oct Nov Dec Jan Feb Mar Apr May Jun Totals % of Total
FY16
City Waste 1,960 1,563 1,723 1,645 1,685 1,872 1,147 1,619 1,811 2,024 1,950 2,220 21,219 6.03%County Waste 3,627 2,880 2,832 2,869 2,682 2,891 2,025 2,389 2,694 2,406 2,508 2,661 32,465 9.22%
Municipal Solid Waste 27,933 22,999 22,552 22,850 20,679 26,138 22,632 22,781 22,935 24,388 26,561 27,355 289,801 82.32%Supplemental Waste 676 427 771 684 676 787 642 850 792 996 605 661 8,565 2.43%
MSW Totals 34,196 27,869 27,878 28,047 25,722 31,687 26,446 27,639 28,232 29,814 31,623 32,896 352,049 100.00%Jul Aug Sep Oct Nov Dec Jan Feb Mar Apr May Jun Totals % of Total
FY17
City Waste 1,678 1,836 1,668 1,722 1,817 1,708 1,597 1,452 1,604 1,882 2,170 2,002 21,136 6.06%County Waste 2,386 2,469 2,370 2,184 2,321 2,289 2,287 2,016 2,517 2,371 2,877 2,889 28,976 8.31%
Municipal Solid Waste 24,862 26,976 22,760 22,110 21,598 25,996 24,218 20,888 20,401 25,004 26,143 24,135 285,091 81.78%Supplemental Waste 504 642 734 926 941 1,036 1,083 1,413 1,291 1,420 1,705 1,717 13,412 3.85%
MSW Totals 29,430 31,922 27,532 26,941 26,677 31,030 29,185 25,769 25,814 30,677 32,895 30,743 348,615 100.00%Note (1): Beginning January 2013, the method in which waste was classified was modified as compared to prior periods due to change in contractual obligations and plant ownership
Alexandria/Arlington RRFAnnual Operations Report – Fiscal Year 2017 20 August 2017

Chart 8: Cumulative Total Waste Delivery
As depicted in Table 3 and Chart 8, for the quarter ending in March 2017;
cumulative total waste delivery was 1.0% less compared to the same period in
FY16.
Chart 9: Gross Electrical Generation
Alexandria/Arlington RRF
Annual Operations Report – Fiscal Year 2017 21 August 2017

During Q4FY17, the Facility generated 47,923 MWhrs (gross) of electricity
compared to Q4FY16 generation of 47,521 MWhrs (gross), a 0.9% increase.
The increase in electricity generated (gross) in Q4FY17, is attributable to higher
steam production, offset by slightly more downtime (0.6 additional hours)
experienced by the turbine generators. Note that the sharp spikes depicted in
Chart Nos. 10 through 14 for the months of May and June 2015 are a result of
significant downtime (424.7 hours) experienced by Turbine Generator No. 1 to
repair an exciter failure.
During FY17, the Facility generated 179,556 MWhrs (gross) of electricity
compared to the FY16 generation of 176,967, a 1.5% increase. The increase in
gross electrical generation in FY17 as compared to FY16 is attributable to the
increase in steam production, offset by more (173.0 additional hours) scheduled,
unscheduled, and standby downtime experienced by the turbine generators.
Also note that 2016 was a Leap Year and as such had an additional day of
operations, when compared to the FY17. This slightly biases negatively
processed tonnage, steam production, and electrical generation when comparing
FY17 to FY16.
Chart 10: Gross Conversion Rate
Alexandria/Arlington RRF
Annual Operations Report – Fiscal Year 2017 22 August 2017

As shown in Chart 10, the average gross electrical generation per reference ton
of refuse processed during Q4FY17 was 469 kWhr, which is identical to the
corresponding quarter in FY16. Since this calculated value uses reference or
normalized tonnages of waste, it should cancel the effect of MSW heating value
(Btu content) variability.
During FY17, the average gross electrical generation per reference ton of refuse
processed was 466 kWhr, which is slightly lower (0.3%) than FY16.
Chart 11: Net Conversion Rate
Chart 11 depicts the normalized net power (gross minus in-house usage)
generation history. In Q4FY17, the average net electrical generation per
reference ton was 397 kWhr, which is 0.3% higher than the corresponding
quarter in FY16.
In FY17, the average net electrical generation per reference ton was 391 kWhr,
which is 0.2% lower than FY16.
Alexandria/Arlington RRF
Annual Operations Report – Fiscal Year 2017 23 August 2017

Alexandria/Arlington RRF
Annual Operations Report – Fiscal Year 2017 24 August 2017

Chart 12: Net Conversion Rate
Chart 12 depicts the net power generation per processed ton. The net electrical
generation per processed ton in Q4FY17 was 437 kWhr, which is 1.7% higher
than the corresponding quarter in FY16, is attributable to higher steam
production, offset by slightly more downtime (0.6 additional hours) experienced
by the turbine generators.
In FY17, the net electrical generation per processed ton was 432 kWhr which is
1.6% higher than FY16. The increase is attributable to the increase in steam
production, offset by more (173.0 additional hours) scheduled, unscheduled, and
standby downtime experienced by the turbine generators.
Alexandria/Arlington RRF
Annual Operations Report – Fiscal Year 2017 25 August 2017

Chart 13: Gross Turbine Generator Conversion Rate
Charts 13 and 14 illustrate the quantities of steam required to generate one (1)
kWhr of electricity, gross and net respectively. This measure is a turbine
generator performance indicator, where lower steam rates indicate superior
performance. For simplification, this calculated rate is based on the average for
the two turbine generators. In Q4FY17 the average lbs of steam consumed per
gross kWhr generated was 11.8, which is 0.3% higher (less efficient) than the
corresponding quarter Q4FY16. A factor that negatively impacts this metric is
Turbine Generator No. 2, which continues to operate with its Stage 9 blades
removed from the rotor. CAAI reported that during the Turbine Generator No. 2
overhaul in November 2013, some cracking was observed on the Stage 9 blades
of the rotor, and the blading in that row was removed as a precautionary
measure. CAAI originally indicated that a new set of blades would be
manufactured and installed during a Turbine Generator No. 2 Outage in 2016,
but advised in May 2015, that the implementation of the replacement blades
installation would be delayed, and did not provide a date for repair. The average
lbs of steam consumed per net kWhr was 13.9, which is 0.1% higher (declined)
than the corresponding quarter in FY16. The average steam temperature during
the quarter was 691.3° F, which is 0.1% higher than the average steam
Alexandria/Arlington RRF
Annual Operations Report – Fiscal Year 2017 26 August 2017

temperature of the corresponding quarter last fiscal year and 8.7° F lower than
design temperature of 700o F.
In FY17, the average lbs of steam consumed per gross kWhr was 11.8, which is
1.4% lower than the rate in FY16, noting that for this metric, lower steam
consumption represents improved performance. The average lbs of steam
consumed per net kWhr in FY17 was 14.1, which is 1.5% lower than the rate in
FY16. The average steam temperature for FY17 was 686.4o F, which is slightly
higher (0.9%) than the steam temperature in FY16 and 13.6 F lower than the
design temperature of 700o F.
Chart 14: Net Turbine Generator Conversion Rate
4.1 Utility and Reagent Consumptions
Table 4: Facility Utility and Reagent Consumptions
Utility Units Q4FY17 Total
Q4FY16Total
Q4FY17”Per Processed Ton”
Consumption
Q4FY16”Per Processed Ton”
ConsumptionFY17Total
FY16Total
Purchased Power MWhr 6,191 5,651 0.07 0.06 22,906 22,242Fuel Oil Gal. 13,440 11,590 0.14 0.12 58,890 41,110Boiler Make-up Gal. 1,234,000 1,794,000 13.27 19.16 6,257,000 7,813,000Cooling Tower Make-up Gal. 42,298,090 42,074,659 454.70 449.27 152,993,251 146,912,669Pebble Lime Lbs. 1,324,000 1,344,000 14.23 14.35 5,042,000 5,378,000Ammonia Lbs. 191,000 183,000 2.05 1.95 710,000 663,000Carbon Lbs. 94,000 98,000 1.01 1.05 374,000 404,000Dolomitic Lime Lbs. 290,000 138,000 3.12 1.47 784,000 701,800
Alexandria/Arlington RRF
Annual Operations Report – Fiscal Year 2017 27 August 2017

Fuel oil usage during the quarter represents approximately 0.22% of the total
heat input to the boilers, which compares favorably with industry averages, and
slightly higher than the percentage of heat input in Q4FY16 which was 0.19%.
Fuel oil is used to stabilize combustion of wet fuel, as well as during start-up and
shut-down of the boilers for maintenance. Boiler makeup water usage during the
quarter represents 1.8% of steam flow, which is slightly lower than the boiler
makeup in Q4FY16 which was 2.7%, and is acceptable. Pebble lime usage, at
1,324,000 lbs. is lower (1.5%) than the corresponding quarter last year, and the
quarterly consumption rate of 14.2 lbs/ton is below historical levels (16-18
lbs/ton).
In comparing Q4FY17 to Q4FY16 on a per processed ton consumption basis:
the purchased power consumption rate was 10.3% higher
the total fuel oil consumption rate was 16.7% higher
the boiler make-up water consumption rate was 30.8% lower
the cooling tower make-up water consumption rate was 1.2% higher
the total pebble lime consumption rate was 0.8% lower
the ammonia consumption rate was 5.1% higher
the carbon consumption rate was 3.4% lower
the total dolomitic lime consumption rate was 111.6% higher
CAAI reports that the significant increase in dolomitic lime usage during the
quarter, when compared to the corresponding quarter last year, is attributable to
a dolomitic lime silo level detector malfunction experienced from June 25, 2015
through July 9, 2015. As a result of this malfunction, CAAI stated that delivery
totals were utilized as usage totals during those months last fiscal year.
Alexandria/Arlington RRF
Annual Operations Report – Fiscal Year 2017 28 August 2017

4.2 Safety & Environmental Training
The Facility experienced no OSHA recordable accidents during the quarter and
has operated 284 days without an OSHA recordable accident. During the
quarter, Safety and Environmental training was conducted with themes as
follows:
April 2017 Safety:
o Blood Borne Pathogens
o Hearing Conservation
o Barricades and Flagging
Environmental:
o Reagent Optimization
May 2017 Safety:
o Walking, Working Surfaces, and Fall Protection
o Fall Protection Equipment and Inspection
o Portable Ladder Safety
o Fall Hazards
o Inspections and Assessments
Environmental:
o Annual Review of the Environmental Compliance Operating Manual
(ECOM)
o Exercise on procedure if an unknown chemical is delivered in the
waste stream
o Environmental Awareness and the 3 R’s (Recognize, Report,
Respond)
June 2017 Safety:
o Emergency Action Plan
Alexandria/Arlington RRF
Annual Operations Report – Fiscal Year 2017 29 August 2017

o Fire Safety Equipment and Fire Extinguisher Training
o Heat Stress
o How to Handle Facility Intruder
Environmental:
o Solid Waste Deliveries
o Environmental Inspections
5.0 Facility Maintenance
Throughout the quarter, significant routine and preventative maintenance was
performed. HDR considers that the Facility is implementing an effective
maintenance regimen, and is performing routine and preventative maintenance,
along with selected equipment replacements in a timely manner. CAAI monthly
maintenance reports provide a detailed account of maintenance performed.
Beginning June 21, 2017 Boiler No. 2 experienced 17.8 hours of downtime, for a
scheduled cleaning outage. In addition to the scheduled cleaning outage, CAAI
reports that 852 preventative maintenance actions were completed during the
quarter.
5.1 Availability
Facility availabilities for Q4FY17 are shown in Table 5. According to CAAI
reports, the average unit availabilities for Boiler Nos. 1, 2, and 3 for Q4FY17
were 98.6%, 98.2%, and 100.0%, respectively. The three-boiler average
availability during the quarter was 98.9%, which is excellent and comparable to
that of mature, well run waste to energy facilities.
During Q4FY17, the average availability for Turbine Generator Nos. 1 and 2 was
100.0%, which is excellent.
Overall boiler availability for FY17 was 96.2%, and overall turbine generator
availability was 99.5%. Overall availabilities for the boilers are highly acceptable
and above industry averages, noting that these reported availability metrics
Alexandria/Arlington RRF
Annual Operations Report – Fiscal Year 2017 30 August 2017

exclude standby time experienced during the fiscal year which amounted to
315.9 hours for the boilers and 631.9 hours for the turbine generators.
Alexandria/Arlington RRF
Annual Operations Report – Fiscal Year 2017 31 August 2017

Table 5: Quarterly Facility Unit Availabilities
Availability Q1FY17 Average
Q2FY17 Averag
eQ3FY17 Average
Q4FY17 Average
FY17Average
Boiler No. 1 97.7% 97.9% 91.4% 98.6% 96.4%
Boiler No. 2 94.6% 99.6% 90.9% 98.2% 95.9%Boiler No. 3 98.7% 94.3% 92.8% 100.0% 96.5%
Avg. 97.0% 97.3% 91.7% 98.9% 96.2%Turbine No. 1 100.0% 100.0% 97.3% 100.0% 99.3%Turbine No. 2 100.0% 100.0% 98.9% 100.0% 99.7%
Avg. 100.0% 100.0% 98.1% 100.0% 99.5%
Alexandria/Arlington RRF
Annual Operations Report – Fiscal Year 2017 32 August 2017

5.2 Downtime Summary
Table 6: Boiler Downtime – Q4FY17Boiler
NumberOutage Begin Date
Outage End Date
Hours Unavailable
DowntimeClassification Reason Unavailable
2 5/18/17 5/18/17 21.0 Unscheduled Tube leak repairs1 5/21/17 5/21/17 3.3 Unscheduled Feeder repairs1 5/28/17 5/29/17 16.0 Unscheduled Grate bar repairs1 6/6/17 6/6/17 11.8 Unscheduled Under Fire Air Fan failure2 6/21/17 6/21/17 17.8 Scheduled Scheduled boiler cleaning
Total Unscheduled Downtime 52.1 HoursTotal Scheduled Downtime 17.8 HoursTotal Standby Downtime 0.0 HoursTotal Downtime 69.9 Hours
Table 7: Turbine Generator Downtime – Q4FY17Turbine
Generator Number
Outage Begin Date
Outage End Date
Hours Unavailabl
eDowntime
Classification Reason Unavailable
1 6/21/17 6/21/17 7.3 Standby Scheduled Boiler No. 2 CleaningTotal Unscheduled Downtime 0.0 HoursTotal Scheduled Downtime0 0.0 HoursTotal Standby Downtime 7.3 HoursTotal Downtime 7.3 Hours
Alexandria/Arlington RRFAnnual Operations Report – Fiscal Year 2017 33 August 2017

5.3 Facility Housekeeping
CAAI is performing Facility housekeeping and maintaining plant cleanliness in
accordance with acceptable industry practices. A site inspection was conducted
in May 2017. At the time of the inspection, new deficiencies were recorded and
prior deficiencies were given a status update. Photos of interest from the
inspection are depicted in Appendix B. The Facility housekeeping ratings from
the May 2017 inspection are presented in Table 8.
Table 8: Facility Housekeeping Ratings – May 2017Facility Area Acceptable Needs
Improvement Unacceptable
Tipping Floor Citizen’s Drop-off Area Tipping Floor Truck Exit Front Parking Lot Rear Parking Lot Boiler House Pump Room Lime Slurry Pump Room Switchgear Area Ash Load-out Area Vibrating Conveyor Area
Ash Discharger Area Cooling Tower Area Truck Scale Area SDA/FF Conveyor Area SDA Penthouses Lime Preparation Area Boiler Drum Levels Turbine Room Electrical Room
Alexandria/Arlington RRF
Annual Operations Report – Fiscal Year 2017 34 August 2017

6.0 Environmental
The air pollution control equipment maintained emission concentrations well
within the established regulations. Average Continuous Emission Monitoring
System (CEMS) data collected for each monthly period during Q4FY17 are
summarized in Appendix A. No permit deviations were reported by the Facility
during Q4FY17. Note that as of June 30, 2017, the CAAI Facility has operated
1,296 days without an environmental excursion.
On August 8, 2014, CAAI sent a letter to the Virginia Department of
Environmental Quality (VADEQ) requesting relief from the steam permit limit
requirements in the Facility’s Title V and PSD permits. These requested
changes relate to the permit values established for the calculated steam-to-waste
ratio, which has resulted in a reduction of MSW throughput. In recent
discussions, CAAI indicated that it is re-evaluating options to the proposed permit
changes, and will provide further updates on this issue.
6.1 Nitrogen Oxide Emissions
During Q4FY17, the monthly emission concentrations of nitrogen oxides (NOx)
averaged 160.3 ppmdv, 159.0 ppmdv and 159.3 ppmdv for Boiler Nos. 1, 2, and
3, respectively. CAAI continues to operate the units at the lower (160 ppmdv)
set-points, except immediately following a scheduled outage and associated
boiler cleaning.
6.2 Sulfur Dioxide Emissions
During Q4FY17 the monthly emission concentration of stack sulfur dioxide (SO2)
averaged 1.0 ppmdv, 0.3 ppmdv, and 0.3 ppmdv for Boiler Nos. 1, 2, and 3,
respectively. All of these stack SO2 concentrations are significantly below the
permit limit of 29 ppmdv @ 7% O2.
Alexandria/Arlington RRF
Annual Operations Report – Fiscal Year 2017 35 August 2017

6.3 Carbon Monoxide Emissions
During Q4FY17, the average CO emission concentrations on Boiler Nos. 1, 2,
and 3 were 35.3 ppmdv, 31.7 ppmdv, and 39.0 ppmdv, respectively, and all are
well within permit limits (100 ppmdv, hourly average). However, as reported by
HDR during the May 2016 FMG Meeting, and continuing through Q4FY17, CO
averages have been trending higher over the past year of operations on all three
boilers, and CAAI has been requested to investigate and mitigate this uptrend.
While not a permit issue, it is indicative of poorer boiler performance and
combustion efficiency.
6.4 Opacity
During Q4FY17, the average opacity for Boiler Nos. 1, 2, and 3 was 0.3%, 1.3%,
and 0.3% respectively. All of these averages are significantly below the 10% (6-
minute) average permit limit.
6.5 Daily Emissions Data
Appendix A, Tables 11, 12, and 13 tabulate the monthly average, maximum, and
minimum emissions data for each unit during Q4FY17. Excursions, if any, would
appear in bold print. It should be noted that these tabulations of monthly
averages, reported here for informational purposes, are based on tabulations of
daily averages. These averages do not correlate with official reports to the
regulatory agencies because of differences in averaging times and other
technical differences required by agency report formats.
6.6 2017 Annual Stack Testing
Annual stack testing was conducted March 20th through March 22nd, 2017 by
Testar Inc. Historical stack test data including 2017 results are summarized in
Chart 15 and Table 9. The 2017 test results demonstrate compliance well within
the permit limits for all parameters. In addition to the tests required by the
Facility permit, additional tests for small particulate matter (PM < 2.5) were
Alexandria/Arlington RRF
Annual Operations Report – Fiscal Year 2017 36 August 2017

conducted. While there are no current regulatory limits established for PM < 2.5,
average results for 2017 were 0.003 Gr/DSCF (grains per dry standard cubic
foot) corrected to 7% O2, compared to the 2016 Annual Stack Testing PM <2.5
Results which averaged 0.005 Gr/DSCF corrected to 7% O2.
Chart 15: Stack Test Results through 2017
Note (1): Lead emissions have been decreased by a factor of 10 for trending purposes Note (2): Mercury emissions have been decreased by a factor of 10 for trending purposes Note (3): CO emissions have been decreased by a factor of 10 for trending purposes Note (4): NOx emissions have been decreased by a factor of 10 for trending purposes
Alexandria/Arlington RRF
Annual Operations Report – Fiscal Year 2017 37 August 2017

Table 9: Stack Test Results through 2017
NOx(4) HCL SO2 CO(3) Mercury(2) Cadmium Dioxins/Furans Lead(1) Particulates P.M. 2.5(ppmdv) (ppmdv) (ppmdv) (ppmdv) (ug/dscm) (ug/dscm) (ng/dscm) (ug/dscm) (mg/dscm) (gr/dscf)
2007
Boiler 1 187 0.82 1 31 0.38 0.25 2.31 2.03 --
Boiler 2 185 0.68 1 36 0.39 0.19 1.42 2.12 2.04 --
Boiler 3 189 0.84 1 34 0.59 0.16 1.55 1.33 --
AVERAGE 187.0 0.78 1.00 33.67 0.46 0.20 1.42 1.99 1.80 --
2008
Boiler 1 181 2.96 2 37 0.45 6.60 1.25 9.4 1.46 --
Boiler 2 182 3.52 2 30 0.42 0.50 2.6 0.82 --
Boiler 3 186 2.43 1 24 1.03 0.16 0.23 0.48 --
AVERAGE 183.0 3.0 1.67 30.3 0.63 2.4 1.25 4.1 0.9 --
2009
Boiler 1 159 1.40 2 28 0.184 0.191 2.260 0.483 --
Boiler 2 158 2.12 1 25 0.271 0.143 0.894 0.068 --
Boiler 3 163 3.53 1 29 0.198 0.256 1.54 3.030 0.155 --AVERAGE 160 2.35 1.33 27.33 0.22 0.20 1.54 2.061 0.235 --
2010
Boiler 1 159 2.69 1 29 5.76 0.120 1.33 3.690 0.00410Boiler 2 158 0.67 1 28 29.50 0.032 0.35 3.00 0.914 0.00630
Boiler 3 168 2.85 3 38 34.70 0.241 8.71 0.336 0.00990AVERAGE 161.7 2.07 1.67 31.67 23.32 0.13 0.35 4.347 1.647 0.007
2011
Boiler 1 167 2.15 2 28 0.36 0.140 2.67 1.72 0.130 0.00570
Boiler 2 159 1.14 1 38 0.44 0.140 1.46 0.350 0.00690
Boiler 3 161 2.40 2 37 0.36 0.110 1.47 0.350 0.00170AVERAGE 162.3 1.90 1.67 34.33 0.39 0.13 2.67 1.550 0.277 0.005
2012
Boiler 1 163 1.14 2 23 0.30 0.310 1.34 0.640 0.00932Boiler 2 156 2.02 2 29 0.34 0.250 0.75 6.52 1.280 0.00782
Boiler 3 161 1.66 1 27 0.37 0.590 47.80 1.020 0.00679AVERAGE 160.0 1.61 1.67 26.33 0.34 0.38 0.75 18.553 0.980 0.008
2013
Boiler 1 164 1.48 1 28 0.36 0.134 1.45 0.637 0.00637Boiler 2 158 1.98 1 25 0.37 0.112 1.66 1.05 0.737 0.00475
Boiler 3 159 1.52 1 22 0.42 0.137 3.03 0.733 0.00471AVERAGE 160.3 1.66 1.00 25.00 0.38 0.13 1.66 1.843 0.702 0.005
2014
Boiler 1 167 1.13 2 35 0.33 0.270 0.16 3.82 0.282 0.00337
Boiler 2 157 1.02 1 35 0.35 0.183 2.52 1.240 0.00415
Boiler 3 161 1.50 1 17 0.49 0.228 2.85 0.520 0.00425AVERAGE 161.7 1.22 1.33 29.00 0.39 0.23 0.16 3.063 0.681 0.004
2015
Boiler 1 164 1.80 2 25 0.32 0.102 1.00 0.513 0.00540
Boiler 2 157 1.99 1 29 0.38 0.109 1.30 0.532 0.00410Boiler 3 159 1.71 1 27 0.39 0.409 1.21 3.04 0.499 0.00074
AVERAGE 160.0 1.83 1.33 27.00 0.36 0.21 1.21 1.778 0.515 0.003
2016
Boiler 1 166 4.33 1.0 29 0.46 0.231 2.81 1.170 0.00680Boiler 2 156 3.46 1.0 37 0.43 0.154 1.16 1.13 0.657 0.00241Boiler 3 159 1.86 1.0 28 0.38 0.107 1.59 0.371 0.00456
Alexandria/Arlington RRF
Annual Operations Report – Fiscal Year 2017 38 August 2017

AVERAGE 160.3 3.22 1.00 31.33 0.42 0.16 1.16 1.843 0.733 0.005
2017
Boiler 1 171 1.41 2.0 33 0.49 0.169 0.17 1.99 0.860 0.00393
Boiler 2 160 1.81 0.0 25 0.41 0.139 1.10 0.742 0.00160
Boiler 3 156 4.71 3.0 23 0.37 0.115 1.28 0.561 0.00385AVERAGE 162.3 2.64 1.67 27.00 0.42 0.14 0.17 1.457 0.721 0.003
EPA EMISSIONS LIMIT 205 29 29 100 80 40 30 440 27 --Percent of Limit for 2017 79.2% 9.1% 5.7% 27.0% 0.5% 0.4% 0.6% 0.3% 2.7% --
Alexandria/Arlington RRF
Annual Operations Report – Fiscal Year 2017 39 August 2017

6.7 Ash System Compliance
The dolomitic lime feed rate is adjusted periodically in order to maintain a desired
ash pH level in the range of 8.0 to 11.0. Since initial startup, the feed rate has
varied from between 1 to 9 lbs per ton each month. Ash Toxicity (TCLP) tests
were performed for field samples collected over a seven (7) day period in August
2016, and results indicated that the average pH during testing was 8.4. Results
from the TCLP testing conducted in May 2017 and August 2016 are depicted in
Table 10 and Chart 16 below.
Table 10: Comparison of Statistical Results and Regulatory Thresholds for Metal Analytes
Metals90% Upper Confidence (May 2017)
90% Upper Confidence
(August 2016)
Regulatory Threshold
(mg/L)% of Threshold
(May 2017)% of Threshold (August 2016)
Arsenic 0.025 0.250 5.0 0.50% 5.00%Barium 0.912 0.805 100.0 0.91% 0.81%Cadmium 0.025 0.154 1.0 2.50% 15.40%Chromium 0.025 0.250 5.0 0.50% 5.00%Lead 0.025 0.250 5.0 0.50% 5.00%Mercury 0.0002 0.00025 0.2 0.10% 0.13%Selenium 0.039 0.050 1.0 3.90% 5.00%Silver 0.025 0.250 5.0 0.50% 5.00%
Chart 16: Ash Toxicity Characteristic Leaching Procedure (TCLP) Results
Alexandria/Arlington RRF
Annual Operations Report – Fiscal Year 2017 40 August 2017

Note: The regulatory threshold for Barium is 100 mg/L
CAAI also samples ash monthly in-house, and documents pH reading to adjust
dolomitic lime feed rate. The results for the ash pH tests are found below in
Chart 17 where each quarter is represented by the average of the respective
monthly readings. During Q4FY17, the average ash pH for in-house tests was
9.3.
Chart 17: Quarterly Ash Test Results
Alexandria/Arlington RRF
Annual Operations Report – Fiscal Year 2017 41 August 2017

APPENDIX AFACILITY CEMS DATA
Alexandria/Arlington RRF
Annual Operations Report – Fiscal Year 2017 42 August 2017

Table 11: Unit #1 Monthly Summary for Reportable Emissions DataGroup#-Channel# G8-C35 G8-C28 G8-C8 G8-C4 G8-C12 G8-C34 G8-C37 G8-C40 G8-C39
Long Descrip. U-1 Steam U-1 Econ U-1 Stack U-1 Stack U-1 Stack U-1 Opaci U-1 FF In U-1 Carbo U-1 LimeShort Descrip. SteamFl SO2ec SO2sc COsc NOxsc Opacity FF InTemp CarbInj LimeFlow
Units K#/Hr ppmc ppm ppmc ppmc % deg F #/hr gpmRange 0-100 0-2000 0-500 0-4000 0-1000 0-100 100-500 0-50 0-20
Apr - 17AVG 83.8 29.0 1.0 36.0 160.0 0.5 300.0 16.1 3.2
Max 85.6 44.0 4.0 47.0 163.0 0.9 302.0 17.2 3.3
Min 82.3 20.0 0.0 25.0 156.0 0.3 300.0 16.0 2.9
May - 17AVG 83.0 23.0 1.0 35.0 160.0 0.3 300.0 15.2 3.2
Max 85.0 36.0 4.0 50.0 163.0 0.9 301.0 16.5 3.3
Min 79.2 12.0 0.0 24.0 156.0 0.0 299.0 14.9 3.1
Jun - 17AVG 85.1 28.0 1.0 35.0 161.0 0.2 300.0 15.0 3.1
Max 88.4 44.0 4.0 47.0 166.0 0.5 301.0 15.2 3.3
Min 78.4 15.0 0.0 24.0 155.0 0.0 296.0 15.0 2.9Quarter Average 84.0 26.7 1.0 35.3 160.3 0.3 300.0 15.4 3.2Quarter Max Value 88.4 44.0 4.0 50.0 166.0 0.9 301.0 17.2 3.3Quarter Min Value 78.4 12.0 0.0 24.0 155.0 0.0 296.0 14.9 2.9Limits: 98 NA 29 100 205 10 331 14(a)
(a) Carbon flow limit is a minimum value
* Note: The data reported herein represent 24 hour average data for all parameters. Emissions excursions that are measured on shorter time intervals (i.e., 4-hour block averages for CO) do not correlate with the 24 hour average data reported above.
Alexandria/Arlington RRF
Annual Operations Report – Fiscal Year 2017 43 August 2017
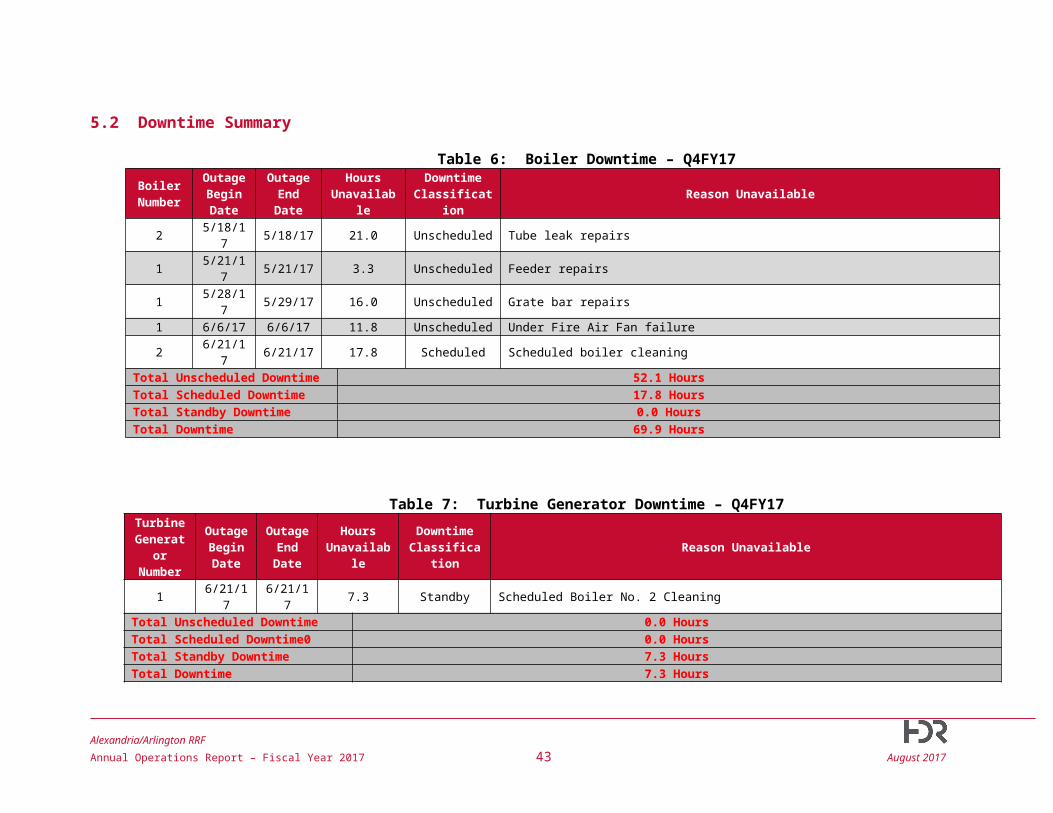
Table 12: Unit #2 Monthly Summary for Reportable Emissions DataGroup#-Channel# G8-C35 G8-C28 G8-C8 G8-C4 G8-C12 G8-C34 G8-C37 G8-C40 G8-C39
Long Descrip. U-2 Steam U-2 Econ U-2 Stack U-2 Stack U-2 Stack U-2 Opaci U-2 FF In U-2 Carbo U-2 LimeShort Descrip. SteamFl SO2ec SO2sc COsc NOxsc Opacity FF InTemp CarbInj LimeFlow
Units K#/Hr ppmc ppm ppmc ppmc % deg F #/hr gpmRange 0-100 0-2000 0-500 0-4000 0-1000 0-100 100-500 0-50 0-20
Apr - 17AVG 89.3 42.0 0.0 35.0 159.0 1.3 298.0 16.0 3.2
Max 90.7 71.0 3.0 47.0 167.0 1.7 299.0 16.3 3.4
Min 87.3 31.0 0.0 27.0 156.0 0.9 298.0 16.0 2.9
May - 17AVG 89.3 36.0 0.0 29.0 159.0 1.3 298.0 15.1 3.2
Max 91.3 59.0 4.0 41.0 164.0 1.7 299.0 16.5 3.4
Min 85.3 23.0 0.0 17.0 155.0 0.8 297.0 14.9 3.0
Jun - 17AVG 85.4 52.0 1.0 31.0 159.0 1.3 298.0 15.0 3.2
Max 91.9 219.0 34.0 45.0 172.0 1.5 300.0 15.1 5.5
Min 65.6 22.0 0.0 21.0 153.0 0.9 297.0 14.9 2.8Quarter Average 88.0 43.3 0.3 31.7 159.0 1.3 298.0 15.4 3.2Quarter Max Value 91.9 219.0 34.0 47.0 172.0 1.7 300.0 16.5 5.5Quarter Min Value 65.6 22.0 0.0 17.0 153.0 0.8 297.0 14.9 2.8Limits: 97 NA 29 100 205 10 331 14(a)
(a) Carbon flow limit is a minimum value
* Note: The data reported herein represent 24 hour average data for all parameters. Emissions excursions that are measured on shorter time intervals (i.e., 4-hour block averages for CO) do not correlate with the 24 hour average data reported above.
Alexandria/Arlington RRF
Annual Operations Report – Fiscal Year 2017 44 August 2017

Table 13: Unit #3 Monthly Summary for Reportable Emissions DataGroup#-Channel# G8-C35 G8-C28 G8-C8 G8-C4 G8-C12 G8-C34 G8-C37 G8-C40 G8-C39
Long Descrip. U-3 Steam U-3 Econ U-3 Stack U-3 Stack U-3 Stack U-3 Opaci U-3 FF In U-3 Carbo U-3 Lime
Short Descrip. SteamFl SO2ec SO2sc COsc NOxsc Opacity FF InTemp CarbInj LimeFlow
Units K#/Hr ppmc ppm ppmc ppmc % deg F #/hr gpm
Range 0-100 0-2000 0-500 0-4000 0-1000 0-100 100-500 0-50 0-20
Apr - 17AVG 89.4 39.0 1.0 40.0 160.0 0.4 298.0 16.1 3.1
Max 91.5 57.0 4.0 54.0 161.0 0.7 299.0 16.1 3.4
Min 86.9 21.0 0.0 31.0 159.0 0.1 298.0 16.0 2.9
May - 17AVG 89.1 29.0 0.0 39.0 159.0 0.3 298.0 15.2 3.2
Max 90.7 42.0 3.0 54.0 161.0 0.8 299.0 16.1 3.4
Min 87.1 19.0 0.0 28.0 158.0 0.0 295.0 15.0 3.1
Jun - 17AVG 88.7 26.0 0.0 38.0 159.0 0.2 298.0 15.0 3.1
Max 91.5 44.0 3.0 53.0 161.0 0.4 300.0 15.2 3.3
Min 84.4 14.0 0.0 27.0 156.0 0.0 294.0 14.9 2.7Quarter Average 89.1 31.3 0.3 39.0 159.3 0.3 298.0 15.4 3.1Quarter Max Value 91.5 57.0 4.0 54.0 161.0 0.8 300.0 16.1 3.4Quarter Min Value 84.4 14.0 0.0 27.0 156.0 0.0 294.0 14.9 2.7Limits: 99 NA 29 100 205 10 339 14(a)
(a) Carbon flow limit is a minimum value
* Note: The data reported herein represent 24 hour average data for all parameters. Emissions excursions that are measured on shorter time intervals (i.e., 4-hour block averages for CO) do not correlate with the 24 hour average data reported above.
Alexandria/Arlington RRF
Annual Operations Report – Fiscal Year 2017 45 August 2017

APPENDIX BSITE PHOTOS – MAY 2017
Alexandria/Arlington RRF
Annual Operations Report – Fiscal Year 2017 46 August 2017

Figure 1: Ceiling panels deteriorated above Boiler Nos. 2 and 3 – New Deficiency
Figure 2: Pebble Lime Warning Sign deteriorated on SDA No. 3 Entrance Door – New Deficiency
Figure 3: Fence falling over near Citizen’s Drop Roll-Off – New Deficiency
Figure 4: Siding on north and east side of Facility dirty – New Deficiency
Figure 5: Viewport glass cracked on Boiler No. 3 Figure 6: Cooling Towers & Ash Trailer Canopy
Alexandria/Arlington RRF
Annual Operations Report – Fiscal Year 2017 47 August 2017

Barn Door – New Deficiency from SDA Deck No. 3
Figure 7: SDA No. 3 and Dolomitic Lime Silo Figure 8: Scales and Facility Roadway from Turbine Generator Enclosure Roof
Figure 9: SDA Hopper Nos. 2 and 3 from Economizer Deck
Figure 10: Turbine Generator No. 2
Alexandria/Arlington RRF
Annual Operations Report – Fiscal Year 2017 48 August 2017

Figure 11: Ferrous Magnet Figure 12: Ammonia Storage Silo
Figure 13: Cooling Tower and Stack Figure 14: White Goods Roll-off
Figure 15: Tipping Floor Entrance Road Figure 16: Scales and Scale House
Figure 17: Citizen’s Drop off Roll-off Figure 18: South side of Facility from Eisenhower Sidewalk
Alexandria/Arlington RRF
Annual Operations Report – Fiscal Year 2017 49 August 2017

Figure 19: West side Roadway from Facility Entrance
Figure 20: General Facility Photo from southeast up Eisenhower
Figure 21: TCLP Sampling in Progress Figure 22: Baghouse Aisle – No issues observed
Figure 23: SDA Hopper Double Dump Valve Figure 24: Facility Upgrades – New Lighting, Floor Tiles, and Paint
Alexandria/Arlington RRF
Annual Operations Report – Fiscal Year 2017 50 August 2017

Figure 25: Facility Upgrades – Covanta Break Room with New Floor Tiles and Paint
Figure 26: Facility Upgrades - New Concrete Slab at Facility Entrance
Figure 27: Facility Upgrades – Receptionist Area - New Lighting, Floor Tiles, Ceiling Tiles and Paint
Figure 28: Facility Upgrades – New Conference Room just off Main Entrance
Figure 29: Facility Upgrades – Receptionist Area – Figure 30: New LED Light Fixtures throughout
Alexandria/Arlington RRF
Annual Operations Report – Fiscal Year 2017 51 August 2017

Alternate View Turbine Generator Enclosure
Alexandria/Arlington RRF
Annual Operations Report – Fiscal Year 2017 52 August 2017