Oxyresveratrol Supplementation to C57bl/6 Mice Fed with a ...
Upload
bruce-anthonyCategory
view
212download
0
Alcohol 44 (2010) 659e671
Alcohol-induced facial dysmorphology in C57BL/6 mouse modelsof fetal alcohol spectrum disorder
Bruce Anthonya,*, Sophia Vinci-Boohera, Leah Wetherillb, Richard Wardc, Charles Goodlettd,e,Feng C. Zhoua,d,e
aDepartment of Anatomy & Cell Biology, Indiana University School of Medicine, Indianapolis, IN 46202, USAbDepartment of Medical Genetics, Indiana University School of Medicine, Indianapolis, IN, USA
cDepartment of Anthropology, Indiana University Purdue University, Indianapolis, IN, USAdDepartment of Psychology, Indiana University Purdue University, Indianapolis, IN, USA
eStark Neuroscience Research Institute, Indianapolis, IN, USA
Received 19 May 2009; received in revised form 9 February 2010; accepted 21 April 2010
Abstract
Alcohol consumption during pregnancy causes fetal alcohol spectrum disorder (FASD), which includes a range of developmental defi-cits. Fetal alcohol syndrome is the most severe form of FASD and can be diagnosed with pathognomonic facial features such as a smoothphiltrum, short palpebral fissure, and thin upper vermilion. However, many children with developmental damage because of prenatal alcoholexposure exhibit none, or only a subset, of the above features, making diagnosis difficult. This study explored novel analyses to quantify theeffect of a known dose of alcohol on specific facial measurements in substrains C57BL/B6J (B6J) and C57BL/6NHsd (B6N) mice. Mousedams were provided alcohol (Alc) consisting of 4.8% (vol/vol) alcohol in a liquid diet for 16 days prepregnancy and chow and water dietduring mating, and then the alcohol liquid diet was reinstated on gestational days 7 (E7) to gestational day 17 (E17). Treatment controlsincluded a pair-fed (PF) group given matched volumes of an alcohol-free liquid diet made isocalorically and a group given ad lib access tolab chow and water (Chow). Maternal diet intake (Alc and PF), blood alcohol concentrations (BACs), embryo weights, and 15 morpho-metric facial measurements for E17 embryos were analyzed. B6N dams drank more alcohol during pregnancy and generated higherBAC than B6J dams. Both the Alc and PF treatments induced significant reductions in embryo weights relative to Chow in both substrains.Alcohol treatments produced significant changes, relative to controls, in 4 of the 15 facial measures for the B6N substrain but only in twomeasures for the B6J substrain. Discriminant analysis demonstrated successful classification of the alcohol-exposed versus nonalcohol-exposed B6N embryos, with a high sensitivity of 86%, specificity 80%, and overall classification (total correct 83%), whereas B6J miceyielded sensitivity of 80%, specificity 78%, and overall correct classification in 79%. In addition, B6N mice showed significantly moreeffects of pair feeding on these facial measures than did B6J mice, suggesting that the B6N substrain may be more vulnerable to nutritionalstress during pregnancy. Overall, these data indicate that both B6N and B6J mice were vulnerable to alcohol but show differences in theseverity and location of alcohol-induced dysmorphic facial features and may parallel findings from human studies comparing different ethnicgroups. Furthermore, these findings suggest that discriminant analysis may be useful in predicting alcohol exposure in either mouse sub-strains. � 2010 Elsevier Inc. All rights reserved.
Keywords: Facial development; Genetic variance; Morphometrics; Anthropometry; Diagnosis; Craniofacial; Translational study
Introduction
Excessive alcohol consumption during pregnancy maycause many adverse developmental effects in the conceptus,which are now recognized as a spectrum of cognitive,behavioral, and structural abnormalities termed fetalalcohol spectrum disorders (FASDs; Barr and Streissguth,2001; Goodlett et al., 2005; Hoyme et al., 2005; Sokol
* Corresponding author. Tel.: þ1-317-274-4934; fax: þ1-317-274-
4934.
E-mail address: [email protected] (B. Anthony).
0741-8329/$ - see front matter � 2010 Elsevier Inc. All rights reserved.
doi: 10.1016/j.alcohol.2010.04.002
et al., 2003). Effective clinical diagnosis of fetal alcoholsyndrome (FAS)/FASD depends, in part, on a distinct setof abnormal facial features such as a smooth philtrum, shortpalpebral fissures, and thin upper vermilion (Astley, 2006;Bertrand et al., 2005; Jones and Smith, 1973; Loocket al., 2005). Optimal clinical management requires earlydiagnosis because early intervention improves outcomeand facial dysmorphology becomes less distinct with age(Streissguth et al., 1991). Many FASD patients demonstrateonly a small subset of dysmorphic features, with varyingdegrees of expression, and to date, clinical diagnosis ofcases with less obvious dysmorphology is not reliable
660 B. Anthony et al. / Alcohol 44 (2010) 659e671
(Hoyme et al., 2005). Additional complications in diagnosisof FASD arise from differences in facial dysmorphologythat vary as a function of ethnicity (Moore et al., 2007).
Over the past several years, published diagnostic guide-lines for FAS/FASD have included Institute of Medicine(IOM) guidelines (Stratton et al., 1996), FASD 4-DigitDiagnostic Code (Astley and Clarren, 2000), Centers forDisease Control and Prevention guidelines (Centers forDisease Control and Prevention, 2004), Hoyme FASDguidelines (Hoyme et al., 2005), and Canadian FASDguidelines (Chudley et al., 2005). All require distinctcriteria for alterations in growth, facial dysmorphology,and central nervous system (CNS) abnormalities. Diagnosisof facial dysmorphology in these guidelines encompassesall or a partial set of distinct facial features; includinga smooth philtrum, short palpebral fissure, and thin uppervermilion. In addition, a flat midface is a dysmorphic crite-rion in the IOM guidelines. Current diagnostic methods forhuman facial features in FAS/FASD use direct clinicalobservation (Jones and Smith, 1973), scored assessmentof two-dimensional (2D) photographs (Astley andClarren, 2001; Astley et al., 2002), or craniofacial anthro-pometry (or other morphometric techniques) combinedwith multivariate analysis to assess sets of distinct facialalterations that may be used to classify FASD over a wideage range (Moore et al., 2001, 2002, 2007).
Although each method is generally suited for diagnosingfull-blown FAS when the cardinal facial features are evident,facial anthropometry has been shown to have advantages inidentifying FASD in cases with less obvious or minimal clin-ical facial features (Ferrario et al., 1998; Hurwitz et al., 1999;Moore et al., 2001). Variations in facial phenotypes acrossethnic groups also complicate the diagnosis of FAS. Forexample, a recent study using facial anthropomorphometryto classify FAS and control cases using discriminant analysisof 16 different facial measures in four different groups(North American Caucasian, African American, FinnishCaucasian, and Cape Coloured of South Africa, not matchedfor age) found that FAS and control cases could be classifiedwith relatively high sensitivity and specificity in each group,but the discriminant analysis relied on different uniquecombinations of measures for each group to achieve the bestresults (Moore et al., 2007). This earlier study suggested thatethnic variation may not account for all differences seen indiscriminant analysis because of a wide variation in theethnic population in terms of age and demographic features.These findings suggest that the particular features of facialstructure that provide the most reliable diagnostic discrimi-nation of facial dysmorphology may vary with ethnicity,genotype, age, nutrition, behavior, and/or varied combina-tions of these factors. Relatively little is known about thecontribution of these factors or developmental differencesto variations in the expression of alcohol-induced facial dys-morphology, and animal studies offer a model to identifyhow these factors modify or regulate the effects of prenatalalcohol exposure on craniofacial morphogenesis.
Facial dysmorphology results from alcohol exposureduring critical periods of embryonic development, andstudies using chick, rat, and mouse models of prenatalalcohol exposure demonstrate a strong connection betweenthe emergent facial dysmorphology and the induction ofapoptosis and altered migration of neural crest cells(Cartwright and Smith, 1995; Chen et al., 2000; Sulik,2005; Sulik et al., 1986). Recent studies using mousemodels of FASD, with controlled dose and timing ofalcohol exposure, have demonstrated distinctive structuralalterations in head and face development (Goodlett andHorn, 2001; Ogawa et al., 2005; Zhou et al., 2003). Studiesusing C57BL/6 (B6) mice demonstrated some distinctfacial dysmorphology that parallels human dysmorphology(Johnson 1996, Sulik, 1984; Swayze, 1997), and it has beensuggested that craniofacial dysmorphology correlates withCNS abnormalities (Parnell et al., 2006; Parnell et al.,2009). Mouse models provide a means to study how alcoholexposure alters morphogenetic processes to producea specific set of abnormal facial features and to assess theextent to which the altered development of the face is asso-ciated with alterations in CNS structure and function.Mouse models in FASD facial dysmorphology providethe crucial experimental capability of controlling andmanipulating the dose and developmental timing of thealcohol exposure, thereby allowing for doseeeffect anal-yses and differences associated with the developmentalstage of exposure. Mouse studies can then provide informa-tion on efforts to improve clinical diagnosis of FASD whenthe phenotype is only partially expressed, by developingquantitative means to identify patterns of facial and CNSabnormalities that may be translated to apply to clinicaldiagnosis in a quick and cost-effective manner.
Although several strains of mice have been assessed forteratogenic effects from alcohol, the C57BL/6 strain willdrink ethanol with high avidity, and ethanol exposure inB6 mice under varied conditions alters craniofacialfeatures, defining an FAS phenotype (Khisti et al., 2006;Ogawa et al., 2005; Sulik, 2005), including alterations inbrain, body, and behavior. To investigate how similar dosesof alcohol can result in varied FASD facial dysmorphology,we controlled dose of alcohol exposure during a specifiedtreatment period and examined two substrains of B6 mice,C57BL/6J (B6J; The Jackson Laboratory, Bar Harbor, ME)and C57BL/6NHsd (B6N; Harlan Sprague Dawley, Indian-apolis, IN) which derived from same ancestor and separatedover hundreds of generations. Previous studies have re-ported dysmorphic facial features for both substrains(Parnell et al., 2006; Sulik, 2005; Degitz et al., 2004;Ogawa et al., 2005). Our choice of these two substrainswas further influenced by the known genetic/phenotypicdifferences reported by Harlan Sprague Dawley, The Jack-son Laboratory, and other studies on comparative analysisin genotype and behavior (Green et al., 2007; Petkov et al.,2004; Bryant et al., 2008). Current Jackson Laboratorycomparisons suggest metabolic, bone density, and body fat
661B. Anthony et al. / Alcohol 44 (2010) 659e671
differences between C57BL/6J and C57BL/6N mice (http://phenome.jax.org/pubcgi/phenome/mpdcgi?rtn5views/twostrains_mpd&strains57%2C138&diffmode5diff; http://www.harlan.com/online_literature/rms__animal_models.hl).Expression differences in glucose metabolic genes (PFKL,PGK1, PKM2, NNT ) have also been reported in B6J ascompared with B6N (Green et al., 2007; Petkov et al.,2004). Most of all, the genetic difference in DNA sequencealone does not account for the whole spectrum of rich diversity.The environmental interaction influencing epigenetic markscould also be transmitted through generations withoutaffecting DNA sequences. These inbred substrains are likelyto have accumulated epigenetic and other nongenetic dif-ferences, which might collaboratively contribute to the pheno-typic difference as well as differential vulnerability.Furthermore, recent studies in our laboratory, and those ofSulik et al. (1986) show distinguishable differences inembryo’s facial dysmorphology, developmental progression,embryo weights, and dam’s drinking behavior between thesetwo substrains. For example, differences were seen in palpe-bral fissure and eye development as well as in grossmorphology (Green et al., 2007). We evaluated the two sub-strains to determine whether they manifest differences in thepatterns of facial dysmorphology. These studies assessedalcohol intake, embryo weights, and most of all the 15 facialmeasurements derived directly from those used in previousstudies of human FAS (Moore et al., 2007; Hoyme et al.,2005; Astley and Clarren, 2001; Astley et al., 2002), using2D linear anthropometric measurements in E17 embryos forboth the B6J and B6N substrains.
Materials and methods
Subjects
Inbred B6N and B6J mice were used in this study. Adult(26 6 2 weeks old) nulliparous female and male breedersof the B6N inbred strain (obtained from Harlan SpragueDawley) or the B6J inbred strain (obtained from TheJackson Laboratory) were treated as described in thefollowing parallel experiments. All the mice were used inaccordance with National Institutes of Health (NIH) and In-diana University Animal Care and Use guidelines, and duecare was exercised to assure minimal pain and discomfort.All research was conducted in accordance with all local,state, national, and international standards for animal careand use. The mice were acclimated to a reverse light/darkcycle (lights on 10:00 PM to 10:00 AM) for 1 week beforestart of treatment. Animals not on liquid diet treatment(see the following) were given ad libitum chow and water.
Treatment groups and liquid diet administration
Our experimental paradigm consisted of three treatmentgroups designated Alcohol, Pair-Fed (PF), and Chow. AllAlcohol treatments used alcohol concentrations of 4.8%vol/vol in liquid diet (Purina Micro-stabilized Alcohol Diet
[PMI]; Purina Mills Inc., Richmond, IN] as per supplier’sinstructions, with 5% wt/vol sucrose. PF diets used thePMI diet mixture with equal caloric maltose dextran (isoca-loric diets) as a substitute for alcohol calories, and thevolume of liquid diet intake was restricted to that ofa matched dam from the Alcohol group throughout all treat-ments. All liquid diets were formulated at 1 cal/mL andwere administered using a 35-mL drinking tube (DyetsInc, NY). Chow treatment was ad libitum chow and waterdiet through prepregnancy and pregnancy periods. Prepreg-nancy alcohol started with 2.4% vol/vol liquid diet for2 days and then 14 days at 4.8% vol/vol alcohol; PF damswere given volumes of isocaloric diet matched to therespective alcohol-consuming dam. Animals were thenplaced on chow and water diets during alcohol withdrawalperiod of 4 days and during the subsequent mating period.For timed pregnancies, two females were placed, with onemale for a 2-h period beginning at the start of the dark cycle(10:00 AM to 12:00 noon). Dams were checked for spermplugs at the end of 2 h and determined pregnant at detectionof sperm plug (embryonic day 0 [E0]). All animals weremated daily over a period of no more than 3 weeks, atwhich time all animals were on ad libitum chow and waterdiets, until plugs were detected. If no plug was found withinthis time frame, animals were eliminated from the study. Atembryonic day 7 (E7), pregnant dams were placed onChow, 4.8% vol/vol Alcohol, or PF as indicated previouslythrough the end of E16.
Liquid diet and alcohol intake
All PF- and Alcohol-treated dams were weighed, andtotal volume (in mL) of a 4.8% vol/vol liquid diet was re-corded at 10:00 AM daily during both prepregnancy andpregnancy periods. Drinking measures (in g/kg) were ob-tained by converting the volume of 4.8% vol/vol alcoholliquid diet, consumed each day, to grams of alcoholconsumed, then value divided by the dam’s body weight(kg). The volume of liquid diet consumed by each group(Alcohol or PF) is also reported as mL/kg 6 SEM/day.Statistical analyses were performed using analysis of vari-ance (ANOVA).
Embryo isolation
Under deep CO2 euthanasia, embryos were harvestedfrom dams at E17 (10:00 AM to 12:00 noon) by removal fromthe embryonic sack. Each embryo was immersion-fixed in 20mL of 4% paraformaldehyde/phosphate-buffered saline andstored at 4�C in fixative overnight.
Embryo weight
Each embryo was weighed on a Sartorius R160P analyt-ical scale, followed by toe clip marking to maintainembryo’s identification between all images and facialmeasurements. Differences in weight between treatments
662 B. Anthony et al. / Alcohol 44 (2010) 659e671
were tested using an ANOVA within each line. Variabilitybecause of litter effect was accounted for by using litterID as a covariate nested within treatment.
Blood alcohol concentrations
A committed set of treated dams (N 5 8 for each sub-strain) were used to collect tail vein blood for blood alcoholconcentration (BAC) analysis. Samples were collectedduring prepregnancy treatment on days 3 and 7 and duringpregnancy treatment on days 3 (E7) and 10 (E17). Bloodsamples were collected at two time intervals on each collec-tion day at 2 and 4 h into the dark cycle (12:00 noon and2:00 PM). Blood samples (15 mL) were collected in heparin-ized tubes and plasma was collected through centrifugationand stored at �80�C prior to analysis with gas chromato-graph (Agilent Technologies; model 6890). Each samplewas analyzed in duplicate.
Facial morphometrics
2D image acquisition and measurementAll 2D images were acquired using a SPOT Insight color
digital camera 3.2.0 (Diagnostic Instruments Inc.) and runby SPOT Advanced version 4.6 software. The camera wasattached to a Leica MZFLIII Stereomicroscope. The SPOTcamera was calibrated to focal length, resulting in definedsensor pixel to real distance conversions. Focal length,1.25� 10 (ratio of 169:1,000 mm), was used for all samplemeasurements. To attain proper consistency in lateralangles, embryo samples were hold on Plexiglas head ina fixed position and placed on a rotating dual step motorsystem (Model MD-2; Arrick Robotics, Tyler, TX). Fivepictures were taken of each sample including (1) a fixed10� tilt to the frontal view, defined by Frankfort horizontal(FH), (2) a top view to acquire bitragal measurement, (3)full frontal view defined as 0� (nose forward defined asthe line from the nasion through the middle of the nosepad centered between the developing nasal cavities), and(4 and 5) left lateral 70�, right lateral �70�, using dual stepmotor. A total of 15 morphometric measurements weredefined (Fig. 3). The facial morphometric measurementswere performed using a computation vector after calibrationwith known metrics. The shortest distance between the tworeference points was acquired. Linear facial measurements(depicted in Table 1) were taken for each substrain andincluded width, height, and depth measurements analogousto those obtained in human studies. The muti-angle 2D anal-ysis of facial images has previously been demonstrated topredict the control and alcohol-treated mice in the same treat-ment paradigm (Fang et al., 2009).
For translational study, the mouse embryologicalanalogue of facial anthropometry previously studied forFAS diagnosis (Moore et al., 2007) was adapted. For thispurpose, the 15 facial measurements were matched withmeasurements in human studies. Because of the obvious
differences in facial morphology and the fact that our testsubjects were embryos, some of the measurements, forexample, whisker pad, nasal length, nasal bridge length,columella, could only approximate features found in hu-mans. Only the left side of all bilateral measurementswas used in the analyses (to avoid bias by camera capturethrough a single lens pathway on microscopic). Facialmeasurement outliers deviating more than 3 SDs as a resultof measurement error within each treatment for each sub-strain were excluded. In addition, measurements becauseof overdeveloped embryos (plugs missed at E0 and detectedat E1) and those showing deformation from embryo isola-tion were excluded. The FH was used as reference line toposition four measurements: minimal frontal width, outercanthal width, inner canthal width, and palpebral fissurelength. FH on mouse was defined as the line that connectsthe lowest point in the outer lower margin of the bony orbitand the center of the auditory canal. To define nasion, weused the line created for inner canthal width and determineda center point, as nasion. Statistical analysis is presented inthe following.
Maternal variables and embryo weights
All the analyses were performed using SAS software(v. 9.1.3; Cary, NC). Daily maternal alcohol intake(measured in g/kg) and volume (measured in mL/kg) wereanalyzed separately for the prepregnancy and pregnancyperiod using repeated measures ANOVA models, with sub-strain (B6N or B6J) as a grouping factor and day as therepeated measure. In addition, maternal weight gain, definedas the difference in dam weight from E7 to E17, was analyzedusing an ANOVA, with strain and treatment as between-group factors. Because the Alcohol and PF groups werematched only within substrain, differences in embryoweights because of treatment effects (Alcohol, PF, andChow) were tested separately within each strain using anANOVA. Variability because of litter effects was accountedfor by using litter as a nested effect within treatment for allANOVA models. Comparisons between treatments were per-formed as post hoc tests using the TukeyeKramer correctionfor multiple testing within each strain. The potential for thepair feeding procedures to affect the two strains differentlywas tested with a second ANOVA model using a two-wayfactorial ANOVA, with the control (nonalcohol) treatments(Chow or PF) and substrain (B6N or B6J) as between-group factors.
Analysis of facial measurements
The 15 linear facial measurements obtained in the E17embryos were grouped according to the following threedimensions: facial widths, depths, and lengths. To minimizethe number of tests performed, a multivariate analysis ofvariance (MANOVA) was first performed to test for anoverall effect of treatment (P ! .05 from Hotelling’s T2
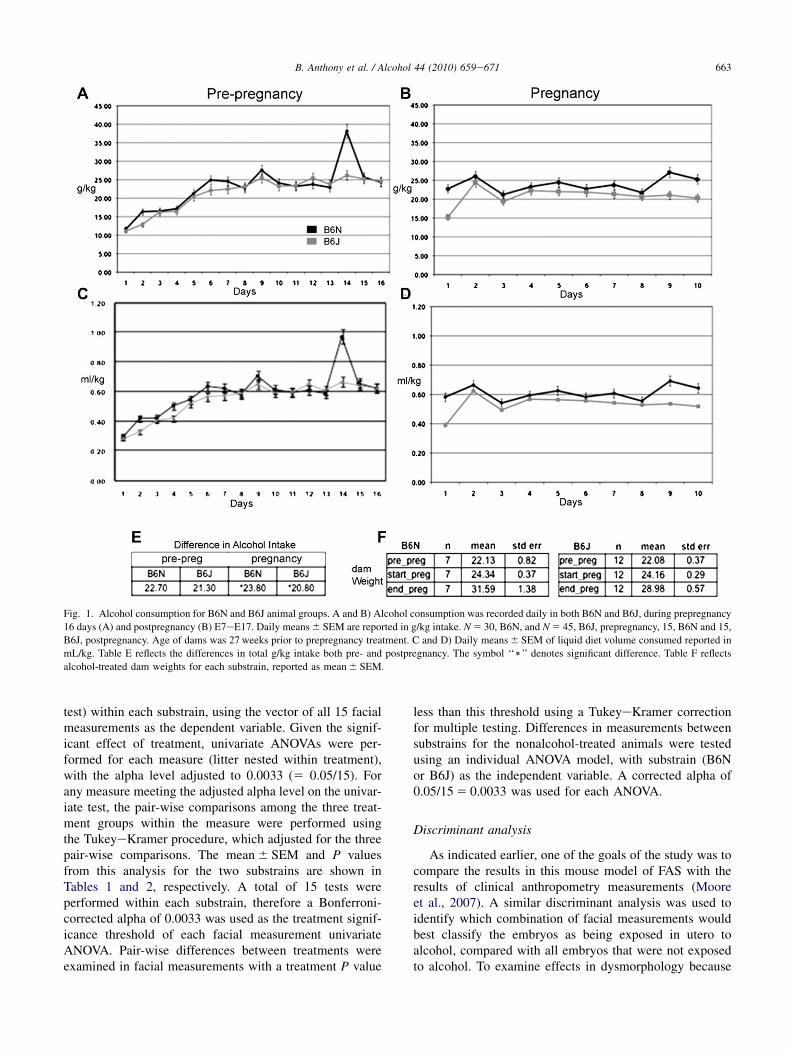
Fig. 1. Alcohol consumption for B6N and B6J animal groups. A and B) Alcohol consumption was recorded daily in both B6N and B6J, during prepregnancy
16 days (A) and postpregnancy (B) E7eE17. Daily means 6 SEM are reported in g/kg intake. N 5 30, B6N, and N 5 45, B6J, prepregnancy, 15, B6N and 15,
B6J, postpregnancy. Age of dams was 27 weeks prior to prepregnancy treatment. C and D) Daily means 6 SEM of liquid diet volume consumed reported in
mL/kg. Table E reflects the differences in total g/kg intake both pre- and postpregnancy. The symbol ‘‘)’’ denotes significant difference. Table F reflects
alcohol-treated dam weights for each substrain, reported as mean 6 SEM.
663B. Anthony et al. / Alcohol 44 (2010) 659e671
test) within each substrain, using the vector of all 15 facialmeasurements as the dependent variable. Given the signif-icant effect of treatment, univariate ANOVAs were per-formed for each measure (litter nested within treatment),with the alpha level adjusted to 0.0033 (5 0.05/15). Forany measure meeting the adjusted alpha level on the univar-iate test, the pair-wise comparisons among the three treat-ment groups within the measure were performed usingthe TukeyeKramer procedure, which adjusted for the threepair-wise comparisons. The mean 6 SEM and P valuesfrom this analysis for the two substrains are shown inTables 1 and 2, respectively. A total of 15 tests wereperformed within each substrain, therefore a Bonferroni-corrected alpha of 0.0033 was used as the treatment signif-icance threshold of each facial measurement univariateANOVA. Pair-wise differences between treatments wereexamined in facial measurements with a treatment P value
less than this threshold using a TukeyeKramer correctionfor multiple testing. Differences in measurements betweensubstrains for the nonalcohol-treated animals were testedusing an individual ANOVA model, with substrain (B6Nor B6J) as the independent variable. A corrected alpha of0.05/15 5 0.0033 was used for each ANOVA.
Discriminant analysis
As indicated earlier, one of the goals of the study was tocompare the results in this mouse model of FAS with theresults of clinical anthropometry measurements (Mooreet al., 2007). A similar discriminant analysis was used toidentify which combination of facial measurements wouldbest classify the embryos as being exposed in utero toalcohol, compared with all embryos that were not exposedto alcohol. To examine effects in dysmorphology because
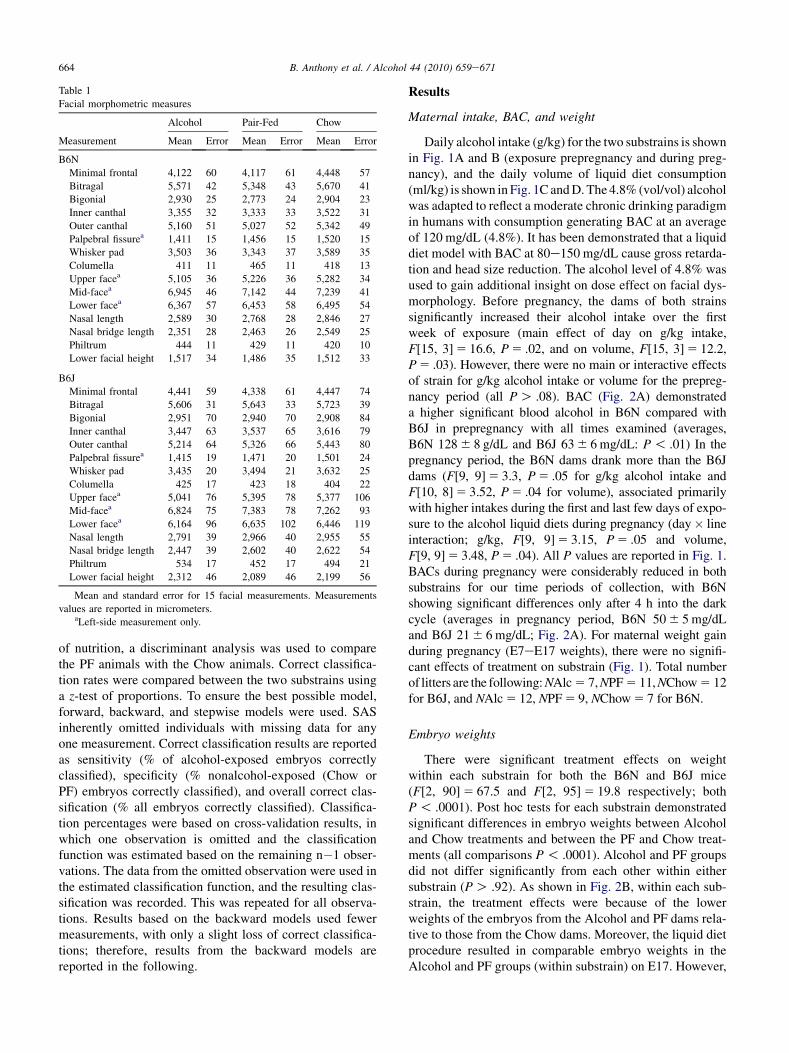
Table 1
Facial morphometric measures
Measurement
Alcohol Pair-Fed Chow
Mean Error Mean Error Mean Error
B6N
Minimal frontal 4,122 60 4,117 61 4,448 57
Bitragal 5,571 42 5,348 43 5,670 41
Bigonial 2,930 25 2,773 24 2,904 23
Inner canthal 3,355 32 3,333 33 3,522 31
Outer canthal 5,160 51 5,027 52 5,342 49
Palpebral fissurea 1,411 15 1,456 15 1,520 15
Whisker pad 3,503 36 3,343 37 3,589 35
Columella 411 11 465 11 418 13
Upper facea 5,105 36 5,226 36 5,282 34
Mid-facea 6,945 46 7,142 44 7,239 41
Lower facea 6,367 57 6,453 58 6,495 54
Nasal length 2,589 30 2,768 28 2,846 27
Nasal bridge length 2,351 28 2,463 26 2,549 25
Philtrum 444 11 429 11 420 10
Lower facial height 1,517 34 1,486 35 1,512 33
B6J
Minimal frontal 4,441 59 4,338 61 4,447 74
Bitragal 5,606 31 5,643 33 5,723 39
Bigonial 2,951 70 2,940 70 2,908 84
Inner canthal 3,447 63 3,537 65 3,616 79
Outer canthal 5,214 64 5,326 66 5,443 80
Palpebral fissurea 1,415 19 1,471 20 1,501 24
Whisker pad 3,435 20 3,494 21 3,632 25
Columella 425 17 423 18 404 22
Upper facea 5,041 76 5,395 78 5,377 106
Mid-facea 6,824 75 7,383 78 7,262 93
Lower facea 6,164 96 6,635 102 6,446 119
Nasal length 2,791 39 2,966 40 2,955 55
Nasal bridge length 2,447 39 2,602 40 2,622 54
Philtrum 534 17 452 17 494 21
Lower facial height 2,312 46 2,089 46 2,199 56
Mean and standard error for 15 facial measurements. Measurements
values are reported in micrometers.aLeft-side measurement only.
664 B. Anthony et al. / Alcohol 44 (2010) 659e671
of nutrition, a discriminant analysis was used to comparethe PF animals with the Chow animals. Correct classifica-tion rates were compared between the two substrains usinga z-test of proportions. To ensure the best possible model,forward, backward, and stepwise models were used. SASinherently omitted individuals with missing data for anyone measurement. Correct classification results are reportedas sensitivity (% of alcohol-exposed embryos correctlyclassified), specificity (% nonalcohol-exposed (Chow orPF) embryos correctly classified), and overall correct clas-sification (% all embryos correctly classified). Classifica-tion percentages were based on cross-validation results, inwhich one observation is omitted and the classificationfunction was estimated based on the remaining n�1 obser-vations. The data from the omitted observation were used inthe estimated classification function, and the resulting clas-sification was recorded. This was repeated for all observa-tions. Results based on the backward models used fewermeasurements, with only a slight loss of correct classifica-tions; therefore, results from the backward models arereported in the following.
Results
Maternal intake, BAC, and weight
Daily alcohol intake (g/kg) for the two substrains is shownin Fig. 1A and B (exposure prepregnancy and during preg-nancy), and the daily volume of liquid diet consumption(ml/kg) is shown in Fig. 1C and D. The 4.8% (vol/vol) alcoholwas adapted to reflect a moderate chronic drinking paradigmin humans with consumption generating BAC at an averageof 120 mg/dL (4.8%). It has been demonstrated that a liquiddiet model with BAC at 80e150 mg/dL cause gross retarda-tion and head size reduction. The alcohol level of 4.8% wasused to gain additional insight on dose effect on facial dys-morphology. Before pregnancy, the dams of both strainssignificantly increased their alcohol intake over the firstweek of exposure (main effect of day on g/kg intake,F[15, 3] 5 16.6, P 5 .02, and on volume, F[15, 3] 5 12.2,P 5 .03). However, there were no main or interactive effectsof strain for g/kg alcohol intake or volume for the prepreg-nancy period (all P O .08). BAC (Fig. 2A) demonstrateda higher significant blood alcohol in B6N compared withB6J in prepregnancy with all times examined (averages,B6N 128 6 8 g/dL and B6J 63 6 6 mg/dL: P ! .01) In thepregnancy period, the B6N dams drank more than the B6Jdams (F[9, 9] 5 3.3, P 5 .05 for g/kg alcohol intake andF[10, 8] 5 3.52, P 5 .04 for volume), associated primarilywith higher intakes during the first and last few days of expo-sure to the alcohol liquid diets during pregnancy (day� lineinteraction; g/kg, F[9, 9] 5 3.15, P 5 .05 and volume,F[9, 9] 5 3.48, P 5 .04). All P values are reported in Fig. 1.BACs during pregnancy were considerably reduced in bothsubstrains for our time periods of collection, with B6Nshowing significant differences only after 4 h into the darkcycle (averages in pregnancy period, B6N 50 6 5 mg/dLand B6J 21 6 6 mg/dL; Fig. 2A). For maternal weight gainduring pregnancy (E7eE17 weights), there were no signifi-cant effects of treatment on substrain (Fig. 1). Total numberof litters are the following: NAlc 5 7, NPF 5 11, NChow 5 12for B6J, and NAlc 5 12, NPF 5 9, NChow 5 7 for B6N.
Embryo weights
There were significant treatment effects on weightwithin each substrain for both the B6N and B6J mice(F[2, 90] 5 67.5 and F[2, 95] 5 19.8 respectively; bothP ! .0001). Post hoc tests for each substrain demonstratedsignificant differences in embryo weights between Alcoholand Chow treatments and between the PF and Chow treat-ments (all comparisons P ! .0001). Alcohol and PF groupsdid not differ significantly from each other within eithersubstrain (P O .92). As shown in Fig. 2B, within each sub-strain, the treatment effects were because of the lowerweights of the embryos from the Alcohol and PF dams rela-tive to those from the Chow dams. Moreover, the liquid dietprocedure resulted in comparable embryo weights in theAlcohol and PF groups (within substrain) on E17. However,

Table 2
Facial morphometric analysis
Measure
B6N B6J
Univariate
P value (a 5 0.0036) AlceChow AlcePF ChowePF
Univariate
P value (a 5 0.0036) AlceChow AlcePF ChowePF
Width
Minimal frontal .0001) 0.001) 1.00 0.001) .30
Bitragal .0001) 0.22 0.001) 0.0001) .07
Bigonial .0001) 0.71 0.0001) 0.001) .92
Inner canthal .0001) 0.0001) 0.88 0.11 .24
Outer canthal .0002) 0.03) 0.17 0.0001) .09
Palpebrala fissure .0001) 0.0001) 0.09 0.009) .02
Whisker pad .0001) 0.21 0.008) 0.0001) .0001) 0.0001) 0.10 0.0001)Columella .0027) 0.004) 0.02) .75
Depth
Upper facea .0019) 0.002) 0.03 � 0.20 .0001) 0.0001) 0.0001) 0.80
Mid-facea .0001) 0.0001) 0.008) 0.25 .0001) 0.001) 0.0001) 0.58
Lower facea .28 .004
Height
Nasal length .0001) 0.0001) 0.0001) 0.12 .005)Nasal bridge .0001) 0.0001) 0.012) 0.05 .008)Philtrum .20 .12
Lower facial height .80 .002) 0.12 0.001) 0.35
Alc 5 alcohol; PF 5 pair fed. B6N: multivariate analysis of variance (MANOVA) (n 5 84); Hotelling’s Trace F(30, 70) 5 3.7, P ! .0001; univariate
adjusted alpha 5 0.0033; ns 5 94e113. B6J: MANOVA (n 5 78); Hotelling’s Trace F(30, 65) 5 4.9, P ! .0001; univariate adjusted alpha 5 0.0033;
ns 5 98e118. P value of significant treatment main effects (within substrain) for each facial measure is indicated. For the paired comparisons (using Tu-
keyeKramer procedures), comparisons were made for Alc to Chow, PF to Chow, and Chow to PF groups. Bold-typed values under columns denote that
the overall treatment P value ! the Bonferroni-corrected a 5 0.0033. The symbol ‘‘)’’ denotes that the TukeyeKramer pair-wise comparison was significant
(P ! .05). Gray-shaded areas are measurements with significant difference between both control groups and alcohol-exposed group (AlcePF and AlceChow).
Significant treatment effect, a 5 0.0033; )P ! .05, TukeyeKramer; �P 5 .05, TukeyeKramer.aMeasure taken on left side.
665B. Anthony et al. / Alcohol 44 (2010) 659e671
embryo weights differed in the two substrains in terms of theeffects of consuming the control liquid diet. A two-way AN-OVA of embryo weights using the Chow and PF groups andthe two substrains confirmed a significant substrain� treat-ment interaction (F[1, 122] 5 44.9, P ! .0001) as well assignificant main effects of treatment (F[1, 122] 5 49.3,P ! .0001) and substrain (F[1, 122] 5 10.2, P 5 .002).The Chow group of the B6J substrain had higher bodyweights than the Chow group of the B6N substrain(P 5 .0001). More importantly, the B6N PF mice (givencontrol liquid diet) had greater reductions in embryo weights(relative to the respective Chow group) than did the B6J mice.Results are based on sample size: NAlc 5 37, NPF 5 44,NChow 5 40 for B6N embryos, and NAlc 5 54, NPF 5 41,NChow 5 28 for B6J embryos. Meanþ SEM weight forthe E17 embryos of the two substrains are shown in Fig. 2(B6N, n 5 121, and B6J, n 5 123).
2D facial measurements
The mean and standard errors for each of the 15 facialmeasurements across treatment groups for each substrainare shown in Table 1. The only difference betweensubstrains for the Chow-treated animals was in philtrumlength (P 5 .002). The PF animals were different for mostof the width measurements (minimal frontal, bitragal, bigo-nial, inner canthal, outer canthal, whisker pad, columella;
all P ! .0001), upper facial depth (P 5 .001), and nasallength (P 5 .0005). Columella width was larger in theB6N mice, but all other differences show larger B6Jmeasurements. The MANOVA models, testing overalltreatment effects, yielded significant treatment effects bothfor the B6N substrain (HotellingeLawley Trace 5 2.67,F[30, 70] 5 3.67, P ! .0001) and the B6J strain (Hotellin-geLawley Trace 5 3.86, F[30, 65] 5 4.92, P ! .0001). Inthe B6N substrain, significant treatment effects were foundfor all facial measurements (all P ! .0019), except forlower facial depth, philtrum length, and lower facial height(all P O .20). As shown in Table 2, significant differencesin the follow-up pair-wise comparisons were observedbetween the Alcohol and Chow (eight measurements),Alc and PF (eight measurements), and Chow and PF (sevenmeasurements) (all P ! .03). However, four measures wereidentified in the B6N strain for which the Alcohol groupdiffered significantly both from the PF and the Chowgroupdupper facial depth (both P ! .03), mid-facial depth(both P ! .008), nasal length (both P ! .0001), and nasalbridge (both P ! .01). In contrast, the B6J strain showedfewer measures with significant treatment effects (whiskerpad, upper facial depth, mid-facial depth, and lower facialheight, all P ! .002; see Table 2), and only two measureswere identified in the B6J strain in which the Alcohol groupdiffered significantly from both the PF and Chow groups(upper facial depth and mid-facial depth, both P ! .0001).
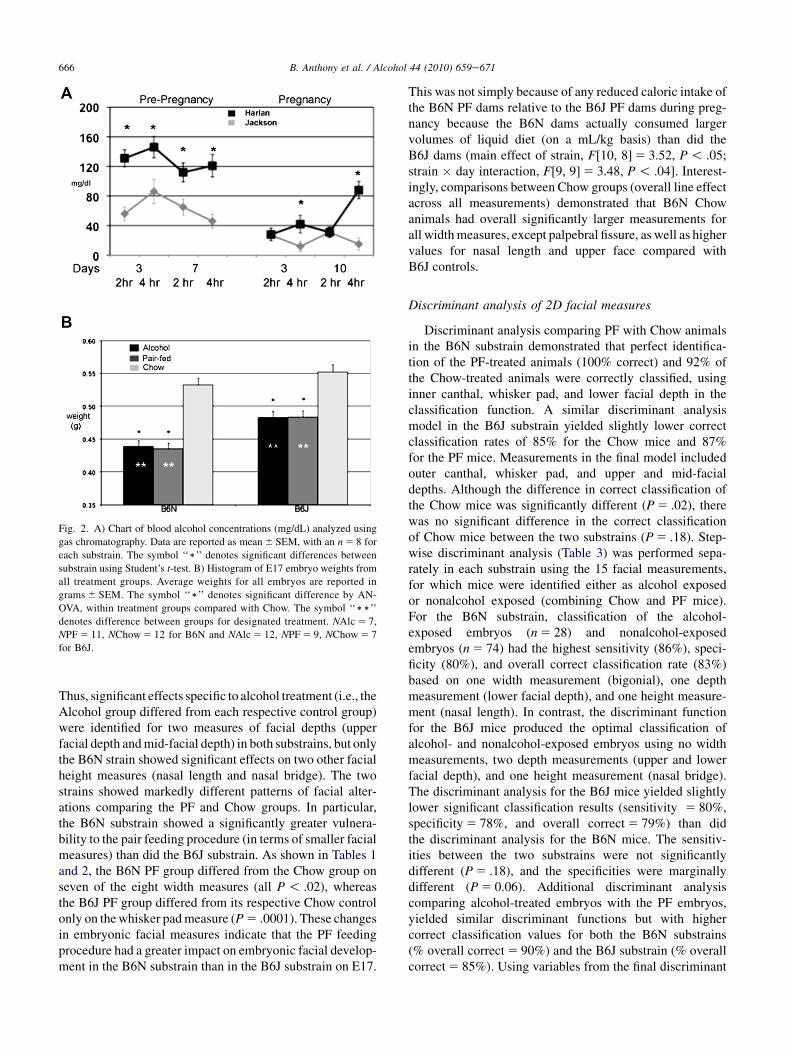
Fig. 2. A) Chart of blood alcohol concentrations (mg/dL) analyzed using
gas chromatography. Data are reported as mean 6 SEM, with an n 5 8 for
each substrain. The symbol ‘‘)’’ denotes significant differences between
substrain using Student’s t-test. B) Histogram of E17 embryo weights from
all treatment groups. Average weights for all embryos are reported in
grams 6 SEM. The symbol ‘‘)’’ denotes significant difference by AN-
OVA, within treatment groups compared with Chow. The symbol ‘‘))’’
denotes difference between groups for designated treatment. NAlc 5 7,
NPF 5 11, NChow 5 12 for B6N and NAlc 5 12, NPF 5 9, NChow 5 7
for B6J.
666 B. Anthony et al. / Alcohol 44 (2010) 659e671
Thus, significant effects specific to alcohol treatment (i.e., theAlcohol group differed from each respective control group)were identified for two measures of facial depths (upperfacial depth and mid-facial depth) in both substrains, but onlythe B6N strain showed significant effects on two other facialheight measures (nasal length and nasal bridge). The twostrains showed markedly different patterns of facial alter-ations comparing the PF and Chow groups. In particular,the B6N substrain showed a significantly greater vulnera-bility to the pair feeding procedure (in terms of smaller facialmeasures) than did the B6J substrain. As shown in Tables 1and 2, the B6N PF group differed from the Chow group onseven of the eight width measures (all P ! .02), whereasthe B6J PF group differed from its respective Chow controlonly on the whisker pad measure (P 5 .0001). These changesin embryonic facial measures indicate that the PF feedingprocedure had a greater impact on embryonic facial develop-ment in the B6N substrain than in the B6J substrain on E17.
This was not simply because of any reduced caloric intake ofthe B6N PF dams relative to the B6J PF dams during preg-nancy because the B6N dams actually consumed largervolumes of liquid diet (on a mL/kg basis) than did theB6J dams (main effect of strain, F[10, 8] 5 3.52, P ! .05;strain � day interaction, F[9, 9] 5 3.48, P ! .04]. Interest-ingly, comparisons between Chow groups (overall line effectacross all measurements) demonstrated that B6N Chowanimals had overall significantly larger measurements forall width measures, except palpebral fissure, as well as highervalues for nasal length and upper face compared withB6J controls.
Discriminant analysis of 2D facial measures
Discriminant analysis comparing PF with Chow animalsin the B6N substrain demonstrated that perfect identifica-tion of the PF-treated animals (100% correct) and 92% ofthe Chow-treated animals were correctly classified, usinginner canthal, whisker pad, and lower facial depth in theclassification function. A similar discriminant analysismodel in the B6J substrain yielded slightly lower correctclassification rates of 85% for the Chow mice and 87%for the PF mice. Measurements in the final model includedouter canthal, whisker pad, and upper and mid-facialdepths. Although the difference in correct classification ofthe Chow mice was significantly different (P 5 .02), therewas no significant difference in the correct classificationof Chow mice between the two substrains (P 5 .18). Step-wise discriminant analysis (Table 3) was performed sepa-rately in each substrain using the 15 facial measurements,for which mice were identified either as alcohol exposedor nonalcohol exposed (combining Chow and PF mice).For the B6N substrain, classification of the alcohol-exposed embryos (n 5 28) and nonalcohol-exposedembryos (n 5 74) had the highest sensitivity (86%), speci-ficity (80%), and overall correct classification rate (83%)based on one width measurement (bigonial), one depthmeasurement (lower facial depth), and one height measure-ment (nasal length). In contrast, the discriminant functionfor the B6J mice produced the optimal classification ofalcohol- and nonalcohol-exposed embryos using no widthmeasurements, two depth measurements (upper and lowerfacial depth), and one height measurement (nasal bridge).The discriminant analysis for the B6J mice yielded slightlylower significant classification results (sensitivity 5 80%,specificity 5 78%, and overall correct 5 79%) than didthe discriminant analysis for the B6N mice. The sensitiv-ities between the two substrains were not significantlydifferent (P 5 .18), and the specificities were marginallydifferent (P 5 0.06). Additional discriminant analysiscomparing alcohol-treated embryos with the PF embryos,yielded similar discriminant functions but with highercorrect classification values for both the B6N substrains(% overall correct 5 90%) and the B6J substrain (% overallcorrect 5 85%). Using variables from the final discriminant
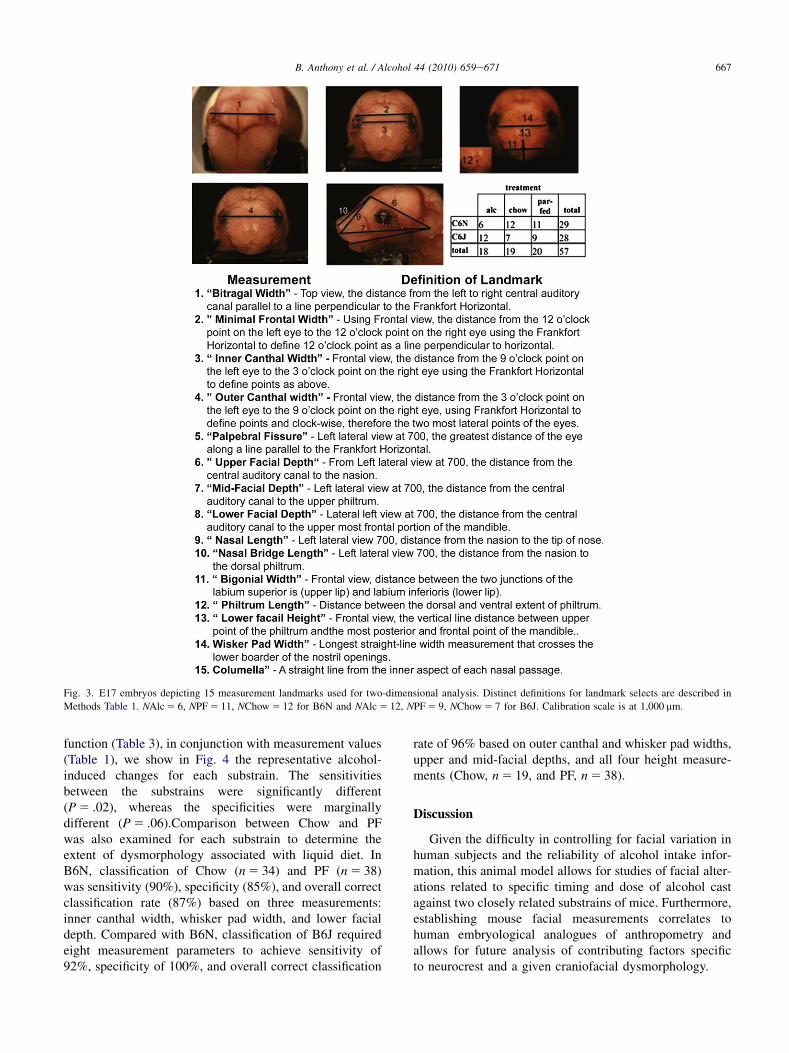
Fig. 3. E17 embryos depicting 15 measurement landmarks used for two-dimensional analysis. Distinct definitions for landmark selects are described in
Methods Table 1. NAlc 5 6, NPF 5 11, NChow 5 12 for B6N and NAlc 5 12, NPF 5 9, NChow 5 7 for B6J. Calibration scale is at 1,000 mm.
667B. Anthony et al. / Alcohol 44 (2010) 659e671
function (Table 3), in conjunction with measurement values(Table 1), we show in Fig. 4 the representative alcohol-induced changes for each substrain. The sensitivitiesbetween the substrains were significantly different(P 5 .02), whereas the specificities were marginallydifferent (P 5 .06).Comparison between Chow and PFwas also examined for each substrain to determine theextent of dysmorphology associated with liquid diet. InB6N, classification of Chow (n 5 34) and PF (n 5 38)was sensitivity (90%), specificity (85%), and overall correctclassification rate (87%) based on three measurements:inner canthal width, whisker pad width, and lower facialdepth. Compared with B6N, classification of B6J requiredeight measurement parameters to achieve sensitivity of92%, specificity of 100%, and overall correct classification
rate of 96% based on outer canthal and whisker pad widths,upper and mid-facial depths, and all four height measure-ments (Chow, n 5 19, and PF, n 5 38).
Discussion
Given the difficulty in controlling for facial variation inhuman subjects and the reliability of alcohol intake infor-mation, this animal model allows for studies of facial alter-ations related to specific timing and dose of alcohol castagainst two closely related substrains of mice. Furthermore,establishing mouse facial measurements correlates tohuman embryological analogues of anthropometry andallows for future analysis of contributing factors specificto neurocrest and a given craniofacial dysmorphology.
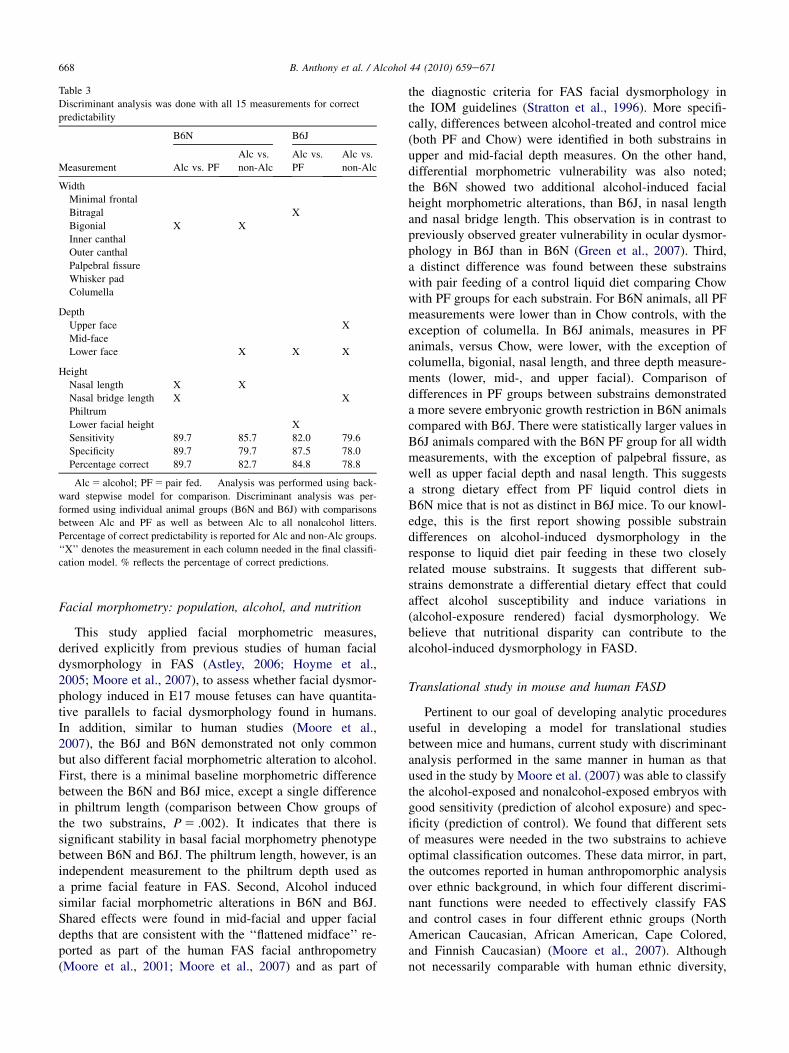
Table 3
Discriminant analysis was done with all 15 measurements for correct
predictability
Measurement
B6N B6J
Alc vs. PF
Alc vs.
non-Alc
Alc vs.
PF
Alc vs.
non-Alc
Width
Minimal frontal
Bitragal X
Bigonial X X
Inner canthal
Outer canthal
Palpebral fissure
Whisker pad
Columella
Depth
Upper face X
Mid-face
Lower face X X X
Height
Nasal length X X
Nasal bridge length X X
Philtrum
Lower facial height X
Sensitivity 89.7 85.7 82.0 79.6
Specificity 89.7 79.7 87.5 78.0
Percentage correct 89.7 82.7 84.8 78.8
Alc 5 alcohol; PF 5 pair fed. Analysis was performed using back-
ward stepwise model for comparison. Discriminant analysis was per-
formed using individual animal groups (B6N and B6J) with comparisons
between Alc and PF as well as between Alc to all nonalcohol litters.
Percentage of correct predictability is reported for Alc and non-Alc groups.
‘‘X’’ denotes the measurement in each column needed in the final classifi-
cation model. % reflects the percentage of correct predictions.
668 B. Anthony et al. / Alcohol 44 (2010) 659e671
Facial morphometry: population, alcohol, and nutrition
This study applied facial morphometric measures,derived explicitly from previous studies of human facialdysmorphology in FAS (Astley, 2006; Hoyme et al.,2005; Moore et al., 2007), to assess whether facial dysmor-phology induced in E17 mouse fetuses can have quantita-tive parallels to facial dysmorphology found in humans.In addition, similar to human studies (Moore et al.,2007), the B6J and B6N demonstrated not only commonbut also different facial morphometric alteration to alcohol.First, there is a minimal baseline morphometric differencebetween the B6N and B6J mice, except a single differencein philtrum length (comparison between Chow groups ofthe two substrains, P 5 .002). It indicates that there issignificant stability in basal facial morphometry phenotypebetween B6N and B6J. The philtrum length, however, is anindependent measurement to the philtrum depth used asa prime facial feature in FAS. Second, Alcohol inducedsimilar facial morphometric alterations in B6N and B6J.Shared effects were found in mid-facial and upper facialdepths that are consistent with the ‘‘flattened midface’’ re-ported as part of the human FAS facial anthropometry(Moore et al., 2001; Moore et al., 2007) and as part of
the diagnostic criteria for FAS facial dysmorphology inthe IOM guidelines (Stratton et al., 1996). More specifi-cally, differences between alcohol-treated and control mice(both PF and Chow) were identified in both substrains inupper and mid-facial depth measures. On the other hand,differential morphometric vulnerability was also noted;the B6N showed two additional alcohol-induced facialheight morphometric alterations, than B6J, in nasal lengthand nasal bridge length. This observation is in contrast topreviously observed greater vulnerability in ocular dysmor-phology in B6J than in B6N (Green et al., 2007). Third,a distinct difference was found between these substrainswith pair feeding of a control liquid diet comparing Chowwith PF groups for each substrain. For B6N animals, all PFmeasurements were lower than in Chow controls, with theexception of columella. In B6J animals, measures in PFanimals, versus Chow, were lower, with the exception ofcolumella, bigonial, nasal length, and three depth measure-ments (lower, mid-, and upper facial). Comparison ofdifferences in PF groups between substrains demonstrateda more severe embryonic growth restriction in B6N animalscompared with B6J. There were statistically larger values inB6J animals compared with the B6N PF group for all widthmeasurements, with the exception of palpebral fissure, aswell as upper facial depth and nasal length. This suggestsa strong dietary effect from PF liquid control diets inB6N mice that is not as distinct in B6J mice. To our knowl-edge, this is the first report showing possible substraindifferences on alcohol-induced dysmorphology in theresponse to liquid diet pair feeding in these two closelyrelated mouse substrains. It suggests that different sub-strains demonstrate a differential dietary effect that couldaffect alcohol susceptibility and induce variations in(alcohol-exposure rendered) facial dysmorphology. Webelieve that nutritional disparity can contribute to thealcohol-induced dysmorphology in FASD.
Translational study in mouse and human FASD
Pertinent to our goal of developing analytic proceduresuseful in developing a model for translational studiesbetween mice and humans, current study with discriminantanalysis performed in the same manner in human as thatused in the study by Moore et al. (2007) was able to classifythe alcohol-exposed and nonalcohol-exposed embryos withgood sensitivity (prediction of alcohol exposure) and spec-ificity (prediction of control). We found that different setsof measures were needed in the two substrains to achieveoptimal classification outcomes. These data mirror, in part,the outcomes reported in human anthropomorphic analysisover ethnic background, in which four different discrimi-nant functions were needed to effectively classify FASand control cases in four different ethnic groups (NorthAmerican Caucasian, African American, Cape Colored,and Finnish Caucasian) (Moore et al., 2007). Althoughnot necessarily comparable with human ethnic diversity,
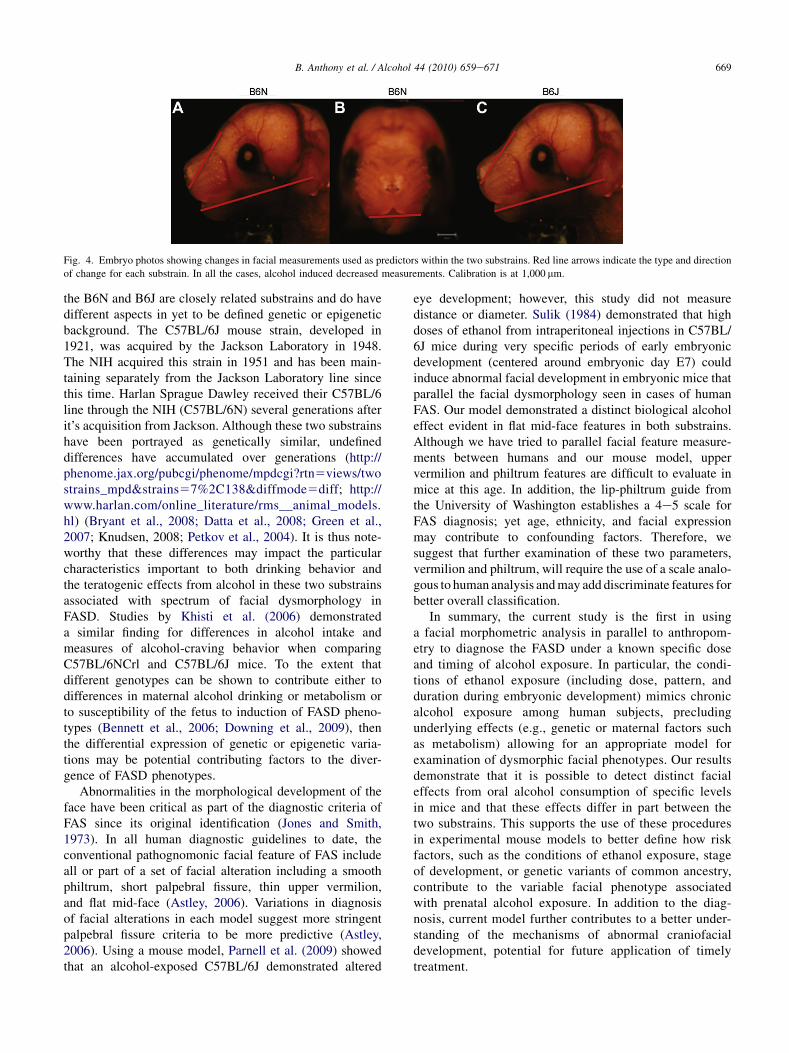
Fig. 4. Embryo photos showing changes in facial measurements used as predictors within the two substrains. Red line arrows indicate the type and direction
of change for each substrain. In all the cases, alcohol induced decreased measurements. Calibration is at 1,000 mm.
669B. Anthony et al. / Alcohol 44 (2010) 659e671
the B6N and B6J are closely related substrains and do havedifferent aspects in yet to be defined genetic or epigeneticbackground. The C57BL/6J mouse strain, developed in1921, was acquired by the Jackson Laboratory in 1948.The NIH acquired this strain in 1951 and has been main-taining separately from the Jackson Laboratory line sincethis time. Harlan Sprague Dawley received their C57BL/6line through the NIH (C57BL/6N) several generations afterit’s acquisition from Jackson. Although these two substrainshave been portrayed as genetically similar, undefineddifferences have accumulated over generations (http://phenome.jax.org/pubcgi/phenome/mpdcgi?rtn5views/twostrains_mpd&strains57%2C138&diffmode5diff; http://www.harlan.com/online_literature/rms__animal_models.hl) (Bryant et al., 2008; Datta et al., 2008; Green et al.,2007; Knudsen, 2008; Petkov et al., 2004). It is thus note-worthy that these differences may impact the particularcharacteristics important to both drinking behavior andthe teratogenic effects from alcohol in these two substrainsassociated with spectrum of facial dysmorphology inFASD. Studies by Khisti et al. (2006) demonstrateda similar finding for differences in alcohol intake andmeasures of alcohol-craving behavior when comparingC57BL/6NCrl and C57BL/6J mice. To the extent thatdifferent genotypes can be shown to contribute either todifferences in maternal alcohol drinking or metabolism orto susceptibility of the fetus to induction of FASD pheno-types (Bennett et al., 2006; Downing et al., 2009), thenthe differential expression of genetic or epigenetic varia-tions may be potential contributing factors to the diver-gence of FASD phenotypes.
Abnormalities in the morphological development of theface have been critical as part of the diagnostic criteria ofFAS since its original identification (Jones and Smith,1973). In all human diagnostic guidelines to date, theconventional pathognomonic facial feature of FAS includeall or part of a set of facial alteration including a smoothphiltrum, short palpebral fissure, thin upper vermilion,and flat mid-face (Astley, 2006). Variations in diagnosisof facial alterations in each model suggest more stringentpalpebral fissure criteria to be more predictive (Astley,2006). Using a mouse model, Parnell et al. (2009) showedthat an alcohol-exposed C57BL/6J demonstrated altered
eye development; however, this study did not measuredistance or diameter. Sulik (1984) demonstrated that highdoses of ethanol from intraperitoneal injections in C57BL/6J mice during very specific periods of early embryonicdevelopment (centered around embryonic day E7) couldinduce abnormal facial development in embryonic mice thatparallel the facial dysmorphology seen in cases of humanFAS. Our model demonstrated a distinct biological alcoholeffect evident in flat mid-face features in both substrains.Although we have tried to parallel facial feature measure-ments between humans and our mouse model, uppervermilion and philtrum features are difficult to evaluate inmice at this age. In addition, the lip-philtrum guide fromthe University of Washington establishes a 4e5 scale forFAS diagnosis; yet age, ethnicity, and facial expressionmay contribute to confounding factors. Therefore, wesuggest that further examination of these two parameters,vermilion and philtrum, will require the use of a scale analo-gous to human analysis and may add discriminate features forbetter overall classification.
In summary, the current study is the first in usinga facial morphometric analysis in parallel to anthropom-etry to diagnose the FASD under a known specific doseand timing of alcohol exposure. In particular, the condi-tions of ethanol exposure (including dose, pattern, andduration during embryonic development) mimics chronicalcohol exposure among human subjects, precludingunderlying effects (e.g., genetic or maternal factors suchas metabolism) allowing for an appropriate model forexamination of dysmorphic facial phenotypes. Our resultsdemonstrate that it is possible to detect distinct facialeffects from oral alcohol consumption of specific levelsin mice and that these effects differ in part between thetwo substrains. This supports the use of these proceduresin experimental mouse models to better define how riskfactors, such as the conditions of ethanol exposure, stageof development, or genetic variants of common ancestry,contribute to the variable facial phenotype associatedwith prenatal alcohol exposure. In addition to the diag-nosis, current model further contributes to a better under-standing of the mechanisms of abnormal craniofacialdevelopment, potential for future application of timelytreatment.
670 B. Anthony et al. / Alcohol 44 (2010) 659e671
Acknowledgments
This study is supported by National Institute on AlcoholAbuse AA016698 to FCZ, a part of Collaborative Initiativeon Fetal Alcohol Spectrum Disorders (CIFASD) Consor-tium. CG is a co-investigator, BA is a postdoctoral fellowcontributing to animal drinking paradigm and facialmeasurement acquisition and analysis, SV-B is a researchassistant contributing to micro-video facial image andmorphometric measurement acquisition, RW contributed tomorphometry design, and LW contributed to statistical anal-yses. All or part of this work was done in conjunction with theCIFASD, which is funded by grants from the National Insti-tute on Alcohol and Alcohol Abuse. ER is the PI of theAdministrative Core of the CIFASD (AA014811) and canbe contacted at [email protected]. Send publicationrequest to FCZ at [email protected].
Supplementary information
Supplementary data associated with this article can befound, in the online version, at 10.1016/j.alcohol.2010.04.002
References
Astley, S. J. (2006). Comparison of the 4-digit diagnostic code and the
Hoyme diagnostic guidelines for fetal alcohol spectrum disorders.
Pediatrics 118, 1532–1545.
Astley, S. J., and Clarren, S. K. (2000). Diagnosing the full spectrum of
fetal alcohol-exposed individuals: introducing the 4-digit diagnostic
code. Alcohol Alcohol. 35, 400–410.
Astley, S. J., and Clarren, S. K. (2001). Measuring the facial phenotype of
individuals with prenatal alcohol exposure: correlations with brain
dysfunction. Alcohol Alcohol. 36, 147–159.
Astley, S. J., Stachowiak, J., Clarren, S. K., and Clausen, C. (2002). Appli-
cation of the fetal alcohol syndrome facial photographic screening tool
in a foster care population. J. Pediatr. 141, 712–717.
Barr, H. M., and Streissguth, A. P. (2001). Identifying maternal self-
reported alcohol use associated with fetal alcohol spectrum disorders.
Alcohol. Clin. Exp. Res. 25, 283–287.
Bennett, B., Downing, C., Parker, C., and Johnson, T. E. (2006). Mouse
genetic models in alcohol research. Trends Genet. 22, 367–374.
Bertrand, J., Floyd, L. L., and Weber, M. K. (2005). Guidelines for
identifying and referring persons with fetal alcohol syndrome. MMWR
Recomm. Rep. 54, 1–14.
Bryant, C. D., Zhang, N. N., Sokoloff, G., Fanselow, M. S., Ennes, H. S.,
Palmer, A. A., et al. (2008). Behavioral differences among C57BL/6
sub-strains: implications for transgenic and knockout studies. J. Neuro-
genet. 22, 315–331.
Cartwright, M. M., and Smith, S. M. (1995). Stage-dependent effects of
ethanol on cranial neural crest cell development: partial basis for the
phenotypic variations observed in fetal alcohol syndrome. Alcohol.
Clin. Exp. Res. 19, 1454–1462.
Chen, S. Y., Periasamy, A., Yang, B., Herman, B., Jacobson, K., and
Sulik, K. K. (2000). Differential sensitivity of mouse neural crest cells
to ethanol-induced toxicity. Alcohol 20, 75–81.
Chudley, A. E., Conry, J., Cook, J. L., Loock, C., Rosales, T., and
LeBlanc, N. (2005). Fetal alcohol spectrum disorder: Canadian guide-
lines for diagnosis. CMAJ 172, S1–S21.
Datta, S., Turner, D., Singh, R., Ruest, L. B., Pierce, W. M. Jr., and
Knudsen, T. B. (2008). Fetal alcohol syndrome (FAS) in C57BL/6 mice
detected through proteomics screening of the amniotic fluid. Birth
Defects Res. Part A Clin. Mol. Teratol. 82, 177–186.
Degitz, S. J., Zucker, R. M., Kawanishi, C. Y., Massenburg, G. S., and
Rogers, J. M. (2004). Pathogenesis of methanol-induced craniofacial
defects in C57BL/6J mice. Birth Defects Res A Clin. Mol. Teratol
70, 172–178.
Downing, C., Balderrama-Durbin, C., Broncucia, H., Gilliam, D., and
Johnson, T. E. (2009). Ethanol teratogenesis in five inbred strains of
mice. Alcohol. Clin. Exp. Res. 33, 1238–1245.
Fang, S., Liu, Y., Huang, J., Vinci-Booher, S., Anthony, B., and Zhou, F.C.
(2009). Alcohol exposure analysis of mouse embryos using multi-angle
facial image analysis. Proceedings of Association for Computing
Machinery Symposium on Applied Computing, March 9-12, 2009.
Honolulu, Hawaii, USA, pp. 852e856.
Ferrario, V. F., Sforza, C., Poggio, C. E., Cova, M., and Tartaglia, G. (1998).
Preliminary evaluation of an electromagnetic three-dimensional digi-
tizer in facial anthropometry. Cleft Palate Craniofac. J. 35, 9–15.
Goodlett, C. R., and Horn, K. H. (2001). Mechanisms of alcohol-induced
damage to the developing nervous system. Alcohol Res. Health 25,
175–184.
Goodlett, C. R., Horn, K. H., and Zhou, F. C. (2005). Alcohol teratogen-
esis: mechanisms of damage and strategies for intervention. Exp. Biol.
Med. 230, 394–406.
Green, M. L., Singh, A. V., Zhang, Y., Nemeth, K. A., Sulik, K. K., and
Knudsen, T. B. (2007). Reprogramming of genetic networks during
initiation of the fetal alcohol syndrome. Dev. Dyn. 236, 613–631.
Hoyme, H. E., May, P. A., Kalberg, W. O., Kodituwakku, P., Gossage, J. P.,
Trujillo, P. M., et al. (2005). A practical clinical approach to diagnosis
of fetal alcohol spectrum disorders: clarification of the 1996 institute of
medicine criteria. Pediatrics 115, 39–47.
Hurwitz, D. J., Ashby, E. R., Llull, R., Pasqual, J., Tabor, C., Garrison, L.,
et al. (1999). Computer-assisted anthropometry for outcome assess-
ment of cleft lip. Plast. Reconstr. Surg. 103, 1608–1623.
Johnson, V. P., Swayze, V. W. 2nd, Sato, Y., and Andreasen, N. C. (1996).
Fetal alcohol syndrome: craniofacial and central nervous system mani-
festations. Am. J. Med. Genet. 61, 329–339.
Jones, K. L., and Smith, D. W. (1973). Recognition of the fetal alcohol
syndrome in early infancy. Lancet 2, 999–1001.
Khisti, R. T., Wolstenholme, J., Shelton, K. L., and Miles, M. F. (2006).
Characterization of the ethanol-deprivation effect in substrains of
C57BL/6 mice. Alcohol 40, 119–126.
Loock, C., Conry, J., Cook, J. L., Chudley, A. E., and Rosales, T. (2005).
Identifying fetal alcohol spectrum disorder in primary care. CMAJ 172,
628–630.
Moore, E. S., Ward, R. E., Jamison, P. L., Morris, C. A., Bader, P. I., and
Hall, B. D. (2001). The subtle facial signs of prenatal exposure to
alcohol: an anthropometric approach. J. Pediatr. 139, 215–219.
Moore, E. S., Ward, R. E., Jamison, P. L., Morris, C. A., Bader, P. I., and
Hall, B. D. (2002). New perspectives on the face in fetal alcohol syndrome:
what anthropometry tells us. Am. J. Med. Genet. 109, 249–260.
Moore, E. S., Ward, R. E., Wetherill, L. F., Rogers, J. L., Autti-Ramo, I.,
Fagerlund, A., et al. (2007). Unique facial features distinguish fetal
alcohol syndrome patients and controls in diverse ethnic populations.
Alcohol. Clin. Exp. Res. 31, 1707–1713.
Ogawa, T., Kuwagata, M., Ruiz, J., and Zhou, F. C. (2005). Differential
teratogenic effect of alcohol on embryonic development between
C57BL/6 and DBA/2 mice: a new view. Alcohol. Clin. Exp. Res. 29,
855–863.
Parnell, S. E., Dehart, D. B., Wills, T. A., Chen, S. Y., Hodge, C. W.,
Besheer, J., et al. (2006). Maternal oral intake mouse model for fetal
alcohol spectrum disorders: ocular defects as a measure of effect.
Alcohol. Clin. Exp. Res. 30, 1791–1798.
Parnell, S. E., O’Leary-Moore, S. K., Godin, E. A., Dehart, D. B.,
Johnson, B. W., Allan Johnson, G., et al. (2009). Magnetic resonance
microscopy defines ethanol-induced brain abnormalities in prenatal
671B. Anthony et al. / Alcohol 44 (2010) 659e671
mice: effects of acute insult on gestational day 8. Alcohol. Clin. Exp.
Res. 33, 1001–1011.
Petkov, P. M., Ding, Y., Cassell, M. A., Zhang, W., Wagner, G.,
Sargent, E. E., et al. (2004). An efficient SNP system for mouse
genome scanning and elucidating strain relationships. Genome Res.
14, 1806–1811.
Centers for Disease Control and Prevention (2004). Fetal Alcohol
Syndrome: Guidelines for Referral and Diagnosis. Atlanta, GA:
Centers for Disease Control and Prevention.
Sokol, R. J., Delaney-Black, V., and Nordstrom, B. (2003). Fetal alcohol
spectrum disorder. JAMA 290, 2996–2999.
Stratton, K. M., Howe., C., and Battaglia, F. (1996). Fetal Alcohol
Syndrome: Diagnosis, Epidemiology, Prevention, and Treatment.
Washington, D.C: Institute of Medicine. National Academy Press.
Streissguth, A. P., Aase, J. M., Clarren, S. K., Randels, S. P., LaDue, R. A.,
and Smith, D. F. (1991). Fetal alcohol syndrome in adolescents and
adults. JAMA 265, 1961–1967.
Sulik, K. K. (1984). Critical periods for alcohol teratogenesis in mice, with
special reference to the gastrulation stage of embryogenesis. Ciba
Found. Symp. 105, 124–141.
Sulik, K. K. (2005). Genesis of alcohol-induced craniofacial dysmorphism.
Exp. Biol. Med. 230, 366–375.
Sulik, K. K., Johnston, M. C., Daft, P. A., Russell, W. E., and
Dehart, D. B. (1986). Fetal alcohol syndrome and DiGeorge
anomaly: critical ethanol exposure periods for craniofacial malfor-
mations as illustrated in an animal model. Am. J. Med. Genet. Suppl.
2, 97–112.
Swayze, V. W. 2nd, Johnson, V. P., Hanson, J. W., Piven, J., Sato, Y.,
Giedd, J. N., Mosnik, D., and Andreasen, N. C. (1997). Magnetic reso-
nance imaging of brain anomalies in fetal alcohol syndrome. Pediatrics
99, 232–240.
Zhou, F. C., Sari, Y., Powrozek, T., Goodlett, C. R., and Li, T. K. (2003).
Moderate alcohol exposure compromises neural tube midline develop-
ment in prenatal brain. Brain Res. 144, 43–55.