Alberta's Occupational Supply Outlook Education and Skills ... · Age/Sex/Net Migration...
18
ALBERTA’S SUPPLY OUTLOOK MODEL 2011 – 2021 Education and Skills
-
Upload
truonghanh -
Category
Documents
-
view
216 -
download
1
Transcript of Alberta's Occupational Supply Outlook Education and Skills ... · Age/Sex/Net Migration...
ALBERTA’S SUPPLY OUTLOOK MODEL
2011 – 2021
Education and Skills

Highlights
1
• The proportion of Albertans with a post-secondary education is expected to increase
from 52.6% to 59.3% over the forecast period of 2011 to 2021.
• More females than males, 62.3% compared to 56.4%, are expected to obtain a post-
secondary education by 2021.
• More people will graduate from education, humanities, social science, physical and life
sciences, and mathematical and computer sciences at universities than at college and
trade institutions.
• More people will graduate from visual and performing arts, business, architecture and
engineering, agriculture, health, and personal services at college and trade institutions
than at universities.
• At college and trade institutions, a higher percentage of males than females will
graduate from physical and life sciences, mathematical and computer sciences,
architecture and engineering, and agriculture. Females are expected to have higher
percentages in education, business, visual and performing arts, social sciences, and
health.
• Of those Albertans with university degrees, females are more likely than males to
graduate in education and health fields. Males are more likely to graduate in
architecture and engineering and mathematical and computer science.

Introduction
2
Every two years Alberta Human Services produces Alberta’s Occupational Demand and
Supply Outlook Models1. Alberta’s supply outlook model provides labour supply
forecasts by occupation covering a 10-year forecast period. The model contains 30
linked sub-models and more than 100,000 data series.
The education sub-model is a critical component of the supply outlook model. The
model forecasts the number of enrolments and graduates across eleven major fields of
study, listed in Appendix A, for different levels of schooling. These forecasts can be
translated into the occupations where these people are expected to look for
employment. Figure 1 provides an overview of the supply outlook model and the role of
the education component in forecasting labour supply.
The first section of the report looks at the projected educational attainment levels of
Alberta’s population. The remainder of the report gives an analysis of the major fields of
study at different post-secondary education levels and by gender. Following the text,
Appendix B details the assumptions underlying the education forecasts and Appendix C
shows the results of the model projections.
1 Available at http://employment.alberta.ca/documents/LMI/LMI-LMF_occ_demand_supply.pdf
An Overview of Alberta's Occupational Supply Outlook Model
Demographic Projection Gross Migration & Ethnicity/Disability
Distribution Assumptions
Demographic Outlook Age/Sex/Net Migration
Participation Rate Stock-Flow Co-efficient
projection
Labour Supply by OccupationAge/Gender/Ethnicity/
Work Activity Limitations
Enrolment, Graduation, Educational Attainment by
Level of Schooling & Major Field of
Study
Demographic Component
Education Component
Figure 1
An Overview of Alberta's Supply Outlook Model

Educational Attainment
3
Over the forecast period of 2011 to 2021, the proportion of people with a post-secondary
education is expected to increase from 52.6% to 59.3%. Meanwhile, the other categories,
less than high school and high school, are expected to decrease. Chart 1 compares the
proportion of each gender projected to have attained each level of education in 2011 and
2021. It is expected that the proportion of females with post-secondary education in 2021
will exceed that of males, 62.3% compared to 56.4%. Chart 1
Female and Male Educational Attainment, 2011 and 2021
25.5
%
27.7
%
26.5
%
20.3
%
22.3
%29.7
%
26.7
%
21.4
%
32.2
%
30.0
%
21.6
%
16.2
% 26.3
%30.1
%
27.2
%
16.5
%
0%5%
10%15%20%25%30%35%
Less Than HighSchool
High School College and Trade University Degree
Females, 2011 Males, 2011 Females, 2021 Males, 2021
Data Source: Alberta’s Occupational Supply Outlook Model, 2011-2021 Chart 2 shows the average annual change in educational attainment between 2011 and
2021 for males, females, and for both genders. Attainment of degrees shows the highest
average annual change (+3.7%) while less than high school attainment has the lowest
(-1.0%). Females are expected to have higher growth rates than males for post-
secondary levels of attainment. Both genders will see a decline in levels for the less than
high school category.
Chart 2
Average Annual Change in Educational Attainment, 2011 - 2021
0.8%
4.1%
2.5%
-0.8% -0.3%
3.2%
-1.3%
1.6%1.8%
3.7%
-1.0%
2.0%
-2%-1%0%1%2%3%4%5%
Less Than HighSchool
High School College and Trade University Degree
Females
Males
Both Genders
Data Source: Alberta’s Occupational Supply Outlook Model, 2011-2021

Major Fields of Study: College and Trade Institutions and Universities
4
Chart 3 compares the average proportions in each major field of study at college and
trade institutions and at universities. Compared to college and trade institutions,
universities will have higher proportions of graduates with education, humanities, social,
science, physical and life science, and mathematical and computer science
qualifications. Conversely, college and trade institutions will graduate higher proportions
in the fields of visual and performing arts, business, architecture and engineering,
agriculture, health, and personal services. These differences persist over the forecast
period of 2011 to 2021.
Chart 3
Average Proportions in Major Fields of Study College and Trade Institutions and Universities, 2011 - 2021
1.5%3.8% 2.1%
5.0%
21.5%
1.1%5.4%
3.0%
16.0%
9.1%12.3%
8.1%
15.4%
7.6% 6.1%
11.9%
31.4%
2.1%
19.2%
3.1%
13.7%
0.5%0%5%
10%15%20%25%30%35%
Edu
catio
n
Vis
ual a
ndpe
rform
ing
arts
,an
dco
mm
unic
atio
nste
chno
logi
es
Hum
anitie
s
Soc
ial a
ndbe
havi
oura
lsc
ienc
es a
ndla
w
Bus
ines
s,m
anag
emen
tan
d pu
blic
adm
inis
tratio
n
Phy
sica
l and
life s
cien
ces
and
tech
nolo
gies
Mat
hem
atic
s,co
mpu
ter a
ndin
form
atio
nsc
ienc
es
Arc
hite
ctur
e,en
gine
erin
g, a
ndre
late
dte
chno
logi
es
Agr
icul
ture
,na
tura
lre
sour
ces
and
cons
erva
tion
Hea
lth, p
arks
,re
crea
tion
and
fitne
ss
Per
sona
l,pr
otec
tive
and
trans
porta
tion
serv
ices
College and Trade Institutions Universities
Data Source: Alberta’s Occupational Supply Outlook Model, 2011-2021

Major Fields of Study: College and Trade Institutions
5
Chart 4 shows the average proportions of all university graduates in each major field of
study by gender for 2011 to 2021. A higher proportion of females than males is
expected to graduate with qualifications in education, visual and performing arts,
humanities, social science, and health. Males are expected to graduate in higher
proportions in business, physical and life sciences, architecture and engineering,
mathematical and computer sciences, agriculture, and personal services. This
continues traditional gender patterns in fields of study.
Chart 4
Average Proportions in Major Fields of Study Universities, 2011 - 2021
17.0%
3.7%
9.2%
17.1%
6.8%
1.7%
18.9%
13.5%
8.6% 9.4%
21.1%
18.2%
3.3% 3.9%
0.3%
6.8%
2.4%
6.9%
20.4%
0.8%
7.6%
2.6%
0%
5%
10%
15%
20%
25%
Edu
catio
n
Vis
ual a
ndpe
rform
ing
arts
,an
dco
mm
unic
atio
nste
chno
logi
es
Hum
anitie
s
Soc
ial a
ndbe
havi
oura
lsc
ienc
es a
ndla
w
Bus
ines
s,m
anag
emen
tan
d pu
blic
adm
inis
tratio
n
Phy
sica
l and
life s
cien
ces
and
tech
nolo
gies
Mat
hem
atic
s,co
mpu
ter a
ndin
form
atio
nsc
ienc
es
Arc
hite
ctur
e,en
gine
erin
g, a
ndre
late
dte
chno
logi
es
Agr
icul
ture
,na
tura
lre
sour
ces
and
cons
erva
tion
Hea
lth, p
arks
,re
crea
tion
and
fitne
ss
Per
sona
l,pr
otec
tive
and
trans
porta
tion
serv
ices
Females
Males
Data Source: Alberta’s Occupational Supply Outlook Model, 2011-2021
Enrolment rates for females are expected to increase at a faster rate than for males over
the forecast period. Growth rates for males are expected to exceed those of females in
education, mathematical and computer sciences (Chart 5).
Chart 5
Average Annual Change by Major Fields of Study Universities, 2011 - 2021
3.2%
4.8% 4.8% 5.0%
4.0%4.5%
1.8%
2.6%
3.6%
4.4%
5.8%
4.4%
3.1%
2.2%2.3%2.0%
3.2%3.7%
4.3%4.4%4.5%
3.3%
0%
1%
2%
3%
4%
5%
6%
7%
Educ
atio
n
Visu
al a
ndpe
rform
ing
arts
and
com
mun
icat
ion
tech
nolo
gies
Hum
anitit
es
Soci
al a
ndbe
havi
oura
lsc
ienc
es a
ndla
w
Busi
ness
,m
anag
emen
t,an
d pu
blic
adm
inis
tratio
n
Phys
ical
and
life s
cien
ces
and
tech
nolo
gies
Mat
hem
atic
s,co
mpu
ter,
and
info
rmat
ion
scie
nces
Arch
itect
ure,
engi
neer
ing,
and
rela
ted
tech
nolo
gies
Agric
ultu
re,
natu
ral
reso
urce
s, a
ndco
nser
vatio
n
Hea
lth, p
arks
,re
crea
tion,
and
fitne
ss
Pers
onal
,pr
otec
tive,
and
trans
porta
tion
serv
ices
Females
Males
Data Source: Alberta’s Occupational Supply Outlook Model, 2011-2021
Major Fields of Study: Universities

Major Fields of Study: College and Trade Institutions
6
Chart 6 compares the average proportions of all college and trade graduates in each
major field of study by gender for 2011 to 2021. There are higher proportions of females
than males with qualifications in most major fields of study, except for architecture and
engineering with 57.1% of males compared to 4.2% of females.
Chart 6
Average Proportions in Major Fields of Study College and Trade Institutions, 2011 - 2021
2.7% 3.9% 2.6%8.6%
28.6%
9.3%
32.3%
2.1%4.2%4.5%
1.0%
57.1%
11.4%8.8%
4.2%3.8%6.3%1.2%1.6%1.6%
3.7%0.4%
0%
10%
20%
30%
40%
50%
60%
Edu
catio
n
Vis
ual a
ndpe
rform
ing
arts
,an
dco
mm
unic
atio
nste
chno
logi
es
Hum
anitie
s
Soc
ial a
ndbe
havi
oura
lsc
ienc
es a
ndla
w
Bus
ines
s,m
anag
emen
tan
d pu
blic
adm
inis
tratio
n
Phy
sica
l and
life s
cien
ces
and
tech
nolo
gies
Mat
hem
atic
s,co
mpu
ter a
ndin
form
atio
nsc
ienc
es
Arc
hite
ctur
e,en
gine
erin
g, a
ndre
late
dte
chno
logi
es
Agr
icul
ture
,na
tura
lre
sour
ces
and
cons
erva
tion
Hea
lth, p
arks
,re
crea
tion
and
fitne
ss
Per
sona
l,pr
otec
tive
and
trans
porta
tion
serv
ices
Females
Males
Data Source: Alberta’s Occupational Supply Outlook Model, 2011-2021
Chart 7 shows that males are anticipated to have higher average annual growth rates
than females in business, humanities, social science, physical and life science,
mathematical and computer science, health, and personal service fields. Females are
expected to have higher growth rates in education, visual and performing arts,
architecture and engineering, and agriculture fields.
Chart 7
Average Annual Change by Major Fields of Study College and Trade Institutions, 2011 - 2021
2.9%
3.9%
1.9%
3.4%
1.1%
3.1% 3.2%
2.3%2.1%
4.3%
2.8%
4.1%
2.2%
3.1%
0.4%
3.0%
2.2%2.7%
3.2%
4.5%
3.7%
0.7%
0%
1%
2%
3%
4%
5%
Educ
atio
n
Visu
al a
ndpe
rform
ing
arts
and
com
mun
icat
ion
tech
nolo
gies
Hum
anitit
es
Soci
al a
ndbe
havi
oura
lsc
ienc
es a
ndla
w
Busi
ness
,m
anag
emen
t,an
d pu
blic
adm
inis
tratio
n
Phys
ical
and
life s
cien
ces
and
tech
nolo
gies
Mat
hem
atic
s,co
mpu
ter,
and
info
rmat
ion
scie
nces
Arch
itect
ure,
engi
neer
ing,
and
rela
ted
tech
nolo
gies
Agric
ultu
re,
natu
ral
reso
urce
s, a
ndco
nser
vatio
n
Hea
lth, p
arks
,re
crea
tion,
and
fitne
ss
Pers
onal
,pr
otec
tive,
and
trans
porta
tion
serv
ices
Females
Males
Data Source: Alberta’s Occupational Supply Outlook Model, 2011-2021

Summary and Conclusion
7
Over the coming decade, 2011 to 2021, the overall level of educational attainment in
Alberta is expected to increase as more people enroll in post-secondary institutions.
The enrolment rates for females in post-secondary education will exceed that of males,
resulting in a higher proportion of females having obtained a post-secondary education
by 2021.
Compared to females, a higher proportion of males will be qualified in applied science
technologies and trades at the college and university levels. On the other hand, higher
proportions of females will have qualifications in health.
According to Alberta’s Occupational Demand and Supply Outlook, 2011-2021
occupations related to the trades and health major fields of study are expected to be in
need of labour over the coming decade.

Summary and Conclusion
8
Major Fields of Study
Education
Visual and performing arts and communication technologies
Humanities
Social and behavioural sciences and law
Business, management, and public administration
Physical and life sciences and technologies
Mathematics, computer, and information sciences
Architecture, engineering, and related technologies
Agriculture, natural resources, and conservation
Health, parks, recreation, and fitness
Personal, protective, and transportation services
Appendix A

Summary and Conclusion
9
Education Assumptions
A number of assumptions are used to derive the results of this forecast. The
assumptions used to generate the results in Appendix C are described below. Enrolment and Graduation
• The number of people who attend school is calculated as a share of the total
number in that age or gender group. This proportion is based on historic shares.
• The secondary school enrolment rate for males and females remains constant
over the projection period.
• Enrolment rates for post-secondary institutions increase at the same rate as the
average of the high and low enrolment rate projections that were conducted by
Alberta Advanced Education and Technology.
• Graduation rates are determined by level of schooling, major field of study, age
and gender. Graduation rates are calculated as a share of those who could
potentially graduate and are kept constant over the forecast period.
• The overall number of university, college and trades graduates is determined by
applying the graduate rate to the different age groups who are enrolled in that
institution and could potentially graduate.
• Drop-out rates and mature student rates are used for the different major fields of
study and level of schooling.
• Migration rates by educational attainment are allowed to adjust to reflect relative
demand conditions in Alberta.
Educational Attainment • To calculate the number of people with university, college and trades, and high
school education, a stock-flow approach3 was used.
3 Stock-Flow Approach: A method in estimating the future population of people in a group of interest. To find the forecasted population, the population from the previous year is adjusted to add those expected to enter that group and subtract those that are expected to leave that group. Example:
t+1 t t+1 t+1
plusRecent
Graduates of College/Trades
minus
People Leaving Group due to
death, retirement, etc.
Number of people with
College/Trades Training
=Number of people with
College/Trades Training
Appendix B

Summary and Conclusion
10
• Those with less than a high school education are determined to be those not
already accounted for in other educational attainment categories.
• Less than high school educational attainment is adjusted to reflect the estimated
portion of mature students in post-secondary institutions that do not have a high
school diploma. High school educational attainment is also adjusted to subtract
recent graduates from university and college and trades.
• The overall enrolment rate for mature students is used for all age groups within
the mature student category.
• To project educational attainment by major field of study, the historic relative
enrolment rate is maintained over the projected period.
• The share of new graduates by major field of study is constant over time.
• University transfer programs are included as university enrollment and university
certificates are classified as college and technical.
• Educational attainment is based on the new graduate forecast plus net inflows
from migration less deaths.
Appendix B

Appendix C
11
Educational Attainment
Both Genders 2011 2012 2013 2014 2015 2016 2017 2018 2019 2020 2021 Average
2011-2021 Less Than High School 647,951 631,637 618,406 608,944 602,678 597,238 592,776 590,894 590,877 591,442 593,071 % of Total 20.8% 20.0% 19.3% 18.7% 18.2% 17.7% 17.3% 17.0% 16.8% 16.5% 16.3% Growth Rate (%) -2.57 -2.52 -2.09 -1.53 -1.03 -0.90 -0.75 -0.32 0.00 0.10 0.28 -1.03 High School 826,181 840,956 853,667 864,821 873,826 880,629 885,347 888,136 889,256 888,782 886,645 % of Total 26.6% 26.6% 26.6% 26.5% 26.4% 26.2% 25.9% 25.6% 25.2% 24.8% 24.4% Growth Rate (%) 2.03 1.79 1.51 1.31 1.04 0.78 0.54 0.32 0.13 -0.05 -0.24 0.83 College and Trade 893,782 913,002 932,154 951,423 970,826 990,362 1,010,097 1,030,025 1,050,254 1,070,840 1,091,884 % of Total 28.7% 28.9% 29.0% 29.2% 29.3% 29.4% 29.5% 29.7% 29.8% 29.9% 30.1% Growth Rate (%) 2.22 2.15 2.10 2.07 2.04 2.01 1.99 1.97 1.96 1.96 1.97 2.04 University Degree 742,776 774,100 805,323 836,156 867,220 898,506 930,160 962,144 994,703 1,027,856 1,061,735 % of Total 23.9% 24.5% 25.1% 25.6% 26.2% 26.7% 27.2% 27.7% 28.2% 28.7% 29.2% Growth Rate (%) 4.29 4.22 4.03 3.83 3.72 3.61 3.52 3.44 3.38 3.33 3.30 3.70
Females 2011 2012 2013 2014 2015 2016 2017 2018 2019 2020 2021 Average
2011-2021 Less Than High School 309,864 302,929 297,778 294,257 292,258 290,388 288,767 288,403 288,857 289,750 291,020 % of Total 20.3% 19.5% 18.9% 18.3% 17.9% 17.5% 17.1% 16.8% 16.6% 16.4% 16.2% Growth Rate (%) -2.16 -2.24 -1.70 -1.18 -0.68 -0.64 -0.56 -0.13 0.16 0.31 0.44 -0.76 High School 403,946 406,598 408,201 409,081 408,921 407,712 405,480 402,272 398,225 393,374 387,687 % of Total 26.5% 26.2% 25.9% 25.5% 25.0% 24.6% 24.0% 23.5% 22.9% 22.2% 21.6% Growth Rate (%) 0.84 0.66 0.39 0.22 -0.04 -0.30 -0.55 -0.79 -1.01 -1.22 -1.45 -0.29 College and Trade 423,671 434,997 446,314 457,692 469,141 480,642 492,229 503,892 515,668 527,584 539,698 % of Total 27.7% 28.0% 28.3% 28.5% 28.7% 29.0% 29.2% 29.4% 29.6% 29.8% 30.0% Growth Rate (%) 2.76 2.67 2.60 2.55 2.50 2.45 2.41 2.37 2.34 2.31 2.30 2.48 University Degree 389,703 407,846 426,102 444,284 462,690 481,317 500,249 519,458 539,075 559,117 579,654 % of Total 25.5% 26.3% 27.0% 27.7% 28.3% 29.0% 29.7% 30.3% 30.9% 31.6% 32.2% Growth Rate (%) 4.76 4.66 4.48 4.27 4.14 4.03 3.93 3.84 3.78 3.72 3.67 4.11
Males 2011 2012 2013 2014 2015 2016 2017 2018 2019 2020 2021 Average
2011-2021 Less Than High School 338,087 328,708 320,628 314,688 310,420 306,850 304,009 302,491 302,020 301,691 302,051 % of Total 21.4% 20.5% 19.7% 19.0% 18.5% 18.0% 17.6% 17.2% 16.9% 16.7% 16.5% Growth Rate (%) -2.94 -2.77 -2.46 -1.85 -1.36 -1.15 -0.93 -0.50 -0.16 -0.11 0.12 -1.28 High School 422,234 434,358 445,466 455,740 464,904 472,916 479,868 485,864 491,031 495,408 498,957 % of Total 26.7% 27.0% 27.3% 27.5% 27.6% 27.7% 27.7% 27.7% 27.5% 27.4% 27.2% Growth Rate (%) 3.21 2.87 2.56 2.31 2.01 1.72 1.47 1.25 1.06 0.89 0.72 1.82 College and Trade 470,111 478,005 485,840 493,731 501,685 509,720 517,868 526,134 534,586 543,256 552,186 % of Total 29.7% 29.7% 29.8% 29.8% 29.8% 29.9% 29.9% 29.9% 30.0% 30.0% 30.1% Growth Rate (%) 1.73 1.68 1.64 1.62 1.61 1.60 1.60 1.60 1.61 1.62 1.64 1.63 University Degree 353,073 366,254 379,221 391,872 404,530 417,189 429,911 442,687 455,628 468,739 482,081 % of Total 22.3% 22.8% 23.2% 23.7% 24.1% 24.4% 24.8% 25.2% 25.6% 25.9% 26.3% Growth Rate (%) 3.79 3.73 3.54 3.34 3.23 3.13 3.05 2.97 2.92 2.88 2.85 3.22

Appendix C
12
Major Fields of Study: Universities
Both Genders 2011 2012 2013 2014 2015 2016 2017 2018 2019 2020 2021 Average
2011-2021 Education 93,492 96,907 100,251 103,496 106,766 110,071 113,426 116,827 120,303 123,853 127,490 % of Total 12.6% 12.5% 12.4% 12.4% 12.3% 12.3% 12.2% 12.1% 12.1% 12.0% 12.0% Growth Rate (%) 3.70 3.65 3.45 3.24 3.16 3.10 3.05 3.00 2.97 2.95 2.94 3.20 Visual and performing arts and communication technologies 21,574 22,790 24,003 25,196 26,395 27,597 28,810 30,030 31,268 32,523 33,803 % of Total 2.9% 2.9% 3.0% 3.0% 3.0% 3.1% 3.1% 3.1% 3.1% 3.2% 3.2% Growth Rate (%) 5.87 5.64 5.32 4.97 4.76 4.56 4.39 4.24 4.12 4.02 3.93 4.71
Humanitites 57,357 60,768 64,018 67,100 70,180 73,255 76,340 79,430 82,547 85,694 88,883 % of Total 7.7% 7.9% 7.9% 8.0% 8.1% 8.2% 8.2% 8.3% 8.3% 8.3% 8.4% Growth Rate (%) 6.48 5.95 5.35 4.81 4.59 4.38 4.21 4.05 3.92 3.81 3.72 4.66
Social and behavioural sciences and law 108,402 114,716 120,936 127,026 133,126 139,231 145,365 151,521 157,740 164,026 170,401 % of Total 14.6% 14.8% 15.0% 15.2% 15.4% 15.5% 15.6% 15.7% 15.9% 16.0% 16.0% Growth Rate (%) 6.02 5.82 5.42 5.04 4.80 4.59 4.41 4.23 4.10 3.99 3.89 4.76
Business, management, and public administration 141,924 148,017 154,197 160,398 166,648 172,942 179,308 185,739 192,289 198,960 205,779 % of Total 19.1% 19.1% 19.1% 19.2% 19.2% 19.2% 19.3% 19.3% 19.3% 19.4% 19.4% Growth Rate (%) 4.34 4.29 4.18 4.02 3.90 3.78 3.68 3.59 3.53 3.47 3.43 3.84
Physical and life sciences and technologies 56,240 58,641 61,066 63,474 65,903 68,356 70,843 73,362 75,929 78,549 81,234 % of Total 7.6% 7.6% 7.6% 7.6% 7.6% 7.6% 7.6% 7.6% 7.6% 7.6% 7.7% Growth Rate (%) 4.27 4.27 4.14 3.94 3.83 3.72 3.64 3.56 3.50 3.45 3.42 3.79
Mathematics, computer, and information sciences 49,569 50,637 51,683 52,700 53,717 54,732 55,749 56,768 57,800 58,845 59,908 % of Total 6.7% 6.5% 6.4% 6.3% 6.2% 6.1% 6.0% 5.9% 5.8% 5.7% 5.6% Growth Rate (%) 2.04 2.15 2.07 1.97 1.93 1.89 1.86 1.83 1.82 1.81 1.81 1.92
Architecture, engineering, and related technologies 94,423 96,801 99,173 101,530 103,896 106,272 108,676 111,102 113,582 116,116 118,721 % of Total 12.7% 12.5% 12.3% 12.1% 12.0% 11.8% 11.7% 11.5% 11.4% 11.3% 11.2% Growth Rate (%) 2.50 2.52 2.45 2.38 2.33 2.29 2.26 2.23 2.23 2.23 2.24 2.33
Agriculture, natural resources, and conservation 16,419 16,950 17,460 17,943 18,432 18,925 19,425 19,932 20,450 20,979 21,521 % of Total 2.2% 2.2% 2.2% 2.1% 2.1% 2.1% 2.1% 2.1% 2.1% 2.0% 2.0% Growth Rate (%) 3.22 3.23 3.01 2.77 2.72 2.68 2.65 2.61 2.60 2.59 2.58 2.79
Health, parks, recreation, and fitness 99,824 104,111 108,569 113,129 117,793 122,560 127,450 132,457 137,610 142,910 148,376 % of Total 13.4% 13.4% 13.5% 13.5% 13.6% 13.6% 13.7% 13.8% 13.8% 13.9% 14.0% Growth Rate (%) 4.38 4.29 4.28 4.20 4.12 4.05 3.99 3.93 3.89 3.85 3.82 4.07
Personal, protective, and transportation services 3,551 3,763 3,968 4,165 4,364 4,565 4,769 4,975 5,186 5,400 5,619 % of Total 0.5% 0.5% 0.5% 0.5% 0.5% 0.5% 0.5% 0.5% 0.5% 0.5% 0.5% Growth Rate (%) 6.08 5.96 5.46 4.96 4.78 4.60 4.46 4.33 4.23 4.13 4.06 4.82

Appendix C
13
Major Fields of Study: Universities (Cont.)
Females 2011 2012 2013 2014 2015 2016 2017 2018 2019 2020 2021 Average
2011-2021 Education 69,438 71,944 74,399 76,781 79,185 81,619 84,094 86,608 89,181 91,814 94,517 % of Total 17.8% 17.6% 17.5% 17.3% 17.1% 17.0% 16.8% 16.7% 16.5% 16.4% 16.3% Growth Rate (%) 3.66 3.61 3.41 3.20 3.13 3.07 3.03 2.99 2.97 2.95 2.94 3.18
Visual and performing arts and communication technologies 13,746 14,527 15,313 16,094 16,881 17,675 18,480 19,294 20,122 20,965 21,828 % of Total 3.5% 3.6% 3.6% 3.6% 3.6% 3.7% 3.7% 3.7% 3.7% 3.7% 3.8% Growth Rate (%) 5.90 5.68 5.41 5.10 4.89 4.70 4.55 4.40 4.29 4.19 4.11 4.84
Humanitites 34,446 36,557 38,584 40,518 42,457 44,400 46,354 48,317 50,301 52,310 54,349 % of Total 8.8% 9.0% 9.1% 9.1% 9.2% 9.2% 9.3% 9.3% 9.3% 9.4% 9.4% Growth Rate (%) 6.65 6.13 5.54 5.01 4.79 4.58 4.40 4.23 4.11 3.99 3.90 4.85
Social and behavioural sciences and law 63,548 67,444 71,305 75,105 78,925 82,764 86,635 90,534 94,485 98,491 102,566 % of Total 16.3% 16.5% 16.7% 16.9% 17.1% 17.2% 17.3% 17.4% 17.5% 17.6% 17.7% Growth Rate (%) 6.35 6.13 5.72 5.33 5.09 4.86 4.68 4.50 4.36 4.24 4.14 5.04
Business, management, and public administration 71,578 74,685 77,878 81,124 84,412 87,738 91,118 94,547 98,053 101,638 105,315 % of Total 18.4% 18.3% 18.3% 18.3% 18.2% 18.2% 18.2% 18.2% 18.2% 18.2% 18.2% Growth Rate (%) 4.35 4.34 4.28 4.17 4.05 3.94 3.85 3.76 3.71 3.66 3.62 3.98
Physical and life sciences and technologies 25,834 27,166 28,521 29,876 31,246 32,631 34,037 35,460 36,909 38,388 39,901 % of Total 6.6% 6.7% 6.7% 6.7% 6.8% 6.8% 6.8% 6.8% 6.8% 6.9% 6.9% Growth Rate (%) 5.16 5.15 4.99 4.75 4.58 4.43 4.31 4.18 4.09 4.01 3.94 4.51
Mathematics, computer, and information sciences 14,355 14,630 14,901 15,166 15,432 15,699 15,969 16,241 16,519 16,802 17,093 % of Total 3.7% 3.6% 3.5% 3.4% 3.3% 3.3% 3.2% 3.1% 3.1% 3.0% 2.9% Growth Rate (%) 1.77 1.92 1.85 1.78 1.76 1.73 1.72 1.70 1.71 1.72 1.73 1.76
Architecture, engineering, and related technologies 16,307 16,743 17,187 17,637 18,096 18,564 19,043 19,533 20,038 20,560 21,100 % of Total 4.2% 4.1% 4.0% 4.0% 3.9% 3.9% 3.8% 3.8% 3.7% 3.7% 3.6% Growth Rate (%) 2.67 2.67 2.65 2.62 2.60 2.58 2.58 2.57 2.59 2.60 2.63 2.62
Agriculture, natural resources, and conservation 6,793 7,074 7,347 7,607 7,873 8,144 8,422 8,705 8,996 9,295 9,603 % of Total 1.7% 1.7% 1.7% 1.7% 1.7% 1.7% 1.7% 1.7% 1.7% 1.7% 1.7% Growth Rate (%) 4.16 4.15 3.86 3.54 3.49 3.44 3.41 3.37 3.34 3.32 3.31 3.58
Health, parks, recreation, and fitness 72,631 75,977 79,497 83,136 86,870 90,699 94,636 98,680 102,849 107,148 111,589 % of Total 18.6% 18.6% 18.7% 18.7% 18.8% 18.8% 18.9% 19.0% 19.1% 19.2% 19.3% Growth Rate (%) 4.72 4.61 4.63 4.58 4.49 4.41 4.34 4.27 4.23 4.18 4.14 4.42
Personal, protective, and transportation services 1,027 1,099 1,171 1,240 1,312 1,385 1,461 1,540 1,621 1,705 1,792 % of Total 0.3% 0.3% 0.3% 0.3% 0.3% 0.3% 0.3% 0.3% 0.3% 0.3% 0.3% Growth Rate (%) 6.99 7.01 6.50 5.92 5.76 5.61 5.50 5.38 5.27 5.18 5.10 5.84
Appendix C
14
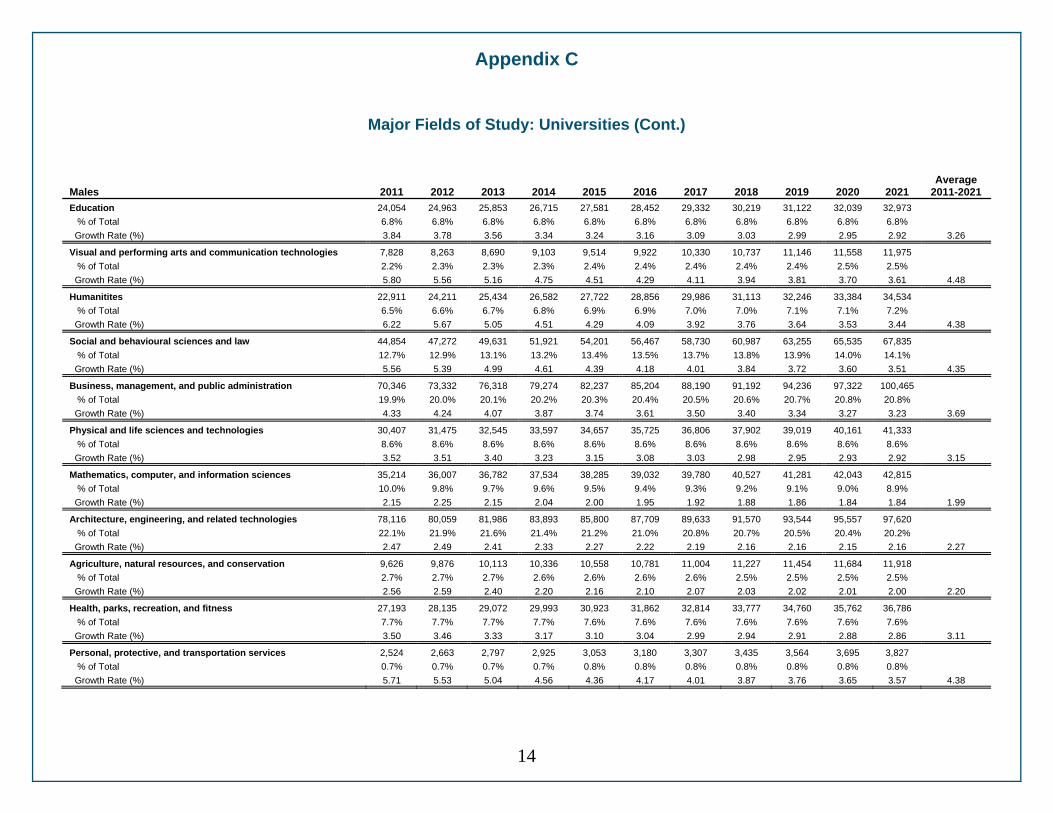
Major Fields of Study: Universities (Cont.)
Males 2011 2012 2013 2014 2015 2016 2017 2018 2019 2020 2021 Average
2011-2021 Education 24,054 24,963 25,853 26,715 27,581 28,452 29,332 30,219 31,122 32,039 32,973 % of Total 6.8% 6.8% 6.8% 6.8% 6.8% 6.8% 6.8% 6.8% 6.8% 6.8% 6.8% Growth Rate (%) 3.84 3.78 3.56 3.34 3.24 3.16 3.09 3.03 2.99 2.95 2.92 3.26
Visual and performing arts and communication technologies 7,828 8,263 8,690 9,103 9,514 9,922 10,330 10,737 11,146 11,558 11,975 % of Total 2.2% 2.3% 2.3% 2.3% 2.4% 2.4% 2.4% 2.4% 2.4% 2.5% 2.5% Growth Rate (%) 5.80 5.56 5.16 4.75 4.51 4.29 4.11 3.94 3.81 3.70 3.61 4.48
Humanitites 22,911 24,211 25,434 26,582 27,722 28,856 29,986 31,113 32,246 33,384 34,534 % of Total 6.5% 6.6% 6.7% 6.8% 6.9% 6.9% 7.0% 7.0% 7.1% 7.1% 7.2% Growth Rate (%) 6.22 5.67 5.05 4.51 4.29 4.09 3.92 3.76 3.64 3.53 3.44 4.38
Social and behavioural sciences and law 44,854 47,272 49,631 51,921 54,201 56,467 58,730 60,987 63,255 65,535 67,835 % of Total 12.7% 12.9% 13.1% 13.2% 13.4% 13.5% 13.7% 13.8% 13.9% 14.0% 14.1% Growth Rate (%) 5.56 5.39 4.99 4.61 4.39 4.18 4.01 3.84 3.72 3.60 3.51 4.35
Business, management, and public administration 70,346 73,332 76,318 79,274 82,237 85,204 88,190 91,192 94,236 97,322 100,465 % of Total 19.9% 20.0% 20.1% 20.2% 20.3% 20.4% 20.5% 20.6% 20.7% 20.8% 20.8% Growth Rate (%) 4.33 4.24 4.07 3.87 3.74 3.61 3.50 3.40 3.34 3.27 3.23 3.69
Physical and life sciences and technologies 30,407 31,475 32,545 33,597 34,657 35,725 36,806 37,902 39,019 40,161 41,333 % of Total 8.6% 8.6% 8.6% 8.6% 8.6% 8.6% 8.6% 8.6% 8.6% 8.6% 8.6% Growth Rate (%) 3.52 3.51 3.40 3.23 3.15 3.08 3.03 2.98 2.95 2.93 2.92 3.15
Mathematics, computer, and information sciences 35,214 36,007 36,782 37,534 38,285 39,032 39,780 40,527 41,281 42,043 42,815 % of Total 10.0% 9.8% 9.7% 9.6% 9.5% 9.4% 9.3% 9.2% 9.1% 9.0% 8.9% Growth Rate (%) 2.15 2.25 2.15 2.04 2.00 1.95 1.92 1.88 1.86 1.84 1.84 1.99
Architecture, engineering, and related technologies 78,116 80,059 81,986 83,893 85,800 87,709 89,633 91,570 93,544 95,557 97,620 % of Total 22.1% 21.9% 21.6% 21.4% 21.2% 21.0% 20.8% 20.7% 20.5% 20.4% 20.2% Growth Rate (%) 2.47 2.49 2.41 2.33 2.27 2.22 2.19 2.16 2.16 2.15 2.16 2.27
Agriculture, natural resources, and conservation 9,626 9,876 10,113 10,336 10,558 10,781 11,004 11,227 11,454 11,684 11,918 % of Total 2.7% 2.7% 2.7% 2.6% 2.6% 2.6% 2.6% 2.5% 2.5% 2.5% 2.5% Growth Rate (%) 2.56 2.59 2.40 2.20 2.16 2.10 2.07 2.03 2.02 2.01 2.00 2.20
Health, parks, recreation, and fitness 27,193 28,135 29,072 29,993 30,923 31,862 32,814 33,777 34,760 35,762 36,786 % of Total 7.7% 7.7% 7.7% 7.7% 7.6% 7.6% 7.6% 7.6% 7.6% 7.6% 7.6% Growth Rate (%) 3.50 3.46 3.33 3.17 3.10 3.04 2.99 2.94 2.91 2.88 2.86 3.11
Personal, protective, and transportation services 2,524 2,663 2,797 2,925 3,053 3,180 3,307 3,435 3,564 3,695 3,827 % of Total 0.7% 0.7% 0.7% 0.7% 0.8% 0.8% 0.8% 0.8% 0.8% 0.8% 0.8% Growth Rate (%) 5.71 5.53 5.04 4.56 4.36 4.17 4.01 3.87 3.76 3.65 3.57 4.38

Appendix C
15
Major Fields of Study: College and Trade Institutions
Both Genders 2011 2012 2013 2014 2015 2016 2017 2018 2019 2020 2021 Average
2011-2021 Education 12,904 13,322 13,737 14,150 14,563 14,974 15,385 15,794 16,205 16,617 17,031 % of Total 1.4% 1.5% 1.5% 1.5% 1.5% 1.5% 1.5% 1.5% 1.5% 1.6% 1.6% Growth Rate (%) 3.34 3.24 3.12 3.01 2.92 2.82 2.74 2.66 2.60 2.54 2.49 2.86 Visual and performing arts and communication technologies 31,710 33,012 34,301 35,587 36,868 38,145 39,422 40,699 41,983 43,278 44,590 % of Total 3.5% 3.6% 3.7% 3.7% 3.8% 3.9% 3.9% 4.0% 4.0% 4.0% 4.1% Growth Rate (%) 4.38 4.11 3.91 3.75 3.60 3.46 3.35 3.24 3.15 3.08 3.03 3.55
Humanitites 16,484 17,347 18,194 19,031 19,858 20,676 21,486 22,288 23,085 23,879 24,674 % of Total 1.8% 1.9% 2.0% 2.0% 2.0% 2.1% 2.1% 2.2% 2.2% 2.2% 2.3% Growth Rate (%) 5.61 5.24 4.88 4.60 4.35 4.12 3.92 3.73 3.58 3.44 3.33 4.25
Social and behavioural sciences and law 42,331 43,884 45,424 46,963 48,504 50,045 51,591 53,140 54,700 56,275 57,872 % of Total 4.7% 4.8% 4.9% 4.9% 5.0% 5.1% 5.1% 5.2% 5.2% 5.3% 5.3% Growth Rate (%) 3.93 3.67 3.51 3.39 3.28 3.18 3.09 3.00 2.94 2.88 2.84 3.25
Business, management, and public administration 188,570 193,422 198,266 203,148 208,079 213,054 218,089 223,185 228,367 233,651 239,063 % of Total 21.1% 21.2% 21.3% 21.4% 21.4% 21.5% 21.6% 21.7% 21.7% 21.8% 21.9% Growth Rate (%) 2.68 2.57 2.50 2.46 2.43 2.39 2.36 2.34 2.32 2.31 2.32 2.43
Physical and life sciences and technologies 9,320 9,658 9,987 10,310 10,628 10,940 11,247 11,549 11,848 12,143 12,437 % of Total 1.0% 1.1% 1.1% 1.1% 1.1% 1.1% 1.1% 1.1% 1.1% 1.1% 1.1% Growth Rate (%) 3.85 3.62 3.41 3.24 3.08 2.94 2.81 2.69 2.58 2.49 2.42 3.01
Mathematics, computer, and information sciences 49,592 50,444 51,282 52,110 52,927 53,731 54,524 55,306 56,081 56,850 57,615 % of Total 5.5% 5.5% 5.5% 5.5% 5.5% 5.4% 5.4% 5.4% 5.3% 5.3% 5.3% Growth Rate (%) 1.74 1.72 1.66 1.61 1.57 1.52 1.48 1.43 1.40 1.37 1.35 1.53
Architecture, engineering, and related technologies 299,316 301,423 303,566 305,787 308,073 310,439 312,905 315,473 318,173 321,016 324,032 % of Total 33.5% 33.0% 32.6% 32.1% 31.7% 31.3% 31.0% 30.6% 30.3% 30.0% 29.7% Growth Rate (%) 0.68 0.70 0.71 0.73 0.75 0.77 0.79 0.82 0.86 0.89 0.94 0.79
Agriculture, natural resources, and conservation 25,924 26,613 27,297 27,987 28,685 29,391 30,108 30,836 31,579 32,341 33,125 % of Total 2.9% 2.9% 2.9% 2.9% 3.0% 3.0% 3.0% 3.0% 3.0% 3.0% 3.0% Growth Rate (%) 2.82 2.66 2.57 2.53 2.49 2.46 2.44 2.42 2.41 2.41 2.43 2.51
Health, parks, recreation, and fitness 135,088 139,828 144,576 149,371 154,217 159,110 164,059 169,059 174,123 179,259 184,483 % of Total 15.1% 15.3% 15.5% 15.7% 15.9% 16.1% 16.2% 16.4% 16.6% 16.7% 16.9% Growth Rate (%) 3.64 3.51 3.40 3.32 3.24 3.17 3.11 3.05 3.00 2.95 2.91 3.21
Personal, protective, and transportation services 82,543 84,051 85,524 86,980 88,425 89,856 91,280 92,694 94,110 95,531 96,962 % of Total 9.2% 9.2% 9.2% 9.1% 9.1% 9.1% 9.0% 9.0% 9.0% 8.9% 8.9% Growth Rate (%) 1.95 1.83 1.75 1.70 1.66 1.62 1.58 1.55 1.53 1.51 1.50 1.65

Appendix C
16
Major Fields of Study: College and Trade Institutions (Cont.)
Females 2011 2012 2013 2014 2015 2016 2017 2018 2019 2020 2021 Average
2011-2021 Education 11,200 11,565 11,929 12,292 12,654 13,014 13,375 13,735 14,097 14,459 14,824 % of Total 2.6% 2.7% 2.7% 2.7% 2.7% 2.7% 2.7% 2.7% 2.7% 2.7% 2.7% Growth Rate (%) 3.36 3.26 3.14 3.04 2.95 2.85 2.77 2.69 2.63 2.57 2.52 2.89
Visual and performing arts and communication technologies 15,501 16,202 16,900 17,596 18,293 18,988 19,685 20,382 21,082 21,788 22,503 % of Total 3.7% 3.7% 3.8% 3.8% 3.9% 4.0% 4.0% 4.0% 4.1% 4.1% 4.2% Growth Rate (%) 4.85 4.53 4.30 4.12 3.96 3.80 3.67 3.54 3.44 3.35 3.28 3.89
Humanitites 10,220 10,736 11,244 11,745 12,238 12,724 13,203 13,676 14,143 14,605 15,064 % of Total 2.4% 2.5% 2.5% 2.6% 2.6% 2.6% 2.7% 2.7% 2.7% 2.8% 2.8% Growth Rate (%) 5.40 5.05 4.73 4.45 4.20 3.97 3.77 3.58 3.41 3.27 3.15 4.09
Social and behavioural sciences and law 35,354 36,620 37,875 39,127 40,378 41,625 42,873 44,120 45,370 46,627 47,897 % of Total 8.3% 8.4% 8.5% 8.5% 8.6% 8.7% 8.7% 8.8% 8.8% 8.8% 8.9% Growth Rate (%) 3.81 3.58 3.43 3.31 3.20 3.09 3.00 2.91 2.83 2.77 2.72 3.15
Business, management, and public administration 139,069 142,232 145,399 148,591 151,815 155,065 158,353 161,677 165,050 168,482 171,990 % of Total 32.8% 32.7% 32.6% 32.5% 32.4% 32.3% 32.2% 32.1% 32.0% 31.9% 31.9% Growth Rate (%) 2.35 2.27 2.23 2.20 2.17 2.14 2.12 2.10 2.09 2.08 2.08 2.17
Physical and life sciences and technologies 4,259 4,398 4,535 4,669 4,801 4,931 5,059 5,185 5,310 5,434 5,556 % of Total 1.0% 1.0% 1.0% 1.0% 1.0% 1.0% 1.0% 1.0% 1.0% 1.0% 1.0% Growth Rate (%) 3.45 3.26 3.10 2.96 2.83 2.71 2.60 2.50 2.41 2.33 2.26 2.76
Mathematics, computer, and information sciences 21,244 21,345 21,445 21,545 21,644 21,741 21,837 21,931 22,026 22,121 22,217 % of Total 5.0% 4.9% 4.8% 4.7% 4.6% 4.5% 4.4% 4.4% 4.3% 4.2% 4.1% Growth Rate (%) 0.46 0.47 0.47 0.46 0.46 0.45 0.44 0.43 0.43 0.43 0.43 0.45
Architecture, engineering, and related technologies 18,220 18,544 18,883 19,240 19,610 19,990 20,383 20,790 21,210 21,642 22,096 % of Total 4.3% 4.3% 4.2% 4.2% 4.2% 4.2% 4.1% 4.1% 4.1% 4.1% 4.1% Growth Rate (%) 1.69 1.78 1.83 1.89 1.92 1.94 1.96 2.00 2.02 2.04 2.10 1.92
Agriculture, natural resources, and conservation 8,513 8,834 9,155 9,477 9,802 10,130 10,461 10,796 11,135 11,480 11,832 % of Total 2.0% 2.0% 2.1% 2.1% 2.1% 2.1% 2.1% 2.1% 2.2% 2.2% 2.2% Growth Rate (%) 4.06 3.77 3.63 3.52 3.43 3.35 3.27 3.20 3.14 3.09 3.07 3.41
Health, parks, recreation, and fitness 117,901 121,811 125,732 129,689 133,686 137,718 141,795 145,909 150,072 154,291 158,579 % of Total 27.8% 28.0% 28.2% 28.3% 28.5% 28.7% 28.8% 29.0% 29.1% 29.2% 29.4% Growth Rate (%) 3.41 3.32 3.22 3.15 3.08 3.02 2.96 2.90 2.85 2.81 2.78 3.05
Personal, protective, and transportation services 42,191 42,708 43,217 43,721 44,222 44,715 45,206 45,690 46,173 46,655 47,140 % of Total 10.0% 9.8% 9.7% 9.6% 9.4% 9.3% 9.2% 9.1% 9.0% 8.8% 8.7% Growth Rate (%) 1.28 1.23 1.19 1.17 1.14 1.12 1.10 1.07 1.06 1.04 1.04 1.13

Appendix C
17
Major Fields of Study: College and Trade Institutions (Cont.)
Males 2011 2012 2013 2014 2015 2016 2017 2018 2019 2020 2021 Average
2011-2021 Education 1,704 1,756 1,808 1,859 1,910 1,960 2,010 2,059 2,108 2,158 2,207 % of Total 0.4% 0.4% 0.4% 0.4% 0.4% 0.4% 0.4% 0.4% 0.4% 0.4% 0.4% Growth Rate (%) 3.16 3.06 2.93 2.83 2.73 2.63 2.54 2.46 2.40 2.34 2.29 2.67
Visual and performing arts and communication technologies 16,209 16,810 17,402 17,990 18,575 19,157 19,737 20,318 20,901 21,490 22,087 % of Total 3.4% 3.5% 3.6% 3.6% 3.7% 3.8% 3.8% 3.9% 3.9% 4.0% 4.0% Growth Rate (%) 3.94 3.70 3.52 3.38 3.25 3.13 3.03 2.94 2.87 2.82 2.78 3.22
Humanitites 6,264 6,611 6,950 7,286 7,620 7,952 8,283 8,612 8,942 9,274 9,610 % of Total 1.3% 1.4% 1.4% 1.5% 1.5% 1.6% 1.6% 1.6% 1.7% 1.7% 1.7% Growth Rate (%) 5.94 5.54 5.12 4.84 4.58 4.36 4.16 3.98 3.83 3.72 3.62 4.52
Social and behavioural sciences and law 6,977 7,264 7,548 7,835 8,126 8,419 8,718 9,020 9,330 9,648 9,975 % of Total 1.5% 1.5% 1.6% 1.6% 1.6% 1.7% 1.7% 1.7% 1.7% 1.8% 1.8% Growth Rate (%) 4.56 4.11 3.92 3.80 3.71 3.61 3.54 3.47 3.43 3.40 3.40 3.72
Business, management, and public administration 49,501 51,190 52,867 54,557 56,264 57,989 59,736 61,508 63,317 65,169 67,073 % of Total 10.5% 10.7% 10.9% 11.0% 11.2% 11.4% 11.5% 11.7% 11.8% 12.0% 12.1% Growth Rate (%) 3.62 3.41 3.28 3.20 3.13 3.07 3.01 2.97 2.94 2.93 2.92 3.13
Physical and life sciences and technologies 5,061 5,259 5,452 5,641 5,827 6,009 6,188 6,364 6,538 6,710 6,880 % of Total 1.1% 1.1% 1.1% 1.1% 1.2% 1.2% 1.2% 1.2% 1.2% 1.2% 1.2% Growth Rate (%) 4.19 3.92 3.67 3.47 3.29 3.12 2.98 2.84 2.73 2.63 2.54 3.22
Mathematics, computer, and information sciences 28,348 29,098 29,837 30,565 31,284 31,991 32,688 33,375 34,055 34,729 35,398 % of Total 6.0% 6.1% 6.1% 6.2% 6.2% 6.3% 6.3% 6.3% 6.4% 6.4% 6.4% Growth Rate (%) 2.72 2.65 2.54 2.44 2.35 2.26 2.18 2.10 2.04 1.98 1.93 2.29
Architecture, engineering, and related technologies 281,097 282,879 284,683 286,547 288,463 290,449 292,523 294,683 296,963 299,374 301,936 % of Total 59.8% 59.2% 58.6% 58.0% 57.5% 57.0% 56.5% 56.0% 55.6% 55.1% 54.7% Growth Rate (%) 0.61 0.63 0.64 0.65 0.67 0.69 0.71 0.74 0.77 0.81 0.86 0.71
Agriculture, natural resources, and conservation 17,411 17,778 18,142 18,510 18,883 19,261 19,647 20,040 20,444 20,861 21,293 % of Total 3.7% 3.7% 3.7% 3.7% 3.8% 3.8% 3.8% 3.8% 3.8% 3.8% 3.9% Growth Rate (%) 2.23 2.11 2.05 2.03 2.02 2.00 2.00 2.00 2.02 2.04 2.07 2.05
Health, parks, recreation, and fitness 17,187 18,018 18,845 19,682 20,531 21,392 22,265 23,150 24,051 24,968 25,905 % of Total 3.7% 3.8% 3.9% 4.0% 4.1% 4.2% 4.3% 4.4% 4.5% 4.6% 4.7% Growth Rate (%) 5.20 4.83 4.59 4.44 4.31 4.19 4.08 3.98 3.89 3.82 3.75 4.28
Personal, protective, and transportation services 40,352 41,343 42,306 43,258 44,203 45,141 46,074 47,004 47,937 48,875 49,822 % of Total 8.6% 8.6% 8.7% 8.8% 8.8% 8.9% 8.9% 8.9% 9.0% 9.0% 9.0% Growth Rate (%) 2.66 2.45 2.33 2.25 2.18 2.12 2.07 2.02 1.98 1.96 1.94 2.18