Albemarle County Public Schools · Albemarle County Public Schools ... • Continue cost-benefit...
57
Albemarle County Public Schools ANNUAL REPORT 2002-2003 School Year (October 1, 2001 ~ September 30, 2002)
-
Upload
hoangthuan -
Category
Documents
-
view
212 -
download
0
Transcript of Albemarle County Public Schools · Albemarle County Public Schools ... • Continue cost-benefit...
Albemarle County Public Schools
ANNUAL REPORT
2002-2003 School Year (October 1, 2001 ~ September 30, 2002)
Albemarle County Public Schools Department of Human Resources
ANNUAL REPORT 2002-2003 School Year
(October 1, 2001 ~ September 30, 2002)
!"!"!"!"
TABLE OF CONTENTS INTRODUCTION ............................................................................................................................ 1
EXECUTIVE SUMMARY .............................................................................................................. 2
REPORT ........................................................................................................................................... 5
CRITICAL ISSUES ....................................................................................................................... 19
RECOMMENDATIONS – BASED ON CRITICAL ISSUES ...................................................... 21
CONCLUSION .............................................................................................................................. 24
APPENDIX 1:
Table 1: Student Ethnic Distribution ................................................................................. 25
Table 2: Employee Ethnic Distribution ............................................................................. 26
Table 3: Teaching Field Demographics ............................................................................ 34
Table 4: 2001-2002 Recruitment Trip Schedule ............................................................... 35
Table 5: Summary of 2001-2002 Recruitment Trip Results ............................................. 36
Table 6: Summary Comparison of Recruitment Trips ...................................................... 37
Table 7: Newly Employed Teaching Staff ........................................................................ 38
Table 8: Personnel Characteristics of New Teaching Staff, 1998-2002 ........................... 44
APPENDIX 2:
360 Degree Feedback Forms .............................................................................................. 45
APPENDIX 3:
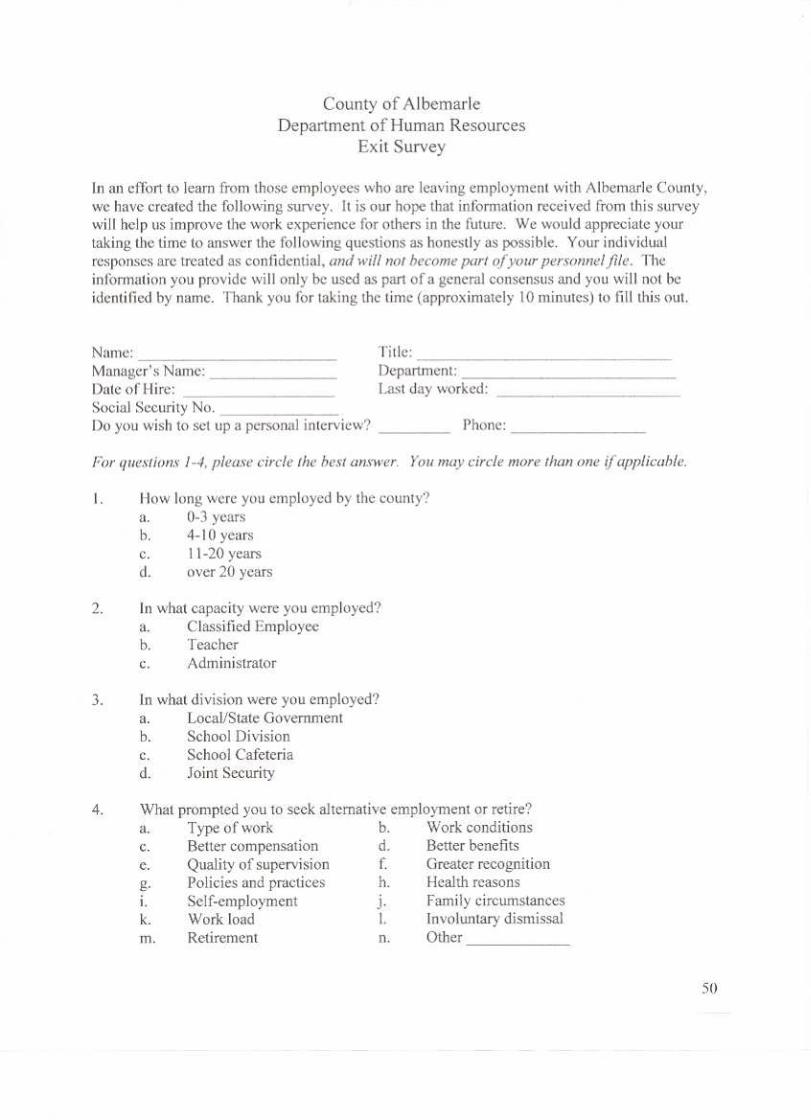
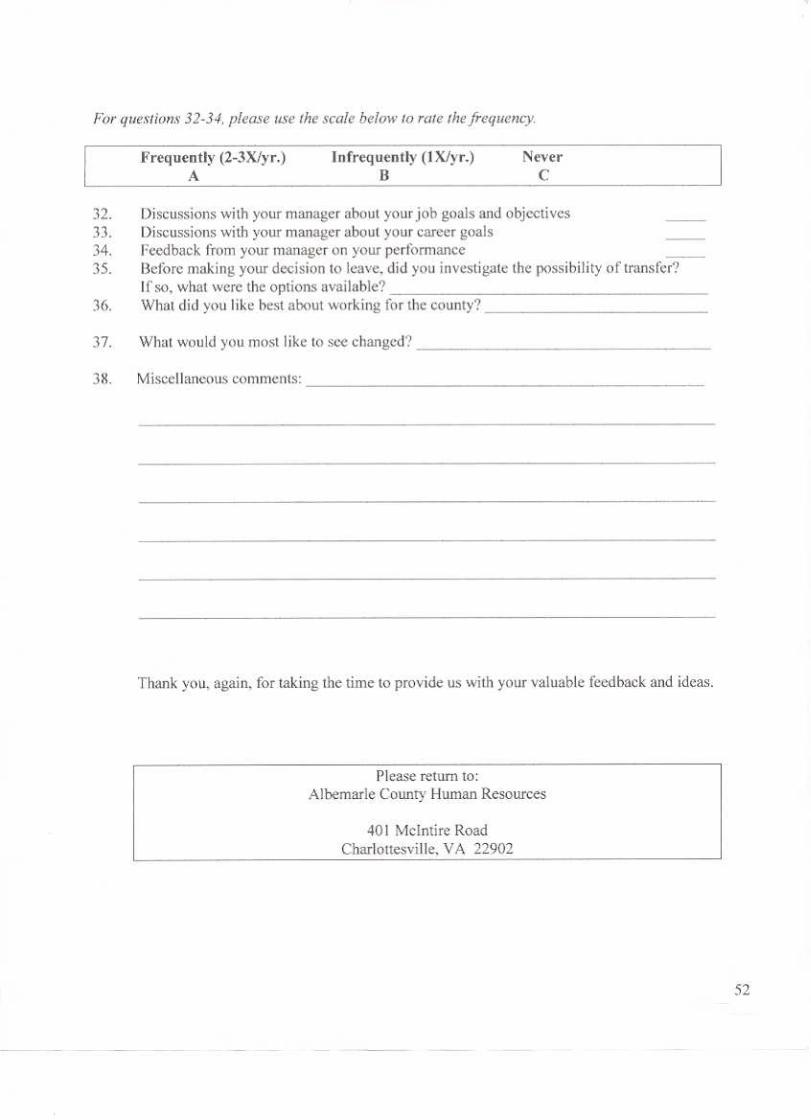
Exit Survey Forms .............................................................................................................. 50
INTRODUCTION
The Human Resources Department began providing the School Board with a yearly report on Re-cruitment, Selection, and Retention in 1995-1996. The report initially focused on teacher recruit-ment issues, but has been expanded to include information on broad human resource areas of focus. This report provides statistical information on the School Division workforce, identifies critical is-sues, and presents recommendations based on those critical issues. In addition, some of the Human Resources Department’s major accomplishments are included. As in past reports, additional infor-mation about recruitment and general staff demographics is also provided in an Appendix. Information from this report will be used to help establish the Division's overall strategic plan and set human resource initiatives for the coming year. The Human Resources Department is deter-mined to provide excellent human resource support to our customers through the implementation of our strategic plan. We will continue our efforts to focus on: competitive salaries/benefits, recruit-ment/selection/retention, professional development, aging workforce/retirements, as well as assess-ment and improvement of our internal systems and processes.
1

EXECUTIVE SUMMARY
The intention of this report is to provide information to be used in establishing the overall strategic plan and to assist in setting initiatives for the coming year. This report provides statistical informa-tion on the School Division workforce as well as the Human Resources Department’s accomplish-ments of the past year. This year realized a new direction in the Human Resources Department. Several major initiatives included the following:
• Re-designed Human Resources to a client group focus • Developed a department strategic plan through needs, process and gap analysis • Established strategic partnerships with all departments/schools • Developed the HR mission “To be a premier customer service-focused Human Resources
Team dedicated to aggressively providing excellent human resource support to Albemarle County Public Schools and Local Government.”
• Conducted an assessment of applicant management process • Restructured the annual recognition program • Conducted assessment of the workers compensation and safety programs • Established an attendance reward program for bus drivers
Following is a summary of the key information provided in the report:
• Through September 30, 2002, the Albemarle County School Division hired 127 teachers, five administrators and 121 classified staff, for a total of 253 new employees.
• For the 2002-2003 school year, the School Division hired ten new minority teachers. Over
the past seven years, the number of minority teachers in the School Division has shown an overall increase from 70 in 1995-1996 to 79 in 2002-2003. In addition, three male teachers endorsed on the elementary level were hired for the 2002-2003 school year.
• As of September 2002, 21 teachers retired as compared to 14 in the previous year, an in-
crease of 50%. This long-term trend toward more retirees will undoubtedly continue as the Division's teaching force ages.
• Overall teacher retention remained relatively stable over five of the past eight years, be-
tween 91.5% and 95.9%. Retention for the past three years was between 85.5% and 87.7%, increasing each successive year.
2

• Exit survey data identified the top three reasons for leaving as family, type of work, and bet-ter compensation. This data also indicated that employees were most dissatisfied with base salary, most recent salary increases, and potential for career growth.
• Progress has been made with closing the gap on classified salary compared to market. The current teacher scale lags the market at steps 10, 20, 25, 30, maximum and is above market at steps 0, 5, and 15.
The following major recommendations, addressing the critical areas of Competitive Salaries and Benefits, Recruitment and Selection, Professional Development, Retention and Aging Work Force/Retirement are presented as follows: Competitive Salaries and Benefits
• For FY 2003-2004, follow the Joint Board adopted compensation process. • Reevaluate the methodology for future years. • Continue providing a longevity increase for teachers. • Develop Total Rewards Strategy.
Recruitment and Selection
• Continue to offer early contracts for specific teaching positions. • Develop strategic recruitment plan. • Continue cost-benefit analysis of recruitment trips. • Evaluate the use of other recruitment sources. • Identify teaching assistants to move into teaching positions and support their development.
Professional Development
• Evaluate the current professional development stipend. • Evaluate providing assistance to teachers seeking National Board Certification. • In light of No Child Left Behind legislation, identify instructional staff with appropriate
education and experience and assist them in achieving certification in critical needs areas. • Utilize the performance management processes to identify skill set gaps and opportunities
for development. Retention
• Continue strengthening mentoring programs. • Evaluate current retention related programs. • Continue to support equity and diversity initiatives. • Analyze turnover of teachers with 0-3 years experience and develop initiatives. • Continue to develop retention initiatives that address the diverse needs of classified staff. • Identify teachers eligible for retirement who are endorsed in the critical needs areas and ex-
plore incentives for continued employment. • Utilize ability to re-employ retirees in part-time classified and teaching positions. • Continue to conduct exit surveys.
3

Aging Workforce/Retirement
• Continue evaluating current benefit programs with consideration to the issues of this aging workforce.
• Create an incentive for teachers considering retirement to commit early enough to plan for replacements.
4

REPORT
!"!"!"!"
RECRUITMENT, SELECTION AND RETENTION The Human Resources Department has been instrumental in assisting with the recruitment, selec-tion and internal promotion of several key positions over the past year. The team is in the process of creating and implementing a new and innovative competency-based interviewing system. This year they provided interview training, coordinated interviews, conducted pre-employment testing, and assisted with filling all vacant positions. Through September 30, 2002, the Albemarle County School Division hired 127 teachers, five ad-ministrators and 121 classified employees to the system. As the numbers in the chart below indi-cate (which shows hiring trends from 1995 to the present), there has been a decrease in the number of teachers hired from last year by seven. While there is a decrease in the overall number of teachers hired this year, the market continues to be extremely competitive and will be a challenge when re-cruiting and selecting highly qualified teachers.
At the start of the 2002-2003 school year, Albemarle County began hosting their first small group of Visiting International Faculty (VIF) teachers. The VIF program is the leading cultural exchange program for hosting international teachers in the United States. Since 1989, VIF has been bringing highly qualified educators to provide outstanding instruction and cultural enrichment to U.S. stu-dents. Through VIF, we employed three highly qualified, veteran teachers from Australia to teach at the elementary level.
0
20
40
60
80
100
120
140
160
180
9-30-1995 9-30-1996 9-30-1997 9-30-1998 9-30-1999 9-30-2000 9-30-2001 9-30-2002
Teachers Classified Administrators
0
50
100
150
200
250
300
350
9-30-1995 9-30-1996 9-30-1997 9-30-1998 9-30-1999 9-30-2000 9-30-2001 9-30-2002
Total
5
9-30-1995 9-30-1996 9-30-1997 9-30-1998 9-30-1999 9-30-2000 9-30-2001 9-30-2002
Teachers 73 85 89 145 140 176 134 127
Administrators — — — — — 7 7 5
Total 180 194 189 300 256 322 261 253
NEW EMPLOYEES
Classified 107 109 100 155 116 139 120 121

Minority Staffing The hiring of minority staff continues to be a major need and focus area for the Division. It is the philosophy of the Division that the instructional staff should reflect the diversity of the student population. A continuing School Board/Superintendent Priority is to make progress in achieving this comparable level of di-versity within the instruc-tional staff. The data indi-cates a decrease in the over-all number of minority teachers hired this year. We attribute this to the increas-ingly competitive market for instructional minority candi-dates. Competition for minority candidates is intense both in the public and private sec-tors because of the need and importance to make their work forces more diverse. Local competition from the private sector and the loca-tion of Albemarle County make it especially challeng-ing to recruit a more diverse population. Research from the American Association for Employment and Education indicates the perception of minority candidates available has not changed. Approxi-mately 70% of those responding institutions report no change. Additionally, Albemarle County is not located conveniently to a major metropolitan city and is not conducive to a more diverse and cultural lifestyle. Since this has been a challenging demand for all of the surrounding systems, we are partnering with the Charlottesville City Public Schools to find better ways to attract and retain minority employees. One example of our collaboration is the Mentoring for Excellence program. Mentoring for Excellence was established last year under the auspices of the Human Resources Department and the Superintendent’s Equity and Diversity Committee. Its purpose is to provide cultural, personal and professional coaching to new minority employees. The mentors are leaders in the community who have volunteered to assist each new employee with the acclimation of their new position. The mentor is not designed to replace their building level mentor, but to enhance the support needed. Wachovia/First Union Bank serves as the Corporate Sponsor to the program. Over the past eight years, the number of minority teachers in the school division has increased from 70 in 1995-1996 to 79 in 2002-2003. However, past recruiting challenges coupled with a loss of mi-nority teachers resulted in a net decrease of six minority teachers in the division. In addition, two of the five new administrators are minorities. Currently, our minority teaching assistants comprise 14% of the total teaching assistant population.
NEWLY EMPLOYED TEACHING STAFF SINCE LAST YEAR'S REPORT
Asian1%
Hispanic0%
American Indian1%
African American5%
White93%
Count: African American = 8; American Indian = 1; Asian = 2; Hispanic = 0; White = 137
Note: This number includes the 10 new minority teachers in addition to 1 minority teacher hired mid-term.
6

Per the School Board and Superintendent’s stated priority, the instructional staff should reflect the overall diversity of the student population. In order to be successful in achieving this priority, the Division must continue to focus on minority recruitment and retention to close the gap as indicated in the graph .
Minority Employee Distribution Compared to County Resident Minority Distribution
Promotions Albemarle County Public Schools continues to celebrate the many accomplishments of its employ-ees, including those who were successfully promoted. This year 44 employees were promoted within the school division.
Minority Employee Distribution
African American12%
White87%
American Indian<1%
Hispanic1% Asian
<1%
County Resident Distribution
Asian3%
Hispanic2%
African-American10%
White85%
7
20%
8%
14%
17%
24%
55%
17%
40%
22% 23%
9%
4% 1%
30%
18%
0%
10%
20%
30%
40%
50%
60%
Albemarle Charlottesville Fluvanna Louisa
Minority Distribution in Area Schools
Students Teachers Teaching Assistants Administrators Other Support

Retirements Since September 2001, 21 teachers retired compared to 14 in the previous year. The following graph shows a spike in the number of teacher retirements in 2000, then dropping back to earlier lev-els in 2001 and increasing again for 2002 to the second highest level in eight years.
The trend toward more retirees will undoubtedly continue as the Division’s teaching force ages. Retirements will also impact the Division’s administrative and classified staff. The graphs on the following page provide information on the age distribution of Albemarle County teachers, adminis-trators and support staff. From this data, we can anticipate a large number of retirements in the near future. However, retired school employees can return to work in a part-time position and continue to receive their Virginia Retirement System (VRS) pension. Legislation is still pending IRS ap-proval to allow retired teachers and administrators in critical positions to be re-employed full-time and continue to receive VRS pension.
3
5
14
11
15
27
14
21
0
5
10
15
20
25
30
Num
ber o
f Ret
irees
1995 1996 1997 1998 1999 2000 2001 2002Year
Retired Teachers
<1%
1%
2%
1%
2%
3%
1%
2%
8
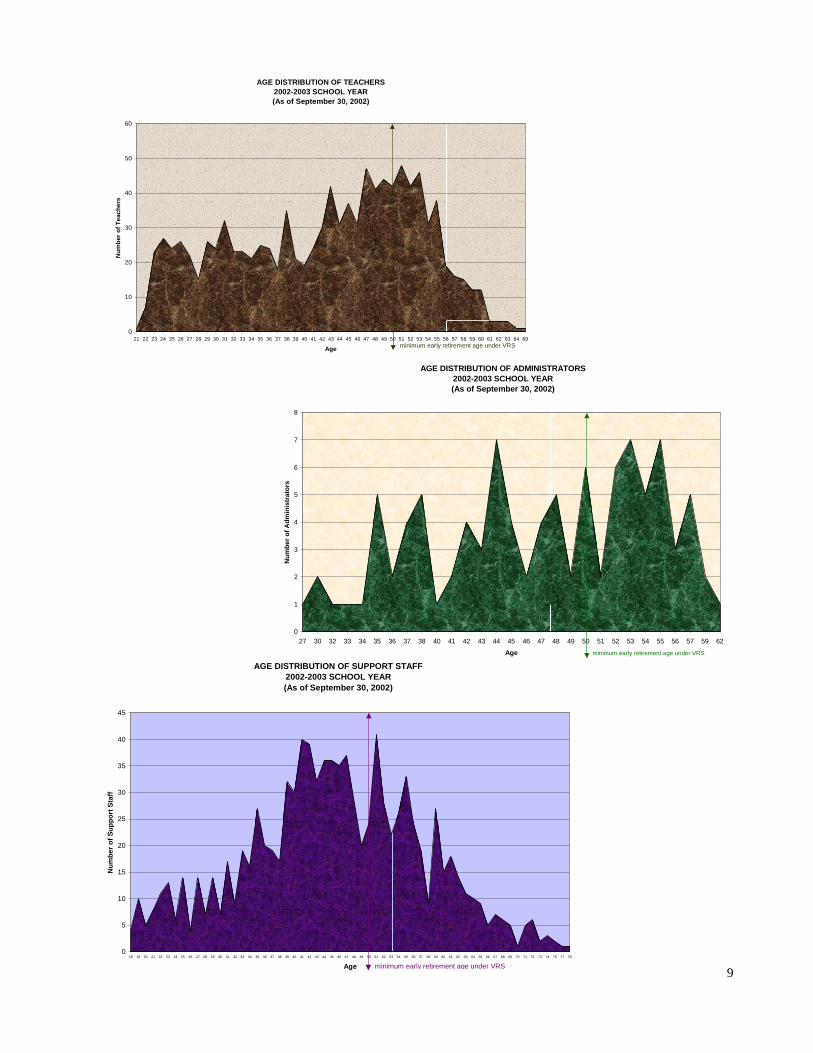
AGE DISTRIBUTION OF TEACHERS2002-2003 SCHOOL YEAR(As of September 30, 2002)
0
10
20
30
40
50
60
21 22 23 24 25 26 27 28 29 30 31 32 33 34 35 36 37 38 39 40 41 42 43 44 45 46 47 48 49 50 51 52 53 54 55 56 57 58 59 60 61 62 63 64 69
Age
Num
ber o
f Tea
cher
s
minimum early retirement age under VRS
AGE DISTRIBUTION OF ADMINISTRATORS2002-2003 SCHOOL YEAR(As of September 30, 2002)
0
1
2
3
4
5
6
7
8
27 30 32 33 34 35 36 37 38 40 41 42 43 44 45 46 47 48 49 50 51 52 53 54 55 56 57 59 62
Age
Num
ber o
f Adm
inis
trat
ors
minimum early retirement age under VRS
AGE DISTRIBUTION OF SUPPORT STAFF2002-2003 SCHOOL YEAR(As of September 30, 2002)
0
5
10
15
20
25
30
35
40
45
18 19 20 21 22 23 24 25 26 27 28 29 30 31 32 33 34 35 36 37 38 39 40 41 42 43 44 45 46 47 48 49 50 51 52 53 54 55 56 57 58 59 60 61 62 63 64 65 66 67 68 69 70 71 72 73 74 75 77 78
Age
Num
ber o
f Sup
port
Sta
ff
minimum early retirement age under VRS 9

One critical element in projecting workforce requirements for the future is to consider the impact of poten-tial retirements. (The following retirement projections do not include service earned in other public entities and thus understates the projection).
The number of employees eligible for full retirement July 2003: (65 years old or 30 years of service)
j 24 Teachers j 5 Administrators j 41 Classified
The number of employees eligible for early retirement (VERIP) July 2003: (50 years old and 10 years of service with Albemarle County)
j 211 Teachers j 27 Administrators j 127 Classified
As the above graph indicates a large number of our employees will be eligible to choose an early retire-ment option this year. Looking ahead to next year, the number of employees eligible to retire continues to be significant as indicated by the following information:
EMPLOYEES ELIGIBLE TO RETIRE JULY 1, 2003
24
41
211
27
127
50
50
100
150
200
250
Teachers Administrators Classified
Nu
mb
er o
f E
mp
loye
es
Eligible for Full Retirement Eligible for Early Retirement
2%
19%
5%
25%
4%
13%
10

The number of additional employees eligible for full retirement July 2004: (65 years old or 30 years of service)
j 13 Teachers j 0 Administrators j 11 Classified
The number of additional employees eligible for early retirement (VERIP) July 2004: (50 years old and 10 years of service with Albemarle County)
j 34 Teachers j 4 Administrators j 14 Classified
Retention
The graph below provides the eight-year trend regarding teacher retention. Teacher retention remained relatively stable over five of the past eight years, between 91.5% and 95.9%. Retention in the past three years was between 85.5% and 87.7%, increasing each successive year.
95.9%
94.2%93.8%
94.5%
91.5%
85.5%85.9%
87.7%
80
82
84
86
88
90
92
94
96
Per
cen
tag
e
1995 1996 1997 1998 1999 2000 2001 2002Year
Teacher Retention Rates
11

The graph on the right provides teacher turnover in-formation by experi-ence level. Consis-tent with national trends, the highest turnover for teachers is within the first three years of teach-ing. However, the turnover rate for teachers in Al-bemarle County with 0-3 years of experi-ence decreased from 10% in 2000-2001 to 8% in 2001-2002. Possible factors in this improvement are improved recruitment, interview and selection tech-niques, success of the building level mentoring programs, and additional training of building level adminis-trators. Retention rates at other levels of years of experience remained stable in comparison to last school year. Performance Appraisal (Pilots) Recognizing that consistent and timely performance evaluations increase retention, performance appraisal draft instruments have been piloted on a division-wide basis for the past two school years. While in the pilot stage, feedback has been collected and will be incorporated into the instruments during the 2002-2003 school year. It is anticipated that the piloted instruments will be adopted by the Board for the 2003-2004 school year. 360° Feedback 360° evaluations, a multiple source feedback process, have been effectively used to identify opportunities for professional growth, create individual development plans and to set goals. In our efforts to provide valuable feedback during the evaluation process, the piloted 360° Feedback Process continued for a sec-ond year. For cost savings, efficiency, and confidentiality, the 360° Feedback process was outsourced in 2001-2002. Participants (or raters) completed the survey information in May and within ten days, a com-posite report summarizing the participants’ perceptions was sent to the administrator. The feedback infor-mation was shared with their supervisor for purposes of goal-setting for this current school year.
TEACHERS LEAVING EMPLOYMENT
74
36
2117
107
24
10 10
86
2016
103
2 10
20
40
60
80
100
120
0-3 yrs 4-10 yrs 11-20 yrs 21-30 yrs 31+ yrsYears of Teaching Experience in Albemarle County
Num
ber o
f Em
ploy
ees
10/1/99-9/30/00 10/1/00-9/30/01 10/1/01-9/30/02
7%
3%
2% 2%
<1%
10%
2%
1% 1%<1%
8%
2% 1%
1%<1%
12

Exit Surveys The Exit Survey data collected for this report includes terminations that occurred between September 1, 2001 and August 31, 2002. There were 370 voluntary and involuntary terminations during this timeframe. Having encompassed an entire twelve months for the first time, making it a more comprehensive process, we can begin to put a higher level of confidence in the survey’s findings. Trends, therefore, will begin to become more evident over the next few years enabling us to recognize where the highest priorities emerge.
Summary of Data from Exit Surveys The findings indicate a very high percentage of employees were at least satisfied with their overall experi-ence of working for Albemarle County Public Schools. The 93% affirmative response rate from the group of surveys we received is up from the 88% mark recorded in last year’s report. The following are some highlights from the survey results. The top 3 reasons for leaving were:
For All Employees: For Teachers Only: • 26% Family circumstances • 38% Family circumstances • 11% Type of work • 14% Type of work • 9% Better compensation • 14% Moving/relocation
Note: The “Other” responses were broken out into groups determined by the written responses in order to give more specific information. One point of interest gleaned from this information was that “Going back to school” or “To continue my education” with an 8% response is making a significant impact.
The top 3 aspects that employees were most dissatisfied with include:
For All Employees: For Teachers Only: • 34% Base salary • 41% Base salary • 32% Most recent increase • 28% Most recent increase • 30% Potential for career growth • 21% Communication with the County as a whole and potential for career growth
The top 3 aspects that employees were most satisfied with include:
For All Employees: • 93% Overall experience • 83% Cooperation with other departments • 79% Communication with their manager, average level of workload
For Teachers Only:
• 97% Overall experience • 97% Communication with their manager • 86% Cooperation within their department, communication within their department, quantity of training, quality
of training
13

The following category corresponds to the employees’ impressions of how they were supervised:
For All Employees, the following are the top three behaviors that their supervisors exhibited at least most of the time:
• 83% Followed policies and practices • 81% Demonstrated fair and equal treatment • 81% Encouraged teamwork and cooperation
For Teachers only, the following are the top three behaviors that their supervisors exhibited at least most of the time:
• 97% Resolved complaints and problems • 93% Demonstrated fair and equal treatment • 93% Followed policies and practices
For All Employees, the following are the top three behaviors that their supervisors rarely or never exhibited:
• 23% Gave constructive feedback • 23% Communicated a clear vision of departmental goals • 21% Provided recognition on the job, encouraged/listened to suggestions
For Teachers only, the following are the top three behaviors that their supervisors rarely or never exhibited:
• 10% Provided recognition on the job • 10% Encouraged teamwork and cooperation • 10% Communicated a clear vision of departmental goals
When asked about the frequency of discussions held with their manager regarding job goals and objec-tives, the employees responded as follows:
All Employees Teachers Only Frequently (2-3x/yr) 51% 69% Infrequently (1x/yr) 34% 31% Never 13% 0% When asked about the frequency of discussions held with their manager regarding their career goals, the employees responded as follows: All Employees Teachers Only Frequently (2-3x/yr) 38% 59% Infrequently (1x/yr) 30% 31% Never 26% 10% When asked how often they received feedback on their performance from their manager, the employees responded as follows: All Employees Teachers Only Frequently (2-3x/yr) 64% 83% Infrequently (1x/yr) 19% 10% Never 9% 0% The final section of the survey allowed the employee to make comments regarding the aspects of being an Albemarle County employee that they enjoyed and also the things they would like to see changed. The
14

following statements are a synopsis of the most significant or recurring statements that were made. On the subject of what employees enjoyed the most about working for Albemarle County, the responses centered around the following:
• Working with the children • Their co-workers (in and out of their department) • The focus on students • The quality of the staff and the organization
When asked what they would like to see changed, common themes amongst the responses were:
• Better pay • Increased/improved communication (in and across departments) • More opportunity for professional development • Increase in staffing levels
cdcd
COMPENSATION AND BENEFITS
Strategic Plan for Total Compensation A planning team of representatives from the County, School Division, and the community worked with Palmer & Cay Consulting Group to develop a Compensation and Benefits strategy by analyzing informa-tion gathered from employees and other organizations. In November 2000, the Joint Boards adopted the Total Compensation strategy and later adopted a process by which to establish the annual merit pool in-crease and salary scale adjustment. The new process was used this past year in making recommendations on compensation and benefits to the Joint Boards that resulted in the Board of Supervisors and the School Board implementing a 3.3% average salary increase (including step) for teachers distributed across the scale, a 3.0% salary scale adjustment and a 3.8% merit pool for classified/administrative staff in FY 2002-2003. Compensation and Benefits Strategy Adopted by Joint Boards � Overall Goal: The overall goal of the County’s Compensation and Benefits strategy is to provide
competitive compensation opportunities that reinforce high performance from all em-ployees and the achievement of organizational goals.
� Base Salary: Base salary range midpoints are targeted at approximately market levels (i.e., @ 100th
percentile). � Benefits: Benefits will be targeted slightly above the County’s competitive market (i.e., @ 105th
percentile).
15

� Competitive Market: The primary competitive market for all County positions is defined as:
• Counties and School systems of similar size within the State of Virginia; • Counties and School systems located in the same geographic region of the State of Virginia;
and, • Local private employers within the Charlottesville area for positions that are not unique to gov-
ernment and/or education industry. � Internal Equity: Our focus on establishing an equitable compensation program is reflected in our
dedication to considering internal equity and market compensation levels in estab-lishing base salary ranges.
Steps Taken to Achieve Strategy � Compensation:
The data from our competitive market indicated that salaries matched the market for teachers and lagged the market for classified/administrators an average of 2.5% as of July 2001. To reach the ob-jective of paying employees at market, two actions were taken effective July, 2002 as indicated below. Classified Scale and Employees' Increase: 1. Our classified salary struc-
ture was increased by 3.0% to increase our com-petitiveness in the recruiting market for new employees. This did not impact current employees unless they were paid below the minimum of their paygrade.
2. To reward current employ-
ees for their job perform-ance and maintain internal equity with the market, the merit pool amount was funded at 3.8%. This resulted in a range of increase amounts depending on performance rating, salary/midpoint ratio and departmental pool amount.
The graph above indicates the progress we made in closing the gap between Albemarle County and our market.
-4.50
-2.50
0.50
-6.00
-5.00
-4.00
-3.00
-2.00
-1.00
0.00
1.00
2.00
Per
cent
age
FY 00/01 FY 01/02 FY 02/03
Classified Salary Scale
Albemarle Market
16
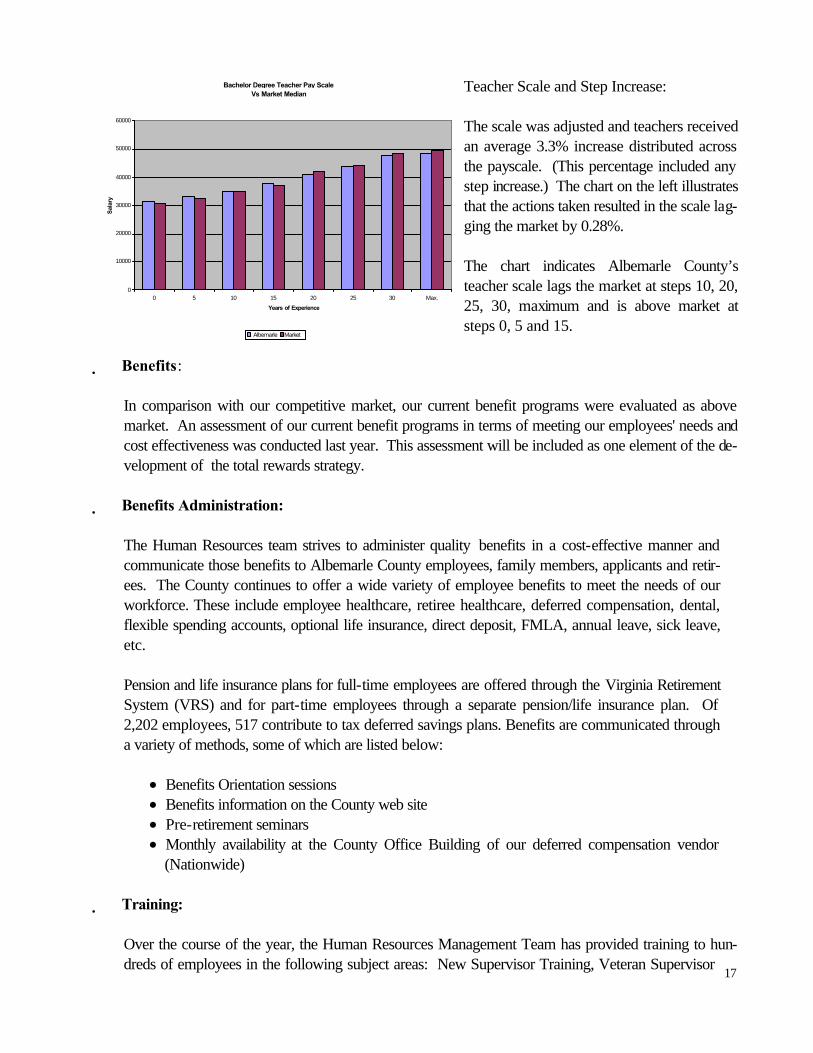
Teacher Scale and Step Increase: The scale was adjusted and teachers received an average 3.3% increase distributed across the payscale. (This percentage included any step increase.) The chart on the left illustrates that the actions taken resulted in the scale lag-ging the market by 0.28%. The chart indicates Albemarle County’s teacher scale lags the market at steps 10, 20, 25, 30, maximum and is above market at steps 0, 5 and 15.
� Benefits:
In comparison with our competitive market, our current benefit programs were evaluated as above market. An assessment of our current benefit programs in terms of meeting our employees' needs and cost effectiveness was conducted last year. This assessment will be included as one element of the de-velopment of the total rewards strategy.
� Benefits Administration:
The Human Resources team strives to administer quality benefits in a cost-effective manner and communicate those benefits to Albemarle County employees, family members, applicants and retir-ees. The County continues to offer a wide variety of employee benefits to meet the needs of our workforce. These include employee healthcare, retiree healthcare, deferred compensation, dental, flexible spending accounts, optional life insurance, direct deposit, FMLA, annual leave, sick leave, etc.
Pension and life insurance plans for full-time employees are offered through the Virginia Retirement System (VRS) and for part-time employees through a separate pension/life insurance plan. Of 2,202 employees, 517 contribute to tax deferred savings plans. Benefits are communicated through a variety of methods, some of which are listed below: j Benefits Orientation sessions j Benefits information on the County web site j Pre-retirement seminars j Monthly availability at the County Office Building of our deferred compensation vendor
(Nationwide)
� Training:
Over the course of the year, the Human Resources Management Team has provided training to hun-dreds of employees in the following subject areas: New Supervisor Training, Veteran Supervisor
Bachelor Degree Teacher Pay Scale Vs Market Median
0
10000
20000
30000
40000
50000
60000
0 5 10 15 20 25 30 Max.
Years of Experience
Sal
ary
Albemarle Market
17

Workshop, Interviewing (Legal Issues and Interview Skills), Retention Strategies for Managers and Supervisors, and Sexual Harassment Training. Additionally, through the Albemarle Resource Center (ARC), employees were offered a variety of training opportunities. Some of the more popular ones included classes on quality improvement, time management, team leadership, meeting facilitation, and customer service.
� Rewards And Recognition:
The County's employee recognition program was revamped and aligned to better meet the needs of the individual employees and provide more meaningful forums for providing recognition. Instead of a centralized annual event, the recognition is conducted within the employee's department/school, as studies have indicated this form of recognition is more valued by employees. In addition, the forms of recognition have been expanded:
• for 10 and 15 years, employees now receive a gift • for 20+ years, employees choose from a selection of gifts that best suit their needs
In the Fall of 2002, 316 employees were recognized for their service milestones which occurred be-tween January 1, 2001 and June 30, 2002.
18
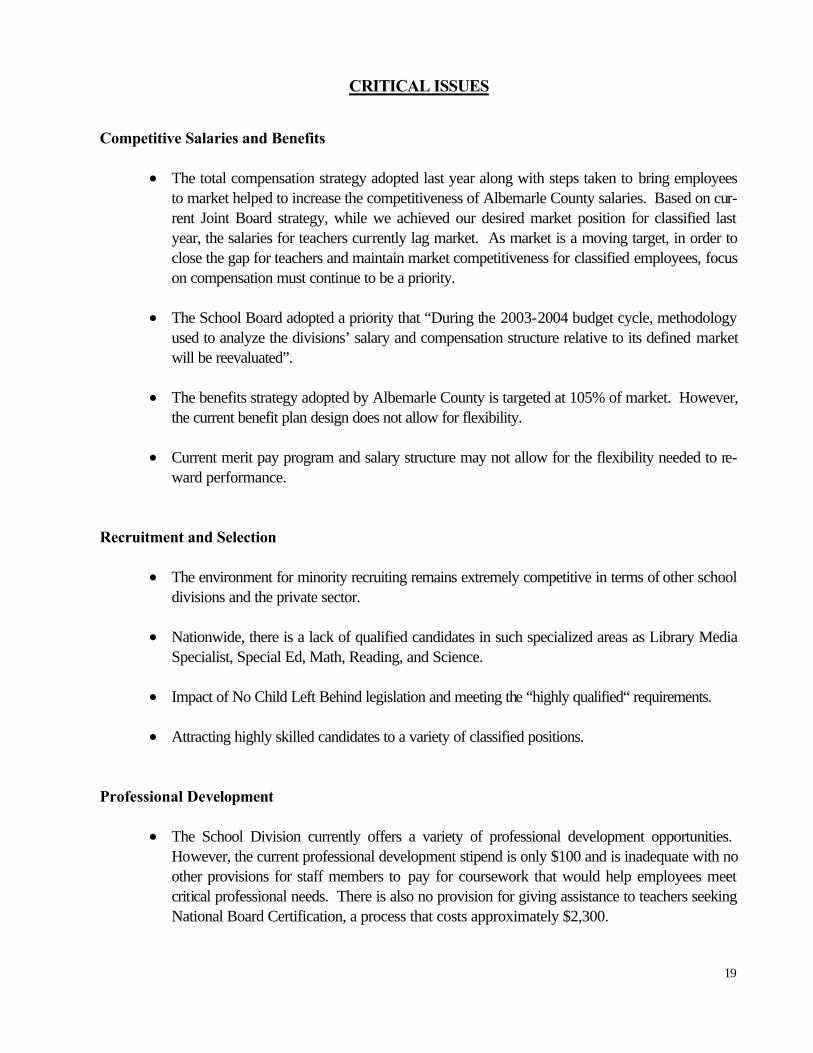
CRITICAL ISSUES Competitive Salaries and Benefits
j The total compensation strategy adopted last year along with steps taken to bring employees to market helped to increase the competitiveness of Albemarle County salaries. Based on cur-rent Joint Board strategy, while we achieved our desired market position for classified last year, the salaries for teachers currently lag market. As market is a moving target, in order to close the gap for teachers and maintain market competitiveness for classified employees, focus on compensation must continue to be a priority.
j The School Board adopted a priority that “During the 2003-2004 budget cycle, methodology
used to analyze the divisions’ salary and compensation structure relative to its defined market will be reevaluated”.
j The benefits strategy adopted by Albemarle County is targeted at 105% of market. However,
the current benefit plan design does not allow for flexibility.
j Current merit pay program and salary structure may not allow for the flexibility needed to re-ward performance.
Recruitment and Selection
j The environment for minority recruiting remains extremely competitive in terms of other school divisions and the private sector.
j Nationwide, there is a lack of qualified candidates in such specialized areas as Library Media
Specialist, Special Ed, Math, Reading, and Science.
j Impact of No Child Left Behind legislation and meeting the “highly qualified“ requirements.
j Attracting highly skilled candidates to a variety of classified positions.
Professional Development
j The School Division currently offers a variety of professional development opportunities. However, the current professional development stipend is only $100 and is inadequate with no other provisions for staff members to pay for coursework that would help employees meet critical professional needs. There is also no provision for giving assistance to teachers seeking National Board Certification, a process that costs approximately $2,300.
19

j Successful management of the workforce requires those in supervisory roles to exhibit people management skills. The data from the exit surveys currently identified deficiencies in these skills in some of our supervisors.
j The No Child Left Behind legislation will require review of current teacher endorsements.
Retention
j A high turnover rate exists for teachers with 0-3 years experience. j The high number of employees currently eligible for early retirement. j Increased retention of classified employees, particularly in bus driver positions.
Aging Workforce/Retirement
j Our workforce in Albemarle County is aging. This not only impacts an increasing number of retirements, but has implications for our benefit plans as well, to include increased health insur-ance costs, sick leave and sick leave bank usage, disability retirements, and workers compen-sation incidents.
j Those in supervisory positions are not currently well versed in the legal and administrative im-
plications related to health and disability issues, such as Family Medical Leave Act (FMLA) and Americans with Disabilities Act (ADA).
j Teacher turnover due to retirement, with typically short notice, creates recruitment and staffing
difficulties.
20

RECOMMENDATIONS - BASED ON CRITICAL ISSUES
Competitive Salaries and Benefits
j For FY 2003-2004, following the Joint Board adopted compensation process, establish budgeted increases as indicated: j No increase in the classified scale j 3.8% merit pool for classified staff j 4.08% funding for teacher increases (including step) to be distributed along the scale
j Reevaluate the methodology of the Joint Board adopted compensation process. This may in-
clude reviewing the following options: position relative to the adopted market, using market average or another measure instead of market median, selecting different markets for different positions.
j Continue evaluating current benefit programs in terms of meeting employees' needs and cost
effectiveness. Our current benefit plan design should be flexible to meet the needs of our di-verse workforce.
j Continue providing a longevity increase for teachers.
j Develop Total Rewards Strategy.
Recruitment and Selection
j Continue to offer early contracts for teaching positions in all areas with particular emphasis on
minority teachers and hard-to-fill positions.
j Develop a strategic recruitment plan to include analysis of our current plan, projection of future needs and recommendations based on that assessment.
j Continue cost-benefit analysis of recruitment trips over a three-year period to clearly identify
where we have had the most success. Adjust recruiting planning as necessary in order to get the most out of these recruitment opportunities.
j Evaluate the use of other recruitment sources, such as education web sites and professional
organizations. In addition, begin developing relationships with schools that target key groups.
j Identify retired Albemarle County employees for re-instatement in critical teaching areas, which may be permitted now by the Virginia Retirement System.
j Continue partnering with Support Services Departments: Transportation, Child Nutrition and
Building Services to identify their employment needs and create recruitment initiatives. 21

j Identify Teaching Assistants with appropriate education and experience, assess their level of interest in a teaching position and assist them in achieving certification in critical needs areas.
Professional Development
j Evaluate the current professional development stipend ($100) for recommended increase. j Evaluate financial assistance to teachers seeking National Board Certification.
j In light of No Child Left Behind legislation, identify instructional staff with appropriate educa-
tion and experience and assist them in achieving certification in critical needs areas by provid-ing support for necessary coursework.
j To comply with No Child Left Behind legislation, assess qualifications of current instructional
staff, conduct gap analysis, and develop plan to address any identified issues.
j Utilize the performance management processes to identify skill set gaps and opportunities for development. Create realistic development plans to leverage strengths and address perform-ance opportunities.
Retention
j Continue strengthening mentoring programs in the schools and departments throughout the Di-vision.
j Evaluate current retention related programs to identify areas of improvement to include new
hire orientation, pre-employment workshops, diversity initiatives and employee recognition.
j Continue to support equity and diversity initiatives as a means of improving the overall working environment for all employees.
j Analyze the various factors causing the high rate of turnover of teachers with 0-3 years experi-
ence and then develop initiatives to address the causes for turnover. j Continue to develop retention initiatives that address the diverse needs of the classified staff,
such as the attendance reward program for bus drivers. j Identify teachers eligible for retirement who are endorsed in the critical needs areas. Explore
incentives for continued employment. j Continue to conduct exit surveys in order to identify critical issues that need to be addressed to
increase retention. 22

j Utilize ability to re-employ retirees in part-time classified and teaching positions.
Aging Workforce/Retirement
j Continue evaluating current benefit programs in terms of meeting employees' needs and cost effectiveness, with consideration to the issues of this aging workforce. This includes a review of elder care options, long-term care insurance options and phased-in retirement benefits.
j Assess related supervisory training needs and develop training plan. j Create an incentive for retiring teachers to commit to a retirement date early enough to plan for
replacements. j Create succession plans for key positions to reduce the impact of retirements.
23

CONCLUSION The School Division's success in the coming years in attracting and maintaining a high-quality, high-performing, and diverse workforce in an extremely competitive environment will be a function of the Divi-sion's ability to continually focus on these areas by developing and implementing initiatives to address an ever-changing and competitive employment environment. The recruitment, selection, development and retention of a quality workforce is a function of the interaction of a number of factors, including, but not limited to: Compensation/Benefits, Performance Management, Organizational Development, and Quality of the Work Environment. The reorganization of the Human Resources Department has effectively aligned the Human Resources staff, allowing them to proactively provide the services and solutions to meet the School Division's needs.
24

Appendix 1

Table 1
# % # % # % # % # %ELEMENTARY
AGNOR-HURT 3 0.7 38 8.9 103 24.0 37 8.6 248 57.8 429BAKER-BUTLER 0 0.0 18 4.0 33 7.3 2 0.4 400 88.3 453BROADUS WOOD 0 0.0 3 0.9 5 1.4 1 0.3 341 97.4 350BROWNSVILLE 1 0.3 0 0.0 28 8.8 18 5.6 273 85.3 320CALE 0 0.0 11 2.2 89 17.6 52 10.3 355 70.0 507CROZET 0 0.0 5 1.5 12 3.5 13 3.8 310 91.2 340GREER 3 0.8 83 20.8 113 28.3 34 8.5 166 41.6 399HOLLYMEAD 0 0.0 25 5.9 27 6.3 9 2.1 366 85.7 427MERIWETHER LEWIS 1 0.2 9 2.0 5 1.1 7 1.6 426 95.1 448MURRAY ELEM. 0 0.0 15 5.6 9 3.4 3 1.1 240 89.9 267RED HILL 0 0.0 4 2.4 23 13.5 16 9.4 127 74.7 170SCOTTSVILLE 3 1.7 0 0.0 7 3.9 3 1.7 165 92.7 178STONE-ROBINSON 0 0.0 2 0.4 68 14.8 15 3.3 374 81.5 459STONY POINT 0 0.0 6 2.9 22 10.7 2 1.0 175 85.4 205WOODBROOK 1 0.3 13 4.0 87 27.0 5 1.6 216 67.1 322YANCEY 1 0.7 0 0.0 50 33.6 9 6.0 89 59.7 149
SUBTOTAL 13 0.2 232 4.3 681 12.6 226 4.2 4271 78.8 5423MIDDLE
BURLEY 0 0.0 6 1.5 92 22.7 8 2.0 299 73.8 405HENLEY 0 0.0 6 0.9 25 3.7 11 1.6 627 93.7 669JOUETT 0 0.0 33 5.8 71 12.4 29 5.1 439 76.7 572SUTHERLAND 0 0.0 19 2.9 107 16.1 8 1.2 531 79.8 665WALTON 0 0.0 7 1.1 123 18.5 30 4.5 505 75.9 665
SUBTOTAL 0 0.0 71 2.4 418 14.0 86 2.9 2401 80.7 2976HIGH
ALBEMARLE H.S. 0 0.0 76 4.6 260 15.8 37 2.2 1274 77.4 1647MONTICELLO H.S. 0 0.0 9 0.8 195 17.8 39 3.6 850 77.8 1093MURRAY 0 0.0 1 1.2 8 9.4 1 1.2 75 88.2 85WESTERN ALBEMARLE 2 0.2 25 2.5 36 3.5 14 1.4 941 92.4 1018
SUBTOTAL 2 0.1 111 2.9 499 13.0 91 2.4 3140 81.7 3843TOTAL 15 0.1 414 3.4 1598 13.1 403 3.3 9812 80.2 12242
25
ALBEMARLE COUNTY PUBLIC SCHOOLS
STUDENT ETHNIC DISTRIBUTION2002-2003 SCHOOL YEAR (As of September 30, 2002)
SCHOOLS TOTAL AMERICAN
INDIANHISPANIC
AFRICANAMERICAN
ASIAN WHITE

26 Table 2
# % # % # % # % # % # % # % # %AGNOR-HURT 59 57 96.6 2 3.4 52 88.1 6 10.2 1 1.7 0 0.0 0 0.0 7 11.9BAKER-BUTLER 51 44 86.3 7 13.7 48 94.1 3 5.9 0 0.0 0 0.0 0 0.0 3 5.9BROADUS WOOD 39 37 94.9 2 5.1 37 94.9 2 5.1 0 0.0 0 0.0 0 0.0 2 5.1BROWNSVILLE 50 48 96.0 2 4.0 46 92.0 4 8.0 0 0.0 0 0.0 0 0.0 4 8.0CALE 72 65 90.3 7 9.7 62 86.1 5 6.9 2 2.8 2 2.8 1 1.4 10 13.9CROZET 53 49 92.5 4 7.5 50 94.3 3 5.7 0 0.0 0 0.0 0 0.0 3 5.7GREER 64 61 95.3 3 4.7 59 92.2 2 3.1 2 3.1 1 1.6 0 0.0 5 7.8HOLLYMEAD 60 53 88.3 7 11.7 54 90.0 4 6.7 1 1.7 1 1.7 0 0.0 6 10.0MERIWETHER LEWIS 48 43 89.6 5 10.4 47 97.9 1 2.1 0 0.0 0 0.0 0 0.0 1 2.1MURRAY E.S. 40 38 95.0 2 5.0 38 95.0 1 2.5 1 2.5 0 0.0 0 0.0 2 5.0RED HILL 31 28 90.3 3 9.7 29 93.5 1 3.2 1 3.2 0 0.0 0 0.0 2 6.5SCOTTSVILLE 29 23 79.3 6 20.7 26 89.7 3 10.3 0 0.0 0 0.0 0 0.0 3 10.3STONE-ROBINSON 74 69 93.2 5 6.8 71 95.9 3 4.1 0 0.0 0 0.0 0 0.0 3 4.1STONY POINT 36 33 91.7 3 8.3 36 100.0 0 0.0 0 0.0 0 0.0 0 0.0 0 0.0WOODBROOK 48 42 87.5 6 12.5 48 100.0 0 0.0 0 0.0 0 0.0 0 0.0 0 0.0YANCEY 28 24 85.7 4 14.3 27 96.4 1 3.6 0 0.0 0 0.0 0 0.0 1 3.6BURLEY M.S. 53 39 73.6 14 26.4 42 79.2 10 18.9 1 1.9 0 0.0 0 0.0 11 20.8HENLEY M.S. 62 45 72.6 17 27.4 55 88.7 6 9.7 0 0.0 0 0.0 1 1.6 7 11.3JOUETT M.S. 58 45 77.6 13 22.4 49 84.5 9 15.5 0 0.0 0 0.0 0 0.0 9 15.5SUTHERLAND M.S. 57 40 70.2 17 29.8 55 96.5 2 3.5 0 0.0 0 0.0 0 0.0 2 3.5WALTON M.S. 72 53 73.6 19 26.4 66 91.7 4 5.6 1 1.4 1 1.4 0 0.0 6 8.3ALBEMARLE H.S. 174 121 69.5 53 30.5 160 92.0 13 7.5 0 0.0 1 0.6 0 0.0 14 8.0MONTICELLO H.S. 128 86 67.2 42 32.8 110 85.9 17 13.3 0 0.0 0 0.0 1 0.8 18 14.1MURRAY H.S. 13 9 69.2 4 30.8 11 84.6 1 7.7 1 7.7 0 0.0 0 0.0 2 15.4WESTERN ALBEMARLE H.S. 106 72 67.9 34 32.1 96 90.6 9 8.5 0 0.0 1 0.9 0 0.0 10 9.4ENTERPRISE CENTER 5 3 60.0 2 40.0 4 80.0 1 20.0 0 0.0 0 0.0 0 0.0 1 20.0
SUBTOTAL 1510 1227 81.3 283 18.7 1378 91.3 111 7.4 11 0.7 7 0.5 3 0.2 132 8.7
ALBEMARLE COUNTY PUBLIC SCHOOLS
EMPLOYEE ETHNIC DISTRIBUTION2002-2003 SCHOOL YEAR (As of September 30, 2002)
SCHOOLSTOTAL NO.
OFEMPLOYEES WHITE ASIANHISPANIC
AFRICAN-AMERICAN
TOTALMINORITY
EMPLOYEESAMERICAN
INDIANFEMALE MALE

EMPLOYEE ETHNIC DISTRIBUTION continued… Table 2
# % # % # % # % # % # % # % # %BUS SHOP 230 143 62.2 87 37.8 179 77.8 51 22.2 0 0.0 0 0.0 0 0.0 51 22.2SCHOOL BOARD 9 4 44.4 5 55.6 9 100.0 0 0.0 0 0.0 0 0.0 0 0.0 0 0.0MAINTENANCE SHOP 40 6 15.0 34 85.0 33 82.5 7 17.5 0 0.0 0 0.0 0 0.0 7 17.5MEDIA CENTER 4 2 50.0 2 50.0 3 75.0 0 0.0 1 25.0 0 0.0 0 0.0 1 25.0SUPERINTENDENT'S OFFICE 2 1 50.0 1 50.0 1 50.0 1 50.0 0 0.0 0 0.0 0 0.0 1 50.0FEDERAL/COMMUNITY ED. 10 8 80.0 2 20.0 8 80.0 2 20.0 0 0.0 0 0.0 0 0.0 2 20.0INSTRUCTION 14 13 92.9 1 7.1 13 92.9 1 7.1 0 0.0 0 0.0 0 0.0 1 7.1SPECIAL SERVICES 13 10 76.9 3 23.1 11 84.6 2 15.4 0 0.0 0 0.0 0 0.0 2 15.4ESOL 13 13 100.0 0 0.0 11 84.6 1 7.7 1 7.7 0 0.0 0 0.0 2 15.4COMMUNITY EDUCATION 73 65 89.0 8 11.0 59 80.8 9 12.3 3 4.1 2 2.7 0 0.0 14 19.2FISCAL SERVICES 7 6 85.7 1 14.3 6 85.7 1 14.3 0 0.0 0 0.0 0 0.0 1 14.3BUILDING SERVICES 120 32 26.7 88 73.3 46 38.3 71 59.2 3 2.5 0 0.0 0 0.0 74 61.7SUPPORT & PLANNING 2 1 50.0 1 50.0 2 100.0 0 0.0 0 0.0 0 0.0 0 0.0 0 0.0GUIDANCE AND EVALUATION 4 3 75.0 1 25.0 4 100.0 0 0.0 0 0.0 0 0.0 0 0.0 0 0.0SCHOOL TECHNOLOGY 16 5 31.3 11 68.8 16 100.0 0 0.0 0 0.0 0 0.0 0 0.0 0 0.0HUMAN RESOURCES 17 14 82.4 3 17.6 13 76.5 4 23.5 0 0.0 0 0.0 0 0.0 4 23.5CHILD NUTRITION PROGRAM 115 105 91.3 10 8.7 100 87.0 12 10.4 1 0.9 1 0.9 1 0.9 15 13.0RESOURCE CENTER 3 3 100.0 0 0.0 2 66.7 1 33.3 0 0.0 0 0.0 0 0.0 1 33.3
SUBTOTAL 692 434 62.7 258 37.3 516 74.6 163 23.6 9 1.3 3 0.4 1 0.1 176 25.4GRAND TOTAL 2202 1661 75.4 541 24.6 1894 86.0 274 12.4 20 0.9 10 0.5 4 0.2 308 14.0
# % # % # % # % # % # % # % # %CATEC 36 18 50.0 18 50.0 28 77.8 8 22.2 0 0.0 0 0.0 0 0.0 8 22.2
27
SCHOOLSTOTAL NO.
OFEMPLOYEES WHITE
AFRICAN-AMERICAN
HISPANIC ASIANAMERICAN
INDIAN
TOTALMINORITY
EMPLOYEES
HISPANIC ASIANAMERICAN
INDIAN
TOTALMINORITY
EMPLOYEESFEMALE MALE
FEMALE MALE
CHARLOTTESVILLE-ALBEMARLE TECHNICAL EDUCATION CENTER
SCHOOLSTOTAL NO.
OFEMPLOYEES WHITE
AFRICAN-AMERICAN

28 Table 2
# % # % # % # % # % # % # % # % # %
AGNOR-HURT 59 52 88.1 7 11.9 37 97.4 1 2.6 35 92.1 3 7.9 0 0.0 0 0.0 0 0.0BAKER-BUTLER 51 48 94.1 3 5.9 30 88.2 4 11.8 33 97.1 1 2.9 0 0.0 0 0.0 0 0.0BROADUS WOOD 39 37 94.9 2 5.1 27 93.1 2 6.9 28 96.6 1 3.4 0 0.0 0 0.0 0 0.0BROWNSVILLE 50 46 92.0 4 8.0 27 90.0 3 10.0 28 93.3 2 6.7 0 0.0 0 0.0 0 0.0CALE 72 62 86.1 10 13.9 42 87.5 6 12.5 40 83.3 3 6.3 2 4.2 2 4.2 1 2.1CROZET 53 50 94.3 3 5.7 29 90.6 3 9.4 30 93.8 2 6.3 0 0.0 0 0.0 0 0.0GREER 64 59 92.2 5 7.8 39 95.1 2 4.9 40 97.6 1 2.4 0 0.0 0 0.0 0 0.0HOLLYMEAD 60 54 90.0 6 10.0 34 85.0 6 15.0 36 90.0 2 5.0 1 2.5 1 2.5 0 0.0MERIWETHER LEWIS 48 47 97.9 1 2.1 30 85.7 5 14.3 35 100.0 0 0.0 0 0.0 0 0.0 0 0.0MURRAY E.S. 40 38 95.0 2 5.0 26 96.3 1 3.7 26 96.3 1 3.7 0 0.0 0 0.0 0 0.0RED HILL 31 29 93.5 2 6.5 20 90.9 2 9.1 20 90.9 1 4.5 1 4.5 0 0.0 0 0.0SCOTTSVILLE 29 26 89.7 3 10.3 15 75.0 5 25.0 18 90.0 2 10.0 0 0.0 0 0.0 0 0.0STONE-ROBINSON 74 71 95.9 3 4.1 41 89.1 5 10.9 45 97.8 1 2.2 0 0.0 0 0.0 0 0.0STONY POINT 36 36 100.0 0 0.0 17 89.5 2 10.5 19 100.0 0 0.0 0 0.0 0 0.0 0 0.0WOODBROOK 48 48 100.0 0 0.0 29 85.3 5 14.7 34 100.0 0 0.0 0 0.0 0 0.0 0 0.0YANCEY 28 27 96.4 1 3.6 15 83.3 3 16.7 17 94.4 1 5.6 0 0.0 0 0.0 0 0.0BURLEY M.S. 53 42 79.2 11 20.8 28 68.3 13 31.7 35 85.4 5 12.2 1 2.4 0 0.0 0 0.0HENLEY M.S. 62 55 88.7 7 11.3 36 72.0 14 28.0 44 88.0 6 12.0 0 0.0 0 0.0 0 0.0JOUETT M.S. 58 49 84.5 9 15.5 38 79.2 10 20.8 42 87.5 6 12.5 0 0.0 0 0.0 0 0.0SUTHERLAND M.S. 57 55 96.5 2 3.5 32 66.7 16 33.3 47 97.9 1 2.1 0 0.0 0 0.0 0 0.0WALTON M.S. 72 66 91.7 6 8.3 40 70.2 17 29.8 52 91.2 3 5.3 1 1.8 1 1.8 0 0.0ALBEMARLE H.S. 174 160 92.0 14 8.0 85 63.4 49 36.6 127 94.8 6 4.5 0 0.0 1 0.7 0 0.0MONTICELLO H.S. 128 110 85.9 18 14.1 61 65.6 32 34.4 84 90.3 8 8.6 0 0.0 0 0.0 1 1.1MURRAY H.S. 13 11 84.6 2 15.4 7 63.6 4 36.4 9 81.8 1 9.1 1 9.1 0 0.0 0 0.0WESTERN ALBEMARLE H.S. 106 96 90.6 10 9.4 51 61.4 32 38.6 78 94.0 4 4.8 0 0.0 1 1.2 0 0.0ENTERPRISE CENTER 5 4 80.0 1 20.0 2 66.7 1 33.3 3 100.0 0 0.0 0 0.0 0 0.0 0 0.0
SUBTOTAL 1510 1378 91.3 132 8.7 838 77.5 243 22.5 1005 93.0 61 5.6 7 0.6 6 0.6 2 0.2
SCHOOLSTOTAL NO.
OFEMPLOYEES
TOTAL # OF EMPLOYEES TEACHERS
FEMALE MALEMINORITY
ALBEMARLE COUNTY PUBLIC SCHOOLS
EMPLOYEE ETHNIC DISTRIBUTION2002-2003 SCHOOL YEAR (As of September 30, 2002)
WHITE ASIANHISPANICAFRICAN-
AMERICANAMERICAN
INDIANWHITE
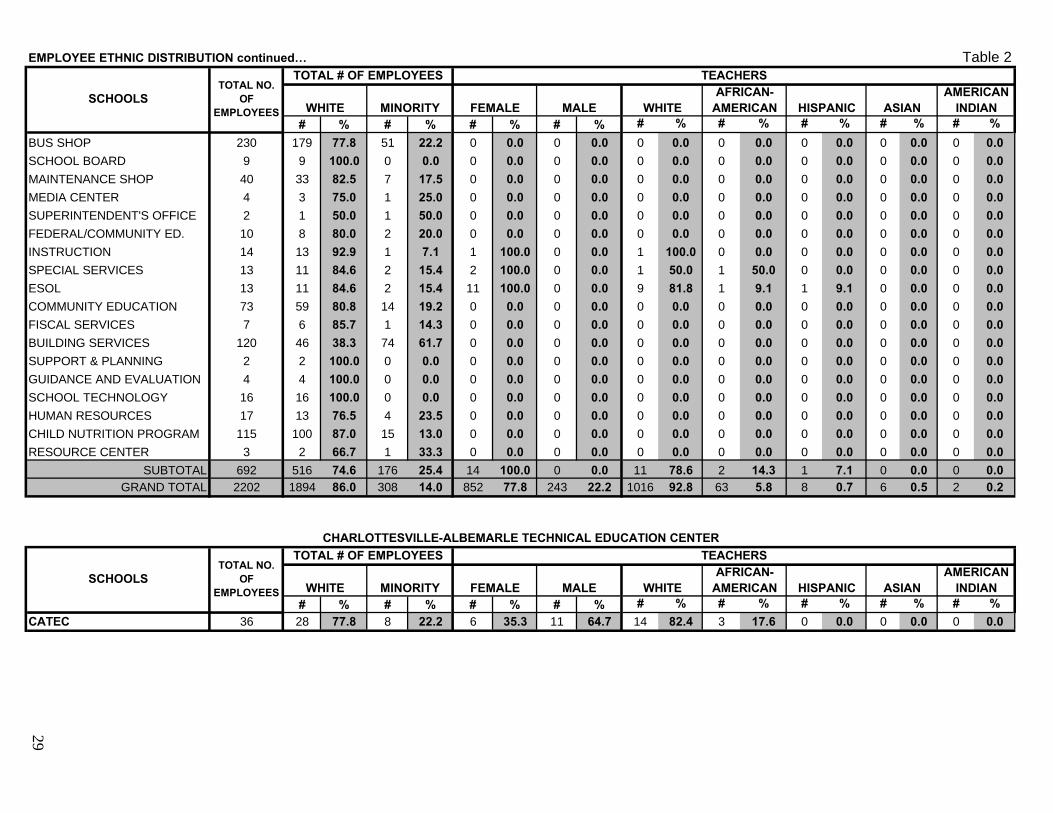
EMPLOYEE ETHNIC DISTRIBUTION continued… Table 2
# % # % # % # % # % # % # % # % # %
BUS SHOP 230 179 77.8 51 22.2 0 0.0 0 0.0 0 0.0 0 0.0 0 0.0 0 0.0 0 0.0SCHOOL BOARD 9 9 100.0 0 0.0 0 0.0 0 0.0 0 0.0 0 0.0 0 0.0 0 0.0 0 0.0MAINTENANCE SHOP 40 33 82.5 7 17.5 0 0.0 0 0.0 0 0.0 0 0.0 0 0.0 0 0.0 0 0.0MEDIA CENTER 4 3 75.0 1 25.0 0 0.0 0 0.0 0 0.0 0 0.0 0 0.0 0 0.0 0 0.0SUPERINTENDENT'S OFFICE 2 1 50.0 1 50.0 0 0.0 0 0.0 0 0.0 0 0.0 0 0.0 0 0.0 0 0.0FEDERAL/COMMUNITY ED. 10 8 80.0 2 20.0 0 0.0 0 0.0 0 0.0 0 0.0 0 0.0 0 0.0 0 0.0INSTRUCTION 14 13 92.9 1 7.1 1 100.0 0 0.0 1 100.0 0 0.0 0 0.0 0 0.0 0 0.0SPECIAL SERVICES 13 11 84.6 2 15.4 2 100.0 0 0.0 1 50.0 1 50.0 0 0.0 0 0.0 0 0.0ESOL 13 11 84.6 2 15.4 11 100.0 0 0.0 9 81.8 1 9.1 1 9.1 0 0.0 0 0.0COMMUNITY EDUCATION 73 59 80.8 14 19.2 0 0.0 0 0.0 0 0.0 0 0.0 0 0.0 0 0.0 0 0.0FISCAL SERVICES 7 6 85.7 1 14.3 0 0.0 0 0.0 0 0.0 0 0.0 0 0.0 0 0.0 0 0.0BUILDING SERVICES 120 46 38.3 74 61.7 0 0.0 0 0.0 0 0.0 0 0.0 0 0.0 0 0.0 0 0.0SUPPORT & PLANNING 2 2 100.0 0 0.0 0 0.0 0 0.0 0 0.0 0 0.0 0 0.0 0 0.0 0 0.0GUIDANCE AND EVALUATION 4 4 100.0 0 0.0 0 0.0 0 0.0 0 0.0 0 0.0 0 0.0 0 0.0 0 0.0SCHOOL TECHNOLOGY 16 16 100.0 0 0.0 0 0.0 0 0.0 0 0.0 0 0.0 0 0.0 0 0.0 0 0.0HUMAN RESOURCES 17 13 76.5 4 23.5 0 0.0 0 0.0 0 0.0 0 0.0 0 0.0 0 0.0 0 0.0CHILD NUTRITION PROGRAM 115 100 87.0 15 13.0 0 0.0 0 0.0 0 0.0 0 0.0 0 0.0 0 0.0 0 0.0RESOURCE CENTER 3 2 66.7 1 33.3 0 0.0 0 0.0 0 0.0 0 0.0 0 0.0 0 0.0 0 0.0
SUBTOTAL 692 516 74.6 176 25.4 14 100.0 0 0.0 11 78.6 2 14.3 1 7.1 0 0.0 0 0.0GRAND TOTAL 2202 1894 86.0 308 14.0 852 77.8 243 22.2 1016 92.8 63 5.8 8 0.7 6 0.5 2 0.2
# % # % # % # % # % # % # % # % # %CATEC 36 28 77.8 8 22.2 6 35.3 11 64.7 14 82.4 3 17.6 0 0.0 0 0.0 0 0.0
29
SCHOOLSTOTAL NO.
OFEMPLOYEES
TOTAL # OF EMPLOYEES TEACHERS
FEMALE MALE
CHARLOTTESVILLE-ALBEMARLE TECHNICAL EDUCATION CENTER
SCHOOLSTOTAL NO.
OFEMPLOYEES
WHITE MINORITY WHITEAFRICAN-
AMERICAN HISPANIC ASIANAMERICAN
INDIAN
WHITEAFRICAN-
AMERICAN HISPANIC ASIANWHITE MINORITY FEMALE MALEAMERICAN
INDIAN
TOTAL # OF EMPLOYEES TEACHERS

30 Table 2
# % # % # % # % # % # % # % # % # %
AGNOR-HURT 59 52 88.1 7 11.9 2 100.0 0 0.0 2 100.0 0 0.0 0 0.0 0 0.0 0 0.0BAKER-BUTLER 51 48 94.1 3 5.9 1 50.0 1 50.0 2 100.0 0 0.0 0 0.0 0 0.0 0 0.0BROADUS WOOD 39 37 94.9 2 5.1 1 100.0 0 0.0 1 100.0 0 0.0 0 0.0 0 0.0 0 0.0BROWNSVILLE 50 46 92.0 4 8.0 0 0.0 1 100.0 1 100.0 0 0.0 0 0.0 0 0.0 0 0.0CALE 72 62 86.1 10 13.9 1 50.0 1 50.0 2 100.0 0 0.0 0 0.0 0 0.0 0 0.0CROZET 53 50 94.3 3 5.7 1 100.0 0 0.0 1 100.0 0 0.0 0 0.0 0 0.0 0 0.0GREER 64 59 92.2 5 7.8 1 50.0 1 50.0 2 100.0 0 0.0 0 0.0 0 0.0 0 0.0HOLLYMEAD 60 54 90.0 6 10.0 2 100.0 0 0.0 2 100.0 0 0.0 0 0.0 0 0.0 0 0.0MERIWETHER LEWIS 48 47 97.9 1 2.1 2 100.0 0 0.0 1 50.0 1 50.0 0 0.0 0 0.0 0 0.0MURRAY E.S. 40 38 95.0 2 5.0 0 0.0 1 100.0 1 100.0 0 0.0 0 0.0 0 0.0 0 0.0RED HILL 31 29 93.5 2 6.5 0 0.0 1 100.0 1 100.0 0 0.0 0 0.0 0 0.0 0 0.0SCOTTSVILLE 29 26 89.7 3 10.3 1 100.0 0 0.0 1 100.0 0 0.0 0 0.0 0 0.0 0 0.0STONE-ROBINSON 74 71 95.9 3 4.1 2 100.0 0 0.0 2 100.0 0 0.0 0 0.0 0 0.0 0 0.0STONY POINT 36 36 100.0 0 0.0 0 0.0 1 100.0 1 100.0 0 0.0 0 0.0 0 0.0 0 0.0WOODBROOK 48 48 100.0 0 0.0 1 100.0 0 0.0 1 100.0 0 0.0 0 0.0 0 0.0 0 0.0YANCEY 28 27 96.4 1 3.6 1 100.0 0 0.0 1 100.0 0 0.0 0 0.0 0 0.0 0 0.0BURLEY M.S. 53 42 79.2 11 20.8 1 50.0 1 50.0 0 0.0 2 100.0 0 0.0 0 0.0 0 0.0HENLEY M.S. 62 55 88.7 7 11.3 0 0.0 2 100.0 2 100.0 0 0.0 0 0.0 0 0.0 0 0.0JOUETT M.S. 58 49 84.5 9 15.5 1 50.0 1 50.0 1 50.0 1 50.0 0 0.0 0 0.0 0 0.0SUTHERLAND M.S. 57 55 96.5 2 3.5 1 50.0 1 50.0 1 50.0 1 50.0 0 0.0 0 0.0 0 0.0WALTON M.S. 72 66 91.7 6 8.3 0 0.0 2 100.0 2 100.0 0 0.0 0 0.0 0 0.0 0 0.0ALBEMARLE H.S. 174 160 92.0 14 8.0 5 62.5 3 37.5 5 62.5 3 37.5 0 0.0 0 0.0 0 0.0MONTICELLO H.S. 128 110 85.9 18 14.1 3 42.9 4 57.1 5 71.4 2 28.6 0 0.0 0 0.0 0 0.0MURRAY H.S. 13 11 84.6 2 15.4 1 100.0 0 0.0 1 100.0 0 0.0 0 0.0 0 0.0 0 0.0WESTERN ALBEMARLE H.S. 106 96 90.6 10 9.4 3 60.0 2 40.0 4 80.0 1 20.0 0 0.0 0 0.0 0 0.0ENTERPRISE CENTER 5 4 80.0 1 20.0 1 100.0 0 0.0 1 100.0 0 0.0 0 0.0 0 0.0 0 0.0
SUBTOTAL 1510 1378 91.3 132 8.7 32 58.2 23 41.8 44 80.0 11 20.0 0 0.0 0 0.0 0 0.0
ALBEMARLE COUNTY PUBLIC SCHOOLS
EMPLOYEE ETHNIC DISTRIBUTION2002-2003 SCHOOL YEAR (As of September 30, 2002)
WHITE ASIANHISPANICAFRICAN-
AMERICANAMERICAN
INDIANWHITESCHOOLS
TOTAL NO.OF
EMPLOYEES
TOTAL # OF EMPLOYEES ADMINISTRATORS*
FEMALE MALEMINORITY
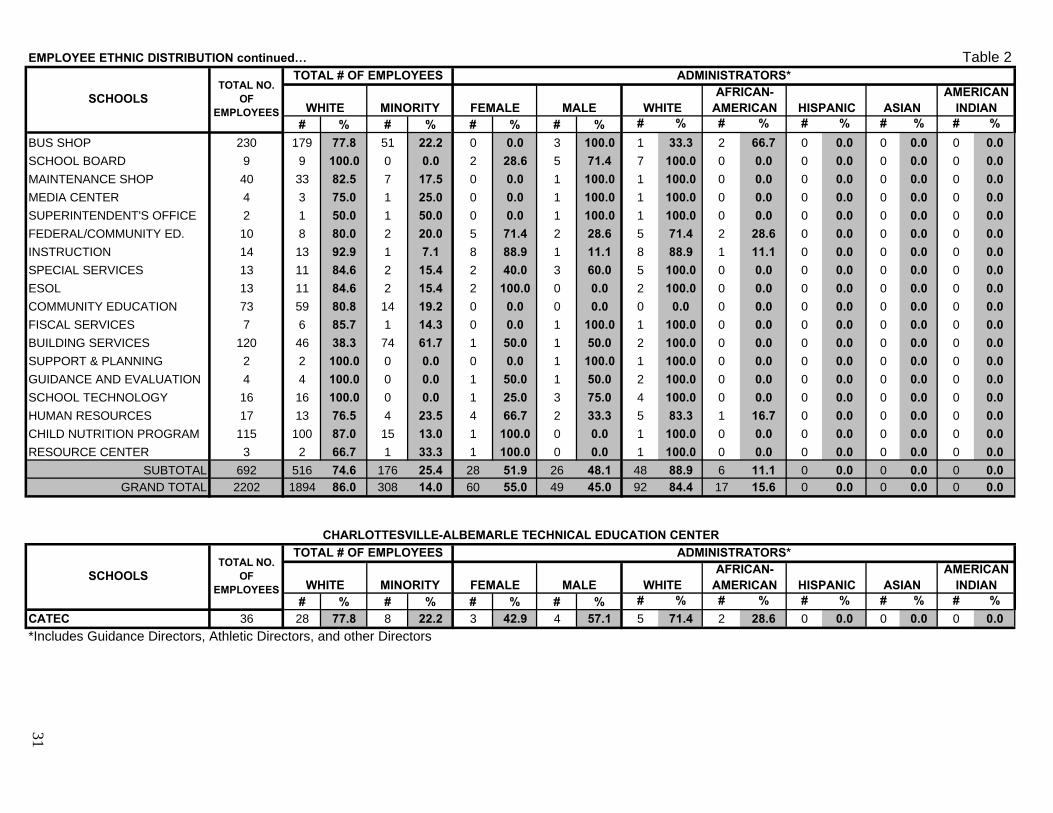
EMPLOYEE ETHNIC DISTRIBUTION continued… Table 2
# % # % # % # % # % # % # % # % # %
BUS SHOP 230 179 77.8 51 22.2 0 0.0 3 100.0 1 33.3 2 66.7 0 0.0 0 0.0 0 0.0SCHOOL BOARD 9 9 100.0 0 0.0 2 28.6 5 71.4 7 100.0 0 0.0 0 0.0 0 0.0 0 0.0MAINTENANCE SHOP 40 33 82.5 7 17.5 0 0.0 1 100.0 1 100.0 0 0.0 0 0.0 0 0.0 0 0.0MEDIA CENTER 4 3 75.0 1 25.0 0 0.0 1 100.0 1 100.0 0 0.0 0 0.0 0 0.0 0 0.0SUPERINTENDENT'S OFFICE 2 1 50.0 1 50.0 0 0.0 1 100.0 1 100.0 0 0.0 0 0.0 0 0.0 0 0.0FEDERAL/COMMUNITY ED. 10 8 80.0 2 20.0 5 71.4 2 28.6 5 71.4 2 28.6 0 0.0 0 0.0 0 0.0INSTRUCTION 14 13 92.9 1 7.1 8 88.9 1 11.1 8 88.9 1 11.1 0 0.0 0 0.0 0 0.0SPECIAL SERVICES 13 11 84.6 2 15.4 2 40.0 3 60.0 5 100.0 0 0.0 0 0.0 0 0.0 0 0.0ESOL 13 11 84.6 2 15.4 2 100.0 0 0.0 2 100.0 0 0.0 0 0.0 0 0.0 0 0.0COMMUNITY EDUCATION 73 59 80.8 14 19.2 0 0.0 0 0.0 0 0.0 0 0.0 0 0.0 0 0.0 0 0.0FISCAL SERVICES 7 6 85.7 1 14.3 0 0.0 1 100.0 1 100.0 0 0.0 0 0.0 0 0.0 0 0.0BUILDING SERVICES 120 46 38.3 74 61.7 1 50.0 1 50.0 2 100.0 0 0.0 0 0.0 0 0.0 0 0.0SUPPORT & PLANNING 2 2 100.0 0 0.0 0 0.0 1 100.0 1 100.0 0 0.0 0 0.0 0 0.0 0 0.0GUIDANCE AND EVALUATION 4 4 100.0 0 0.0 1 50.0 1 50.0 2 100.0 0 0.0 0 0.0 0 0.0 0 0.0SCHOOL TECHNOLOGY 16 16 100.0 0 0.0 1 25.0 3 75.0 4 100.0 0 0.0 0 0.0 0 0.0 0 0.0HUMAN RESOURCES 17 13 76.5 4 23.5 4 66.7 2 33.3 5 83.3 1 16.7 0 0.0 0 0.0 0 0.0CHILD NUTRITION PROGRAM 115 100 87.0 15 13.0 1 100.0 0 0.0 1 100.0 0 0.0 0 0.0 0 0.0 0 0.0RESOURCE CENTER 3 2 66.7 1 33.3 1 100.0 0 0.0 1 100.0 0 0.0 0 0.0 0 0.0 0 0.0
SUBTOTAL 692 516 74.6 176 25.4 28 51.9 26 48.1 48 88.9 6 11.1 0 0.0 0 0.0 0 0.0GRAND TOTAL 2202 1894 86.0 308 14.0 60 55.0 49 45.0 92 84.4 17 15.6 0 0.0 0 0.0 0 0.0
# % # % # % # % # % # % # % # % # %CATEC 36 28 77.8 8 22.2 3 42.9 4 57.1 5 71.4 2 28.6 0 0.0 0 0.0 0 0.0*Includes Guidance Directors, Athletic Directors, and other Directors
31
AMERICANINDIAN
TOTAL # OF EMPLOYEES ADMINISTRATORS*
WHITE MINORITY FEMALE MALE WHITEAFRICAN-
AMERICAN HISPANIC ASIAN
CHARLOTTESVILLE-ALBEMARLE TECHNICAL EDUCATION CENTER
SCHOOLSTOTAL NO.
OFEMPLOYEES
WHITE MINORITY WHITEAFRICAN-
AMERICAN HISPANIC ASIANAMERICAN
INDIANSCHOOLS
TOTAL NO.OF
EMPLOYEES
TOTAL # OF EMPLOYEES ADMINISTRATORS*
FEMALE MALE

32 Table 2
# % # % # % # % # % # % # % # % # %
AGNOR-HURT 59 52 88.1 7 11.9 18 94.7 1 5.3 15 78.9 3 15.8 1 5.3 0 0.0 0 0.0BAKER-BUTLER 51 48 94.1 3 5.9 13 86.7 2 13.3 13 86.7 2 13.3 0 0.0 0 0.0 0 0.0BROADUS WOOD 39 37 94.9 2 5.1 9 100.0 0 0.0 8 88.9 1 11.1 0 0.0 0 0.0 0 0.0BROWNSVILLE 50 46 92.0 4 8.0 15 78.9 4 21.1 17 89.5 2 10.5 0 0.0 0 0.0 0 0.0CALE 72 62 86.1 10 13.9 22 100.0 0 0.0 20 90.9 2 9.1 0 0.0 0 0.0 0 0.0CROZET 53 50 94.3 3 5.7 19 95.0 1 5.0 19 95.0 1 5.0 0 0.0 0 0.0 0 0.0GREER 64 59 92.2 5 7.8 21 100.0 0 0.0 17 81.0 1 4.8 2 9.5 1 4.8 0 0.0HOLLYMEAD 60 54 90.0 6 10.0 17 94.4 1 5.6 16 88.9 2 11.1 0 0.0 0 0.0 0 0.0MERIWETHER LEWIS 48 47 97.9 1 2.1 11 100.0 0 0.0 11 100.0 0 0.0 0 0.0 0 0.0 0 0.0MURRAY E.S. 40 38 95.0 2 5.0 12 100.0 0 0.0 11 91.7 0 0.0 1 8.3 0 0.0 0 0.0RED HILL 31 29 93.5 2 6.5 8 100.0 0 0.0 8 100.0 0 0.0 0 0.0 0 0.0 0 0.0SCOTTSVILLE 29 26 89.7 3 10.3 7 87.5 1 12.5 7 87.5 1 12.5 0 0.0 0 0.0 0 0.0STONE-ROBINSON 74 71 95.9 3 4.1 26 100.0 0 0.0 24 92.3 2 7.7 0 0.0 0 0.0 0 0.0STONY POINT 36 36 100.0 0 0.0 16 100.0 0 0.0 16 100.0 0 0.0 0 0.0 0 0.0 0 0.0WOODBROOK 48 48 100.0 0 0.0 12 92.3 1 7.7 13 100.0 0 0.0 0 0.0 0 0.0 0 0.0YANCEY 28 27 96.4 1 3.6 8 88.9 1 11.1 9 100.0 0 0.0 0 0.0 0 0.0 0 0.0BURLEY M.S. 53 42 79.2 11 20.8 10 100.0 0 0.0 7 70.0 3 30.0 0 0.0 0 0.0 0 0.0HENLEY M.S. 62 55 88.7 7 11.3 9 90.0 1 10.0 9 90.0 0 0.0 0 0.0 0 0.0 1 10.0JOUETT M.S. 58 49 84.5 9 15.5 6 75.0 2 25.0 6 75.0 2 25.0 0 0.0 0 0.0 0 0.0SUTHERLAND M.S. 57 55 96.5 2 3.5 7 100.0 0 0.0 7 100.0 0 0.0 0 0.0 0 0.0 0 0.0WALTON M.S. 72 66 91.7 6 8.3 13 100.0 0 0.0 12 92.3 1 7.7 0 0.0 0 0.0 0 0.0ALBEMARLE H.S. 174 160 92.0 14 8.0 31 96.9 1 3.1 28 87.5 4 12.5 0 0.0 0 0.0 0 0.0MONTICELLO H.S. 128 110 85.9 18 14.1 22 78.6 6 21.4 21 75.0 7 25.0 0 0.0 0 0.0 0 0.0MURRAY H.S. 13 11 84.6 2 15.4 1 100.0 0 0.0 1 100.0 0 0.0 0 0.0 0 0.0 0 0.0WESTERN ALBEMARLE H.S. 106 96 90.6 10 9.4 18 100.0 0 0.0 14 77.8 4 22.2 0 0.0 0 0.0 0 0.0ENTERPRISE CENTER 5 4 80.0 1 20.0 0 0.0 1 100.0 0 0.0 1 100.0 0 0.0 0 0.0 0 0.0
SUBTOTAL 1510 1378 91.3 132 8.7 351 93.9 23 6.1 329 88.0 39 10.4 4 1.1 1 0.3 1 0.3
SCHOOLSTOTAL NO.
OFEMPLOYEES
TOTAL # OF EMPLOYEES SUPPORT STAFF
FEMALE MALEMINORITY
ALBEMARLE COUNTY PUBLIC SCHOOLS
EMPLOYEE ETHNIC DISTRIBUTION2002-2003 SCHOOL YEAR (As of September 30, 2002)
WHITE ASIANHISPANICAFRICAN-
AMERICANAMERICAN
INDIANWHITE

EMPLOYEE ETHNIC DISTRIBUTION continued… Table 2
# % # % # % # % # % # % # % # % # %
BUS SHOP 230 179 77.8 51 22.2 143 63.0 84 37.0 178 78.4 49 21.6 0 0.0 0 0.0 0 0.0SCHOOL BOARD 9 9 100.0 0 0.0 2 100.0 0 0.0 2 100.0 0 0.0 0 0.0 0 0.0 0 0.0MAINTENANCE SHOP 40 33 82.5 7 17.5 6 15.4 33 84.6 32 82.1 7 17.9 0 0.0 0 0.0 0 0.0MEDIA CENTER 4 3 75.0 1 25.0 2 66.7 1 33.3 2 66.7 0 0.0 1 33.3 0 0.0 0 0.0SUPERINTENDENT'S OFFICE 2 1 50.0 1 50.0 1 100.0 0 0.0 0 0.0 1 100.0 0 0.0 0 0.0 0 0.0FEDERAL/COMMUNITY ED. 10 8 80.0 2 20.0 3 100.0 0 0.0 3 100.0 0 0.0 0 0.0 0 0.0 0 0.0INSTRUCTION 14 13 92.9 1 7.1 4 100.0 0 0.0 4 100.0 0 0.0 0 0.0 0 0.0 0 0.0SPECIAL SERVICES 13 11 84.6 2 15.4 6 100.0 0 0.0 5 83.3 1 16.7 0 0.0 0 0.0 0 0.0ESOL 13 11 84.6 2 15.4 0 0.0 0 0.0 0 0.0 0 0.0 0 0.0 0 0.0 0 0.0COMMUNITY EDUCATION 73 59 80.8 14 19.2 65 89.0 8 11.0 59 80.8 9 12.3 3 4.1 2 2.7 0 0.0FISCAL SERVICES 7 6 85.7 1 14.3 6 100.0 0 0.0 5 83.3 1 16.7 0 0.0 0 0.0 0 0.0BUILDING SERVICES 120 46 38.3 74 61.7 31 26.3 87 73.7 44 37.3 71 60.2 3 2.5 0 0.0 0 0.0SUPPORT & PLANNING 2 2 100.0 0 0.0 1 100.0 0 0.0 1 100.0 0 0.0 0 0.0 0 0.0 0 0.0GUIDANCE AND EVALUATION 4 4 100.0 0 0.0 2 100.0 0 0.0 2 100.0 0 0.0 0 0.0 0 0.0 0 0.0SCHOOL TECHNOLOGY 16 16 100.0 0 0.0 4 33.3 8 66.7 12 100.0 0 0.0 0 0.0 0 0.0 0 0.0HUMAN RESOURCES 17 13 76.5 4 23.5 10 90.9 1 9.1 8 72.7 3 27.3 0 0.0 0 0.0 0 0.0CHILD NUTRITION PROGRAM 115 100 87.0 15 13.0 104 91.2 10 8.8 99 86.8 12 10.5 1 0.9 1 0.9 1 0.9RESOURCE CENTER 3 2 66.7 1 33.3 2 100.0 0 0.0 1 50.0 1 50.0 0 0.0 0 0.0 0 0.0
SUBTOTAL 692 516 74.6 176 25.4 392 62.8 232 37.2 457 73.2 155 24.8 8 1.3 3 0.5 1 0.2GRAND TOTAL 2202 1894 86.0 308 14.0 743 74.4 255 25.6 786 78.8 194 19.4 12 1.2 4 0.4 2 0.2
# % # % # % # % # % # % # % # % # %CATEC 36 28 77.8 8 22.2 9 75.0 3 25.0 9 75.0 3 25.0 0 0.0 0 0.0 0 0.0
33
SCHOOLSTOTAL NO.
OFEMPLOYEES
TOTAL # OF EMPLOYEES SUPPORT
FEMALE MALE
CHARLOTTESVILLE-ALBEMARLE TECHNICAL EDUCATION CENTER
SCHOOLSTOTAL NO.
OFEMPLOYEES
WHITE MINORITY WHITEAFRICAN-
AMERICAN HISPANIC ASIANAMERICAN
INDIAN
WHITEAFRICAN-
AMERICAN HISPANIC ASIANWHITE MINORITY FEMALE MALEAMERICAN
INDIAN
TOTAL # OF EMPLOYEES SUPPORT STAFF
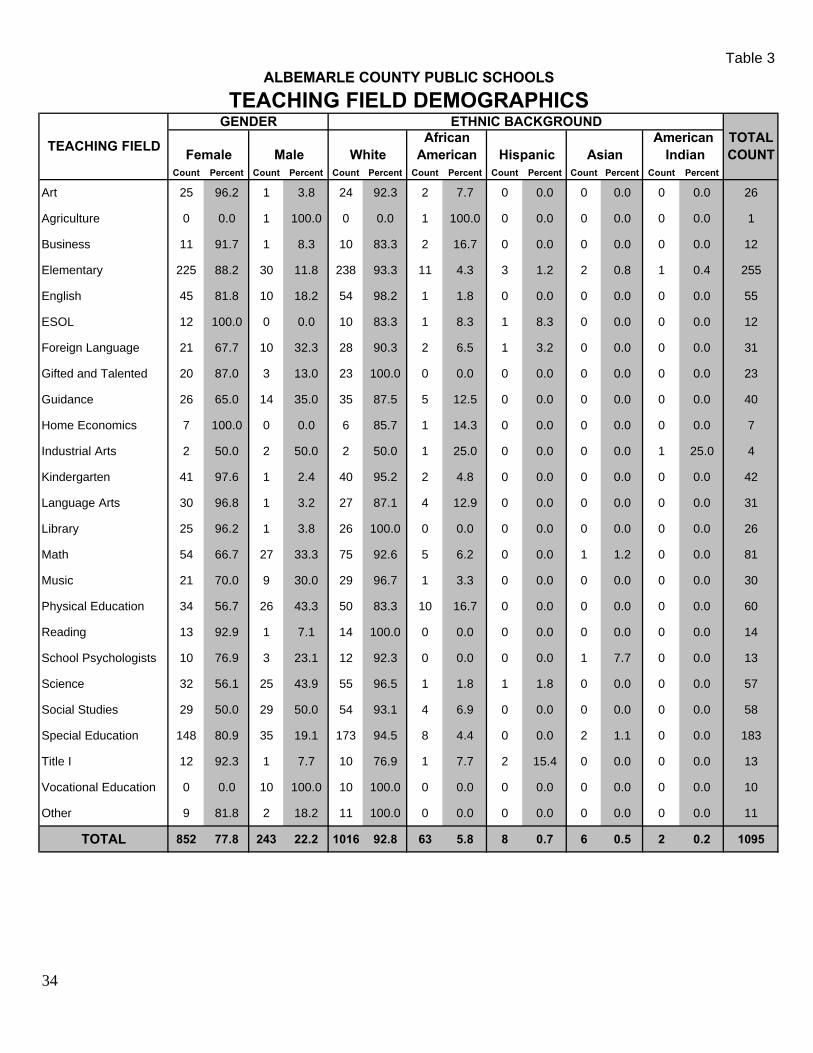
Table 3
Count Percent Count Percent Count Percent Count Percent Count Percent Count Percent Count Percent
Art 25 96.2 1 3.8 24 92.3 2 7.7 0 0.0 0 0.0 0 0.0 26
Agriculture 0 0.0 1 100.0 0 0.0 1 100.0 0 0.0 0 0.0 0 0.0 1
Business 11 91.7 1 8.3 10 83.3 2 16.7 0 0.0 0 0.0 0 0.0 12
Elementary 225 88.2 30 11.8 238 93.3 11 4.3 3 1.2 2 0.8 1 0.4 255
English 45 81.8 10 18.2 54 98.2 1 1.8 0 0.0 0 0.0 0 0.0 55
ESOL 12 100.0 0 0.0 10 83.3 1 8.3 1 8.3 0 0.0 0 0.0 12
Foreign Language 21 67.7 10 32.3 28 90.3 2 6.5 1 3.2 0 0.0 0 0.0 31
Gifted and Talented 20 87.0 3 13.0 23 100.0 0 0.0 0 0.0 0 0.0 0 0.0 23
Guidance 26 65.0 14 35.0 35 87.5 5 12.5 0 0.0 0 0.0 0 0.0 40
Home Economics 7 100.0 0 0.0 6 85.7 1 14.3 0 0.0 0 0.0 0 0.0 7
Industrial Arts 2 50.0 2 50.0 2 50.0 1 25.0 0 0.0 0 0.0 1 25.0 4
Kindergarten 41 97.6 1 2.4 40 95.2 2 4.8 0 0.0 0 0.0 0 0.0 42
Language Arts 30 96.8 1 3.2 27 87.1 4 12.9 0 0.0 0 0.0 0 0.0 31
Library 25 96.2 1 3.8 26 100.0 0 0.0 0 0.0 0 0.0 0 0.0 26
Math 54 66.7 27 33.3 75 92.6 5 6.2 0 0.0 1 1.2 0 0.0 81
Music 21 70.0 9 30.0 29 96.7 1 3.3 0 0.0 0 0.0 0 0.0 30
Physical Education 34 56.7 26 43.3 50 83.3 10 16.7 0 0.0 0 0.0 0 0.0 60
Reading 13 92.9 1 7.1 14 100.0 0 0.0 0 0.0 0 0.0 0 0.0 14
School Psychologists 10 76.9 3 23.1 12 92.3 0 0.0 0 0.0 1 7.7 0 0.0 13
Science 32 56.1 25 43.9 55 96.5 1 1.8 1 1.8 0 0.0 0 0.0 57
Social Studies 29 50.0 29 50.0 54 93.1 4 6.9 0 0.0 0 0.0 0 0.0 58
Special Education 148 80.9 35 19.1 173 94.5 8 4.4 0 0.0 2 1.1 0 0.0 183
Title I 12 92.3 1 7.7 10 76.9 1 7.7 2 15.4 0 0.0 0 0.0 13
Vocational Education 0 0.0 10 100.0 10 100.0 0 0.0 0 0.0 0 0.0 0 0.0 10
Other 9 81.8 2 18.2 11 100.0 0 0.0 0 0.0 0 0.0 0 0.0 11
TOTAL 852 77.8 243 22.2 1016 92.8 63 5.8 8 0.7 6 0.5 2 0.2 1095
34
ALBEMARLE COUNTY PUBLIC SCHOOLS
TEACHING FIELD DEMOGRAPHICS
Female Male WhiteAfrican
American
GENDER ETHNIC BACKGROUNDTOTALCOUNT
TEACHING FIELDHispanic Asian
American Indian

Table 4
2001-2002 RECRUITMENT SCHEDULE
DATE(S) & TIMES LOCATIONS TYPE
October 23, 2001 Minority Career Day
Omni Hotel Charlottesville, VA
Annual Career Fair
November, 2001 VASPA Norfolk, VA
Education Career Fair
December, 2001 MAASCUS Hershey, PA
Education Career Fair
February 8 & 9, 2002 University of Virginia Charlottesville, VA
Education Career Fair
March 19, 2002 Fairmont State College Fairmont, WV
Education Career Fair
March 20, 2002 Hampton University Hampton, VA
Education Career Fair
March 21, 2002 Radford University/Virginia Tech Radford, VA
Education Career Fair
March 11, 2002 James Madison University Harrisonburg, VA
Education Career Fair
March 21, 2002 College of William & Mary Williamsburg, VA
Education Career Fair
April 22, 2002 Central New York Consortium Cortland, NY
Education Career Fair
April 23, 2002 Western New York Consortium Buffalo, NY
Education Career Fair
April 24, 2002 Rochester Area Consortium Rochester, NY
Education Career Fair
35

Table 5
ALBEMARLE COUNTY PUBLIC SCHOOLS SUMMARY OF 2001-2002 RECRUITMENT TRIP RESULTS
# OF APPLICATIONS SUBMITTED
# OF APPLICANTS HIRED COLLEGE/UNIVERSITY # INTERVIEWED/ PARTICIPATED
#M #F #MI #C TOTAL
#M #F #MI #C TOTAL
U. Va. Minority Career Day 44 0 1 0 1 1 0 0 0 0 0 Virginia Association of School Personnel Admin. (VASPA) Job Fairs 41 0 0 0 0 0 0 0 0 0 0
MAASCUS 60 0 0 0 0 0 0 0 0 0 0 U. Va. Education Expo 50 3 12 2 13 15 0 2 0 2 2
Fairmont State 12 2 2 0 4 4 0 1 0 1 1
Hampton University 6 0 0 0 0 0 0 0 0 0 0 Radford University & Virginia Tech 8 3 1 0 4 4 0 0 0 0 0
James Madison University 17 2 1 0 3 3 0 1 0 1 1
College of William & Mary 8 0 2 0 2 0 0 0 0 0 0 Rochester Area TRD 33 0 5 0 5 5 0 0 0 0 0
Western New York (Buffalo) 47 3 1 0 4 4 0 0 0 0 0
Central New York (Cortland) 50 2 2 0 4 4 0 0 0 0 0 TOTAL FOR TRIPS 376 15 27 2 40 42 0 4 0 4 4
“OPEN RECRUITMENT” 129 360 35 454 489 24 99 10 113 123
TOTAL 144 387 37 494 531 24 103 10 117 127 LEGEND: #M = NUMBER OF MALES #MI = NUMBER OF MINORITIES #F = NUMBER OF FEMALES #C = NUMBER OF CAUCASIANS * = both local government and school recruitment
36

Table 6 SUMMARY COMPARISON OF RECRUITMENT TRIPS
1999-2000 2000-2001 2001-2002
COLLEGE/UNIVERSITY TOTAL APPLICATIONS
TOTAL HIRED
TOTAL APPLICATIONS
TOTAL HIRED
TOTAL APPLICATIONS
TOTAL HIRED
Virginia Commonwealth University 6 2 1 0 n/a n/a West Virginia University n/a n/a 1 0 n/a n/a Virginia Union University 0 0 0 0 n/a n/a U.Va. Minority Career Day 0 0 2 0 1 0 Virginia Association of School Personnel Admin. (VASPA) Job Fairs 4 1 9 0 0 0
MAASCUS n/a n/a 0 0 0 0 Norfolk State University 0 0 1 0 n/a n/a Liberty University n/a n/a 3 0 n/a n/a U.Va. Education Expo 24 6 4 4 15 2 Marshall University (WV) n/a n/a 4 1 n/a n/a Fairmont State 3 1 2 2 4 1 Hampton University 0 0 0 0 0 0 Radford University & Virginia Tech 8 2 2 2 4 0 Spelman College/Clark/Morris Brown (Atlanta, GA) n/a n/a 0 0 n/a n/a
James Madison University 7 1 4 1 3 1 University of Maryland – DC Consortium n/a n/a 1 1 n/a n/a
College of William & Mary 5 3 3 0 0 0 University of Florida n/a n/a 2 1 n/a n/a Rochester Area TRD 7 5 1 0 5 0 Western New York (Buffalo) n/a n/a 7 4 4 0 Central New York (Cortland) 11 2 3 2 4 0 Ohio State University n/a n/a 9 0 n/a n/a Lynchburg College 2 0 n/a n/a n/a n/a Saint Paul’s College 0 0 n/a n/a n/a n/a Longwood College 1 1 n/a n/a n/a n/a Virginia State University 0 0 n/a n/a n/a n/a Old Dominion University 3 0 n/a n/a n/a n/a TOTAL FOR TRIPS 81 24 59 18 42 4 “OPEN” RECRUITMENT 537 152 593 117 489 123 TOTAL 618 176 652 135 531 127
37

Table 7
MALE FEMALE # %Elementary School 3 45 48 37.8%Middle School 10 25 35 27.6%High School 11 33 44 34.6%TOTAL 24 103 127 100.0%
Male Female Total Male Female Total Male Female Total # %Bachelor's 2 21 23 5 13 18 6 16 22 63 49.6%Master's 0 21 21 5 9 14 5 15 20 55 43.3%Master's Plus 30 Hours 1 1 2 0 3 3 0 2 2 7 5.5%Doctorate 0 2 2 0 0 0 0 0 0 2 1.6%
Male Female Total Male Female Total Male Female Total # %0 0 17 17 5 12 17 7 12 19 53 41.7%
1-3 0 6 6 3 4 7 2 9 11 24 18.9%4-5 0 7 7 0 2 2 1 2 3 12 9.4%6-8 1 6 7 1 5 6 0 5 5 18 14.2%9-11 1 1 2 0 0 0 0 3 3 5 3.9%
12-15 0 4 4 0 1 1 1 0 1 6 4.7%16-20 0 3 3 1 0 1 0 1 1 5 3.9%
21 & Above 1 1 2 0 1 1 0 1 1 4 3.1%*28 years is the most experience for a newly employed teacher
Male Female Total Male Female Total Male Female Total # %Collegiate Professional 1 18 19 4 7 11 0 11 11 41 32.3%Postgraduate Professional 0 20 20 3 11 14 2 12 14 48 37.8%Provisional 1 4 5 3 7 10 6 9 15 30 23.6%Pupil Personnel 1 1 2 0 0 0 1 1 2 4 3.1%Special Ed. Conditional 0 1 1 0 0 0 0 0 0 1 0.8%Occupational Therapy 0 1 1 0 0 0 0 0 0 1 0.8%*Does Not Hold A License 0 0 0 0 0 0 2 0 2 2 1.6%*AFJROTC Officers
38
MIDDLE HIGHBY DEGREE
MIDDLE HIGH TOTAL
DEGREE TOTALELEMENTARY
TOTAL
ALBEMARLE COUNTY PUBLIC SCHOOLSNEW EMPLOYED TEACHING STAFF
2002-2003 SCHOOL YEAR (As of September 30, 2002)
BY GRADE LEVEL TEACHINGGRADE LEVEL
LICENSURE
BY YEARS OF PREVIOUS EXPERIENCE(including military service)
LICENSURE
YEARS OFEXPERIENCE
ELEMENTARY MIDDLE HIGH TOTAL
ELEMENTARY

NEWLY EMPLOYED TEACHING STAFF continued… Table 7
Male Female Total Male Female Total Male Female TotalAlbemarle 0 4 4 0 1 1 0 2 2 7Buckingham 0 0 0 0 0 0 0 1 1 1Charlottesville 0 3 3 0 0 0 0 1 1 4Chesapeake 0 0 0 1 0 1 0 0 0 1Fairfax 0 0 0 0 2 2 0 0 0 2Fluvanna 0 0 0 0 1 1 0 1 1 2Greene 0 0 0 0 0 0 0 1 1 1Hampton 0 1 1 0 0 0 0 0 0 1Henrico 0 1 1 0 0 0 0 0 0 1Louisa 0 0 0 0 0 0 1 0 1 1Madison 0 1 1 0 0 0 0 0 0 1Norfolk 0 1 1 0 0 0 0 1 1 2Orange 0 0 0 0 1 1 0 1 1 2Roanoke City 0 0 0 0 0 0 0 1 1 1Staunton 0 1 1 0 0 0 0 0 0 1Waynesboro 0 2 2 0 0 0 0 0 0 2Private School 0 0 0 0 1 1 0 3 3 4College/University 0 0 0 0 1 1 1 0 1 2Other Private Organization 0 2 2 0 0 0 0 0 0 2
OTHERArizona 0 0 0 1 0 1 0 0 0 1Australia 1 2 3 0 0 0 0 0 0 3California 0 0 0 1 2 3 0 0 0 3Colorado 0 0 0 0 0 0 0 1 1 1England 0 1 1 0 0 0 0 0 0 1Florida 0 2 2 0 1 1 0 2 2 5Georgia 0 0 0 0 1 1 0 0 0 1Illinois 0 1 1 0 0 0 0 0 0 1Maryland 0 0 0 0 0 0 0 1 1 1Massachusetts 0 0 0 0 0 0 1 0 1 1Mississippi 0 1 1 0 0 0 0 0 0 1New Hampshire 0 0 0 0 1 1 0 0 0 1New Jersey 0 0 0 0 0 0 0 1 1 1North Carolina 0 0 0 0 2 2 1 2 3 5Ohio 0 1 1 0 0 0 0 1 1 2Pennsylvania 0 1 1 0 0 0 0 0 0 1South Carolina 1 0 1 0 1 1 1 0 1 3Switzerland 0 1 1 0 0 0 0 0 0 1Texas 0 1 1 0 0 0 0 0 0 1Washington 1 0 1 0 0 0 0 0 0 1
39
TOTALCITY/COUNTY
BY GEOGRAPHICAL AREA LAST TAUGHTELEMENTARY MIDDLE HIGH

NEWLY EMPLOYED TEACHING STAFF continued… Table 7
Male Female Total Male Female Total Male Female Total # %
Art 0 3 3 0 0 0 0 1 1 4 3.1
Business 0 0 0 0 0 0 0 2 2 2 1.6
Chapter I 0 1 1 0 0 0 0 0 0 1 0.8
Elementary/Middle 1 19 20 0 0 0 0 0 0 20 15.7
English/Second Lang. 0 0 0 0 1 1 0 2 2 3 2.4
Gifted & Talented 0 0 0 0 2 2 0 0 0 2 1.6
Guidance 0 3 3 0 0 0 1 1 2 5 3.9
Industrial Arts 0 0 0 0 0 0 0 2 2 2 1.6
Language Arts/English 0 2 2 2 8 10 1 6 7 19 15.0
Language/Foreign 0 0 0 0 0 0 3 2 5 5 3.9
Librarian 0 2 2 1 0 1 0 0 0 3 2.4
Mathematics 0 0 0 2 2 4 1 5 6 10 7.9
Music 0 2 2 0 3 3 0 0 0 5 3.9
Other 0 0 0 0 0 0 0 1 1 1 0.8
Physical Education 1 0 1 1 0 1 0 2 2 4 3.1
Reading 0 2 2 0 0 0 0 0 0 2 1.6
School Psychologist 1 0 1 0 1 1 0 0 0 2 1.6
Science 0 0 0 0 0 0 1 1 2 2 1.6
Social Studies 0 0 0 2 0 2 0 6 6 8 6.3
Special Educ. Dept. 0 11 11 2 8 10 1 2 3 24 18.9
Vocational Education 0 0 0 0 0 0 3 0 3 3 2.4
40
TOTALBY AREA OF ASSIGNMENT
ASSIGNMENT ELEMENTARY HIGHMIDDLE
NEWLY EMPLOYED TEACHING STAFF continued… Table 7
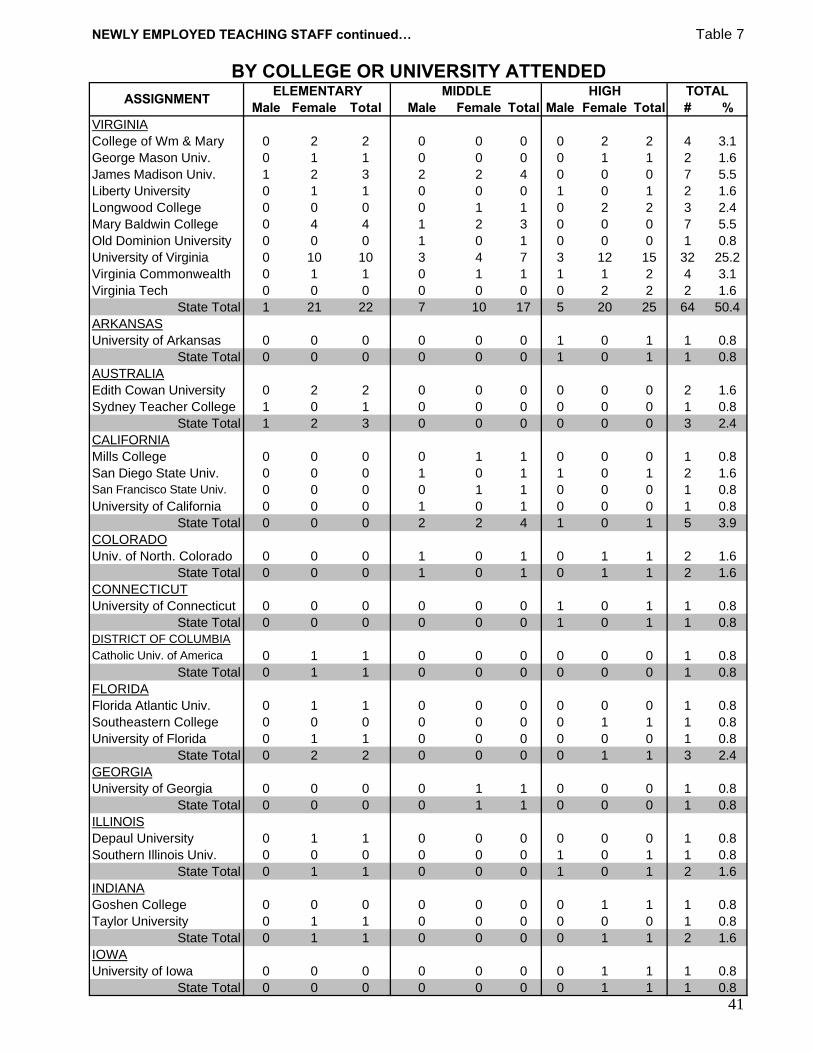
Male Female Total Male Female Total Male Female Total # %VIRGINIACollege of Wm & Mary 0 2 2 0 0 0 0 2 2 4 3.1George Mason Univ. 0 1 1 0 0 0 0 1 1 2 1.6James Madison Univ. 1 2 3 2 2 4 0 0 0 7 5.5Liberty University 0 1 1 0 0 0 1 0 1 2 1.6Longwood College 0 0 0 0 1 1 0 2 2 3 2.4Mary Baldwin College 0 4 4 1 2 3 0 0 0 7 5.5Old Dominion University 0 0 0 1 0 1 0 0 0 1 0.8University of Virginia 0 10 10 3 4 7 3 12 15 32 25.2Virginia Commonwealth 0 1 1 0 1 1 1 1 2 4 3.1Virginia Tech 0 0 0 0 0 0 0 2 2 2 1.6
State Total 1 21 22 7 10 17 5 20 25 64 50.4ARKANSASUniversity of Arkansas 0 0 0 0 0 0 1 0 1 1 0.8
State Total 0 0 0 0 0 0 1 0 1 1 0.8AUSTRALIAEdith Cowan University 0 2 2 0 0 0 0 0 0 2 1.6Sydney Teacher College 1 0 1 0 0 0 0 0 0 1 0.8
State Total 1 2 3 0 0 0 0 0 0 3 2.4CALIFORNIAMills College 0 0 0 0 1 1 0 0 0 1 0.8San Diego State Univ. 0 0 0 1 0 1 1 0 1 2 1.6San Francisco State Univ. 0 0 0 0 1 1 0 0 0 1 0.8University of California 0 0 0 1 0 1 0 0 0 1 0.8
State Total 0 0 0 2 2 4 1 0 1 5 3.9COLORADOUniv. of North. Colorado 0 0 0 1 0 1 0 1 1 2 1.6
State Total 0 0 0 1 0 1 0 1 1 2 1.6CONNECTICUTUniversity of Connecticut 0 0 0 0 0 0 1 0 1 1 0.8
State Total 0 0 0 0 0 0 1 0 1 1 0.8DISTRICT OF COLUMBIACatholic Univ. of America 0 1 1 0 0 0 0 0 0 1 0.8
State Total 0 1 1 0 0 0 0 0 0 1 0.8FLORIDAFlorida Atlantic Univ. 0 1 1 0 0 0 0 0 0 1 0.8Southeastern College 0 0 0 0 0 0 0 1 1 1 0.8University of Florida 0 1 1 0 0 0 0 0 0 1 0.8
State Total 0 2 2 0 0 0 0 1 1 3 2.4GEORGIAUniversity of Georgia 0 0 0 0 1 1 0 0 0 1 0.8
State Total 0 0 0 0 1 1 0 0 0 1 0.8ILLINOISDepaul University 0 1 1 0 0 0 0 0 0 1 0.8Southern Illinois Univ. 0 0 0 0 0 0 1 0 1 1 0.8
State Total 0 1 1 0 0 0 1 0 1 2 1.6INDIANAGoshen College 0 0 0 0 0 0 0 1 1 1 0.8Taylor University 0 1 1 0 0 0 0 0 0 1 0.8
State Total 0 1 1 0 0 0 0 1 1 2 1.6IOWAUniversity of Iowa 0 0 0 0 0 0 0 1 1 1 0.8
State Total 0 0 0 0 0 0 0 1 1 1 0.841
BY COLLEGE OR UNIVERSITY ATTENDEDASSIGNMENT ELEMENTARY HIGHMIDDLE TOTAL
NEWLY EMPLOYED TEACHING STAFF continued… Table 7
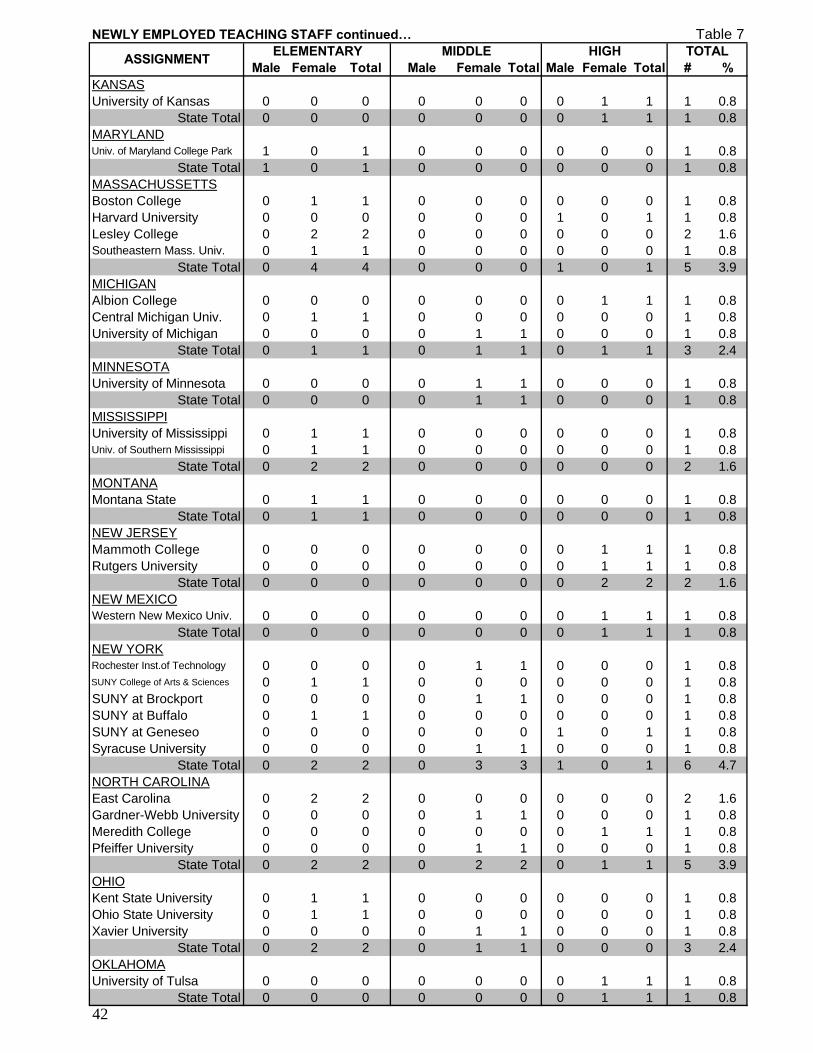
Male Female Total Male Female Total Male Female Total # %KANSASUniversity of Kansas 0 0 0 0 0 0 0 1 1 1 0.8
State Total 0 0 0 0 0 0 0 1 1 1 0.8MARYLANDUniv. of Maryland College Park 1 0 1 0 0 0 0 0 0 1 0.8
State Total 1 0 1 0 0 0 0 0 0 1 0.8MASSACHUSSETTSBoston College 0 1 1 0 0 0 0 0 0 1 0.8Harvard University 0 0 0 0 0 0 1 0 1 1 0.8Lesley College 0 2 2 0 0 0 0 0 0 2 1.6Southeastern Mass. Univ. 0 1 1 0 0 0 0 0 0 1 0.8
State Total 0 4 4 0 0 0 1 0 1 5 3.9MICHIGANAlbion College 0 0 0 0 0 0 0 1 1 1 0.8Central Michigan Univ. 0 1 1 0 0 0 0 0 0 1 0.8University of Michigan 0 0 0 0 1 1 0 0 0 1 0.8
State Total 0 1 1 0 1 1 0 1 1 3 2.4MINNESOTAUniversity of Minnesota 0 0 0 0 1 1 0 0 0 1 0.8
State Total 0 0 0 0 1 1 0 0 0 1 0.8MISSISSIPPIUniversity of Mississippi 0 1 1 0 0 0 0 0 0 1 0.8Univ. of Southern Mississippi 0 1 1 0 0 0 0 0 0 1 0.8
State Total 0 2 2 0 0 0 0 0 0 2 1.6MONTANAMontana State 0 1 1 0 0 0 0 0 0 1 0.8
State Total 0 1 1 0 0 0 0 0 0 1 0.8NEW JERSEYMammoth College 0 0 0 0 0 0 0 1 1 1 0.8Rutgers University 0 0 0 0 0 0 0 1 1 1 0.8
State Total 0 0 0 0 0 0 0 2 2 2 1.6NEW MEXICOWestern New Mexico Univ. 0 0 0 0 0 0 0 1 1 1 0.8
State Total 0 0 0 0 0 0 0 1 1 1 0.8NEW YORKRochester Inst.of Technology 0 0 0 0 1 1 0 0 0 1 0.8SUNY College of Arts & Sciences 0 1 1 0 0 0 0 0 0 1 0.8SUNY at Brockport 0 0 0 0 1 1 0 0 0 1 0.8SUNY at Buffalo 0 1 1 0 0 0 0 0 0 1 0.8SUNY at Geneseo 0 0 0 0 0 0 1 0 1 1 0.8Syracuse University 0 0 0 0 1 1 0 0 0 1 0.8
State Total 0 2 2 0 3 3 1 0 1 6 4.7NORTH CAROLINAEast Carolina 0 2 2 0 0 0 0 0 0 2 1.6Gardner-Webb University 0 0 0 0 1 1 0 0 0 1 0.8Meredith College 0 0 0 0 0 0 0 1 1 1 0.8Pfeiffer University 0 0 0 0 1 1 0 0 0 1 0.8
State Total 0 2 2 0 2 2 0 1 1 5 3.9OHIOKent State University 0 1 1 0 0 0 0 0 0 1 0.8Ohio State University 0 1 1 0 0 0 0 0 0 1 0.8Xavier University 0 0 0 0 1 1 0 0 0 1 0.8
State Total 0 2 2 0 1 1 0 0 0 3 2.4OKLAHOMAUniversity of Tulsa 0 0 0 0 0 0 0 1 1 1 0.8
State Total 0 0 0 0 0 0 0 1 1 1 0.842
ASSIGNMENT ELEMENTARY MIDDLE HIGH TOTAL

NEWLY EMPLOYED TEACHING STAFF continued… Table 7
Male Female Total Male Female Total Male Female Total # %PENNSYLVANIAIndiana Univ. of Penn. 0 0 0 0 1 1 0 0 0 1 0.8Millersville University 0 1 1 0 0 0 0 0 0 1 0.8Slippery Rock University 0 0 0 0 1 1 0 0 0 1 0.8Temple University 0 0 0 0 0 0 0 1 1 1 0.8University of the Arts 0 1 1 0 0 0 0 0 0 1 0.8
State Total 0 2 2 0 2 2 0 1 1 5 3.9SOUTH CAROLINACollege of Charleston 0 0 0 0 1 1 0 0 0 1 0.8
State Total 0 0 0 0 1 1 0 0 0 1 0.8TEXASUniversity of North Texas 0 1 1 0 0 0 0 0 0 1 0.8University of Texas 0 0 0 0 0 0 0 1 1 1 0.8
State Total 0 1 1 0 0 0 0 1 1 2 1.6WEST VIRGINIAFairmont State College 0 0 0 0 1 1 0 0 0 1 0.8
State Total 0 0 0 0 1 1 0 0 0 1 0.8
43
TOTALASSIGNMENT ELEMENTARY MIDDLE HIGH
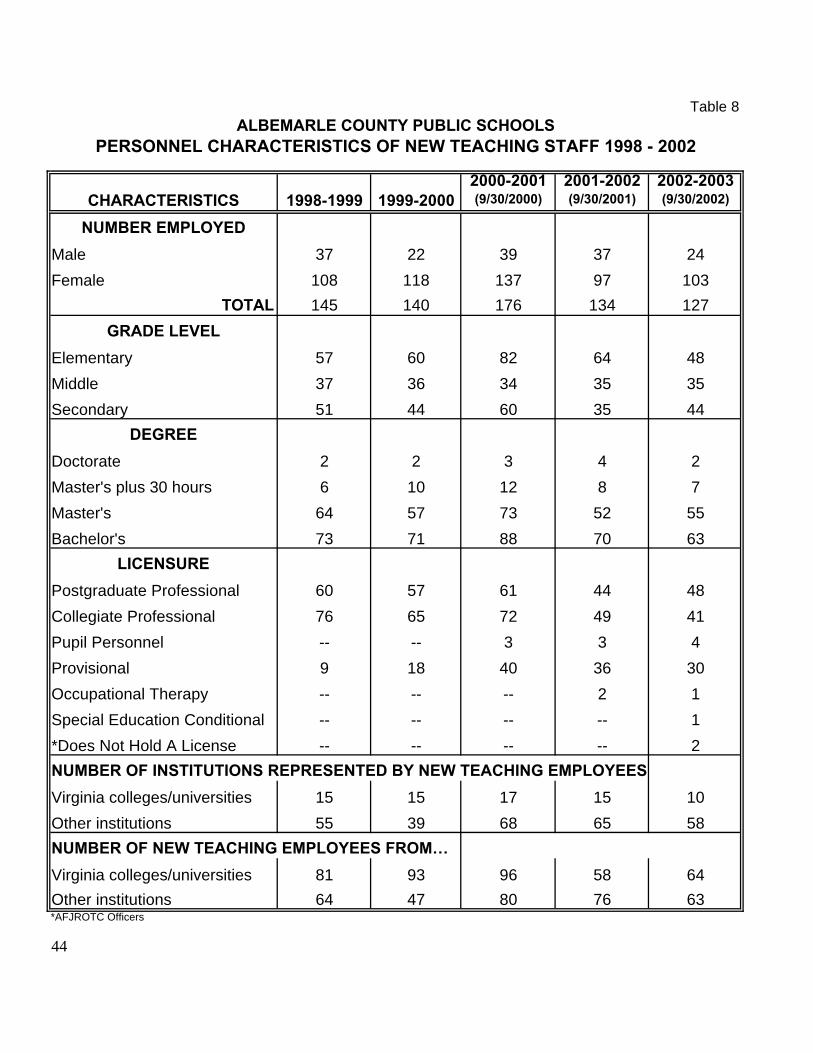
Table 8
CHARACTERISTICS 1998-1999 1999-20002000-2001(9/30/2000)
2001-2002(9/30/2001)
2002-2003(9/30/2002)
NUMBER EMPLOYED
Male 37 22 39 37 24Female 108 118 137 97 103
TOTAL 145 140 176 134 127GRADE LEVEL
Elementary 57 60 82 64 48Middle 37 36 34 35 35Secondary 51 44 60 35 44
DEGREE
Doctorate 2 2 3 4 2Master's plus 30 hours 6 10 12 8 7Master's 64 57 73 52 55Bachelor's 73 71 88 70 63
LICENSURE
Postgraduate Professional 60 57 61 44 48Collegiate Professional 76 65 72 49 41Pupil Personnel -- -- 3 3 4Provisional 9 18 40 36 30Occupational Therapy -- -- -- 2 1Special Education Conditional -- -- -- -- 1*Does Not Hold A License -- -- -- -- 2NUMBER OF INSTITUTIONS REPRESENTED BY NEW TEACHING EMPLOYEES
Virginia colleges/universities 15 15 17 15 10Other institutions 55 39 68 65 58NUMBER OF NEW TEACHING EMPLOYEES FROM…
Virginia colleges/universities 81 93 96 58 64Other institutions 64 47 80 76 63*AFJROTC Officers
44
PERSONNEL CHARACTERISTICS OF NEW TEACHING STAFF 1998 - 2002ALBEMARLE COUNTY PUBLIC SCHOOLS

Appendix 2

ALBEMARLE COUNTY PUBLIC SCHOOLS
360° Feedback - Administrator
Instructions:
You have been identified by the administrator being appraised as one who can provide valuable input to the individual on his/her performance. Your individual responses will remain anonymous and only composite information will be provided to the administrator which will assist in his/her objective setting for the next appraisal period.
Please use the following scale to assess the performance of the administrator and record your response on the green and white scanner sheet provided to you. A B C D E Not Applicable Does Not Meet Improvement Meets Exceeds or Observable Expectations Desired Expectations Expectations 1. Actively listens to others ------------------------------------------------------A B C D E Provides a supportive environment for expressing and clarifying ideas and suggestions. 2. Utilizes effective oral and written communication skills--------------------A B C D E Expresses ideas in a clear and effective manner. 3. Communicates necessary information appropriately-----------------------A B C D E Communicates necessary information to appropriate personnel in a timely fashion. Seeks input and feedback; gives support and reinforcement. 4. Plans, organizes and follows through effectively----------------------------A B C D E Prioritizes tasks, foresees and identifies problem areas and seeks strategies to address them. 5. Demonstrates organization in the day-to-day functions --------------------A B C D E Facilitates smooth daily operations. Plans in a productive manner. Develops and implements equitable schedules. 6. Employs the principles of effective time management ----------------------A B C D E Performs responsibilities in a timely fashion. Meets deadlines. 7. Provides a safe and orderly climate in the building -------------------------A B C D E Manages the operation of all programs at the job site in a secure and positive environment. 8. Develops programs relevant to the objectives of SIP/QuIP -------------------A B C D E Designs programs that match the goals of SIP/QuIP with the needs of the staff.
45

360° Feedback (continued) 9. Monitors the various programs in accordance with local -----------------A B C D E and state guidelines. Adjusting the programs as needed to adhere to Division and State regulations. 10. Develops respect by example in behavior and conduct --------------------A B C D E Guides, directs, and positively affects the action and results of individuals and groups. 11. Delegates tasks to others-----------------------------------------------------A B C D E Delegates responsibility and authority appropriately. Directs, coaches and supports independent action while following up to ensure results. 12. Recognizes/credits others for their professional efforts -------------------A B C D E Acknowledges contributions of others. Seeks and shares the expertise of others. Encourages a climate of collaboration. 13. Displays fairness/impartiality, integrity and honesty-------------------------A B C D E Treats all staff members with understanding and dignity. Acts in fair and consistent manner. 14. Is approachable---------------------------------------------------------------A B C D E Is visible and accessible to all staff members. Receptive and allows time for discussion. 15. Values others’ input----------------------------------------------------------A B C D E Actively solicits others’ opinions and contributions. Respects differing points of view. 16. Demonstrates knowledge of current issues and trends --------------------A B C D E Effectively uses knowledge of local and state policies, procedures and laws. 17. Employs affirmative action policies consistently---------------------------A B C D E Actively follows the County’s Affirmative Action Policy. 18. Follows due process procedures---------------------------------------------A B C D E Adheres to procedural guidelines for due process. GENERAL COMMENTS: Use the essay section of the scanner (reverse side) to respond to the following questions: 19. Describe areas in which you believe this person does well. 20. Describe areas in which you would like to see this person improve. 46


JANE DOE Total # Surveyed 10 Total # of Responses 6 360°° FEEDBACK SURVEY RESULTS
COMMUNICATION
A Not Applicable or Observable
B Does Not Meet Expectations
C Improvement
Desired
D Meets
Expectations
E Exceeds
Expectations # % # % # % # % # %
1. Actively listens to others 4 67% 2 33% 2. Utilizes effective oral and written communication skills. 4 67% 2 33% 3. Communicates necessary information appropriately 5 83% 1 17%
OVERALL RATING 4.33 72% 1.67 28%
ORGANIZATION
4. Plans, organizes and follows through effectively 1 17% 4 67% 1 17% 5. Demonstrates organization in the day-to-day functions 0 0% 3 50% 3 50% 6. Employs the principles of effective time management 0 0% 3 50% 3 50%
OVERALL RATING .33 6% 3.33 56% 2.33 39%
PROGRAM MANAGEMENT
7. Provides a safe and orderly climate in the building 1 17% 2 33% 3 50% 8. Develops programs relevant to the objectives of SIP/QuIP 0 0% 5 83% 1 17% 9. Monitors the various programs in accordance with local and state guidelines. 0 0% 5 83% 1 17%
OVERALL RATING .33 6% 4.0 67% 1.67 28%
LEADERSHIP
10. Develops respect by example in behavior and conduct 1 17% 2 33% 3 50% 11. Delegates tasks to others 0 0% 5 83% 1 17% 12. Recognizes/credits others for their professional efforts 0 0% 3 50% 3 50%
OVERALL RATING .33 6% 3.33 56% 1.67 28%
HUMAN RELATIONS
13. Displays fairness/impartiality, integrity and honesty 1 17% 3 50% 2 33% 14. Is approachable 0 0% 1 17% 5 83% 15. Values other's input 0 0% 3 50% 3 50%
OVERALL RATING .33 6% 2.33 39% 3.33 56%
POLICIES & PROCEDURES
16. Demonstrates knowledge of current issues and trends 5 83% 1 17% 17. Employs affirmative action policies consistently 4 67% 2 33% 18. Follows due process procedures 4 67% 2 33%
OVERALL RATING 4.33 72% 1.67 28% 49

Appendix 3