Albany Numbers and Percents - nebula.wsimg.com
99
Wyoming Department of Transportation Evaluation of Alcohol Factors in Custodial Arrests in the State of Wyoming Highway Safety Program 2007 2007 Wyoming Association of Sheriffs and Chiefs of Police Supplemental Report
Transcript of Albany Numbers and Percents - nebula.wsimg.com
WyomingDepartment of Transportation
Evaluation ofAlcohol Factors
in CustodialArrests in the
State of Wyoming
Highway Safety Program
20072007
Wyoming Association of Sheriffs and Chiefs of PoliceSupplemental Report
WYOMING DEPARTMENT OF TRANSPORTATION – Highway Safety Program
EVALUATION OF ALCOHOL FACTORS IN CUSTODIAL ARRESTS IN THE STATE OF WYOMING
2007 SUPPLEMENTAL REPORT
(COUNTY STATISTICS)
November 2007
This evaluation project was conducted by the Wyoming Association of Sheriffs and Chiefs of Police with Federal 402 Highway Safety funds received from a grant from the Wyoming Department of Transportation - Project No. HS00107.

Evaluation of Alcohol Factors in Wyoming Custodial Arrests
Wyoming Association of Sheriffs and Chiefs of Police
INTRODUCTION The report contains alcohol-related information collected in all twenty-three counties in the State of Wyoming for a period of six months (April 1 through September 30, 2007) by the Wyoming Association of Sheriffs and Chiefs of Police. Information was collected from a total of 11,591 persons who were arrested and subsequently detained in a county detention facility. It also includes statistics from persons booked into the Fremont County Alcohol Crisis Center. This report provides detailed county specific alcohol-related information and is a Supplemental Report to the Evaluation of Alcohol Factors – 2007 Report.
TABLE OF CONTENTS
1. ALBANY…………………………………………………….……..... 1-4 2. BIG HORN ……………………………………………………..……. 5-8 3. CAMPBELL ………………………………………………….…….. 9-12 4. CARBON ……………………………………………………..…....13-16 5. CONVERSE ………………………………………………….….... 17-20 6. CROOK ……………………………………………………….…... 21-24 7. FREMONT …………………………………………………….….. 25-28 8. FREMONT – Alcohol Crisis Center ………………………..….…. 29-32 9. GOSHEN ………………………………………………………...... 33-36 10. HOT SPRINGS ………………………………………………........ 37-40 11. JOHNSON ………………………………………………………... 41-44 12. LARAMIE …………………………………………………….…... 45-48 13. LINCOLN …………………………………………………….….... 49-52 14. NATRONA ………………………………………………………... 53-56 15. NIOBRARA ………………………………………………….….…57-60 16. PARK ……………………………………………………………... 61-64 17. PLATTE …………………………………………………………. 65-68 18. SHERIDAN …………………………………………………….…. 69-72 19. SUBLETTE …………………………………………………….…. 73-76 20. SWEETWATER ……………………………………………….….. 77-80 21. TETON ……………………………………………………………. 81-84 22. UINTA …………………………………………………………….. 85-88 23. WASHAKIE ………………………………………………………. 89-92 24. WESTON ………………………………………………………….. 93-96

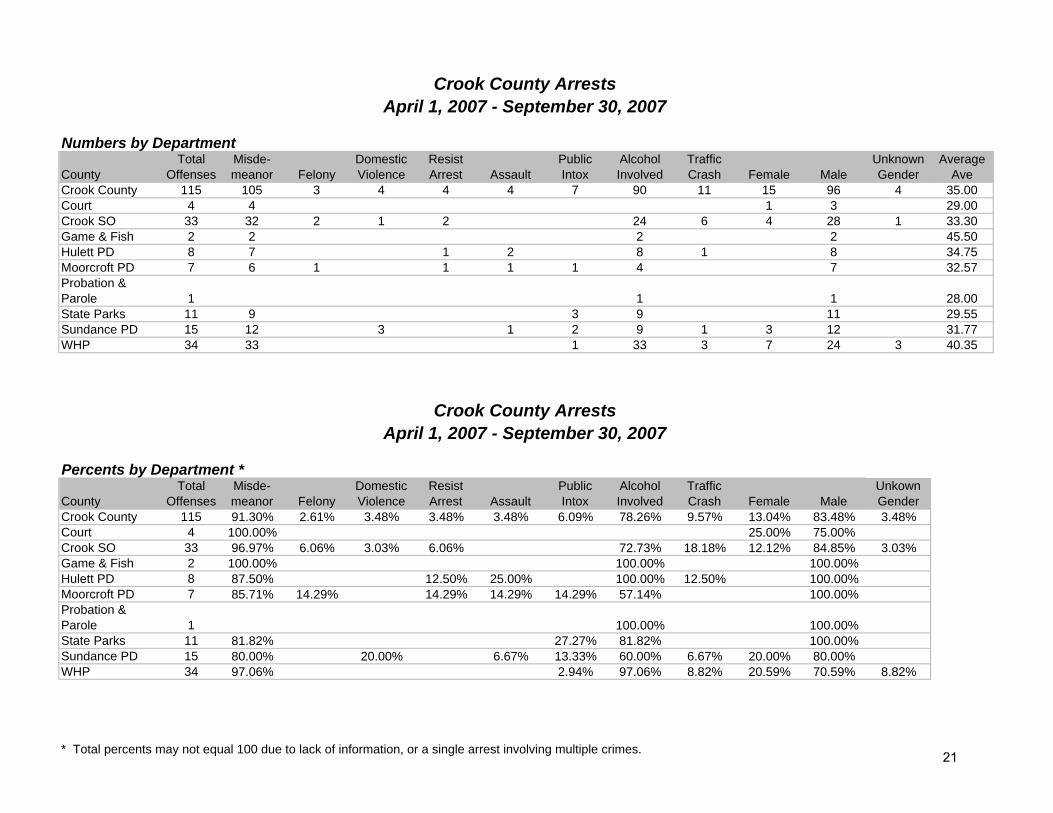
Numbers by Department
CountyTotal
OffensesMisde-meanor Felony
Domestic Violence
Resist Arrest Assault
Public Intox
Alcohol Involved
Traffic Crash Female Male
Unknown Gender
Average Ave
Albany County 392 348 22 6 2 18 264 15 66 322 1 28.20Albany SO 42 33 5 1 17 1 2 40 35.90DCI 3 2 1 2 24.33Forest Service 1 1 1 1 35.00Game & Fish 1 1 1 19.00Laramie PD 259 236 9 5 1 14 202 12 49 210 27.05Other 3 1 1 3 1UW PD 13 11 2 4 10 4 9 20.08WHP 70 65 4 31 1 10 59 1 29.24
Percents by Department *
CountyTotal
OffensesMisde-meanor Felony
Domestic Violence
Resist Arrest Assault
Public Intox
Alcohol Involved
Traffic Crash Female Male
Unkown Gender
Albany County 392 88.78% 5.61% 1.53% 0.51% 4.59% 67.35% 3.83% 16.84% 82.14% 0.26%Albany SO 42 78.57% 11.90% 2.38% 40.48% 2.38% 4.76% 95.24%DCI 3 66.67% 33.33% 66.67%Forest Service 1 100.00% 100.00% 100.00%Game & Fish 1 100.00% 100.00%Laramie PD 259 91.12% 3.47% 1.93% 0.39% 5.41% 77.99% 4.63% 18.92% 81.08%Other 3 33.33% 33.33% 100.00% 33.33%UW PD 13 84.62% 15.38% 30.77% 76.92% 30.77% 69.23%WHP 70 92.86% 5.71% 44.29% 1.43% 14.29% 84.29% 1.43%
* Total percents may not equal 100 due to lack of information, or a single arrest involving multiple crimes.
Albany County ArrestsApril 1, 2007 - September 30, 2007
Albany County ArrestsApril 1, 2007 - September 30, 2007
1

MIP Arrests Meth, Drugs & Public IntoxicationCounty DUI MIP % MIP Average County Total Meth Drugs Public Pub. Intox. Department Offenses Arrests to DUI MIP BAC Department Offenses Involved Involved Intox. Ave. BACAlbany County 186 27 14.52% 0.1469 Albany County 392 2 27 18 0.1977Albany SO 11 1 9.09% 0.0360 Albany SO 42 1DCI DCI 3 1Forest Service 1 Forest Service 1Game & Fish Game & Fish 1Laramie PD 140 22 15.71% 0.1577 Laramie PD 259 8 14 0.2261Other 2 Other 3UW PD 5 2 40.00% 0.1540 UW PD 13 4 0.1220WHP 27 2 7.41% 0.0280 WHP 70 2 17
DUI Arrests Traffic CrashesCounty Total DUI % DUI Ave. County Traffic Alcohol % Alcohol Average Department Offenses Offenses Of Total BAC Department Crashes Involved Involved BACAlbany County 392 186 47.45% 0.1573 Albany County 15 13 86.67% 0.1840Albany SO 42 11 26.19% 0.1708 Albany SO 1 1 100.00%DCI 3 DCIForest Service 1 1 100.00% 0.1100 Forest ServiceGame & Fish 1 Game & FishLaramie PD 259 140 54.05% 0.1598 Laramie PD 12 11 91.67% 0.1840Other 3 2 66.67% 0.1000 Other 1 1 100.00%UW PD 13 5 38.46% UW PDWHP 70 27 38.57% 0.1470 WHP 1 0.00%
Underage DUI ArrestsCounty DUI Underage % DUI Ave. Department Offenses Offenses Of Total BACAlbany County 186 27 14.52% 0.1044Albany SO 11 2 18.18% 0.1380DCIForest Service 1Game & FishLaramie PD 140 19 13.57% 0.1052Other 2UW PD 5 5 100.00%WHP 27 1 3.70% 0.0280
2

Total Offenses-Alcohol Involvement Domestic Violence-Alcohol Involvement
County TotalNumber Involving Percent of Total County
Domestic Violence
Number Involving
Percent of Domestic Violence Offenses
Department Offenses Alcohol Involving Alcohol Department Offenses Alcohol Involving AlcoholAlbany County 392 264 67.35% Albany County 6 3 50.00%Albany SO 42 17 40.48% Albany SODCI 3 DCIForest Service 1 1 100.00% Forest ServiceGame & Fish 1 Game & FishLaramie PD 259 202 77.99% Laramie PD 5 2 40.00%Other 3 3 100.00% Other 1 1 100.00%UW PD 13 10 76.92% UW PDWHP 70 31 44.29% WHP
Felony Offenses-Alcohol Involvement Resisting Arrest-Alcohol Involvement
County FelonyNumber Involving
Percent of Felony Offenses Involving County
Resisting Arrest
Number Involving
Percent of Resisting Arrest Offenses
Department Offenses Alcohol Alcohol Department Offenses Alcohol Involving AlcoholAlbany County 22 4 18.18% Albany County 0 0 0.00%Albany SO 5 Albany SODCI 2 DCIForest Service Forest ServiceGame & Fish Game & FishLaramie PD 9 4 44.44% Laramie PDOther OtherUW PD 2 UW PDWHP 4 WHP
Misdemeanor Offenses-Alcohol Involvement Assault-Alcohol Involvement
CountyMisde-meanor
Number Involving
Percent of Misdemeanor
Offenses County AssaultNumber Involving
Percent of Assault Offenses
Department Offenses Alcohol Alcohol Department Offenses Alcohol Involving AlcoholAlbany County 348 244 70.11% Albany County 2 0 0.00%Albany SO 33 14 42.42% Albany SO 1DCI DCIForest Service 1 1 100.00% Forest ServiceGame & Fish 1 Game & FishLaramie PD 236 188 79.66% Laramie PD 1Other 1 1 100.00% OtherUW PD 11 10 90.91% UW PDWHP 65 30 46.15% WHP
3
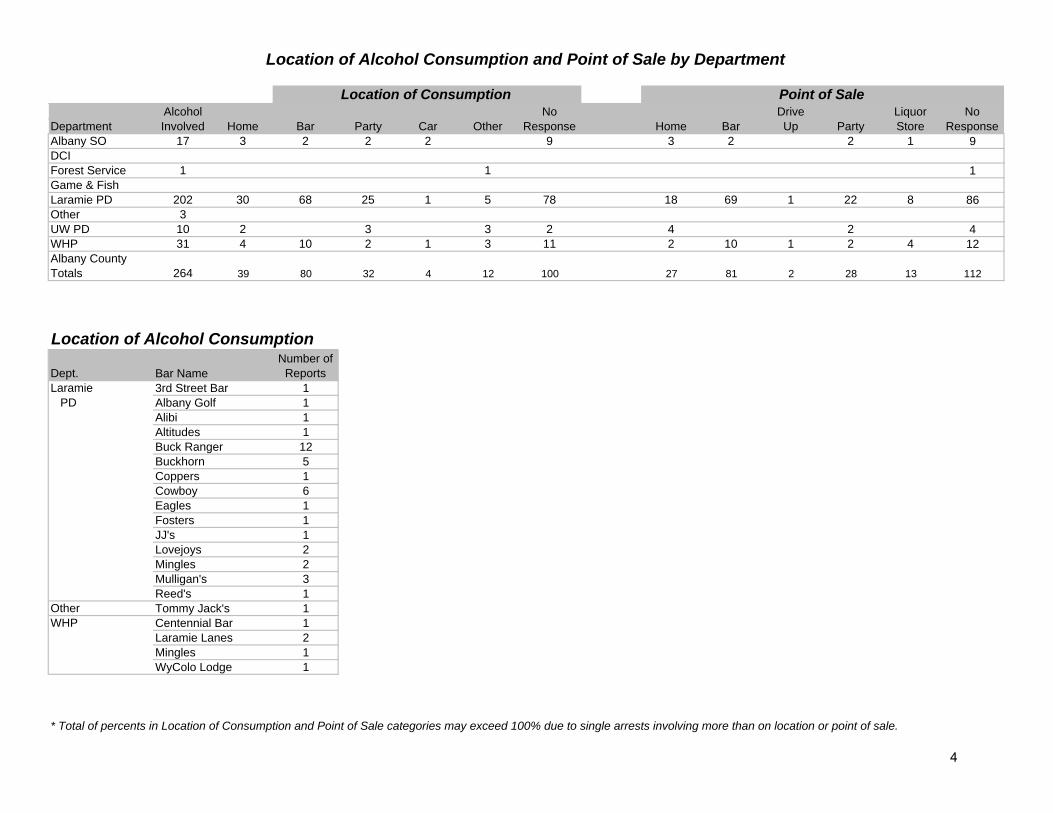
Alcohol No Drive Liquor No Department Involved Home Bar Party Car Other Response Home Bar Up Party Store ResponseAlbany SO 17 3 2 2 2 9 3 2 2 1 9DCIForest Service 1 1 1Game & FishLaramie PD 202 30 68 25 1 5 78 18 69 1 22 8 86Other 3UW PD 10 2 3 3 2 4 2 4WHP 31 4 10 2 1 3 11 2 10 1 2 4 12Albany County Totals 264 39 80 32 4 12 100 27 81 2 28 13 112
Location of Alcohol Consumption
Dept.Number of
ReportsLaramie 3rd Street Bar 1 PD Albany Golf 1
Alibi 1Altitudes 1Buck Ranger 12Buckhorn 5Coppers 1Cowboy 6Eagles 1Fosters 1JJ's 1Lovejoys 2Mingles 2Mulligan's 3Reed's 1
Other Tommy Jack's 1WHP Centennial Bar 1
Laramie Lanes 2Mingles 1WyColo Lodge 1
* Total of percents in Location of Consumption and Point of Sale categories may exceed 100% due to single arrests involving more than on location or point of sale.
Location of Alcohol Consumption and Point of Sale by Department
Location of Consumption Point of Sale
Bar Name
4

Numbers by Department
CountyTotal
OffensesMisde-meanor Felony
Domestic Violence
Resist Arrest Assault
Public Intox
Alcohol Involved
Traffic Crash Female Male
Unknown Gender
Average Ave
Big Horn County 125 113 14 16 2 14 14 93 3 29 96 0 34.21Basin PD 11 10 1 1 1 8 5 6 26.45Big Horn SO 51 43 10 8 1 8 7 35 3 12 39 33.75Byron PD 1 1 1 1 48.00Deaver PD 1 1 1 1 36.00Greybull PD 35 32 3 5 1 4 5 27 7 28 40.44Lovell PD 9 9 2 1 1 7 1 8 31.67WHP 17 17 15 4 13 29.35
Percents by Department *
CountyTotal
OffensesMisde-meanor Felony
Domestic Violence
Resist Arrest Assault
Public Intox
Alcohol Involved
Traffic Crash Female Male
Unkown Gender
Big Horn County 125 90.40% 11.20% 12.80% 1.60% 11.20% 11.20% 74.40% 2.40% 23.20% 76.80% 0.00%Basin PD 11 90.91% 9.09% 9.09% 9.09% 72.73% 45.45% 54.55%Big Horn SO 51 84.31% 19.61% 15.69% 1.96% 15.69% 13.73% 68.63% 5.88% 23.53% 76.47%Byron PD 1 100.00% 100.00% 100.00%Deaver PD 1 100.00% 100.00% 100.00%Greybull PD 35 91.43% 8.57% 14.29% 2.86% 11.43% 14.29% 77.14% 20.00% 80.00%Lovell PD 9 100.00% 22.22% 11.11% 11.11% 77.78% 11.11% 88.89%WHP 17 100.00% 88.24% 23.53% 76.47%
* Total percents may not equal 100 due to lack of information, or a single arrest involving multiple crimes.
Big Horn County ArrestsApril 1, 2007 - September 30, 2007
Big Horn County ArrestsApril 1, 2007 - September 30, 2007
5

MIP Arrests Meth, Drugs & Public IntoxicationCounty DUI MIP % MIP Average County Total Meth Drugs Public Pub. Intox. Department Offenses Arrests to DUI MIP BAC Department Offenses Involved Involved Intox. Ave. BACBig Horn County 49 15 30.61% 0.0862 Big Horn County 125 3 15 14 0.2328Basin PD 2 4 200.00% 0.0835 Basin PD 11 2 1 0.1860Big Horn SO 15 8 53.33% 0.0730 Big Horn SO 51 3 8 7 0.2160Byron PD 1 Byron PD 1Deaver PD Deaver PD 1Greybull PD 13 1 7.69% Greybull PD 35 2 5 0.1560Lovell PD 5 1 20.00% 0.1750 Lovell PD 9 1 0.3730WHP 13 1 7.69% 0.1080 WHP 17 3
DUI Arrests Traffic CrashesCounty Total DUI % DUI Ave. County Traffic Alcohol % Alcohol Average Department Offenses Offenses Of Total BAC Department Crashes Involved Involved BACBig Horn County 125 49 39.20% 0.1256 Big Horn County 3 0.2300Basin PD 11 2 18.18% Basin PDBig Horn SO 51 15 29.41% 0.1556 Big Horn SO 3 0.2300Byron PD 1 1 100.00% 0.2120 Byron PDDeaver PD 1 Deaver PDGreybull PD 35 13 37.14% 0.0746 Greybull PDLovell PD 9 5 55.56% 0.1340 Lovell PDWHP 17 13 76.47% 0.1089 WHP
Underage DUI ArrestsCounty DUI Underage % DUI Ave. Department Offenses Offenses Of Total BACBig Horn County 49 7 14.29% 0.0923Basin PD 2 1 50.00%Big Horn SO 15 2 13.33% 0.0470Byron PD 1Deaver PDGreybull PD 13Lovell PD 5 1 20.00% 0.1750WHP 13 3 23.08% 0.1000
6

Total Offenses-Alcohol Involvement Domestic Violence-Alcohol Involvement
County TotalNumber Involving Percent of Total County
Domestic Violence
Number Involving
Percent of Domestic Violence Offenses
Department Offenses Alcohol Involving Alcohol Department Offenses Alcohol Involving AlcoholBig Horn County 125 93 74.40% Big Horn County 16 8 50.00%Basin PD 11 8 72.73% Basin PDBig Horn SO 51 35 68.63% Big Horn SO 8 3 37.50%Byron PD 1 1 100.00% Byron PDDeaver PD 1 Deaver PD 1Greybull PD 35 27 77.14% Greybull PD 5 5 100.00%Lovell PD 9 7 77.78% Lovell PD 2WHP 17 15 88.24% WHP
Felony Offenses-Alcohol Involvement Resisting Arrest-Alcohol Involvement
County FelonyNumber Involving
Percent of Felony Offenses Involving County
Resisting Arrest
Number Involving
Percent of Resisting Arrest Offenses
Department Offenses Alcohol Alcohol Department Offenses Alcohol Involving AlcoholBig Horn County 14 5 35.71% Big Horn County 2 2 100.00%Basin PD 1 Basin PDBig Horn SO 10 4 40.00% Big Horn SO 1 1 100.00%Byron PD Byron PDDeaver PD Deaver PDGreybull PD 3 1 33.33% Greybull PD 1 1 100.00%Lovell PD Lovell PDWHP WHP
Misdemeanor Offenses-Alcohol Involvement Assault-Alcohol Involvement
CountyMisde-meanor
Number Involving
Percent of Misdemeanor
Offenses County AssaultNumber Involving
Percent of Assault Offenses
Department Offenses Alcohol Alcohol Department Offenses Alcohol Involving AlcoholBig Horn County 113 89 78.76% Big Horn County 14 7 50.00%Basin PD 10 8 80.00% Basin PD 1Big Horn SO 43 32 74.42% Big Horn SO 8 3 37.50%Byron PD 1 1 100.00% Byron PDDeaver PD 1 Deaver PDGreybull PD 32 26 81.25% Greybull PD 4 3 75.00%Lovell PD 9 7 77.78% Lovell PD 1 1 100.00%WHP 17 15 88.24% WHP
7

Alcohol No Drive Liquor No Department Involved Home Bar Party Car Other Response Home Bar Up Party Store ResponseBasin PD 8 2 3 2 1 1 3 4Big Horn SO 35 11 7 8 5 5 6 9 7 1 12Byron PD 1 1 1Deaver PDGreybull PD 27 8 15 1 1 3 5 16 1 1 4Lovell PD 7 1 1 2 1 2 1 2 4WHP 15 1 4 1 1 8 1 4 1 9Big Horn County Totals 93 22 27 14 9 4 19 13 32 11 3 34
Location of Alcohol Consumption
DepartmentNumber of
ReportsBig Horn SO Branding Iron 1
Highway Bar 1Lisa's Restaurant 1
Greybull PD Branding Iron 3Byron Bar 1Highway Bar 1Smokehouse 3
Lovell PD Diamond J Bar 1WHP Paintrock Bar 2
Silver Dollar 1Smokehouse 1
* Total of percents in Location of Consumption and Point of Sale categories may exceed 100% due to single arrests involving more than on location or point of sale.
Location of Alcohol Consumption and Point of Sale by Department
Location of Consumption Point of Sale
Bar Name
8

Numbers by Department
CountyTotal
OffensesMisde-meanor Felony
Domestic Violence
Resist Arrest Assault
Public Intox
Alcohol Involved
Traffic Crash Female Male
Unknown Gender
Average Ave
Campbell County 725 652 53 22 2 8 57 582 52 112 613 0 31.97Campbell SO 204 181 24 4 2 1 2 152 11 28 176 32.89DCI 3 3 1 2 29.00Gillette PD 478 431 26 18 7 55 399 38 76 402 31.59WHP 40 40 31 3 7 33 32.03
Percents by Department *
CountyTotal
OffensesMisde-meanor Felony
Domestic Violence
Resist Arrest Assault
Public Intox
Alcohol Involved
Traffic Crash Female Male
Unkown Gender
Campbell County 725 89.93% 7.31% 3.03% 0.28% 1.10% 7.86% 80.28% 7.17% 15.45% 84.55% 0.00%Campbell SO 204 88.73% 11.76% 1.96% 0.98% 0.49% 0.98% 74.51% 5.39% 13.73% 86.27%DCI 3 100.00% 33.33% 66.67%Gillette PD 478 90.17% 5.44% 3.77% 1.46% 11.51% 83.47% 7.95% 15.90% 84.10%WHP 40 100.00% 77.50% 7.50% 17.50% 82.50%
* Total percents may not equal 100 due to lack of information, or a single arrest involving multiple crimes.
Campbell County ArrestsApril 1, 2007 - September 30, 2007
Campbell County ArrestsApril 1, 2007 - September 30, 2007
9

MIP Arrests Meth, Drugs & Public IntoxicationCounty DUI MIP % MIP Average County Total Meth Drugs Public Pub. Intox.
Department Offenses Arrests to DUI MIP BAC Department Offenses Involved Involved Intox Ave BAC Department Offenses Arrests to DUI MIP BAC Department Offenses Involved Involved Intox. Ave. BACCampbell County 378 23 6.08% 0.1304 Campbell County 725 17 43 57 0.2170Campbell SO 107 6 5.61% 0.1070 Campbell SO 204 6 12 2DCI DCI 3 3 3Gillette PD 245 17 6.94% 0.1371 Gillette PD 478 8 25 55 0.2170WHP 26 WHP 40 3
DUI Arrests Traffic CrashesCounty Total DUI % DUI Ave. County Traffic Alcohol % Alcohol Average Department Offenses Offenses Of Total BAC Department Crashes Involved Involved BACCampbell County 725 378 52.14% 0.1529 Campbell County 52 50 96.15% 0.1513p y p yCampbell SO 204 107 52.45% 0.1506 Campbell SO 11 11 100.00% 0.1090DCI 3 DCIGillette PD 478 245 51.26% 0.1561 Gillette PD 38 37 97.37% 0.1549WHP 40 26 65.00% 0.1249 WHP 3 2 66.67%
Underage DUI ArrestsCounty DUI Underage % DUI Ave. Department Offenses Offenses Of Total BACCampbell County 378 34 8.99% 0.1258Campbell SO 107 9 8.41% 0.0966DCIGillette PD 245 24 9.80% 0.1382WHP 26 1 3.85% 0.0500
10
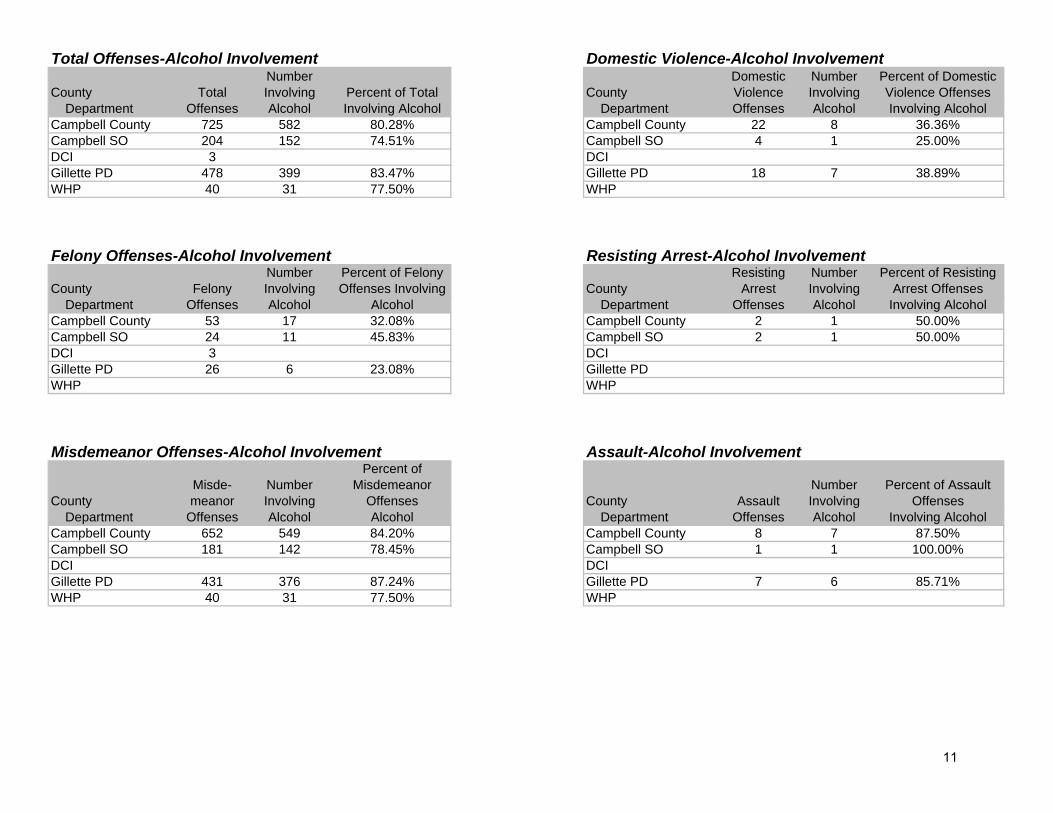
Total Offenses-Alcohol Involvement Domestic Violence-Alcohol Involvement
County TotalNumber Involving Percent of Total County
Domestic Violence
Number Involving
Percent of Domestic Violence Offenses
Department Offenses Alcohol Involving Alcohol Department Offenses Alcohol Involving AlcoholCampbell County 725 582 80.28% Campbell County 22 8 36.36%Campbell SO 204 152 74.51% Campbell SO 4 1 25.00%DCI 3 DCIGillette PD 478 399 83.47% Gillette PD 18 7 38.89%WHP 40 31 77.50% WHP
Felony Offenses-Alcohol Involvement Resisting Arrest-Alcohol Involvement
County FelonyNumber Involving
Percent of Felony Offenses Involving County
Resisting Arrest
Number Involving
Percent of Resisting Arrest Offenses
Department Offenses Alcohol Alcohol Department Offenses Alcohol Involving AlcoholCampbell County 53 17 32.08% Campbell County 2 1 50.00%Campbell SO 24 11 45.83% Campbell SO 2 1 50.00%DCI 3 DCIGillette PD 26 6 23.08% Gillette PDWHP WHP
Misdemeanor Offenses-Alcohol Involvement Assault-Alcohol Involvement
CountyMisde-meanor
Number Involving
Percent of Misdemeanor
Offenses County AssaultNumber Involving
Percent of Assault Offenses
Department Offenses Alcohol Alcohol Department Offenses Alcohol Involving AlcoholCampbell County 652 549 84.20% Campbell County 8 7 87.50%Campbell SO 181 142 78.45% Campbell SO 1 1 100.00%DCI DCIGillette PD 431 376 87.24% Gillette PD 7 6 85.71%WHP 40 31 77.50% WHP
11

Alcohol No Drive Liquor No Department Involved Home Bar Party Car Other Response Home Bar Up Party Store ResponseCampbell SO 152 36 71 8 11 13 15 22 81 3 10 14 23DCIGillette PD 399 75 191 13 16 26 81 39 192 11 12 28 117WHP 31 5 17 2 1 2 4 1 17 2 6 5Campbell County Totals 582 116 279 23 28 41 100 62 290 14 24 48 145
DepartmentNumber of
Reports Dept.Number of
Reports Dept.Number of
ReportsCampbell SO Altitudes 2 Gillette Brian's Place 1 WHP Altitudes 1
Applebee's 1 PD Brothers Coffee 1 East Side 1Brian's Place 6 Center Bar 3 Jake's 1Cowboy Bar 1 Eagles 1 Mingles 1East Side Liquor 2 East Side 6 Other Side 1Fireside 2 Fire Side 15Good Times 1 Good Times 5Hank's 1 Hank's 1Jake's 4 Humphrey's 2Lakeside Liquor 2 Jack's Liquor 1Mingles 4 Jake's 4Other Side 3 Lakeside Liquor 1Pat's Liquor 1 Mingles 13Rusty Nail 1 Montgomery 2Sports Bar 2 National 9 1VFW 1 Other Side 7
Gillette PD Altitudes 21 Pat's Liquor 1Applebee's 3 Smart Choice 1Bell Knob 1 Sports Bar 2Bootleggers 1 T West 1Boss Lodge 1 The Center 1
* Total of percents in Location of Consumption and Point of Sale categories may exceed 100% due to single arrests involving more than on location or point of sale.
Location of Alcohol Consumption and Point of Sale by Department
Location of Consumption Point of Sale
Bar Name Bar Name Bar Name
Location of Alcohol Consumption
12
Numbers by Department
CountyTotal
OffensesMisde-meanor Felony
Domestic Violence
Resist Arrest Assault
Public Intox
Alcohol Involved
Traffic Crash Female Male
Unknown Gender
Average Ave
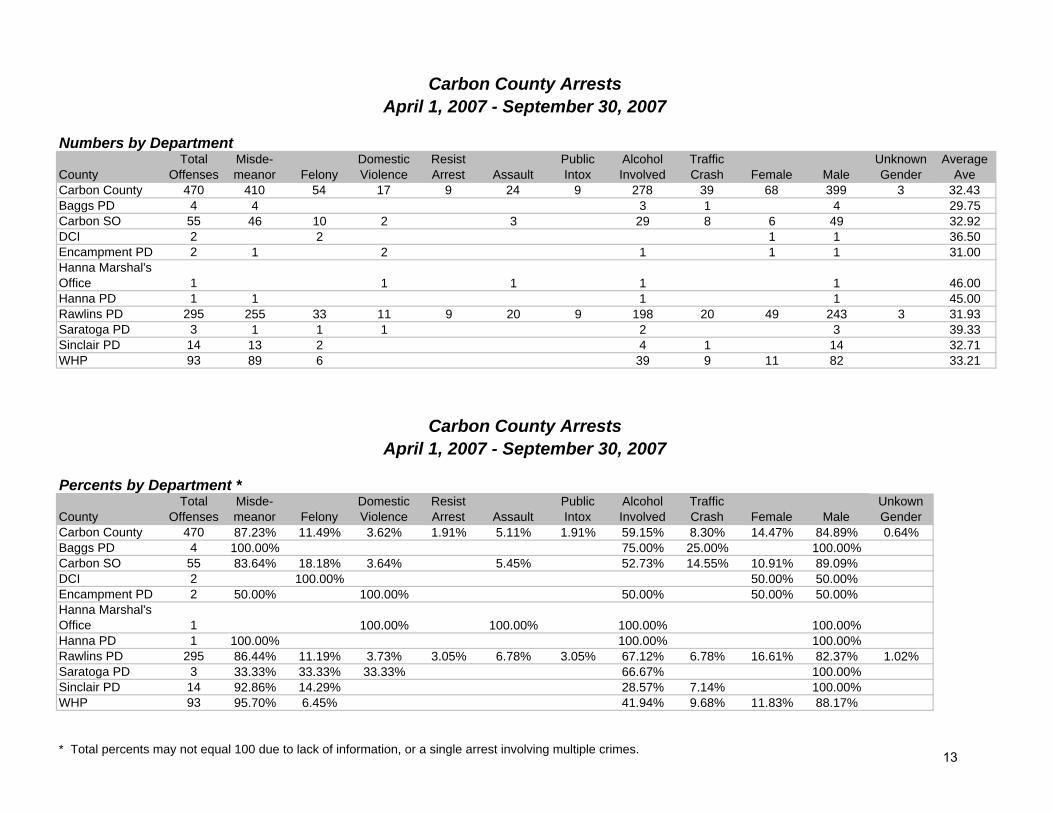
Carbon County 470 410 54 17 9 24 9 278 39 68 399 3 32.43Baggs PD 4 4 3 1 4 29.75Carbon SO 55 46 10 2 3 29 8 6 49 32.92DCI 2 2 1 1 36.50Encampment PD 2 1 2 1 1 1 31.00Hanna Marshal's Office 1 1 1 1 1 46.00Hanna PD 1 1 1 1 45.00Rawlins PD 295 255 33 11 9 20 9 198 20 49 243 3 31.93Saratoga PD 3 1 1 1 2 3 39.33Sinclair PD 14 13 2 4 1 14 32.71WHP 93 89 6 39 9 11 82 33.21
Percents by Department *
CountyTotal
OffensesMisde-meanor Felony
Domestic Violence
Resist Arrest Assault
Public Intox
Alcohol Involved
Traffic Crash Female Male
Unkown Gender
Carbon County 470 87.23% 11.49% 3.62% 1.91% 5.11% 1.91% 59.15% 8.30% 14.47% 84.89% 0.64%Baggs PD 4 100.00% 75.00% 25.00% 100.00%Carbon SO 55 83.64% 18.18% 3.64% 5.45% 52.73% 14.55% 10.91% 89.09%DCI 2 100.00% 50.00% 50.00%Encampment PD 2 50.00% 100.00% 50.00% 50.00% 50.00%Hanna Marshal's Office 1 100.00% 100.00% 100.00% 100.00%Hanna PD 1 100.00% 100.00% 100.00%Rawlins PD 295 86.44% 11.19% 3.73% 3.05% 6.78% 3.05% 67.12% 6.78% 16.61% 82.37% 1.02%Saratoga PD 3 33.33% 33.33% 33.33% 66.67% 100.00%Sinclair PD 14 92.86% 14.29% 28.57% 7.14% 100.00%WHP 93 95.70% 6.45% 41.94% 9.68% 11.83% 88.17%
* Total percents may not equal 100 due to lack of information, or a single arrest involving multiple crimes.
Carbon County ArrestsApril 1, 2007 - September 30, 2007
Carbon County ArrestsApril 1, 2007 - September 30, 2007
13
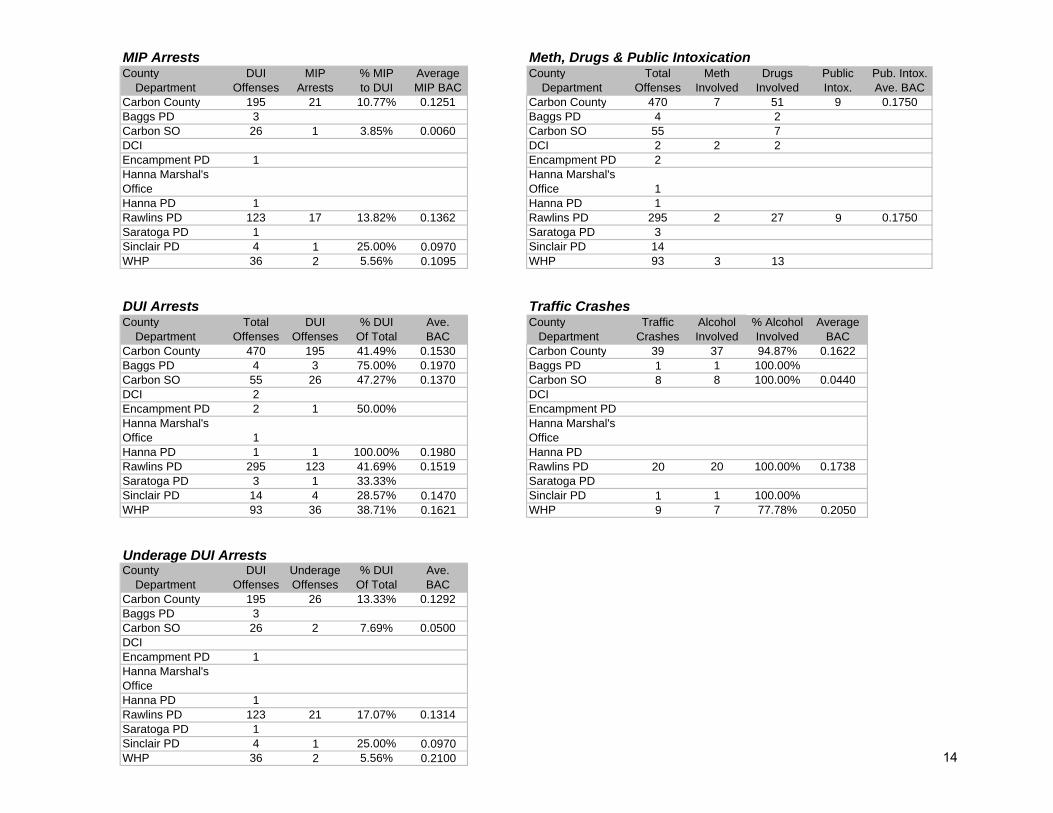
MIP Arrests Meth, Drugs & Public IntoxicationCounty DUI MIP % MIP Average County Total Meth Drugs Public Pub. Intox. Department Offenses Arrests to DUI MIP BAC Department Offenses Involved Involved Intox. Ave. BACCarbon County 195 21 10.77% 0.1251 Carbon County 470 7 51 9 0.1750Baggs PD 3 Baggs PD 4 2Carbon SO 26 1 3.85% 0.0060 Carbon SO 55 7DCI DCI 2 2 2Encampment PD 1 Encampment PD 2Hanna Marshal's Office
Hanna Marshal's Office 1
Hanna PD 1 Hanna PD 1Rawlins PD 123 17 13.82% 0.1362 Rawlins PD 295 2 27 9 0.1750Saratoga PD 1 Saratoga PD 3Sinclair PD 4 1 25.00% 0.0970 Sinclair PD 14WHP 36 2 5.56% 0.1095 WHP 93 3 13
DUI Arrests Traffic CrashesCounty Total DUI % DUI Ave. County Traffic Alcohol % Alcohol Average Department Offenses Offenses Of Total BAC Department Crashes Involved Involved BACCarbon County 470 195 41.49% 0.1530 Carbon County 39 37 94.87% 0.1622Baggs PD 4 3 75.00% 0.1970 Baggs PD 1 1 100.00%Carbon SO 55 26 47.27% 0.1370 Carbon SO 8 8 100.00% 0.0440DCI 2 DCIEncampment PD 2 1 50.00% Encampment PDHanna Marshal's Office 1
Hanna Marshal's Office
Hanna PD 1 1 100.00% 0.1980 Hanna PDRawlins PD 295 123 41.69% 0.1519 Rawlins PD 20 20 100.00% 0.1738Saratoga PD 3 1 33.33% Saratoga PDSinclair PD 14 4 28.57% 0.1470 Sinclair PD 1 1 100.00%WHP 93 36 38.71% 0.1621 WHP 9 7 77.78% 0.2050
Underage DUI ArrestsCounty DUI Underage % DUI Ave. Department Offenses Offenses Of Total BACCarbon County 195 26 13.33% 0.1292Baggs PD 3Carbon SO 26 2 7.69% 0.0500DCIEncampment PD 1Hanna Marshal's OfficeHanna PD 1Rawlins PD 123 21 17.07% 0.1314Saratoga PD 1Sinclair PD 4 1 25.00% 0.0970WHP 36 2 5.56% 0.2100 14

Total Offenses-Alcohol Involvement Domestic Violence-Alcohol Involvement
County TotalNumber Involving Percent of Total County
Domestic Violence
Number Involving
Percent of Domestic Violence Offenses
Department Offenses Alcohol Involving Alcohol Department Offenses Alcohol Involving AlcoholCarbon County 470 278 59.15% Carbon County 17 16 94.12%Baggs PD 4 3 75.00% Baggs PDCarbon SO 55 29 52.73% Carbon SO 2 2 100.00%DCI 2 DCIEncampment PD 2 1 50.00% Encampment PD 2 1 50.00%Hanna Marshal's Office 1 1 100.00%
Hanna Marshal's Office 1 1 100.00%
Hanna PD 1 1 100.00% Hanna PDRawlins PD 295 198 67.12% Rawlins PD 11 11 100.00%Saratoga PD 3 2 66.67% Saratoga PD 1 1 100.00%Sinclair PD 14 4 28.57% Sinclair PDWHP 93 39 41.94% WHP
Felony Offenses-Alcohol Involvement Resisting Arrest-Alcohol Involvement
County FelonyNumber Involving
Percent of Felony Offenses Involving County
Resisting Arrest
Number Involving
Percent of Resisting Arrest Offenses
Department Offenses Alcohol Alcohol Department Offenses Alcohol Involving AlcoholCarbon County 54 22 40.74% Carbon County 9 5 55.56%Baggs PD Baggs PDCarbon SO 10 2 20.00% Carbon SODCI 2 DCIEncampment PD Encampment PDHanna Marshal's Office
Hanna Marshal's Office
Hanna PD Hanna PDRawlins PD 33 17 51.52% Rawlins PD 9 5 55.56%Saratoga PD 1 Saratoga PDSinclair PD 2 1 50.00% Sinclair PDWHP 6 2 33.33% WHP
Misdemeanor Offenses-Alcohol Involvement Assault-Alcohol Involvement
CountyMisde-meanor
Number Involving
Percent of Misdemeanor
Offenses County AssaultNumber Involving
Percent of Assault Offenses
Department Offenses Alcohol Alcohol Department Offenses Alcohol Involving AlcoholCarbon County 410 254 61.95% Carbon County 24 18 75.00%Baggs PD 4 3 75.00% Baggs PDCarbon SO 46 25 54.35% Carbon SO 3 1 33.33%DCI DCIEncampment PD 1 1 100.00% Encampment PDHanna Marshal's Office
Hanna Marshal's Office 1 1 100.00%
Hanna PD 1 1 100.00% Hanna PDRawlins PD 255 181 70.98% Rawlins PD 20 16 80.00%Saratoga PD 1 1 100.00% Saratoga PDSinclair PD 13 4 30.77% Sinclair PDWHP 89 38 42.70% WHP
15

Alcohol No Drive Liquor No Department Involved Home Bar Party Car Other Response Home Bar Up Party Store ResponseBaggs PD 3 2 1 1 1 2Carbon SO 29 11 4 8 5 4 4 6 3 1 6 12DCIEncampment PD 1 1 1Hanna Marshal's Office 1 1 1Hanna PD 1 1 1Rawlins PD 198 48 88 4 16 10 39 25 80 1 9 12 72Saratoga PD 2 2 1 1 1Sinclair PD 4 1 2 1 1 2 1 1WHP 39 4 7 14 4 10 7 1 8 23Carbon County Totals 278 67 105 5 40 19 55 31 98 5 10 27 111
Location of Alcohol Consumption
DepartmentNumber of
ReportsBaggs PD Drifter 1
In Wamsetter 1Carbon SO Drifter 1
Lazy River 1Mangy Moose 1Peppermill 1
Encampment PD Pine Lodge 1Hanna PD Nugget 1Rawlins PD Elks 1
Hole in the Wall 1Michael's Big City 26Peppermill 6Rifleman 8Rochelle 1Sportsman 6The Keg 7Wyoming Bar 2
Sinclair PD Corner Bar 1Drifter 1Hole in the Wall 1Nugget 1
* Total of percents in Location of Consumption and Point of Sale categories may exceed 100% due to single arrests involving more than on location or point of sale.
Location of Alcohol Consumption and Point of Sale by Department
Location of Consumption Point of Sale
Bar Name
16

Numbers by Department
CountyTotal
OffensesMisde-meanor Felony
Domestic Violence
Resist Arrest Assault
Public Intox
Alcohol Involved
Traffic Crash Female Male
Unknown Gender
Average Ave
Converse County 290 232 35 17 2 10 7 181 12 61 227 2 31.91Converse SO 74 54 15 1 2 40 5 17 56 1 31.90Douglas PD 128 105 12 13 2 6 1 83 3 23 105 31.64Glenrock PD 52 40 6 3 2 6 34 14 38 29.67Other 1 1 1 1WHP 35 32 2 23 4 7 28 35.79
Percents by Department *
CountyTotal
OffensesMisde-meanor Felony
Domestic Violence
Resist Arrest Assault
Public Intox
Alcohol Involved
Traffic Crash Female Male
Unkown Gender
Converse County 290 80.00% 12.07% 5.86% 0.69% 3.45% 2.41% 62.41% 4.14% 21.03% 78.28% 0.34%Converse SO 74 72.97% 20.27% 1.35% 2.70% 54.05% 6.76% 22.97% 75.68% 1.35%Douglas PD 128 82.03% 9.38% 10.16% 1.56% 4.69% 0.78% 64.84% 2.34% 17.97% 82.03%Glenrock PD 52 76.92% 11.54% 5.77% 3.85% 11.54% 65.38% 26.92% 73.08%Other 1 100.00% 100.00% 100.00%WHP 35 91.43% 5.71% 65.71% 11.43% 20.00% 80.00%
* Total percents may not equal 100 due to lack of information, or a single arrest involving multiple crimes.
Converse County ArrestsApril 1, 2007 - September 30, 2007
Converse County ArrestsApril 1, 2007 - September 30, 2007
17
MIP Arrests Meth, Drugs & Public IntoxicationCounty DUI MIP % MIP Average County Total Meth Drugs Public Pub. Intox.
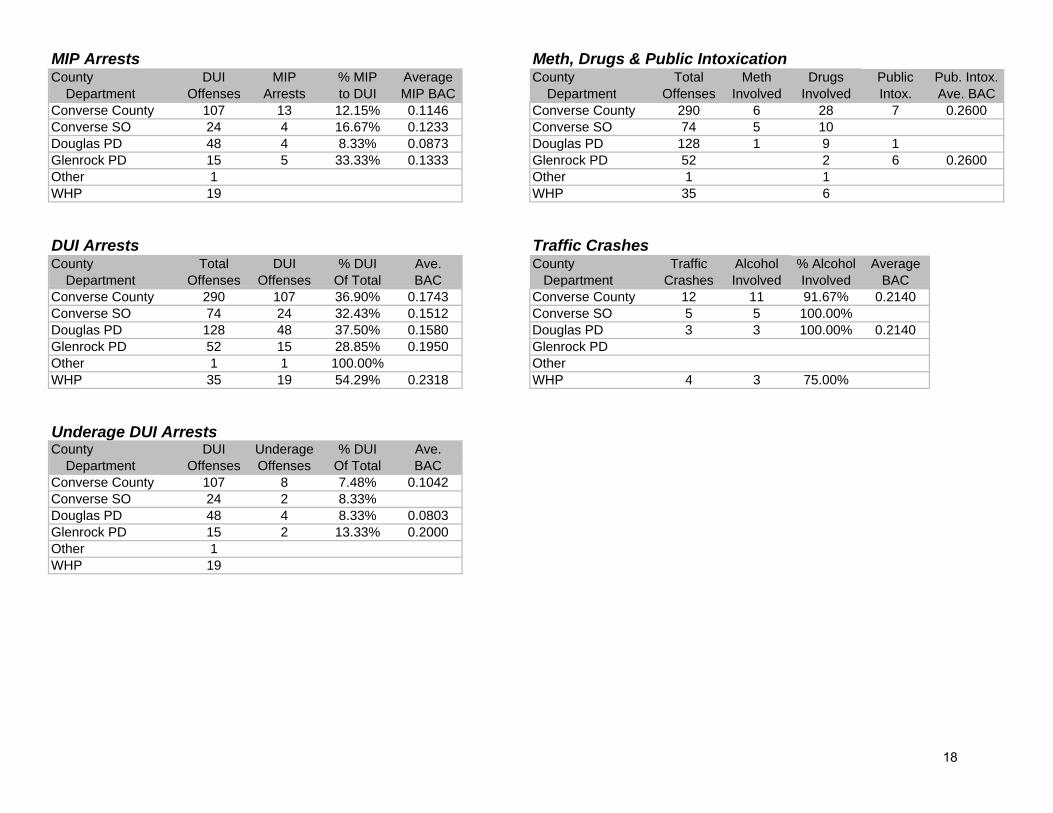
Department Offenses Arrests to DUI MIP BAC Department Offenses Involved Involved Intox Ave BAC Department Offenses Arrests to DUI MIP BAC Department Offenses Involved Involved Intox. Ave. BACConverse County 107 13 12.15% 0.1146 Converse County 290 6 28 7 0.2600Converse SO 24 4 16.67% 0.1233 Converse SO 74 5 10Douglas PD 48 4 8.33% 0.0873 Douglas PD 128 1 9 1Glenrock PD 15 5 33.33% 0.1333 Glenrock PD 52 2 6 0.2600Other 1 Other 1 1WHP 19 WHP 35 6WHP 19 WHP 35 6
DUI Arrests Traffic CrashesCounty Total DUI % DUI Ave. County Traffic Alcohol % Alcohol Average Department Offenses Offenses Of Total BAC Department Crashes Involved Involved BACp pConverse County 290 107 36.90% 0.1743 Converse County 12 11 91.67% 0.2140Converse SO 74 24 32.43% 0.1512 Converse SO 5 5 100.00%Douglas PD 128 48 37.50% 0.1580 Douglas PD 3 3 100.00% 0.2140Glenrock PD 52 15 28.85% 0.1950 Glenrock PDOther 1 1 100.00% OtherWHP 35 19 54 29% 0 2318 WHP 4 3 75 00%WHP 35 19 54.29% 0.2318 WHP 4 3 75.00%
Underage DUI ArrestsCounty DUI Underage % DUI Ave. Department Offenses Offenses Of Total BACConverse County 107 8 7.48% 0.1042Converse SO 24 2 8.33%Douglas PD 48 4 8.33% 0.0803Glenrock PD 15 2 13.33% 0.2000Other 1WHP 19
18
Total Offenses-Alcohol Involvement Domestic Violence-Alcohol Involvement
County TotalNumber Involving Percent of Total County
Domestic Violence
Number Involving
Percent of Domestic Violence Offenses
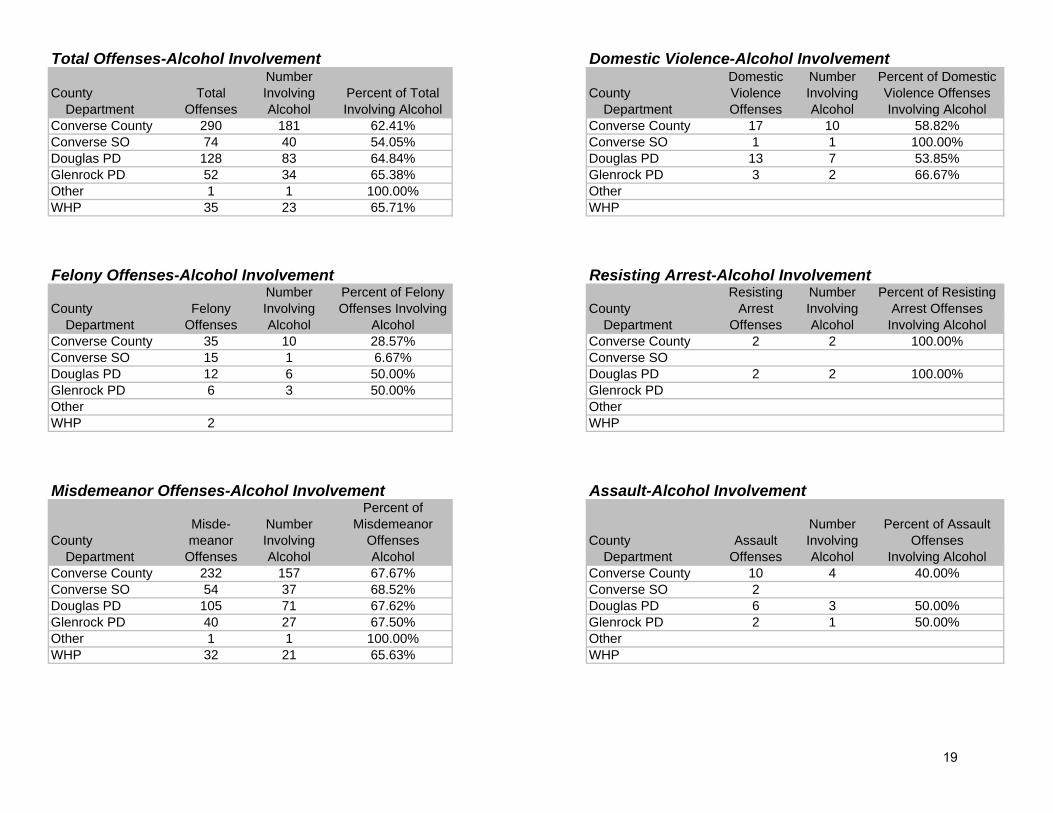
Department Offenses Alcohol Involving Alcohol Department Offenses Alcohol Involving AlcoholConverse County 290 181 62.41% Converse County 17 10 58.82%Converse SO 74 40 54.05% Converse SO 1 1 100.00%Douglas PD 128 83 64.84% Douglas PD 13 7 53.85%Glenrock PD 52 34 65.38% Glenrock PD 3 2 66.67%Other 1 1 100.00% OtherWHP 35 23 65.71% WHP
Felony Offenses-Alcohol Involvement Resisting Arrest-Alcohol Involvement
County FelonyNumber Involving
Percent of Felony Offenses Involving County
Resisting Arrest
Number Involving
Percent of Resisting Arrest Offenses
Department Offenses Alcohol Alcohol Department Offenses Alcohol Involving AlcoholConverse County 35 10 28.57% Converse County 2 2 100.00%Converse SO 15 1 6.67% Converse SODouglas PD 12 6 50.00% Douglas PD 2 2 100.00%Glenrock PD 6 3 50.00% Glenrock PDOther OtherWHP 2 WHP
Misdemeanor Offenses-Alcohol Involvement Assault-Alcohol Involvement
CountyMisde-meanor
Number Involving
Percent of Misdemeanor
Offenses County AssaultNumber Involving
Percent of Assault Offenses
Department Offenses Alcohol Alcohol Department Offenses Alcohol Involving AlcoholConverse County 232 157 67.67% Converse County 10 4 40.00%Converse SO 54 37 68.52% Converse SO 2Douglas PD 105 71 67.62% Douglas PD 6 3 50.00%Glenrock PD 40 27 67.50% Glenrock PD 2 1 50.00%Other 1 1 100.00% OtherWHP 32 21 65.63% WHP
19

Alcohol No Drive Liquor No Department Involved Home Bar Party Car Other Response Home Bar Up Party Store ResponseConverse SO 40 8 13 2 5 10 4 1 15 3 1 3 18Douglas PD 83 13 36 4 11 6 15 5 37 2 2 5 33Glenrock PD 34 6 18 3 2 5 3 18 2 2 9Other 1 1 1WHP 23 1 4 8 2 8 2 3 1 2 16Converse County Totals 181 29 71 6 27 20 32 12 73 8 3 12 76
Location of Alcohol Consumption
DepartmentNumber of
ReportsConverse SO Chutes 1
College Inn 1Knotty Pine 1La Bonte 4North Gate 1Plains 1
Douglas PD Best Western 1Chutes 3La Bonte 17North Gate 3Plains 2Water Hole 7
Glenrock PD 4 Aces 5Deer Creek 2Knotty Pine 6
WHP 4 Aces 1La Bonte 1Moonlight 1
* Total of percents in Location of Consumption and Point of Sale categories may exceed 100% due to single arrests involving more than on location or point of sale.
Location of Alcohol Consumption and Point of Sale by Department
Location of Consumption Point of Sale
Bar Name
20
Numbers by Department
CountyTotal
OffensesMisde-meanor Felony
Domestic Violence
Resist Arrest Assault
Public Intox
Alcohol Involved
Traffic Crash Female Male
Unknown Gender
Average Ave
Crook County 115 105 3 4 4 4 7 90 11 15 96 4 35.00Court 4 4 1 3 29.00Crook SO 33 32 2 1 2 24 6 4 28 1 33.30Game & Fish 2 2 2 2 45.50Hulett PD 8 7 1 2 8 1 8 34.75Moorcroft PD 7 6 1 1 1 1 4 7 32.57Probation & Parole 1 1 1 28.00State Parks 11 9 3 9 11 29.55Sundance PD 15 12 3 1 2 9 1 3 12 31.77WHP 34 33 1 33 3 7 24 3 40.35
Percents by Department *
CountyTotal
OffensesMisde-meanor Felony
Domestic Violence
Resist Arrest Assault
Public Intox
Alcohol Involved
Traffic Crash Female Male
Unkown Gender
Crook County 115 91.30% 2.61% 3.48% 3.48% 3.48% 6.09% 78.26% 9.57% 13.04% 83.48% 3.48%Court 4 100.00% 25.00% 75.00%Crook SO 33 96.97% 6.06% 3.03% 6.06% 72.73% 18.18% 12.12% 84.85% 3.03%Game & Fish 2 100.00% 100.00% 100.00%Hulett PD 8 87.50% 12.50% 25.00% 100.00% 12.50% 100.00%Moorcroft PD 7 85.71% 14.29% 14.29% 14.29% 14.29% 57.14% 100.00%Probation & Parole 1 100.00% 100.00%State Parks 11 81.82% 27.27% 81.82% 100.00%Sundance PD 15 80.00% 20.00% 6.67% 13.33% 60.00% 6.67% 20.00% 80.00%WHP 34 97.06% 2.94% 97.06% 8.82% 20.59% 70.59% 8.82%
* Total percents may not equal 100 due to lack of information, or a single arrest involving multiple crimes.
Crook County ArrestsApril 1, 2007 - September 30, 2007
Crook County ArrestsApril 1, 2007 - September 30, 2007
21
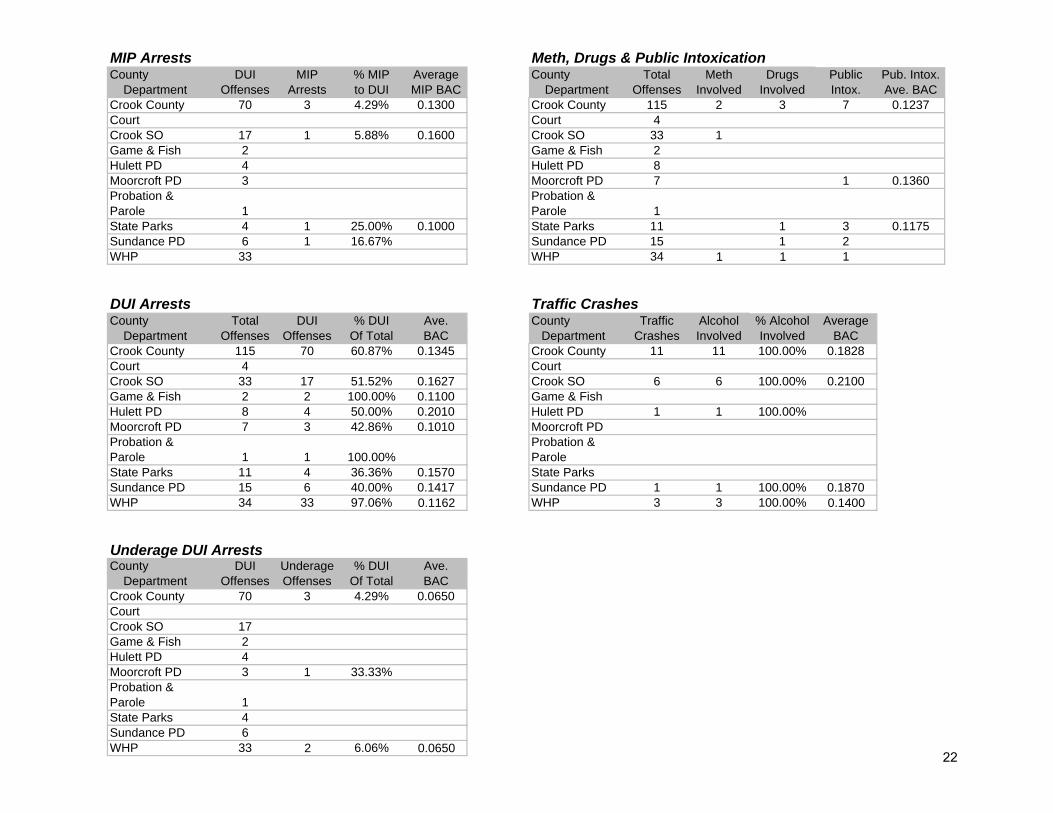
MIP Arrests Meth, Drugs & Public IntoxicationCounty DUI MIP % MIP Average County Total Meth Drugs Public Pub. Intox. Department Offenses Arrests to DUI MIP BAC Department Offenses Involved Involved Intox. Ave. BACCrook County 70 3 4.29% 0.1300 Crook County 115 2 3 7 0.1237Court Court 4Crook SO 17 1 5.88% 0.1600 Crook SO 33 1Game & Fish 2 Game & Fish 2Hulett PD 4 Hulett PD 8Moorcroft PD 3 Moorcroft PD 7 1 0.1360Probation & Parole 1
Probation & Parole 1
State Parks 4 1 25.00% 0.1000 State Parks 11 1 3 0.1175Sundance PD 6 1 16.67% Sundance PD 15 1 2WHP 33 WHP 34 1 1 1
DUI Arrests Traffic CrashesCounty Total DUI % DUI Ave. County Traffic Alcohol % Alcohol Average Department Offenses Offenses Of Total BAC Department Crashes Involved Involved BACCrook County 115 70 60.87% 0.1345 Crook County 11 11 100.00% 0.1828Court 4 CourtCrook SO 33 17 51.52% 0.1627 Crook SO 6 6 100.00% 0.2100Game & Fish 2 2 100.00% 0.1100 Game & FishHulett PD 8 4 50.00% 0.2010 Hulett PD 1 1 100.00%Moorcroft PD 7 3 42.86% 0.1010 Moorcroft PDProbation & Parole 1 1 100.00%
Probation & Parole
State Parks 11 4 36.36% 0.1570 State ParksSundance PD 15 6 40.00% 0.1417 Sundance PD 1 1 100.00% 0.1870WHP 34 33 97.06% 0.1162 WHP 3 3 100.00% 0.1400
Underage DUI ArrestsCounty DUI Underage % DUI Ave. Department Offenses Offenses Of Total BACCrook County 70 3 4.29% 0.0650CourtCrook SO 17Game & Fish 2Hulett PD 4Moorcroft PD 3 1 33.33%Probation & Parole 1State Parks 4Sundance PD 6WHP 33 2 6.06% 0.0650
22

Total Offenses-Alcohol Involvement Domestic Violence-Alcohol Involvement
County TotalNumber Involving Percent of Total County
Domestic Violence
Number Involving
Percent of Domestic Violence Offenses
Department Offenses Alcohol Involving Alcohol Department Offenses Alcohol Involving AlcoholCrook County 115 90 78.26% Crook County 4 2 50.00%Court 4 CourtCrook SO 33 24 72.73% Crook SO 1Game & Fish 2 2 100.00% Game & FishHulett PD 8 8 100.00% Hulett PDMoorcroft PD 7 4 57.14% Moorcroft PDProbation & Parole 1 1 100.00%
Probation & Parole
State Parks 11 9 81.82% State ParksSundance PD 15 9 60.00% Sundance PD 3 2 66.67%WHP 34 33 97.06% WHP
Felony Offenses-Alcohol Involvement Resisting Arrest-Alcohol Involvement
County FelonyNumber Involving
Percent of Felony Offenses Involving County
Resisting Arrest
Number Involving
Percent of Resisting Arrest Offenses
Department Offenses Alcohol Alcohol Department Offenses Alcohol Involving AlcoholCrook County 3 1 33.33% Crook County 4 4 100.00%Court CourtCrook SO 2 Crook SO 2 2 100.00%Game & Fish Game & FishHulett PD Hulett PD 1 1 100.00%Moorcroft PD 1 1 100.00% Moorcroft PD 1 1 100.00%Probation & Parole
Probation & Parole
State Parks State ParksSundance PD Sundance PDWHP WHP
Misdemeanor Offenses-Alcohol Involvement Assault-Alcohol Involvement
CountyMisde-meanor
Number Involving
Percent of Misdemeanor
Offenses County AssaultNumber Involving
Percent of Assault Offenses
Department Offenses Alcohol Alcohol Department Offenses Alcohol Involving AlcoholCrook County 105 83 79.05% Crook County 4 4 100.00%Court 4 CourtCrook SO 32 24 75.00% Crook SOGame & Fish 2 2 100.00% Game & FishHulett PD 7 7 100.00% Hulett PD 2 2 100.00%Moorcroft PD 6 3 50.00% Moorcroft PD 1 1 100.00%Probation & Parole
Probation & Parole
State Parks 9 8 88.89% State ParksSundance PD 12 7 58.33% Sundance PD 1 1 100.00%WHP 33 32 96.97% WHP
23
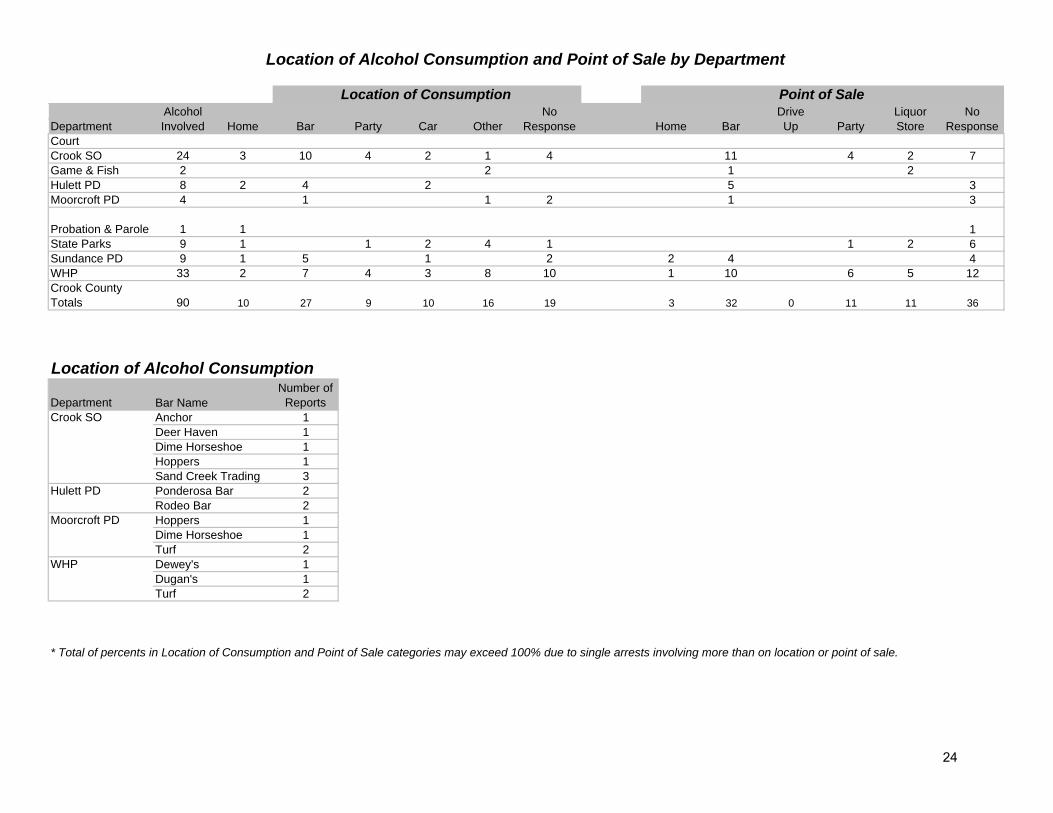
Alcohol No Drive Liquor No Department Involved Home Bar Party Car Other Response Home Bar Up Party Store ResponseCourtCrook SO 24 3 10 4 2 1 4 11 4 2 7Game & Fish 2 2 1 2Hulett PD 8 2 4 2 5 3Moorcroft PD 4 1 1 2 1 3
Probation & Parole 1 1 1State Parks 9 1 1 2 4 1 1 2 6Sundance PD 9 1 5 1 2 2 4 4WHP 33 2 7 4 3 8 10 1 10 6 5 12Crook County Totals 90 10 27 9 10 16 19 3 32 0 11 11 36
Location of Alcohol Consumption
DepartmentNumber of
ReportsCrook SO Anchor 1
Deer Haven 1Dime Horseshoe 1Hoppers 1Sand Creek Trading 3
Hulett PD Ponderosa Bar 2Rodeo Bar 2
Moorcroft PD Hoppers 1Dime Horseshoe 1Turf 2
WHP Dewey's 1Dugan's 1Turf 2
* Total of percents in Location of Consumption and Point of Sale categories may exceed 100% due to single arrests involving more than on location or point of sale.
Location of Alcohol Consumption and Point of Sale by Department
Location of Consumption Point of Sale
Bar Name
24
Numbers by Department
CountyTotal
OffensesMisde-meanor Felony
Domestic Violence
Resist Arrest Assault
Public Intox
Alcohol Involved
Traffic Crash Female Male
Unknown Gender
Average Ave
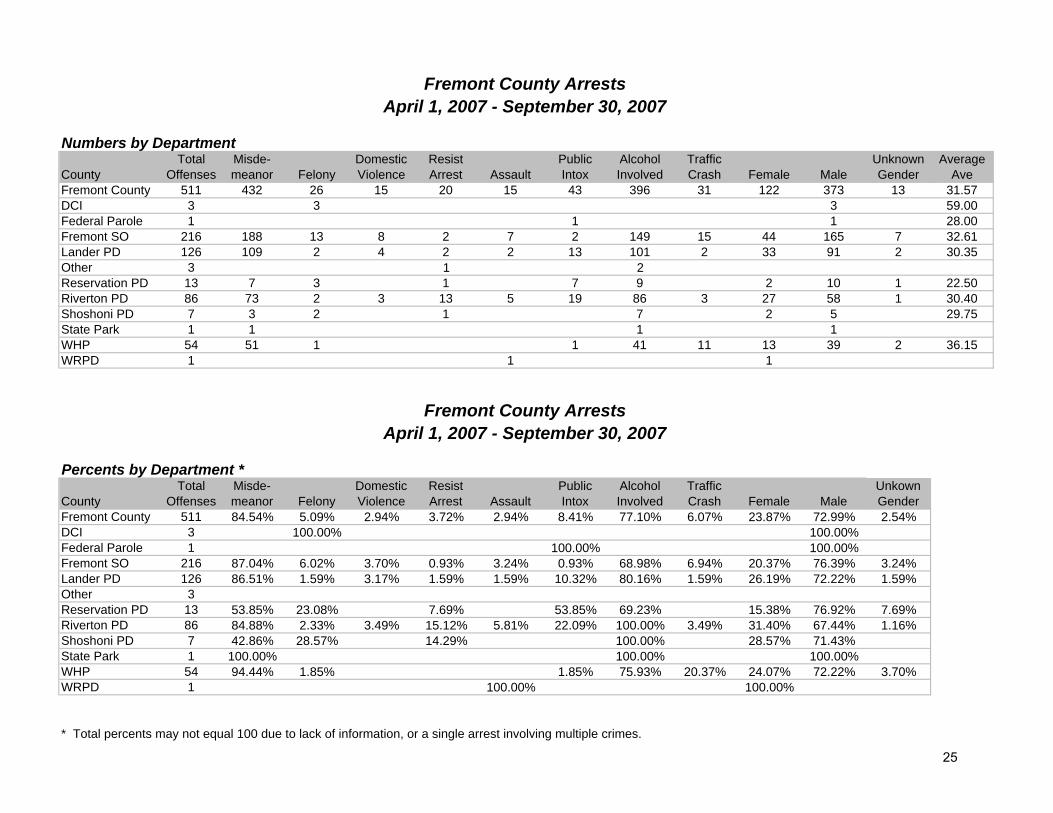
Fremont County 511 432 26 15 20 15 43 396 31 122 373 13 31.57DCI 3 3 3 59.00Federal Parole 1 1 1 28.00Fremont SO 216 188 13 8 2 7 2 149 15 44 165 7 32.61Lander PD 126 109 2 4 2 2 13 101 2 33 91 2 30.35Other 3 1 2Reservation PD 13 7 3 1 7 9 2 10 1 22.50Riverton PD 86 73 2 3 13 5 19 86 3 27 58 1 30.40Shoshoni PD 7 3 2 1 7 2 5 29.75State Park 1 1 1 1WHP 54 51 1 1 41 11 13 39 2 36.15WRPD 1 1 1
Percents by Department *
CountyTotal
OffensesMisde-meanor Felony
Domestic Violence
Resist Arrest Assault
Public Intox
Alcohol Involved
Traffic Crash Female Male
Unkown Gender
Fremont County 511 84.54% 5.09% 2.94% 3.72% 2.94% 8.41% 77.10% 6.07% 23.87% 72.99% 2.54%DCI 3 100.00% 100.00%Federal Parole 1 100.00% 100.00%Fremont SO 216 87.04% 6.02% 3.70% 0.93% 3.24% 0.93% 68.98% 6.94% 20.37% 76.39% 3.24%Lander PD 126 86.51% 1.59% 3.17% 1.59% 1.59% 10.32% 80.16% 1.59% 26.19% 72.22% 1.59%Other 3Reservation PD 13 53.85% 23.08% 7.69% 53.85% 69.23% 15.38% 76.92% 7.69%Riverton PD 86 84.88% 2.33% 3.49% 15.12% 5.81% 22.09% 100.00% 3.49% 31.40% 67.44% 1.16%Shoshoni PD 7 42.86% 28.57% 14.29% 100.00% 28.57% 71.43%State Park 1 100.00% 100.00% 100.00%WHP 54 94.44% 1.85% 1.85% 75.93% 20.37% 24.07% 72.22% 3.70%WRPD 1 100.00% 100.00%
* Total percents may not equal 100 due to lack of information, or a single arrest involving multiple crimes.
Fremont County ArrestsApril 1, 2007 - September 30, 2007
Fremont County ArrestsApril 1, 2007 - September 30, 2007
25

MIP Arrests Meth, Drugs & Public IntoxicationCounty DUI MIP % MIP Average County Total Meth Drugs Public Pub. Intox. Department Offenses Arrests to DUI MIP BAC Department Offenses Involved Involved Intox. Ave. BACFremont County 246 43 17.48% 0.1582 Fremont County 511 3 32 43 0.2297DCI DCI 3 2 2Federal Parole Federal Parole 1 1Fremont SO 94 10 10.64% 0.1939 Fremont SO 216 17 2 0.1535Lander PD 66 9 13.64% 0.1700 Lander PD 126 4 13 0.2210Other 1 Other 3 1 1Reservation PD 3 7 233.33% 0.1075 Reservation PD 13 1 7 0.1170Riverton PD 47 14 29.79% 0.1723 Riverton PD 86 3 19 0.2871Shoshoni PD 4 Shoshoni PD 7 2State Park State Park 1WHP 31 3 9.68% 0.0637 WHP 54 2 1 0.1630WRPD WRPD 1
DUI Arrests Traffic CrashesCounty Total DUI % DUI Ave. County Traffic Alcohol % Alcohol Average Department Offenses Offenses Of Total BAC Department Crashes Involved Involved BACFremont County 511 246 48.14% 0.1534 Fremont County 31 29 93.55% 0.1663DCI 3 DCIFederal Parole 1 Federal ParoleFremont SO 216 94 43.52% 0.1401 Fremont SO 15 15 100.00% 0.1473Lander PD 126 66 52.38% 0.1648 Lander PD 2 2 100.00% 0.1730Other 3 1 33.33% OtherReservation PD 13 3 23.08% 0.1200 Reservation PDRiverton PD 86 47 54.65% 0.1929 Riverton PD 3 3 100.00% 0.1620Shoshoni PD 7 4 57.14% 0.1455 Shoshoni PDState Park 1 State ParkWHP 54 31 57.41% 0.1303 WHP 11 9 81.82% 0.1920WRPD 1 WRPD
Underage DUI ArrestsCounty DUI Underage % DUI Ave. Department Offenses Offenses Of Total BACFremont County 246 21 8.54% 0.1194DCIFederal ParoleFremont SO 94 8 8.51% 0.0724Lander PD 66 8 12.12% 0.1100Other 1Reservation PD 3 2 66.67% 0.1020Riverton PD 47 2 4.26% 0.2825Shoshoni PD 4State ParkWHP 31 1 3.23% 0.1000WRPD 26

Total Offenses-Alcohol Involvement Domestic Violence-Alcohol Involvement
County TotalNumber Involving Percent of Total County
Domestic Violence
Number Involving
Percent of Domestic Violence Offenses
Department Offenses Alcohol Involving Alcohol Department Offenses Alcohol Involving Alcohol Department Offenses Alcohol Involving Alcohol Department Offenses Alcohol Involving AlcoholFremont County 511 396 77.50% Fremont County 15 12 80.00%DCI 3 DCIFederal Parole 1 Federal ParoleFremont SO 216 149 68.98% Fremont SO 8 6 75.00%Lander PD 126 101 80.16% Lander PD 4 3 75.00%Other 3 2 66.67% OtherReservation PD 13 9 69.23% Reservation PDRiverton PD 86 86 100.00% Riverton PD 3 3 100.00%Shoshoni PD 7 7 100.00% Shoshoni PDState Park 1 1 100.00% State ParkWHP 54 41 75.93% WHPWRPD 1 WRPD
Felony Offenses-Alcohol Involvement Resisting Arrest-Alcohol Involvement
County FelonyNumber Involving
Percent of Felony Offenses Involving County
Resisting Arrest
Number Involving
Percent of Resisting Arrest Offenses
Department Offenses Alcohol Alcohol Department Offenses Alcohol Involving AlcoholFremont County 26 11 42.31% Fremont County 20 20 100.00%DCI 3 DCIFederal Parole Federal ParoleFederal Parole Federal ParoleFremont SO 13 4 30.77% Fremont SO 2 2 100.00%Lander PD 2 2 100.00% Lander PD 2 2 100.00%Other Other 1 1 100.00%Reservation PD 3 Reservation PD 1 1 100.00%Riverton PD 2 2 100.00% Riverton PD 13 13 100.00%Shoshoni PD 2 2 100.00% Shoshoni PD 1 1 100.00%State Park State ParkWHP 1 1 100 00% WHPWHP 1 1 100.00% WHPWRPD WRPD
Misdemeanor Offenses-Alcohol Involvement Assault-Alcohol Involvement
Misde- NumberPercent of
Misdemeanor Number Percent of AssaultCounty
Misde-meanor
Number Involving
Misdemeanor Offenses County Assault
Number Involving
Percent of Assault Offenses
Department Offenses Alcohol Alcohol Department Offenses Alcohol Involving AlcoholFremont County 432 343 79.40% Fremont County 15 13 86.67%DCI DCIFederal Parole Federal ParoleFremont SO 188 137 72.87% Fremont SO 7 7 100.00%Lander PD 109 85 77.98% Lander PD 2 1 50.00%Other OtherReservation PD 7 6 85.71% Reservation PDRiverton PD 73 73 100.00% Riverton PD 5 5 100.00%Shoshoni PD 3 3 100.00% Shoshoni PDState Park 1 1 100.00% State ParkWHP 51 38 74.51% WHPWRPD WRPD 1
27

Location of Alcohol Consumption and Point of Sale by Department
Location of Consumption Point of SaleAlcohol No Drive Liquor No
Department Involved Home Bar Party Car Other Response Home Bar Up Party Store ResponseDCIFederal ParoleFremont SO 149 37 41 9 21 5 43 18 45 3 4 7 75Lander PD 101 26 16 7 11 6 39 9 17 3 8 65Oth 2 2 2
Location of Consumption Point of Sale
Other 2 2 2Reservation PD 9 4 1 1 3 2 7Riverton PD 86 20 12 4 3 11 36 4 11 2 14 57Shoshoni PD 7 1 2 1 3 1 6State Park 1 1 1WHP 41 7 8 5 13 5 5 4 9 3 2 4 19WRPDNatrona County Totals 396 95 77 25 51 29 132 37 82 6 11 34 232
Location of Alcohol Consumption
DepartmentNumber of
ReportsFremont SO B&B 2
Crooked Creek 2Lander Bar 1Livestock 1Outlaw 3
Bar Name
Outlaw 3Rezeride 4Rustic Pine 5Sadies 1VFW - Dubois 2Vic's 1
Lander PD Elk's 1L d B 3Lander Bar 3Vic's 4
Riverton PD Ralph's 3River City Bar 1Rocky Mountain 1
WHP B&K Shoreline 1Left Tackle 1Lucky Five Bar 1Rezeride 1The Boot 1Union Bar 1
* Total of percents in Location of Consumption and Point of Sale categories may exceed 100% due to single arrests involving more than on location or point of sale. 28
Numbers by Department
CountyTotal
OffensesMisde-meanor Felony
Domestic Violence
Resist Arrest Assault
Public Intox
Alcohol Involved
Traffic Crash Female Male
Unknown Gender
Average Ave
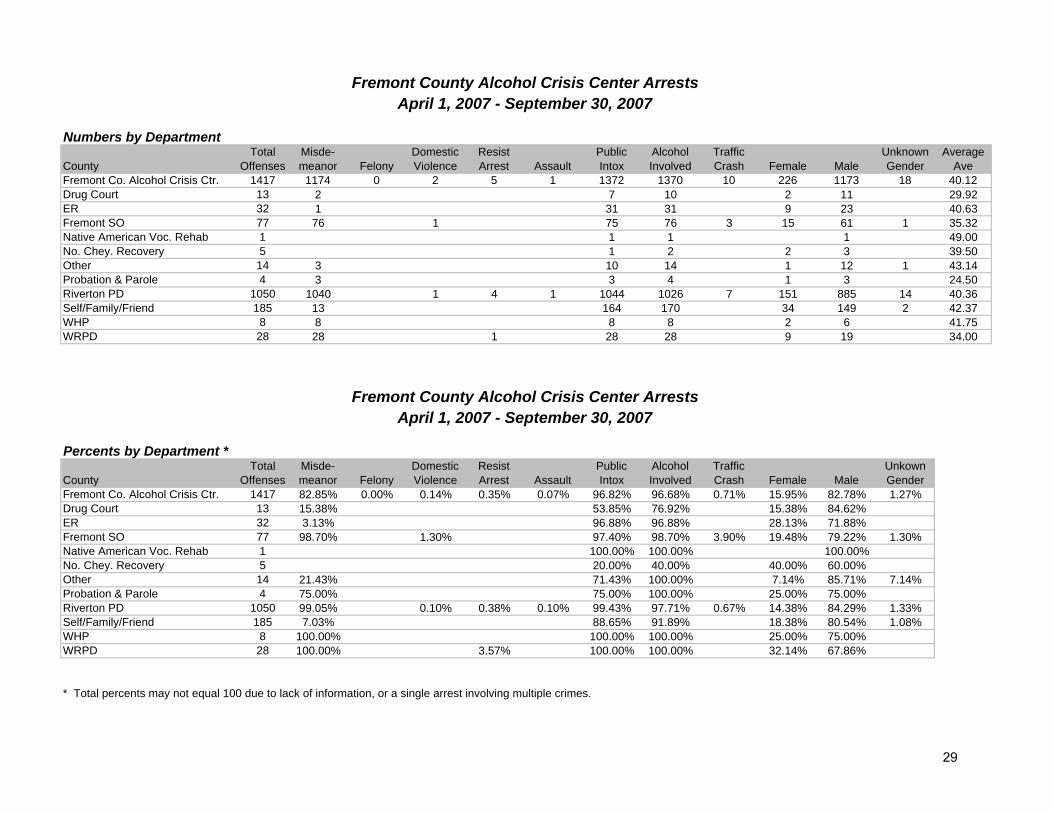
Fremont Co. Alcohol Crisis Ctr. 1417 1174 0 2 5 1 1372 1370 10 226 1173 18 40.12Drug Court 13 2 7 10 2 11 29.92ER 32 1 31 31 9 23 40.63Fremont SO 77 76 1 75 76 3 15 61 1 35.32Native American Voc. Rehab 1 1 1 1 49.00No. Chey. Recovery 5 1 2 2 3 39.50Other 14 3 10 14 1 12 1 43.14Probation & Parole 4 3 3 4 1 3 24.50Riverton PD 1050 1040 1 4 1 1044 1026 7 151 885 14 40.36Self/Family/Friend 185 13 164 170 34 149 2 42.37WHP 8 8 8 8 2 6 41.75WRPD 28 28 1 28 28 9 19 34.00
Percents by Department *
CountyTotal
OffensesMisde-meanor Felony
Domestic Violence
Resist Arrest Assault
Public Intox
Alcohol Involved
Traffic Crash Female Male
Unkown Gender
Fremont Co. Alcohol Crisis Ctr. 1417 82.85% 0.00% 0.14% 0.35% 0.07% 96.82% 96.68% 0.71% 15.95% 82.78% 1.27%Drug Court 13 15.38% 53.85% 76.92% 15.38% 84.62%ER 32 3.13% 96.88% 96.88% 28.13% 71.88%Fremont SO 77 98.70% 1.30% 97.40% 98.70% 3.90% 19.48% 79.22% 1.30%Native American Voc. Rehab 1 100.00% 100.00% 100.00%No. Chey. Recovery 5 20.00% 40.00% 40.00% 60.00%Other 14 21.43% 71.43% 100.00% 7.14% 85.71% 7.14%Probation & Parole 4 75.00% 75.00% 100.00% 25.00% 75.00%Riverton PD 1050 99.05% 0.10% 0.38% 0.10% 99.43% 97.71% 0.67% 14.38% 84.29% 1.33%Self/Family/Friend 185 7.03% 88.65% 91.89% 18.38% 80.54% 1.08%WHP 8 100.00% 100.00% 100.00% 25.00% 75.00%WRPD 28 100.00% 3.57% 100.00% 100.00% 32.14% 67.86%
* Total percents may not equal 100 due to lack of information, or a single arrest involving multiple crimes.
Fremont County Alcohol Crisis Center ArrestsApril 1, 2007 - September 30, 2007
Fremont County Alcohol Crisis Center ArrestsApril 1, 2007 - September 30, 2007
29
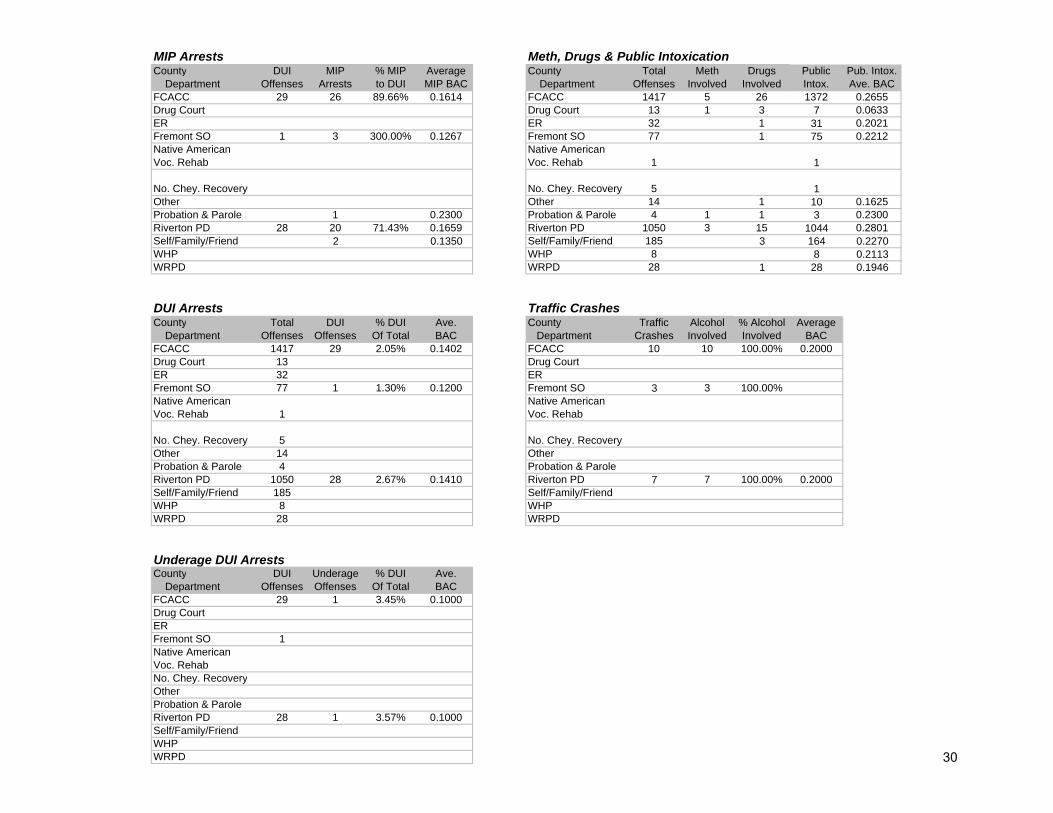
MIP Arrests Meth, Drugs & Public IntoxicationCounty DUI MIP % MIP Average County Total Meth Drugs Public Pub. Intox. Department Offenses Arrests to DUI MIP BAC Department Offenses Involved Involved Intox. Ave. BACFCACC 29 26 89.66% 0.1614 FCACC 1417 5 26 1372 0.2655Drug Court Drug Court 13 1 3 7 0.0633ER ER 32 1 31 0.2021Fremont SO 1 3 300.00% 0.1267 Fremont SO 77 1 75 0.2212Native American Voc. Rehab
Native American Voc. Rehab 1 1
No. Chey. Recovery No. Chey. Recovery 5 1Other Other 14 1 10 0.1625Probation & Parole 1 0.2300 Probation & Parole 4 1 1 3 0.2300Riverton PD 28 20 71.43% 0.1659 Riverton PD 1050 3 15 1044 0.2801Self/Family/Friend 2 0.1350 Self/Family/Friend 185 3 164 0.2270WHP WHP 8 8 0.2113WRPD WRPD 28 1 28 0.1946
DUI Arrests Traffic CrashesCounty Total DUI % DUI Ave. County Traffic Alcohol % Alcohol Average Department Offenses Offenses Of Total BAC Department Crashes Involved Involved BACFCACC 1417 29 2.05% 0.1402 FCACC 10 10 100.00% 0.2000Drug Court 13 Drug CourtER 32 ERFremont SO 77 1 1.30% 0.1200 Fremont SO 3 3 100.00%Native American Voc. Rehab 1
Native American Voc. Rehab
No. Chey. Recovery 5 No. Chey. RecoveryOther 14 OtherProbation & Parole 4 Probation & ParoleRiverton PD 1050 28 2.67% 0.1410 Riverton PD 7 7 100.00% 0.2000Self/Family/Friend 185 Self/Family/FriendWHP 8 WHPWRPD 28 WRPD
Underage DUI ArrestsCounty DUI Underage % DUI Ave. Department Offenses Offenses Of Total BACFCACC 29 1 3.45% 0.1000Drug CourtERFremont SO 1Native American Voc. RehabNo. Chey. RecoveryOtherProbation & ParoleRiverton PD 28 1 3.57% 0.1000Self/Family/FriendWHPWRPD 30

Total Offenses-Alcohol Involvement Domestic Violence-Alcohol Involvement
County TotalNumber Involving Percent of Total County
Domestic Violence
Number Involving
Percent of Domestic Violence Offenses
Department Offenses Alcohol Involving Alcohol Department Offenses Alcohol Involving AlcoholFCACC 1417 1370 96.68% FCACC 2 2 100.00%Drug Court 13 10 76.92% Drug CourtER 32 31 96.88% ERFremont SO 77 76 98.70% Fremont SO 1 1 100.00%Native American Voc. Rehab 1 1 100.00%
Native American Voc. Rehab
No. Chey. Recovery 5 2 40.00% No. Chey. RecoveryOther 14 14 100.00% OtherProbation & Parole 4 4 100.00% Probation & ParoleRiverton PD 1050 1026 97.71% Riverton PD 1 1 100.00%Self/Family/Friend 185 170 91.89% Self/Family/FriendWHP 8 8 100.00% WHPWRPD 28 28 100.00% WRPD
Felony Offenses-Alcohol Involvement Resisting Arrest-Alcohol Involvement
County FelonyNumber Involving
Percent of Felony Offenses Involving County
Resisting Arrest
Number Involving
Percent of Resisting Arrest Offenses
Department Offenses Alcohol Alcohol Department Offenses Alcohol Involving AlcoholFCACC 0 0 FCACC 5 5 100.00%Drug Court Drug CourtER ERFremont SO Fremont SONative American Voc. Rehab
Native American Voc. Rehab
No. Chey. Recovery No. Chey. RecoveryOther OtherProbation & Parole Probation & ParoleRiverton PD Riverton PD 4 4 100.00%Self/Family/Friend Self/Family/FriendWHP WHPWRPD WRPD 1 1 100.00%
Misdemeanor Offenses-Alcohol Involvement Assault-Alcohol Involvement
CountyMisde-meanor
Number Involving
Percent of Misdemeanor
Offenses County AssaultNumber Involving
Percent of Assault Offenses
Department Offenses Alcohol Alcohol Department Offenses Alcohol Involving AlcoholFCACC 1174 1149 96.68% FCACC 1 1 100.00%Drug Court 2 2 76.92% Drug CourtER 1 1 96.88% ERFremont SO 76 75 98.70% Fremont SONative American Voc. Rehab
Native American Voc. Rehab
No. Chey. Recovery No. Chey. RecoveryOther 3 3 100.00% OtherProbation & Parole 3 3 100.00% Probation & ParoleRiverton PD 1040 1016 97.71% Riverton PD 1 1 100.00%Self/Family/Friend 13 13 91.89% Self/Family/FriendWHP 8 8 100.00% WHPWRPD 28 28 100.00% WRPD
31

Alcohol No Drive Liquor No Department Involved Home Bar Party Car Other Response Home Bar Up Party Store ResponseDrug Court 10 1 1 2 6 10ER 31 3 2 7 20 1 9 21Fremont SO 76 10 2 4 1 14 45 1 1 14 60Native American Voc. Rehab 1 1 1
No. Chey. Recovery 2 1 1 1 1Other 14 1 2 11 1 13Probation & Parole 4 4 4Riverton PD 1026 34 26 15 15 383 554 8 29 4 5 193 788Self/Family/Friend 170 26 6 1 9 42 86 4 7 2 2 39 116WHP 8 1 2 5 8WRPD 28 5 1 7 15 5 23FCACC Totals 1370 80 34 24 27 459 748 0 13 37 6 8 262 1045
Location of Alcohol Consumption
DepartmentNumber of
ReportsSelf/Friend/Family Cedar 1
Ralph's River City 3Fremont SO Sadie's 1Riverton PD Cedar 1
Livestock 1Ralph's River City 7Time Out 1
* Total of percents in Location of Consumption and Point of Sale categories may exceed 100% due to single arrests involving more than on location or point of sale.
Location of Alcohol Consumption and Point of Sale by Department
Location of Consumption Point of Sale
Bar Name
32

Numbers by Department
CountyTotal
OffensesMisde-meanor Felony
Domestic Violence
Resist Arrest Assault
Public Intox
Alcohol Involved
Traffic Crash Female Male
Unknown Gender
Average Ave
Goshen County 96 81 7 16 5 2 10 58 7 26 66 2 33.60Goshen SO 21 18 4 4 1 7 1 4 16 1 33.45Lingle PD 3 2 1 2 43.33Other 2 2 1 1 1Torrington PD 61 50 3 11 4 1 10 43 5 21 39 1 32.47WHP 9 9 7 1 9 37.22
Percents by Department *
CountyTotal
OffensesMisde-meanor Felony
Domestic Violence
Resist Arrest Assault
Public Intox
Alcohol Involved
Traffic Crash Female Male
Unkown Gender
Goshen County 96 84.38% 7.29% 16.67% 5.21% 2.08% 10.42% 60.42% 7.29% 27.08% 68.75% 2.08%Goshen SO 21 85.71% 19.05% 19.05% 4.76% 33.33% 4.76% 19.05% 76.19% 4.76%Lingle PD 3 66.67% 33.33% 66.67%Other 2 100.00% 50.00% 50.00% 50.00%Torrington PD 61 81.97% 4.92% 18.03% 6.56% 1.64% 16.39% 70.49% 8.20% 34.43% 63.93% 1.64%WHP 9 100.00% 77.78% 11.11% 100.00%
* Total percents may not equal 100 due to lack of information, or a single arrest involving multiple crimes.
Goshen County ArrestsApril 1, 2007 - September 30, 2007
Goshen County ArrestsApril 1, 2007 - September 30, 2007
33

MIP Arrests Meth, Drugs & Public IntoxicationCounty DUI MIP % MIP Average County Total Meth Drugs Public Pub. Intox.
Department Offenses Arrests to DUI MIP BAC Department Offenses Involved Involved Intox Ave BAC Department Offenses Arrests to DUI MIP BAC Department Offenses Involved Involved Intox. Ave. BACGoshen County 38 3 7.89% 0.1073 Goshen County 96 2 9 10 0.1210Goshen SO 5 Goshen SO 21 1 2Lingle PD Lingle PD 3 1Other 1 Other 2Torrington PD 27 3 11.11% 0.1073 Torrington PD 61 1 5 10 0.1210WHP 5 WHP 9 1WHP 5 WHP 9 1
DUI Arrests Traffic CrashesCounty Total DUI % DUI Ave. County Traffic Alcohol % Alcohol Average Department Offenses Offenses Of Total BAC Department Crashes Involved Involved BACp pGoshen County 96 38 39.58% 0.1552 Goshen County 7 7 100.00% 0.1933Goshen SO 21 5 23.81% 0.2305 Goshen SO 1 1 100.00%Lingle PD 3 Lingle PDOther 2 1 50.00% OtherTorrington PD 61 27 44.26% 0.1425 Torrington PD 5 5 100.00% 0.1933WHP 9 5 55 56% 0 2200 WHP 1 1 100 00%WHP 9 5 55.56% 0.2200 WHP 1 1 100.00%
Underage DUI ArrestsCounty DUI Underage % DUI Ave. Department Offenses Offenses Of Total BACGoshen County 38 2 5.26% 0.0230Goshen SO 5Lingle PDOther 1 1 100.00%Torrington PD 27 1 3.70% 0.0230WHP 5
34

Total Offenses-Alcohol Involvement Domestic Violence-Alcohol Involvement
County TotalNumber Involving Percent of Total County
Domestic Violence
Number Involving
Percent of Domestic Violence Offenses
Department Offenses Alcohol Involving Alcohol Department Offenses Alcohol Involving AlcoholGoshen County 96 58 60.42% Goshen County 16 7 43.75%Goshen SO 21 7 33.33% Goshen SO 4 2 50.00%Lingle PD 3 Lingle PDOther 2 1 50.00% Other 1Torrington PD 61 43 70.49% Torrington PD 11 5 45.45%WHP 9 7 77.78% WHP
Felony Offenses-Alcohol Involvement Resisting Arrest-Alcohol Involvement
County FelonyNumber Involving
Percent of Felony Offenses Involving County
Resisting Arrest
Number Involving
Percent of Resisting Arrest Offenses
Department Offenses Alcohol Alcohol Department Offenses Alcohol Involving AlcoholGoshen County 7 0 0.00% Goshen County 5 4 80.00%Goshen SO 4 Goshen SOLingle PD Lingle PDOther Other 1 1 100.00%Torrington PD 3 Torrington PD 4 3 75.00%WHP WHP
Misdemeanor Offenses-Alcohol Involvement Assault-Alcohol Involvement
CountyMisde-meanor
Number Involving
Percent of Misdemeanor
Offenses County AssaultNumber Involving
Percent of Assault Offenses
Department Offenses Alcohol Alcohol Department Offenses Alcohol Involving AlcoholGoshen County 81 51 62.96% Goshen County 2 0 0.00%Goshen SO 18 7 38.89% Goshen SO 1Lingle PD 2 Lingle PDOther 2 1 50.00% OtherTorrington PD 50 36 72.00% Torrington PD 1WHP 9 7 77.78% WHP
35

Alcohol No Drive Liquor No Department Involved Home Bar Party Car Other Response Home Bar Up Party Store ResponseGoshen SO 7 1 1 5 1 1 5Lingle PD 1 1Other 1Torrington PD 43 5 20 1 2 15 5 18 2 18WHP 7 2 2 3 1 2 4Goshen County Totals 58 7 23 2 0 2 24 6 21 0 1 2 28
Location of Alcohol Consumption
DepartmentNumber of
ReportsGoshen SO Ft. Laramie Saloon 1Torrington PD Bronco Bar 8
Ft. Laramie Saloon 1Hiway 2J&B Liquor 1Kings Inn 2Tote Away 5
WHP State Line 2
* Total of percents in Location of Consumption and Point of Sale categories may exceed 100% due to single arrests involving more than on location or point of sale.
Location of Alcohol Consumption and Point of Sale by Department
Location of Consumption Point of Sale
Bar Name
36
Numbers by Department
CountyTotal
OffensesMisde-meanor Felony
Domestic Violence
Resist Arrest Assault
Public Intox
Alcohol Involved
Traffic Crash Female Male
Unknown Gender
Average Ave
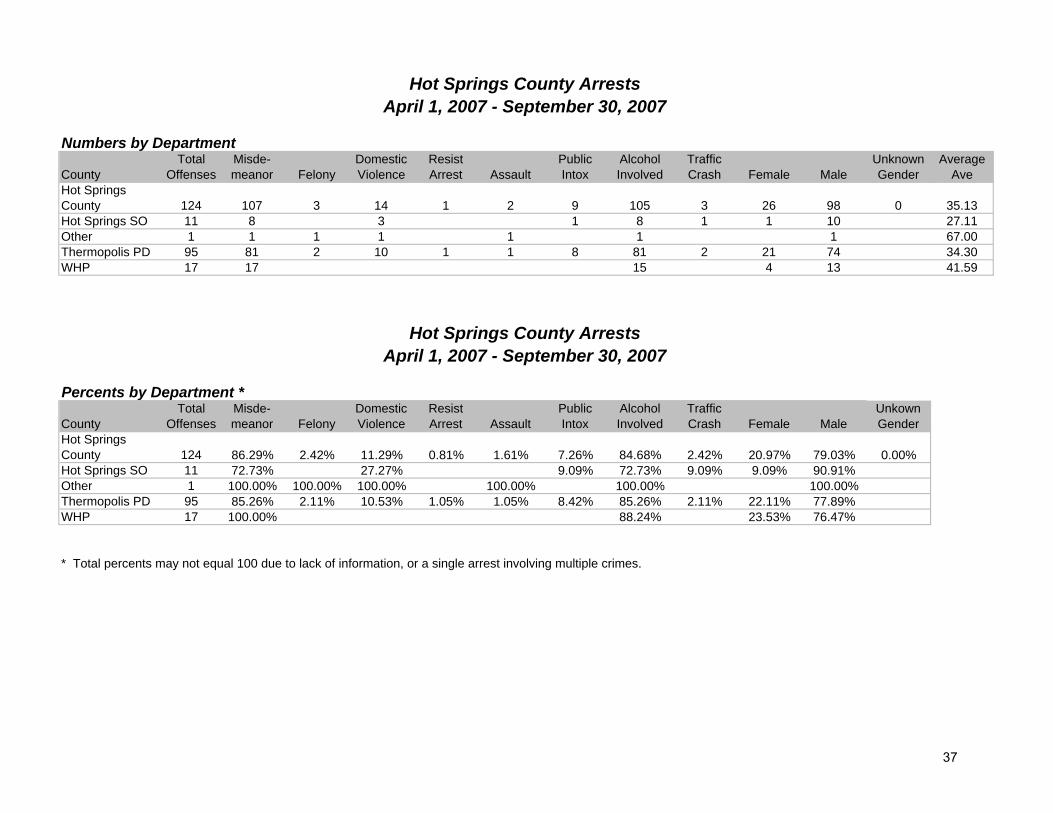
Hot Springs County 124 107 3 14 1 2 9 105 3 26 98 0 35.13Hot Springs SO 11 8 3 1 8 1 1 10 27.11Other 1 1 1 1 1 1 1 67.00Thermopolis PD 95 81 2 10 1 1 8 81 2 21 74 34.30WHP 17 17 15 4 13 41.59
Percents by Department *
CountyTotal
OffensesMisde-meanor Felony
Domestic Violence
Resist Arrest Assault
Public Intox
Alcohol Involved
Traffic Crash Female Male
Unkown Gender
Hot Springs County 124 86.29% 2.42% 11.29% 0.81% 1.61% 7.26% 84.68% 2.42% 20.97% 79.03% 0.00%Hot Springs SO 11 72.73% 27.27% 9.09% 72.73% 9.09% 9.09% 90.91%Other 1 100.00% 100.00% 100.00% 100.00% 100.00% 100.00%Thermopolis PD 95 85.26% 2.11% 10.53% 1.05% 1.05% 8.42% 85.26% 2.11% 22.11% 77.89%WHP 17 100.00% 88.24% 23.53% 76.47%
* Total percents may not equal 100 due to lack of information, or a single arrest involving multiple crimes.
Hot Springs County ArrestsApril 1, 2007 - September 30, 2007
Hot Springs County ArrestsApril 1, 2007 - September 30, 2007
37
MIP Arrests Meth, Drugs & Public IntoxicationCounty DUI MIP % MIP Average County Total Meth Drugs Public Pub. Intox. Department Offenses Arrests to DUI MIP BAC Department Offenses Involved Involved Intox. Ave. BAC
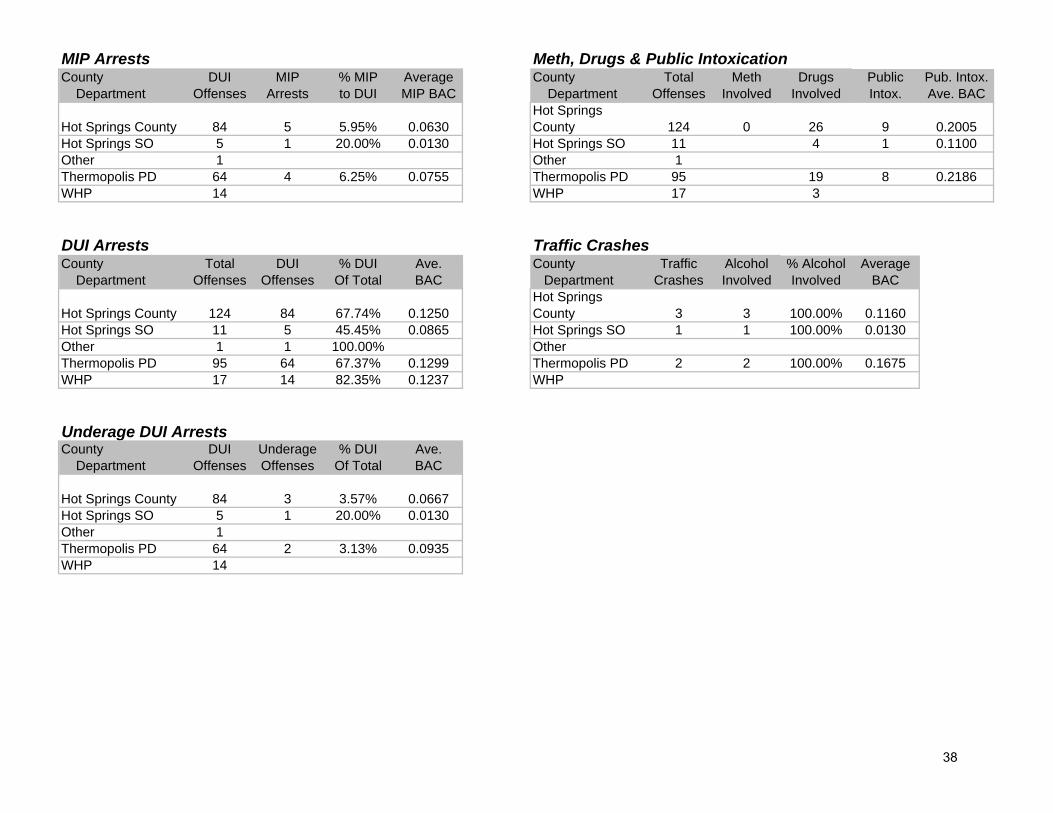
Hot Springs County 84 5 5.95% 0.0630Hot Springs County 124 0 26 9 0.2005
Hot Springs SO 5 1 20.00% 0.0130 Hot Springs SO 11 4 1 0.1100Other 1 Other 1Thermopolis PD 64 4 6.25% 0.0755 Thermopolis PD 95 19 8 0.2186WHP 14 WHP 17 3
DUI Arrests Traffic CrashesCounty Total DUI % DUI Ave. County Traffic Alcohol % Alcohol Average Department Offenses Offenses Of Total BAC Department Crashes Involved Involved BAC
Hot Springs County 124 84 67.74% 0.1250Hot Springs County 3 3 100.00% 0.1160
Hot Springs SO 11 5 45.45% 0.0865 Hot Springs SO 1 1 100.00% 0.0130Other 1 1 100.00% OtherThermopolis PD 95 64 67.37% 0.1299 Thermopolis PD 2 2 100.00% 0.1675WHP 17 14 82.35% 0.1237 WHP
Underage DUI ArrestsCounty DUI Underage % DUI Ave. Department Offenses Offenses Of Total BAC
Hot Springs County 84 3 3.57% 0.0667Hot Springs SO 5 1 20.00% 0.0130Other 1Thermopolis PD 64 2 3.13% 0.0935WHP 14
38

Total Offenses-Alcohol Involvement Domestic Violence-Alcohol Involvement
County TotalNumber Involving Percent of Total County
Domestic Violence
Number Involving
Percent of Domestic Violence OffensesCounty Total Involving Percent of Total County Violence Involving Violence Offenses
Department Offenses Alcohol Involving Alcohol Department Offenses Alcohol Involving AlcoholHot Springs County 124 105 84.68%
Hot Springs County 14 13 92.86%
Hot Springs SO 11 8 72.73% Hot Springs SO 3 3 100.00%Other 1 1 100.00% Other 1 1 100.00%Th li PD 95 81 85 26% Th li PD 10 9 90 00%Thermopolis PD 95 81 85.26% Thermopolis PD 10 9 90.00%WHP 17 15 88.24% WHP
Felony Offenses-Alcohol Involvement Resisting Arrest-Alcohol Involvementy g
County FelonyNumber Involving
Percent of Felony Offenses Involving County
Resisting Arrest
Number Involving
Percent of Resisting Arrest Offenses
Department Offenses Alcohol Alcohol Department Offenses Alcohol Involving AlcoholHot Springs County 3 3 100.00%
Hot Springs County 1 1 100.00%
Hot Springs SO Hot Springs SOHot Springs SO Hot Springs SOOther 1 1 100.00% OtherThermopolis PD 2 2 100.00% Thermopolis PD 1 1 100.00%WHP WHP
Misdemeanor Offenses-Alcohol Involvement Assault-Alcohol Involvement
CountyMisde-meanor
Number Involving
Percent of Misdemeanor
Offenses County AssaultNumber Involving
Percent of Assault Offenses
Department Offenses Alcohol Alcohol Department Offenses Alcohol Involving Alcoholp p gHot Springs County 107 91 85.05%
Hot Springs County 2 2 100.00%
Hot Springs SO 8 6 75.00% Hot Springs SOOther 1 1 100.00% Other 1 1 100.00%Thermopolis PD 81 69 85.19% Thermopolis PD 1 1 100.00%WHP 17 15 88 24% WHPWHP 17 15 88.24% WHP
39
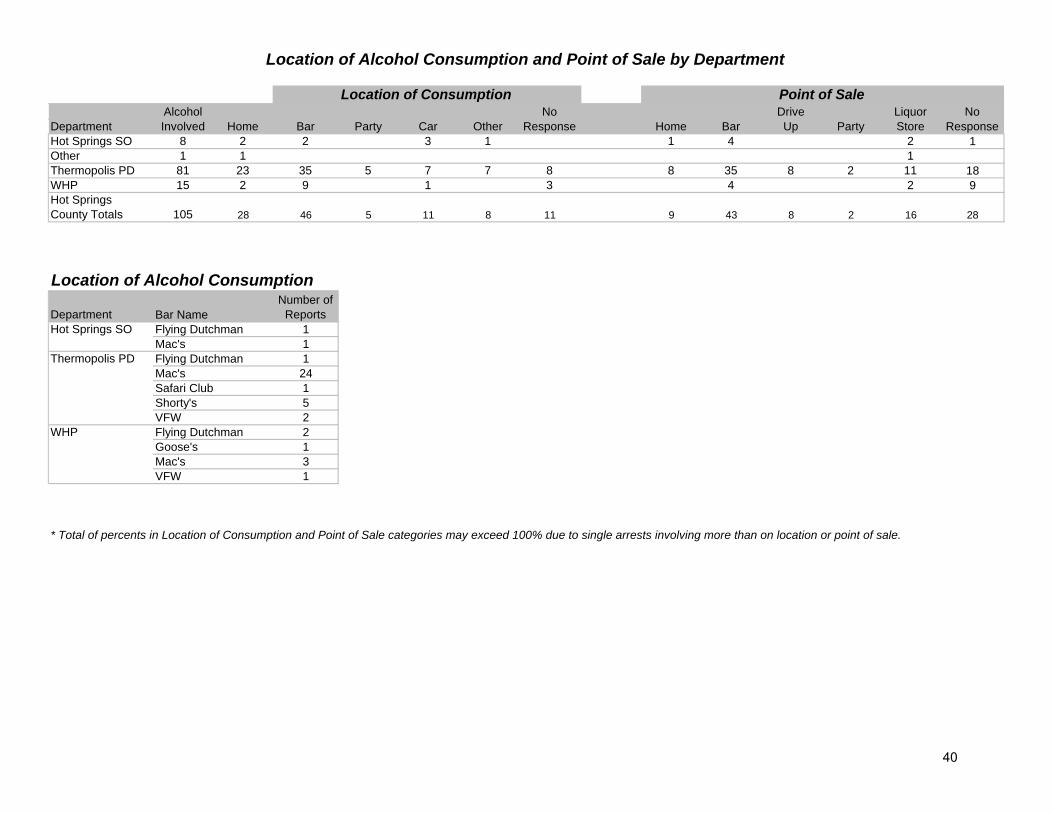
Location of Alcohol Consumption and Point of Sale by Department
Location of Consumption Point of SaleAlcohol No Drive Liquor No
Department Involved Home Bar Party Car Other Response Home Bar Up Party Store ResponseHot Springs SO 8 2 2 3 1 1 4 2 1Other 1 1 1Thermopolis PD 81 23 35 5 7 7 8 8 35 8 2 11 18WHP 15 2 9 1 3 4 2 9
Location of Consumption Point of Sale
Hot Springs County Totals 105 28 46 5 11 8 11 9 43 8 2 16 28
Location of Alcohol ConsumptionLocation of Alcohol Consumption
DepartmentNumber of
ReportsHot Springs SO Flying Dutchman 1
Mac's 1Thermopolis PD Flying Dutchman 1
Mac's 24
Bar Name
Safari Club 1Shorty's 5VFW 2
WHP Flying Dutchman 2Goose's 1Mac's 3VFW 1VFW 1
* Total of percents in Location of Consumption and Point of Sale categories may exceed 100% due to single arrests involving more than on location or point of sale.
40

Numbers by Department
CountyTotal
OffensesMisde-meanor Felony
Domestic Violence
Resist Arrest Assault
Public Intox
Alcohol Involved
Traffic Crash Female Male
Unknown Gender
Average Ave
Johnson County 163 137 12 4 0 3 15 103 8 24 138 1 34.38Buffalo PD 50 40 1 3 12 36 2 8 41 1 33.86DCI 1 1 1 21.00Johnson SO 86 73 9 2 2 49 3 12 74 35.25Kaycee PD 4 4 1 1 1 3 1 3 47.00VA Police 1 1 1 1 45.00WHP 21 19 1 14 3 3 18 30.93
Percents by Department *
CountyTotal
OffensesMisde-meanor Felony
Domestic Violence
Resist Arrest Assault
Public Intox
Alcohol Involved
Traffic Crash Female Male
Unkown Gender
Johnson County 163 84.05% 7.36% 2.45% 0.00% 1.84% 9.20% 63.19% 4.91% 14.72% 84.66% 0.61%Buffalo PD 50 80.00% 2.00% 6.00% 24.00% 72.00% 4.00% 16.00% 82.00% 2.00%DCI 1 100.00% 100.00%Johnson SO 86 84.88% 10.47% 2.33% 2.33% 56.98% 3.49% 13.95% 86.05%Kaycee PD 4 100.00% 25.00% 25.00% 25.00% 75.00% 25.00% 75.00%VA Police 1 100.00% 100.00% 100.00%WHP 21 90.48% 4.76% 66.67% 14.29% 14.29% 85.71%
* Total percents may not equal 100 due to lack of information, or a single arrest involving multiple crimes.
Johnson County ArrestsApril 1, 2007 - September 30, 2007
Johnson County ArrestsApril 1, 2007 - September 30, 2007
41
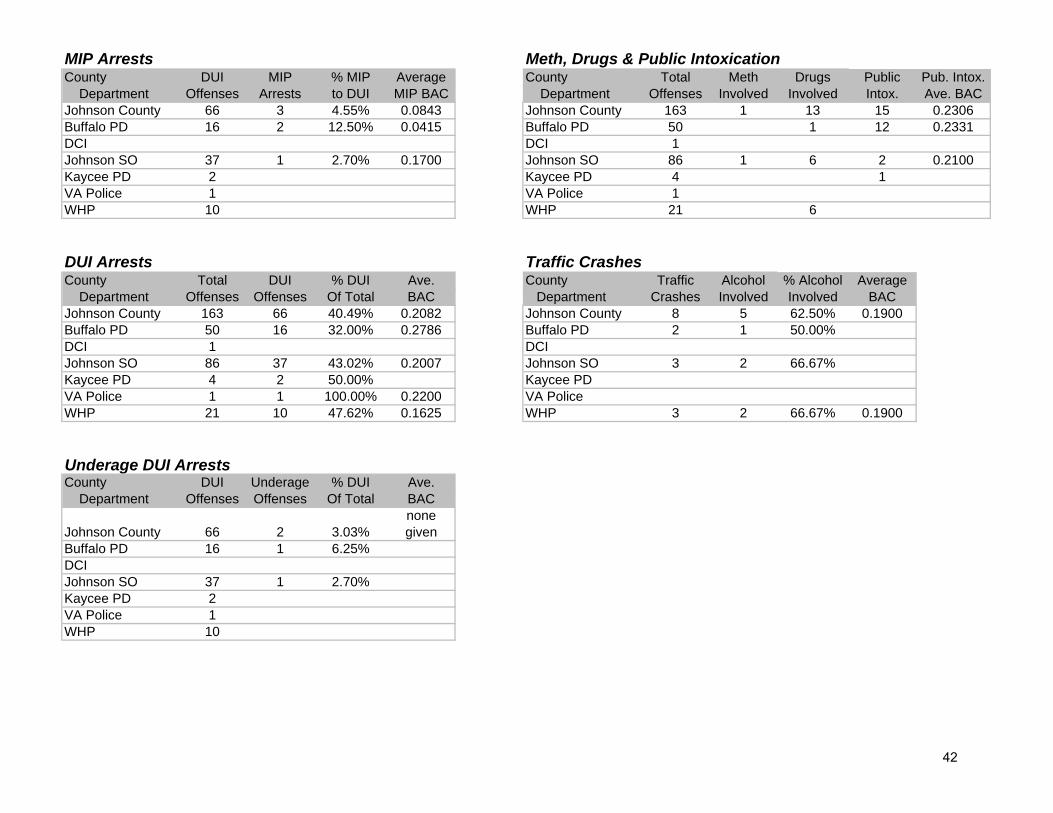
MIP Arrests Meth, Drugs & Public IntoxicationCounty DUI MIP % MIP Average County Total Meth Drugs Public Pub. Intox. Department Offenses Arrests to DUI MIP BAC Department Offenses Involved Involved Intox. Ave. BACJohnson County 66 3 4.55% 0.0843 Johnson County 163 1 13 15 0.2306Buffalo PD 16 2 12.50% 0.0415 Buffalo PD 50 1 12 0.2331DCI DCI 1Johnson SO 37 1 2.70% 0.1700 Johnson SO 86 1 6 2 0.2100Kaycee PD 2 Kaycee PD 4 1VA Police 1 VA Police 1WHP 10 WHP 21 6
DUI Arrests Traffic CrashesCounty Total DUI % DUI Ave. County Traffic Alcohol % Alcohol Average Department Offenses Offenses Of Total BAC Department Crashes Involved Involved BACJohnson County 163 66 40.49% 0.2082 Johnson County 8 5 62.50% 0.1900Buffalo PD 50 16 32.00% 0.2786 Buffalo PD 2 1 50.00%DCI 1 DCIJohnson SO 86 37 43.02% 0.2007 Johnson SO 3 2 66.67%Kaycee PD 4 2 50.00% Kaycee PDVA Police 1 1 100.00% 0.2200 VA PoliceWHP 21 10 47.62% 0.1625 WHP 3 2 66.67% 0.1900
Underage DUI ArrestsCounty DUI Underage % DUI Ave. Department Offenses Offenses Of Total BAC
Johnson County 66 2 3.03%none given
Buffalo PD 16 1 6.25%DCIJohnson SO 37 1 2.70%Kaycee PD 2VA Police 1WHP 10
42

Total Offenses-Alcohol Involvement Domestic Violence-Alcohol Involvement
County TotalNumber Involving Percent of Total County
Domestic Violence
Number Involving
Percent of Domestic Violence OffensesCounty Total Involving Percent of Total County Violence Involving Violence Offenses
Department Offenses Alcohol Involving Alcohol Department Offenses Alcohol Involving AlcoholJohnson County 163 103 63.19% Johnson County 4 2 50.00%Buffalo PD 50 36 72.00% Buffalo PD 3 2 66.67%DCI 1 DCIJohnson SO 86 49 56.98% Johnson SOK PD 4 3 75 00% K PD 1Kaycee PD 4 3 75.00% Kaycee PD 1VA Police 1 1 100.00% VA PoliceWHP 21 14 66.67% WHP
Felony Offenses-Alcohol Involvement Resisting Arrest-Alcohol Involvement
County FelonyNumber Involving
Percent of Felony Offenses Involving County
Resisting Arrest
Number Involving
Percent of Resisting Arrest Offenses
Department Offenses Alcohol Alcohol Department Offenses Alcohol Involving AlcoholJohnson County 12 4 33.33% Johnson County 0 0Buffalo PD 1 1 100 00% Buffalo PDBuffalo PD 1 1 100.00% Buffalo PDDCI 1 DCIJohnson SO 9 2 22.22% Johnson SOKaycee PD Kaycee PDVA Police VA PoliceWHP 1 1 100.00% WHP
Misdemeanor Offenses-Alcohol Involvement Assault-Alcohol Involvement
Misde- Number Percent of
Misdemeanor Number Percent of Assault County meanor Involving Offenses County Assault Involving Offenses Department Offenses Alcohol Alcohol Department Offenses Alcohol Involving AlcoholJohnson County 137 91 66.42% Johnson County 3 2 66.67%Buffalo PD 40 28 70.00% Buffalo PDDCI DCIJohnson SO 73 46 63 01% Johnson SO 2 2 100 00%Johnson SO 73 46 63.01% Johnson SO 2 2 100.00%Kaycee PD 4 3 75.00% Kaycee PD 1VA Police 1 1 100.00% VA PoliceWHP 19 13 68.42% WHP
43
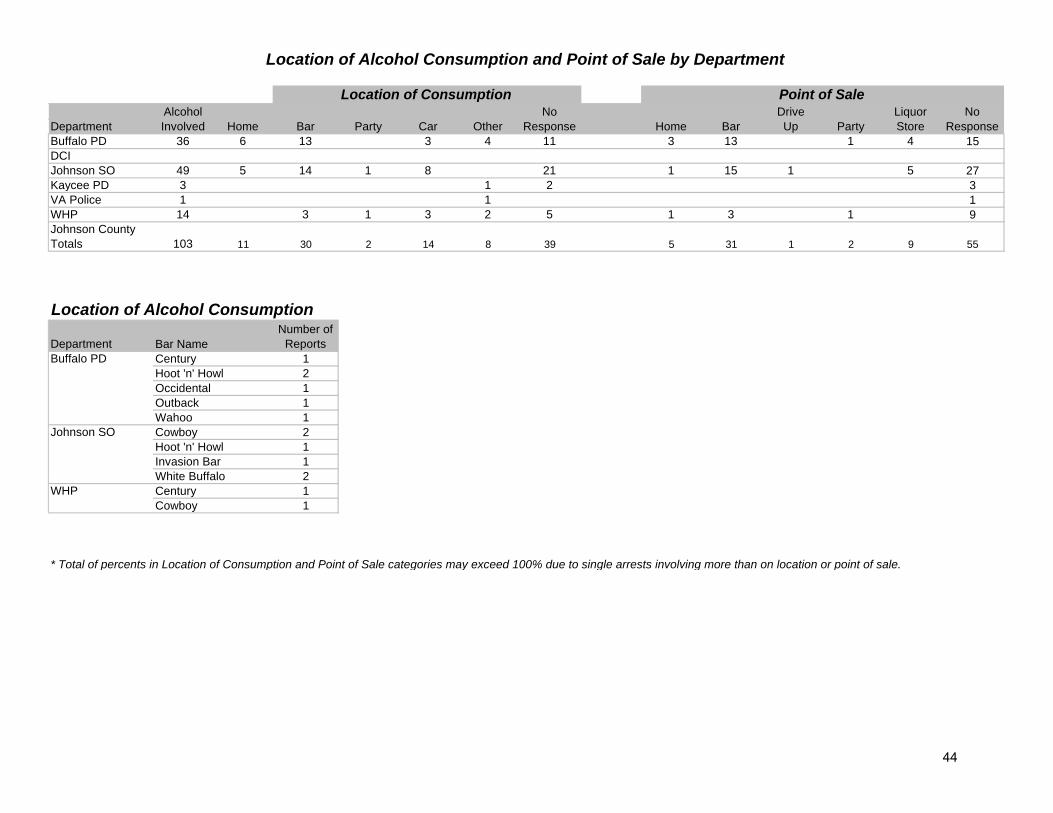
Location of Alcohol Consumption and Point of Sale by Department
Location of Consumption Point of SaleAlcohol No Drive Liquor No
Department Involved Home Bar Party Car Other Response Home Bar Up Party Store ResponseBuffalo PD 36 6 13 3 4 11 3 13 1 4 15DCIJohnson SO 49 5 14 1 8 21 1 15 1 5 27Kaycee PD 3 1 2 3
Location of Consumption Point of Sale
yVA Police 1 1 1WHP 14 3 1 3 2 5 1 3 1 9Johnson County Totals 103 11 30 2 14 8 39 5 31 1 2 9 55
Location of Alcohol Consumption
DepartmentNumber of
ReportsBuffalo PD Century 1
Hoot 'n' Howl 2
Bar Name
Occidental 1Outback 1Wahoo 1
Johnson SO Cowboy 2Hoot 'n' Howl 1Invasion Bar 1White Buffalo 2White Buffalo 2
WHP Century 1Cowboy 1
* Total of percents in Location of Consumption and Point of Sale categories may exceed 100% due to single arrests involving more than on location or point of sale.p p g y g g p
44
Numbers by Department
CountyTotal
OffensesMisde-meanor Felony
Domestic Violence
Resist Arrest Assault
Public Intox
Alcohol Involved
Traffic Crash Female Male
Unknown Gender
Average Ave
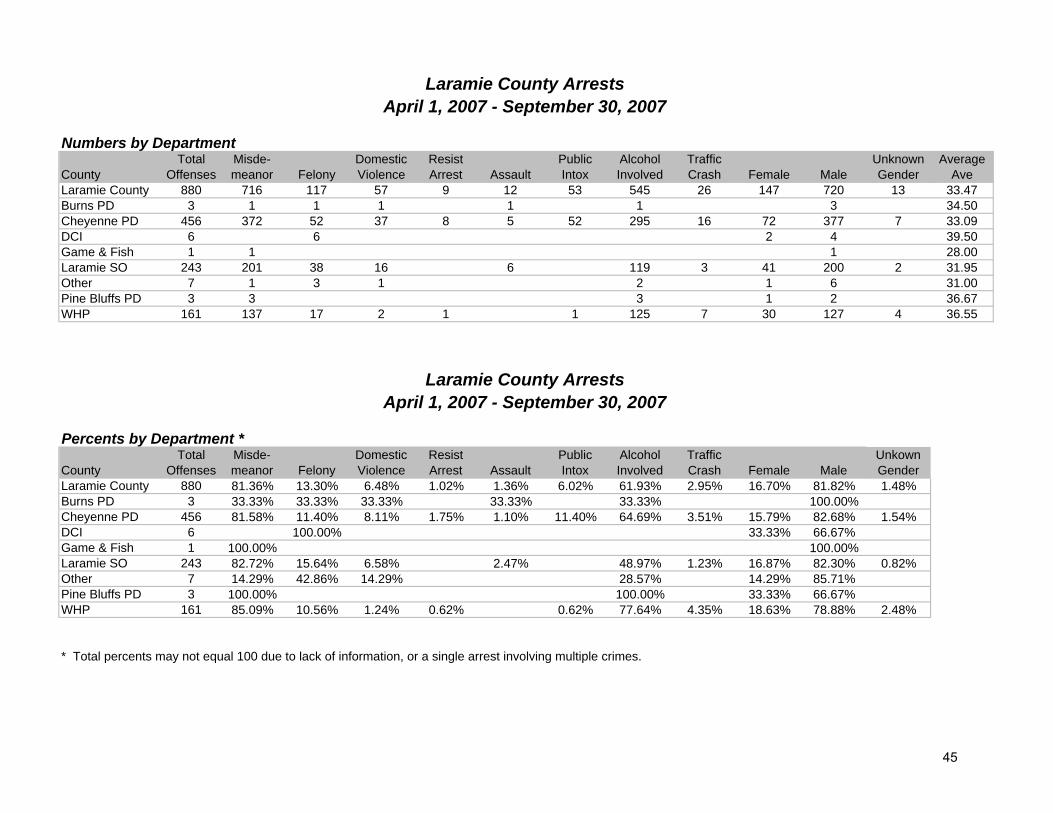
Laramie County 880 716 117 57 9 12 53 545 26 147 720 13 33.47Burns PD 3 1 1 1 1 1 3 34.50Cheyenne PD 456 372 52 37 8 5 52 295 16 72 377 7 33.09DCI 6 6 2 4 39.50Game & Fish 1 1 1 28.00Laramie SO 243 201 38 16 6 119 3 41 200 2 31.95Other 7 1 3 1 2 1 6 31.00Pine Bluffs PD 3 3 3 1 2 36.67WHP 161 137 17 2 1 1 125 7 30 127 4 36.55
Percents by Department *
CountyTotal
OffensesMisde-meanor Felony
Domestic Violence
Resist Arrest Assault
Public Intox
Alcohol Involved
Traffic Crash Female Male
Unkown Gender
Laramie County 880 81.36% 13.30% 6.48% 1.02% 1.36% 6.02% 61.93% 2.95% 16.70% 81.82% 1.48%Burns PD 3 33.33% 33.33% 33.33% 33.33% 33.33% 100.00%Cheyenne PD 456 81.58% 11.40% 8.11% 1.75% 1.10% 11.40% 64.69% 3.51% 15.79% 82.68% 1.54%DCI 6 100.00% 33.33% 66.67%Game & Fish 1 100.00% 100.00%Laramie SO 243 82.72% 15.64% 6.58% 2.47% 48.97% 1.23% 16.87% 82.30% 0.82%Other 7 14.29% 42.86% 14.29% 28.57% 14.29% 85.71%Pine Bluffs PD 3 100.00% 100.00% 33.33% 66.67%WHP 161 85.09% 10.56% 1.24% 0.62% 0.62% 77.64% 4.35% 18.63% 78.88% 2.48%
* Total percents may not equal 100 due to lack of information, or a single arrest involving multiple crimes.
Laramie County ArrestsApril 1, 2007 - September 30, 2007
Laramie County ArrestsApril 1, 2007 - September 30, 2007
45

MIP Arrests Meth, Drugs & Public IntoxicationCounty DUI MIP % MIP Average County Total Meth Drugs Public Pub. Intox. Department Offenses Arrests to DUI MIP BAC Department Offenses Involved Involved Intox. Ave. BACLaramie County 230 11 4.78% 0.1518 Laramie County 880 19 70 53 0.2500Burns PD Burns PD 3Cheyenne PD 77 6 7.79% 0.1764 Cheyenne PD 456 4 23 52 0.2500DCI DCI 6 3 3Game & Fish Game & Fish 1Laramie SO 63 4 6.35% 0.1288 Laramie SO 243 9 23Other Other 7 1Pine Bluffs PD Pine Bluffs PD 3WHP 90 1 1.11% 0.1210 WHP 161 3 20 1
DUI Arrests Traffic CrashesCounty Total DUI % DUI Ave. County Traffic Alcohol % Alcohol Average Department Offenses Offenses Of Total BAC Department Crashes Involved Involved BACLaramie County 880 230 26.14% 0.1625 Laramie County 26 22 84.62% 0.1451Burns PD 3 Burns PDCheyenne PD 456 77 16.89% 0.1660 Cheyenne PD 16 15 93.75% 0.1163DCI 6 DCIGame & Fish 1 Game & FishLaramie SO 243 63 25.93% 0.1510 Laramie SO 3 2 66.67% 0.2110Other 7 OtherPine Bluffs PD 3 Pine Bluffs PDWHP 161 90 55.90% 0.1701 WHP 7 7 100.00% 0.1700
Underage DUI ArrestsCounty DUI Underage % DUI Ave. Department Offenses Offenses Of Total BACLaramie County 230 16 6.96% 0.1319Burns PDCheyenne PD 77 8 10.39% 0.1393DCIGame & FishLaramie SO 63 6 9.52% 0.1300OtherPine Bluffs PDWHP 90 2 2.22% 0.1100
46
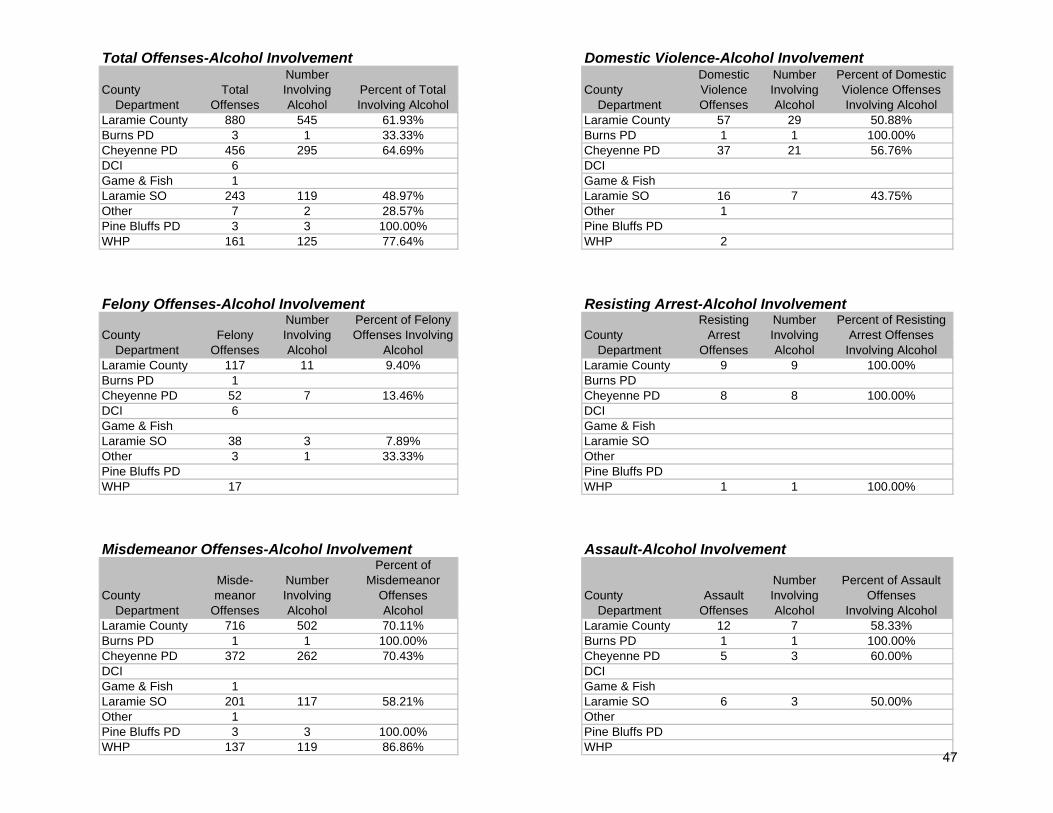
Total Offenses-Alcohol Involvement Domestic Violence-Alcohol Involvement
County TotalNumber Involving Percent of Total County
Domestic Violence
Number Involving
Percent of Domestic Violence Offenses
Department Offenses Alcohol Involving Alcohol Department Offenses Alcohol Involving AlcoholLaramie County 880 545 61.93% Laramie County 57 29 50.88%Burns PD 3 1 33.33% Burns PD 1 1 100.00%Cheyenne PD 456 295 64.69% Cheyenne PD 37 21 56.76%DCI 6 DCIGame & Fish 1 Game & FishLaramie SO 243 119 48.97% Laramie SO 16 7 43.75%Other 7 2 28.57% Other 1Pine Bluffs PD 3 3 100.00% Pine Bluffs PDWHP 161 125 77.64% WHP 2
Felony Offenses-Alcohol Involvement Resisting Arrest-Alcohol Involvement
County FelonyNumber Involving
Percent of Felony Offenses Involving County
Resisting Arrest
Number Involving
Percent of Resisting Arrest Offenses
Department Offenses Alcohol Alcohol Department Offenses Alcohol Involving AlcoholLaramie County 117 11 9.40% Laramie County 9 9 100.00%Burns PD 1 Burns PDCheyenne PD 52 7 13.46% Cheyenne PD 8 8 100.00%DCI 6 DCIGame & Fish Game & FishLaramie SO 38 3 7.89% Laramie SOOther 3 1 33.33% OtherPine Bluffs PD Pine Bluffs PDWHP 17 WHP 1 1 100.00%
Misdemeanor Offenses-Alcohol Involvement Assault-Alcohol Involvement
CountyMisde-meanor
Number Involving
Percent of Misdemeanor
Offenses County AssaultNumber Involving
Percent of Assault Offenses
Department Offenses Alcohol Alcohol Department Offenses Alcohol Involving AlcoholLaramie County 716 502 70.11% Laramie County 12 7 58.33%Burns PD 1 1 100.00% Burns PD 1 1 100.00%Cheyenne PD 372 262 70.43% Cheyenne PD 5 3 60.00%DCI DCIGame & Fish 1 Game & FishLaramie SO 201 117 58.21% Laramie SO 6 3 50.00%Other 1 OtherPine Bluffs PD 3 3 100.00% Pine Bluffs PDWHP 137 119 86.86% WHP
47
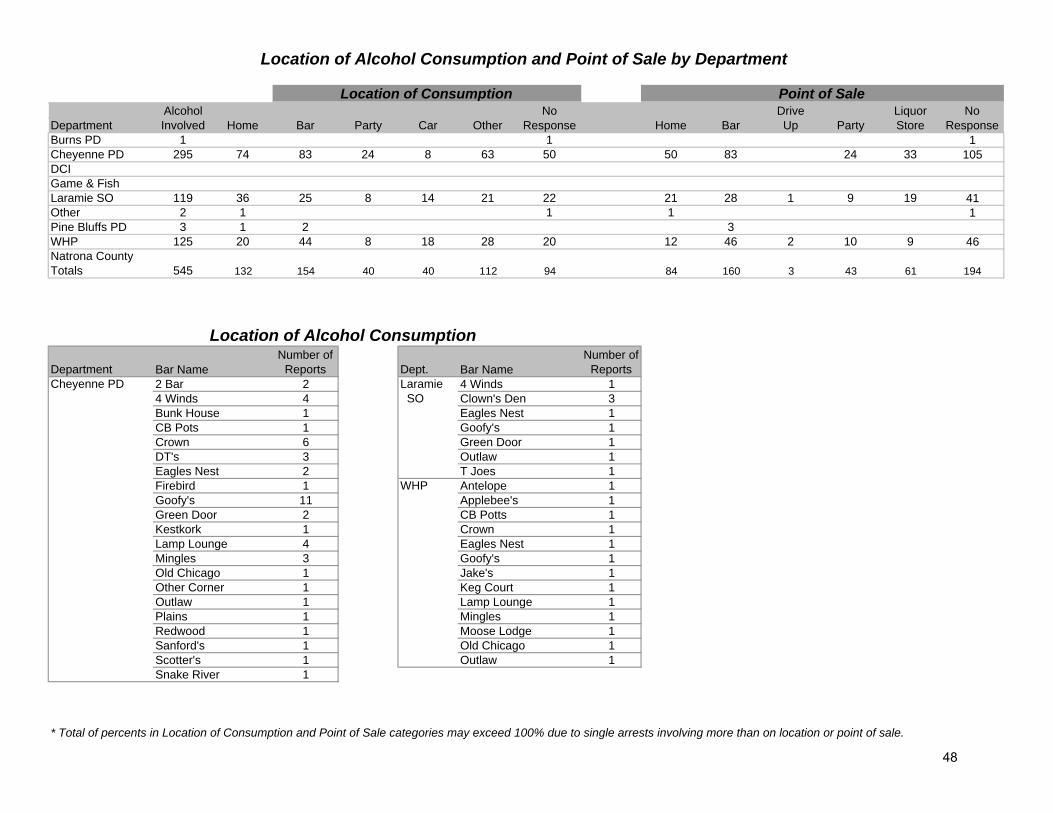
Alcohol No Drive Liquor No Department Involved Home Bar Party Car Other Response Home Bar Up Party Store ResponseBurns PD 1 1 1Cheyenne PD 295 74 83 24 8 63 50 50 83 24 33 105DCIGame & FishLaramie SO 119 36 25 8 14 21 22 21 28 1 9 19 41Other 2 1 1 1 1Pine Bluffs PD 3 1 2 3WHP 125 20 44 8 18 28 20 12 46 2 10 9 46Natrona County Totals 545 132 154 40 40 112 94 84 160 3 43 61 194
DepartmentNumber of
Reports Dept.Number of
ReportsCheyenne PD 2 Bar 2 Laramie 4 Winds 1
4 Winds 4 SO Clown's Den 3Bunk House 1 Eagles Nest 1CB Pots 1 Goofy's 1Crown 6 Green Door 1DT's 3 Outlaw 1Eagles Nest 2 T Joes 1Firebird 1 WHP Antelope 1Goofy's 11 Applebee's 1Green Door 2 CB Potts 1Kestkork 1 Crown 1Lamp Lounge 4 Eagles Nest 1Mingles 3 Goofy's 1Old Chicago 1 Jake's 1Other Corner 1 Keg Court 1Outlaw 1 Lamp Lounge 1Plains 1 Mingles 1Redwood 1 Moose Lodge 1Sanford's 1 Old Chicago 1Scotter's 1 Outlaw 1Snake River 1
* Total of percents in Location of Consumption and Point of Sale categories may exceed 100% due to single arrests involving more than on location or point of sale.
Location of Alcohol Consumption and Point of Sale by Department
Location of Consumption Point of Sale
Bar Name Bar Name
Location of Alcohol Consumption
48

Numbers by Department
CountyTotal
OffensesMisde-meanor Felony
Domestic Violence
Resist Arrest Assault
Public Intox
Alcohol Involved
Traffic Crash Female Male
Unknown Gender
Average Ave
Lincoln County 190 159 18 13 4 5 10 128 15 32 158 0 31.83Afton PD 14 14 2 1 5 5 9 28.62Alpine PD 5 2 2 1 1 2 1 4 39.20Cokeville PD 6 3 2 1 5 1 5 32.00Diamondville PD 18 14 2 1 14 2 16 29.24Kemmerer PD 33 24 3 4 2 3 8 28 4 5 28 28.03La Barge PD 2 2 2 1 2 33.50Lincoln SO 83 75 7 3 1 1 53 10 14 69 32.67Thayne PD 1 1 1 1 55.00WHP 28 24 4 1 18 4 24 34.67
Percents by Department *
CountyTotal
OffensesMisde-meanor Felony
Domestic Violence
Resist Arrest Assault
Public Intox
Alcohol Involved
Traffic Crash Female Male
Unkown Gender
Lincoln County 190 83.68% 9.47% 6.84% 2.11% 2.63% 5.26% 67.37% 7.89% 16.84% 83.16% 0.00%Afton PD 14 100.00% 14.29% 7.14% 35.71% 35.71% 64.29%Alpine PD 5 40.00% 40.00% 20.00% 20.00% 40.00% 20.00% 80.00%Cokeville PD 6 50.00% 33.33% 16.67% 83.33% 16.67% 83.33%Diamondville PD 18 77.78% 11.11% 5.56% 77.78% 11.11% 88.89%Kemmerer PD 33 72.73% 9.09% 12.12% 6.06% 9.09% 24.24% 84.85% 12.12% 15.15% 84.85%La Barge PD 2 100.00% 100.00% 50.00% 100.00%Lincoln SO 83 90.36% 8.43% 3.61% 1.20% 1.20% 63.86% 12.05% 16.87% 83.13%Thayne PD 1 100.00% 100.00% 100.00%WHP 28 85.71% 14.29% 3.57% 64.29% 14.29% 85.71%
* Total percents may not equal 100 due to lack of information, or a single arrest involving multiple crimes.
Lincoln County ArrestsApril 1, 2007 - September 30, 2007
Lincoln County ArrestsApril 1, 2007 - September 30, 2007
49
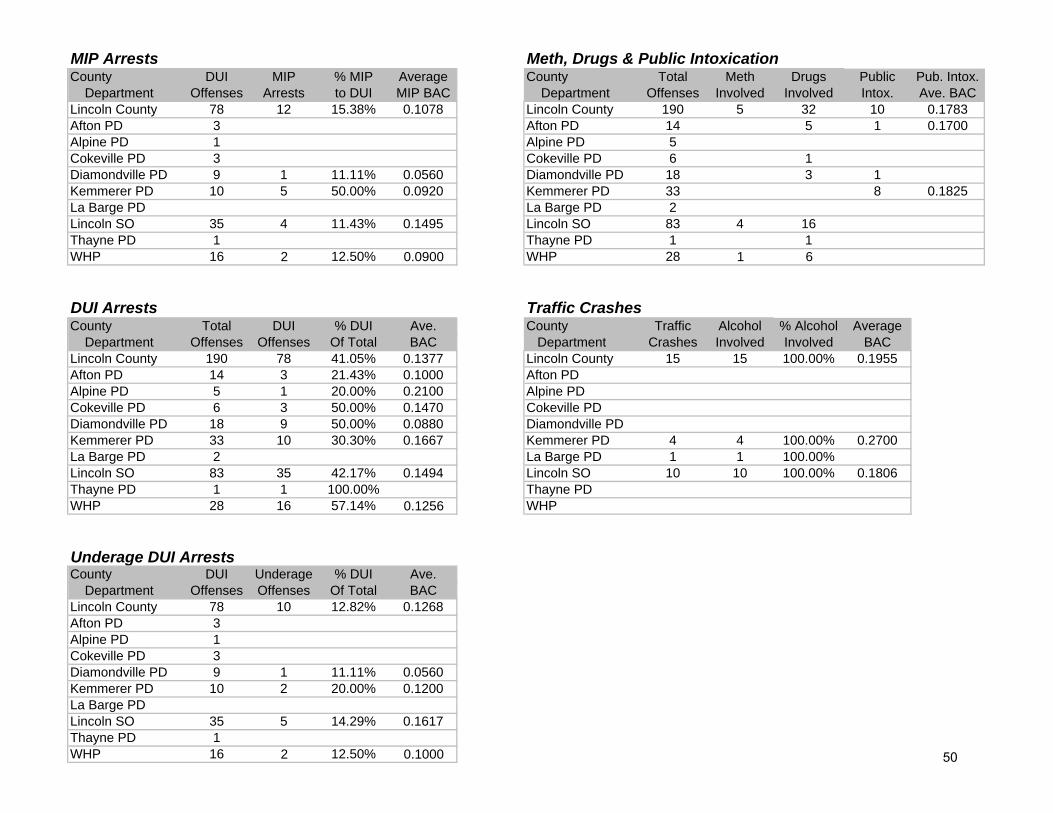
MIP Arrests Meth, Drugs & Public IntoxicationCounty DUI MIP % MIP Average County Total Meth Drugs Public Pub. Intox. Department Offenses Arrests to DUI MIP BAC Department Offenses Involved Involved Intox. Ave. BACLincoln County 78 12 15.38% 0.1078 Lincoln County 190 5 32 10 0.1783Afton PD 3 Afton PD 14 5 1 0.1700Alpine PD 1 Alpine PD 5Cokeville PD 3 Cokeville PD 6 1Diamondville PD 9 1 11.11% 0.0560 Diamondville PD 18 3 1Kemmerer PD 10 5 50.00% 0.0920 Kemmerer PD 33 8 0.1825La Barge PD La Barge PD 2Lincoln SO 35 4 11.43% 0.1495 Lincoln SO 83 4 16Thayne PD 1 Thayne PD 1 1WHP 16 2 12.50% 0.0900 WHP 28 1 6
DUI Arrests Traffic CrashesCounty Total DUI % DUI Ave. County Traffic Alcohol % Alcohol Average Department Offenses Offenses Of Total BAC Department Crashes Involved Involved BACLincoln County 190 78 41.05% 0.1377 Lincoln County 15 15 100.00% 0.1955Afton PD 14 3 21.43% 0.1000 Afton PDAlpine PD 5 1 20.00% 0.2100 Alpine PDCokeville PD 6 3 50.00% 0.1470 Cokeville PDDiamondville PD 18 9 50.00% 0.0880 Diamondville PDKemmerer PD 33 10 30.30% 0.1667 Kemmerer PD 4 4 100.00% 0.2700La Barge PD 2 La Barge PD 1 1 100.00%Lincoln SO 83 35 42.17% 0.1494 Lincoln SO 10 10 100.00% 0.1806Thayne PD 1 1 100.00% Thayne PDWHP 28 16 57.14% 0.1256 WHP
Underage DUI ArrestsCounty DUI Underage % DUI Ave. Department Offenses Offenses Of Total BACLincoln County 78 10 12.82% 0.1268Afton PD 3Alpine PD 1Cokeville PD 3Diamondville PD 9 1 11.11% 0.0560Kemmerer PD 10 2 20.00% 0.1200La Barge PDLincoln SO 35 5 14.29% 0.1617Thayne PD 1WHP 16 2 12.50% 0.1000 50

Total Offenses-Alcohol Involvement Domestic Violence-Alcohol Involvement
County TotalNumber Involving Percent of Total County
Domestic Violence
Number Involving
Percent of Domestic Violence Offenses
Department Offenses Alcohol Involving Alcohol Department Offenses Alcohol Involving AlcoholLincoln County 190 128 67.37% Lincoln County 13 8 61.54%Afton PD 14 5 35.71% Afton PD 2Alpine PD 5 2 40.00% Alpine PD 1 1 100.00%Cokeville PD 6 5 83.33% Cokeville PD 1 1 100.00%Diamondville PD 18 14 77.78% Diamondville PD 2 1 50.00%Kemmerer PD 33 28 84.85% Kemmerer PD 4 2 50.00%La Barge PD 2 2 100.00% La Barge PDLincoln SO 83 53 63.86% Lincoln SO 3 3 100.00%Thayne PD 1 1 100.00% Thayne PDWHP 28 18 64.29% WHP
Felony Offenses-Alcohol Involvement Resisting Arrest-Alcohol Involvement
County FelonyNumber Involving
Percent of Felony Offenses Involving County
Resisting Arrest
Number Involving
Percent of Resisting Arrest Offenses
Department Offenses Alcohol Alcohol Department Offenses Alcohol Involving AlcoholLincoln County 18 4 22.22% Lincoln County 4 4 100.00%Afton PD Afton PDAlpine PD 2 Alpine PDCokeville PD 2 1 50.00% Cokeville PDDiamondville PD Diamondville PDKemmerer PD 3 3 100.00% Kemmerer PD 2 2 100.00%La Barge PD La Barge PDLincoln SO 7 Lincoln SO 1 1 100.00%Thayne PD Thayne PDWHP 4 WHP 1 1 100.00%
Misdemeanor Offenses-Alcohol Involvement Assault-Alcohol Involvement
CountyMisde-meanor
Number Involving
Percent of Misdemeanor
Offenses County AssaultNumber Involving
Percent of Assault Offenses
Department Offenses Alcohol Alcohol Department Offenses Alcohol Involving AlcoholLincoln County 159 116 72.96% Lincoln County 5 4 80.00%Afton PD 14 5 35.71% Afton PDAlpine PD 2 2 100.00% Alpine PD 1 1 100.00%Cokeville PD 3 3 100.00% Cokeville PDDiamondville PD 14 12 85.71% Diamondville PDKemmerer PD 24 21 87.50% Kemmerer PD 3 3 100.00%La Barge PD 2 2 100.00% La Barge PDLincoln SO 75 52 69.33% Lincoln SO 1Thayne PD 1 1 100.00% Thayne PDWHP 24 18 75.00% WHP 51

Alcohol No Drive Liquor No Department Involved Home Bar Party Car Other Response Home Bar Up Party Store ResponseAfton PD 5 1 1 1 2 1 4Alpine PD 2 1 1 2Cokeville PD 5 2 1 1 1 3 1 1Diamondville PD 14 5 2 2 2 3 1 2 3 2 6Kemmerer PD 28 5 9 2 3 11 4 9 1 14La Barge PD 2 1 1 1 1Lincoln SO 53 11 10 2 7 2 21 5 13 2 2 31Thayne PD 1 1 1WHP 18 7 1 1 4 3 4 1 3 1 5 8Lincoln County Totals 128 32 24 7 15 11 43 12 33 0 8 11 64
Location of Alcohol Consumption
DepartmentNumber of
ReportsAlpine PD Tavern on the Green 1Cokeville PD Red Dog 1Kemmerer PD Stock Exchange 1Lincoln SO Bull Moose 1
Eagle 1Gridiron 1Location 1Stock Exchange 1Tavern on the Green 1
* Total of percents in Location of Consumption and Point of Sale categories may exceed 100% due to single arrests involving more than on location or point of sale.
Location of Alcohol Consumption and Point of Sale by Department
Location of Consumption Point of Sale
Bar Name
52

Numbers by Department
CountyTotal
OffensesMisde-meanor Felony
Domestic Violence
Resist Arrest Assault
Public Intox
Alcohol Involved
Traffic Crash Female Male
Unknown Gender
Average Ave
Natrona County 2389 2075 199 47 23 34 250 1230 69 583 1765 41 32.38Casper PD 1529 1338 126 39 15 28 213 823 45 377 1123 29 31.65DCI 8 4 4 1 1 3 5 29.00Evansville PD 105 93 4 1 2 1 10 49 2 33 70 2 32.53Game & Fish 6 5 6 1 6 39.00Midwest PD 2 1 1 1 1 32.50Mills PD 237 216 11 1 2 21 113 5 61 176 34.73Natrona SO 344 275 46 6 3 5 3 131 8 81 259 4 32.51Other 9 4 2 1 4 1 2 6 1 39.00State Parks 1 1 1 47.00USMS 1 1 1WHP 147 138 5 2 102 7 25 117 5 34.45
Percents by Department *
CountyTotal
OffensesMisde-meanor Felony
Domestic Violence
Resist Arrest Assault
Public Intox
Alcohol Involved
Traffic Crash Female Male
Unkown Gender
Natrona County 2389 86.86% 8.33% 1.97% 0.96% 1.42% 10.46% 51.49% 2.89% 24.40% 73.88% 1.72%Casper PD 1529 87.51% 8.24% 2.55% 0.98% 1.83% 13.93% 53.83% 2.94% 24.66% 73.45% 1.90%DCI 8 50.00% 50.00% 12.50% 12.50% 37.50% 62.50%Evansville PD 105 88.57% 3.81% 0.95% 1.90% 0.95% 9.52% 46.67% 1.90% 31.43% 66.67% 1.90%Game & Fish 6 83.33% 100.00% 16.67% 100.00%Midwest PD 2 50.00% 50.00% 50.00% 50.00%Mills PD 237 91.14% 4.64% 0.42% 0.84% 8.86% 47.68% 2.11% 25.74% 74.26%Natrona SO 344 79.94% 13.37% 1.74% 0.87% 1.45% 0.87% 38.08% 2.33% 23.55% 75.29% 1.16%Other 9 44.44% 22.22% 11.11% 44.44% 11.11% 22.22% 66.67% 11.11%State Parks 1 100.00% 100.00%USMS 1 100.00% 100.00%WHP 147 93.88% 3.40% 1.36% 69.39% 4.76% 17.01% 79.59% 3.40%
* Total percents may not equal 100 due to lack of information, or a single arrest involving multiple crimes.
Natrona County ArrestsApril 1, 2007 - September 30, 2007
Natrona County ArrestsApril 1, 2007 - September 30, 2007
53

MIP Arrests Meth, Drugs & Public IntoxicationCounty DUI MIP % MIP Average County Total Meth Drugs Public Pub. Intox. Department Offenses Arrests to DUI MIP BAC Department Offenses Involved Involved Intox. Ave. BACNatrona County 381 37 9.71% 0.1048 Natrona County 2389 54 173 250 0.1851Casper PD 214 29 13.55% 0.1050 Casper PD 1529 19 92 213 0.2073DCI DCI 8 3 5Evansville PD 10 3 30.00% 0.1300 Evansville PD 105 4 6 10 0.2100Game & Fish 2 Game & Fish 6Midwest PD Midwest PD 2Mills PD 38 Mills PD 237 18 33 21 0.0967Natrona SO 54 2 3.70% Natrona SO 344 8 25 3 0.1590Other 1 Other 9 1 1 1State Parks State Parks 1USMS USMS 1WHP 62 3 4.84% 0.0500 WHP 147 1 11 2
DUI Arrests Traffic CrashesCounty Total DUI % DUI Ave. County Traffic Alcohol % Alcohol Average Department Offenses Offenses Of Total BAC Department Crashes Involved Involved BACNatrona County 2389 381 15.95% 0.1475 Natrona County 69 51 73.91% 0.1354Casper PD 1529 214 14.00% 0.1528 Casper PD 45 32 71.11% 0.1438DCI 8 DCIEvansville PD 105 10 9.52% 0.1603 Evansville PD 2 2 100.00%Game & Fish 6 2 33.33% 0.2000 Game & Fish 1 1 100.00%Midwest PD 2 Midwest PDMills PD 237 38 16.03% 0.1170 Mills PD 5 4 80.00% 0.1100Natrona SO 344 54 15.70% 0.1584 Natrona SO 8 6 75.00%Other 9 1 11.11% Other 1 1 100.00%State Parks 1 State ParksUSMS 1 USMSWHP 147 62 42.18% 0.1342 WHP 7 5 71.43%
Underage DUI ArrestsCounty DUI Underage % DUI Ave. Department Offenses Offenses Of Total BACNatrona County 381 35 9.19% 0.1294Casper PD 214 26 12.15% 0.1401DCIEvansville PD 10 1 10.00%Game & Fish 2Midwest PDMills PD 38 3 7.89% 0.1100Natrona SO 54 1 1.85%Other 1State ParksUSMSWHP 62 4 6.45% 0.1067 54

Total Offenses-Alcohol Involvement Domestic Violence-Alcohol Involvement
County TotalNumber Involving Percent of Total County
Domestic Violence
Number Involving
Percent of Domestic Violence Offenses
Department Offenses Alcohol Involving Alcohol Department Offenses Alcohol Involving AlcoholNatrona County 2389 1230 51.49% Natrona County 47 27 57.45%Casper PD 1529 823 53.83% Casper PD 39 24 61.54%DCI 8 1 12.50% DCIEvansville PD 105 49 46.67% Evansville PD 1Game & Fish 6 6 100.00% Game & FishMidwest PD 2 1 50.00% Midwest PDMills PD 237 113 47.68% Mills PD 1 1 100.00%Natrona SO 344 131 38.08% Natrona SO 6 2 33.33%Other 9 4 44.44% OtherState Parks 1 State ParksUSMS 1 USMSWHP 147 102 69.39% WHP
Felony Offenses-Alcohol Involvement Resisting Arrest-Alcohol Involvement
County FelonyNumber Involving
Percent of Felony Offenses Involving County
Resisting Arrest
Number Involving
Percent of Resisting Arrest Offenses
Department Offenses Alcohol Alcohol Department Offenses Alcohol Involving AlcoholNatrona County 199 51 25.63% Natrona County 23 20 86.96%Casper PD 126 41 32.54% Casper PD 15 13 86.67%DCI 4 1 25.00% DCI 1Evansville PD 4 2 50.00% Evansville PD 2 2 100.00%Game & Fish Game & FishMidwest PD Midwest PDMills PD 11 1 9.09% Mills PD 2 2 100.00%Natrona SO 46 5 10.87% Natrona SO 3 3 100.00%Other 2 OtherState Parks State ParksUSMS 1 USMSWHP 5 1 20.00% WHP
Misdemeanor Offenses-Alcohol Involvement Assault-Alcohol Involvement
CountyMisde-meanor
Number Involving
Percent of Misdemeanor
Offenses County AssaultNumber Involving
Percent of Assault Offenses
Department Offenses Alcohol Alcohol Department Offenses Alcohol Involving AlcoholNatrona County 2075 1120 53.98% Natrona County 34 22 64.71%Casper PD 1338 743 55.53% Casper PD 28 19 67.86%DCI 4 DCIEvansville PD 93 44 47.31% Evansville PD 1 1 100.00%Game & Fish 5 5 100.00% Game & FishMidwest PD 1 1 100.00% Midwest PDMills PD 216 105 48.61% Mills PDNatrona SO 275 122 44.36% Natrona SO 5 2 40.00%Other 4 3 75.00% OtherState Parks 1 State ParksUSMS USMSWHP 138 97 70.29% WHP
55

Alcohol No Drive Liquor No Department Involved Home Bar Party Car Other Response Home Bar Up Party Store ResponseCasper PD 823 209 221 56 27 84 240 122 226 9 36 64 376DCI 1 1 1Evansville PD 49 12 15 2 3 4 15 5 10 2 32Game & Fish 6 6 6Midwest PD 1 1 1Mills PD 113 23 51 3 5 5 27 7 40 2 1 7 56Natrona SO 131 35 38 15 10 8 28 17 40 9 11 5 50Other 4 1 2 4 1 1 4 1 1 3State ParksUSMSWHP 102 24 35 7 18 7 12 16 31 8 4 10 34Natrona County Totals 1230 304 362 83 63 112 331 168 351 29 54 87 559
DepartmentNumber of
Reports Dept.Number of
Reports Dept.Number of
ReportsCasper PD Alibi 10 Evansville Avalon 1 Natrona Airport Bar 2
American Legion 1 PD Butch's 5 SO Beacon 3Beacon 2 Cowboys 1 Cowboys 6Butch's 11 Sidelines 1 Horseshoe 1CY Resort 1 Taylor's 3 Lazy 8 1Eagles 3 Mills PD Avalon 1 PJ Schooner Bar 1El Marko 1 Baja 1 Sandbar 1FireRock 1 Bayou 1 Sidelines 1Fireside 1 Beacon 12 Sunset 2Johnny O's 2 Cowboys 2 TJs 1Moonlight 12 Eagles 1 Other Horseshoe 1Off-Track Betting 1 Hidaway 3 WHP Avalon 1Old Chicago's 2 Horseshoe 1 Butch's 3Outback 2 Northern Dreams 1 Chatters 1Poplar Wine 1 Old Chicago's 1 Cowboys 2PV Liquor 1 OT 3 Eagles 1Sandbar 17 PV Liquor 1 Horseshoe 2Sidelines 18 Sandbar 2 Moonlight 1TJ's Bar 1 Sidelines 1 North 40 2VFW 1 VFW 1 OT 1Wonder Bar 7 Sidelines 2
Sunset 2
* Total of percents in Location of Consumption and Point of Sale categories may exceed 100% due to single arrests involving more than on location or point of sale.
Location of Alcohol Consumption and Point of Sale by Department
Bar Name
Point of SaleLocation of Consumption
Bar Name Bar Name
Location of Alcohol Consumption
56

Numbers by Department
CountyTotal
OffensesMisde-meanor Felony
Domestic Violence
Resist Arrest Assault
Public Intox
Alcohol Involved
Traffic Crash Female Male
Unknown Gender
Average Ave
Niobrara County 13 9 1 1 2 1 1 12 0 3 10 0 35.31Lusk PD 7 3 1 1 1 1 1 6 3 4 31.29Niobrara SO 2 2 1 2 2 39.00WHP 4 4 4 4 40.50
Percents by Department *
CountyTotal
OffensesMisde-meanor Felony
Domestic Violence
Resist Arrest Assault
Public Intox
Alcohol Involved
Traffic Crash Female Male
Unkown Gender
Niobrara County 13 69.23% 7.69% 7.69% 15.38% 7.69% 7.69% 92.31% 0.00% 23.08% 76.92%Lusk PD 7 42.86% 14.29% 14.29% 14.29% 14.29% 14.29% 85.71% 42.86% 57.14%Niobrara SO 2 100.00% 50.00% 100.00% 100.00%WHP 4 100.00% 100.00% 100.00%
* Total percents may not equal 100 due to lack of information, or a single arrest involving multiple crimes.
Niobrara County ArrestsApril 1, 2007 - September 30, 2007
Niobrara County ArrestsApril 1, 2007 - September 30, 2007
57

MIP Arrests Meth, Drugs & Public IntoxicationCounty DUI MIP % MIP Average County Total Meth Drugs Public Pub. Intox. Department Offenses Arrests to DUI MIP BAC Department Offenses Involved Involved Intox. Ave. BACNiobrara County 8 1 12.50% 0.1150 Niobrara County 13 0 0 1 0.0540Lusk PD 3 Lusk PD 7 1 0.0540Niobrara SO 1 1 100.00% 0.1150 Niobrara SO 2WHP 4 WHP 4
DUI Arrests Traffic CrashesCounty Total DUI % DUI Ave. County Traffic Alcohol % Alcohol Average Department Offenses Offenses Of Total BAC Department Crashes Involved Involved BACNiobrara County 13 8 61.54% 0.1340 Niobrara County 0 0 0.00%Lusk PD 7 3 42.86% 0.1410 Lusk PDNiobrara SO 2 1 50.00% 0.2140 Niobrara SOWHP 4 4 100.00% 0.1027 WHP
Underage DUI ArrestsCounty DUI Underage % DUI Ave. Department Offenses Offenses Of Total BACNiobrara County 8 1 12.50% 0.1240Lusk PD 3Niobrara SO 1WHP 4 1 25.00% 0.1240
58
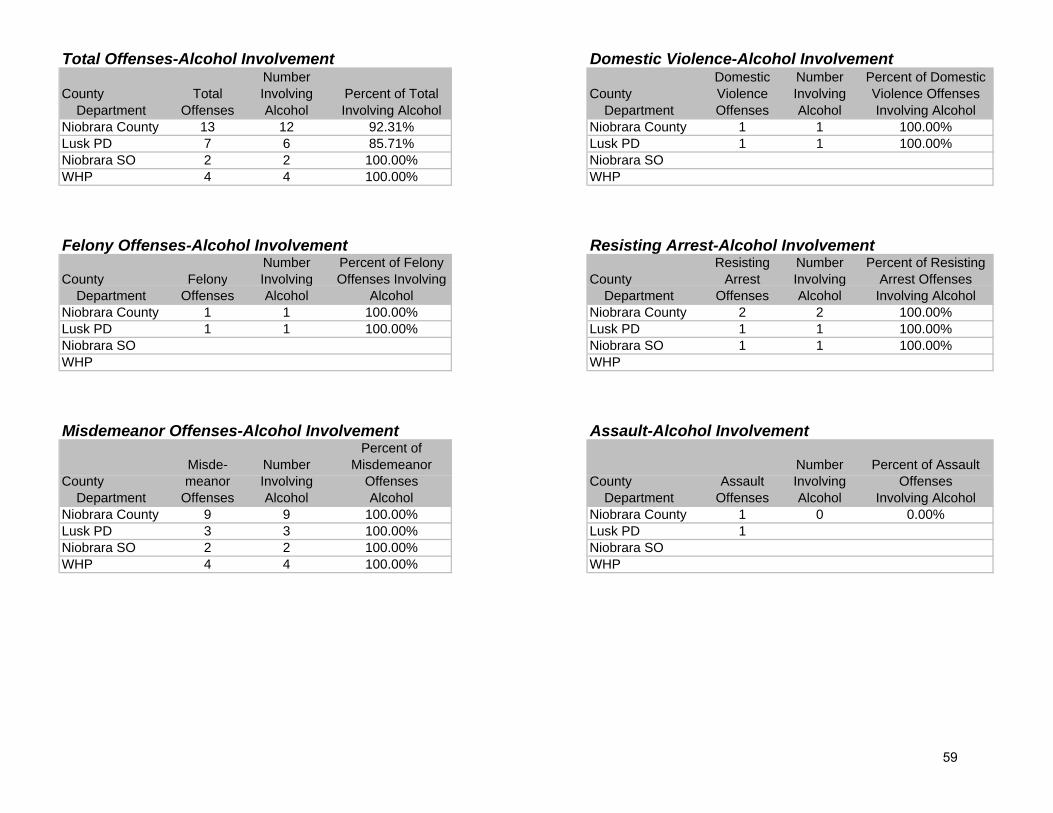
Total Offenses-Alcohol Involvement Domestic Violence-Alcohol Involvement
County TotalNumber Involving Percent of Total County
Domestic Violence
Number Involving
Percent of Domestic Violence OffensesCounty Total Involving Percent of Total County Violence Involving Violence Offenses
Department Offenses Alcohol Involving Alcohol Department Offenses Alcohol Involving AlcoholNiobrara County 13 12 92.31% Niobrara County 1 1 100.00%Lusk PD 7 6 85.71% Lusk PD 1 1 100.00%Niobrara SO 2 2 100.00% Niobrara SOWHP 4 4 100.00% WHP
Felony Offenses-Alcohol Involvement Resisting Arrest-Alcohol Involvement
County FelonyNumber Involving
Percent of Felony Offenses Involving County
Resisting Arrest
Number Involving
Percent of Resisting Arrest Offensesy y g g y g
Department Offenses Alcohol Alcohol Department Offenses Alcohol Involving AlcoholNiobrara County 1 1 100.00% Niobrara County 2 2 100.00%Lusk PD 1 1 100.00% Lusk PD 1 1 100.00%Niobrara SO Niobrara SO 1 1 100.00%WHP WHP
Misdemeanor Offenses-Alcohol Involvement Assault-Alcohol Involvement
Misde- Number Percent of
Misdemeanor Number Percent of Assault County meanor Involving Offenses County Assault Involving Offenses Department Offenses Alcohol Alcohol Department Offenses Alcohol Involving AlcoholNiobrara County 9 9 100.00% Niobrara County 1 0 0.00%Lusk PD 3 3 100.00% Lusk PD 1Niobrara SO 2 2 100.00% Niobrara SOWHP 4 4 100.00% WHP
59
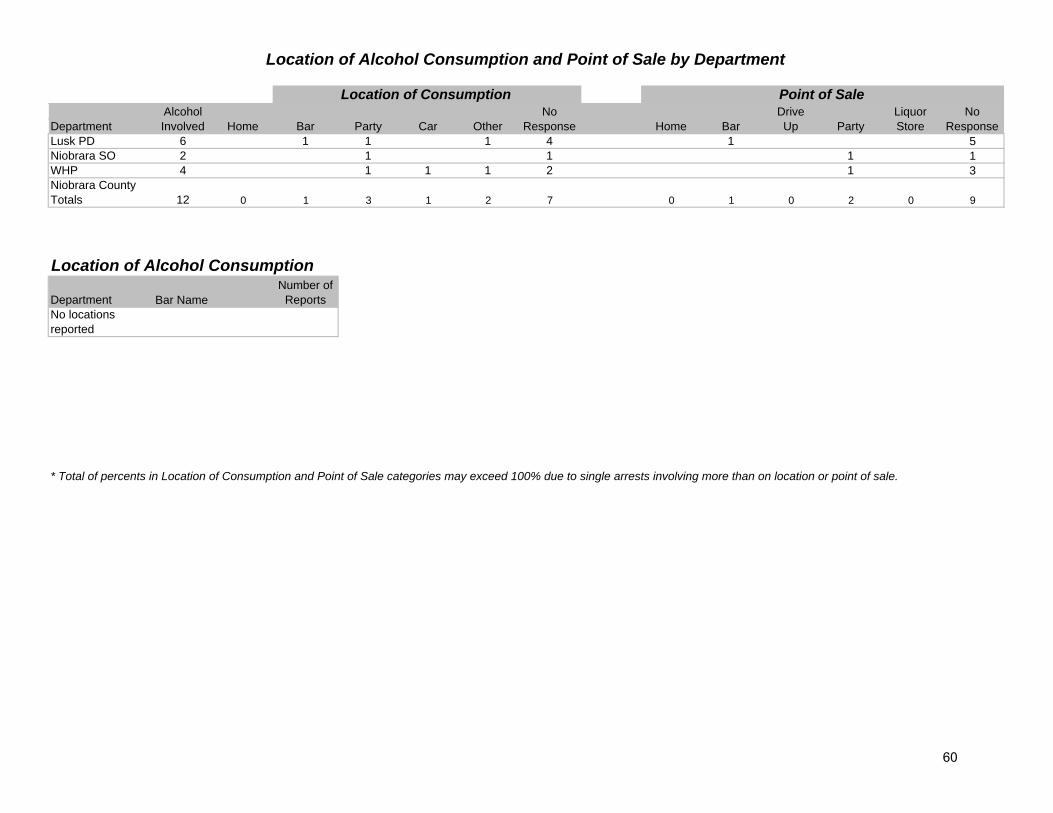
Alcohol No Drive Liquor No Department Involved Home Bar Party Car Other Response Home Bar Up Party Store ResponseLusk PD 6 1 1 1 4 1 5Niobrara SO 2 1 1 1 1WHP 4 1 1 1 2 1 3Niobrara County Totals 12 0 1 3 1 2 7 0 1 0 2 0 9
Location of Alcohol Consumption
DepartmentNumber of
ReportsNo locations reported
* Total of percents in Location of Consumption and Point of Sale categories may exceed 100% due to single arrests involving more than on location or point of sale.
Location of Alcohol Consumption and Point of Sale by Department
Location of Consumption Point of Sale
Bar Name
60

Numbers by Department
CountyTotal
OffensesMisde-meanor Felony
Domestic Violence
Resist Arrest Assault
Public Intox
Alcohol Involved
Traffic Crash Female Male
Unknown Gender
Average Ave
Park County 349 294 31 13 5 3 32 260 20 78 270 1 31.14Cody PD 195 170 10 6 3 26 152 8 45 150 31.78Drug Court 1 1 1 1 1 19.00Other 3 2 1 2 3 1 2 42.00Park Service 1 1 1 1 26.00Park SO 26 21 4 3 12 5 21 30.93Powell PD 116 94 16 4 2 1 5 84 8 24 91 1 30.07WHP 7 5 1 7 3 1 6 26.75
Percents by Department *
CountyTotal
OffensesMisde-meanor Felony
Domestic Violence
Resist Arrest Assault
Public Intox
Alcohol Involved
Traffic Crash Female Male
Unkown Gender
Park County 349 84.24% 8.88% 3.72% 1.43% 0.86% 9.17% 74.50% 5.73% 22.35% 77.36% 0.29%Cody PD 195 87.18% 5.13% 3.08% 1.54% 13.33% 77.95% 4.10% 23.08% 76.92%Drug Court 1 100.00% 100.00% 100.00% 100.00%Other 3 66.67% 33.33% 66.67% 100.00% 33.33% 66.67%Park Service 1 100.00% 100.00% 100.00%Park SO 26 80.77% 15.38% 11.54% 46.15% 19.23% 80.77%Powell PD 116 81.03% 13.79% 3.45% 1.72% 0.86% 4.31% 72.41% 6.90% 20.69% 78.45% 0.86%WHP 7 71.43% 14.29% 100.00% 42.86% 14.29% 85.71%
* Total percents may not equal 100 due to lack of information, or a single arrest involving multiple crimes.
Park County ArrestsApril 1, 2007 - September 30, 2007
Park County ArrestsApril 1, 2007 - September 30, 2007
61

MIP Arrests Meth, Drugs & Public IntoxicationCounty DUI MIP % MIP Average County Total Meth Drugs Public Pub. Intox. Department Offenses Arrests to DUI MIP BAC Department Offenses Involved Involved Intox. Ave. BACPark County 151 25 16.56% 0.1110 Park County 349 2 24 32 0.2092Cody PD 83 17 20.48% 0.1101 Cody PD 195 9 26 0.1975Drug Court 1 Drug Court 1Other Other 3Park Service 1 Park Service 1Park SO 4 Park SO 26 3Powell PD 59 8 13.56% 0.1127 Powell PD 116 2 11 5 0.2857WHP 3 WHP 7 1 1 0.0730
DUI Arrests Traffic CrashesCounty Total DUI % DUI Ave. County Traffic Alcohol % Alcohol Average Department Offenses Offenses Of Total BAC Department Crashes Involved Involved BACPark County 349 151 43.27% 0.1500 Park County 20 20 100.00% 0.1681Cody PD 195 83 42.56% 0.1593 Cody PD 8 8 100.00% 0.1603Drug Court 1 1 100.00% 0.1370 Drug Court 1 1 100.00% 0.1370Other 3 OtherPark Service 1 1 100.00% Park ServicePark SO 26 4 15.38% 0.1177 Park SOPowell PD 116 59 50.86% 0.1406 Powell PD 8 8 100.00% 0.1703WHP 7 3 42.86% 0.1497 WHP 3 3 100.00% 0.2090
Underage DUI ArrestsCounty DUI Underage % DUI Ave. Department Offenses Offenses Of Total BACPark County 151 20 13.25% 0.1137Cody PD 83 11 13.25% 0.0890Drug Court 1 1 100.00% 0.1370OtherPark Service 1Park SO 4 1 25.00% 0.1030Powell PD 59 7 11.86% 0.1260WHP 3
62
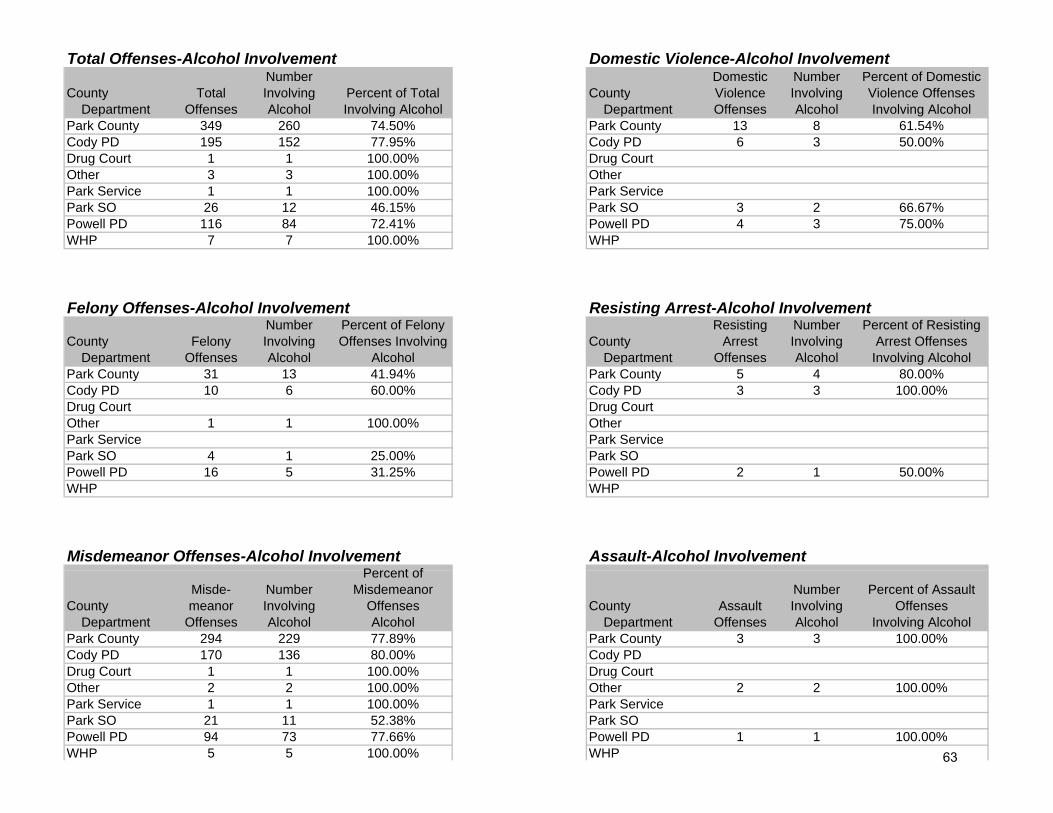
Total Offenses-Alcohol Involvement Domestic Violence-Alcohol Involvement
County TotalNumber Involving Percent of Total County
Domestic Violence
Number Involving
Percent of Domestic Violence OffensesCounty Total Involving Percent of Total County Violence Involving Violence Offenses
Department Offenses Alcohol Involving Alcohol Department Offenses Alcohol Involving AlcoholPark County 349 260 74.50% Park County 13 8 61.54%Cody PD 195 152 77.95% Cody PD 6 3 50.00%Drug Court 1 1 100.00% Drug CourtOther 3 3 100.00% OtherPark Service 1 1 100 00% Park ServicePark Service 1 1 100.00% Park ServicePark SO 26 12 46.15% Park SO 3 2 66.67%Powell PD 116 84 72.41% Powell PD 4 3 75.00%WHP 7 7 100.00% WHP
Felony Offenses-Alcohol Involvement Resisting Arrest-Alcohol Involvement
County FelonyNumber Involving
Percent of Felony Offenses Involving County
Resisting Arrest
Number Involving
Percent of Resisting Arrest Offenses
Department Offenses Alcohol Alcohol Department Offenses Alcohol Involving AlcoholPark County 31 13 41.94% Park County 5 4 80.00%y yCody PD 10 6 60.00% Cody PD 3 3 100.00%Drug Court Drug CourtOther 1 1 100.00% OtherPark Service Park ServicePark SO 4 1 25.00% Park SOPowell PD 16 5 31 25% Powell PD 2 1 50 00%Powell PD 16 5 31.25% Powell PD 2 1 50.00%WHP WHP
Misdemeanor Offenses-Alcohol Involvement Assault-Alcohol InvolvementP t f
CountyMisde-meanor
Number Involving
Percent of Misdemeanor
Offenses County AssaultNumber Involving
Percent of Assault Offenses
Department Offenses Alcohol Alcohol Department Offenses Alcohol Involving AlcoholPark County 294 229 77.89% Park County 3 3 100.00%Cody PD 170 136 80.00% Cody PDDrug Court 1 1 100.00% Drug CourtOther 2 2 100.00% Other 2 2 100.00%Park Service 1 1 100.00% Park ServicePark SO 21 11 52.38% Park SOPowell PD 94 73 77.66% Powell PD 1 1 100.00%WHP 5 5 100.00% WHP 63

Location of Alcohol Consumption and Point of Sale by Department
Location of Consumption Point of SaleAlcohol No Drive Liquor No
Department Involved Home Bar Party Car Other Response Home Bar Up Party Store ResponseCody PD 152 33 76 6 7 14 19 22 76 1 6 10 40Drug Court 1 1 1Other 3 1 1 2 1 1 1 1Park Service 1 1 1
Location of Consumption Point of Sale
Park SO 12 7 2 2 1 4 2 1 3 2Powell PD 84 18 41 5 5 4 11 10 36 2 5 2 30WHP 7 2 2 2 1 2 1 4Natrona County Totals 260 59 122 13 18 20 32 37 117 3 14 15 79
Location of Alcohol Consumption
DepartmentNumber of
ReportsCody PD 3 H 1
Bar Name
Cassie's 1Cooter Brown 12Dollar 3Downtowner 8Irma 5Rodeo 1Silver Dollar 6Silver Dollar 6Superbowl 2Whiskey River 2
Other Cooter Brown 1Park SO Whiskey River 1Powell PD Back Street 5
Cooter Brown 1Hansel & Gretel's 6Joey's 2K Bar 5Lavinia's 6Peaks 3
WHP Back Street 1La Comida 1La Comida 1
* Total of percents in Location of Consumption and Point of Sale categories may exceed 100% due to single arrests involving more than on location or point of sale.
64
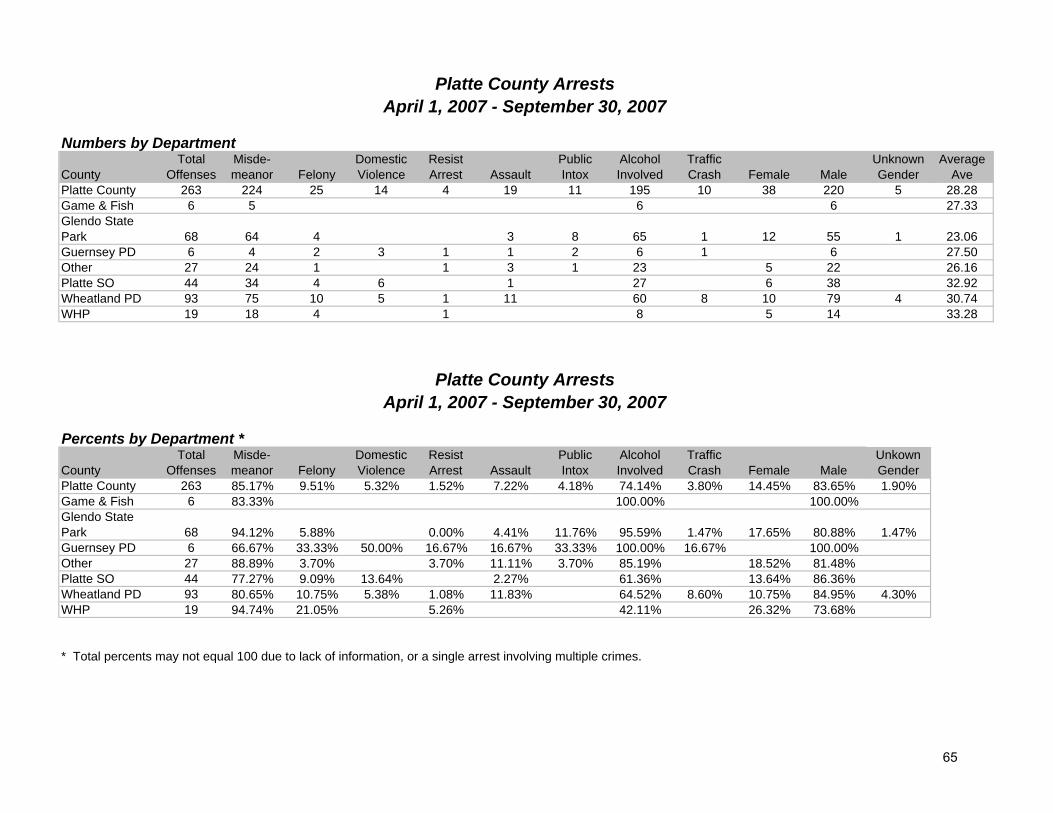
Numbers by Department
CountyTotal
OffensesMisde-meanor Felony
Domestic Violence
Resist Arrest Assault
Public Intox
Alcohol Involved
Traffic Crash Female Male
Unknown Gender
Average Ave
Platte County 263 224 25 14 4 19 11 195 10 38 220 5 28.28Game & Fish 6 5 6 6 27.33Glendo State Park 68 64 4 3 8 65 1 12 55 1 23.06Guernsey PD 6 4 2 3 1 1 2 6 1 6 27.50Other 27 24 1 1 3 1 23 5 22 26.16Platte SO 44 34 4 6 1 27 6 38 32.92Wheatland PD 93 75 10 5 1 11 60 8 10 79 4 30.74WHP 19 18 4 1 8 5 14 33.28
Percents by Department *
CountyTotal
OffensesMisde-meanor Felony
Domestic Violence
Resist Arrest Assault
Public Intox
Alcohol Involved
Traffic Crash Female Male
Unkown Gender
Platte County 263 85.17% 9.51% 5.32% 1.52% 7.22% 4.18% 74.14% 3.80% 14.45% 83.65% 1.90%Game & Fish 6 83.33% 100.00% 100.00%Glendo State Park 68 94.12% 5.88% 0.00% 4.41% 11.76% 95.59% 1.47% 17.65% 80.88% 1.47%Guernsey PD 6 66.67% 33.33% 50.00% 16.67% 16.67% 33.33% 100.00% 16.67% 100.00%Other 27 88.89% 3.70% 3.70% 11.11% 3.70% 85.19% 18.52% 81.48%Platte SO 44 77.27% 9.09% 13.64% 2.27% 61.36% 13.64% 86.36%Wheatland PD 93 80.65% 10.75% 5.38% 1.08% 11.83% 64.52% 8.60% 10.75% 84.95% 4.30%WHP 19 94.74% 21.05% 5.26% 42.11% 26.32% 73.68%
* Total percents may not equal 100 due to lack of information, or a single arrest involving multiple crimes.
Platte County ArrestsApril 1, 2007 - September 30, 2007
Platte County ArrestsApril 1, 2007 - September 30, 2007
65

MIP Arrests Meth, Drugs & Public IntoxicationCounty DUI MIP % MIP Average County Total Meth Drugs Public Pub. Intox. Department Offenses Arrests to DUI MIP BAC Department Offenses Involved Involved Intox. Ave. BACPlatte County 86 44 51.16% 0.0814 Platte County 263 7 45 11 0.1184Game & Fish 6 Game & Fish 6
Glendo State Park 10 28 280.00% 0.0745Glendo State Park 68 8 8 0.1186
Guernsey PD 1 Guernsey PD 6 2 0.1160Other 15 7 46.67% 0.0659 Other 27 4 1 0.1200Platte SO 13 3 23.08% 0.1880 Platte SO 44 7Wheatland PD 36 5 13.89% 0.1093 Wheatland PD 93 3 17WHP 5 1 20.00% 0.0600 WHP 19 4 9
DUI Arrests Traffic CrashesCounty Total DUI % DUI Ave. County Traffic Alcohol % Alcohol Average Department Offenses Offenses Of Total BAC Department Crashes Involved Involved BACPlatte County 263 86 32.70% 0.1219 Platte County 10 10 100.00% 0.1475Game & Fish 6 6 100.00% 0.1092 Game & Fish
Glendo State Park 68 10 14.71% 0.1128Glendo State Park 1 1 100.00%
Guernsey PD 6 1 16.67% 0.0200 Guernsey PD 1 1 100.00% 0.0200Other 27 15 55.56% 0.0700 OtherPlatte SO 44 13 29.55% 0.1661 Platte SOWheatland PD 93 36 38.71% 0.1334 Wheatland PD 8 8 100.00% 0.1900WHP 19 5 26.32% 0.0805 WHP
Underage DUI ArrestsCounty DUI Underage % DUI Ave. Department Offenses Offenses Of Total BACPlatte County 86 12 13.95% 0.0719Game & Fish 6 1 16.67% 0.0770
Glendo State Park 10 2 20.00% 0.0900Guernsey PD 1Other 15 4 26.67% 0.0700Platte SO 13Wheatland PD 36 4 11.11% 0.0700WHP 5 1 20.00% 0.0600
66

Total Offenses-Alcohol Involvement Domestic Violence-Alcohol Involvement
County TotalNumber Involving Percent of Total County
Domestic Violence
Number Involving
Percent of Domestic Violence Offensesy g y g
Department Offenses Alcohol Involving Alcohol Department Offenses Alcohol Involving AlcoholPlatte County 263 195 74.14% Platte County 14 12 85.71%Game & Fish 6 6 100.00% Game & Fish
Glendo State Park 68 65 95.59% Glendo State ParkGuernsey PD 6 6 100.00% Guernsey PD 3 3 100.00%Other 27 23 85.19% OtherPlatte SO 44 27 61.36% Platte SO 6 6 100.00%Wheatland PD 93 60 64.52% Wheatland PD 5 3 60.00%WHP 19 8 42.11% WHP
Felony Offenses-Alcohol Involvement Resisting Arrest-Alcohol Involvement
County FelonyNumber Involving
Percent of Felony Offenses Involving County
Resisting Arrest
Number Involving
Percent of Resisting Arrest Offenses
Department Offenses Alcohol Alcohol Department Offenses Alcohol Involving AlcoholPlatte County 25 13 52.00% Platte County 4 4 100.00%Game & Fish Game & FishGame & Fish Game & Fish
Glendo State Park 4 3 75.00% Glendo State ParkGuernsey PD 2 2 100.00% Guernsey PD 1 1 100.00%Other 1 1 100.00% Other 1 1 100.00%Platte SO 4 Platte SOWheatland PD 10 6 60.00% Wheatland PD 1 1 100.00%Wheatland PD 10 6 60.00% Wheatland PD 1 1 100.00%WHP 4 1 25.00% WHP 1 1 100.00%
Misdemeanor Offenses-Alcohol Involvement Assault-Alcohol InvolvementPercent of
CountyMisde-meanor
Number Involving
Misdemeanor Offenses County Assault
Number Involving
Percent of Assault Offenses
Department Offenses Alcohol Alcohol Department Offenses Alcohol Involving AlcoholPlatte County 224 174 77.68% Platte County 19 14 73.68%Game & Fish 5 5 100.00% Game & Fish
Glendo State Park 64 61 95.31% Glendo State Park 3 2 66.67%Guernsey PD 4 4 100.00% Guernsey PD 1 1 100.00%Other 24 20 83.33% Other 3 1 33.33%Platte SO 34 23 67.65% Platte SO 1 1 100.00%Wheatland PD 75 53 70.67% Wheatland PD 11 9 81.82%WHP 18 8 44.44% WHP
67
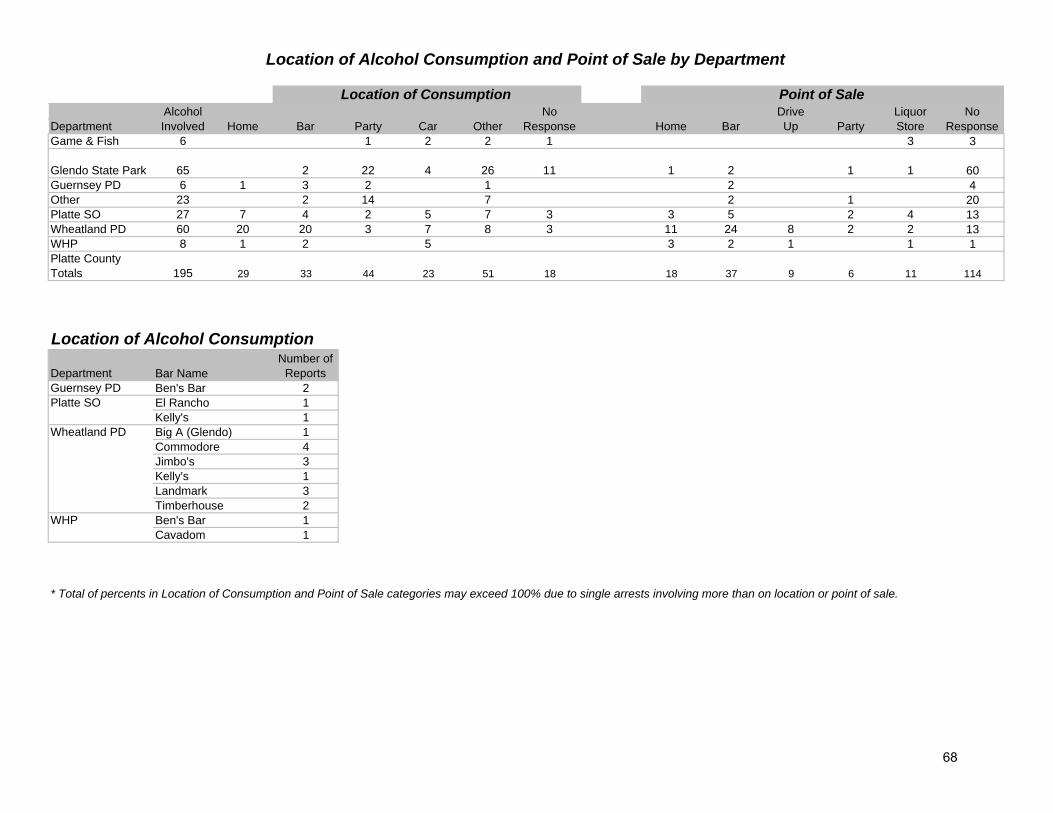
Alcohol No Drive Liquor No Department Involved Home Bar Party Car Other Response Home Bar Up Party Store ResponseGame & Fish 6 1 2 2 1 3 3
Glendo State Park 65 2 22 4 26 11 1 2 1 1 60Guernsey PD 6 1 3 2 1 2 4Other 23 2 14 7 2 1 20Platte SO 27 7 4 2 5 7 3 3 5 2 4 13Wheatland PD 60 20 20 3 7 8 3 11 24 8 2 2 13WHP 8 1 2 5 3 2 1 1 1Platte County Totals 195 29 33 44 23 51 18 18 37 9 6 11 114
Location of Alcohol Consumption
DepartmentNumber of
ReportsGuernsey PD Ben's Bar 2Platte SO El Rancho 1
Kelly's 1Wheatland PD Big A (Glendo) 1
Commodore 4Jimbo's 3Kelly's 1Landmark 3Timberhouse 2
WHP Ben's Bar 1Cavadom 1
* Total of percents in Location of Consumption and Point of Sale categories may exceed 100% due to single arrests involving more than on location or point of sale.
Location of Alcohol Consumption and Point of Sale by Department
Location of Consumption Point of Sale
Bar Name
68
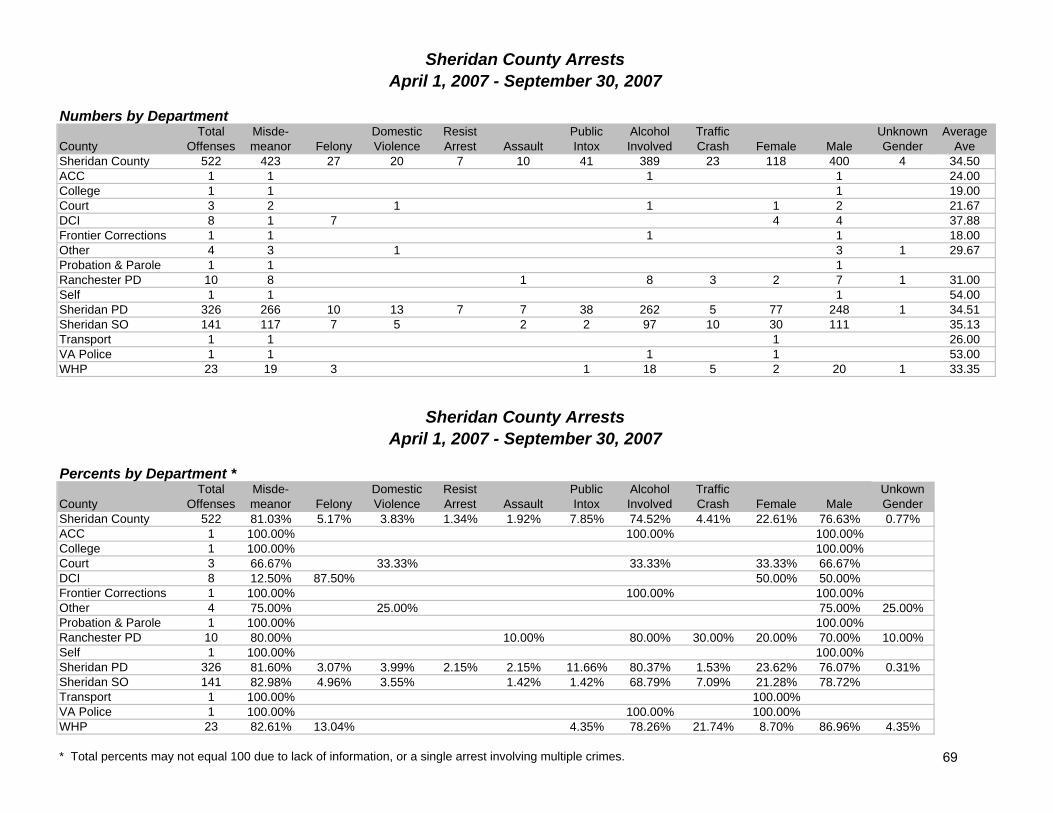
Numbers by Department
CountyTotal
OffensesMisde-meanor Felony
Domestic Violence
Resist Arrest Assault
Public Intox
Alcohol Involved
Traffic Crash Female Male
Unknown Gender
Average Ave
Sheridan County 522 423 27 20 7 10 41 389 23 118 400 4 34.50ACC 1 1 1 1 24.00College 1 1 1 19.00Court 3 2 1 1 1 2 21.67DCI 8 1 7 4 4 37.88Frontier Corrections 1 1 1 1 18.00Other 4 3 1 3 1 29.67Probation & Parole 1 1 1Ranchester PD 10 8 1 8 3 2 7 1 31.00Self 1 1 1 54.00Sheridan PD 326 266 10 13 7 7 38 262 5 77 248 1 34.51Sheridan SO 141 117 7 5 2 2 97 10 30 111 35.13Transport 1 1 1 26.00VA Police 1 1 1 1 53.00WHP 23 19 3 1 18 5 2 20 1 33.35
Percents by Department *
CountyTotal
OffensesMisde-meanor Felony
Domestic Violence
Resist Arrest Assault
Public Intox
Alcohol Involved
Traffic Crash Female Male
Unkown Gender
Sheridan County 522 81.03% 5.17% 3.83% 1.34% 1.92% 7.85% 74.52% 4.41% 22.61% 76.63% 0.77%ACC 1 100.00% 100.00% 100.00%College 1 100.00% 100.00%Court 3 66.67% 33.33% 33.33% 33.33% 66.67%DCI 8 12.50% 87.50% 50.00% 50.00%Frontier Corrections 1 100.00% 100.00% 100.00%Other 4 75.00% 25.00% 75.00% 25.00%Probation & Parole 1 100.00% 100.00%Ranchester PD 10 80.00% 10.00% 80.00% 30.00% 20.00% 70.00% 10.00%Self 1 100.00% 100.00%Sheridan PD 326 81.60% 3.07% 3.99% 2.15% 2.15% 11.66% 80.37% 1.53% 23.62% 76.07% 0.31%Sheridan SO 141 82.98% 4.96% 3.55% 1.42% 1.42% 68.79% 7.09% 21.28% 78.72%Transport 1 100.00% 100.00%VA Police 1 100.00% 100.00% 100.00%WHP 23 82.61% 13.04% 4.35% 78.26% 21.74% 8.70% 86.96% 4.35%
* Total percents may not equal 100 due to lack of information, or a single arrest involving multiple crimes.
Sheridan County ArrestsApril 1, 2007 - September 30, 2007
April 1, 2007 - September 30, 2007Sheridan County Arrests
69

MIP Arrests Meth, Drugs & Public IntoxicationCounty DUI MIP % MIP Average County Total Meth Drugs Public Pub. Intox. Department Offenses Arrests to DUI MIP BAC Department Offenses Involved Involved Intox. Ave. BACSheridan County 259 9 3.47% 0.1090 Sheridan County 522 6 37 41 0.2239y yACC 1 ACC 1College College 1Court 1 0.00% Court 3DCI DCI 8 3 7
Frontier Corrections Frontier Corrections 1 1Other Other 4 1Probation & Parole Probation & Parole 1R h PD R h PD 10Ranchester PD 5 Ranchester PD 10Self Self 1Sheridan PD 167 6 3.59% 0.1050 Sheridan PD 326 2 13 38 0.2489Sheridan SO 69 2 2.90% 0.1130 Sheridan SO 141 1 12 2 0.1580Transport Transport 1VA Police VA Police 1WHP 17 WHP 23 3 1 0.1060
DUI Arrests Traffic CrashesCounty Total DUI % DUI Ave. County Traffic Alcohol % Alcohol Average Department Offenses Offenses Of Total BAC Department Crashes Involved Involved BACSheridan County 522 259 49.62% 0.1639 Sheridan County 23 22 95.65% 0.1543ACC 1 1 100.00% 0.0030 ACCCollege 1 CollegeCourt 3 CourtDCI 8 DCIDCI 8 DCI
Frontier Corrections 1 Frontier CorrectionsOther 4 OtherProbation & Parole 1 Probation & ParoleRanchester PD 10 5 50.00% 0.1460 Ranchester PD 3 3 100.00% 0.2100Self 1 SelfSheridan PD 326 167 51.23% 0.1578 Sheridan PD 5 5 100.00% 0.1570Sheridan SO 141 69 48.94% 0.1779 Sheridan SO 10 10 100.00% 0.1510Transport 1 TransportVA Police 1 VA PoliceWHP 23 17 73.91% 0.1738 WHP 5 4 80.00% 0.1320
Underage DUI ArrestsCounty DUI Underage % DUI Ave. Department Offenses Offenses Of Total BACSheridan County 259 16 6.18% 0.1128ACC 1CollegeCourtDCI
Frontier CorrectionsOtherProbation & ParoleProbation & ParoleRanchester PD 5SelfSheridan PD 167 11 6.59% 0.0990Sheridan SO 69 5 7.25% 0.1265TransportVA PoliceWHP 17
70

Total Offenses-Alcohol Involvement Domestic Violence-Alcohol Involvement
County TotalNumber Involving Percent of Total County
Domestic Violence
Number Involving
Percent of Domestic Violence Offenses
Department Offenses Alcohol Involving Alcohol Department Offenses Alcohol Involving AlcoholSheridan County 522 389 Sheridan County 20 11ACC 1 1 ACCCollege 1 CollegeCourt 3 1 Court 1DCI 8 DCIFrontier Corrections 1 1 Frontier CorrectionsOther 4 Other 1Probation & Parole 1 Probation & ParoleRanchester PD 10 8 Ranchester PDSelf 1 SelfSheridan PD 326 262 Sheridan PD 13 9Sheridan SO 141 97 Sheridan SO 5 2Transport 1 TransportVA Police 1 1 VA PoliceWHP 23 18 WHP
Felony Offenses-Alcohol Involvement Resisting Arrest-Alcohol Involvement
County FelonyNumber Involving
Percent of Felony Offenses Involving County
Resisting Arrest
Number Involving
Percent of Resisting Arrest Offenses
Department Offenses Alcohol Alcohol Department Offenses Alcohol Involving AlcoholSheridan County 27 6 Sheridan County 7 5ACC ACCCollege CollegeCourt CourtDCI 7 DCIFrontier Corrections Frontier CorrectionsOther OtherProbation & Parole Probation & ParoleRanchester PD Ranchester PDSelf SelfSheridan PD 10 4 Sheridan PD 7 5Sheridan SO 7 1 Sheridan SOTransport TransportVA Police VA PoliceWHP 3 1 WHP
Misdemeanor Offenses-Alcohol Involvement Assault-Alcohol Involvement
CountyMisde-meanor
Number Involving
Percent of Misdemeanor
Offenses County AssaultNumber Involving
Percent of Assault Offenses
Department Offenses Alcohol Alcohol Department Offenses Alcohol Involving AlcoholSheridan County 423 332 Sheridan County 10 8ACC 1 1 ACCCollege 1 CollegeCourt 2 1 CourtDCI 1 DCIFrontier Corrections 1 1 Frontier CorrectionsOther 3 OtherProbation & Parole 1 Probation & ParoleRanchester PD 8 7 Ranchester PD 1 1Self 1 SelfSheridan PD 266 219 Sheridan PD 7 6Sheridan SO 117 87 Sheridan SO 2 1Transport 1 TransportVA Police 1 1 VA PoliceWHP 19 15 WHP 71
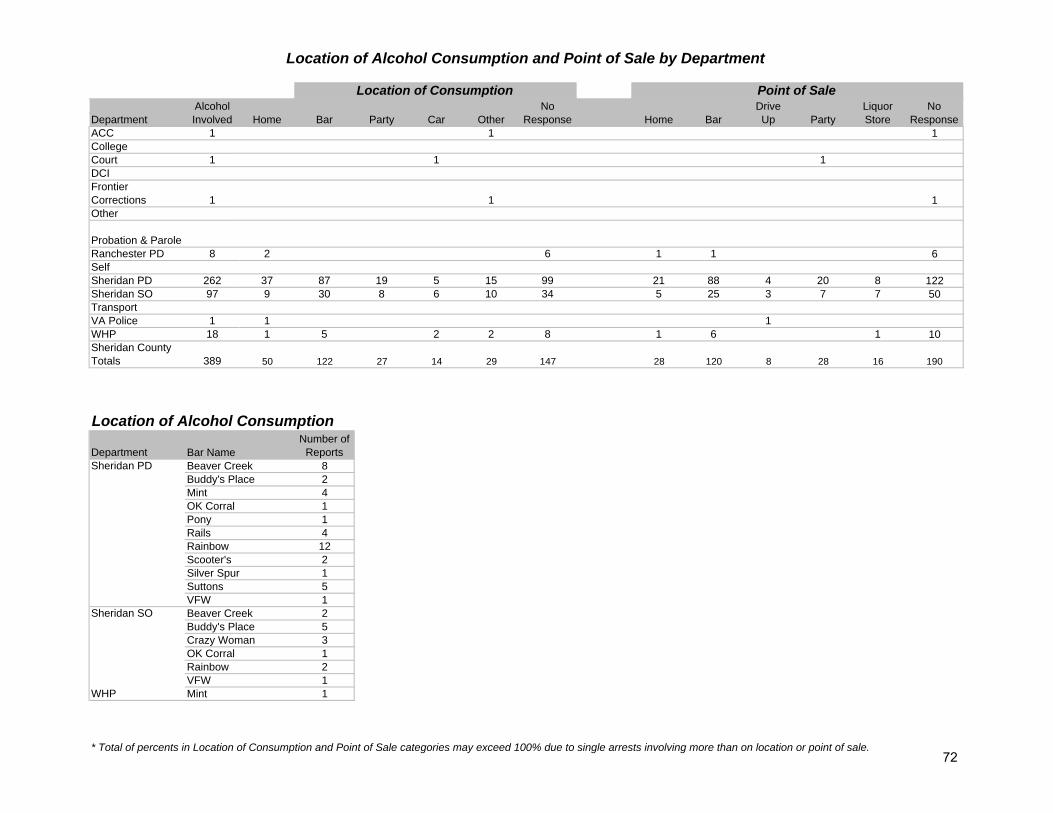
Alcohol No Drive Liquor No Department Involved Home Bar Party Car Other Response Home Bar Up Party Store ResponseACC 1 1 1CollegeCourt 1 1 1DCIFrontier Corrections 1 1 1Other
Probation & ParoleRanchester PD 8 2 6 1 1 6SelfSheridan PD 262 37 87 19 5 15 99 21 88 4 20 8 122Sheridan SO 97 9 30 8 6 10 34 5 25 3 7 7 50TransportVA Police 1 1 1WHP 18 1 5 2 2 8 1 6 1 10Sheridan County Totals 389 50 122 27 14 29 147 28 120 8 28 16 190
Location of Alcohol Consumption
DepartmentNumber of
ReportsSheridan PD Beaver Creek 8
Buddy's Place 2Mint 4OK Corral 1Pony 1Rails 4Rainbow 12Scooter's 2Silver Spur 1Suttons 5VFW 1
Sheridan SO Beaver Creek 2Buddy's Place 5Crazy Woman 3OK Corral 1Rainbow 2VFW 1
WHP Mint 1
* Total of percents in Location of Consumption and Point of Sale categories may exceed 100% due to single arrests involving more than on location or point of sale.
Location of Alcohol Consumption and Point of Sale by Department
Location of Consumption Point of Sale
Bar Name
72
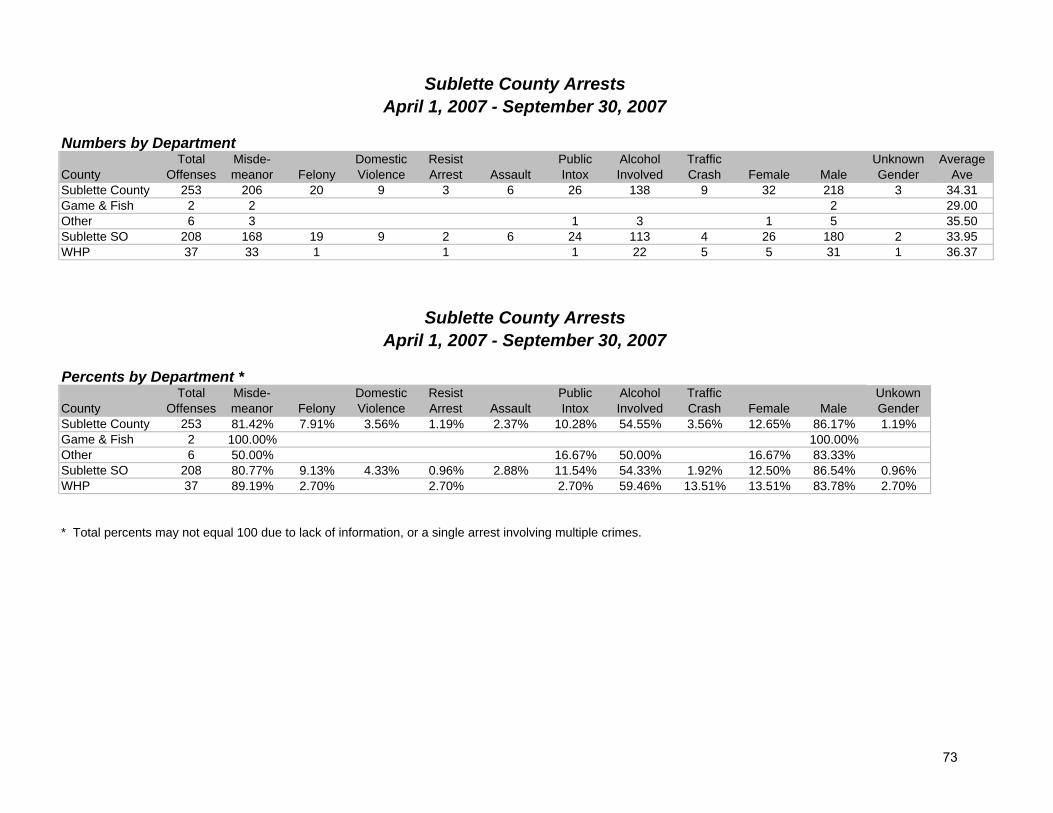
Numbers by Department
CountyTotal
OffensesMisde-meanor Felony
Domestic Violence
Resist Arrest Assault
Public Intox
Alcohol Involved
Traffic Crash Female Male
Unknown Gender
Average Ave
Sublette County 253 206 20 9 3 6 26 138 9 32 218 3 34.31Game & Fish 2 2 2 29.00Other 6 3 1 3 1 5 35.50Sublette SO 208 168 19 9 2 6 24 113 4 26 180 2 33.95WHP 37 33 1 1 1 22 5 5 31 1 36.37
Percents by Department *
CountyTotal
OffensesMisde-meanor Felony
Domestic Violence
Resist Arrest Assault
Public Intox
Alcohol Involved
Traffic Crash Female Male
Unkown Gender
Sublette County 253 81.42% 7.91% 3.56% 1.19% 2.37% 10.28% 54.55% 3.56% 12.65% 86.17% 1.19%Game & Fish 2 100.00% 100.00%Other 6 50.00% 16.67% 50.00% 16.67% 83.33%Sublette SO 208 80.77% 9.13% 4.33% 0.96% 2.88% 11.54% 54.33% 1.92% 12.50% 86.54% 0.96%WHP 37 89.19% 2.70% 2.70% 2.70% 59.46% 13.51% 13.51% 83.78% 2.70%
* Total percents may not equal 100 due to lack of information, or a single arrest involving multiple crimes.
Sublette County ArrestsApril 1, 2007 - September 30, 2007
Sublette County ArrestsApril 1, 2007 - September 30, 2007
73

MIP Arrests Meth, Drugs & Public IntoxicationCounty DUI MIP % MIP Average County Total Meth Drugs Public Pub. Intox. Department Offenses Arrests to DUI MIP BAC Department Offenses Involved Involved Intox. Ave. BACSublette County 70 9 0.1333 Sublette County 253 2 14 26 0.1633Game & Fish Game & Fish 2Other Other 6 1Sublette SO 51 7 0.1277 Sublette SO 208 2 8 24 0.1633WHP 19 2 0.1500 WHP 37 6 1
DUI Arrests Traffic CrashesCounty Total DUI % DUI Ave. County Traffic Alcohol % Alcohol Average Department Offenses Offenses Of Total BAC Department Crashes Involved Involved BACSublette County 253 70 0.1613 Sublette County 9 8 0.2343Game & Fish 2 Game & FishOther 6 OtherSublette SO 208 51 0.1588 Sublette SO 4 3 0.2765WHP 37 19 0.1714 WHP 5 5 0.1500
Underage DUI ArrestsCounty DUI Underage % DUI Ave. Department Offenses Offenses Of Total BACSublette County 70 7 0.1400Game & FishOtherSublette SO 51 6 0.1400WHP 19 1
74

Total Offenses-Alcohol Involvement Domestic Violence-Alcohol Involvement
County TotalNumber Involving Percent of Total County
Domestic Violence
Number Involving
Percent of Domestic Violence Offenses
Department Offenses Alcohol Involving Alcohol Department Offenses Alcohol Involving AlcoholSublette County 253 138 54.55% Sublette County 9 3 33.33%Game & Fish 2 Game & FishOther 6 3 50.00% OtherSublette SO 208 113 54.33% Sublette SO 9 3 33.33%WHP 37 22 59.46% WHP
Felony Offenses-Alcohol Involvement Resisting Arrest-Alcohol Involvement
County FelonyNumber Involving
Percent of Felony Offenses Involving County
Resisting Arrest
Number Involving
Percent of Resisting Arrest Offenses
Department Offenses Alcohol Alcohol Department Offenses Alcohol Involving AlcoholSublette County 20 3 15.00% Sublette County 3 2 66.67%Game & Fish Game & FishOther OtherSublette SO 19 3 15.79% Sublette SO 2 2 100.00%WHP 1 WHP 1
Misdemeanor Offenses-Alcohol Involvement Assault-Alcohol Involvement
CountyMisde-meanor
Number Involving
Percent of Misdemeanor
Offenses County AssaultNumber Involving
Percent of Assault Offenses
Department Offenses Alcohol Alcohol Department Offenses Alcohol Involving AlcoholSublette County 206 120 58.25% Sublette County 6 2 33.33%Game & Fish 2 Game & FishOther 3 OtherSublette SO 168 100 59.52% Sublette SO 6 2 33.33%WHP 33 20 60.61% WHP
75

Alcohol No Drive Liquor No Department Involved Home Bar Party Car Other Response Home Bar Up Party Store ResponseGame & FishOther 3 1 1 1 1 1 1Sublette SO 113 16 35 9 7 8 41 9 35 3 7 59WHP 22 4 5 1 5 7 1 6 1 4 10Sublette County Totals 138 21 41 9 8 13 49 10 42 0 4 12 70
DepartmentNumber of
ReportsOther Corral Bar 1Sublette SO Bottom's Up 1
Corral Bar 14Green River Bar 1Lakeside Lodge 1Silver Spur 4Stockman's 5VFW 1Wheel 2
WHP Corral Bar 4
* Total of percents in Location of Consumption and Point of Sale categories may exceed 100% due to single arrests involving more than on location or point of sale.
Location of Alcohol Consumption and Point of Sale by Department
Location of Consumption Point of Sale
Location of Alcohol Consumption
Bar Name
76

Numbers by Department
CountyTotal
OffensesMisde-meanor Felony
Domestic Violence
Resist Arrest Assault
Public Intox
Alcohol Involved
Traffic Crash Female Male
Unknown Gender
Average Ave
Sweetwater County 1349 1116 141 60 23 36 277 812 43 241 1104 4 31.77DCI 5 2 4 1 1 4 27.80Game & Fish 1 1 1 1 48.00Green River PD 157 130 13 18 6 7 27 93 4 30 126 1 32.40Judge 11 7 1 1 2 8 1 26.60Other 33 22 7 1 2 9 18 10 23 32.84Ranchester PD 1 1 1 1 30.00Rock Springs PD 747 601 79 30 12 23 226 459 25 135 612 31.86SCCW 1 1 1 1 48.00Sweetwater SO 292 262 29 10 3 4 12 173 5 48 243 1 30.96Wamsutter PD 4 4 3 1 4 33.25WHP 97 85 9 1 2 3 61 7 14 82 1 32.41
Percents by Department *
CountyTotal
OffensesMisde-meanor Felony
Domestic Violence
Resist Arrest Assault
Public Intox
Alcohol Involved
Traffic Crash Female Male
Unkown Gender
Sweetwater County 1349 82.73% 10.45% 4.45% 1.70% 2.67% 20.53% 60.19% 3.19% 17.87% 81.84% 0.30%DCI 5 40.00% 80.00% 20.00% 20.00% 80.00%Game & Fish 1 100.00% 100.00% 100.00%Green River PD 157 82.80% 8.28% 11.46% 3.82% 4.46% 17.20% 59.24% 2.55% 19.11% 80.25% 0.64%Judge 11 63.64% 9.09% 9.09% 18.18% 72.73% 9.09%Other 33 66.67% 21.21% 3.03% 6.06% 27.27% 54.55% 30.30% 69.70%Ranchester PD 1 100.00% 100.00% 100.00%Rock Springs PD 747 80.46% 10.58% 4.02% 1.61% 3.08% 30.25% 61.45% 3.35% 18.07% 81.93%SCCW 1 100.00% 100.00% 100.00%Sweetwater SO 292 89.73% 9.93% 3.42% 1.03% 1.37% 4.11% 59.25% 1.71% 16.44% 83.22% 0.34%Wamsutter PD 4 100.00% 75.00% 25.00% 100.00%WHP 97 87.63% 9.28% 1.03% 2.06% 3.09% 62.89% 7.22% 14.43% 84.54% 1.03%
* Total percents may not equal 100 due to lack of information, or a single arrest involving multiple crimes.
Sweetwater County ArrestsApril 1, 2007 - September 30, 2007
Sweetwater County ArrestsApril 1, 2007 - September 30, 2007
77
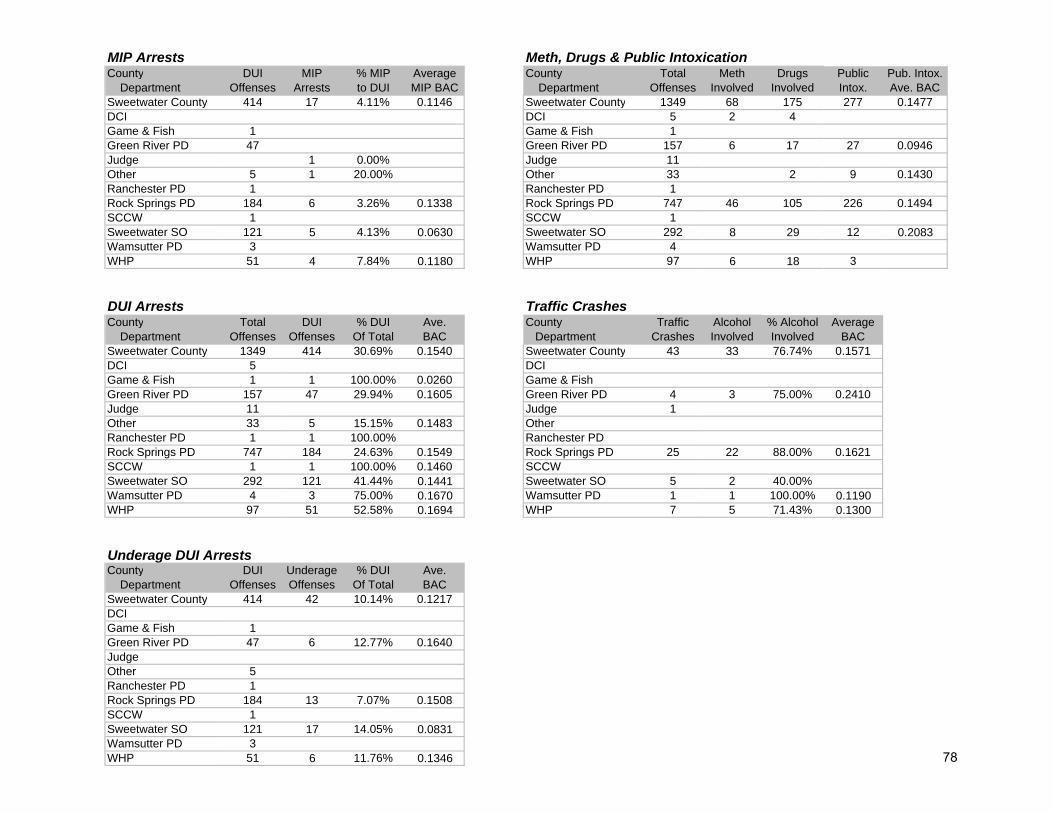
MIP Arrests Meth, Drugs & Public IntoxicationCounty DUI MIP % MIP Average County Total Meth Drugs Public Pub. Intox. Department Offenses Arrests to DUI MIP BAC Department Offenses Involved Involved Intox. Ave. BACSweetwater County 414 17 4.11% 0.1146 Sweetwater County 1349 68 175 277 0.1477DCI DCI 5 2 4Game & Fish 1 Game & Fish 1Green River PD 47 Green River PD 157 6 17 27 0.0946Judge 1 0.00% Judge 11Other 5 1 20.00% Other 33 2 9 0.1430Ranchester PD 1 Ranchester PD 1Rock Springs PD 184 6 3.26% 0.1338 Rock Springs PD 747 46 105 226 0.1494SCCW 1 SCCW 1Sweetwater SO 121 5 4.13% 0.0630 Sweetwater SO 292 8 29 12 0.2083Wamsutter PD 3 Wamsutter PD 4WHP 51 4 7.84% 0.1180 WHP 97 6 18 3
DUI Arrests Traffic CrashesCounty Total DUI % DUI Ave. County Traffic Alcohol % Alcohol Average Department Offenses Offenses Of Total BAC Department Crashes Involved Involved BACSweetwater County 1349 414 30.69% 0.1540 Sweetwater County 43 33 76.74% 0.1571DCI 5 DCIGame & Fish 1 1 100.00% 0.0260 Game & FishGreen River PD 157 47 29.94% 0.1605 Green River PD 4 3 75.00% 0.2410Judge 11 Judge 1Other 33 5 15.15% 0.1483 OtherRanchester PD 1 1 100.00% Ranchester PDRock Springs PD 747 184 24.63% 0.1549 Rock Springs PD 25 22 88.00% 0.1621SCCW 1 1 100.00% 0.1460 SCCWSweetwater SO 292 121 41.44% 0.1441 Sweetwater SO 5 2 40.00%Wamsutter PD 4 3 75.00% 0.1670 Wamsutter PD 1 1 100.00% 0.1190WHP 97 51 52.58% 0.1694 WHP 7 5 71.43% 0.1300
Underage DUI ArrestsCounty DUI Underage % DUI Ave. Department Offenses Offenses Of Total BACSweetwater County 414 42 10.14% 0.1217DCIGame & Fish 1Green River PD 47 6 12.77% 0.1640JudgeOther 5Ranchester PD 1Rock Springs PD 184 13 7.07% 0.1508SCCW 1Sweetwater SO 121 17 14.05% 0.0831Wamsutter PD 3WHP 51 6 11.76% 0.1346 78

Total Offenses-Alcohol Involvement Domestic Violence-Alcohol Involvement
County TotalNumber Involving Percent of Total County
Domestic Violence
Number Involving
Percent of Domestic Violence Offenses
Department Offenses Alcohol Involving Alcohol Department Offenses Alcohol Involving AlcoholSweetwater County 1349 812 60.19% Sweetwater County 60 30 50.00%DCI 5 1 20.00% DCIGame & Fish 1 1 100.00% Game & FishGreen River PD 157 93 59.24% Green River PD 18 10 55.56%Judge 11 1 9.09% JudgeOther 33 18 54.55% Other 1Ranchester PD 1 1 100.00% Ranchester PDRock Springs PD 747 459 61.45% Rock Springs PD 30 16 53.33%SCCW 1 1 100.00% SCCWSweetwater SO 292 173 59.25% Sweetwater SO 10 4 40.00%Wamsutter PD 4 3 75.00% Wamsutter PDWHP 97 61 62.89% WHP 1
Felony Offenses-Alcohol Involvement Resisting Arrest-Alcohol Involvement
County FelonyNumber Involving
Percent of Felony Offenses Involving County
Resisting Arrest
Number Involving
Percent of Resisting Arrest Offenses
Department Offenses Alcohol Alcohol Department Offenses Alcohol Involving AlcoholSweetwater County 141 28 19.86% Sweetwater County 23 14 60.87%DCI 4 DCIGame & Fish Game & FishGreen River PD 13 5 38.46% Green River PD 6 4 66.67%Judge JudgeOther 7 1 14.29% OtherRanchester PD Ranchester PDRock Springs PD 79 15 18.99% Rock Springs PD 12 8 66.67%SCCW SCCWSweetwater SO 29 5 17.24% Sweetwater SO 3 1 33.33%Wamsutter PD Wamsutter PDWHP 9 2 22.22% WHP 2 1 50.00%
Misdemeanor Offenses-Alcohol Involvement Assault-Alcohol Involvement
CountyMisde-meanor
Number Involving
Percent of Misdemeanor
Offenses County AssaultNumber Involving
Percent of Assault Offenses
Department Offenses Alcohol Alcohol Department Offenses Alcohol Involving AlcoholSweetwater County 1116 688 61.65% Sweetwater County 36 18 50.00%DCI 2 1 50.00% DCIGame & Fish 1 1 100.00% Game & FishGreen River PD 130 81 62.31% Green River PD 7 3 42.86%Judge 7 1 14.29% JudgeOther 22 14 63.64% Other 2Ranchester PD 1 1 100.00% Ranchester PDRock Springs PD 601 365 60.73% Rock Springs PD 23 12 52.17%SCCW 1 1 100.00% SCCWSweetwater SO 262 164 62.60% Sweetwater SO 4 3 75.00%Wamsutter PD 4 3 75.00% Wamsutter PDWHP 85 56 65.88% WHP
79

Alcohol No Drive Liquor No Department Involved Home Bar Party Car Other Response Home Bar Up Party Store ResponseDCI 1 1 1Game & Fish 1 1 1Green River PD 93 5 6 13 3 1 66 2 6 1 13 2 70Judge 1 1 1Other 18 1 1 1 1 16 1 1 18Ranchester PD 1 1 1Rock Springs PD 459 30 74 13 4 20 322 6 68 9 15 361SCCW 1 1 1Sweetwater SO 173 14 21 12 6 6 115 5 22 3 9 9 125Wamsutter PD 3 3 3WHP 61 2 10 5 3 1 40 2 10 2 2 45Sweetwater County Totals 812 51 112 44 17 29 567 15 107 4 34 28 627
DepartmentNumber of
Reports Dept.Number of
ReportsGreen River PD Club 86 2
Embassy 1 SO American Inn 1Fraberry 1 Astro 3Windy City 1 Club Millenium 1
Rock Springs PD Astro 15 Embassy 1Bitter Creek 1 Emotions 1Bombers 8 Killpeppers 1Budda Bob's 1 Mast 1Club Millenium 5 Park Mosey 1Eagles 1 Satellite 1Joe's Bar 1 Ted's 1Johnny Mac's 1 Toastmaster 1KD's 1 Windy City 1Killpeppers 5 WHP Astro 1Outlaw 1 Desert Bar 1Palmer 1 Poor House 1Park Hotel 3 Porky's 1Poor House 1 Windy City 1Porky's 3Satellite 3Wild Horse 1Windy City 8
* Total of percents in Location of Consumption and Point of Sale categories may exceed 100% due to single arrests involving more than on location or point of sale.
Sweetwater
Location of Alcohol Consumption
Location of Alcohol Consumption and Point of Sale by Department
Location of Consumption Point of Sale
Bar Name Bar Name
80

Numbers by Department
CountyTotal
OffensesMisde-meanor Felony
Domestic Violence
Resist Arrest Assault
Public Intox
Alcohol Involved
Traffic Crash Female Male
Unknown Gender
Average Ave
Teton County 502 457 22 18 1 6 134 405 21 72 430 0 34.06DCI 1 1 1 25.00Game & Fish 1 1 1 1 26.00ICE 1 1 1 31.00Jackson PD 279 245 12 13 3 115 244 5 35 244 34.19Park Service PD 39 38 1 12 35 3 6 33 35.18Teton SO 137 129 7 5 3 7 108 9 26 111 33.41WHP 44 44 1 17 4 4 40 34.74
Percents by Department *
CountyTotal
OffensesMisde-meanor Felony
Domestic Violence
Resist Arrest Assault
Public Intox
Alcohol Involved
Traffic Crash Female Male
Unkown Gender
Teton County 502 91.04% 4.38% 3.59% 0.20% 1.20% 26.69% 80.68% 4.18% 14.34% 85.66% 0.00%DCI 1 100.00% 100.00%Game & Fish 1 100.00% 100.00% 100.00%ICE 1 100.00% 100.00%Jackson PD 279 87.81% 4.30% 4.66% 1.08% 41.22% 87.46% 1.79% 12.54% 87.46%Park Service PD 39 97.44% 2.56% 30.77% 89.74% 7.69% 15.38% 84.62%Teton SO 137 94.16% 5.11% 3.65% 2.19% 5.11% 78.83% 6.57% 18.98% 81.02%WHP 44 100.00% 2.27% 38.64% 9.09% 9.09% 90.91%
* Total percents may not equal 100 due to lack of information, or a single arrest involving multiple crimes.
Teton County ArrestsApril 1, 2007 - September 30, 2007
Teton County ArrestsApril 1, 2007 - September 30, 2007
81
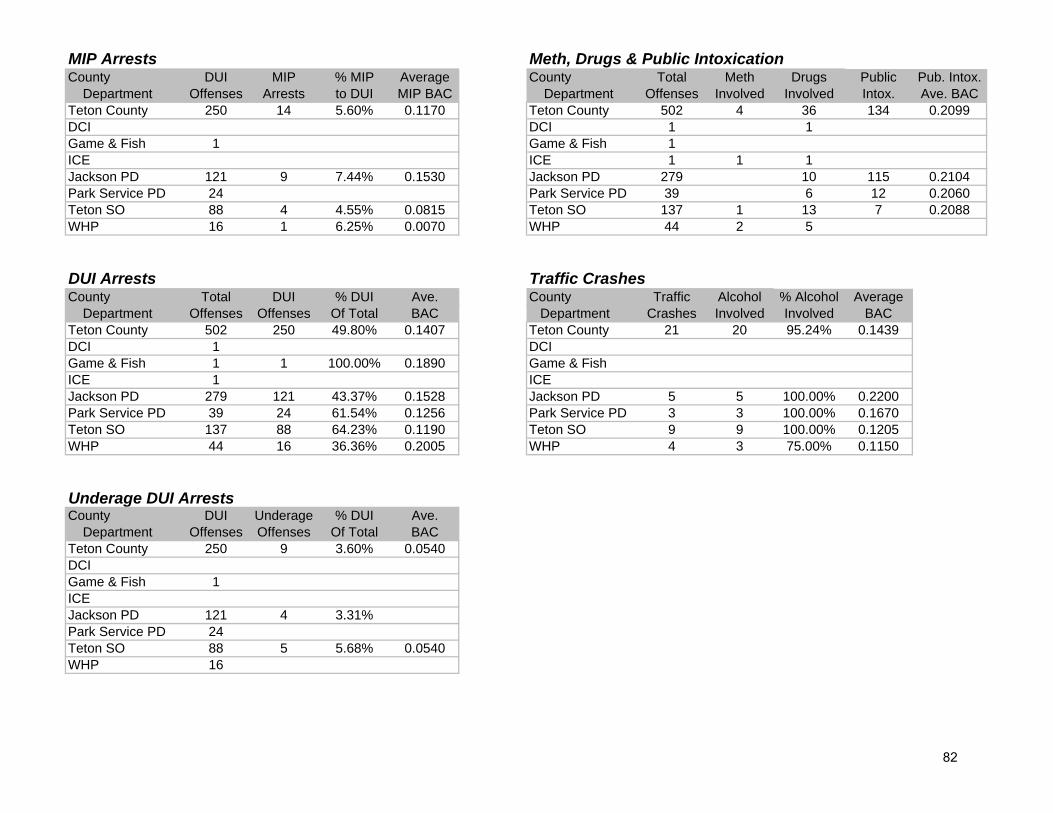
MIP Arrests Meth, Drugs & Public IntoxicationCounty DUI MIP % MIP Average County Total Meth Drugs Public Pub. Intox. Department Offenses Arrests to DUI MIP BAC Department Offenses Involved Involved Intox. Ave. BACTeton County 250 14 5.60% 0.1170 Teton County 502 4 36 134 0.2099DCI DCI 1 1Game & Fish 1 Game & Fish 1ICE ICE 1 1 1Jackson PD 121 9 7.44% 0.1530 Jackson PD 279 10 115 0.2104Park Service PD 24 Park Service PD 39 6 12 0.2060Teton SO 88 4 4.55% 0.0815 Teton SO 137 1 13 7 0.2088WHP 16 1 6.25% 0.0070 WHP 44 2 5
DUI Arrests Traffic CrashesCounty Total DUI % DUI Ave. County Traffic Alcohol % Alcohol Average Department Offenses Offenses Of Total BAC Department Crashes Involved Involved BACTeton County 502 250 49.80% 0.1407 Teton County 21 20 95.24% 0.1439DCI 1 DCIGame & Fish 1 1 100.00% 0.1890 Game & FishICE 1 ICEJackson PD 279 121 43.37% 0.1528 Jackson PD 5 5 100.00% 0.2200Park Service PD 39 24 61.54% 0.1256 Park Service PD 3 3 100.00% 0.1670Teton SO 137 88 64.23% 0.1190 Teton SO 9 9 100.00% 0.1205WHP 44 16 36.36% 0.2005 WHP 4 3 75.00% 0.1150
Underage DUI ArrestsCounty DUI Underage % DUI Ave. Department Offenses Offenses Of Total BACTeton County 250 9 3.60% 0.0540DCIGame & Fish 1ICEJackson PD 121 4 3.31%Park Service PD 24Teton SO 88 5 5.68% 0.0540WHP 16
82
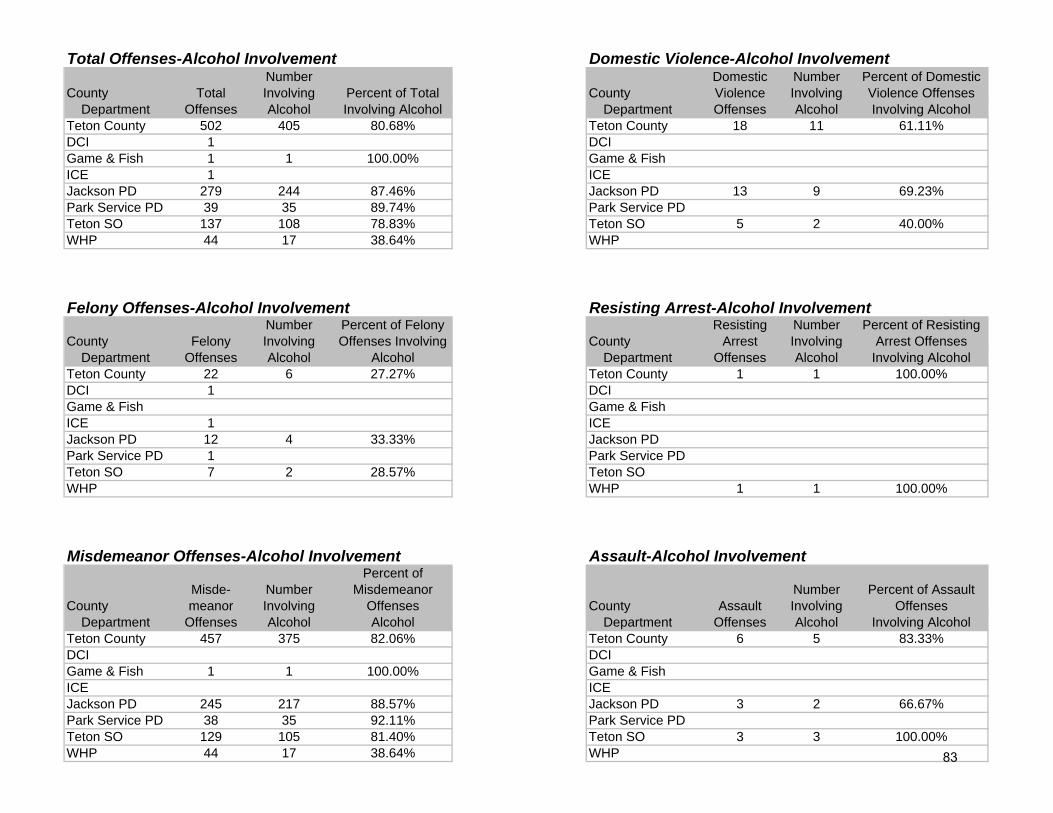
Total Offenses-Alcohol Involvement Domestic Violence-Alcohol Involvement
County TotalNumber Involving Percent of Total County
Domestic Violence
Number Involving
Percent of Domestic Violence Offenses
Department Offenses Alcohol Involving Alcohol Department Offenses Alcohol Involving AlcoholTeton County 502 405 80.68% Teton County 18 11 61.11%DCI 1 DCIGame & Fish 1 1 100.00% Game & FishICE 1 ICEJackson PD 279 244 87.46% Jackson PD 13 9 69.23%Park Service PD 39 35 89.74% Park Service PDTeton SO 137 108 78.83% Teton SO 5 2 40.00%WHP 44 17 38.64% WHP
Felony Offenses-Alcohol Involvement Resisting Arrest-Alcohol Involvement
County FelonyNumber Involving
Percent of Felony Offenses Involving County
Resisting Arrest
Number Involving
Percent of Resisting Arrest Offenses
Department Offenses Alcohol Alcohol Department Offenses Alcohol Involving AlcoholTeton County 22 6 27.27% Teton County 1 1 100.00%DCI 1 DCIGame & Fish Game & FishICE 1 ICEJackson PD 12 4 33.33% Jackson PDPark Service PD 1 Park Service PDTeton SO 7 2 28.57% Teton SOWHP WHP 1 1 100.00%
Misdemeanor Offenses-Alcohol Involvement Assault-Alcohol Involvement
CountyMisde-meanor
Number Involving
Percent of Misdemeanor
Offenses County AssaultNumber Involving
Percent of Assault Offenses
Department Offenses Alcohol Alcohol Department Offenses Alcohol Involving AlcoholTeton County 457 375 82.06% Teton County 6 5 83.33%DCI DCIGame & Fish 1 1 100.00% Game & FishICE ICEJackson PD 245 217 88.57% Jackson PD 3 2 66.67%Park Service PD 38 35 92.11% Park Service PDTeton SO 129 105 81.40% Teton SO 3 3 100.00%WHP 44 17 38.64% WHP 83

Alcohol No Drive Liquor No Department Involved Home Bar Party Car Other Response Home Bar Up Party Store ResponseDCIGame & Fish 1 1 1ICEJackson PD 244 26 134 15 2 27 40 18 137 2 13 28 47Park Service PD 35 6 11 1 3 9 5 5 13 1 10 6Teton SO 108 13 49 10 4 15 18 10 49 2 13 8 27WHP 17 4 6 1 3 3 5 7 1 4Teton County Totals 405 50 200 27 9 54 66 38 206 4 27 48 84
DepartmentNumber of
Reports Dept.Number of
Reports Dept.Number of
ReportsJackson PD 43 North 5 Park Srvc. Grand Teton Lodge 1 Teton SO Village Café 1
Amangni Hotel 1 PD Grant Village 1 Virginian 7Bistro 1 Jackson Golf 1 Wort Hotel 1Cadillac 3 Jackson Lodge 1 WHP Camp Creek 1Camp Creek 1 Signal Mountain 1 Gun Barrel 1Cowboy 27 Virginian 1 Horse Creek 1Cutty's 3 Teton SO 43 North 6 Snake River 1Eleanor's 11 Blue Lion 1 Virginian 1Gun Barrell 1 Calico 2Library 1 Cowboy 2Log Cabin 22 Cutty's 3Mangy Moose 2 Eleanor's 1Million Dollar 1 Four Seasons 1Paint Buffalo 1 Log Cabin 2Silver Dollar 3 Mangy Moose 3Snake River 2 Nikai 1Virginian 33 Pete's 1Wagon Wheel 1 Snake River 2
Park Service PD Cotton Bay 1 Stagecoach 6Cowboy 1 Stieglers 1Doran's 1 Trio Restaurant 1
* Total of percents in Location of Consumption and Point of Sale categories may exceed 100% due to single arrests involving more than on location or point of sale.
Location of Alcohol Consumption and Point of Sale by Department
Location of Consumption Point of Sale
Bar Name Bar Name Bar Name
Location of Alcohol Consumption
84

Numbers by Department
CountyTotal
OffensesMisde-meanor Felony
Domestic Violence
Resist Arrest Assault
Public Intox
Alcohol Involved
Traffic Crash Female Male
Unknown Gender
Average Ave
Uinta County 285 254 17 11 3 6 32 176 15 62 223 0 33.21DCI 2 1 1 1 38.50Evanston PD 195 178 7 7 3 6 32 133 10 44 151 33.17Lyman PD 10 9 3 1 4 2 8 35.89Mtn. View PD 4 4 2 1 4 25.00Other 2 1 1 2 33.00Uinta SO 45 41 3 3 21 4 12 33 30.68WHP 27 22 2 15 3 24 36.95
Percents by Department *
CountyTotal
OffensesMisde-meanor Felony
Domestic Violence
Resist Arrest Assault
Public Intox
Alcohol Involved
Traffic Crash Female Male
Unkown Gender
Uinta County 285 89.12% 5.96% 3.86% 1.05% 2.11% 11.23% 61.75% 5.26% 21.75% 78.25% 0.00%DCI 2 50.00% 50.00% 50.00%Evanston PD 195 91.28% 3.59% 3.59% 1.54% 3.08% 16.41% 68.21% 5.13% 22.56% 77.44%Lyman PD 10 90.00% 30.00% 10.00% 40.00% 20.00% 80.00%Mtn. View PD 4 100.00% 50.00% 25.00% 100.00%Other 2 50.00% 50.00% 100.00%Uinta SO 45 91.11% 6.67% 6.67% 46.67% 8.89% 26.67% 73.33%WHP 27 81.48% 7.41% 55.56% 11.11% 88.89%
* Total percents may not equal 100 due to lack of information, or a single arrest involving multiple crimes.
Uinta County ArrestsApril 1, 2007 - September 30, 2007
Uinta County ArrestsApril 1, 2007 - September 30, 2007
85

MIP Arrests Meth, Drugs & Public IntoxicationCounty DUI MIP % MIP Average County Total Meth Drugs Public Pub. Intox. Department Offenses Arrests to DUI MIP BAC Department Offenses Involved Involved Intox. Ave. BACUinta County 110 4 3.64% 0.1368 Uinta County 285 10 18 32 0.1430DCI DCI 2 1 1Evanston PD 78 3 3.85% 0.1243 Evanston PD 195 2 5 32 0.1430Lyman PD 2 Lyman PD 10 1 1Mtn. View PD 2 Mtn. View PD 4Other Other 2Uinta SO 15 1 6.67% 0.1740 Uinta SO 45 2 5WHP 13 WHP 27 4 6
DUI Arrests Traffic CrashesCounty Total DUI % DUI Ave. County Traffic Alcohol % Alcohol Average Department Offenses Offenses Of Total BAC Department Crashes Involved Involved BACUinta County 285 110 38.60% 0.1566 Uinta County 15 13 86.67% 0.1530DCI 2 DCIEvanston PD 195 78 40.00% 0.1621 Evanston PD 10 8 80.00% 0.1486Lyman PD 10 2 20.00% 0.1035 Lyman PDMtn. View PD 4 2 50.00% 0.1510 Mtn. View PD 1 1 100.00% 0.1420Other 2 OtherUinta SO 45 15 33.33% 0.1838 Uinta SO 4 4 100.00% 0.1860WHP 27 13 48.15% 0.1121 WHP
Underage DUI ArrestsCounty DUI Underage % DUI Ave. Department Offenses Offenses Of Total BACUinta County 110 3 2.73% No reportDCIEvanston PD 78 3 3.85%Lyman PD 2Mtn. View PD 2OtherUinta SO 15WHP 13
86

Total Offenses-Alcohol Involvement Domestic Violence-Alcohol Involvement
County TotalNumber Involving Percent of Total County
Domestic Violence
Number Involving
Percent of Domestic Violence Offenses
Department Offenses Alcohol Involving Alcohol Department Offenses Alcohol Involving AlcoholUinta County 285 176 61.75% Uinta County 11 5 45.45%DCI 2 DCIEvanston PD 195 133 68.21% Evanston PD 7 5 71.43%Lyman PD 10 4 40.00% Lyman PD 1Mtn. View PD 4 2 50.00% Mtn. View PDOther 2 1 50.00% OtherUinta SO 45 21 46.67% Uinta SO 3WHP 27 15 55.56% WHP
Felony Offenses-Alcohol Involvement Resisting Arrest-Alcohol Involvement
County FelonyNumber Involving
Percent of Felony Offenses Involving County
Resisting Arrest
Number Involving
Percent of Resisting Arrest Offenses
Department Offenses Alcohol Alcohol Department Offenses Alcohol Involving AlcoholUinta County 17 2 11.76% Uinta County 3 3 100.00%DCI 1 DCIEvanston PD 7 1 14.29% Evanston PD 3 3 100.00%Lyman PD 3 1 33.33% Lyman PDMtn. View PD Mtn. View PDOther 1 OtherUinta SO 3 Uinta SOWHP 2 WHP
Misdemeanor Offenses-Alcohol Involvement Assault-Alcohol Involvement
CountyMisde-meanor
Number Involving
Percent of Misdemeanor
Offenses County AssaultNumber Involving
Percent of Assault Offenses
Department Offenses Alcohol Alcohol Department Offenses Alcohol Involving AlcoholUinta County 254 168 66.14% Uinta County 6 4 66.67%DCI DCIEvanston PD 178 127 71.35% Evanston PD 6 4 66.67%Lyman PD 9 4 44.44% Lyman PDMtn. View PD 4 2 50.00% Mtn. View PDOther OtherUinta SO 41 21 51.22% Uinta SOWHP 22 14 63.64% WHP 87

Alcohol No Drive Liquor No Department Involved Home Bar Party Car Other Response Home Bar Up Party Store ResponseDCIEvanston PD 133 16 52 9 2 13 41 10 52 2 9 6 54Lyman PD 4 2 1 1 2 1 1Mtn. View PD 2 1 1 1 1Other 1 1 1Uinta SO 21 7 5 1 1 1 6 4 5 1 1 3 8WHP 15 2 1 1 3 8 2 1 2 10
Uinta County Totals 176 27 59 11 5 18 56 18 60 3 11 11 74
Location of Alcohol Consumption
DepartmentNumber of
ReportsEvanston PD Golf Course 1
Howard Johnson's 1Kate's 1Legal Tender 11Lotty's 21Old Mill 1
Lyman PD Bridger Club 1Mountain View PD Bowling Alley 1Uinta SO Lotty's 2
Raven's Nest 1
* Total of percents in Location of Consumption and Point of Sale categories may exceed 100% due to single arrests involving more than on location or point of sale.
Location of Alcohol Consumption and Point of Sale by Department
Location of Consumption Point of Sale
Bar Name
88
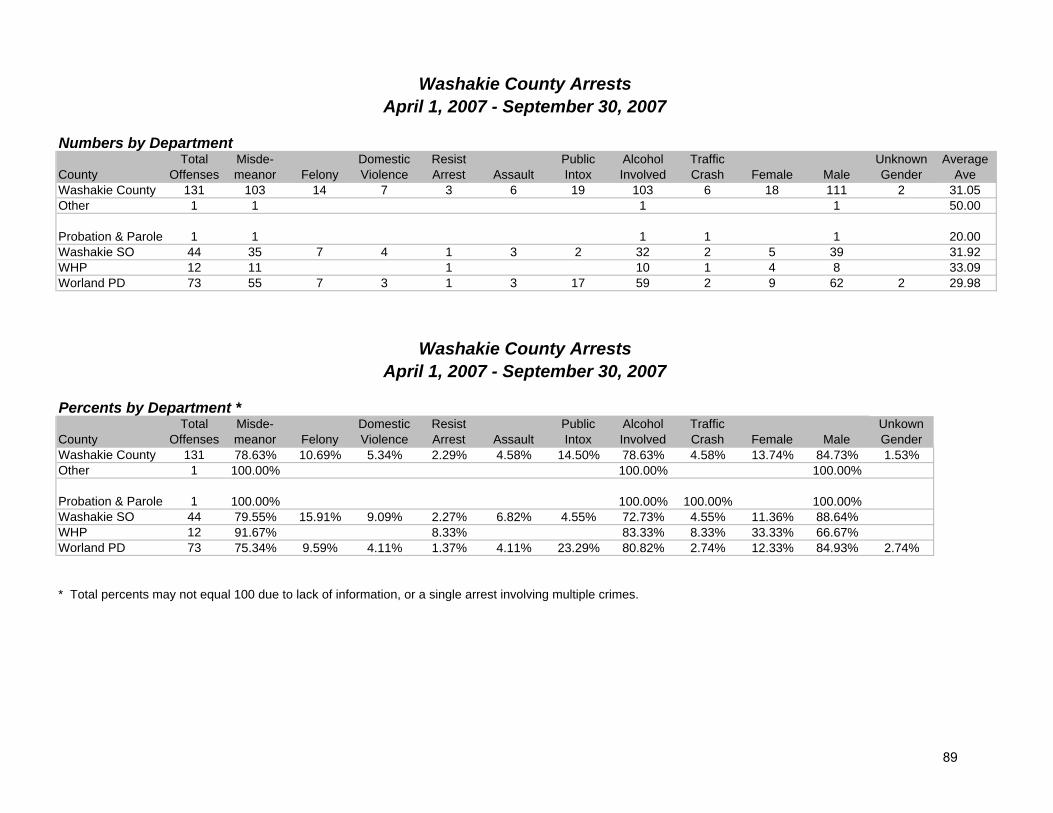
Numbers by Department
CountyTotal
OffensesMisde-meanor Felony
Domestic Violence
Resist Arrest Assault
Public Intox
Alcohol Involved
Traffic Crash Female Male
Unknown Gender
Average Ave
Washakie County 131 103 14 7 3 6 19 103 6 18 111 2 31.05Other 1 1 1 1 50.00
Probation & Parole 1 1 1 1 1 20.00Washakie SO 44 35 7 4 1 3 2 32 2 5 39 31.92WHP 12 11 1 10 1 4 8 33.09Worland PD 73 55 7 3 1 3 17 59 2 9 62 2 29.98
Percents by Department *
CountyTotal
OffensesMisde-meanor Felony
Domestic Violence
Resist Arrest Assault
Public Intox
Alcohol Involved
Traffic Crash Female Male
Unkown Gender
Washakie County 131 78.63% 10.69% 5.34% 2.29% 4.58% 14.50% 78.63% 4.58% 13.74% 84.73% 1.53%Other 1 100.00% 100.00% 100.00%
Probation & Parole 1 100.00% 100.00% 100.00% 100.00%Washakie SO 44 79.55% 15.91% 9.09% 2.27% 6.82% 4.55% 72.73% 4.55% 11.36% 88.64%WHP 12 91.67% 8.33% 83.33% 8.33% 33.33% 66.67%Worland PD 73 75.34% 9.59% 4.11% 1.37% 4.11% 23.29% 80.82% 2.74% 12.33% 84.93% 2.74%
* Total percents may not equal 100 due to lack of information, or a single arrest involving multiple crimes.
Washakie County ArrestsApril 1, 2007 - September 30, 2007
Washakie County ArrestsApril 1, 2007 - September 30, 2007
89
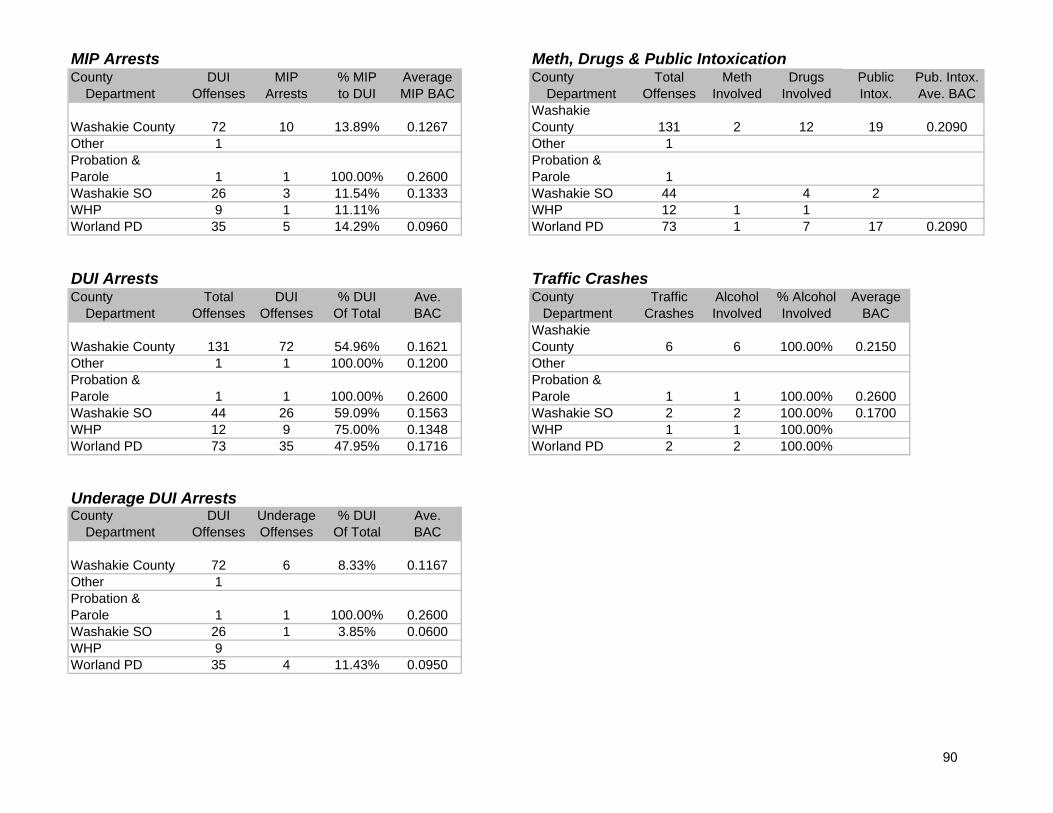
MIP Arrests Meth, Drugs & Public IntoxicationCounty DUI MIP % MIP Average County Total Meth Drugs Public Pub. Intox. Department Offenses Arrests to DUI MIP BAC Department Offenses Involved Involved Intox. Ave. BAC
Washakie County 72 10 13.89% 0.1267Washakie County 131 2 12 19 0.2090
Other 1 Other 1Probation & Parole 1 1 100.00% 0.2600
Probation & Parole 1
Washakie SO 26 3 11.54% 0.1333 Washakie SO 44 4 2WHP 9 1 11.11% WHP 12 1 1Worland PD 35 5 14.29% 0.0960 Worland PD 73 1 7 17 0.2090
DUI Arrests Traffic CrashesCounty Total DUI % DUI Ave. County Traffic Alcohol % Alcohol Average Department Offenses Offenses Of Total BAC Department Crashes Involved Involved BAC
Washakie County 131 72 54.96% 0.1621Washakie County 6 6 100.00% 0.2150
Other 1 1 100.00% 0.1200 OtherProbation & Parole 1 1 100.00% 0.2600
Probation & Parole 1 1 100.00% 0.2600
Washakie SO 44 26 59.09% 0.1563 Washakie SO 2 2 100.00% 0.1700WHP 12 9 75.00% 0.1348 WHP 1 1 100.00%Worland PD 73 35 47.95% 0.1716 Worland PD 2 2 100.00%
Underage DUI ArrestsCounty DUI Underage % DUI Ave. Department Offenses Offenses Of Total BAC
Washakie County 72 6 8.33% 0.1167Other 1Probation & Parole 1 1 100.00% 0.2600Washakie SO 26 1 3.85% 0.0600WHP 9Worland PD 35 4 11.43% 0.0950
90
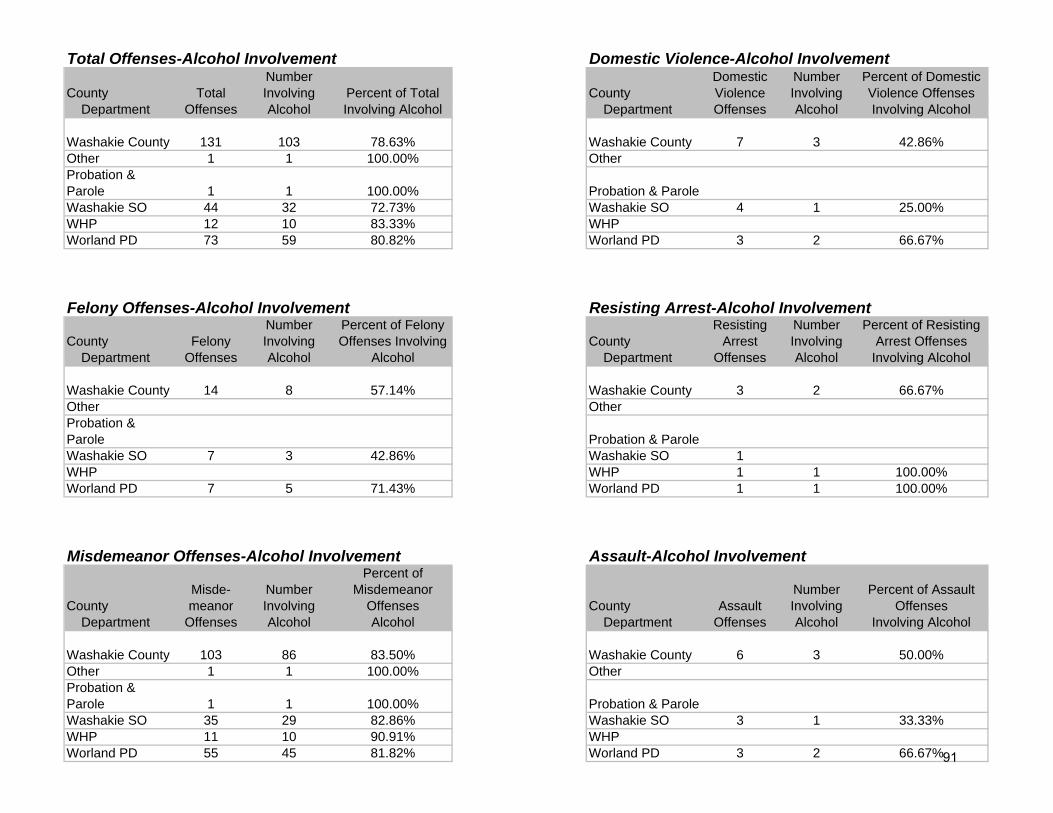
Total Offenses-Alcohol Involvement Domestic Violence-Alcohol Involvement
County TotalNumber Involving Percent of Total County
Domestic Violence
Number Involving
Percent of Domestic Violence Offenses
Department Offenses Alcohol Involving Alcohol Department Offenses Alcohol Involving Alcohol
Washakie County 131 103 78.63% Washakie County 7 3 42.86%Other 1 1 100.00% OtherProbation & Parole 1 1 100.00% Probation & ParoleWashakie SO 44 32 72.73% Washakie SO 4 1 25.00%WHP 12 10 83.33% WHPWorland PD 73 59 80.82% Worland PD 3 2 66.67%
Felony Offenses-Alcohol Involvement Resisting Arrest-Alcohol Involvement
County FelonyNumber Involving
Percent of Felony Offenses Involving County
Resisting Arrest
Number Involving
Percent of Resisting Arrest Offenses
Department Offenses Alcohol Alcohol Department Offenses Alcohol Involving Alcohol
Washakie County 14 8 57.14% Washakie County 3 2 66.67%Other OtherProbation & Parole Probation & ParoleWashakie SO 7 3 42.86% Washakie SO 1WHP WHP 1 1 100.00%Worland PD 7 5 71.43% Worland PD 1 1 100.00%
Misdemeanor Offenses-Alcohol Involvement Assault-Alcohol Involvement
CountyMisde-meanor
Number Involving
Percent of Misdemeanor
Offenses County AssaultNumber Involving
Percent of Assault Offenses
Department Offenses Alcohol Alcohol Department Offenses Alcohol Involving Alcohol
Washakie County 103 86 83.50% Washakie County 6 3 50.00%Other 1 1 100.00% OtherProbation & Parole 1 1 100.00% Probation & ParoleWashakie SO 35 29 82.86% Washakie SO 3 1 33.33%WHP 11 10 90.91% WHPWorland PD 55 45 81.82% Worland PD 3 2 66.67%91

Location of Alcohol Consumption and Point of Sale by Department
Location of Consumption Point of SaleAlcohol No Drive Liquor No
Department Involved Home Bar Party Car Other Response Home Bar Up Party Store ResponseOther 1 1 1
Probation & Parole 1 1 1Washakie SO 32 9 7 2 3 7 6 1 8 2 4 17
Location of Consumption Point of Sale
WHP 10 1 4 1 1 1 2 1 3 1 1 4Worland PD 59 12 19 7 1 3 18 5 19 1 2 6 27Washakie County Totals 103 22 30 11 5 11 27 7 30 3 3 11 50
Location of Alcohol Consumption
DepartmentNumber of
ReportsWashakie SO Buffalo Rose 1
Rendezvous 1
Bar Name
WHP Little Chief 1Rendezvous 1Rock Bottom 2
Worland PD Rendezvous 2Rock Bottom 9Ten Sleep 1
* Total of percents in Location of Consumption and Point of Sale categories may exceed 100% due to single arrests involving more than on location or point of sale.
92

Numbers by Department
CountyTotal
OffensesMisde-meanor Felony
Domestic Violence
Resist Arrest Assault
Public Intox
Alcohol Involved
Traffic Crash Female Male
Unknown Gender
Average Ave
Weston County 37 34 0 2 0 4 0 31 3 9 28 0 37.85Newcastle PD 20 19 1 2 17 6 14 39.50Upton PD 2 1 2 1 1 18.00Weston SO 12 11 1 2 9 2 2 10 37.82WHP 3 3 3 1 3 34.67
Percents by Department *
CountyTotal
OffensesMisde-meanor Felony
Domestic Violence
Resist Arrest Assault
Public Intox
Alcohol Involved
Traffic Crash Female Male
Unkown Gender
Weston County 37 91.89% 0.00% 5.41% 0.00% 10.81% 0.00% 83.78% 8.11% 24.32% 75.68% 0.00%Newcastle PD 20 95.00% 5.00% 10.00% 85.00% 30.00% 70.00%Upton PD 2 50.00% 100.00% 50.00% 50.00%Weston SO 12 91.67% 8.33% 16.67% 75.00% 16.67% 16.67% 83.33%WHP 3 100.00% 100.00% 33.33% 100.00%
* Total percents may not equal 100 due to lack of information, or a single arrest involving multiple crimes.
Weston County ArrestsApril 1, 2007 - September 30, 2007
Weston County ArrestsApril 1, 2007 - September 30, 2007
93
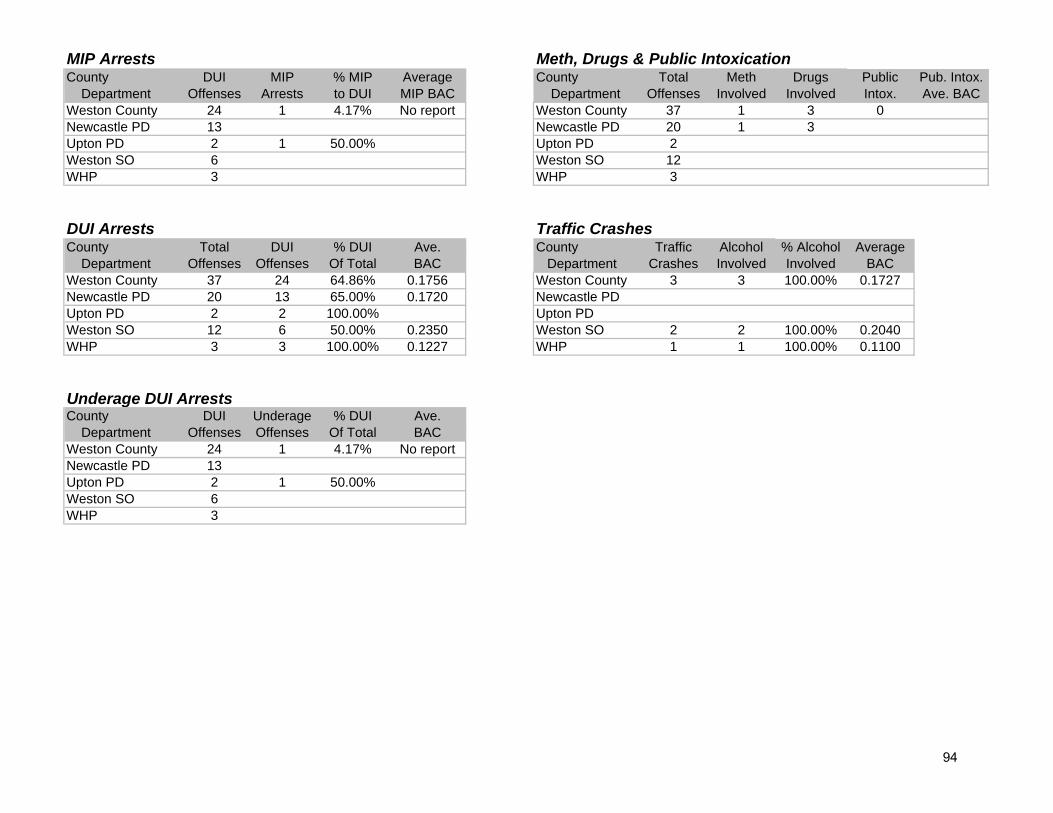
MIP Arrests Meth, Drugs & Public IntoxicationCounty DUI MIP % MIP Average County Total Meth Drugs Public Pub. Intox. Department Offenses Arrests to DUI MIP BAC Department Offenses Involved Involved Intox. Ave. BACWeston County 24 1 4.17% No report Weston County 37 1 3 0Newcastle PD 13 Newcastle PD 20 1 3Upton PD 2 1 50.00% Upton PD 2Weston SO 6 Weston SO 12WHP 3 WHP 3
DUI Arrests Traffic CrashesCounty Total DUI % DUI Ave. County Traffic Alcohol % Alcohol Average Department Offenses Offenses Of Total BAC Department Crashes Involved Involved BACWeston County 37 24 64.86% 0.1756 Weston County 3 3 100.00% 0.1727Newcastle PD 20 13 65.00% 0.1720 Newcastle PDUpton PD 2 2 100.00% Upton PDWeston SO 12 6 50.00% 0.2350 Weston SO 2 2 100.00% 0.2040WHP 3 3 100.00% 0.1227 WHP 1 1 100.00% 0.1100
Underage DUI ArrestsCounty DUI Underage % DUI Ave. Department Offenses Offenses Of Total BACWeston County 24 1 4.17% No reportNewcastle PD 13Upton PD 2 1 50.00%Weston SO 6WHP 3
94

Total Offenses-Alcohol Involvement Domestic Violence-Alcohol Involvement
County TotalNumber Involving Percent of Total County
Domestic Violence
Number Involving
Percent of Domestic Violence Offenses
Department Offenses Alcohol Involving Alcohol Department Offenses Alcohol Involving AlcoholWeston County 37 31 83.78% Weston County 2 0Newcastle PD 20 17 85.00% Newcastle PD 1Upton PD 2 2 100.00% Upton PDWeston SO 12 9 75.00% Weston SO 1WHP 3 3 100.00% WHP
Felony Offenses-Alcohol Involvement Resisting Arrest-Alcohol Involvement
County FelonyNumber Involving
Percent of Felony Offenses Involving County
Resisting Arrest
Number Involving
Percent of Resisting Arrest Offenses
Department Offenses Alcohol Alcohol Department Offenses Alcohol Involving AlcoholWeston County 0 0 Weston County 0 0Newcastle PD Newcastle PDUpton PD Upton PDWeston SO Weston SOWHP WHP
Misdemeanor Offenses-Alcohol Involvement Assault-Alcohol Involvement
CountyMisde-meanor
Number Involving
Percent of Misdemeanor
Offenses County AssaultNumber Involving
Percent of Assault Offenses
Department Offenses Alcohol Alcohol Department Offenses Alcohol Involving AlcoholWeston County 34 28 82.35% Weston County 4 2 50.00%Newcastle PD 19 16 84.21% Newcastle PD 2 1 50.00%Upton PD 1 1 100.00% Upton PDWeston SO 11 8 72.73% Weston SO 2 1 50.00%WHP 3 3 100.00% WHP
95
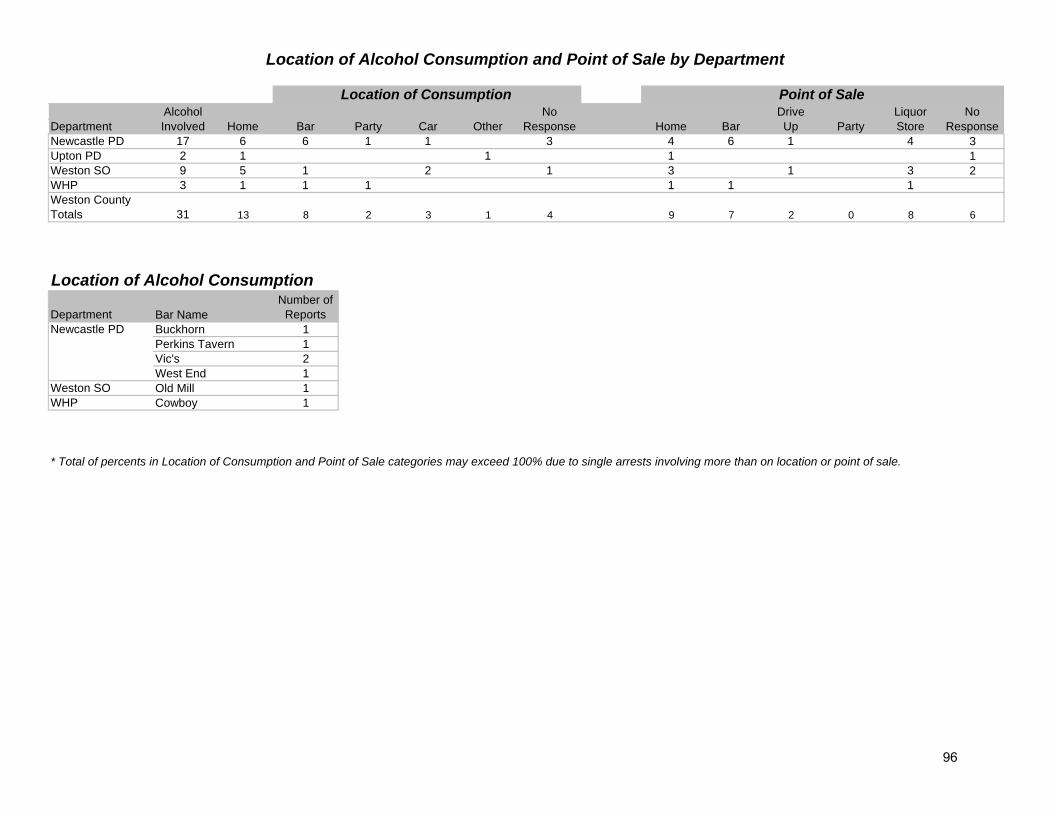
Location of Alcohol Consumption and Point of Sale by Department
Location of Consumption Point of SaleAlcohol No Drive Liquor No
Department Involved Home Bar Party Car Other Response Home Bar Up Party Store ResponseNewcastle PD 17 6 6 1 1 3 4 6 1 4 3Upton PD 2 1 1 1 1Weston SO 9 5 1 2 1 3 1 3 2WHP 3 1 1 1 1 1 1
Location of Consumption Point of Sale
Weston County Totals 31 13 8 2 3 1 4 9 7 2 0 8 6
Location of Alcohol ConsumptionLocation of Alcohol Consumption
DepartmentNumber of
ReportsNewcastle PD Buckhorn 1
Perkins Tavern 1Vic's 2West End 1
Bar Name
Weston SO Old Mill 1WHP Cowboy 1
* Total of percents in Location of Consumption and Point of Sale categories may exceed 100% due to single arrests involving more than on location or point of sale.
96