ALBANIA COUNTRY ASSISTANCE EVALUATION -...
92
Report No. 33532 ALBANIA COUNTRY ASSISTANCE EVALUATION September 13, 2005 Country Evaluation and Regional Relations Operations Evaluation Department Document of the World Bank
-
Upload
duongthuan -
Category
Documents
-
view
219 -
download
1
Transcript of ALBANIA COUNTRY ASSISTANCE EVALUATION -...

Report No. 33532
ALBANIA
COUNTRY ASSISTANCE EVALUATION September 13, 2005
Country Evaluation and Regional Relations Operations Evaluation Department
Document of the World Bank

Acronyms AAA Analytical and Advisory Activities CAE Country Assistance Evaluation CAS Country Assistance Strategy CDD Community Driven Development CEM Country Economic Memorandum CPAR Country Procurement Assessment Report EBRD European Bank for Reconstruction and Development ECA Europe and Central Asia ESW Economic and Sector Work EU European Union FIAS Foreign Investment Advisory Service FYR Former Yugoslav Republic GDP Gross Domestic Product GNI Gross National Income HII Health Insurance Institute IBRD International Bank for Reconstruction and Development IDA International Development Association IFC International Financial Corporations IMF International Monetary Fund INSIG The Insurance Institute MDG Millennium Development Goals MIGA Multilateral Investment Guarantee Agency MOE Ministry of Education MOH Ministry of Health MOLSA Ministry of Labor and Social Affair MTEF Medium Term Expenditure Framework NGO Non-governmental Organization NSSED National Strategy for Social and Economic Development OED Operations Evaluation Department PIU Project Implementation Unit PPAR Project Performance Assessment Report PRSC Poverty Reduction Support Credit PRGF Poverty Reduction and Growth Facility PRSP Poverty Reduction Strategy Paper QAG Quality Assurance Group SAA Stabilization Association Agreement SAC Structural Adjustment Credit SAP Stabilization and Association Process SCA Savings and Credit Associations UNDP United Nations Development Program USAID United States Agency for International Development
Director-General, Operations Evaluation : Mr. Vinod Thomas Director, Operations Evaluation Department : Mr. Ajay Chhibber Senior Manager, Country Evaluation & Regional Relations : Mr. R. Kyle Peters Task Manager : Mr. Jorge García-García

Contents Preface ..............................................................................................................................................i Summary ....................................................................................................................................... iii Summary of CAE Ratings .............................................................................................................v
1. Background........................................................................................................................1 2. Bank Assistance Strategy
OED Country Assistance Evaluation of late 1990s ......................................................5 Country assistance strategies and progress report: late 1990s, 2000 (PR), 2002.........5
Objectives ..................................................................................................................5 Lending ......................................................................................................................6 OED Assessment of Closed Projects .........................................................................7 ESW ...........................................................................................................................8 Partnership ................................................................................................................9
3. Impact of Assistance
Governance and Institution Building ..........................................................................10 Public Administration and Civil Service .................................................................10 Judiciary and Anti-Corruption ................................................................................11 Local Institutions and Social Consensus .................................................................12
Sustainable Private Sector Growth .............................................................................14 Macroeconomic Stability .........................................................................................14 Private Sector Development ....................................................................................15 Financial Sector Development ................................................................................16 Infrastructure and Urban Development ..................................................................18 Agriculture...............................................................................................................22 Environment and Natural Resources.......................................................................22
Human Development ..................................................................................................22 Social Protection and Poverty Alleviation ..............................................................24 Education.................................................................................................................25 Health ......................................................................................................................28
Overall Ratings ...........................................................................................................30
4. Contributions
Borrower Performance ..............................................................................................32 Bank Performance .....................................................................................................33 Other Partners............................................................................................................34
5. Lessons and Recommendations......................................................................................36

Contents (continued)
Figures 1.1 Real GDP Growth ...............................................................................................................1 1.2 Inflation, Debt and Fiscal Deficit ........................................................................................1 1.3 Current Account Balance and Remittances.........................................................................2 3.1 Governance Indicators: Albania 2002 ...............................................................................12 Tables 2.1 Albania—Lending by Sector: FY97-FY04 ........................................................................6 2.2 Comparative Bank Budget by Cost Category: 2000-2004 ..................................................7 2.3 Key OED Indicators for Outcomes, Institutional Development and Sustainability for Albania, ECA and World Bank, FY97-04.....................................................................8 2.4 ESW and Lending Program.................................................................................................8 3.1 Albania-Indicators of Governance and Public Sector Management .................................12 3.2 Summary of Outcome Ratings for Governance and Institution Building .........................13 3.3 Albania-Indictors of Economic Performance....................................................................15 3.4 Albania-Indicators of Financial Sector Performance ........................................................17 3.5 Financial Sector Indicators of Albania and Comparator Countries: 1997, 2003...............18 3.6 Albania-Indicators of Performance in Electricity..............................................................19 3.7 Albania-Indicators of Performance in Water Sector .........................................................20 3.8 Albania-Indictors of Performance in Other Infrastructure ................................................21 3.9 Summary of Outcomes Ratings for Sustainable Private Sector Growth ...........................23 3.10 Albania-Indicators of Performance in Reducing and Alleviating Poverty........................25 3.11 Albania-Indicators of Performance in Education ..............................................................27 3.12 Albania-Indicators of Performance in Health....................................................................29 3.13 Summary of Outcome Ratings for Human Development .................................................30 3.14 Overall Outcome Ratings ..................................................................................................30 Annexes Annex A : Statistical Annex ..................................................................................................37 Annex B : People Interviewed...............................................................................................53 Annex C : Guide to OED’s Country Assistance Evaluation Methodology ...........................59 Annex D : Management Action Record.................................................................................63 Attachments 1. Comments from the Government ......................................................................................65 2. Chairperson’s Summary ....................................................................................................75 Bibliography .....................................................................................................................79

i
Preface
This Country Assistance Evaluation (CAE) report reviews the Bank’s assistance strategy for Albania from FY98 to FY04. It looks at whether the assistance dealt with the major issues affecting the economy and how it contributed to the accomplishments of the country. The report also assesses the relevance, efficacy, and efficiency of that assistance and recommends actions for the future. The evaluation is based on a review of World Bank documents and on interviews with government officials, Bank staff, officials from other donor agencies, members of non-governmental organizations, academicians and people in the private sector. A Bank mission visited Albania from September 4, 2004 to September 19, 2004. The contribution and the cooperation of government officials and agencies, civil society, private sector, and donors are gratefully acknowledged.
The Regional response to the Management Action Record is attached as Annex D.
A draft of the CAE was shared with the Government of Albania and their comments are presented as Attachment 1. The comments have been incorporated in footnotes attributed to the Government.
The Country Assistance Evaluation was written by Jorge García-García (Task Manager) with contributions by Anthony Pellegrini, Elaine W. Ooi, Ilka Funke, Luis Alvaro Sánchez and Patrice Harou (Consultants). The evaluation benefited from work done by OED on the PRSP and on pensions. This evaluation also benefited from comments of Laurie Effron and two peer reviewers: Messrs. Robert J. Anderson (OEDCR) and Roger Robinson (ECCAR). María Claudia Pachón provided research assistance. Janice Joshi provided administrative support.


iii
Summary
1. After a pyramid scheme collapsed in late 1996 and early 1997, leading to riots and looting, Albania forged a stable economy through sound economic management and stronger economic and political institutions. The government that took over in mid-1997 responded decisively to the crisis and embarked upon a stabilization and reform program that restored stability and created the conditions for the economy to grow at 8.1 percent per year in 1998-2003. Rapid growth has improved overall economic and social conditions but unemployment is high and some social indicators, such as primary and secondary school enrollment, remain behind those of neighboring countries.
2. This evaluation of the World Bank’s assistance program for Albania covers the period FY98 to FY04, and follows on OED’s previous evaluation for the 1992-1997 period. After the European Community, the Bank is the second largest donor to Albania, with 32 credits granted for a total of US$485 million, or about US$22 per capita per year. Annual net transfers from the Bank were US$50 million per year.
3. OED ratings of projects completed during the period indicate that Albania ranks higher than the ECA region and the Bank in terms of satisfactory outcomes, but lower in terms of sustainability and institutional development impact. OED ratings also indicate that projects in Albania have lower satisfactory outcomes than in neighboring Bosnia-Herzegovina, Bulgaria, and the FYR Macedonia, but higher than in Romania.
4. The overall development impact of IDA’s assistance is rated as moderately satisfactory. Albania made gains in economic growth and price stabilization, alleviation of poverty, fiscal sustainability of the pension system, and in the electricity and roads sectors. Albania has also shown some gains in civil service reform and stands to gain much in the water sector if the experiment of using private operators to manage water systems succeeds. However, reform has barely reached health and education which are important for ensuring broad-based growth and poverty reduction. Nor has there been much improvement in governance or the investment climate. Where Bank assistance established specific targets for outcomes, such as in energy, results of the assistance have been better than in areas such as governance, where the Bank’s objectives were vaguely articulated.
5. Several lessons emerge from this evaluation. First, Bank assistance was effective when the government adopted and donors supported a sector strategy that laid out a reform agenda with clear and monitorable performance indicators. Second, developing the analytic underpinning and strategy was also important, as was done in the electricity sector but, not by contrast, for issues related to governance, which lacked a clear strategic framework. Third, a series of projects that build around pilot phases, such as in water supply, are more likely to have an impact at a country level than a number of small projects spread over many sub-sectors which fail to have synergies on a larger scale. Fourth, Bank assistance that sought solutions to institutional and management problems with project implementation units was unable to create lasting, effective institutions; it also undermined the long term objectives of institutional development and project sustainability. Fifth, donor coordination was good following crises, when the government focused on specific

iv
problems such as in energy and finance. Donor coordination in other areas, particularly where there was no crisis, such as in health, was not good and needs improvement.
6. The lessons suggest the following recommendations:
• Country strategies and project design need to move to an outcome-oriented approach. To accomplish this, IDA should establish monitorable and realistic targets for outcomes and design interventions to meet these targets. Where possible interventions should focus on the quality of service delivery and cost recovery, like in electricity and water.
• Bank assistance should increase selectivity, with priority in infrastructure —including urban—health and education. Important issues such as governance and business climate will need to be undertaken in conjunction with and, for areas specifically covered by agreements (the acquis), perhaps under the leadership of the EU.
• The Bank should fill existing gaps in ESW on health, infrastructure, and urban development.
• IDA should start working with the present administrative structures of government and its organizations and gradually phase out the project implementation units.
7. Early in this decade Albania was considered eligible only for IDA lending. Over the last three years Albania’s macroeconomic indicators and GNP per capita have improved substantially, the latter now about double IDA’s operational threshold. Management should review the justification for continued IDA eligibility, explore Albania’s potential creditworthiness for IBRD lending, and ensure that the results of this analysis form the basis for proposals on lending levels and lending terms in the next country assistance strategy.
Vinod Thomas Director-General
Operations Evaluation

v
Summary of CAE Ratings Objectives Outcome Ratings
Governance and Institution Building Moderately
Satisfactory - strengthening public administration
Civil service code adopted, and around 3000 high-level positions created and a medium term expenditure framework is in place (paragraph 3.4)
- strengthening the judiciary and anti- corruption
Limited progress on judicial performance (paragraph 3.5). Corruption indicators deteriorated (paragraph 3.7).
- strengthening local capacity
Progress in strengthening local capacity (paragraphs 3.8-3.9).
Sustainable Private Sector Growth Moderately
Satisfactory
- Macro stability Macro stability achieved (paragraph 3.15)
- PSD Business climate showed little improvement (paragraph 3.18).
- FSD Pyramid schemes collapse dealt with, government banks privatized, financial sector depth increased (paragraphs 3.21, 3.24).
- infrastructure and urban development
Infrastructure showed improvement, especially in energy (paragraphs 3.26-3.30).
- agriculture Progress in irrigation, but little progress in other aspects (paragraph 3.33).
- environment and natural resources
Progress in forestry and water sector, but national environmental action plan not implemented (paragraph 3.34).
Human Development and Poverty Alleviation Moderately
Satisfactory
- social protection Poverty reduced and targeting of social programs improved (paragraphs 3.40-3.41, 3.56).
- education School enrollment increase, and infrastructure improved, but sector policy weak and expenditure targets not met (paragraphs 3.47-3.48).
- health Health outcomes mixed, and expenditure targets not met (paragraph 3.53-3.54, 3.56).
Overall Moderately Satisfactory


1
1. Background
1.1 When Albania began its transformation from communism to a market economy, per capita income was significantly lower than that of neighboring Eastern and Central European countries at an estimated US$300 (Atlas methodology) in 1992, or, one-fifth and one-third of the per capita income of Poland and of the Former Yugoslav Republic of Macedonia (FYROM), respectively. Since 1992 real GDP in Albania has grown at 5.7 percent per year and real per capita income doubled (see figure 1.1). In 2003 its 3.2 million people had a per capita income of US$1,740.1
1.2 The early transition years 1992-96. After 50 years, the repressive communist regime in Albania collapsed in 1991 under serious economic difficulties (figure 1.2). Serious reforms began in 1992. By 1996, inflation had fallen to 13 percent and the economy had been growing at 9 percent per year since 1993.
1.3 The pyramid schemes 1996-1997. The banking system provided few services to customers2 and its inadequacy played a significant role in the growth of an informal market that included funds that invested on their own account—rather than lend, like other informal companies—offering high rates of return. In 1996 new firms entered the market offering higher rates and forcing the established firms to match the rates offered by the new entrants. Eventually the system collapsed in late 1996-early 1997, leading to riots and looting that brought Albania to the brink of anarchy and destroyed part of the country’s
1 The large increase in nominal dollar income between 1992 and 2000 comes from the rapid growth in real income, the increase in nominal lek income and the appreciation of the lek since 1997. 2 Even today, payments are still largely made in cash and the clearing time for payments between accounts of different branches of the same bank takes days.
Figure 1.1: Real GDP Growth
-
20
40
60
80
100
120
140
160
1990 1991 1992 1993 1994 1995 1996 1997 1998 1999 2000 2001 2002 2003
Years
Inde
x (1
990=
100)
GDP GDP per capita
Figure 1.2: Inflation, Debt and Fiscal Deficit (% )
0
50
100
150
200
250
1990 1991 1992 1993 1994 1995 1996 1997 1998 1999 2000 2001 2002 2003 2004p
Years
0
5
10
15
20
25
30
35
Fiscal Deficit
Inflation Debt/GDP Fiscal Deficit/GDP

2
already crippled infrastructure. The unrest caused the collapse of the government in June 1997.3
1.4 The aftermath of the crisis and economic recovery. The long-term economic effects of the crisis were surprisingly limited considering that the schemes’ liabilities were about half of GDP in 1996. The immediate impact of the turmoil was a rise in inflation to 40 percent, a 10.7 percent drop in GDP in 1997 and a sharp rise in the fiscal deficit financed with domestic borrowing. The government that took over in mid-1997 sought to restore economic stability and agreed to an adjustment program with the IMF. The Bank of Albania adopted a tight monetary policy, lending by the state-owned banks was restricted, and the government made a sizeable effort to control expenditure and increase revenues. It also started a long-overdue banking sector reform program. The government has since followed cautious fiscal and monetary polices, the economy has grown at about 8.1 percent per year since 1998 and inflation fell to about 1 percent in 2003. Albania’s GDP and GDP per capita in 2003 are 40 percent higher than in 1990 (see figure 1.2).
1.5 The disruptions that followed the early years of transition induced about 370,000 Albanians to migrate. This diaspora now sends about US$620 million per year (15.2 percent of GDP) in remittances (figure 1.3). An estimated 20-25 percent of the population (or about 40-50 percent of the active workforce) is working abroad, mainly in Italy and Greece.
1.6 Growth Sources. The changes that have taken place during the last 12 years are considerable and probably irreversible. The private sector produces about three-quarters of GDP and agriculture generated about 25 percent of GDP in 2002, down from 34 percent of GDP in 1992. Prudent macroeconomic management has set the basis for economic stability, and structural reforms have driven large gains in total factor productivity, gains that account for the growth in 1993-1996 and for about 80 percent of it since then. Future large gains in productivity from reallocating resources are unlikely, so growth will have to depend mainly on factor accumulation (capital and labor) and technical change.4
1.7 Government strategy. While the crises that have affected Albania have largely shaped government strategy some structural problems have also shaped it. First and foremost, the pyramid crisis destabilized the economy, forcing the government to set as
3 See Carlos Elbirt's vivid account of the event in his Encuentro con Albania, (Salta-Argentina, Ediciones del Robledal, 2001), pp. 33-47; Chris Jarvis presents a detailed account of the main economic developments in The Rise and Fall of the Pyramid Schemes in Albania, (Washington, D.C., IMF Working Paper WP/99/98, July 1999). These schemes are also known as Ponzi schemes. 4 Albania–Sustaining Growth Beyond Transition, CEM 2004.
Figure 1.3: Current Account Balance and Remittances (% of GDP)
-70-60-50-40-30-20-10
0102030
1990 1991 1992 1993 1994 1995 1996 1997 1998 1999 2000 2001 2002 2003
Years
(%)
Current Account Remittances

3
priority to achieve macroeconomic stability, and to carry out strong structural reforms to maximize the country’s growth potential. Second, the crumbling infrastructure caused by years of neglect and deliberate destruction by an angry citizenry made a priority rebuilding it. The road network (16,000 km) was in poor condition, especially the secondary and tertiary levels. Shortages, blackouts and financial problems plagued the electricity system. Sector capacity of about 1,900 mw has not expanded since the early 1980s and 98 percent reliance on hydroelectricity makes it vulnerable to droughts; in 2000 a severe drought caused a large reduction in energy production that required imports and threatened the fiscal balance. Only 50 percent of Albanians have access to running water inside the dwelling5 and there is virtually no treatment for waste water, which tends to be discharged into rivers. The Kosovo conflict in 1999 brought a large number of refuges that also strained the country’s infrastructure.
1.8 Third, Albania has a relatively well educated population and reasonable health indicators, but social indicators and access to services place the country at the bottom of European countries. In 1997 life expectancy at birth was 71.7 years and infant mortality was 27.6 per 1000 live births, and in 2002 poverty remained at 25 percent and unemployment was about 15 percent. Net school enrollment rates have declined, especially in secondary education where they are below 50 percent.6 Malnutrition among children seems to be prevalent.7 The quality and quantity of health infrastructure have deteriorated over the last 25 years, and access to health services continues to be meager and expensive, especially in rural areas. If Albania is going to enter the EU and compete successfully in that market it needs to improve the quality of its human resources. Fourth, the desire to become a member of the EU and create a favorable investment climate make it necessary to seek respect for the law. Corruption permeates all levels of the bureaucracy, including the judiciary, and attempts to curb it have failed. Moreover, state capture and informal monopolies could hinder development if left to fester. Similarly, property rights, especially for land, are ill-defined, and the courts and the legal system do not enforce contracts, leaving private parties to settle the disputes between themselves.8
1.9 Government strategy took shape in an Interim Poverty Reduction Strategy Paper (I-PRSP) in 2000, which evolved into the Growth and Poverty Reduction Strategy (GPRS) in 2001. The GPRS evolved into the National Strategy for Social and Economic Development (NSSED), a government owned strategy that articulates a long-term vision of sustainable development designed to move from managing short-term crises to
5 The World Bank, Poverty Assessment 2003, p.15. Sanitary conditions are also bad as 46 percent of the population lack access to a piped toilet. Ibid. These data differ from the ones in Annex Tables 1 and 2, that come from the Bank’s World Development Indicators. 6 UNDP, The Albanian Response to the Millennium Development Goals, Tirana, May 2002, p.19, prepared by the Human Development Promotion Center. 7 Almost one in three Albanian children is moderately stunted, while about one in six are severely stunted according to UNICEF’s Multiple Indicator Cluster (MCIS) Survey Report of 2000. 8 The government notes that the Law on Property Restitution and Compensation, approved in June 2004, provides a sound basis to tackle with the issue of property rights and title (see Attachment 1).

4
creating the conditions that promote long-term growth and reduce poverty. The strategy rests on the pillars of governance and strong economic growth, but also emphasizes policy interventions to improve education, healthcare and infrastructure and calls for stronger public accountability and increased public participation in decision-making to empower the poor. Annual progress reports make adjustment to the NSSED as new information becomes available. The NSSED provides a framework for monitoring and evaluation, one of its outcomes being a Medium Term Expenditure Framework (MTEF) linking budget allocations to development objectives.

5
2. Bank Assistance Strategy
OED country assistance review of late 1990s
2.1 The first OED evaluation of country assistance to Albania covered the period 1992-97. IDA’s strategy of the early nineties emphasized flexibility and its lending was characterized by many small operations with simple designs. The review found merit in this approach, but noted that it strained IDA’s budgetary resources, diluted effort in any one area, and resulted in a blurred strategy. Paradoxically, many individual credits had good outcomes, but their sum was not sufficient to have impact at the sectoral or national level. The focus on the portfolio of projects had detracted management attention from larger issues of policy and institutional reforms. The review also found that weak public sector institutions undermined progress in improving quality of public services and concluded that governance and institutional reforms were critical components for future strategies. Finally, IDA assistance had faltered in several sectors such as finance, health, and education, and lack of a sector strategy or a well-defined vision may have contributed to the problems.
2.2 The review recommended that the Bank become more selective in its interventions, emphasize ESW where sector strategies were absent and increase efforts to build a consensus for reforms and policies among donors and within the government. Particular attention was needed to ensure geographical balance of projects, to promote public awareness of the rationale for Bank lending, and to use participatory approaches for project design to improve the accountability of service providers and implementing agencies. Finally, the review recommended more attention be given to aid coordination.
Country assistance strategies and progress report: late 1990s, 2000 (PR), 2002
2.3 Since 1998, IDA assistance to Albania has been framed by the crises mentioned in Chapter 1. The 1997 pyramid crisis required immediate assistance and shaped the FY98 strategy. The Kosovo crisis of 1999-2000 focused the FY00 progress report on macroeconomic fundamentals and immediate actions to prevent serious social and economic upheaval. The FY02 strategy centered around the PRSP and the PRSCs, putting greater emphasis on structural issues.
Objectives
2.4 Both country assistance strategies (FY98 and 02) and the intervening progress update (FY00) maintained three basic pillars: (a) improve governance and institutions; (b) promote private sector growth; and (c) foster human development. Each pillar was supported by sub-objectives (a total of 15) that remained largely unchanged during the period.
2.5 Although it is difficult to argue that the specific objectives were not relevant, the strategies suffered from the earlier problem of lack of selectivity. The FY02 CAS was developed in conjunction with the government in the context of the Poverty Reduction Strategy process, and although the resulting strategy was consistent with the

6
government’s, it also lacked clear priorities for action. Selectivity remains a challenge for IDA’s assistance strategy.9
Lending
2.6 Between FY98 and FY04, IDA approved 32 credits for a total of US$485 million (table 2.1). The overall level and sectoral distribution of lending was broadly consistent with those proposed in the strategies, albeit some 22 percent above the aggregate base cases proposed in the country assistance strategies. The bulk of the assistance went to infrastructure, with roughly one-third of the number of projects and the volume of lending, mostly for the electricity sector and road networks, with support increasing after crisis or near-crisis hit both sub-sectors.
2.7 IDA lending between FY98 and 04 had four salient features. First, the total lending amounts were quite high: with average annual per capita lending of $22, Albania received one of the largest transfers among IDA countries of similar size (population between 2 and 10 million).10 Two factors may explain this level of lending. First, Albania’s Country Policy and Institutional Assessment (CPIA), a composite of 20 indicators of policy and institutional performance, was in the top quintile among countries in the early part of the period under review, which meant that its IDA allocation was relatively high.11 Second, Albania had several crises to which IDA responded, thus pushing actual lending above the base case.
2.8 Second, Albania has been well above the IDA cut off level on per capita income for some years now (Albania’s is $1,740, almost twice the $895 per capita income cut off
9 A fuller discussion of linkage between IDA strategy and the PRSP is in OED, OED Review of the Poverty Reduction Strategy (PRS) Initiative, An Independent Evaluation of the World Bank Support Through 2003, Report No. 30226, January 1, 2004, and the case study for Albania. 10 Only Bosnia-Herzegovina, a post-conflict country, and Armenia had higher per capita lending levels among this group of countries over this period. 11 Albania dropped to the second quintile in 2002 and the third quintile in 2003.
Table 2.1: Albania—Lending by Sector: FY98-FY04 (US million dollars) FY98 FY99-01 FY02-04 Total Loan Size Loans Governance 0 48 0 48 16 3 PRSC 0 0 38 38 19 2 Macro 30 45 0 75 25 3 Financial 10 19 15 44 11 4 Infrastructure and Urban Development 27 32 100 159 16 10 Agriculture 0 34 21 55 14 4 Human Development and Poverty Alleviation 17 36 15 68 11 6 Total 84 213 189 485 Total in country assistance strategy 59 * 178 *,** 161 **, + 398 Loan Size 14 14 17 15 Loans 6 15 11 32 32 Source: World Bank database, December 14, 2004. Numbers have been rounded to the nearest integer. The classification by sector here differs from that in Annex Table 3b. The PRSC is separated from social protection, and private sector development and some rural sector loans have been assigned to other sectors. * Country assistance strategy FY98, ** Progress Report FY00, + CAS FY02.

7
for IDA eligibility), but the Bank concluded that Albania was not creditworthy for IBRD lending. Bank management had promised to carry out by FY04 analytic work on Albania’s creditworthiness for IBRD lending. The analysis has not yet been done. The next country assistance strategy should ensure that the results of such an analysis form the basis for proposals on lending levels and lending terms, i.e., IDA versus IBRD.
2.9 Third, the lending has continued to be characterized by a large number of small credits across a large number of sub-sectors, as in the early part of the 1990s. Small project size (average US$15 million, one of the lowest among IDA borrowers of similar size) seems paradoxical in a country that ranked relatively high in terms of country policy and institutional assessment. In addition, this approach has resulted in weaknesses in the lending program similar to the earlier period: high cost of supervision over the past five years—46 percent of direct budget costs spent on supervision compared to 33 percent in the other Balkan countries and 39 percent in the other IDA countries in the ECA Region —and consequently less spent on ESW (see table 2.2). Finally, as in the earlier period, the relatively good outcomes of projects have not consistently translated into equally good outcomes at a sectoral level (see Chapter 3 on Impact of Assistance), and this may be due in part to the lack of synergies among the projects.
Table 2.2: Comparative Bank Budget by Cost Category: 2000-2004 (in percent) Cost Category Albania IDA countries in ECA Region * Balkans **
ESW 15 21 21 Lending 29 28 34 Supervision 46 39 33 Other 10 12 13 Total 100 100 100 Source: World Bank database, Dec. 20, 2004 Note:* Armenia, Georgia, Kyrgyz Republic, Moldova, and Tajikistan. ** Bosnia-Herzegovina, Bulgaria, Croatia, FYROM, Romania, and Serbia-Montenegro. 2.10 Finally, most of the projects were implemented by autonomous project implementation units (PIUs), with staff paid from project funds and budgets which were managed and accounted for outside of the usual budgetary processes. The advantages of this approach are obvious: more control by IDA over implementation and more attention to fiduciary safeguards. The disadvantages are perhaps less obvious but equally present: no focus on capacity building for project management within the administration and potentially more problematic project sustainability following the dissolution of the PIU. The continued reliance on PIUs is at odds with IDA’s stated strategic objective of strengthening public administration, contrary to emerging literature on the disadvantages of using this “enclave” approach, and against the spirit of the recently issued operational note on the use of PIUs.12
OED Assessment of Closed Projects
2.11 For projects exiting between FY97 and FY04, OED rated outcomes of 89 percent of the projects (by value) as satisfactory; 47 percent had substantial institutional 12 See OED Lessons and Practices, 2000, “Utilization of Project Implementation Units” and World Bank, Operations Policy and Country Services (OPCS), internal note on good practice guidance for project management.

8
development impact and 77 percent were considered to have likely sustainability (table 2.3). Albania ranks higher than both the ECA Region and the Bank in terms of satisfactory outcomes, and close to the Bank average but somewhat below ECA in terms of sustainability and institutional development impact.
2.12 Regarding the portfolio, the Quality Assurance Group (QAG) finds that projects in Albania have about 8 percent of total net commitments at risk compared to 21 percent and 18 percent in the ECA region and the Bank.
ESW
2.13 As noted above (paragraph 2.9), IDA spent relatively little on ESW over this period, compared to amounts spent in Balkan countries or in other IDA countries in the ECA Region. Table 2.4 presents information on where ESW was associated with lending, where it was carried out with no associated lending, and where lending was carried out with no associated ESW.
2.14 Quadrant I shows that the Bank covered the fiduciary aspects well, with reports on procurement (CPAR), financial accountability (CFAA), and public expenditure (PEIR). The Bank also completed a Poverty Assessment and was instrumental, with the IMF and other donors, in the country’s preparation of the PRSP and subsequent NSSED (paragraph 1.9). The fiduciary ESW supported the lending for the PRSC, and the 1998 CEM fed into the 1998 strategy and subsequent adjustment lending. Quadrant III shows that the Bank had no ESW in other areas where it lent actively, such as in the financial sector, health, judiciary, port, roads, urban development or local institutions. The Bank compensated to some extent in infrastructure and finance by retaining task managers who provided both experience and continuity to the dialogue. The question remains, however, whether some problems could have been avoided if the program had been built on ESW. Quadrant II
Table 2.3: Key OED Indicators for Outcome, Institutional Development and Sustainability for Albania, ECA and World Bank, FY97-04
Satisfactory Outcome Substantial Institutional Development Impact Likely Sustainability
(percent of disbursements) Albania 89 47 77 ECA 74 52 82 World Bank 79 48 74
Source: World Bank database as of November 18, 2004.
Table 2.4: ESW and Lending Program
ESW Lending
Yes No Quadrant I Quadrant II
CEM 1998 CEM 2004 PRSP support (for PRSCs) Fiscal decentralization CPAR (for PRSCs) FIAS Reports CFAA (for PRSCs) Roma social assessment PEIR (for MTEF in PRSC) Civil society National water strategy Refugee impactElectricity (done with funds from Bank credit) Environment Poverty Assessment 2003 Social safety net review
Yes
Education Sector Review Quadrant III Quadrant IV
Legal and judiciary Telecommunications Financial sector Ports Roads Trade and transport Urban development Local institutions (Community works)
No
Health Source: Adapted from information in World Bank database as of March 17th, 2004.

9
shows a belated fiscal decentralization report, several FIAS reports that informed the Bank’s views on corruption and an update to the 1993 report on the environment.
Partnerships
2.15 Donor partnerships have a mixed record in Albania, working well during crises and not working well in normal periods. In the electricity sector, for example, when the government’s reform program went off track in 1997/98, the donors agreed to halt assistance and to resume only once targets under an agreed action plan were met. The 2000 drought served to further catalyze efforts from donors and the authorities. In other sectors, where the problems were serious but there was no crisis, donor coordination was not as urgent and did not work. In the Health Reform project (FY98), for example, some of the numerous co-financiers failed to deliver support to key activities, resulting in cancellation of project components. The Community Works Project (FY99) had a similar, but less dramatic, experience.
2.16 The EU took a major role in aid coordination, providing technical assistance to the government to help it in the process. After the 1997 crisis and aftermath, an informal aid group called Friends of Albania was established to keep donors informed of their activities, and to monitor progress in reforms, but because it meets under the aegis of a political agency (the Organization for Security and Co-operation in Europe), its focus is not on poverty reduction and economic growth and is therefore not well placed to coordinate economic assistance efforts. The PRSP process, by contrast, which became the government’s NSSED, was supposed to involve other donors, but it too suffered initially from lack of donor participation, and may have even exacerbated tensions among donors. First, donors saw it as largely Bank-driven and were unwilling to align their own programs with it. In addition, when the PRSP was relatively new in Albania, the Millennium Development Goals (MDGs) were published. The UNDP, who monitors progress on the MDG, perceived the PRSP as an input into the process, while the Bank viewed the PRSP as a coordinating framework which could help government set priorities, even among the MDGs. Finally, there have been disagreements within the government as well as among donors on which Ministry should take primary responsibility for compiling databases on aid commitments.
2.17 Since 2003 donors have been making efforts to coordinate aid again, with the establishment of a group comprising all bilateral and multilateral diplomatic missions, which meets quarterly with a rotating chair. It is organized around four themes, each with a lead donor for a sub-thematic working group: socioeconomic development (World Bank), rule of law and security (EU), democratization and human rights (Organization for Security and Co-operation in Europe) and governance and capacity building (UNDP). Government officials also participate in these meetings. In addition, the government has established a department of the NSSED within the Ministry of Finance to coordinate all activities related to it. Aid coordination remains a challenge, particularly for the government to ensure that donor input aligns with both the NSSED and the EU accession agenda.

10
3. Impact of Assistance
Governance and Institution Building
3.1 The collapse of communism in Albania allowed the unspoken reality of the poor public administration and popular lack of respect for the state, government institutions and the rule of law to surface. Twelve years later, these attitudes remain as evidenced by the findings of a number of surveys about perceptions of corruption in Albania.13
3.2 The late 1990’s country assistance review found that IDA assistance strategy had a marginal impact on the quality of governance and low efficacy in the public administration reform program. The review made improving governance and the quality of public administration high priorities and recommended: (a) articulating a sound conceptual framework for the core public sector and public management; and (b) preparing comprehensive sector work to help reach a consensus with the government about the path of reform. The subsequent country assistance strategies sought to: (a) strengthen the public administration and make the civil service professional; (b) strengthen the judiciary and eliminate corruption; and (c) strengthen local institutions and build social consensus.
Public Administration and Civil Service
3.3 IDA took several actions to help strengthen public administration and civil service.14 Fiduciary ESW was undertaken and the recommendations were incorporated into the two PRSCs.15 The basic financial accountability system is in place, but its impact depends on whether it is implemented and enforced.
3.4 Bank lending sought to strengthen: (a) public expenditure management; (b) human resource management; and (c) policy formulation and policy coordination. The most significant achievement of the assistance has been the implementation of the Civil Service Law that creates a small, stable, well-paid civil service comprising around 3,000 high level positions. One credit, granted during the Kosovo crisis, helped to safeguard essential public sector functions and monitor and enforce orderly public expenditure. The assistance also helped improve policy formulation and link it with the budget. In particular, the PRSP process contributed to the government adopting a NSSED, and a medium term expenditure framework has been put in place. The process of assigning budget ceilings is fairly developed and the budget is comprehensive. The greatest shortcoming of the assistance has been the slow pace of modernization at the
13 Daniel Kaufmann, Aart Kray, Massimo Mastruzzi, “Governance Matters III: Governance Indicators for 1996, 1998, 2000, and 2002”, The World Bank Economic Review, Vol. 18, 2004, No.2; Foreign Investment Advisory Service (FIAS), Albania: Diagnostic Study (mimeo, Washington, D.C., IFC-World Bank, February 2001); FIAS, Albania: Removing Administrative Barriers to Investment: A Critical Component of the National Development Strategy (mimeo, March 2003). 14 Bank loans that supported this objective were: Public Expenditure Support Credit, FY99; Public Administration Reform Project, FY00; PRSC 1 and 2, FY02 and FY04. 15 IDA prepared a Public Expenditure Institutional Review (PEIR), a Country Financial Accountability Assessment, and a Country Procurement Assessment Review.

11
Treasury, which continues to operate unchanged. Overall, public administration and civil service show improvements. The International Country Risk Group (ICRG) index for bureaucratic quality shows an increase from 1 to 2 between December 1997 and December 2004.16 (See table 3.1).
Judiciary and Anti-Corruption
3.5 The main support for the judiciary has been the Structural Adjustment Credit (SAC, FY99) and the Legal and Judicial Reform Credit (FY00), complemented by assistance from the EU, USAID, and the Soros Foundation. No sector work supported the projects, that sought to improve: (a) court management; (b) the enforcement capacity of court decrees; (c) training in modern legal methods; and (d) availability of information to the public. The SAC asked for all judges with less than 10 year experience to be tested for re-accreditation and those who failed were dismissed. The on-going Legal project includes a wide range of components that try to lay institutional foundations rather than to focus on results. Some components have been completed but the impact on the overall performance of the judicial sector has been limited; surveys continue to identify the performance of the court system as a major problem.17 The ICRG index for law and order deteriorated from 3 to 2 between December 1997 and December 2004.18 (See table 3.1)
3.6 The Bank has supported various anti-corruption efforts, beginning with the 1998 National Anti-corruption Program. Based on a CPAR Albania has issued new procurement legislation and strengthened the procurement office under the Ministry of Finance, although the full impact of the legal change has yet to be felt. The new procurement system covers all agencies and transactions but the procurement agency is not yet protected by civil service regulations.19 Albania seems to have the most well-designed procurement system in the Balkans but has no system in place yet to evaluate its quality or monitor performance. More recently Bank assistance has focused on anti-corruption through the PRSC, and the government issued legislation that requires high officials to declare their assets. The officials interviewed by the evaluation mission consider this law an important step in combating corruption, but its effectiveness is muted by the lack of proper enforcement mechanisms to track transactions and property ownership. Finally, a specialized small group under the Cabinet of Ministries monitors a broad anti-corruption strategy but lacks any enforcement power as it has to refer its findings to a prosecutor general.
16 The ICRG index for bureaucratic quality falls between 1 (worst) and 4 (best). 17 See for example, the recent ECA-PSD, Early Warning System (mimeo, 2004). 18 The bounds for the law and order index are 1 (worst) and 6 (best). 19 The Government notes that the Public Procurement Agency is under the Council of Ministers, not under the Ministry of Finance, and that it is protected since 2003 by civil service regulations according to the amendments made to the law on public procurement (see Attachment 1).

12
Comparison between 2002, 2000, 1996 (top-bottom) Country’s Percentile Rank (0-100). Source: D. Kaufmann, R. Kraay and M. Mastruzzi, 2003: Governance Indicators for 1996-2002.
Figure 3.1: Governance Indicators: Albania 2002
0 25 50 75 100
Control ofCorruption
Rule of Law
RegulatoryQuality
GovernmentEffectiveness
2002
2000
1996
Table 3.1: Albania-Indicators of Governance and Public Sector Management Initial Conditions Outcome CAS or Project
Target Dec. 97, Dec. 98 Dec. 03, Dec.04 Political Risk Rating (0 riskiest, 100 least risky) No 60.5 65.5Government Stability (0 worst, 12 best) No 9.5 7.25 Democratic Accountability (0 lowest, 6 highest) No 5 4 Bureaucracy Quality (0 worst, 4 best) No 1 2 Corruption (0 worst, 6 best) No 3 2 Law & Order (0 worst, 6 best) No 3 2 Medium-Term Expenditure Framework Yes No Yes Public employment No 160,800 1/ 109,304 2/ Wage bill/GDP (percent) No 4.78 3/ 4.8 4/ Source: See Annex A, table 9 for details. Notes: 1/ 1995. 2/ February 2004. 3/ 2000, 4/ 2003. 3.7 The available evidence shows little change in corruption.20 The recent World Bank report on Anticorruption in Transition 2 shows little change in measure of corruption and shows some increase in corruption in selected areas such as customs and tax administration between 1999 and 2002,21 and the World Bank surveys on governance show that as of 2002 the rule of law, regulatory quality and control of corruption have deteriorated over the previous seven years (see figure 3.1). In addition, Albania’s relative ranking in CPIA ratings for IDA countries in 2003 was in the fourth quintile for public sector management and institutions (a decline from the third quintile in 2002) and in the third quintile for governance. Equally, the ICRG index for corruption and law shows deterioration, both falling from 3 to 2 between December 1997 and December 2004.22
Local Institutions and Social Consensus
3.8 Bank assistance emphasized the importance of strengthening local administrations and involving civil organizations to preserve public infrastructure and improve service delivery. Projects in agriculture, irrigation, health, education, municipal water, and urban land management would help to devolve responsibilities to local government. Projects in micro-credit, education, forestry, 20 The Government notes that it has been addressing the corruption phenomena since 1998 through a participatory strategy and institutional reform (see Attachment 1). 21 Corruption in Enterprise-State Interactions in Europe and Central Asia, World Bank, 2004, page 20. 22 The bounds for this indicator are 1 (worst) and 6 (best).

13
irrigation, urban land management, community works, Durres port, agricultural services, fishery, social services delivery, and road maintenance would help to involve communities in local activities. The projects did not always support decentralization in practice. For example, the support to Tirana transport system was provided to the central government rather than the municipality, and as a result the municipality did not receive the software. The Albanian Development Fund provides financial support to local governments but it substitutes for local governments, to some extent precluding their development.
3.9 Embedding service devolution and community participation proceeded well in irrigation, but more slowly than expected in transferring water services to municipalities. Involving civil society to improve services can be effective, as the experiment in Tirana municipality shows. Funded with a small grant from IDA, the municipality opened a public complaint box about quality of services and committed to address the identified problem within a given period of time. Other cities are interested in using the same approach as their civil society is now stronger and more active.
3.10 Decentralization has received attention in Albania since the mid-1990s but the Bank focused on it only more recently with the report on decentralization (FY04) and the support for the strategies to decentralize health, education and social assistance. The ESW on decentralization focuses on generating stable resources flows, but recommends that funds be earmarked to local authorities as a proportion of central government revenues, a practice that can create rigidities for the management of fiscal policy, and has created problems in Colombia and Argentina.
3.11 Summary. Overall, IDA assistance produced moderately satisfactory outcome ratings for governance and institution building (see table 3.2). The assistance sought laudable objectives, but the agenda proved more ambitious than realistic. Civil service reform has brought some stability to public administration and expenditure management has improved, but the strategies failed to discern troubling emerging trends (state capture) and adapt interventions to curtail them. Improving overall governance would have benefited from background work and a range of well-coordinated and executed interventions. On strengthening the judiciary and eliminating corruption the gap between outcomes and objectives should concern the Bank. An ineffective program may discredit its advice and jeopardize its ability to achieve modest but worthwhile outcomes. The Bank should seek specific monitorable results and link its interventions to them; improving service delivery (see section on infrastructure), for
Table 3.2: Summary of Outcome Ratings for Governance and Institution Building
Objective Outcome Strengthen Public Administration and make the Civil Service Professional Satisfactory
Strengthen the Judiciary and Eliminate Corruption Unsatisfactory
Strengthen Local Institutions and Build Social Consensus Moderately satisfactory
Overall Moderately satisfactory

14
instance, can do much to improve the quality and effectiveness of governance and the public’s perception of it.23
Sustainable Private Sector Growth
3.12 After the pyramid crisis, the Bank strategy focused on restoring stability and achieving high growth rates driven by the private sector. The strategies sought to: (a) maintain macroeconomic stability; (b) facilitate private sector development; (c) improve financial intermediation; (d) improve infrastructure; (e) promote urban development; (f) facilitate rural development; (g) promote sustainable environmental development; and (h) improve telecommunications.
Macroeconomic Stability24
3.13 The strategies sought high annual rates of growth (6-7 percent), low inflation rates (2-4 percent), fiscal consolidation, improved management of public expenditure and a more open economy. These objectives were an integral part of NSSED.
3.14 Bank support for economic stability was provided during a period marked by crisis. Two loans granted in December 1997 supported the government’s efforts to weather the collapse of the pyramid scheme. The government’s decision not to bail out depositors and the schemes’ shareholders—many well connected to influential politicians (Jarvis, 1999)—prevented the fiscal accounts from deteriorating significantly but the losses could have been smaller had the government let the foreign managers—financed by the loans—take over the companies earlier than they did.
3.15 In 1999, when about 500,000 refugees from Kosovo suddenly flooded Albania, two credits supported the government. One credit provided budget and balance of payments support, and sought to make the relief budget transparent, and improve the coordination of the refugee relief program. This credit triggered donor assistance up to US$75 million and helped sustain expenditures on health care, education, public infrastructure, civil service and internal security and judicial institutions. A monitoring mechanism—later audited—tracked relief budget resources and set the foundation for the medium-term expenditure framework adopted later as a standard for managing budget policy. A second credit, supplemented with assistance from Norway and Switzerland, strengthened support for adjustment and macroeconomic stability. Further support came with the PRSC 1 and 2, credits that complemented the IMF’s three year PRGF. Overall, Bank assistance to support economic stability was effective, as fiscal imbalances declined, inflation fell sharply and the economy grew rapidly. (See table 3.3).
23 OED’s report on anti-corruption, “Mainstreaming Anti-corruption Activities in the World Bank Assistance: A Review of Progress since 1997, report no. 29620, 2004, stresses the need to focus the lending on accountability for results (supporting reforms in service delivery) and on providing more assistance for bottom-up reforms. 24 Support for macroeconomic stability came through a Rehabilitation Credit, FY98; and Recovery Program Technical Assistance, FY98; Public Expenditure Support Credit, FY00; Structural Adjustment Credit, FY00; and two Poverty Reduction Strategy Credits, FY02, FY03.

15
Private Sector Development
3.16 By 1997, Albania had privatized small and medium size companies (SMEs) as well as a number of larger state enterprises, and the environment for private investments had improved considerably. The late 1990’s country assistance review noted, however, that absence of a transparent commercial code and accompanying legal structures remained a problem for the private sector and progress on privatizing a number of “strategic” state-owned enterprises (SOEs) had been slow. The review recommended that IDA focus in particular on helping the government attract strategic investors into remaining SOEs.
3.17 IDA assistance since FY98 has been consistent with this recommendation. IDA approved an operation to provide political risk guarantee for private investors, which had modest success, although the sustainability of the guarantee agency is uncertain. Under the PRSC program (the first PRSC and PRSC 2), administrative barriers to the entry of private firms were addressed, with the help of input from FIAS studies on barriers to foreign investment. In addition, to support the privatization of strategic SOEs, the Bank served as administrator of a bilateral trust fund that financed advisors for the program. Since the program began in 1998, some progress has been made, including privatization in the telecommunications sector, and legal changes that have permitted restructuring, private leasing, private concessions, and privatization in the mining and petroleum sectors.
3.18 Nevertheless, a number of issues remain in the enabling environment for private sector development, related mostly to governance. For example, weakness in the judicial system, barriers to competition, and political interference in business practices affect the solidity of property rights and the development of the formal financial markets. For
Table 3.3: Albania-Indicators of Economic Performance CAS 2002 Initial Conditions Outcomes
1997 1998 2003 2004p Overall Performance (percent) Inflation 2-4 32.1 20.7 2.4 2.9 Growth rate 6 -10.3 12.7 6.0 6.0 1/ Unemployment 2/ 12 14.9 17.8 15.0 14.8 3/ Fiscal Accounts (percent) Fiscal Deficit/GDP 6.5 12.8 10.9 4.2 5.1 Public Debt/GDP No 87 78 58 56 Interest Payments/GDP No 4.0 4/ External Debt/Exports 5/ No 358 128 External Accounts Current Account/GDP No -12.3 -7.1 -8.5 -8.1 Reserves in months of imports of goods 6/ 4.7 5.3 5.7 6.9 Risk Ratings from ICRG 7/ Economic 20 33 Financial 28.8 34.3 Investment Profile (12 lowest, 0 highest) 5.5 8 Source: See Annex A, table 9 for details. Notes. 1/ Preliminary. 2/ End of period. 3/ Second quarter. 4/ Medium Term Budget Program, Table 22. 5/ E. Luci, Table 1. 6/ Reserves in months of imports computed by dividing gross reserves by import data (fob) in the balance of payments; the values for reserves and imports come from Bank of Albania. The numbers calculated this way are different from those provided by Bank of Albania, that seem to measure reserves in terms of imports of goods and services. 7/ Economic and financial risk ratings are computed as an average of the values in December 1997 and 1998, and December 2003 and 2004. The ratings have five categories: a) 0.0 - 24.5 percent, very high risk. b) 25.0 - 29.9 percent, high risk. c) 30.0 - 34.9 percent, moderate risk. d) 35.0 - 39.9 percent, low risk. e) 40.0 - 100.0 percent, very low risk.

16
further development in this area, IDA should focus its efforts on a few key areas such as customs and taxation, address the issues in a concentrated way through a project devoted to them (rather than embedded in a multi-sector operation) and define monitorable indicators to measure progress.
Financial Sector Development
3.19 Formal financial intermediation in Albania has traditionally been low and inefficient. The state owned banks failed to mobilize savings, service the nascent private sector, or facilitate payments; they financed the government deficit and undertook directed lending that turned into non-performing loans. The collapse of the pyramid schemes in the informal sector in 1997 focused government’s attention on undertaking financial sector reforms.
3.20 The late 1990’s country assistance review recommended that IDA’s past strategy had not been effective and that in future it should aim to strengthen banking supervision, support the privatization of state banks, and encourage development of the nascent private banking system, and that this effort should be preceded by sector work. IDA assistance has been consistent with these goals, and is considered highly relevant, except for the continued absence of formal ESW, which did not hinder progress in realizing the outcomes.
3.21 The first priority for assistance was to help resolve the pyramid schemes. IDA and other donors financed reputable international administrators who audited the schemes, and the government closed all funds by 1999 and started recovering and distributing assets to depositors, to date, only about five percent of the assets have been recovered. Second, IDA supported the liquidation, restructuring, and privatization of state banks. The state-owned rural bank was liquidated in 1997. The two remaining state banks were restructured and a lending moratorium imposed, covering donor-funded lines of credit as well, a move that was unprecedented in the ECA Region. Selling the banks took longer than expected because vested interests opposed the sale of the larger bank and the poor investment climate discouraged investors.25 In early 2004, however, the Savings Bank, which held 60 percent of the system’s assets, was sold and since this sale, all banks are fully private and profitable.
3.22 Third, IDA helped the government establish a comprehensive legal framework for the financial sector and strengthen the independence of the Bank of Albania, which manages monetary policy. Inflation has dropped to 2 percent per year. Tight licensing and capital requirements have prevented a situation which is problematic in other ECA countries: the entry of small, well-connected, and potentially inefficient banks. In 2000, a law on secured transactions was enacted but legal loopholes and judicial corruption have reduced its effectiveness.26 A deposit insurance scheme was introduced in 2002, but 25 In addition, the sale of one of the banks involved some controversy about whether the foreign bank buying it was fit and proper. In the event, following a crisis in its home country, the foreign bank was intervened by its government in the home country. The privatized Albanian bank, however, has been well managed and profitable since its privatization. 26 The auctioning of immovable property is over-regulated, while no safeguards exist to prevent sale of moveable property to a third party.

17
it is arguable if this was sensible given the small number of deposit-taking banks in the system. To improve the inefficient payments system the Bank of Albania introduced a real time gross settlement payment system, although only in 2004.27 Efforts to create a credit information bureau and to improve the legal enforcement of contracts have not borne fruit. IDA is also supporting legal and regulatory changes in the insurance sector, and provides assistance to privatize the state-owned monopoly INSIG.
3.23 To service the poor and disadvantaged, a credit (FY99) supported converting existing micro-finance funds into operationally self-sustaining financial intermediaries, and to broaden their clientele in both urban and rural areas. In rural areas, a network of 92 Savings and Credit Associations (SCA) and a SCA Union have been created from 223 existing Village Credit Funds. In 2004 the Union began to cover its operating expenses. The analogous urban association (BESA) also achieved operational self-sufficiency in 2003. Loan default rates are low. Because expected co-financing did not materialize, both the SCA network and the urban BESA failed to meet the critical size needed to become fully financially self-sufficient, and both still need subsidized support and training to deepen the range of services and to reach sustainability. IDA needs to examine whether financial and technical support is warranted to make these institutions self-sustaining, and to define an exit strategy for its own support.
27 Late support by the Bank to improving payment systems is not unique to Albania; it is discussed further in OED’s Review of Bank Assistance for Financial Sector Reform, available on the following website, [http://www.worldbank.org/oed/financial_sector].
Table 3.4: Albania-Indicators of Financial Sector Performance CAS or project
target Initial Conditions Outcomes
1997 1998 1999 2003 2004p Financial Development (percent) No C/M2 37 28 M2/GDP 55 48 53 58 Credit to Private Sector/GDP 3.8 3.2 3.6 8 Ownership Yes Government ownership of banks (percent of assets)
0 90 86 52 0
Public banks share in total deposits (%) 0 94 93 88 0 Concentration and competition Number of banks 8 10 13 15 Credit concentration 1/ 0.23 2/ 0.15 Asset concentration 1/ 0.44 2/ 0.3 Credit four largest banks/ Total 1/ 83 2/ 80 Spread (credit-time deposit) -3.2 10.2 11.4 5.03 Profitability (percent) Banks' return on assets 12-31 0.5 1.24 Banks' return on equity 12-31 15.7 19.5 Doubtful loans Yes 45.5 Non-performing loans 87.9 3/ 4.6 0.64 (Nov.) Prudential requirements Capital adequacy ratio (percent) Yes 28.5 25.1 (Sept.) Source: See Annex A, table 9. Notes: 1/ Herfindahl index, end of period. 2/ 2000. 3/ State-owned banks.

18
3.24 Overall, Bank assistance to the financial sector can be associated with satisfactory outcomes (see table 3.4). Indicators of financial intermediation have improved, although further progress is needed. As shown in table 3.5, the drop in government ownership of banks has been more rapid and more complete than in comparator countries. Financial sector depth (measured by M2/GDP) has increased slightly and compares favorably to other countries, while confidence in the banking system has also increased slightly as people held less cash relative to M2 in 2003 compared to 1997. The one important area where much remains to be done is in credit to the private sector. Although it has expanded since 1997, at a rate similar to other IDA countries in the Region (almost doubling between 1997 and 2003), credit to the private sector remains at a modest 8 percent of GDP and lower than comparators. With the very recently privatized banks and competition among them, this may improve in the near future.
Table 3.5: Financial Sector Indicators for Albania and Comparator Countries, 1997 and 2003 (percent) Assets in banking system
owned by Government M2/GDP Currency outside
banks/M2 Credit to Private
Sector/GDP 1997 2001-2003*** 1997 2003 1997 2003 1997 2003 Albania 90 0 55 58 37 28 4 8 IDA countries in ECA* 3 7 11 17 58 44 5 10 Balkan countries** 45 16 22 41 16 18 28 30 * Armenia, Georgia, Kyrgyz Republic, Moldova. ** Bosnia-Herzegovina, Bulgaria, Croatia, FYROM, Romania. *** Latest year available Source: WB WDI, IMF, International Financial Statistics, various years, and, for banking ownership, various Bank documents. Decimal numbers rounded to nearest integer.
Infrastructure and Urban Development
3.25 At the beginning of its transition, Albania’s infrastructure was in extremely bad shape, characterized by inadequate networks of power supply, transport systems, and water and sanitation services. The process of transition introduced further challenges, not only for meeting the growing needs of the population but also for encouraging private investors. In spite of investments in infrastructure in the early part of the 1990s, supported by IDA funding, the quantity and quality of infrastructure services improved only marginally and in areas like electricity and water and sanitation, the problems reached crisis situations. The late 1990’s country assistance review found that IDA had not focused sufficiently on improving the public institutions delivering infrastructure services and recommended that IDA pay greater attention to privatization of infrastructure and the related regulatory framework.
3.26 IDA assistance since FY98 has generally been consistent with the review’s recommendation. The assistance made efforts to strengthen public sector institutions and had success in energy and transport. However, the uncertainties in the investment climate caused by the instability of 1997 and the government’s lack of political will to raise tariffs meant that privatization proceeded unevenly and is only now being resumed. In electricity, for example, the government was initially reluctant to undertake reforms. A FY96 IDA project was suspended in 1998 because of non-compliance with agreed actions, and the sector continued to deteriorate, with non-technical losses (i.e., illegal connections), reaching about 25 percent of distributed electricity, frequent outages, and a precarious and worsening financial situation of the sector’s operators. Low rainfall in early 2000 caused a drop in electricity production that transformed the electricity company from a net exporter to an importer—32 percent of demand in 2001 and 43

19
percent in 2002. The budgetary cost of these imports was so high that it threatened macroeconomic stability and jeopardized the entire reform program, thereby inducing government to undertake reforms.
3.27 The government adopted a Power Sector Policy Statement in April 2002 and later that year agreed to a Bank-led and donor-supported Action Plan with monitorable indicators. Once the government had met an initial set of targets, IDA approved two power sector projects (FY02 and FY04) that focused on strengthening the Electricity Regulatory Authority, developing a strategy and schedule for sector restructuring and privatization, and revising the tariff structure to reflect economic costs. As a result of initial reforms, the financial situation of the sector has improved (with the electricity company contributing $30 million to the 2003 budget, see footnote to table 3.6), and together with favorable rain consumer service is better than it has been in a decade (see table 3.6 for indicators of performance).
Table 3.6: Albania-Indicators of Performance in Electricity Baseline Target (CAS 2000,
PAD, Action Plan) Results
Year Value 2003 Technical 1/ Energy billed (% of total consumption) 1997-1999 71 83 Non-technical losses (% of total production) 1997-1999 22 18 Total losses (% of total production) 1997-1999 57 42 59 Load shedding (% of total production) 1999-2000 4.0 20.1 Quality of services Consumers reporting daily interruptions 2/ a. Tirana 56% b. Urban communities 58% c. Rural communities 83% d. Total 72% Electricity cuts in urban centers (hours per day) 3/ Tirana (lowest number) 2 Shkoder (highest number) 16 Electricity Tariffs for Low Voltage Customers (lek/kwh) 1/ Apr. 2003Budgetary 1998-2000 3.0 9.0 Water Supply 1998-2000 3.0 5.0 Non-Budgetary 1998-2000 6.3 12.0 Subsidized Private 1998-2000 3.0 5.0 Private 1998-2000 6.3 / 10.1 12.0 Domestic 1998-2000 4.0 4.81
Domestic (<= 300 kWh/month) 1998-2000 ( - ) 4.5 * Domestic ( > 300 kWh/month) 1998-2000 ( - ) 8.9 *
Contribution to Budget 4/ Net contributions to budget (US$ million) 30 Sources: Please see Annex A, table 9 for details. 1/ KESH, direct information for tariffs, losses, load shedding and billing. 2/ World Bank, Poverty Assessment (2003) for interruptions in electricity service. 3/ UNDP Albania, Early Warning Report, Human Security in Albania with a Case Study on the Energy Crisis (Tirana, April 2004), p. 30. 4/ Internal OED note on infrastructure and urban development. Net contribution is calculated as taxes paid (profits and VAT) for $53 million, minus $17.5 million in profits minus $5 million in import subsidies to KESH; data come from internal Bank documents of July 14-22, 2004. Note: * 2004.

20
3.28 In water and sanitation, IDA also focused on helping the government develop its National Water Supply and Sanitation Sector Strategy, which was subsequently adopted by the Council of Ministers, and to focus on increasing private provision of these services. The first of two projects was approved (FY00) to make urgent repairs in four cities (Durres, Fier, Lezhe, and Saranda) to prevent water and sanitation systems from collapsing while a more comprehensive project (approved in FY03) was being prepared.28 It met its objectives, with reduced water losses and increased service in the four cities, (see table 3.7), although the sustainability of these results will depend on progress under the on-going project, covering the same cities as the earlier project, and putting in place a private operator to deliver water and sanitation services. This project has experienced problems, but it is too soon to assess its outcome.
Table 3.7: Albania-Indicators of Performance in Water Sector Baseline Target Results
Year Value 2003 2004 Quantity and quality of delivery in four cities 1/ Proportion of people served (percent) n.a. 57 68 Water availability (hours per day) 2.1-20.9 2.3-21 Technical efficiency in four cities Water losses-unaccounted for water (percent) 2000 59-73 60-80 Reduction in water losses (in million m3) 3.09 4.5 Quality of water in four cities Residual chlorine (%) 2000 6% - 60% 0% - 93% 2/ Coliform (%) 2000 88 - 96% 96% -100% 2/
Financial Collection rates in four cities (percent) 2001 33%-34% 46-64 Collected revenues/Cash operating costs (percent) n.a. 39-47 Government operational subsidies to sector (million leks) 1997 45 2,222 800 Government subsidies to sector (percent of GDP) 1997 0.01 0.3 0.1 Sources: See Annex A, table 9 for details. 1/ Durres, Lezhe, Fier, Saranda. 2/ Jan-May 2004; the zero percent is the record of results for one test in Lezhe in April 2004.
3.29 As in the electricity and water and sanitation sub-sectors, IDA provided assistance for roads to address an emergency situation, the damage caused by the transit of heavy trucks during the Kosovo crisis. This project was followed by a second project that focused on introducing institutional changes for road maintenance. The Emergency Road Repair Project achieved its immediate objective of rehabilitating parts of the roads network and also supported the local contracting industry in the process. In addition, IDA support has helped the government to institute the use of economic analysis for screening road projects over US$1 million; all periodic maintenance and half of the routine maintenance is now done by private contractors; and institutional arrangements for improving road safety are in place. The Road Maintenance Project is on-going.
28 On March 29, 2005, the Bank announced the debarment of 5 individuals and 6 firms for collusive practices in relation to the World Bank-financed project “Water Supply Urgent Rehabilitation Project”. While the project objectives were met—make urgent repairs in the water and sanitation system of the four cities—the higher cost caused by the collusive practices reduces the net benefits of the project to the users. This case illustrates some of the problems discussed in paras. 3.5-3.7 and 3.18 of this report.

21
3.30 IDA has addressed inefficiency and corruption in both ports and trade facilities in two projects, both on-going. The port project aims to improve the efficiency and capacity of the Durres port by rehabilitating infrastructure, establishing an autonomous port authority, privatizing port operations, and improving operations, safety and customs procedures. Progress has been made (staff cuts; privatization of stevedoring) and the quality of customs and dockside procedures has improved noticeably although not to the levels expected. The Trade and Transport Facilitation Project—co-financed with the EU—is an innovative approach, part of a regional program with neighboring countries in Southeast Europe, to reduce non-tariff costs to trade at border crossings, including points of entry on roads and at ports. Project support has improved customs procedures and customs clearance. The changes have reduced some of the non-tariff costs to trade; for example, the time to clear customs has fallen in Durres Port, in Tirana’s inland terminal and the border of Qafe-Thane. (See table 3.8).
3.31 Urban Development. The inadequacy of infrastructure is particularly acute in urban areas; in the capital Tirana, for example, as much as 50 percent of the population has no or highly inadequate access to essential services. To address this situation, IDA financed one urban project, Land Management (FY98), still on-going. Aside from providing essential urban infrastructure in participating municipalities, the project led to the adoption of more efficient methods of delivery of community infrastructure, supported land tenure reform by giving residents the right to purchase land, and helped officials and local communities to recognize that regularizing illegal settlements is the only viable option of dealing with them. Beneficiaries have received certificates of occupancy but the legislation to allow full ownership rights has been delayed due to lack of consensus on the terms and the compensation to be given to original land owners. The project has produced satisfactory outcomes but it is not enough to have an impact on the urban sector as a whole. Long-term results will therefore depend on replicating the approach in future projects and expanding the scale of support to the urban sector.
Table 3.8: Albania-Indicators of Performance in Other Infrastructure Baseline Target Results
Year Value 2004 Roads Upgrading of priority roads (kms) 64.5 Durres/ Kosovo and Berat/Corovade (kms) 200 Rural roads maintenance 975 690 (2001) Ports and Trade Staff (numbers) 1997 1520 400 480 Import clearance time – Inland port of Tirana (minutes) 1999 240 60 70 Border crossing at Durres (average time minutes) 1999 120 60 70 Inspection of trucks (percent of all trucks) 2001 100 Selective Urban Development Families with access to better infrastructure 6,000 Recovery of project costs 10% 5% Source: See Annex A, table 9 for details.

22
Agriculture
3.32 Since 1992 the agriculture sector has contributed substantially to the growth of the economy, and has become a safety net for people without employment or income. Initial sector changes were dramatic, but as the easy gains in productivity were realized, growth has fallen. The late 1990’s country assistance review found that IDA had adopted a relevant strategy for the sector and identified key constraints to be addressed in the next phase of assistance: (a) small, fragmented land holdings; (b) constraints in rural credit; (c) organizational problems in the water users' associations in the irrigation system; and (d) better use of technology and inputs. The overall objective of the subsequent strategies for agriculture was to contribute to the sustainable growth of the economy through private sector growth, consistent with the recommendations of the review.
3.33 IDA carried out ESW but lending constituted its principal interventions. The results of most projects were satisfactory but their impact was limited because of their small size and their dispersion. The Irrigation Project (FY99), the only one with a significant impact, helped to rehabilitate 58,000 ha. of irrigation and 130,000 ha. of drainage and to promote around 200 water users' associations that manage primary, secondary, and tertiary channels. The financial sustainability of the associations is not yet established, although the trend is in that direction. The Rural Roads Project (FY95) helped rehabilitate about 690 kms. of road, fewer than the 975 targeted. The community works projects (FY99) supported small infrastructure investments (roads, water supply, sewers, markets, public buildings) selected by local communities. About 80 percent of the planned activities were carried out, helping to raise awareness about decentralization and the capacity of local governments to execute works, but community participation, another project objective, was limited. The credit projects helped to create and strengthen organizations (Rural Financial Fund and Union of Savings and Credit Associations) that lend small amounts to finance productive activities and repair rural infrastructure; the microfinance system now covers over 40 percent of villages in rural areas but to date has reached only about 3 percent of the rural population. The Agricultural Services Project is supporting the preparation of legislation to privatize and regulate the seed industry and strengthen five seed research institutes, but it is still too early to assess progress in registering land, its main objective.
Environment and Natural Resources
3.34 Since the early 1990’s illegal logging, overgrazing, loss of biodiversity, over- fishing and watershed mismanagement have sapped Albania’s rich and varied natural resources. In response, IDA carried out ESW, granted three credits and gave several Global Environment Facility (GEF) conservation grants. The original National Environmental Action Plan (NEAP, 1993) and the updated NEAP (UNEAP 2001) identified the environmental problems and possible solutions, but the government has not followed its recommendations, and IDA dropped from its program the proposed

23
interventions.29 On the other hand, although a number of people expressed concern to the OED mission about the Vlore power plant being too close to an area with tourism potential and a protected wetlands area, the evidence examined by OED shows that the Bank followed appropriate procedures to reach that decision, including carrying out a full environmental assessment, considering alternative sites, and consulting with stakeholders. The completed Forestry Project (FY96) has helped to devolve 126 forests—around 327,000 hectares—to the communes and municipalities, although the environment benefit remains unclear since property rights and the contractual relations between the associations and communes are not defined. The outcome of this objective is moderately satisfactory.
3.35 Summary. The Bank assistance program was highly relevant to the crises of the mid-1990s and had a moderately satisfactory outcome (see table 3.9). The program helped achieve rapid growth and low inflation. Tax revenue increased as a proportion of GDP, the fiscal risks of the pension system declined and savings and investment have been high, suggesting that Albanians have confidence in the economy. On the institutional side the authorities showed their determination to deal with crises, but the public still feels vulnerable, as the high ratio of cash to deposits indicates. The assistance succeeded in privatizing the government owned banks and in improving the regulatory environment in the financial sector, but made little inroads in improving the business climate for everyone. In infrastructure the assistance was particularly successful in electricity and roads and helped to improve water provision in four cities, where an on-going experiment with a private sector operator needs time to assess outcome. The assistance also helped to increase the efficiency of ports and to reduce non-tariff costs to trade, and to provide essential urban infrastructure services in some municipalities that has resulted in the adoption of more efficient methods to deliver community infrastructure. Finally, assistance to agriculture has been effective in irrigation but the rest of it has had a limited impact because of its small size and dispersion.
Human Development and Poverty Alleviation
3.36 Albania has good education and health indicators despite its relatively high poverty rate and the low level of income with which it started the transition. About 99 percent of the population can read and write, infant mortality, at about 22 per 1000, is lower than that for ECA countries, 31 per 1000, and levels of immunization for measles for children under 12 months reached 96 percent in 2003.30 The poverty rate stood at about 25 percent in 2002. The social protection, education and health care system contributed to some of these 29 The Costal Management Project envisioned in the 1998 strategy and the actualization of the NEAP mentioned again in the 1998 strategy and the 2000 Progress Report were not implemented. The environment project envisioned in the 2002 strategy has not yet been identified. 30 Annex A, table 1 and the World Bank/ECA, Albania Data Summary, (www.worldbank.org/eca).
Table 3.9: Summary of Outcome Ratings for Sustainable Private Sector Growth
Objective Outcome Macroeconomic stability Satisfactory Private sector development Moderately unsatisfactory Financial sector development Satisfactory Infrastructure and urban development Satisfactory Agriculture Moderately satisfactory Environment and natural resources Moderately satisfactory Overall Moderately Satisfactory

24
outcomes, but the transition brought to the surface serious problems in the social protection programs and in the delivery and quality of service in health and education. IDA assistance tried to help the government improve access to education and health, improve their quality, and make poverty alleviation interventions more effective.
Social Protection and Poverty Alleviation
3.37 In communist Albania, social protection programs guaranteed employment, wages, cheap consumer goods and comprehensive insurance. In 1993 the government initiated reforms to limit the programs’ impact on the fiscal deficit and to improve resource efficiency.
3.38 The late 1990’s country assistance review found that IDA assistance had achieved its short-term objectives. Pensions, social insurance and unemployment insurance had been rationalized but the pensions system was not yet actuarially sound, payroll taxes were high and the cash assistance program Ndihme Ekonomike (NE) was inadequately targeted. Lack of information on household income and expenditure prevented good targeting.
3.39 The country strategies for social protection sought to improve: (a) the fiscal sustainability of the pension program; (b) targeting in the NE program; and (c) delivery of social services using the community driven development (CDD) approach. All planned AAA was carried out and supported the policy advice and the lending program.
3.40 Fiscal sustainability of the pension program. IDA lending31 and non-lending services supported government actions to reform the pension program and improve its financial situation. The changes (improving administrative capacity and management systems in the Social Insurance Institute, increasing the retirement age by five years, conditioning eligibility for early retirement, lowering rate of contribution by urban workers) have helped reduce the central government subsidy for pensions to one percent of GDP, from 2.8 percent in 1990 (see table 3.10). Nonetheless, the financial integrity of the system is not yet ensured.
3.41 Better targeting the NE program. Through lending and non-lending services IDA supported the Ministry of Labor and Social Assistance (MOLSA) actions to improve NE targeting. Albeit delayed, the 2003 Poverty Assessment provided the first complete poverty map and household profile for Albania, helping to refine NE’s eligibility criteria and MOLSA’s central budget allocation to the regions. Targeting still needs improvement, as about 25 percent of NE beneficiaries are non-poor.
31 Social Safety Net Development Project FY94, Structural Adjustment Credit FY99, Social Services Delivery Project FY01, PRSC 2 FY03.

25
3.42 Restructure delivery of social services. Three credits supported this objective. The Community Works I (FY99) financed the construction of centers that local communities operate, and local governments finance their operational costs. The project helped to advance the decentralization agenda and build local government capacity in managing small public works but its achievements in empowerment and community participation were limited as the implementing agency (Albanian Development Fund) lacked the appropriate expertise; this is being redressed as the Fund amends its policies. The other projects (Social Services Delivery and Community Works II FY03) have experienced implementation delays. It is still too early to judge the efficacy of the CDD approach in Albania.
3.43 Summary. IDA assistance has produced moderately satisfactory outcomes. It helped to create the conditions for a social assistance system to target the poor and vulnerable better and to develop capacity in MOLSA, Social Insurance Institute and the Statistical Institute to manage the cash assistance and pension programs. The pension program has seen the most progress while restructuring of social services delivery (via the CDD approach) has experienced delays.
Education
3.44 The education sector suffered during the transition and its aftermath. Between 1990 and 1998 gross enrollment rates fell from 102 to 94 percent for primary education and from 78 to 41 percent for secondary education.32 Public spending for education dropped from 5 percent of GDP in 1989 to 2.7 percent of GDP in 1999, causing an increase in the cost of attending school and reducing the quality of education and overall sector performance.33 Recurrent spending has suffered more than capital investment34,
32 Source: INSTAT as quoted in The World Bank, Financing, Efficiency and Equity in Albanian Education, WTP 512, June 2001, table 2.9. 33 Poverty Assessment, 2003, table 6.6.
Table 3.10: Albania-Indicators of Performance in Reducing and Alleviating Poverty Baseline CAS Target Results
Year Value 2004 2002 2003 Poverty and inequality Poverty rate (percent) 1998 1/ 29.6 25.4 5/ Population under US$2 PPP a day 1998 1/ 38 * 10.8 5/ Food share in total expenditure (percent) 1996 2/ 70-75 62.8 5/ Gini coefficient (of consumption) 1996 3/ 0.28 0.28 5/ Social Protection - (Ndihme Ekonomike-NE) Households receiving assistance (percent of total) 1996 4/ 15.3 25 6/ Households in lowest decile receiving assistance (percent) 1996 4/ 48.9 n.a. Share of total allocations received by poorest 40 percent 1996 4/ 74.8 75.9 6/ Social Protection Transfers (NE+Disability)/GDP (percent) 1997 1.3 7/ 1.1 7/ 1.1 7/ Spending in Social Insurance Fund (pensions and unemployment) 8/
Total amount (percent of GDP) 3.5 5.8 5.4 State subsidy for social insurance (percent of GDP) 1.0 Sources: For details on 1/ to 8/, see Annex A, table 9 for details. Note * CAS 2002.

26
and in-service and professional upgrading training for teachers were eliminated. As teacher salaries dropped, students were also required to pay informal school fees.
3.45 The late 1990’s country assistance review recognized the need to restore basic education services but noted shortcomings in IDA assistance: absence of ESW and a sector strategy, and neglect of issues like low financing for education, institutional reform of the Ministry of Education (MOE), and lack of accountability for teaching outcomes. Subsequent country assistance strategies sought to: (a) increase expenditures in education; (b) improve the quality of education and resource use; and (c) improve management and accountability.
3.46 IDA followed through with analytical work which supported IDA’s dialogue with the government and the preparation of the Education Reform Credit (FY00). The AAA emphasized the need to reverse the declining enrollment rates in basic and secondary levels, and to reverse the under-financing of education, which had deleterious effects on the quality of teaching. The AAA recommended modernizing, restructuring and strengthening MOE so that it can lead the sector.
3.47 IDA assistance met its objectives partially (see table 3.11). The objective of increasing recurrent expenditure in education was not met. While PRSC 1 and 2 sought increases in budget allocations, actual recurrent expenditure fell from 3.3 percent of GDP in 2001 to 2.9 percent of GDP in 2003; nevertheless, the government was able to increase the wages of rural teachers in 2003. With respect to improving education quality and resource use several actions have been taken. The MOE has adopted standard architectural designs for schools and has completed a school mapping exercise. It has also instituted standardized nationwide examinations in language and mathematics for select grades, creating a baseline for measuring student performance, and indirectly, improving the ability to determine the right mix of inputs to enhance student achievements. The Ministry has published the test scores and the first Annual Statistical Report Card on education, paving the way towards making the sector more transparent and accountable.
34 Initially school infrastructure and equipment suffered from vandalism and general disrepair. Substantial rehabilitation operations throughout the 1990s supported by both donor and government have redressed the problem.

27
3.48 Improved sector management has partially been achieved. MOE has been restructured and specialized units of technical competencies established (e.g., policy and planning, information and statistics, curriculum and standards). Considerable assistance to build capacity has been provided but frequent MOE staff changes have diluted the institution building impact. Many substantial outputs, delivered with the help of external consultants, are not yet internalized by senior operational staff, so their impact is muted. An Education Management Information System has been set up but has not yet been used for policy inputs. While not yet implemented, a Decentralization Policy Paper has been completed, defining the role of MOE vis-à-vis local government. An Education Sector Strategy has been adopted and approved by Parliament; this is an important step towards galvanizing different stakeholders to a common vision for the sector but no implementation plan exists yet.35
3.49 IDA assistance produced moderately satisfactory outcomes. Specifically, the MOE has begun its restructuring, and modernization, a prerequisite to improving sector performance, although frequent changes in Ministers have eroded leadership and ownership of reforms, and the ensuing job insecurity has made senior staff indifferent to reform. Meanwhile gross enrollment rates for primary and secondary education have
35 The strategy was prepared without direct IDA support.
Table 3.11: Albania-Indicators of Performance in Education Baseline Target Results
1997 2004 2002 2003 Enrolment rates and school life expectancy Gross enrolment ratio (percent) Primary 97.1 106 105 Lower secondary 91.1 111 99 Upper Secondary school (general and vocational) 40.3 50 + 43 48 School life expectancy between ages 5-29 (years) 9.4 10 + 11.1 ** Students in basic education (percent) 94 > 99 Government Spending (percent) Spending on education/GDP 3.3 3.7 + 2.8 2.9 Spending per student/ Per capita GDP 15 12 13 Distribution of spending by level of education Basic 63 * 62 Secondary 16.1 * 15 Tertiary 12.8 * 16 Others 8.2 * 7 Indicators of Efficiency in Basic and Secondary School Pupil/Teacher ratio 18.4 19.5 19.5 Students per class 28.3 30.6 30.5 Students per school 297 295 299 Classes per school 10.2 9.6 9.8 Quality of Inputs (percent) Teachers with higher education Pre-primary 7.3 23 Basic 52.6 56 Upper secondary 95.3 97 Schools in good condition 51 Sources: See Annex A, table 9 for details. Note: * 1998; **2001; + CAS 2002.

28
been increasing, but still it is impossible to forecast if the MDG goal of universal primary education will be met.
Health
3.50 Albania has enjoyed relatively good health indicators, to a large extent an inheritance of the communist era. Prior to the transition, there was universal access to health services, and critical public health programs, such as immunization and malaria control, were well managed, but the system had structural weaknesses. Health personnel were overspecialized, even at the lower rural facility level, costly hospital-based curative care took precedence over preventive medicine, sector management and planning was based on historical practice and not on evidence or results; as a result, services provided did not match with the population’s health needs. By the 1980s inadequate expenditure on health began to erode the quality and efficacy of services, infrastructure deteriorated and facilities had only the barest of equipment and pharmaceuticals. The quality of services continued declining as public spending in the sector dropped further, dipping from 4.8 percent of GDP in 1991 to 1.9 percent of GDP by 1996-98,36 with the largest cutbacks occurring in recurrent and operational costs. Salaries were lowered, as was expenditure on training and other investments in human resources. Informal payments to physicians became widespread.
3.51 The late 1990’s country assistance review noted little progress in resolving the fundamental problems of the sector: inadequate recurrent expenditure, the Ministry of Health's lack of capacity to plan and make policy, and Albania’s backwardness in medical technology. The review called for an agreement on a sector strategy and comprehensive sector work to guide the policy dialogue. The review recommended that assistance to rehabilitate primary health centers or other higher level facilities should proceed only upon agreement of a sector policy framework.
3.52 No ESW was carried out but IDA relied on AAA and strategy for the ECA region which could not make up for that shortcoming. IDA assistance aimed to improve quality of and access to health services through sector reforms. Credits supported improving: (a) government health financing; (b) infrastructure and equipment; and (c) institutions and resource efficiency.37
3.53 The assistance partially achieved its objectives. On expenditure the PRSC 1 and 2 required budget allocations to increase “in a manner consistent with the MTEF”. Although the 2002-2004 MTEF had planned an increase in expenditure to 3.2 percent of GDP in both 2003 and 2004, actual expenditures were 2.1 percent of GDP in 2003 and were expected to be 2.5 percent of GDP in 2004;38 the condition was considered to have 36 Poverty Assessment, 2003, table 5.10. 37 IDA granted two investment credits (Health Services Rehabilitation, FY95, and an on-going Health System Recovery and Development-Health II-, FY98). Health II is a complex, ambitious project with multiple co-donors. Conditionality on expenditure was included in PRSC 1 and 2. 38 Republic of Albania, Ministry of Finance, Progress Report … (April 2004), p. 314, and Medium Term Budget Programme (July 2004), table 7.

29
been met, but the actual expenditures fell far short of government’s objectives (see table 3.12). Health infrastructure and equipment were improved in two regional hospitals and 99 primary care centers but the extensive civil works planned for the Tirana University Hospital (TUHC) were cancelled because the master plan and medical program for TUHC were delayed and key inputs from other donors did not arrive on time. The works are currently undertaken by the government.
3.54 With respect to improving institutions and resource efficiency, the government has committed to a revised institutional architecture for the sector and begun the shift towards a decentralized system of service delivery. The MOH plans to focus on formulating policies and strategies while the Health Insurance Institute (HII) would insure and purchase services on behalf of MOH. Piloted in Tirana and Durres regions, regional health planning authorities have begun to be in charge of planning, and physicians under performance contracts have begun to man autonomous regional hospitals. HII is already contracting physicians in primary care facilities throughout Albania. It is expected that these key entities (HII; regional authorities; autonomous regional hospitals; primary health care facilities) will provide better health care more efficiently as their own technical and management capabilities are being developed. However, the Health Reform project did not achieve its objective of improving the level of new skills and human resources it envisaged as many co-donors delivered late or failed to deliver their technical assistance commitments. Finally, the MOH and related institutions have produced a long-term strategy for the sector (with WHO assistance), a national HIV/AIDS strategy (with IDA assistance) and a policy paper on decentralization for health (with IDA assistance). The strategies are in various stages of implementation but still far from impacting health outcomes.
3.55 IDA assistance produced moderately satisfactory outcomes towards achieving quality health care (see table 3.12). Health infrastructure and equipment were improved, a health sector strategy formulated, national health accounts completed, and the health system has been strengthened and modernized. Physical access to a health provider and facility is now less of an issue than the ability of the provider to render appropriate care, given the general shortage of equipment and medicines, and the lack of focus on prevention. Lack of ESW, ambitious program goals and frequent change of IDA task managers (six in six years) and in government leadership in the sector detracted from the effectiveness of the assistance.
Table 3.12: Albania-Indicators of Performance in Health Baseline value Target Results
1997 2004 2002 2003 Life expectancy (years) 72 74 74 Infant mortality (per 1000 births) 26 17 17 Maternal mortality (per 1000 births) 20 15 Spending on health/Total public spending (percent) 6.2 No 9.8 Spending on health/GDP (percent) 1.9 3.2 + 2.0 2.1 Health Insurance Fund Spending (percent of GDP) 0.3 0.6 0.6 a. Financed from contributions (percent of GDP) 0.3 0.3 b. Financed from budget transfer (percent of GDP) 0.2 0.2 Sources: See Annex A, table 9 for details. Note: + CAS 2002.

30
3.56 Summary. IDA assistance produced moderately satisfactory outcomes in human development and poverty alleviation (see table 3.13). Progress has been made against the higher level objective of reducing poverty, due mainly to strong economic growth. Poverty has declined from about 30 percent in 1998 to 25 percent in 2002, and extreme poverty has declined even more, from about 47 percent to 11 percent. According to UNDP Albania is on track to achieve the UNDP-country defined MDG target for poverty eradication.39 Improved targeting of the NE program-one objective of IDA’s strategy-contributed to alleviate poverty, but the program still reaches only about 25 percent of poor families, and as many as 25 percent of the beneficiaries are non-poor.40 The fiscal integrity of the pension program has also improved although some threats to that integrity still exist. On education, enrollment rates have improved but expenditure continues below its 1997 level, indicating some improvement in resource efficiency. Health outcomes present a mixed picture, with clear gains in infant mortality and life expectancy, but uncertain results in other important areas such as child malnutrition, because of problems with comparing data over time. Hospitals have more medical supplies and hospital care and services have improved although not uniformly. By contrast primary health care remains lacking. Public health and nutrition outreach lag far behind curative care.41
Overall Ratings
3.57 The overall outcome of the Bank assistance program in Albania during 1997-2004 is rated as moderately satisfactory. The Bank strategy was relevant to Albania’s development and the assistance program had some successes, but the outcome has been less than fully satisfactory in several areas. Program and component ratings are summarized in table 3.14.
3.58 Sustainability. The sustainability of the Bank’s assistance program is rated likely. In macroeconomic 39 UNDP Albania (2004), p.18. 40 The World Bank, Poverty Assessment, 2003, p. 111. 41 Nutritional deficiencies do not seem to be a priority for health policy. Vitamin A and iodine deficiencies are preventable and treatable with capsules and appropriate health education easily provided at a health post or center. However, available data show that more than 6 percent of children have never received vitamin A supplements. Also, according to UNICEF’s Multiple Indicator Cluster (MCIS) Survey Report of 2000, almost one in three Albanian children is moderately stunted, while 17.3 percent are severely stunted.
Table 3.13: Summary of Outcome Ratings for Human Development
Objective Outcome Strengthen the social safety net and promote social cohesion and inclusion Moderately satisfactory
Improve the quality of education Moderately satisfactory Develop an effective and sustainable health system Moderately satisfactory Overall Moderately satisfactory
Table 3.14: Overall Outcome Rating Objectives Outcomes
Overall Moderately satisfactory • Governance and Institution Building • Moderately satisfactory
• Promote Sustainable Private Sector Growth • Moderately Satisfactory
• Human Development and Poverty Alleviation• Moderately satisfactory

31
management and financial sector development, the government has carried out important, comprehensive reforms, and has demonstrated its commitment to reducing budget deficits and to keeping inflation low. The same assessment is valid for the improvement of the pension system, since the government has acted twice to extend the retirement age and to improve collections to meet the potential threat of a runaway pension deficit. The progress made in infrastructure, especially in electricity and roads, is sustainable since the government has already incurred most of the political cost of the reforms in the electricity sector and is likely to continue with its approach to road maintenance and rehabilitation. Little has been done to improve the business climate, and some worrisome elements of state capture and constraints to competition might become entrenched, but a strong civil society and political competition lend hope to the transitory nature of these problems. In agriculture, the use of water users' associations to manage irrigation districts is likely to be maintained if the benefits of higher output and productivity induce farmers to seek the financial self-sufficiency of the associations.
3.59 Institutional Development Impact. Most of the projects had an institutional development component. The results on this score are mixed. The country has built good institutions and organizations to manage the budget and macroeconomic policy, key for maintaining economic stability and creating a favorable environment for growth. The assistance also produced significant institutional and organizational changes: in the electricity sector people pay their bills, and the company charges the full cost of producing and delivering electricity, cuts service to non-payers, and is generating a surplus for the first time in many years; in roads the government has started contracting maintenance with private parties and has begun to screen projects on the basis of their economic impact. This progress is overshadowed by the continued weaknesses in the rule of law and by the growth in state capture by powerful political and economic interests, which create an unfavorable business climate and discourage domestic and foreign entrepreneurs from investing and operating in Albania. On the government side, civil service reforms are an important initial step to improve existing institutions. Bank assistance has tried to improve public sector management but the use of special project implementation units tend to undermine these efforts. Institutional development impact is rated modest.

32
4. Contributions
Borrower Performance
4.1 The NSSED, whose objectives are shared by the government and the main political parties, expresses the authorities' objectives and the policies to achieve them. The NSSED process needs fine tuning, however. First, it must confront the critical issues of state capture and poor investment climate. Second, it must separate sector guidelines from strategic priorities and ensure that budget allocations reflect sectoral priorities.
4.2 Macro stability and business environment. The government has maintained economic stability throughout the 1997-04 period, and its actions after the pyramids scheme, during the Kosovo crisis, and the drought attest to its commitment. Responding quickly to short-term problems while keeping long-term objectives in mind helped achieve low inflation and high growth rates. The pyramid scheme collapse created the necessary momentum for further reform; some reforms were far reaching but the surge in state capture could undermine many achievements. The country remains vulnerable to shocks, despite its successes, and must reduce the fiscal deficit and public sector debt, especially domestic, to prevent cash flow problems and the loss of external competitiveness.
4.3 The government has some way to go to reduce the cost of doing business and to improve governance and public sector administration. Were today’s monopolies to become entrenched, they could undermine government will to improve public administration, and to strengthen the judiciary and the respect for the rule of law.
4.4 Project outcomes and political support. Government agencies seem to have performed better in projects that supported the growth pillar than in those that supported the governance and human development pillar. Although project design bears some responsibility for outcomes, the conditions in the executing agencies also contribute to outcomes. Well executed projects have had political support and have been managed competently by people who stay long enough to know them and complete them successfully. The Power Sector is an example of how political will stimulated by crisis led to successful reform.
4.5 Poorly executed projects had less political support and more revolving Ministers and project managers. Absence of sector strategies and limited capacity in sector ministries to define policy and implement projects compounded these problems. In education, for example, despite numerous changes, the government did not improve the MOE's capability or leadership, did not supply it with sufficient budgetary resources, and lacked commitment to reform the sector.
4.6 Aid Coordination. The government disperses responsibilities for aid coordination among agencies that deal with different donors: the Ministry of Finance with the IMF and the World Bank, the Ministry of Economy with the UNDP, and the Ministry of Integration with EU. Therefore, a unified vision of aid and a coordinated assistance effort become almost impossible.

33
Bank Performance
4.7 IDA selected relevant objectives for its assistance and for the most part proposed reasonable solutions and interventions to achieve them. The direction and amount of the assistance was to some extent determined by the need to respond to crises but, overall, IDA adhered to a strategy that sought to maintain relatively high growth rates and reduce poverty. The strategy was more effective when IDA sought to achieve specific outcomes, for example, infrastructure and the financial sector, rather than outputs and processes, for example, governance and anticorruption.
4.8 Perhaps the most important contribution of Bank assistance was the timely support that it gave during the crises. Outside of these periods, it helped to launch a dialogue among the government, political parties and civil society that initially led to a Growth and Poverty Reduction Strategy that later crystallized into the NSSED. The government appreciates the assistance the Bank gave to the PRSP process, which it considers useful.
4.9 The government considers the Bank one of its main policy interlocutors and appreciates its technical and financial assistance. It finds that the funds are used more efficiently because of the preparation and supervision of projects and the procurement of goods and services. Some government agencies believe that they could benefit from more support from the Bank office in Tirana to help them evaluate project component additions and deletions.
4.10 Multiple scattered loans. The Bank continued lending small amounts for projects scattered over many areas, which probably resulted in a lesser impact for the assistance than had IDA focused in projects in fewer areas. For example, lending for rural sector financed several projects that produced satisfactory outcomes but that had negligible impacts overall.
4.11 Business Environment. The Bank has not raised forcefully the issue of state capture in the Joint Staff Assessment of the NSSED evaluation, nor has it intervened to support improving the quality of the regulatory environment for business, except for the inclusion of some FIAS recommendations in the second PRSC.
4.12 Realism of objectives and importance of results (outcomes). In several areas (governance, health, education) the Bank sought to achieve lofty goals but paid insufficient attention to the means of achieving them and to their outcomes. In some cases the Bank emphasized the need to issue new legislation, but neglected to look at how to enforce it. In governance, this could undermine the Bank's credibility should the country follow its advice and continue to see governance indicators deteriorate.
4.13 PRSC. The 2002 country strategy identified the broad content of the PRSC, but the conditions focused mostly on process (such as passage and enactment of laws), which may be necessary, but may not be sufficient to achieve desired outcomes. The PRSC were modest in size, but covered a wide range of themes. The approach followed in Albania created opportunities and incentives for sectors in the Bank to rely on the PRSC

34
to advance their agenda rather than rely upon their own sector programs. Moreover, when major themes such as the quality of the investment climate are addressed partially within a complex operation they receive inadequate attention. The PRSC experience should be contrasted with the success of specific interventions in the energy sector. Here government adherence to a specific action plan for reform with tough, monitorable indicators was a condition of Bank support.
Other Partners
4.14 IFC and MIGA. Since Albania became a member in 1991, through fiscal year 2004, IFC has committed US$81 million of its own funds to investment projects in the country. IFC investment has financed seven projects in the financial, oil and gas, information, and manufacturing sectors. In fiscal year 2004, IFC and EBRD each acquired a 19.5 percent stake in INSIG, Albania’s government-owned insurance company. IFC and EBRD also financed Vodafone to enable it to develop a nationwide cellular network. This project is the country’s largest debt-financed project to date and the first syndicated long-term loan to the private sector of Albania. IFC’s advisory work in Albania began with work in the oil and mining sectors in the mid- nineties, and has continued with work on administrative barriers to investment, small and medium enterprise development, legal framework for insurance industry. MIGA is active in Albania and has guarantees outstanding of US$18.5 million.
4.15 IMF. Albania received assistance from the IMF in the form of an Emergency Post Conflict Assistance credit for about US$12 million in November 1997, a three-year Enhanced Structural Adjustment Facility loan for about US$16 million in May 1998 and a Poverty Reduction and Growth Facility arrangement for about US$36 million in June 2002. The assistance sought to improve fiscal and monetary management to sustain high rates of growth (7-8 percent), achieve low inflation (3 percent or lower), and bring current account deficit to medium term viability. It supported reforms in the banking sector, including regulation, in public administration, privatization and agriculture, in the electricity sector, subsidies to public enterprises, and increasing social assistance.
4.16 European Union (EU). The EU has been the largest donor to Albania since 1991, with assistance totaling about 1.27 billion euros. The assistance has supported strengthening the state and the rule of law, infrastructure (roads, water and ports, airport), agriculture and local community development, education, and alleviate humanitarian problems. Since 1999 the relations between Albania and the EU were anchored in the EU’s Stabilization and Association Process (SAP), a framework that governs relations between the EU and the Western Balkan countries. Under the SAP various forms of assistance helped Albania to pass through a political and economic transition. The assistance focuses on helping Albania create the conditions to become eventually an EU member; the main difficulties rest in inadequate capacity to implement and enforce laws, weak public administration, and widespread fraud and corruption.42 In its most recent evaluation, the EU concludes that results have fallen short of expectations in the key 42 European Commission, Directorate Western Balkans, EC CARDS Program, Albania: Country Strategy Paper 2002-2006 (30 November 2001), p. 15.

35
areas of organized crime, corruption, judicial system and public administration reform.43 The fight against corruption is an underlying objective in the SAP and aims to improve transparency and efficiency. The budget for the assistance in 2005-6 is around US$45.5 million per year.
4.17 UNDP. UNDP delivers nearly US$8 million per year in development and technical assistance and plays an advocacy role through the Human Development Report and the Millennium Development Goals (MDGs). UNDP is helping Albania integrate the MDGs into the NSSED. The UNDP is also helping prepare MDGs at the local and regional level and increase awareness of the NSSED among local communities.
43 Commission of the European Communities, Albania: Stabilization and Association Report 2004, Brussels, SEC (2004) 374/2, p. 1.

36
5. Lessons and Recommendations Lessons
5.1 Several lessons emerge from this evaluation. First, Bank assistance was effective when the government adopted and donors supported a sector strategy that laid out a reform agenda with clear and monitorable performance indicators. Second, developing the analytic underpinning and strategy was also important, as was done in the electricity sector but, not by contrast, for issues related to governance, which lacked a clear strategic framework. Third, a series of projects that build around pilot phases, such as in water supply, are more likely to have an impact at a country level than a number of small projects spread over many sub-sectors which fail to have synergies on a larger scale. Fourth, Bank assistance that sought solutions to institutional and management problems with project implementation units was unable to create lasting, effective institutions; it also undermined the long term objectives of institutional development and project sustainability. Fifth, donor coordination was good following crises, when the government focused on specific problems such as in energy and finance. Donor coordination in other areas, particularly where there was no crisis, such as in health, was not good and needs improvement.
Recommendations
5.2 The lessons suggest the following recommendations:
• Country strategies and project design need to move to an outcome-oriented approach. To accomplish this, IDA should establish monitorable and realistic targets for outcomes and design interventions to meet these targets. Where possible interventions should focus on the quality of service delivery and cost recovery, like in electricity and water.
• Bank assistance should increase selectivity, with priority in infrastructure —including urban—health and education. Important issues such as governance and business climate will need to be undertaken in conjunction with and, for areas specifically covered by agreements (the acquis), perhaps under the leadership of the EU.
• The Bank should fill existing gaps in ESW on health, infrastructure, and urban development.
• IDA should start working with the present administrative structures of government and its organizations and gradually phase out the project implementation units.
5.3 Early in this decade Albania was considered eligible only for IDA lending. Over the last three years Albania’s macroeconomic indicators and GNP per capita have improved substantially, the latter now about double IDA’s operational threshold. Management should review the justification for continued IDA eligibility, explore Albania’s potential creditworthiness for IBRD lending, and ensure that the results of this analysis form the basis for proposals on lending levels and lending terms in the next country assistance strategy.
37
Annex A: Statistical Annexes
Annex Table1 : Albania at a Glance
Annex Table 2 : Albania-Key Economic and Social Indicators
Annex Table 3 : Albania-Development Assistance and World Bank Lending
Annex Table 4 : Albania-Selected Economic and Sector Work, 1990-2004
Annex Table 5 : Ratings for Albania and Comparator Countries
Annex Table 6 : Albania-Comparative Bank Budget (by Cost Category) 2000-2004
Annex Table 7 : Albania-World Bank’s Senior Management
Annex Table 8 : Albania-Millennium Development Goals
Annex Table 9 : Source Details for Text Tables


39 Annex A
Annex Table 1: Albania at a Glance 9/15/04
Europe & Lower-POVERTY and SOCIAL Central middle-
Albania Asia income2003Population, mid-year (millions) 3.2 473 2,655GNI per capita (Atlas method, US$) 1,740 2,570 1,480GNI (Atlas method, US$ billions) 5.5 1,217 3,934
Average annual growth, 1997-03
Population (%) 0.3 0.0 0.9Labor force (%) 0.8 0.2 1.2
Most recent estimate (latest year available, 1997-03)
Poverty (% of population below national poverty line) 25 .. ..Urban population (% of total population) 44 63 50Life expectancy at birth (years) 74 69 69Infant mortality (per 1,000 live births) 22 31 32Child malnutrition (% of children under 5) 14 .. 11Access to an improved water source (% of population) 97 91 81Illiteracy (% of population age 15+) 1 3 10Gross primary enrollment (% of school-age population) 107 103 112 Male 107 104 113 Female 107 102 111
KEY ECONOMIC RATIOS and LONG-TERM TRENDS
1983 1993 2002 2003
GDP (US$ billions) .. 1.2 4.8 6.1Gross domestic investment/GDP 36.1 13.2 22.7 ..Exports of goods and services/GDP 18.2 15.4 18.9 ..Gross domestic savings/GDP 33.5 -33.7 -1.4 ..Gross national savings/GDP .. 10.6 14.2 ..
Current account balance/GDP .. 1.2 -8.4 ..Interest payments/GDP .. 0.2 0.4 0.2Total debt/GDP .. 64.0 27.2 25.4Total debt service/exports 0.0 1.0 3.4 ..Present value of debt/GDP .. .. 18.0 ..Present value of debt/exports .. .. 51.5 ..
1983-93 1993-03 2002 2003 2003-07(average annual growth)GDP -3.3 6.1 4.7 6.0 ..GDP per capita -4.8 6.5 4.1 5.4 ..Exports of goods and services .. 6.6 5.5 .. ..
STRUCTURE of the ECONOMY1983 1993 2002 2003
(% of GDP)Agriculture 34.1 54.6 25.3 ..Industry 43.3 22.9 18.9 .. Manufacturing .. .. .. ..Services 22.6 22.5 55.7 ..
Private consumption 57.8 119.5 93.0 ..General government consumption 8.8 14.1 8.4 ..Imports of goods and services 20.8 62.3 43.1 ..
1983-93 1993-03 2002 2003(average annual growth)Agriculture 1.2 2.2 2.3 ..Industry -8.3 9.7 2.2 .. Manufacturing .. 8.7 0.3 ..Services -4.1 7.0 6.6 ..
Private consumption .. 4.9 5.5 ..General government consumption .. 5.5 9.7 ..Gross domestic investment 2.0 12.3 6.1 ..Imports of goods and services .. 5.6 9.8 ..
Note: 2003 data are preliminary estimates.This table was produced from the Development Economics central database.* The diamonds show four key indicators in the country (in bold) compared with its income-group average. If data are missing, the diamond will be incomplete.
-20
0
20
40
60
98 99 00 01 02 03
GDI GDP
Growth of investment and GDP (%)
AlbaniaLower-middle-income group
Development diamond*
Life expectancy
Access to improved water source
GNIpercapita
Grossprimary
enrollment
-40
-20
0
20
40
60
98 99 00 01 02 03
Exports Imports
Growth of exports and imports (%)
AlbaniaLower-middle-income group
Economic ratios*
Trade
Domesticsavings
Investment
Indebtedness

Annex A (continued) 40
Albania
PRICES and GOVERNMENT FINANCE1983 1993 2002 2003
Domestic prices(% change)Consumer prices .. 85.0 5.2 ..Implicit GDP deflator 0.0 114.8 6.0 3.9
Government finance(% of GDP, includes current grants)Current revenue 50.0 28.5 22.7 ..Current budget balance 24.7 0.0 -0.1 ..Overall surplus/deficit .. -8.7 -6.3 ..
TRADE1983 1993 2002 2003
(US$ millions)Total exports (fob) 342 112 330 .. Agriculture .. 20 40 .. Mineral products .. 18 9 .. Manufactures .. 1 206 ..Total imports (cif) 384 602 1,485 .. Food .. 120 286 .. Fuel and energy .. 85 206 .. Capital goods .. 193 672 ..
Export price index (1995=100) .. .. .. ..Import price index (1995=100) .. .. .. ..Terms of trade (1995=100) .. .. .. ..
BALANCE of PAYMENTS1983 1993 2002 2003
(US$ millions)Exports of goods and services 354 189 915 ..Imports of goods and services 405 763 2,076 ..Resource balance -51 -574 -1,160 ..
Net income 7 34 128 ..Net current transfers 6 555 625 ..
Current account balance -38 15 -408 ..
Financing items (net) -3 34 443 ..Changes in net reserves 41 -49 -36 ..
Memo:Reserves including gold (US$ millions) .. .. 866 ..Conversion rate (DEC, local/US$) .. 102.1 140.2 121.9
EXTERNAL DEBT and RESOURCE FLOWS1983 1993 2002 2003
(US$ millions)Total debt outstanding and disbursed .. 786 1,313 1,555 IBRD .. 0 0 0 IDA .. 28 476 583
Total debt service .. 8 58 52 IBRD .. 0 0 0 IDA .. 0 3 5
Composition of net resource flows Official grants .. 183 105 .. Official creditors .. 61 131 120 Private creditors .. 11 1 -3 Foreign direct investment .. 58 135 .. Portfolio equity .. 0 0 ..
World Bank program Commitments .. 70 88 61 Disbursements .. 26 79 61 Principal repayments .. 0 0 1 Net flows .. 26 79 60 Interest payments .. 0 3 4 Net transfers .. 26 76 56
Note: This table was produced from the Development Economics central database. 9/15/04
-15
-10
-5
097 98 99 00 01 02 03
Current account balance to GDP (%)
0
500
1,000
1,500
2,000
97 98 99 00 01 02 03
Exports Imports
Export and import levels (US$ mill.)
0
10
20
30
40
98 99 00 01 02 03
GDP deflator CPI
Inflation (%)
G: 31
D: 159C: 90
B: 583
F: 35
E: 657
Composition of 2003 debt (US$ mill.)
A - IBRDB - IDA C - IMF
D - Other multilateralE - BilateralF - PrivateG - Short-term

Annex Table 2: Albania-Key Economic and Social Indicators 1997-2003
Series Name 1997 1998 1999 2000 2001 2002 2003 Albania Average
Europe & C. Asia
Low Middle Income
Armenia Bosnia & Herzegovina
Bulgaria Romania
GDP growth (annual %) (10.3) 12.7 10.1 7.3 7.6 4.7 6.0 5.4 3.8 4.0 8.0 11.3 2.7 0.8 GDP per capita growth (annual %) (9.6) 13.1 9.9 6.6 6.6 3.7 6.9 5.3 3.8 3.0 8.1 8.8 3.7 1.1 GNI per capita, PPP (current international $) 790 880 970 1,150 1,320 1,420 1,740 1,181 2,174 1,366 709 1,264 1,587 1,750 GNI per capita, Atlas Method (current US$) 2,720 3,120 3,480 3,800 4,160 4,380 4,700 3,766 6,269 4,596 2,669 5,456 6,223 6,016 Agriculture, value added (% of GDP) 33.6 32.6 29.5 29.1 26.0 25.3 .. 29.4 9.8 11.8 28.5 16.8 16.5 14.7 Industry, value added (% of GDP) 18.7 16.0 16.8 19.0 19.1 18.9 .. 18.1 33.1 36.4 34.2 32.0 29.0 36.6 Services, etc., value added (% of GDP) 47.7 51.4 53.7 51.9 54.8 55.7 .. 52.5 57.1 51.8 37.3 51.2 54.5 48.7 Exports of goods and services (% of GDP) 10.5 11.1 15.8 19.0 19.7 18.9 .. 15.8 37.5 27.1 24.9 26.8 52.6 30.6 Imports of goods and services (% of GDP) 36.7 34.5 31.9 40.8 41.8 43.1 .. 38.1 35.8 25.5 50.9 61.3 56.6 37.0 Current account balance (% of GDP) (12.6) (2.4) (4.5) (4.2) (5.1) (8.4) .. (6.2) - - (13.5) (24.4) (3.7) (4.8) Total debt service (% of exports of goods and services)
4.4 2.6 2.3 2.0 2.3 3.4 .. 2.8 18.0 21.9 9.2 9.1 17.5 25.0
External debt (% of GNI) 23.3 22.3 20.1 27.9 24.8 26.4 .. 24.1 48.9 44.6 44.4 47.2 80.3 27.8 Total reserves in months of imports 5.0 5.3 5.6 5.1 5.2 5.0 .. 5.2 4.6 7.2 3.9 2.3 5.4 4.4 Current revenue, excluding grants (% of GDP) 16.5 21.6 .. .. .. .. .. 19.0 24.7 17.4 - - 32.8 28.1 Current expenditure, total (% of GDP) 26.3 28.0 .. .. .. .. .. 27.2 - - - - 30.5 29.7 Overall budget balance, excluding capital grants (% of GDP)
(13.5) (11.6) .. .. .. .. .. (12.5) - - - - 1.7 (3.2)
Gross domestic savings (% of GDP) (16.2) (6.2) 0.3 6.6 3.7 (1.4) .. (2.2) 23.1 26.4 (6.6) (9.2) 13.7 13.7 Inflation, consumer prices (annual %) 33.2 20.6 0.4 0.1 3.1 7.8 0.5 9.4 - - 4.5 - 157.9 53.9 Literacy rate, adult total (% of people ages 15 and above)
82.5 83.3 83.9 84.7 98.7 .. .. 86.6 96.8 86.8 98.5 94.6 98.3 97.9
Immunization, DPT (% of children ages 12-23 months)
99.0 96.0 97.0 97.0 97.0 98.0 .. 97.3 92.6 86.4 90.3 85.7 94.3 98.0
Improved water source (% of population with access)
.. .. .. 97.0 .. .. .. 97.0 90.9 81.0 - - 100.0 58.0
Improved sanitation facilities (% of population with access)
.. .. .. 91.0 .. .. .. 91.0 - 58.9 - - 100.0 53.0
Life expectancy at birth, total (years) 71.7 .. 74.0 74.0 .. 74.0 .. 73.4 68.6 68.7 73.9 73.3 71.3 69.6 Mortality rate, infant (per 1,000 live births) .. .. .. 24.0 .. 22.0 .. 23.0 31.2 33.3 31.0 15.0 14.5 19.0 School enrollment, preprimary (% gross) .. 41.7 41.9 44.4 .. .. .. 42.7 57.0 32.9 28.8 - 65.5 64.3 School enrollment, primary (% gross) .. 108.2 108.2 106.6 .. .. .. 107.7 100.6 113.9 96.2 - 102.1 102.5 School enrollment, secondary (% gross) .. 75.8 75.8 78.4 .. .. .. 76.7 87.1 71.6 86.3 - 90.8 80.0 Population growth (annual %) (0.9) (0.5) (0.0) 0.4 0.6 0.6 0.6 0.1 (0.0) 1.0 (1.0) 2.2 (0.8) (0.3) Population, total 3.1 3.1 3.1 3.1 3.1 3.2 3.2 3.1 473.9 2,586.2 3.1 3.9 8.1 22.4 Urban population (% of total) 40.2 40.8 41.4 42.0 42.6 43.2 43.8 42.0 63.1 47.8 65.0 43.0 68.9 54.7 Source: World Bank internal database December 22, 2004.
41A
nnex A (continued)

Annex Table 3: Albania-Development Assistance and World Bank Lending
Table 3a. Total Receipts Net (ODA*, OOF*, Private). 1997-2003 Data in USD million
Years Cumulative Annual 1997 1998 1999 2000 2001 2002 2003 1997-2003 Average
ALL Donors, Total 174.3 255.0 511.9 232.3 345.4 322.2 376.6 2,217.6 316.8
DAC Countries, Total** 126.3 80.2 281.5 55.6 228.6 177.4 244.1 1,193.6 170.5
o/w Italy 37.3 18.2 78.1 (93.2) 20.3 22.8 20.8 104.3 14.9
Multilateral ,Total 45.7 171.1 221.6 176.1 114.4 136.6 130.7 996.2 142.3
o/w EBRD (3.2) 3.0 (4.6) (0.1) (1.8) 5.9 10.4 9.6 1.4
o/w EC 25.1 86.3 115.4 87.0 64.3 38.4 44.6 461.1 65.9
o/w IDA 18.9 62.8 80.6 64.4 34.3 78.9 59.5 399.3 57.0
IBRD & IDA Share of Multilateral Assistance ( percent)
41 37 36 37 30 58 45 40 40
IBRD & IDA Share of Total Assistance (percent)
11 25 16 28 10 24 16 18 18
*ODA: Official Development Assistance- Grants or loans to countries and territories on Part 1 of the DAC List of Aid Recipients (developing countries) that are: 1- Undertaken by the Official Sector; 2- Have promotion of economic development and welfare as their main objective, 3- Are granted at confessional terms. (the loan has a grant element of at least 25%) * Other Official Flows (OOF)- Transactions by the official sector with countries on the List of Aid Recipients that do not meet the conditions of Official Development. Assistance or Official Aid eligibility, either because they are not primarily aimed at development, or because they have a grant element of less than 25 percent. ** DAC: Development Assistance Committee. The committee of the OECD which deals with development cooperation matters. Source: OECD Website. (Reference Section: Total Receipts (DAC2a, DAC2b, DAC4 : ODA+OOF+Private)) December 20, 2004.
Annex A
(continued) 42

43 Annex A (continued)
Annex Table 3b: World Bank Commitments by Sector Board 1998-2004 Sector- Board 1998 1999 2000 2001 2002 2003 2004 Total Economic Policy 5 45 50
Education 12 12
Infrastructure 27 24 8 47 28 25 159
Financial Sector 7 15 22
Health, Nutrition and Population
17 17
Private Sector Development 10 10
Public Sector Governance 30 18 48
Rural Sector 36 10 6 15 67
Social Development 15 15
Social Protection 25 14 10 20 18 87
Total 84 125 60 28 88 43 58 485
Source: World Bank internal database, November 2004.

Annex A (continued) 44
Table 3c: Albania-List of IBRD/IDA Approved Projects, 1995-2004 Proj ID Proj Name Appr
FY Sector Board IBRD/ IDA Amt
Latest DO
Latest IP
Latest Risk Rating
Project Status
Date, Rev Closng Outcome Sustainability Inst Dev
P040818 Durres Port 1998 Transport 17 S S M Active 12/31/2004
P040975 Land Devlopment 1998 Urban Development 10 S S M Active 3/31/2005
P041442 Municipal Water/Ww 2003 Water Supply and Sanitation 15 S S S Active 12/31/2009
P043178 Irrigation & Drain Ii 1999 Rural Sector 24 S S M Active 3/31/2005
P045312 Health Recovery 1998 Health, Nutrition and Population
17 U U H Active 1/31/2005
P051310 Microcredit 1999 Rural Sector 12 S HS S Active 6/30/2005
P054736 Ag Services 2001 Rural Sector 10 S S S Active 12/31/2007
P055383 Social Service Dev. 2001 Social Protection 10 U U S Active 3/31/2008
P057182 Leg/Jud Ref 2000 Public Sector Governance 9 S S S Active 12/31/2004
P057818 FSACc 2002 Financial Sector 15 S S N Active 12/31/2004
P066260 Road Maintainence 2002 Transport 17 S S S Active 6/30/2007
P069079 Fin Sec Ibta 2000 Financial Sector 7 S S N Active 6/30/2005
P069479 Fishery Devt 2002 Rural Sector 6 S S S Active 9/30/2007
P069939 Public Adminis. Ref 2000 Public Sector Governance 9 S S S Active 6/30/2006
P070078 Trade & Trans Facility In SE Europe 2001 Transport 8 S S S Active 3/31/2005
P074905 Power Sect Rehab/Restructuring 2002 Energy and Mining 30 S S S Active 3/31/2006
P077297 Community Works 2 2003 Social Development 15 S S M Active 9/30/2008
P077526 Power Sector General & Reconstruction 2004 Energy and Mining 25 S S S Active 1/31/2008
P082128 Water Resource Mgmt 2004 Rural Sector 15 S S M Active 6/30/2009 P083897 Road Maint. Supplmt. 2003 Transport 13 Active
P008253 Health Servs Rehab 1995 Health, Nutrition and Population 12 S S M Closed 6/4/2001 Satisfactory Likely Modest
P008257 EFSA 1995 Private Sector Development 15 S S N Closed 6/29/1998 Moderately satisfactory Likely Modest
P008259 Power Loss Reduction 1995 Energy and Mining 5 U U S Closed 5/13/1998 Unsatisfactory Uncertain Modest
P008267 Rural Roads 1995 Transport 15 S S M Closed 5/11/2001 Satisfactory Likely High
P008270 Irrig Rehab 1995 Rural Sector 10 S HS M Closed 12/14/1999 Satisfactory Likely Substantial
P008271 Forestry 1996 Rural Sector 8 S S S Closed 11/11/2003
P008272 Tax Admin Mod 1995 Public Sector Governance 4 S S N Closed 11/3/2000 Satisfactory Likely Substantial
P008273 Rural Development 1995 Rural Sector 6 S S S Closed 12/21/1999 Satisfactory Likely High
P034181 Urban Works & Micro 1996 Private Sector Development 4 S S S Closed 9/15/1999 Satisfactory Uncertain Substantial
P034491 Power Trnsm & Dist 1996 Energy and Mining 30 U S S Closed 12/3/2002 Unsatisfactory Likely Modest
P035787 Agroproc Devt 1996 Rural Sector 6 S S M Closed 4/11/2000 Unsatisfactory Likely Modest
P036060 National Roads 1996 Transport 25 S S M Closed 5/31/2003 Moderately satisfactory Likely Modest
P051309 Community Works 1999 Social Protection 9 S S M Closed 12/23/2002 Satisfactory Likely Substantial
P066335 Comm Works Support (Supplement) 1999 Social Protection 5 Closed 12/23/2002
P051602 Private Ind. Rec. 1998 Private Sector Development 10 S S M Closed 12/23/2002 Moderately satisfactory Non-evaluable Modest
P053357 Rehabilitation 1998 Social Protection 25 S S M Closed 6/30/1998 Satisfactory Uncertain Modest
P054384 Recovery Prog. TA 1998 Economic Policy 5 S S M Closed 1/7/2003 Satisfactory Likely Substantial
P055160 SAC 1999 Economic Policy 45 S S M Closed 12/29/2000 Satisfactory Likely Substantial
P065825 Public Expenditure Support 1999 Public Sector Governance 30 HS HS M Closed 7/1/1999 Satisfactory Likely Substantial
P066491 Ws Urg Rehab 2000 Water Supply and Sanitation 10 S S M Closed 9/8/2003 Satisfactory Likely Modest
P068853 Emg Road Repair 2000 Transport 14 S S M Closed 8/15/2003 Satisfactory Unlikely Modest
P069120 Educ Ref 2000 Education 12 S S S Closed 10/31/2004
P069935 PRSC 2002 Social Protection 20 S S M Closed 12/2/2002 Satisfactory Likely SubstantialP077739 PRSC 2 2004 Social Protection 18 S S M Closed 12/31/2004 Source: World Bank internal database as of December 14, 2004.

45 Annex A (continued)
Annex Table 4: Albania-Selected Economic and Sector Work, 1990-2004 Document Title Date Report No. Document Type
Country Assistance Strategy Albania - Country assistance strategy Vol. 1 (English) 5/28/2002 24189 Country Assistance
Strategy Document Albania - Country assistance strategy - progress report Vol. 1 (English) 2/29/2000 20736 CAS Progress Report
Economic Report Albania - Sustaining Growth Beyond the Transition: A World Bank Country
Economic Memorandum 12/27/2004 29257 Economic Report
Albania - Poverty assessment Vol. 1 of 1 (Albanian) 12/1/2003 26213 Economic Report Albania - Poverty assessment Vol. 1 of 1 (English) 11/5/2003 26213 Economic Report Albania - Public expenditure and institutional review Vol. 1 (English) 4/16/2001 21857 Economic Report Albania - Public expenditure and institutional review Vol. 2 (English) 4/16/2001 21857 Economic Report Albania - Beyond the crisis - a strategy for recovery and growth Vol. 1 (English) 12/7/1998 18658 Economic Report Albania - Building a new economy Vol. 1 (English) 7/14/1994 12342 Economic Report
Sector Report Albania - Decentralization in transition Vol. 2 of 2 / Analytical report (Albanian) 9/1/2004 27885 Sector Report Albania - Decentralization in transition Vol. 2 of 2 / Analytical report (English) 2/1/2004 27885 Sector Report Albania - Decentralization in transition Vol. 1 of 2 (English) 2/1/2004 27885 Sector Report Albania - Decentralization in transition Vol. 1 of 2 / Summary report and matrix of
issues and options (Albanian) 2/1/2004 27885 Sector Report
Trade policies and institutions in the countries of South Eastern Europe in the EU Stabilization and Association Process 3/28/2004 24460 Sector Report
Albania - Growing out of poverty Vol. 1 (English) 5/30/1997 15698 Sector Report
Reports Albania- Second annual poverty reduction strategy paper (PRSP) progress report
and joint IDA IMF staff assessment 6/22/2004 29285 Poverty Reduction Strategy Paper (PRSP)
Building market institutions in South Eastern Europe: comparative prospects for investment and private sector development 5/1/2004 29301 Publication
The tobacco epidemic in south east Europe: consequences and policy responses 1/3/2004 28864 Departmental Working Paper
Measuring social capital: an integrated questionnaire 1/1/2004 28110 Publication
Albania - Joint staff assessment of the Poverty Reduction Strategy Paper (PRSP) annual progress report Vol. 1 of 1/ Albania - Joint staff assessment of the Poverty Reduction Strategy Paper (PRSP) annual progress report (English)
6/16/2003 26139 Poverty Reduction Strategy Paper (PRSP)
Safety nets in transition economies : a primer 3/1/2003 25985 Working Paper Water resource management in South Eastern Europe 1/1/2003 28295 Working Paper
Aligning assistance for development effectiveness: promising country experience 9/29/2002 27778 Working Paper
Albania - Poverty Reduction Strategy Paper (PRSP) and joint assessment Vol. 1 (English) 5/28/2002 23469 Poverty Reduction Strategy
Paper (PRSP) Albania - Country Financial Accountability Assessment Vol. 1 (English) 5/14/2002 24241 Country Financial
Accountability Assessment Albania-Building construction sector study and pipeline development 2/28/2002 24663 Departmental Working
Paper Poverty in Albania: a qualitative assessment 3/31/2002 WTP520 Publication
Structural reforms in southeaster Europe since the Kosovo conflict 1/1/2002 WTP526 Publication
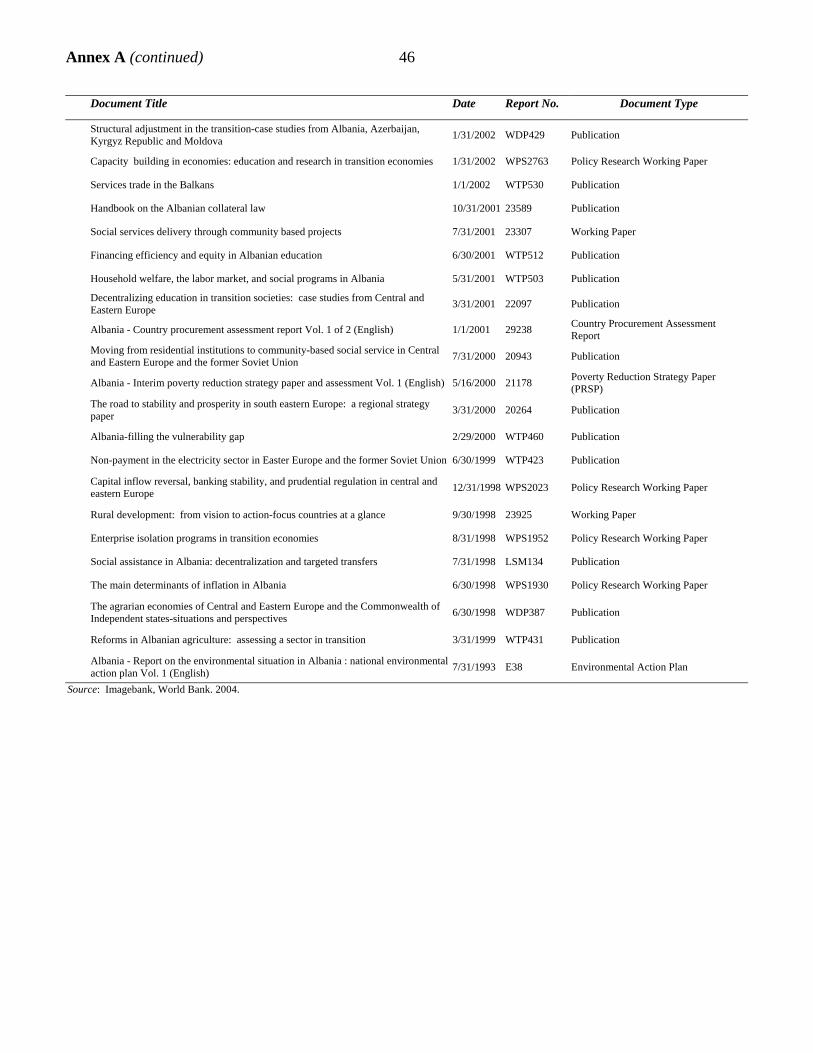
Annex A (continued) 46
Document Title Date Report No. Document Type
Structural adjustment in the transition-case studies from Albania, Azerbaijan, Kyrgyz Republic and Moldova 1/31/2002 WDP429 Publication
Capacity building in economies: education and research in transition economies 1/31/2002 WPS2763 Policy Research Working Paper
Services trade in the Balkans 1/1/2002 WTP530 Publication
Handbook on the Albanian collateral law 10/31/2001 23589 Publication
Social services delivery through community based projects 7/31/2001 23307 Working Paper
Financing efficiency and equity in Albanian education 6/30/2001 WTP512 Publication
Household welfare, the labor market, and social programs in Albania 5/31/2001 WTP503 Publication
Decentralizing education in transition societies: case studies from Central and Eastern Europe 3/31/2001 22097 Publication
Albania - Country procurement assessment report Vol. 1 of 2 (English) 1/1/2001 29238 Country Procurement Assessment Report
Moving from residential institutions to community-based social service in Central and Eastern Europe and the former Soviet Union 7/31/2000 20943 Publication
Albania - Interim poverty reduction strategy paper and assessment Vol. 1 (English) 5/16/2000 21178 Poverty Reduction Strategy Paper (PRSP)
The road to stability and prosperity in south eastern Europe: a regional strategy paper 3/31/2000 20264 Publication
Albania-filling the vulnerability gap 2/29/2000 WTP460 Publication
Non-payment in the electricity sector in Easter Europe and the former Soviet Union 6/30/1999 WTP423 Publication
Capital inflow reversal, banking stability, and prudential regulation in central and eastern Europe 12/31/1998 WPS2023 Policy Research Working Paper
Rural development: from vision to action-focus countries at a glance 9/30/1998 23925 Working Paper
Enterprise isolation programs in transition economies 8/31/1998 WPS1952 Policy Research Working Paper
Social assistance in Albania: decentralization and targeted transfers 7/31/1998 LSM134 Publication
The main determinants of inflation in Albania 6/30/1998 WPS1930 Policy Research Working Paper
The agrarian economies of Central and Eastern Europe and the Commonwealth of Independent states-situations and perspectives 6/30/1998 WDP387 Publication
Reforms in Albanian agriculture: assessing a sector in transition 3/31/1999 WTP431 Publication
Albania - Report on the environmental situation in Albania : national environmental action plan Vol. 1 (English) 7/31/1993 E38 Environmental Action Plan
Source: Imagebank, World Bank. 2004.

Annex Table 5: Ratings for Albania and Comparator Countries
Table 5a: Key OED Ratings (by Project Exit Year), FY98-04 Country Total
Evaluated (number)
Outcome % Sat (number)
Inst Dev Impact % Subst (number)
Sustainability % Likely (number)
Total Evaluated ($million))
Outcome % Sat ($)
Inst Dev Impact% Subst ($)
Sustainability % Likely ($)
Albania 28 85.7 42.9 70.4 364.4 89.3 47 77.2Armenia 13 84.6 69.2 91.7 323.3 77.2 73 95.1Bosnia-Herzegov 25 100.0 44.0 87.0 539.9 100.0 62 90.9Bulgaria 18 94.4 72.2 100.0 928.2 99.5 75 100.0Romania 19 84.2 73.7 94.7 1,835.9 68.6 58 83.7
ECA 362 82.7 54.3 80.9 23,283.5 76.7 52 83.4World Bank 1,811 74.5 46.0 66.7 138,901.2 79.4 49 76.2
Source: World Bank internal database as of Dec. 22, 2004.
Table 5b: Ratings for Active Projects
Country # Proj Net Comm Amount
# Proj At Risk % At Risk Comm At Risk (USD million)
% Commit at Risk
Albania 20 288.5 2 10.0 23.0 8.0Armenia 18 307.5 0 0.0 0.0 0.0Bosnia-Herzegovina 20 384.1 2 10.0 23.5 6.1Bulgaria 8 376.3 1 12.5 30.0 8.0Romania 21 1,490.5 3 14.3 145.0 9.7
ECA 288 14,619.6 49 17.0 2,977.5 20.4World Bank 1,391 94,149.6 267 19.2 17,101.5 18.2
Source: World Bank internal database as of Dec. 22, 2004.
Annex A
(continued) 47

Annex A (continued) 48
Annex Table 6: Comparative Bank Budget (by Cost Category) 2000-2004
(in USD thousands) Year
Country/ Region Cost Category 2000 2001 2002 2003 2004 2000-2004 2000-2004 (percent)
ESW 630 736 618 620 652 3,254 15
Lending 1,538 964 1,501 1,273 1,218 6,494 29
Project Supervision 1,953 1,920 2,025 2,343 2,143 10,384 46
Other 507 557 416 419 346 2,246 10
Albania
TOTAL 4,628 4,177 4,560 4,655 4,359 22,379 100
ESW 1,987 1,832 3,252 5,111 5,410 17,593 21
Lending 5,470 3,722 4,819 4,497 5,547 24,055 28
Project Supervision 5,793 5,472 6,743 7,412 7,516 32,936 39
Other 2,242 2,376 1,668 2,064 2,206 10,556 12
IDA-ECA Region
TOTAL 15,492 13,402 16,482 19,084 20,679 85,139 100
ESW 3,437 4,071 5,244 5,482 4,424 22,657 21
Lending 5,495 5,730 8,566 8,054 9,441 37,285 34
Project Supervision 7,050 5,948 6,657 7,947 8,196 35,798 33
Other 2,158 2,347 2,516 2,957 3,707 13,685 13
Balkans
TOTAL 18,139 18,096 22,983 24,440 25,767 109,425 100 Note: IDA- ECA Region includes IDA countries in ECA: Armenia, Georgia, Kyrgyz Republic, Moldova, and Tajikistan. Balkans include: Bosnia-Herzegovina, Bulgaria, Croatia, Macedonia, Romania, and Serbia-Montenegro. Source: World Bank internal database, Dec. 20, 2004.
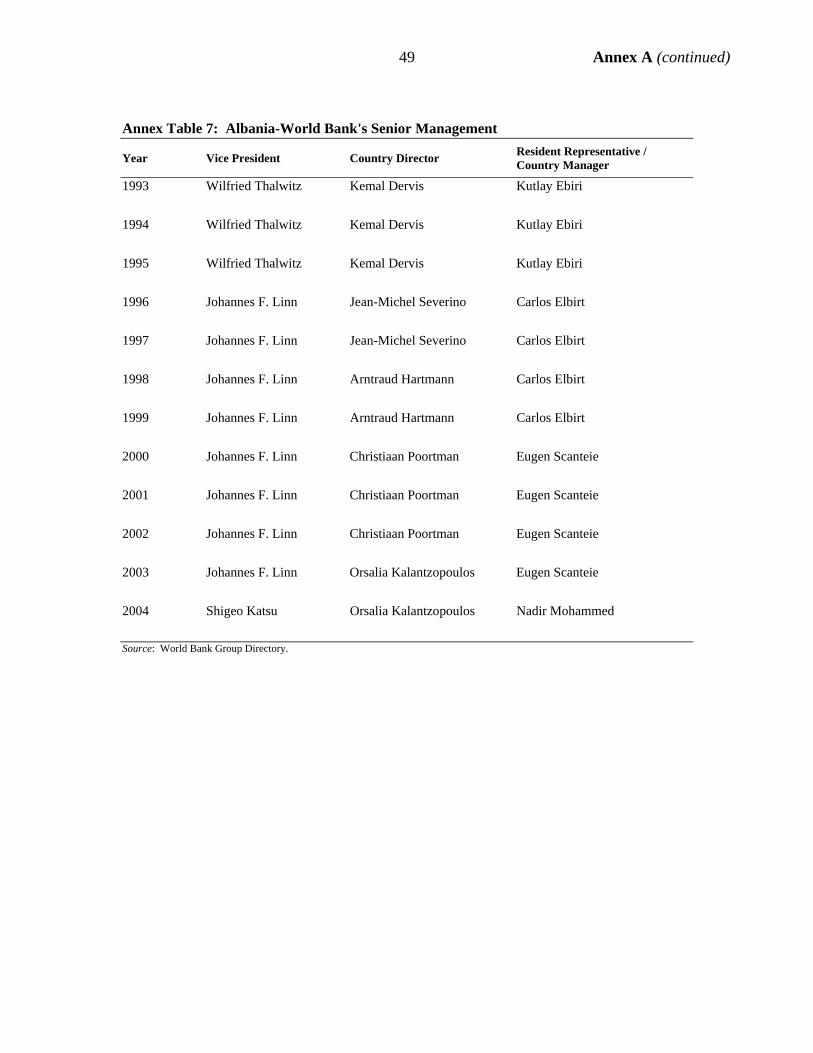
49 Annex A (continued)
Annex Table 7: Albania-World Bank's Senior Management
Year Vice President Country Director Resident Representative / Country Manager
1993 Wilfried Thalwitz Kemal Dervis Kutlay Ebiri
1994 Wilfried Thalwitz Kemal Dervis Kutlay Ebiri
1995 Wilfried Thalwitz Kemal Dervis Kutlay Ebiri
1996 Johannes F. Linn Jean-Michel Severino Carlos Elbirt
1997 Johannes F. Linn Jean-Michel Severino Carlos Elbirt
1998 Johannes F. Linn Arntraud Hartmann Carlos Elbirt
1999 Johannes F. Linn Arntraud Hartmann Carlos Elbirt
2000 Johannes F. Linn Christiaan Poortman Eugen Scanteie
2001 Johannes F. Linn Christiaan Poortman Eugen Scanteie
2002 Johannes F. Linn Christiaan Poortman Eugen Scanteie
2003 Johannes F. Linn Orsalia Kalantzopoulos Eugen Scanteie
2004 Shigeo Katsu Orsalia Kalantzopoulos Nadir Mohammed
Source: World Bank Group Directory.

Annex A (continued) 50
Annex Table 8: Albania-Millennium Development Goals 1990 1995 2001 2002
1. Eradicate extreme poverty and hunger 2015 target = halve 1990 $1 a day poverty and malnutrition rates Population below $1 a day (%) .. .. .. 2Poverty gap at $1 a day (%) .. .. .. 0.5Percentage share of income or consumption held by poorest 20% .. .. .. 9.1Prevalence of child malnutrition (% of children under 5) .. .. 14.3 .. Population below minimum level of dietary energy consumption (%) .. 5 4 .. 2. Achieve universal primary education 2015 target = net enrollment to 100 Net primary enrollment ratio (% of relevant age group) .. 98.7 97.2 .. Percentage of cohort reaching grade 5 (%) .. 82 .. .. Youth literacy rate (% ages 15-24) 94.8 96.6 99.4 .. 3. Promote gender equality 2005 target = education ratio to 100 Ratio of girls to boys in primary and secondary education (%) 96.1 101.3 102 .. Ratio of young literate females to males (% ages 15-24) 94.4 96.2 100.1 .. Share of women employed in the nonagricultural sector (%) 39.6 .. 41.1 .. Proportion of seats held by women in national parliament (%) .. 6 .. .. 4. Reduce child mortality 2015 target = reduce 1990 under 5 mortality by two-thirds Under 5 mortality rate (per 1,000) 42 33 26 24Infant mortality rate (per 1,000 live births) 36 29 24 22Immunization, measles (% of children under 12 months) 88 91 95 965. Improve maternal health 2015 target = reduce 1990 maternal mortality by three-fourths Maternal mortality ratio (modeled estimate, per 100,000 live births) .. .. 55 .. Births attended by skilled health staff (% of total) .. .. 99.1 .. 6. Combat HIV/AIDS, malaria and other diseases 2015 target = halt, and begin to reverse, AIDS, etc. Prevalence of HIV, female (% ages 15-24) .. .. .. .. Contraceptive prevalence rate (% of women ages 15-49) .. .. .. .. Number of children orphaned by HIV/AIDS .. .. .. .. Incidence of tuberculosis (per 100,000 people) .. .. 29 27.5Tuberculosis cases detected under DOTS (%) .. .. 20 247. Ensure environmental sustainability 2015 target = various (see notes) Forest area (% of total land area) 39 .. 36.2 .. Nationally protected areas (% of total land area) .. 2.9 3.1 3.8GDP per unit of energy use (PPP $ per kg oil equivalent) 3.1 7.6 8.3 .. CO2 emissions (metric tons per capita) 2.2 0.6 0.9 .. Access to an improved water source (% of population) .. .. 97 .. Access to improved sanitation (% of population) .. .. 91 .. Access to secure tenure (% of population) .. .. .. .. 8. Develop a Global Partnership for Development 2015 target = various (see notes) Youth unemployment rate (% of total labor force ages 15-24) .. .. .. .. Fixed line and mobile telephones (per 1,000 people) 12.6 13.4 191.2 347.7Personal computers (per 1,000 people) .. 1.6 9.7 11.7General indicators Population 3.3 million 3.2 million 3.1 million 3.2 million Gross national income ($) 2.2 billion 2.1 billion 4.4 billion 4.6 billion GNI per capita ($) 680 650 1,400.00 1,450.00Adult literacy rate (% of people ages 15 and over) 77 81.2 98.7 .. Total fertility rate (births per woman) 3 2.6 2.1 2.2Life expectancy at birth (years) 72.3 71.3 74 74Aid (% of GNI) 0.5 7.3 6.1 6.4External debt (% of GNI) 45.8 18.4 24.8 26.4Investment (% of GDP) 29.3 18 25.7 22.7Trade (% of GDP) 38.1 47 61.6 62Source: World Development Indicators database, April 2004. Note: In some cases the data are for earlier or later years than those stated. Goal 1 targets: Halve, between 1990 and 2015, the proportion of people whose income is less than one dollar a day. Halve, between 1990 and 2015, the proportion of people who suffer from hunger. Goal 2 target: Ensure that, by 2015, children everywhere, boys and girls alike, will be able to complete a full course of primary schooling.
Goal 3 target: Eliminate gender disparity in primary and secondary education preferably by 2005 and to all levels of education no later than 2015.
Goal 4 target: Reduce by two-thirds, between 1990 and 2015, the under-five mortality rate. Goal 5 target: Reduce by three-quarters, between 1990 and 2015, the maternal mortality ratio.
Goal 6 targets: Have halted by 2015, and begun to reverse, the spread of HIV/AIDS. Have halted by 2015, and begun to reverse, the incidence of malaria and other major diseases. Goal 7 targets: Integrate the principles of sustainable development into country policies and programs and reverse the loss of environmental resources. Halve, by 2015, the proportion of people without sustainable access to safe drinking water. By 2020, to have achieved a significant improvement in the lives of at least 100 million slum dwellers. Goal 8 targets: Develop further an open, rule-based, predictable, non-discriminatory trading and financial system. Address the Special Needs of the Least Developed Countries. Address the Special Needs of landlocked countries and small island developing states. Deal comprehensively with the debt problems of developing countries through national and international measures in order to make debt sustainable in the long term. In cooperation with developing countries, develop and implement strategies for decent and productive work for youth. In cooperation with pharmaceutical companies, provide access to affordable, essential drugs in developing countries. In cooperation with the private sector, make available the benefits of new technologies, especially information and communications.

51 Annex A (continued)
Annex Table 9: Source Details for Text Tables
Table 3.1: Source: ICRG (The PRS Group, Inc.) for ratings; Ministry of Finance for employment and wage bill. 1/ 1995. 2/ February 2004. 3/ 2000, 4/ 2003.
Table 3.3: Sources:
1. ECA Regional Tables updated as of March 2005. 2. Bank of Albania, Annual Report 2003, p. 21 and http://www.bankofalbania.org/ for growth rates, international reserves, imports, financial sector, and internal debt. 3. Bank of Albania, Quarterly Review of Albanian Economy, July-September 2004 (October 2004), Table 8. 4. Ministry of Finance, Medium Term Budget Program, Draft, July 2004, Table 22. 5. Erjon Luci, Albanian Economy: Recent Developments, paper presented at Second Annual Conference for the Balkan Countries' Central Banks, May 17-18, Sofia (mimeo). 6. IMF, Albania: Fourth Review under the Three-Year Arrangement Under the Poverty Reduction and Growth Facility. (IMF Country Report No. 04/206), July 2004, page 32 for public and publicly guaranteed debt. Notes. 1/ Preliminary. 2/ End of period. 3/ Second quarter. 4/ Medium Term Budget Program, Table 22. 5/ E. Luci, op. cit., Table 1. 6/ Reserves in months of imports computed by dividing gross reserves by import data (fob) in the balance of payments; the values for reserves and imports come from Bank of Albania. The numbers calculated this way are different from those provided by Bank of Albania, that seem to measure reserves in terms of imports of goods and services. 7/ Economic and financial risk ratings are computed as an average of the values in December 1997 and 1998, and December 2003 and 2004. The ratings have five categories: a. 0.0 - 24.5 percent, very high risk. b. 25.0 - 29.9 percent, high risk. c. 30.0 - 34.9 percent, moderate risk. d. 35.0 - 39.9 percent, low risk. e. 40.0 - 100.0 percent, very low risk.
Table 3.4: Sources:
1. http://www.bankofalbania.org/ and Annual Reports (1999-2003) for international reserves, imports, financial sector, internal debt, and other financial indicators of the banking system. 2. ECA Regional Tables updated as of March 2004. 3. WB WDI, IMF, International Financial Statistics, various years, and, for banking ownership, various Bank documents. Decimal numbers rounded to nearest integer. 4. Bank of Albania, Economic Bulletin, Banking System Over the Period 1999-2000, Vol. 5, No. 2, by Suzana Sheqeri and Edlira Abazi, Table 8 for share of public banks in total deposits. 5. Albanian Economy: Facts and Figures, Bank of Albania summary publication. Notes 1/ Herfindahl index, end of period. 2/ 2000. 3/ State-owned banks.
Table 3.6: Sources:
1/ KESH, direct information for tariffs, losses, load shedding and billing. 2/ World Bank, Poverty Assessment (2003) for interruptions in electricity service. 3/ UNDP Albania, Early Warning Report, Human Security in Albania with a Case Study on the Energy Crisis (Tirana, April 2004), p. 30. 4/ Internal OED note on infrastructure and urban development. Net contribution is calculated as taxes paid (profits and VAT) for $53 million, minus $17.5 million in profits minus $5 million in import subsidies to KESH; data comes from internal Bank documents of July 14-22, 2004 Note: * 2004.

Annex A (continued) 52 Table 3.7: Sources:
Internal OED note on infrastructure and urban development, and OED PPAR, Albania Durres Water and Sanitation and Rehabilitation Project, and Water Supply Urgent Rehabilitation Credit. Report No. 31626, Tables 3 and 4. 1/ Durres, Lezhe, Fier, Saranda, from OED. 2/ Jan-May 2004; the zero percent is the record of results for one test in Lezhe in April 2004. 3/ CEM 2004, Table 52. Nominal GDP for 2004 comes from Ministry of Finance, Macroeconomics Department, Economy in Focus, October 2004.
Table 3.8: Source: Based on information of an internal OED note on infrastructure and urban development. Table 3.10: Sources:
1/ UNDP Albania, The Albanian Response to the Millennium Development Goals (Tirana, May 2002), prepared by the Human Development Promotion Center, p. 12, quoting INSTAT, Living Conditions Survey October 1998. 2/ World Bank, Albania: Growing Out of Poverty (May 30, 1997), Report No. 15698-ALB, p. 45; it refers to urban households in Tirana, Elbasan, Fier and Lehza. 3/ UNDP, 2002, p. 13, refers to Gini for the country excluding Tirana. 4/ Harold Alderman, Social Assistance in Albania, LSMS Working Paper 134, July 1998, Table 1; the survey on which the information is based excludes Tirana. 5/ The World Bank, Albania: Poverty Assessment, Report No. 26213-AL (November 5, 2003), Table 2.1. 6/ Poverty Assessment, Table 7.3; the text that follows the table explains that all the poor in Albania are in the two lowest quintiles of the distribution, and they are 76 percent of the recipients of NE. It also says that only 25% of poor families receive NE. 7/ Ministry of Finance, Medium Term Budget Programme, 2005-2007, (Tirana, July 2004), Draft, Table 5. 8/ Derived from Ministry of Finance, op. cit.. The report provides information on the absolute amounts, and the ratio is calculated using the values of nominal GDP supplied by the Bank of Albania. * Country assistance strategy.
Table 3.11: Sources:
1. For information in 1997, except that listed in note 2, Geremia Palomba and Milan Vodopivec, Financing, Efficiency, and Equity in Albanian Education, World Bank, WTP 512, June 2001, Tables 2.3-2.5, 2.9. 2. Information for 1997, 2002 and 2003 on enrollment, number of classes and schools comes from Ministry of Education and Science, Annual Statistical Report of Education 2002/2003 for both 1997 and 2002 and 2003. The indicators for class size, school size and student teacher ratio are computed from its source. 3. Information for 2002 and 2003 comes from Ministry of Education and Science, op. cit. * 1998, ** 2001, + CAS 2002. Note: basic education includes primary and lower secondary school and students up to the age of 13; upper secondary is divided in general and vocational education and ranges in ages 14-18.
Table 3.12: Sources:
1. INSTAT, information from the web pages for life expectancy, and infant mortality. 2. For expenditure on health, Ministry of Finance, Medium Term Expenditure Framework, 2002-2004, June 2001, Table 6, and Medium Term Budget Program 2005-07, Draft, July 2004, Table 7. + CAS 2002.

53 Annex B
People Interviewed a. Government and State Entity Officials
Ministry of Agriculture and Food (MOAF) Agron Duka Minister Roland Kristo Director-Fisheries Department Arben Molla, Director, APO Enkes Shundi, Specialist Roland Laroshi Agricultural Service Melvan Balilaj Fishery (PIU) Agim E. Shehu Project Director, Agriculture (PIU) Ylli Dede Director-PIU, Irrigation Siri Allushi Director-DSI, Agriculture
Ministry of Education Edmond Hoxha General Secretary (PIU) Suzana Papadhoupulli Acting Director (PIU)
Ministry of Environment Zamir Dedej Director of Environmental for Nature Conservation Mrs. Narin Panariti Director, Environment Policy and Projects Department Dr. Lirim Selfo Project Coordinator for Lake Orhid Conservation
Ministry of Finance H.E. Arben Malaj Minister of Finance Dritan Shano Deputy Minister Gjergj Teneqexhi General Secretary Behar Zeneli Director, Public Procurement Agency Rezar Turdiu Procurement Agency Mimoza Dhembi Budget Department Mimoza Loli Treasury Department Adrian Civici Director, National Strategy for Social and Economic
Development (NSSED) Robert Kokoli Deputy General Director, Customs, Trade and Transport
Facilitation in Southeast Europe Program (TTFSE) Sabina Shyti Project Manager, TTFSE
Ministry of Foreign Affairs (MOFA) Roland Bimo Secretary General
Ministry of Health Leonard Solis Minister Eduart Hashorva Deputy Minister Mrs. Saemira Gjipali-Pino Deputy Minister Samir Padi, Director-PCU Health Sajmir Kadiu Economics Department Petrit Vasili Director Primary Health Care Service

Annex B (continued) 54
Minister of Industry and Energy (MOIE) Viktor Doda Minister
Ministry of Justice Fatmir Xhafa Minister of Justice Bendis Kripa PIU-Legal
Ministry of Labor and Social Affairs (MOLSA) Nexhmedin Dumani Deputy Minister Elda Kapallani Technical Specialist Etleva Vertopi PIU
Ministry of Local Government (MOLGD) Bledar Çuci General Secretary Fran Ibrahimi Head-Economic Department Teuta Kaso Investment Department for RMP Fran Brahimi Director of Decentralization Dept.
Ministry of Transport and Telecommunications (MOTT) Spartak Poci Minister Adem Duka Director-PIU Roads Directorate Flamur Mullisi Road Safety Shkelqim Xhaxhiu Maritime Department Thimio Plaku Land Transport
Ministry of Territorial Adjustment and Tourism Arben Demeti Vice Minister Gjergji Thomai Director-PIU Land Management Genc Gjeci Director of Water (CMU), PIU Bujar Rreme GEF Integrated Water and Wastewater Management
Municipality of Tirana Dritan Agolli General Director
Supreme Court of Albania Thimio Kondi Chief of Supreme Court
Council of Ministers, Implementation Unit of Administration Reform Project Mrs. Mirsa Titka Director Zhani Shappo Director, Public Administration Edmond Dunga Anti-corruption Department
Bank of Albania Shkëlqim Cani Governor
Other Government Officials Pjeter Dema Chairman Electricity Regulation Authority (ERE) Andis Harasani General Director, Korporata Elektro-energjetike Shqiptare
(KESH)

55 Annex B (continued)
Majlinda Gjonaj General Director, General Road Directorate (GRD) Steven Kay Procurement Advisor, PIU-GRD Mimi Kodheli Deputy Mayor of Tirana Dritan Agoli General Director of Public Works, Municipality of Tirana Elvin Meka General Manager, Tirana Stock Exchange Hassan Ceni Director Burrel Hospital, District Health Director Silva Bino Director, Public Health Institute (PHI) Zana Konini Director General, Rural Financial Fund (RFF) Robert Kokoli Deputy General Director of Customs Gjergji Leka General Director, Health Insurance Institute (ISKSH) Milva Ekonomi Director General, Instituti i Statistikës (INSTAT) Drittan Argoli Tirana Public Works Hasan Halili former Minister of Agriculture Vojsava Progri former Director of Education Haki Kola former Director PIU, Forestry Project Ahmet Mehmeti President, Ecological Club Shpetin Gjika Mayor of Vlores Arben Beqiri Chief of Cabinet, Mayor’s staff, Vlores Theodhori Shia President-Regional Council, Vlore Petrit Dervishi Director-PIU, Mid West Coast Project, Vlore Shëtim Gjika Bashkia Vlore (Kryetari), Vlore Luftar Zebi Director PHC, TRHA Sokol Limani Durres Port Authority Lefter Koka Mayor of Durres Sokol Kikino PIU-Port, Durres
b. International Donors Lutz Saltzman Ambassador, Head of Delegation, European Union (EU)
Delegation Sweder van Voorst tot Voorst Ambassador, Embassy of the Kingdom of Netherlands Cas van der Horts Deputy Head of Mission, Embassy of the Kingdom of Netherlands Silvano Tabbo Director, Italian Cooperation and Sustainable Development (Italian
Embassy) Anna Stjärnerklint Resident Representative, UNDP Batkhuyag Baldangombo Program Officer, UNDP Llazar Korra Sector Manager, Agricultural Project, European Union Gavin Evans European Union Noora Häyrinen Albania Desk Officer, European Commission Office EU-Brussels) José Sánchez Alegre Albania Administrator, EU-Brussels Marjeta Koca, International Fund for Agricultural Development (IFAD) Henning Pedersen Country Program Manger IFAD (Rome) Ismail Beka Program Manager, Deutsche Gesellschaft fur Technische
Zusammenarbeit (GTZ) Ms. Carrie Aurer Representative, UNICEF Zhaneta Shatri Health Sector, USAID Son H.Nguyen Agriculture Development Program, USAID François Wencélius Manager, National Forest Program, Food and Agriculture
Organization (FAO), Rome Azeta Cungu Agriculture Policy Officer, (FAO), Rome Richard Eberlin-Quintas Policy Officer for Europe, (FAO), Rome

Annex B (continued) 56
Raimund Jehle Operations Officer for Europe and CIS, (FAO), Rome Aleksandra Zamberlin Policy Officer for Europe, (FAO), Rome Paul Munro-Faure Chief Land Tenure Service, (FAO), Rome David Palmer Registration and Cadastre Officer, (FAO), Rome Yves Dube Forestry Project Officer for FAO/WB Project in Albania, Rome Francois Dauphin FAO/WB Investment Unit, (FAO), Rome Hilmar Foellmi Consultant, former Project Officer for FAO/WB project in
Albania, (FAO), Rome
c. Private Sector and Civil Society
Maksim Mitrojorgji Executive Director Albania Development Fund (ADF) Benet Beci Manager Finance, Albanian Savings and Credit Union Adrian Kamberi Deputy CEO, Savings Bank of Albania (Banka e Kursimeve) Bjram Muça Executive Director, Besa Foundation (Lending Institute for Small
Businesses Albania) Irma Disha Financial Director, Besa Foundation Latín Muca Besa Foundation Uwe Gyber Berlinwasser Michael Koning Berlinwasser Friedrich Per Weber Berlinwasser Dr. Ilir Gedëshi, Director,Centre for Economic and Social Studies (CESS) Simon J. Diffey Fishtech Management Consultants Pierre Semaan President Foreign Investors Advisory Services (FIAS), also the
President of Seament Albania Genc Ruli President, Institute of Contemporary Studies (ICS) Artan Hoxha Research Director, ICS Selami Xhepa Research Manager, ICS Dritan Kolleshi, Director, Lushne Market Enkes Shemdi Marketing Specialist, Lushne Market Yllka Gjermeni Accounting and Administration, Lushne Market Sali Berisha former President, Member of Parliament and Head-Democratic
Party Ridram Bode General Secretary-Democratic Party Ilir Meta former Prime Minister, Member of Parliament and founder of
Institute for Peace, Development and Integration Artan Koxhuky Member of Board of Directors, Institute for Peace, Development
and Integration Edmond Haxhinasto Executive Director, Institute for Peace, Development and
Integration Kryetari Pandeli Gjeka Micro-credit Association Aschyl Byku Water Users Association Benet Beci Finance Management, RFF Çapajev Gjokutaj Executive Director, The Open Society Foundation for Albania
(SOROS) Mimoza Gjika Program Director, SOROS

57 Annex B (continued)
Mihallaq Qirjo Country Director for Albania, Regional Environment Centre Samuiel Benalal President, Telos Group Ltd. Dr. Ylli Çabriri Human Development Promotion Center (HDPC) Artan Zajmi Durres Water Company Qemal Bere Fishery Association, Durres
d. Academics
Prof. Dr. Gramoz Pashko University of New York Tirana Prof. Marta Muco Anteon Corporation Prof. Lindita Lati Faculty of Economics, University of Tirana Prof. Mihallq Qirjo University of Tirana Prof. Dr. Velesin Peçuli Rector, Agricultural University Prof. Postoli Faculty of Forestry, University of Tirana Arben Vercuni Deputy Rector-International Relations, Agricultural University Dr. Ferdinand Bego Expert on Biodiversity, Faculty of Natural Science, University of
Tirana
e. World Bank
Johannes F. Linn former Vice President, ECA Orsalia Kalantzopoulos Country Director (ECCU4) Kristaq S. Luniku Advisor to Executive Director(EDS21) Nadir Mohammed Country Manager (ECCAL) Olav Rex Christensen Acting Country Manager (ECSPS) Timothy R. Gilbo Senior Country Officer (ECCU4) Basil Kavalsky former Country Director, ECA Carlos Elbirt former Country Manager Hormoz Aghdaey Lead Financial Sector Specialist (ECSPF) Michel Audige Lead Transport Specialist (ECSIE) Arben Bakllamaja Consultant (ECSIE) David S. Bernstein Sr. Public Sector Specialist(ECSPE) Pierre Olivier Colleye Senior Microfinance Specialist (ECSSD) Drita Dade Projects Officer (ECSSD) Gerhard Dieterle Lead Forestry Specialist(ARD) Lloyd Edgecombe Sr. Financial Spec. (ECSPF) Kathryn Ann Funk Lead Country Officer Philip Goldman Lead Operations Officer (ECSHD) Ana Gjokuta Communications Officer (ECCAL) Artan Guxho Projects Officer (ECSIE) Ibrahim Hackaj Sr. Operations Officer (ECSSD) Juela Haxhiymeri Economist, Country Office Rochelle Hilton Consultant (ECSPF) Monika Huppi Senior Human Development Economist (ECSHD) Frauke Jungbluth Senior Rural Development Economist (ECSSD) Toru Konishi Senior Economist (ECSSD) Lorena Kostallari Operations Officer ECSHD)

Annex B (continued) 58
Silvia Minotti Sr. Financial Sector Specialist(ECSPF) Greta Minxhozi Sr. Operations Officer, Private Financial Sector Development
(ECSPF) John Oliver Moss Manager, (EAPCO) Cesar Augusto Queiroz Lead Highway Engineer (ECSIE) Jolanda Trebicka Public Sector Management Specialist (ECSPE) Sanjay Vani Sr. Financial Management Specialist (ECSPS) Helena Tang Lead Economist (PRMTR)
f. IFC
Gjergj Konda Sr. Economist (CSEDR) Anila Bashllari Country Program Manager, Southeast Europe Enterprise
Development (SEED)
g. IMF
Julio Escolano Division Chief, European I Department Volker Treichel
h. MIGA
Henning Haugerudbraaten Risk Management Officer (MIGA, MIGFR) Beat Heggli Senior Investment Promotion Officer (MIGOP) Fabrice Michel Walter Morel Underwriter (MIGOP)

59 Annex C
Guide to OED’S Country Evaluation Rating Methodology
1. This methodological note describes the key elements of OED’s country assistance evaluation (CAE) methodology.44 CAEs rate the outcomes of Bank assistance programs, not the Clients’ overall development progress 2. A Bank assistance program needs to be assessed on how well it met its particular objectives, which are typically a sub-set of the Client’s development objectives. If a Bank assistance program is large in relation to the Client’s total development effort, the program outcome will be similar to the Client’s overall development progress. However, most Bank assistance programs provide only a fraction of the total resources devoted to a Client’s development by donors, stakeholders, and the government itself. In CAEs, OED rates only the outcome of the Bank’s program, not the Client’s overall development outcome, although the latter is clearly relevant for judging the program’s outcome. 3. The experience gained in CAEs confirms that Bank program outcomes sometimes diverge significantly from the Client’s overall development progress. CAEs have identified Bank assistance programs which had:
• satisfactory outcomes matched by good Client development; • unsatisfactory outcomes in Clients which achieved good overall development
results, notwithstanding the weak Bank program; and, • satisfactory outcomes in Clients which did not achieve satisfactory overall results
during the period of program implementation.
Assessments of assistance program outcome and Bank performance are not the same 4. By the same token, an unsatisfactory Bank assistance program outcome does not always mean that Bank performance was also unsatisfactory, and vice-versa. This becomes clearer once we consider that the Bank's contribution to the outcome of its assistance program is only part of the story. The assistance program’s outcome is determined by the joint impact of four agents: (a) the Client; (b) the Bank; (c) partners and other stakeholders; and (d) exogenous forces (e.g., events of nature, international economic shocks, etc.). Under the right circumstances, a negative contribution from any one agent might overwhelm the positive contributions from the other three, and lead to an unsatisfactory outcome.
44 In this note, assistance program refers to products and services generated in support of the economic development of a Client country over a specified period of time, and client refers to the country that receives the benefits of that program

Annex C (continued) 60
5. OED measures Bank performance primarily on the basis of contributory actions the Bank directly controlled. Judgments regarding Bank performance typically consider the relevance and implementation of the strategy, the design and supervision of the Bank’s lending interventions, the scope, quality and follow-up of diagnostic work and other AAA activities, the consistency of the Bank’s lending with its non-lending work and with its safeguard policies, and the Bank’s partnership activities.
Rating Assistance Program Outcome
6. In rating the outcome (expected development impact) of an assistance program, OED gauges the extent to which major strategic objectives were relevant and achieved, without any shortcomings. In other words, did the Bank do the right thing, and did it do it right. Programs typically express their goals in terms of higher-order objectives, such as poverty reduction. The country assistance strategy (CAS) may also establish intermediate goals, such as improved targeting of social services or promotion of integrated rural development, and specify how they are expected to contribute toward achieving the higher-order objective. OED’s task is then to validate whether the intermediate objectives were the right ones and whether they produced satisfactory net benefits, and whether the results chain specified in the CAS was valid. Where causal linkages were not fully specified in the CAS, it is the evaluator’s task to reconstruct this causal chain from the available evidence, and assess relevance, efficacy, and outcome with reference to the intermediate and higher-order objectives. 7. For each of the main objectives, the CAE evaluates the relevance of the objective, the relevance of the Bank’s strategy towards meeting the objective, including the balance between lending and non-lending instruments, the efficacy with which the strategy was implemented and the results achieved. This is done in two steps. The first is a top-down review of whether the Bank’s program achieved a particular Bank objective or planned outcome and had a substantive impact on the country’s development. The second step is a bottom-up review of the Bank’s products and services (lending, analytical and advisory services, and aid coordination) used to achieve the objective. Together these two steps test the consistency of findings from the products and services and the development impact dimensions. Subsequently, an assessment is made of the relative contribution to the results achieved by the Bank, other donors, the Government and exogenous factors. 8. Evaluators also assess the degree of Client ownership of international development priorities, such as the Millennium Development Goals, and Bank corporate advocacy priorities, such as safeguards. Ideally, any differences on dealing with these issues would be identified and resolved by the CAS, enabling the evaluator to focus on whether the trade-offs adopted were appropriate. However, in other instances, the strategy may be found to have glossed over certain conflicts, or avoided addressing key Client development constraints. In either case, the consequences could include a diminution of program relevance, a loss of Client ownership, and/or unwelcome side-effects, such as safeguard violations, all of which must be taken into account in judging program outcome.

61 Annex C (continued)
Ratings Scale 9. OED utilizes six rating categories for outcome, ranging from highly satisfactory to highly unsatisfactory: Highly Satisfactory: The assistance program achieved at least acceptable
progress toward all major relevant objectives, and had best practice development impact on one or more of them. No major shortcomings were identified.
Satisfactory: The assistance program achieved acceptable progress toward all major relevant objectives. No best practice achievements or major shortcomings were identified.
Moderately Satisfactory: The assistance program achieved acceptable progress toward most of its major relevant objectives. No major shortcomings were identified.
Moderately Unsatisfactory: The assistance program did not make acceptable progress toward most of its major relevant objectives, or made acceptable progress on all of them, but either (a) did not take into adequate account a key development constraint or (b) produced a major shortcoming, such as a safeguard violation.
Unsatisfactory: The assistance program did not make acceptable progress toward most of its major relevant objectives, and either (a) did not take into adequate account a key development constraint or (b) produced a major shortcoming, such as a safeguard violation.
Highly Unsatisfactory: The assistance program did not make acceptable progress toward any of its major relevant objectives and did not take into adequate account a key development constraint, while also producing at least one major shortcoming, such as a safeguard violation.
10. The institutional development impact (IDI) can be rated as: high, substantial, modest, or negligible. IDI measures the extent to which the program bolstered the Client’s ability to make more efficient, equitable and sustainable use of its human, financial, and natural resources. Examples of areas included in judging the institutional development impact of the program are:
• the soundness of economic management; • the structure of the public sector, and, in particular, the civil service; • the institutional soundness of the financial sector; • the soundness of legal, regulatory, and judicial systems; • the extent of monitoring and evaluation systems; • the effectiveness of aid coordination; • the degree of financial accountability; • the extent of building NGO capacity; and, • the level of social and environmental capital.

Annex C (continued) 62
11. Sustainability can be rated as highly likely, likely, unlikely, highly unlikely, or, if available information is insufficient, non-evaluable. Sustainability measures the resilience to risk of the development benefits of the country assistance program over time, taking into account eight factors:
• technical resilience; • financial resilience (including policies on cost recovery); • economic resilience; • social support (including conditions subject to safeguard policies); • environmental resilience; • ownership by governments and other key stakeholders; • institutional support (including a supportive legal/regulatory framework, and
organizational and management effectiveness); and, • resilience to exogenous effects, such as international economic shocks or
changes in the political and security environments.

63 Annex D
ALBANIA COUNTRY ASSISTANCE EVALUATION MANAGEMENT ACTION RECORD
OED Recommendations Requiring a Response
Management Response
1. Country strategies and project design need to move to an outcome-oriented approach. To accomplish this, IDA should establish monitorable and realistic targets for outcomes and design interventions to meet these targets. Where possible interventions should focus on the quality of service delivery and cost recovery, like in electricity and water.
The new CAS under preparation will be results-based as suggested by OED and the Board. While quality of service delivery, and in particular the governance of service delivery, will be a focus of new CAS operations, a narrow focus on cost recovery may not be warranted across the board given the high poverty levels and poor human development indicators in Albania.
2. Bank assistance should increase selectivity, with priority in infrastructure —including urban—health and education. Important issues such as governance and business climate will need to be undertaken in conjunction with and, for areas specifically covered by agreements (the acquis), perhaps under the leadership of the EU.
We agree on the need for greater selectivity, especially in the context of the maturing institutional and donor environment. The importance of the EU SAP for Albania is already well accepted by the Bank. The Government has also taken initial steps to ensure integration of the NSSED, SAP and MDGs under an Integrated Planning System (IPS). Increased collaboration with the EU is planned in the new CAS, however the need to mitigate risks of other donor support not eventuating as planned is a lesson learned from past engagement in Albania.
3. Management should review the justification for continued IDA eligibility, explore Albania’s potential creditworthiness for IBRD lending, and ensure that the results of this analysis form the basis for proposals on lending levels and lending terms in the next country assistance strategy.
Agreed: this need was outlined in the 2002 CAS. Debt Sustainability Analysis has been completed, and discussions regarding future access to IBRD/IDA resources are ongoing in the context of preparing the new CAS.


65 Attachment 1
Comments from the Government of Albania
REPUBLIC OF ALBANIA MINISTRY OF FINANCE
TO: Mr. Kyle PETERS Senior Manager Country Evaluation and Regional Relations Operations Evaluations Department World Bank, Washington D.C, USA Re: Albania-Country Assistance Evaluation (FY 1998-2004) Dear Sir, I take this opportunity to reiterate my personal and Albanian Government’s appreciation for the support that World Bank continues to provide to my country. Such support has been essential to reforms and investments in the financial, governance, education, health and infrastructure sectors. The progress done in these sectors has been remarkable over the last seven years. The support of the Bank has been consistent with the priorities expressed by the Government in the National Strategy for Socio-Economic Development. Please find enclosed the comments received from the Line Ministries on the Country Assistance Evaluation. After having consulted the various Ministries on the content of the report, I must say that we share with you, the way this report looks to the future of our cooperation and I would like to assure you that the Government of Albania remains committed to continue implementing reforms that will improve the life of Albanian citizens, will ensure a function market economy and institutions thus accelerating the process of EU integration. Sincerely, Arben MALAJ __________ MINISTER

Attachment 1 (continued) 66
Besides the satisfactory performance of specific projects in selected sectors, the PRSC and FSAC have been important vehicles to speed up structural and cross-sector reforms. Privatization of the last state-owned bank (the Savings Bank- now Raiffeisen); the reforming of the insurance sector; the decentralization reforms in education, health and labour and social protection sectors are some outstanding achievements for which both the Government of Albania and the World Bank have to be proud. We are pleased to see that the report denotes Albania as one of the best performing countries of the ECA region. However, we recognize our challenges in fighting corruption and improving governance45. The Government has been the first ever to address the corruption phenomenon (in 199846) building a widely participatory strategy and institutions to fight it over the last 7 years, as against an Albania crowded with pyramidal schemes, breach of UN embargo to former Yugoslavia, imprisonment of journalists, firing of civil servants under a famous article 24/1, a situation which mainly of poor governance and implication of Government officials in these activities led to the collapse of the Albanian state in 1997. These facts have to come out clearly, since there cannot be a comparison of Albania in 1996 with the Albania of today. We would also like to point out the remarkable progress made in the energy sector, which we believe has set a good example (SWAP) of how to address other sectors in the future. Albania has also done verifiable progress in tackling with issues of improving business practices pursuing the action plan of FIAS. Since the enactment of Civil Service law we have made good progress by extending it to Customs and Tax department and to the Public Procurement Agency47. The implementation of the Law of the Declaration of Assets has made Government officials even more accountable and the entire system more transparent. The approval of the Law on Property Restitution and Compensation in June 2004, provides a sound basis to tackle with the issue of property rights and titles. All these actions we have undertaken together over the last period are a clear sign of progress that you may consider to incorporate in the report.
45 Page 9 para. 3.1 of CAE; page 11, para. 3.7. 46 Corruption index started to be measured only by that time. 47 Para 3.6 “Judiciary and Anti-Corruption“ -It is necessary to clarify the dependence status of the Public Procurement Agency, which is not under the Ministry of Finance as it is specified in the report, but under the Council of Ministers. -The Public Procurement Agency since year 2003, it is protected by the civil service regulations according to the amendments made to the law on “Public Procurement”.

67 Attachment 1 (continued)
cc: Mr. Biagio BOSSONE, Executive Director, World Bank, Washington Mr. Kristaq LUNIKU, Advisor to the Executive Director, World Bank, Washington Mr. Nadir MOHAMMED, Country Manager, World Bank, Tirane

Attachment 1 (continued) 68

69 Attachment 1 (continued)

Attachment 1 (continued) 70

71 Attachment 1 (continued)

Attachment 1 (continued) 72

73 Attachment 1 (continued)


75 Attachment 2
Chairman’s Summary
Committee on Development Effectives (Meeting of May 11, 2005)
1. The Informal Subcommittee (SC) of the Committee on Development Effectiveness (CODE) met on May 11, 2005 to discuss the Albania Country Assistance Evaluation (CAE) prepared by the Operations Evaluation Department (OED). A written statement was issued by Mr. Hermann.
2. Background. The CAE reviews the Bank’s assistance strategy for Albania from FY98 to FY04 and follows on OED’s previous evaluation for 1992-1997. It looks at whether the assistance dealt with the major issues affecting the economy and how it contributed to the accomplishments of the country. The report also assesses the relevance, efficacy and efficiency of that assistance and recommends actions for the future. The overall development impact of IDA’s assistance is rated as moderately satisfactory. While Albania made gains in the areas of economic growth and price stabilization, alleviation of poverty, fiscal sustainability of the pension system, the electricity and roads sectors and civil service reform, a lot remains to be done in health and education, as well as in governance and the investment climate. The main lessons emerging from the evaluation are: (i) Bank assistance was effective when sector strategies laid out a reform agenda with clear and monitorable performance indicators; (ii) developing the analytic underpinning and strategy was also important (electricity sector) but not so productive in areas which lacked a clear strategic framework (governance); (iii) a series of projects that build around pilot phases are more likely to have an impact at a country level than a number of small projects spread over many sub-sectors which fail to have synergies on a larger scale; (iv) Bank assistance that sought solutions to institutional and management problems with Project Implementation Units (PIUs) was unable to create lasting, effective institutions; (v) donor coordination was good following crises, when the government focused on specific problems (energy and finance), but needed improvement in other areas, particularly where there was no crisis (health). Based on the lessons, the OED report makes the following recommendations: (a) country strategies and project design need to move to an outcome-oriented approach through establishing monitorable and realistic targets for outcomes and design interventions to meet these targets; (b) Bank assistance should be more selective, with priority in infrastructure, as well as urban, health and education sectors; (c) the Bank should fill existing gaps in ESW on health, infrastructure, and urban development; (d) IDA should start working with the present administrative structures of government and its organizations and gradually phase out the PIUs.
3. Management thanked the OED for candid and comprehensive review and agreed with most of the assessments, lessons and recommendations, which will be incorporated into the design of the new country assistance strategy. At the same time, management noted that the report could have been more balanced in describing the Bank’s contribution to the positive outcomes of growth and poverty reduction, and taken into account the fluid environment the Bank has been facing in the country since 1998. OED agreed that, overall, higher level outcomes, growth and poverty reduction, had been achieved, but stressed that its rating was based on the objectives of the Bank’s assistance program through the last eight years, in which improving governance and institution building was a key objective and this was an area where progress was not fully satisfactory, as compared to others (e.g. infrastructure, macroeconomic stability). OED also added that other factors, such as high level of remittances, made attribution of growth in certain sectors to the Bank assistance somewhat difficult.

Attachment 2 (continued) 76
4. The Chair representing Albania thanked the OED for preparing an excellent report and noted that the Government of Albania generally concurred with the CAE findings and recommendations. He added that the authorities are planning to use them in the process of developing the new country assistance strategy and refining and improving the implementation of the National Poverty Reduction Strategy. In particular, the authorities supported CAE recommendations on employing outcome-oriented approach, the need to increase selectivity with emphasis on infrastructure and the design of the blend IDA/IBRD lending and non-lending products in the next country assistance strategy.
5. Main Conclusions and Next Steps. The Subcommittee welcomed the CAE and commended OED for preparing a solid and credible evaluation. Members agreed with the OED ratings of outcomes of the Bank’s assistance to Albania as moderately satisfactory. They concurred with the main recommendations of the report, although some members felt that the analytic conclusions could have been more specific in terms of recommendations for the upcoming country assistance strategy and lessons for other “blend” countries in transition from IDA to IBRD.
The following points were raised.
6. Bank involvement and results. Members commended the authorities for achieving impressive development outcomes throughout the review period under difficult circumstances. While many members praised positive outcomes in the infrastructure sector, they also expressed concerns about achievements in human development areas, namely education, where little improvement was recorded on budget spending and enrollment as compared to a 1998 country assistance evaluation. In this context, they stressed the need for a more outcome-based approach with clear defined targets, as suggested by OED. A member argued that while the Bank assistance to some sectors (electricity, water, health) was rated successful, a number of indicators still show significant issues that need to be addressed, and asked for further clarification in this regard. OED agreed that results were uneven across all indicators, but noted that the aggregate performance was quite positive.
7. Governance. Several members noted that the issues of governance and corruption are of overarching importance for the country and urged more work in that direction. Several members expressed concerns about deterioration of governance indicators (as per 2002 Bank survey), and recommended continuous application of CPIA for making lending decisions. Management noted that while the CPIA for Albania was indeed downgraded, certain methodological issues did not allow producing a complete picture in this regard. A speaker concurred that the notion that the pre-crisis (1995-1996) Albania was doing better in terms of control of corruption compared to 2002 did not seem to be very credible. Several members stressed that the Bank could have direct impact on the culture of governance and the mindset of decision-makers through successful project design and implementation, and underlined the importance of country ownership in this regard. Members welcomed the additional steps undertaken by the government to curb corruption, as described in the addendum to the CAE, but were not clear whether certain performance indicators (e.g. prosecution rate vs. conviction rate) attest to increase or decline in the levels of corruption. Management concurred with the members’ view on the importance of country ownership of governance reforms, and noted that governance remains an important pillar of the Bank’s strategy in Albania. Management also stressed that good governance depends on strengthening institutions, and results often require behavioral changes that take considerable time to materialize, taking into account the specific country circumstances.

77 Attachment 2 (continued)
8. Private sector development. Several members stressed that the Bank should intensify its efforts on private sector development, including improvement of overall business environment and related legal framework. Some members noted that considerable success in development of the financial sector had not yet had a significant impact on private sector development in general. OED replied that the Albanian experience is in line with the general trend in other IDA countries in ECA region, and is closely related to the issues of imperfect investment and business climate, judiciary and legal framework. Management concurred with the importance of institutional and legal frameworks for private sector development, but noted that those are areas where others donors, notably the EU, are heavily involved.
9. Lessons learned. A member noted that the report could have offered more concrete lessons from the Albanian experience, and specifically from the perspective of: (a) possible EU candidacy, and (b) transition from IDA to IBRD. OED noted that in CAEs, it concentrates on findings relevant to specific countries and tries to reflect general lessons in other cross-country products, such as the recently discussed CAE Retrospective. Several members stressed that another important lesson from Albania is the use of Project Implementation Units in Bank projects, which has the potential of creating tensions with the governmental structures and does not contribute to the long-term sustainability of Bank projects’ results and strengthening institutional capacity. OED noted that it has been advocating gradual integration of PIUs into government structures in a number of its recent studies, and added that there definitely is a tension between the Bank’s fiduciary requirements, weak in-country capacity and the need for developing local institutions. Members were interested in the prospects of Albania’s graduation from IDA and noted that it might be a good case for applying blending mechanism, assuring its access to IBRD funds, while preserving the level of concessionality given its still fragile borrowing capacity. OED replied that it had made the observation that Albania’s per capita income significantly exceeds the operational cut-off for IDA, and pointed to the need to follow up with a creditworthiness review, as promised during the preparation of the previous country strategy. Management clarified that it has completed the debt sustainability analysis and is currently working with the Fund on the creditworthiness study, which will help to determine the type of financing in the next country assistance strategy. Among other important lessons, members noted the importance of strong government institutions, ensuring that privatization does not result in creating new monopolies in the private sector and the role of the Bank in the aftermath of crises.
10. Cooperation. Speakers stressed the importance of close cooperation with other donors, including the EU structures and bilateral partners. A member emphasized the role of the EU as a source of important transfers and EU accession as a magnet for performance improvement, and urged acknowledgement of the central role of Stabilization and Association Process (SAP) framework as the national development strategy, in order to avoid overlaps.
Chander Mohan Vasudev Chairman


79
Bibliography
Beka, Ismail. 2001. “Albania-WTO Membership and Impacts on Agricultural and Trade Policies.” FAO Workshop, ‘Re-engineering of Agricultural Polices in the Selected CIS and South-Eastern Countries in the Context of the Accession to the WTO’.
Beka, Ismail and Martin Wille. 2004. “The Role of Agriculture and Rural Development in Albania.” Paper presented at the IAMO Forum 2004, ‘The Role of Agriculture in Central and Eastern European Rural Development: Engine of Change or Social Buffer?’, 4-6 November, 2004, Halle (Salle), Germany.
Blejer, Mario I., M. Mecagni, R. Sahay, R. Hides, B.Johnston, P. Nagy, and R. Pepper 1992. “Albania: From Isolation Towards Reform.” Occasional Paper No. 98. Washington, D.C.: IMF.
Economist Intelligence Unit, Albania Reports (several years).
Commission of the European Communities. 2004. “Albania-Stabilisation and Association Report 2004.” Commission Staff Working Paper. COM (2004) 203 final.
_____. 2004. “Proposal for a Council Decision on the Principles, Priorities and Condition Contained in the European Partnership with Albania.” COM (2004) final.
_____. 2003. “The Stabilisation and Association Process for South East Europe.” Second Annual Report. COM (2003) 139 final.
_____. 2002. “The Stabilisation and Association Process (SAP): First Annual Report. COM (2002) 163 final.
_____. 2001. “Albania-Country Strategy Paper, 2002-2006.” European Community CARDS Program.
Gupta, P., R. Kleinfeld and G. Salinas. 2002. “Legal and Judicial Reform in Europe and Central Asia.” OED Working Paper. OED. Washington, D.C.: World Bank.
Heath, John. 2003. Agriculture Policy Reform in the ECA Transition Economies, 1991-2002, OED Working Paper. OED. Washington, D.C.: World Bank.
Hellman, J. S., G. Jones, D. Kaufmann, and M. Schankerman. 2000. “Measuring Governance, Corruption, and State Capture-How Firms and Bureaucrats Shape the Business Environment in Transition Economies.” Policy Research Working Paper No. WPS 2312. Washington, D.C.: World Bank.
International Monetary Fund. 2004. Albania-Joint Staff Assessment of the Poverty Reduction Strategy Paper Annual Progress Report. IMF Country Report No. 04/205. Washington, D.C.: IMF.

80
_____. 2004. Albania- Poverty Reduction Strategy Paper Annual Progress Report. IMF Country Report No. 04/204. Washington, D.C.: IMF.
_____. 2003. Albania: Selected Issues and Statistical Appendix. IMF Staff Country Report No. 03/64. Washington, D.C.: IMF.
_____. 1999. Albania: Recent Economic Developments and Statistical Appendix. IMF Staff Country Report No. 99/69. Washington, D.C.: IMF.
_____. 1998. Albania: Statistical Appendix. IMF Staff Country Report No. 98/62. Washington, D.C.: IMF.
_____. 1997. Albania: Recent Economic Developments. IMF Staff Country Report No. 97/21. Washington, D.C.: IMF.
_____. 1994. IMF Economic Reviews-Albania. Washington, D.C.: IMF.
Isham, J., D. Kaufmann, and L. Pritchett. 1995. “Governance and Returns on Investment-An Empirical Investigation.” Policy Research Working Paper No. 1550. Washington, D.C.: World Bank.
Jarvis, Chris. 1999. “The Rise and Fall of the Pyramid Schemes in Albania.” Working Paper No. WP/99/98. Washington, D.C.: IMF.
Koliadina, Natasha. 1996. “The Social Safety Net in Albania.”. Working Paper No. WP/96/96. Washington, D.C.: IMF.
Korovilas, James P. 1999. “The Albania Economy in Transition: the Role of Remittances and Pyramid Investment Schemes.” Post-Communist Economies, Vol. 11, No. 3, 1999. Centre for Research into Post-Communist Economies.
Lambsdorff, Prof. Dr. Johann Graf. “Framework Document 2004.” Background Paper to the 2004 Corruption Perception Index. Transparency International (TI) and University of Passau. September 2004.
Lambsdorff, Prof. Dr. Johann Graf. 2000. “Framework Document.” Background Paper to the 2000 Corruption Perception Index. Transparency International (TI) and Göttingen University. September 2000.
Ministry of Foreign Affairs and Ministry of Finance, Republic of Albania with the assistance of UNDP and the UN Country Team in Albania. 2004. “Albania National Report on Progress towards Achieving the Millennium Development Goals.”
Ministry of Finance, Republic of Albania, 2001. Medium-Term Expenditure Framework, 2002-2004.

81
Ministry of Finance, Republic of Albania, 2004. Medium-Term Budget Program, 2005-2004.
Muço, M., P. Sanfey and A. Taci. 2004. “Inflation, Exchange Rates and the Role of Monetary Policy in Albania.” Working Paper No. 88. European Bank for Reconstruction and Development.
Muço, Marta. 1996. “Economic Transformation in Albania.” The International Spectator. Vol. XXXI, No. 1, January-March 1996. Quarterly Journal of the Instituto Affari Internazionali. Rome.
Nielson, Daniel L. and Michael J. Tierney. 1998. “The Albanian Economy After the Storm: Prospects for Rehabilitation and Recovery.” The International Spectator. Vol. XXXIII, No.2, April-June 1998.
McNeilly, Caryl J. and Doris Schiesser-Gachnang. 1998. “Reducing Inflation: Lessons from Albania’s Early Success.” Working Paper No. WP/98/78. Washington, D.C.: IMF.
OED, Albania, Country Assistance Evaluation, Report No. 21390, November 16, 2000
OED, Mainstreaming Anti-Corruption Activities in World Bank Assistance: A Review of Progress Since 1997, OED Review, Report No. 29620. Washington, D.C.: The World Bank, July 14, 2004
Papapanagos, Harry and Peter Sanfey. 1998. “Intention to Emigrate in Transition Countries: the Case of Albania.” Series: Studies in Economics, No. 9818. Department of Economic, University of Kent.
Petiffer, James. 2001. Albania and Kosovo. New York. NY: W.W. Norton and Company, 2001. Third Edition.
Pleskovic, B., A. Aslund, W. Bader, R. Campbell. 2002. “Capacity Building in Economics-Education and Research in Transition Economies.” Policy Research Working Paper No. WPS 2763. Washington, D.C.: World Bank.
Transparency International. Press Release-Transparency International Global Corruption Barometer. July 2003.
_____. 1999. Transparency International’s Bribe Payers Survey 1999. [On line available at http://www.transparency.org/cpi/1999/bps.html].
Treichel, Volker. 2002. “Stabilization Policies and Structural Reforms in Albania Since 1997-Achievements and Remaining Challenges.” PDF/02/2. IMF Policy Discussion Paper, 2002. IMF.
_____. 2001. “Financial Sustainability and Reform Options for the Albanian Pension Fund.” Working Paper No. WP/01/47. Washington, D.C.: IMF.

82
United Nation System. 2002. Dr. Cabiri, Ylli and Dr. Xhillari, Lindita. The Albanian Response to the Millennium Development Goals. Prepared for the United Nations System in Albania by the Human Development Promotion Center (HDPC). Tirana.
Vickers, Miranda and James Pettifer. 1997. “Albania From Anarchy to a Balkan Identity.” Washington Square, New York. New York University Press, 1997.
World Bank. 1999. The World Bank and Microenterprise Finance-From Concept to Practice, Report No. 19895, November 15, 1999. Washington D.C.: World Bank.
_____. 2004. Anticorruption in Transition 2, Corruption in Enterprise-State Interactions in Europe and Central Asia 1999-2002, report prepared by Cheryl Gray, Joel Hellman, and Randy Ryterman Washington, D.C.
_____. 2005. Albania-Durres Water and Sanitation Rehabilitation Project and Water Supply Urgent Rehabilitation Project. OED Project Performance Assessment Report. Washington, D.C.: World Bank.