Albani V, Celis-Morales C, Marsaux CFM, Forster H, O...
26
Newcastle University ePrints - eprint.ncl.ac.uk Albani V, Celis-Morales C, Marsaux CFM, Forster H, O'Donovan CB, Woolhead C, Macready AL, Fallaize R, Navas-Carretero S, San-Cristobal R, Kolossa S, Mavrogianni C, Lambrinou CP, Moschonis G, Godlewska M, Surwillo A, Gundersen TE, Kaland SE, Manios Y, Traczyk I, Drevon CA, Gibney ER, Walsh MC, Martinez JA, Saris WHM, Daniel H, Lovegrove JA, Gibney MJ, Adamson AJ, Mathers JC, Brennan L. Exploring the association of dairy product intake with the fatty acids C15:0 and C17:0 measured from dried blood spots in a multipopulation cohort: Findings from the Food4Me study. Molecular Nutrition & Food Research 2016, 60(4), 834-845. Copyright: This is the peer reviewed version of the following article: Albani et al. Exploring the association of dairy product intake with the fatty acids C15:0 and C17:0 measured from dried blood spots in a multipopulation cohort: Findings from the Food4Me study. Molecular Nutrition & Food Research 2016, 60(4), 834-845, which has been published in final form at http://dx.doi.org/10.1002/mnfr.201500483 . This article may be used for non-commercial purposes in accordance with Wiley Terms and Conditions for Self-Archiving. DOI link to article: http://dx.doi.org/10.1002/mnfr.201500483 Date deposited: 27/07/2016 Embargo release date: 17 December 2016
Transcript of Albani V, Celis-Morales C, Marsaux CFM, Forster H, O...
Newcastle University ePrints - eprint.ncl.ac.uk
Albani V, Celis-Morales C, Marsaux CFM, Forster H, O'Donovan CB, Woolhead C,
Macready AL, Fallaize R, Navas-Carretero S, San-Cristobal R, Kolossa S,
Mavrogianni C, Lambrinou CP, Moschonis G, Godlewska M, Surwillo A,
Gundersen TE, Kaland SE, Manios Y, Traczyk I, Drevon CA, Gibney ER, Walsh MC,
Martinez JA, Saris WHM, Daniel H, Lovegrove JA, Gibney MJ, Adamson AJ,
Mathers JC, Brennan L.
Exploring the association of dairy product intake with the fatty acids C15:0 and
C17:0 measured from dried blood spots in a multipopulation cohort: Findings
from the Food4Me study.
Molecular Nutrition & Food Research 2016, 60(4), 834-845.
Copyright:
This is the peer reviewed version of the following article: Albani et al. Exploring the association of dairy
product intake with the fatty acids C15:0 and C17:0 measured from dried blood spots in a
multipopulation cohort: Findings from the Food4Me study. Molecular Nutrition & Food Research 2016,
60(4), 834-845, which has been published in final form at http://dx.doi.org/10.1002/mnfr.201500483 .
This article may be used for non-commercial purposes in accordance with Wiley Terms and Conditions for
Self-Archiving.
DOI link to article:
http://dx.doi.org/10.1002/mnfr.201500483
Date deposited:
27/07/2016
Embargo release date:
17 December 2016

www.mnf-journal.com Page 1 Molecular Nutrition & Food Research
Received: 22/06/2015; Revised: 18/11/2015; Accepted: 22/11/2015
This article has been accepted for publication and undergone full peer review but has not been
through the copyediting, typesetting, pagination and proofreading process, which may lead to
differences between this version and the Version of Record. Please cite this article as doi:
10.1002/mnfr.201500483.
This article is protected by copyright. All rights reserved.
Title Exploring the association of diary product intake with the fatty acids C15:0 and C17:0 measured
from dried blood spots in a multi-population cohort: findings from the Food4Me study
Author Names
Viviana Albani1, Carlos Celis-Morales1, Cyril F M Marsaux2, Hannah Forster3, Clare B O’Donovan3,
Clara Woolhead3, Anna L Macready4, Rosalind Fallaize4, Santiago Navas-Carretero5, Rodrigo San-
Cristobal5, Silvia Kolossa6, Christina Mavrogianni7, Christina P Lambrinou7, George Moschonis7,
Magdalena Godlewska8, Agnieszka Surwiłło8, Thomas E. Gundersen9, Siv E Kaland9, Yannis Manios7,
Iwona Traczyk8, Christian A Drevon10, Eileen R Gibney3, Marianne C Walsh3, J Alfredo Martinez5, Wim
H M Saris3, Hannelore Daniel6, Julie A Lovegrove4, Michael J Gibney3, Ashley J. Adamson1, John C
Mathers1 , Lorraine Brennan1,3 on behalf of the Food4Me Study.
Author Affiliation 1Human Nutrition Research Centre and Institute for Health and Society, Newcastle University,
Newcastle upon Tyne, UK 2Department of Human Biology, NUTRIM School of Nutrition and Translational Research in
Metabolism, Maastricht University Medical Centre + (MUMC+), Maastricht, The Netherlands 3Institute of Food & Health, University College Dublin (UCD), Belfield, Dublin, Ireland 4Hugh Sinclair Unit of Human Nutrition and Institute for Cardiovascular and Metabolic Research,
University of Reading, Reading, UK. 5Department of Nutrition, Food Science and Physiology, University of Navarra; CIBER Fisiopatología
Obesidad y Nutrición (CIBERobn), Instituto de Salud Carlos III, Spain (SN-C & JAM) 6ZIEL Research Center of Nutrition and Food Sciences, Biochemistry Unit, Technische Universität
München, Germany. 7Department of Nutrition and Dietetics, Harokopio University, Athens, Greece. 8National Food & Nutrition Institute (IZZ), Poland. 9Vitas AS, Olso Innovation Park, Gaustadalleen 21, N-0349, Oslo, Norway. 10Department of Nutrition, Institute of Basic Medical Sciences, Faculty of Medicine, University of
Oslo, Oslo, Norway.
Corresponding Author
Prof. Lorraine Brennan
Human Nutrition Research Centre and Institute for Health and Society, Newcastle University,
Newcastle upon Tyne, UK and School of Agriculture & Food Science, University College Dublin,
Belfield, Dublin 4
Telephone: 00 353 1 7162811

www.mnf-journal.com Page 2 Molecular Nutrition & Food Research
This article is protected by copyright. All rights reserved.
2
Email: [email protected]
Abbreviations List DBS dried blood spots
FFQ Food Frequency Questionnaire
OLS ordinary least squares
ROC receiver operating characteristic
AUC area under the curve
iqr interquartile range
g/day grams per day
Keywords
Dairy intake, biomarkers, pentadecanoic acid, heptadecanoic acid, dried blood spots
Abstract
Scope
The use of biomarkers in the objective assessment of dietary intake is a high priority in nutrition
research. The aim of this study was to examine pentadecanoic acid (C15:0) and heptadecanoic acid
(C17:0) as biomarkers of dairy foods intake.
Methods and results
The data used in the present study were obtained as part of the Food4me Study. Estimates of C15:0
and C17:0 from dried blood spots and intakes of dairy from an FFQ were obtained from participants
(n=1,180) across 7 countries. Regression analyses were used to explore associations of biomarkers
with dairy intake levels and receiver operating characteristic (ROC) analyses were used to evaluate
the fatty acids. Significant positive associations were found between C15:0 and total intakes of high-
fat dairy products. C15:0 showed good ability to distinguish between low and high consumers of
high-fat dairy products.
Conclusion
C15:0 can be used as a biomarker of high-fat dairy intake and of specific high-fat dairy products.
Both C15:0 and C17:0 performed poorly for total dairy intake highlighting the need for caution when
using these in epidemiological studies.
Graphical abstract:

www.mnf-journal.com Page 3 Molecular Nutrition & Food Research
This article is protected by copyright. All rights reserved.
3
The study explored the association between C15:0 and C17:0 levels in dried-blood spots and intake
of dairy, including high-fat and low-fat dairy products.
Introduction
Adequate measurement of dietary intake is crucial to health-related research as much of the public
health burden in both industrialised and developing societies is due to chronic diseases associated
with lifestyle factors, notably poor diet quality and excess energy intake [1, 2]. However, research on
dietary exposures relies on self-reported methods, such as food frequency questionnaires, food
diaries and 24-hour recalls, that are susceptible to random and systematic measurement errors,
including recall bias and energy under-reporting [3]. Mis-classification of individuals’ dietary intakes
resulting from these errors may contribute to inconsistencies in diet-disease outcomes in published
nutritional epidemiological studies [4]. Given these limitations, interest has grown in the
identification and use of biomarkers as more objective assessment methods of food intake [2]. The
development, validation and application of novel biomarkers of food intake are particularly
pertinent for those foods where associations with important health outcomes are poorly understood
or subject to controversy. One such example is dairy products for which improved measurement of

www.mnf-journal.com Page 4 Molecular Nutrition & Food Research
This article is protected by copyright. All rights reserved.
4
intake would help to clarify inconsistent findings about the relationships between intake of dairy
foods and cardiovascular health [5] and to strengthen the evidence for links between dairy products
and the risk of metabolic syndrome and type 2 diabetes [6, 7].
The odd-chain length saturated fatty acids pentadecanoic acid (C15:0) and heptadecanoic acid
(C17:0) have been proposed as potential biomarkers of dairy intake. The available evidence from
observational studies suggests that C15:0 may be a good biomarker of long-term dairy fat intake [8,
10-12]. Relationships between dairy fat intake and C15:0 levels in adipose tissue and blood lipid
fractions have been similar with correlations ranging from 0.74 to 0.45 for adipose tissue samples
and from 0.50 to 0.45 in serum or plasma lipid fractions [12, 13]. Levels of C15:0 in plasma and
adipose tissue are also significantly associated with reported consumption of dairy and dairy
products, such as whole milk, butter and ice cream; with correlations ranging from 0.28 to 0.22 for
total dairy products between 0.21 and 0.13 for butter, and between 0.27 and 0.17 for cheese [6, 11,
13-15]. Levels of C17:0 in adipose tissue, serum cholesterol esters and phospholipids have also been
reported to be associated with dairy fat intake, but less so with dairy product intake. Reported
correlations between dairy fat intake and C17:0 in adipose tissue, serum cholesterol esters and
phospholipids are in the range of 0.30 to 0.16 [12]; between 0.13 and 0.11 for dairy fat and plasma
lipid fractions [15]; and between 0.24 and 0.16 for dairy product intake and adipose tissue samples
[10, 16]. More recently, a randomized controlled trial conducted with a free-living Canadian
population found a significant increase in plasma levels of C15:0 and of C17:0 following a 4-week
intervention with 3 servings of dairy products daily (low fat milk -1% fat, low fat yoghurt -1.5% fat,
and cheese - 34% fat) [17].
Levels of C15:0 and C17:0 in plasma phospholipids, cholesteryl esters, total plasma lipids,
erythrocytes, triacylglycerol, and subcutaneous adipose tissue from the buttock or abdomen have
been explored as biomarkers of dairy foods intake [11-13, 15, 19]. In addition, Baylin et al. [20] found
that whole blood levels of C15:0 and C17:0 reflected dietary intake of these fatty acids. Given that

www.mnf-journal.com Page 5 Molecular Nutrition & Food Research
This article is protected by copyright. All rights reserved.
5
the collection of whole blood samples as dried blood spots (DBS) is a technically relatively easy and
cost efficient method, there is interest in assessing their use for the measurement of dietary intake
biomarkers, including biomarkers of dairy products intake.
The objective of this study is to examine blood levels of C15:0 and C17:0 measured in DBS as
potential biomarkers of dairy product intake in a large multicultural cohort of European adults.
Materials and methods
Study sample Data for the study were sourced from the Food4Me Proof of Principle study, a randomized
controlled trial of personalised nutrition among European adults. The study ran from August 2012 to
February 2014 and included participants from Germany, Greece, Ireland, the Netherlands, Poland,
Spain and the UK. Participants were recruited through local advertising directing them to the project
website (http://www.food4me.org/). Local recruitment sites were University College Dublin
(Ireland); Maastricht University (the Netherlands); University of Navarra (Spain); Harokopio
University (Greece); University of Reading (United Kingdom; UK); National Food and Nutrition
Institute (Poland); Technische Universität München (Germany). A screening questionnaire excluded
interested individuals who reported being pregnant, having food intolerances or allergies, having
chronic disease (e.g. diabetes), or being on a therapeutic diet. A full description of the study protocol
and screened participants has been previously published [21, 22]. The Research Ethics Committees
at each University or Research Centre delivering the intervention granted ethical approval for the
study. The Food4Me trial was additionally registered as a Randomized Clinical Trial (NCT01530139)
at Clinicaltrials.gov. All participants provided informed consent.

www.mnf-journal.com Page 6 Molecular Nutrition & Food Research
This article is protected by copyright. All rights reserved.
6
Of 1607 individuals randomised to the intervention, 1,471 observations on blood fatty acid levels
and dairy foods intake at baseline (“Month 0”) were initially included in this study. After exclusion of
participants (n=262) with under- or over-reporting of energy intake (see below), and accounting for
missing values for C15:0 and C17:0 levels (n=29), the final sample consisted of 1,180 observations.
Measurements Participants provided finger-prick blood samples through two DBS cards (Vitas Ltd, Oslo, Norway;
DSM N.V., Heerlen, Netherlands) providing approximately 5 drops of blood (150µl) per card [21].
Participants were instructed to let the blood spots dry at room temperature for at least 2 hours but
for no more than 4 hours. One of the DBS samples was sent by post using the collection pack
provided to the corresponding recruitment centre, and from there to Vitas (Vitas Ltd, Norway) for
measurement of whole blood fatty acids. Very briefly, punches of dried human whole blood were
removed from the DBS sample and directly methylated with 0.5 M sodium methoxide. After
incubation at 50 ⁰C for 20 minutes, the formed fatty acid methyl esters (FAMES) were extracted into
hexane and analysed on a Agilent Technologies GC-FID. The fatty acid methyl esters were separated
on a Supelco SP2380 (30m x 250µm x 0.2µm) column and reported as g/100 gram FAME. Theoretical
response factors were used for all fatty acids except for EPA, DPA and DHA. For these PUFAs, a USP
FAME mixture was used to calculated empirical response factors within each sequence. Whole blood
samples stored as DBS were used as quality control samples (QC). Two QCs were run in each
sequence, one at the beginning and one at the end. CV% for the estimation of C15:0 and C17:0 were
4.3% and 4.9%, respectively. BMI was estimated as kg/m2 using participants’ online self-reported
body weight and height.
Assessment of dietary intake Habitual food intake over the previous month was assessed using an on-line Food Frequency
Questionnaire (FFQ) with 157 food items specifically developed for the Food4Me intervention and
validated against the printed EPIC-Norfolk FFQ (version CAMB/PQ/6/1205) [23, 24]. Bland Altman

www.mnf-journal.com Page 7 Molecular Nutrition & Food Research
This article is protected by copyright. All rights reserved.
7
analysis showed good agreement between these two FFQs for intake of dairy food groups.
Correlations analysis also revealed good agreement with coefficients varying from 0.55 (milk) to 0.77
(yogurts). Validity of the FFQ against a 4-day weighed food record (n=49) showed good agreement
for dairy food groups with correlation coefficients ranging from 0.46 (cheese) to 0.73 (yogurt). [25].
Under-reporting of energy intake was determined from the comparison of total reported energy
intake against the lowest estimated energy requirement (1.1 times the predicted basal metabolic
rate [26]). Over-reporting of total energy intake was defined as values exceeding 18.84 MJ/day.
Statistical analyses Normality was explored through Shapiro-Wilk tests of normality and quantile-quantile plots. Means,
medians, standard deviations, and inter-quartile ranges were calculated to explore demographic
characteristics of the participants, variation in dairy product intake and blood levels of fatty acids, in
the whole cohort and also according to country of recruitment. Differences between countries were
explored using Kruskal-Wallis equality-of-populations rank tests with post-hoc pairwise comparisons
for continuous variables, and logistic regression analyses for categorical variables (overall mean as
reference group). Differences by sex in the pooled sample and within countries were tested using
the Wilcoxon rank-sum non-parametric test for two independent samples.
Separate ordinary least square (OLS) regression analyses were used to examine the independent
association between each dairy product intake category (total dairy, high-fat dairy, low-fat dairy,
cheese) as the dependent variable, and the log-transformed C15:0 or C17:0 levels as the
independent variable. For variables with large proportions of reported zero consumption (milk: 12%,
cream: 48%, yoghurt: 12%, butter: 42%, and zero-fat milk: 69%), associations were analysed using a
corner-solution Tobit model with left-censoring at zero [27: 595]. For outcomes that tend to pile up
at specific values (e.g. zero), this type of model provides more appropriate estimates of the
conditional mean of the outcome variable because it accounts for the fact that, under such
conditions, there is not a linear relationship with the explanatory variables [27: 668]. All regressions

www.mnf-journal.com Page 8 Molecular Nutrition & Food Research
This article is protected by copyright. All rights reserved.
8
included total energy intake as an independent covariate. Four specifications were explored: an
“unadjusted” model including only the fatty acid and total energy; a “basic” model, including age,
age squared and sex; an “adjusted” model additionally including smoking status and standardized
BMI, and a “full” model incorporating all of the previous covariates and a set of individual country
variables with value 1 if an observation was from a particular country and 0 otherwise.
Robust standard errors (Huber-White) were used to address heteroskedasticity in the data.
Estimated coefficients of interest included the β values for the OLS regressions, and the marginal
effects for Tobit models estimated at the sample mean of the fatty acid independent variable.
Calculated this way, Tobit marginal effects have a similar interpretation to OLS coefficients [27: 599].
ROC curves were used to assess the sensitivity and specificity of blood levels of C15:0 and C17:0 as
biomarkers of intake of dairy products. Parameters from a ROC analysis give an indication of the
biomarker’s ability to correctly classify subjects given an observed binary outcome (e.g. positive vs.
negative). The area under the curve (AUC) estimates the probability that a randomly selected
positive outcome will have a higher “classifier” or biomarker value than a randomly selected
negative outcome [28] and can be used to evaluate the “classification performance” of biomarkers
[29]. According to the AUC value, the discriminating ability of biomarkers of can be broadly classified
as excellent (AUC>0.90), good (0.8 < AUC < 0.9), fair (0.7< AUC < 0.8) and poor (AUC < 0.70) [28].
ROC analyses compared the ability of the log-transformed C15:0 and C17:0 levels to discriminate
individuals in the 10th percentile of intake and above the 90th percentile if intake. Details of the cut-
offs of intake for each dairy product category analysed are given in the Supporting Information
(Table A3). The curve tester facility of the online ROC Curve Explorer and Tester tool (ROCCET,
http//www.roccet.ca) [28] was used for the ROC curve analyses. STATA Software version 13.0 [30]
was used for all other analyses. p-values (two-sided) of ≤0.05 were considered evidence of statistical
significance.

www.mnf-journal.com Page 9 Molecular Nutrition & Food Research
This article is protected by copyright. All rights reserved.
9
Results
Data from 1,180 participants (39% males) with an average (± sd) age of 40 ± 13 years (18 to 73 years)
were analysed. The average BMI was 25.2 ± 4.8 kg/m2 and waist circumference was 84.8 ± 13.3 cm
(Table 1). The mean total energy intake was 10.6 MJ/day± 6.4 MJ/day, with dairy products supplying
on average 12.5 ± 6.4 % of this energy. Along with Germany, Poland had one of the highest values
for % energy intake from dairy (13.7 ± 7.4 %; 14.1 ± 6.7 %, respectively) and % of total fat from dairy
(18.8 ± 9 %). Other differences were observed for proportion of smokers in the sample, in mean total
energy intake, and in average total fat intake (Table 1).
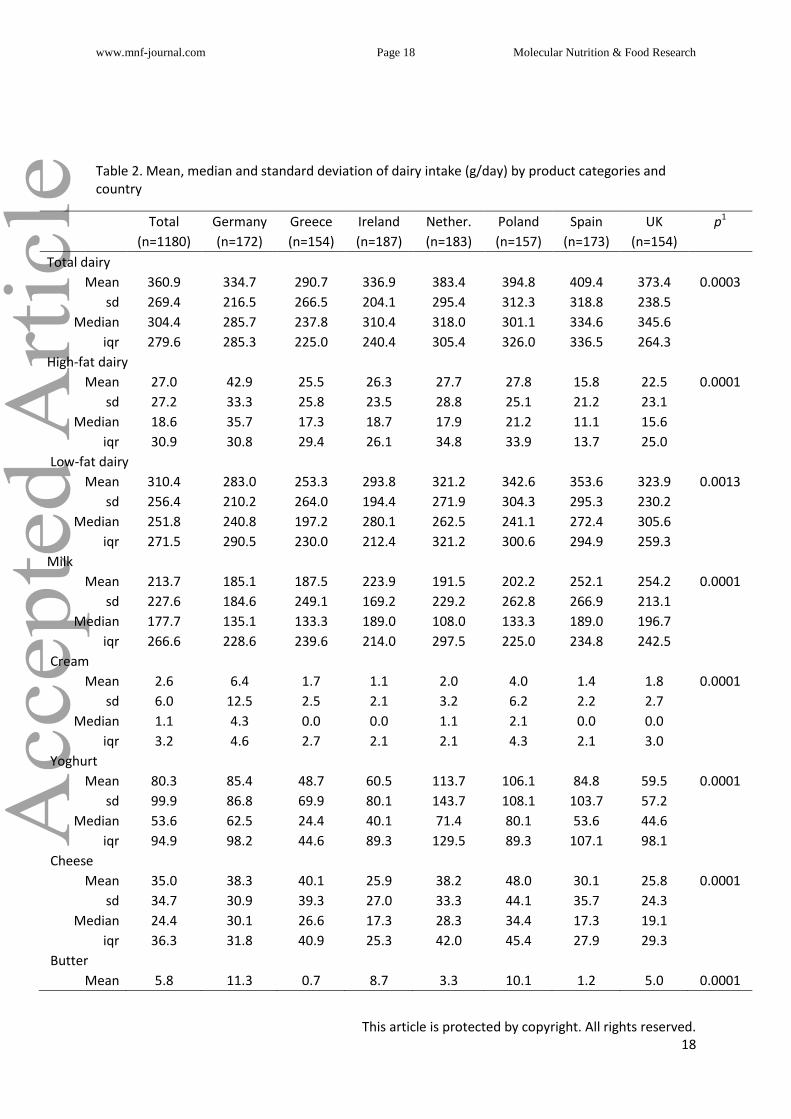
Dairy products intake The median (± interquartile range) intake of dairy products was 304.4 ± 279.6 g/day (Table 2). The
median intake of low-fat dairy products was almost 14-fold higher than that of high-fat dairy
products (251 g/day vs. 18.6 g/day). Across product categories, milk had the highest median intake
per day (177.7 ± 266.6 g/day), followed by yoghurt (53.6 ± 94.9 g/day) and cheese (24.4 ± 36.3
g/day).
Countries differed in their levels of dairy intake (Table 2). Median (± interquartile range) intake of
high-fat dairy products was highest in Germany (35.7 ± 30.8 g/day) and lowest in Spain (11.1 ± 13.7
g/day), while Greece had the lowest intake of both low-fat (197.2 ± 230 g/day) and total dairy
products (237.8 ± 285.3 g/day) across all countries. Approximately half of the Spanish and Greek
participants reported no consumption of butter and cream, while Germans and Polish participants
had median intakes of 6.4 ± 13.3 g/day and 3.9 ± 11.5 g/day respectively. The median intakes of the
other categories of dairy products are reported in Table 2.
Within countries, Greek and Irish women had significantly (p < 0.05) lower intakes of butter than did
men (Table A.1, Supporting Information), whereas Irish and UK women had higher median intakes of

www.mnf-journal.com Page 10 Molecular Nutrition & Food Research
This article is protected by copyright. All rights reserved.
10
yoghurt than did men (53.6 g/day vs. 17.9 g/day; and 53.6 g/day vs. 24.5 g/day, respectively).
Women also reported higher consumption than men of cream in Germany (4.3 g/day vs. 3.0 g/day).
C17:0 and C15:0 levels in dried blood spots Across the entire sample, the average (± sd) level (expressed as % composition total fatty acids) of
C17:0 was 0.32 ± 0.06 %, and that of C15:0 was 0.20 ± 0.06 % (Table 3). These values are in good
agreement with previously reported values for adipose tissue and serum [31]. Overall, the Pearson
correlation coefficient between C15:0 and C17:0 was 0.57 (0.55 for the logged variables).
The lowest mean levels of C15:0 were in Spain (0.16 ± 0.04 %, p < 0.05) and Greece (0.19 ± 0.05 %, p
< 0.05), and the highest in Germany (0.24 ± 0.06 %, p < 0.05). The highest levels of C17:0 were in
Germany and Poland (0.33%, p < 0.05), but were otherwise similar across countries. Men and
women differed significantly in their average levels of C15:0 (0.19% vs. 0.20%, p < 0.05) and of C17:0
(0.32% vs. 0.31%, p < 0.05) (Table A.2, Supporting Information). By country, levels of C15:0 between
men and women were significantly different only in Poland, where women had higher levels than
men (0.23% vs 0.19%, p < 0.05). In contrast, there were more sex differences in C17:0 levels within
countries (lower for women in Ireland, Germany and the Netherlands, and higher in Poland) (Table
A.2, Supporting Information).
Associations of blood levels of C15:0 and C17:0 with dairy intake Levels of C15:0 and of C17:0 were positively and significantly associated (p < 0.001) with intakes of
total dairy, high-fat dairy, and low-fat dairy (Table 4). These associations remained significant after
adjusting for age, sex, smoking status, BMI and country (full model). C15:0 had stronger associations
with intakes across all the different dairy product categories compared to C17:0 (full model,
standardized coefficients). The largest difference was found for high-fat dairy, with the coefficient
for C15:0 almost double the value of that of C17:0. In contrast, levels of C17:0 showed no association
with intake of zero-fat milk, and levels of C15:0 showed a negative association with consumption of
zero-fat milk that was not significant after adjusting for the full set of controls (Table 4).

www.mnf-journal.com Page 11 Molecular Nutrition & Food Research
This article is protected by copyright. All rights reserved.
11
Unadjusted regressions showed strongly significant (p < 0.001) positive associations between C15:0
and intake levels of cream, yoghurt, cheese and butter; and between C17:0 levels and intake of
cheese and butter. Unadjusted regressions also showed significant positive associations of C17:0
levels with milk (p = 0.003) and with yoghurt (p = 0.01), and of C15:0 levels with total milk
consumption (p = 0.007). This pattern of associations remained after controlling for age, sex, BMI,
smoking status and country of origin. The largest independent associations (adjusting for all factors)
were mostly observed for C15:0, particularly for butter (standardized beta = 0.27) and cheese
(standardized beta = 0.19). These higher-fat products also showed the largest difference between
C15:0 and C17:0 coefficient values (Table 5). Robustness checks adjusting for alcohol, ruminant meat
and fish showed no change in results.
ROC analyses showed that C15:0 levels provided acceptable predictability for discriminating
between low and high consumers of high-fat dairy (AUC=0.84; 95% CI: 0.79, 0.89); while levels of
C17:0 had low AUC values for total, high-fat and low-fat dairy products (AUCs < 0.69) (Figure 1). The
combined C15:0 and C17:0 model did not improve the AUCs over the results obtained for C15:0
alone.
By product category, C15:0, but not C17:0, showed good to fair discriminating ability when
comparing low consumers and high consumers of butter (AUC=0.80; 95% CI: 0.76, 0.83), low and
high consumers of cheese (AUC=0.72, 95% CI: 0.66, 0.78), and low consumers and high consumers of
cream (AUC=0.66, 95% CI: 0.61, 0.71) (Figure 2). The joint model showed little improvement from
the individual C15:0 models. In contrast, the AUC values for the food products with lower dairy fat
content of yoghurt and milk showed very low predictability for both C15:0 and C17:0 (AUCs < 0.60)
(Figure A.1, Supporting Information).

www.mnf-journal.com Page 12 Molecular Nutrition & Food Research
This article is protected by copyright. All rights reserved.
12
Discussion
The present study demonstrated the potential utility of C15:0 and C17:0 levels measured in DBS as
biomarkers of intakes of dairy products in European adults across 7 countries. C15:0 levels were
significantly associated with intakes of high-fat dairy products. However, both fatty acids performed
poorly as biomarkers of total dairy intake highlighting that caution should be exercised when using
such markers as measures of total dairy intake in epidemiological studies.
Previous studies looking into biomarkers of dairy have found correlations of plasma C15:0 with
measures of intake of total dairy, high-fat dairy, low-fat dairy, cheese, butter and full-fat milk [6, 13-
15]. This study also found associations of C15:0 with high-fat dairy, low-fat dairy, butter and cheese;
and additionally with total cream, total yoghurt and total milk consumption. Moreover, after
controlling for potential confounding factors, including country of origin, the largest associations
were observed for high-fat dairy, butter, and cheese. Additional analyses using ROC curves showed
that levels of C15:0 did not distinguish well between low consumers and high consumers of total and
low-fat dairy. In contrast, levels of C15:0 classified low and high consumers of high-fat dairy, butter,
cheese and cream reasonably well; corroborating findings from the regression analyses and
providing further evidence of the potential role of C15:0 as a biomarker for high-fat dairy intake.
Results also demonstrated positive associations for blood levels of C17:0 and dairy intake. With the
exception of total cream, significant associations were found for all three dairy product categories
(total, high-fat and low-fat dairy) and all the individual product groups examined here. Previous
studies evaluating the levels of C17:0 in blood lipid fractions have also found positive correlations of
C17:0 with total dairy intake levels, but generally of a lower magnitude than those reported for
C15:0 [15, 18, 32]. Observed associations of C17:0 with dairy intake levels were also lower than
those for C15:0 in this study, across all the dairy categories. ROC curves also mostly reflected the
weaker relationships of C17:0 with dairy intake levels. Lower associations for blood levels of C17:0

www.mnf-journal.com Page 13 Molecular Nutrition & Food Research
This article is protected by copyright. All rights reserved.
13
may be reflecting other metabolic processes associated with this fatty acid in addition to dietary
sources [16].
Results across the linear regressions and the ROC curves showed that C15:0 and C17:0 performed
better for high-fat dairy products compared to lower-fat dairy products (e.g. milk, yoghurt). Different
levels of saturated fatty acids per unit of dairy product may explain the relatively stronger
associations of blood C15:0 and C17:0 levels with high-fat dairy. For example, dietary estimates of
C15:0 in Norway indicated much lower relative levels of this fatty acid in skimmed milk compared
with full fat milk [19]. The strong results for high-fat dairy in this study may also reflect the fact that
milk was not included in this category during analyses, given previous findings of a lack of association
of plasma C15:0 with milk intake, and accompanying suggestions that this lack of relationship is
owing to the fact that milk fat may be metabolized differently than fats from other dairy products
[19].
Strengths of this study include the use of a large sample of dietary patterns and blood lipid levels
across seven European countries, allowing more information to be extracted from the data than
would be the case with typical small-sample biomarker studies [33]. The use of ROC analyses to
explore the ability of C15:0 and C17:0 to correctly classify high and low consumers of dairy provided
greater insight into the performance of these fatty acids as biomarkers of intake compared to more
conventional correlation techniques [32], and is another important contribution of this study. Finally
this study highlights the use of DBS for collection of samples and analysis of diet related biomarkers:
use of this approach in large longitudinal cohort studies could represent an inexpensive method for
assessing diet related parameters. Work from others has demonstrated the stability of the markers
and the use of this DBS approach in measuring a range of other fatty acids including n-3 poly-
unsaturated fatty acids which are related to oily fish consumption [34, 35]. Limitations to consider
when evaluating the results of the study are the possibility that, although data used in this study was

www.mnf-journal.com Page 14 Molecular Nutrition & Food Research
This article is protected by copyright. All rights reserved.
14
from a purposely-designed and validated FFQ questionnaire [24, 25], the strength of observed
associations may have been attenuated by the use of this instrument for dietary data collection [19].
In conclusion, C15:0 measured in DBS performed well as a biomarker of high-fat dairy intake only.
Overall findings highlight the utility of this biomarker for dietary assessment of high-fat dairy and,
ultimately, for improved understanding through epidemiological studies of the role of diets high in
dairy fat and in specific dairy products in the development of cardiovascular disease [36]. Moreover,
recent findings of a negative association of high blood levels of C15:0 and C17:0 with type 2 diabetes
[37, 38] indicate the potential of these fatty acids to act as biomarkers when studying diet-disease
relationships. However, caution needs to be exerted when interpreting these biomarkers as
indicators of food intake: the present data clearly demonstrates stronger relationships with high fat
dairy products. Finally, the results extend the evidence base for the use of DBS in measuring dietary
biomarkers and their potential application in large-scale epidemiological studies of nutrition and
health.
The Food4Me study and this project are supported by the European Commission under the Food,
Agriculture, Fisheries and Biotechnology Theme of the 7th Framework Programme for Research and
Technological Development, grant number 265494.
All procedures performed in studies involving human participants were in accordance with the ethical
standards of the institutional and/or national research committee and with the 1964 Helsinki
declaration and its later amendments or comparable ethical standards.
The authors have declared no conflict of interest
References
[1] Kvaavik, E., Batty, G. D., Ursin, G., Huxley, R., Gale, C. R., Influence of individual and combined health behaviors on total and cause-specific mortality in men and women: the United Kingdom Health and Lifestyle Survey. Archives of Internal Medicine 2010, 170, 711-718. [2] Jenab, M., Slimani, N., Bictash, M., Ferrari, P., Bingham, S., Biomarkers in nutritional epidemiology: applications, needs and new horizons. Hum Genet 2009, 125, 507-525.

www.mnf-journal.com Page 15 Molecular Nutrition & Food Research
This article is protected by copyright. All rights reserved.
15
[3] Kipnis, V., Midthune, D., Freedman, L., Bingham, S., et al., Bias in dietary-report instruments and its implications for nutritional epidemiology. Public Health Nutrition 2002, 5, 915-923. [4] Marshall, J. R., Chen, Z., Diet and health risk: risk patterns and disease-specific associations. The American Journal of Clinical Nutrition 1999, 69, 1351s-1356s. [5] Djoussé, L., Is plasma pentadecanoic acid a reasonable biomarker of dairy consumption? Journal of the American Heart Association 2013, 2. [6] Mozaffarian, D., de Oliveira Otto, M. C., Lemaitre, R. N., Fretts, A. M., et al., trans-Palmitoleic acid, other dairy fat biomarkers, and incident diabetes: the Multi-Ethnic Study of Atherosclerosis (MESA). The American Journal of Clinical Nutrition 2013, 97, 854-861. [7] Tong, X., Dong, J. Y., Wu, Z. W., Li, W., Qin, L. Q., Dairy consumption and risk of type 2 diabetes mellitus: a meta-analysis of cohort studies. European Journal of Clinical Nutrition 2011, 65, 1027-1031. [8] Wolk, A., Vessby, B., Ljung, H., Barrefors, P., Evaluation of a biological marker of dairy fat intake. The American Journal of Clinical Nutrition 1998, 68, 291-295. [9] Wu, Z., Palmquist, D. L., Synthesis and biohydrogenation of fatty acids by ruminal microorganisms in vitro. Journal of Dairy Science 1991, 74, 3035-3046. [10] Baylin, A., Kabagambe, E. K., Siles, X., Campos, H., Adipose tissue biomarkers of fatty acid intake. The American Journal of Clinical Nutrition 2002, 76, 750-757. [11] Smedman, A. E. M., Gustafsson, I.-B., Berglund, L. G. T., Vessby, B. O. H., Pentadecanoic acid in serum as a marker for intake of milk fat: relations between intake of milk fat and metabolic risk factors. The American Journal of Clinical Nutrition 1999, 69, 22-29. [12] Wolk, A., Furuheim, M., Vessby, B., Fatty acid composition of adipose tissue and serum lipids are valid biological markers of dairy fat intake in men. The Journal of Nutrition 2001, 131, 828-833. [13] Biong, A. S., Berstad, P., Pedersen, J. I., Biomarkers for intake of dairy fat and dairy products. European Journal of Lipid Science and Technology 2006, 108, 827-834. [14] de Oliveira Otto, M. C., Nettleton, J. A., Lemaitre, R. N., M. Steffen, L., et al., Biomarkers of Dairy Fatty Acids and Risk of Cardiovascular Disease in the Multi‐Ethnic Study of Atherosclerosis. Journal of the American Heart Association 2013, 2. [15] Sun, Q., Ma, J., Campos, H., Hu, F. B., Plasma and erythrocyte biomarkers of dairy fat intake and risk of ischemic heart disease. The American Journal of Clinical Nutrition 2007, 86, 929-937. [16] Aslibekyan, S., Campos, H., Baylin, A., Biomarkers of dairy intake and the risk of heart disease. Nutrition, Metabolism and Cardiovascular Diseases 2012, 22, 1039-1045. [17] Abdullah, M. M. H., Cyr, A., Lépine, M.-C., Labonté, M.-È., et al., Recommended dairy product intake modulates circulating fatty acid profile in healthy adults: a multi-centre cross-over study. British Journal of Nutrition 2015, FirstView, 1-10. [18] Saadatian-Elahi, M., Slimani, N., Chajès, V., Jenab, M., et al., Plasma phospholipid fatty acid profiles and their association with food intakes: results from a cross-sectional study within the European Prospective Investigation into Cancer and Nutrition. The American Journal of Clinical Nutrition 2009, 89, 331-346. [19] Brevik, A., Veierod, M. B., Drevon, C. A., Andersen, L. F., Evaluation of the odd fatty acids 15:0 and 17:0 in serum and adipose tissue as markers of intake of milk and dairy fat. European Journal of Clinical Nutrition 2005, 59, 1417-1422. [20] Baylin, A., Kim, M. K., Donovan-Palmer, A., Siles, X., et al., Fasting whole blood as a biomarker of essential fatty acid intake in epidemiologic studies: comparison with adipose tissue and plasma. American Journal of Epidemiology 2005, 162, 373-381. [21] Celis-Morales, C., Livingstone, K. M., Marsaux, C. F. M., Forster, H., et al., Design and baseline characteristics of the Food4Me Proof of Principle Study: a web-based randomized controlled trial of personalised nutrition in seven european countries Submitted 2014.

www.mnf-journal.com Page 16 Molecular Nutrition & Food Research
This article is protected by copyright. All rights reserved.
16
[22] Livingstone, K., Celis-Morales, C., Navas-Carretero, S., San-Cristobal, R., et al., Profile of European adults interested in internet-based personalised nutrition: the Food4Me study. Eur J Nutr 2015, 1-11. [23] Bingham, S. A., Gill, C., Welch, A., Cassidy, A., et al., Validation of dietary assessment methods in the UK arm of EPIC using weighed records, and 24-hour urinary nitrogen and potassium and serum vitamin C and carotenoids as biomarkers. International Journal of Epidemiology 1997, 26 Suppl 1, S137-151. [24] Forster, H. F., Gallagher, C., O’Donovan, C., Woolhead, C., et al., Online dietary intake estimation: the Food4Me Food Frequency Questionnaire. Journal of Medical Internet Research 2014, 16, e150. [25] Fallaize, R., Forster, H., Macready, L., Walsh, C., et al., Online dietary intake estimation: reproducibility and validity of the Food4Me food frequency questionnaire against a 4-day weighed food record. Journal of Medical Internet Research 2014, 16, e190. [26] Goldberg, G., Black, A., Jebb, S., Cole, T., et al., Critical evaluation of energy intake data using fundamental principles of energy physiology: 1. Derivation of cut-off limits to identify under-recording. European Journal of Clinical Nutrition 1991, 45, 569-581. [27] Wooldridge, J. M., Introductory Econometrics. A Modern Approach. , Thomson South-Western, Mason, OH 2006. [28] Xia, J., Broadhurst, D., Wilson, M., Wishart, D., Translational biomarker discovery in clinical metabolomics: an introductory tutorial. Metabolomics 2013, 9, 280-299. [29] O’Gorman, A., Morris, C., Ryan, M., O’Grada, C. M., et al., Habitual dietary intake impacts on the lipidomic profile. Journal of Chromatography B 2014, 966, 140-146. [30] StataCorp, StataCorp. LP, College Station, TX 2011. [31] Brevik, A., Veierod, M. B., Drevon, C. A., Andersen, L. F., Evaluation of the odd fatty acids 15:0 and 17:0 in serum and adipose tissue as markers of intake of milk and dairy fat. Eur J Clin Nutr 2005, 59, 1417-1422. [32] Fusconi E, Pala V, Riboli E, Vineis P, et al., Relationship between plasma fatty acid composition and diet over previous years in the Italian centers of the European Prospective Investigation into Cancer and Nutrition (EPIC). Tumori 2003, 89, 624-635. [33] Freedman, L. S., Commins, J. M., Moler, J. E., Arab, L., et al., Pooled results from 5 validation studies of dietary self-report instruments using recovery biomarkers for energy and protein intake. American Journal of Epidemiology 2014, 180, 172-188. [34] Marangoni, F., Colombo, C., Galli, C., A method for the direct evaluation of the fatty acid status in a drop of blood from a fingertip in humans: applicability to nutritional and epidemiological studies. Anal Biochem 2004, 326, 267-272. [35] Liu, G., Muhlhausler, B. S., Gibson, R. A., A method for long term stabilisation of long chain polyunsaturated fatty acids in dried blood spots and its clinical application. Prostaglandins, leukotrienes, and essential fatty acids 2014, 91, 251-260. [36] Huth, P. J., Park, K. M., Influence of dairy product and milk fat consumption on cardiovascular disease risk: A review of the evidence. Advances in Nutrition: An International Review Journal 2012, 3, 266-285. [37] Forouhi, N. G., Koulman, A., Sharp, S. J., Imamura, F., et al., Differences in the prospective association between individual plasma phospholipid saturated fatty acids and incident type 2 diabetes: the EPIC-InterAct case-cohort study. The Lancet Diabetes & Endocrinology 2014, 2, 810-818. [38] Santaren, I. D., Watkins, S. M., Liese, A. D., Wagenknecht, L. E., et al., Serum pentadecanoic acid (15:0), a short-term marker of dairy food intake, is inversely associated with incident type 2 diabetes and its underlying disorders. The American Journal of Clinical Nutrition 2014, 100, 1532-1540.

www.mnf-journal.com Page 17 Molecular Nutrition & Food Research
This article is protected by copyright. All rights reserved.
17
Tables
Table 1. Sample demographic and anthropometric characteristics from 1,180 respondents across Germany, Greece, Ireland, the Netherlands, Poland, Spain and the UK.
Total Germany Greece Ireland Nether. Poland Spain UK
(n=1180) (n=172) (n=154) (n=187) (n=183) (n=157) (n=173) (n=154)
Men (%) 39.3 44.8 35.1 38.0 49.2 27.4 46.8 31.2
Age (years) 40.3 43.8 38.5 39.2 43.6 35.8 42.2 37.7
(13.0) (13.5) (11.2) (12.7) (14.5) (12.2) (10.6) (13.3)
Smoking (%) 12.1 5.8 35.7 6.4 5.5 9.6 19.1 5.2
BMI (kg/m2) 25.2 24.5 26.9 25.3 24.6 24.5 26.1 24.8
(4.8) (3.9) (6.5) (4.8) (4.4) (4.9) (4.1) (4.4)
Waist circumference (cm)
84.8 85.0 88.3 84.8 85.3 80.9 86.9 82.1
(13.3) (13.5) (14.7) (13.4) (12.6) (13.7) (12.3) (11.5)
Total energy intake (MJ/day)
10.6 10.6 9.6 11.1 11.4 10.3 10.9 10.4
(3.1) (2.6) (3.2) (2.8) (3.0) (3.4) (3.1) (3.1)
Energy intake from dairy (%)
12.5 14.1 12.3 10.9 12.9 13.7 11.6 11.8
(6.4) (6.7) (6.8) (5.1) (6.4) (7.4) (6.6) (5.1)
Total energy from fat (%)
35.8 37.1 37.6 36.4 34.5 34.8 35.5 35.1
(5.8) (5.1) (6.6) (5.2) (6.0) (5.3) (5.9) (6.0)
Total fat intake from dairy (%)
16.5 18.8 16.8 14.6 18.8 17.9 14.0 14.7
(8.7) (9.0) (9.2) (7.1) (9.1) (9.5) (8.2) (6.6)
Nether. = the Netherlands. Values are means with standard deviations in parentheses except for
smoking status, which represents proportion of the sample that smokes.
www.mnf-journal.com Page 18 Molecular Nutrition & Food Research
This article is protected by copyright. All rights reserved.
18
Table 2. Mean, median and standard deviation of dairy intake (g/day) by product categories and country
Total Germany Greece Ireland Nether. Poland Spain UK p1
(n=1180) (n=172) (n=154) (n=187) (n=183) (n=157) (n=173) (n=154)
Total dairy
Mean 360.9 334.7 290.7 336.9 383.4 394.8 409.4 373.4 0.0003
sd 269.4 216.5 266.5 204.1 295.4 312.3 318.8 238.5
Median 304.4 285.7 237.8 310.4 318.0 301.1 334.6 345.6
iqr 279.6 285.3 225.0 240.4 305.4 326.0 336.5 264.3
High-fat dairy
Mean 27.0 42.9 25.5 26.3 27.7 27.8 15.8 22.5 0.0001
sd 27.2 33.3 25.8 23.5 28.8 25.1 21.2 23.1
Median 18.6 35.7 17.3 18.7 17.9 21.2 11.1 15.6
iqr 30.9 30.8 29.4 26.1 34.8 33.9 13.7 25.0
Low-fat dairy
Mean 310.4 283.0 253.3 293.8 321.2 342.6 353.6 323.9 0.0013
sd 256.4 210.2 264.0 194.4 271.9 304.3 295.3 230.2
Median 251.8 240.8 197.2 280.1 262.5 241.1 272.4 305.6
iqr 271.5 290.5 230.0 212.4 321.2 300.6 294.9 259.3
Milk
Mean 213.7 185.1 187.5 223.9 191.5 202.2 252.1 254.2 0.0001
sd 227.6 184.6 249.1 169.2 229.2 262.8 266.9 213.1
Median 177.7 135.1 133.3 189.0 108.0 133.3 189.0 196.7
iqr 266.6 228.6 239.6 214.0 297.5 225.0 234.8 242.5
Cream
Mean 2.6 6.4 1.7 1.1 2.0 4.0 1.4 1.8 0.0001
sd 6.0 12.5 2.5 2.1 3.2 6.2 2.2 2.7
Median 1.1 4.3 0.0 0.0 1.1 2.1 0.0 0.0
iqr 3.2 4.6 2.7 2.1 2.1 4.3 2.1 3.0
Yoghurt
Mean 80.3 85.4 48.7 60.5 113.7 106.1 84.8 59.5 0.0001
sd 99.9 86.8 69.9 80.1 143.7 108.1 103.7 57.2
Median 53.6 62.5 24.4 40.1 71.4 80.1 53.6 44.6
iqr 94.9 98.2 44.6 89.3 129.5 89.3 107.1 98.1
Cheese
Mean 35.0 38.3 40.1 25.9 38.2 48.0 30.1 25.8 0.0001
sd 34.7 30.9 39.3 27.0 33.3 44.1 35.7 24.3
Median 24.4 30.1 26.6 17.3 28.3 34.4 17.3 19.1
iqr 36.3 31.8 40.9 25.3 42.0 45.4 27.9 29.3
Butter
Mean 5.8 11.3 0.7 8.7 3.3 10.1 1.2 5.0 0.0001

www.mnf-journal.com Page 19 Molecular Nutrition & Food Research
This article is protected by copyright. All rights reserved.
19
Total Germany Greece Ireland Nether. Poland Spain UK p1
(n=1180) (n=172) (n=154) (n=187) (n=183) (n=157) (n=173) (n=154)
sd 11.2 14.6 2.4 13.2 7.8 15.6 2.8 8.2
Median 1.1 6.4 0.0 2.1 0.6 3.9 0.0 1.1
iqr 6.4 13.3 0.0 11.5 2.1 11.5 1.1 6.4 1p-value of test of differences across countries (Kruskal-Wallis test of difference across k
independent samples). sd= standard deviation, iqr= interquartile range: difference between the third
and first quartiles. High fat dairy includes double cream, high fat cheese, medium fat cheese and
butter. Low fat dairy includes full fat or whole milk, low-fat or semi-skimmed milk, zero-fat or
skimmed milk, single or sour cream, fruit yoghurt or fruit mousse, full fat Greek yoghurt, low-fat
natural yoghurt, low-fat cheese, and very low-fat cheese. Milk: full-fat, semi-skimed and zero-fat
milk. Cream: double/clotted cream and single cream. Yoghurt: full-fat/Greek yoghurt, low-fat
yoghurt and fruit yoghurt/mousse. Cheese: high-fat (e.g. Stilton, Cheddar, Brie), medium-fat (e.g.
Goats, Camembert, Feta, Emmental), low-fat (e.g. Fresh Mozzarella, Cream Cheese, Katiki) and very
low-fat cheeses (e.g. Cottage Cheese, Quark). Nether. = the Netherlands.
Table 3. Mean and standard deviation of C15:0 and C17:0 blood fatty acid levels
Total German
y Greece Ireland
Nether.
Poland Spain UK
(n=1180)
(n-=172) (n=154
) (n=187
) (n=183
) (n=157
) (n=173
) (n=154
) p1
Pentadecanoic (C15:0)
Mean 0.20 0.24 0.19 0.21 0.21 0.22 0.16 0.20 0.000
1
sd 0.06 0.06 0.05 0.05 0.05 0.07 0.04 0.05
Median 0.20 0.23 0.19 0.20 0.20 0.21 0.15 0.20
iqr 0.07 0.08 0.05 0.06 0.06 0.07 0.05 0.06
Heptadecanoic (C17:0)
Mean 0.32 0.33 0.32 0.32 0.32 0.33 0.31 0.31 0.000
1
sd 0.06 0.07 0.05 0.05 0.05 0.06 0.05 0.05
Median 0.32 0.32 0.32 0.32 0.32 0.33 0.30 0.31
iqr 0.07 0.08 0.07 0.06 0.06 0.07 0.06 0.06 1p-value of Kruskal-Wallis test of difference across k independent samples. sd= standard deviation,
iqr= interquartile range: difference between the third and first quartiles. C15:0 and C17:0 blood fatty
acid levels as percentage of total blood fatty acids. Nether. = the Netherlands.

www.mnf-journal.com Page 20 Molecular Nutrition & Food Research
This article is protected by copyright. All rights reserved.
20
Table 4. Associations of blood C15:0 and C17:0 levels and total dairy, high-fat dairy, low-fat dairy and zero-fat milk intake (g/day)
Total dairy
High-fat
dairy
Low-fat
dairy
Zero-fat
Milka
βc
se p-valu
e
β se p-valu
e
β se p-valu
e
β se p-valu
e
No adjustment
Pentadecanoic (C15:0)
b 115.0
4
(27.6
3)
p <
0.00
1
31.9
9
(3.00
)
p <
0.00
1
101.6
3
(27.1
1)
p <
0.00
1
-
45.8
8
(12.6
0)
p <
0.00
1
[0.12] [0.32
]
[0.11] [-
0.14]
Heptadecanoic (C17:0)
b 186.0
0 (43.7
8) p <
0.001
22.31
(5.14)
p < 0.00
1
173.16
(42.46)
p < 0.00
1
-13.9
2
(18.10)
0.443
[0.12] [0.14]
[0.11] [-0.03]
Basic model
Pentadecanoic (C15:0)
111.31
(27.67)
p < 0.00
1
31.75
(3.00)
p < 0.00
1
98.74 (27.22)
p < 0.00
1
-49.4
8
(12.48)
p < 0.00
1 [0.11] [0.32
] [0.11] [-
0.15]
Heptadecanoic (C17:0)
201.05
(43.26)
p < 0.00
1
22.89
(5.15)
p < 0.00
1
183.74
(42.45)
p < 0.00
1
-8.14 (17.84)
0.649
[0.13] [0.14]
[0.12] [-0.02]
Adjusted model
Pentadecanoic (C15:0)
104.89
(28.53)
p < 0.00
1
31.94
(2.91)
p < 0.00
1
94.08 (28.08)
0.001
-50.9
4
(12.67)
p < 0.00
1 [0.11] [0.32
] [0.10] [-
0.16]
Heptadecanoic (C17:0)
194.06
(45.18)
p < 0.00
1
22.14
(5.10)
p < 0.00
1
179.86
(44.35)
p < 0.00
1
-6.66 (18.03)
0.712
[0.12] [0.14]
[0.12] [-0.01]
Full model
Pentadecano 167.3 (30.4 p < 25.3 (2.92 p < 151.2 (30.0 p < -8.91 (12.9 0.49

www.mnf-journal.com Page 21 Molecular Nutrition & Food Research
This article is protected by copyright. All rights reserved.
21
ic (C15:0) 1 7) 0.001
5 ) 0.001
0 5) 0.001
7) 4
[0.17] [0.26]
[0.16] [-0.03]
Heptadecanoic (C17:0)
211.46
(45.96)
p < 0.00
1
18.08
(4.95)
p < 0.00
1
192.35
(45.35)
p < 0.00
1
20.29
(18.57)
0.273
[0.13] [0.11]
[0.13] [0.04]
a Marginal effects from a Tobit model for corner solutions. b Variable in logarithm. Standard errors in parentheses. c Regression coefficients. Standardized coefficients in brackets. Standardized coefficients show the standard deviation change in the dependent variable when the independent variable is changed by one standard deviation. Basic model: adjusted for age, age squared and sex. Adjusted model: variables in basic model and smoking status, standardized BMI. Full model: adjusted model covariates plus country indicator variables. All models adjusted for total energy intake (kcal/day). High fat dairy includes double cream, high fat cheese, medium fat cheese and butter. Low fat dairy includes full fat or whole milk, low-fat or semi-skimmed milk, zero-fat or skimmed milk, single or sour cream, fruit yoghurt or fruit mousse, full fat Greek yoghurt, low-fat natural yoghurt, low-fat cheese, and very low-fat cheese.
Table 5. Associations of blood C15:0 and C17:0 levels and dairy product intake (g/day)
Milk
a Cream
a Yoghurt
a Cheese
Butter
a
βc
se p-value
β se p-value
β se p-value
β se p-value
β se p-value
No adjustment
Pentadecanoic (C15:0)
b
54.
91
(20.
49)
0.0
07 3.06
(0.
76)
p <
0.0
01
35.7
7
(8.7
2)
p <
0.0
01
24.1
4
(3.
66)
p <
0.0
01
12.0
0
(1.
17)
p <
0.0
01
[0.0
8]
[0.2
0]
[0.12
]
[0.1
8]
[0.3
9]
Heptadecanoic (C17:0)
b
97.
06
(32.
71)
0.0
03 2.93
(1.
60)
0.0
67
35.5
7
(13.
87)
0.0
10
21.1
0
(5.
63)
p <
0.0
01
7.99 (1.
65)
p <
0.0
01
[0.0
8]
[0.1
2]
[0.07
]
[0.1
0]
[0.1
6]
Basic model
Pentadecanoic (C15:0)
54.44
(20.67)
0.008
3.02 (0.76)
p < 0.001
34.06
(8.60)
p < 0.001
23.28
(3.62)
p < 0.001
11.97
(1.17)
p < 0.001
[0.08]
[0.20]
[0.11
]
[0.18]
[0.39]

www.mnf-journal.com Page 22 Molecular Nutrition & Food Research
This article is protected by copyright. All rights reserved.
22
Heptadecanoic (C17:0)
102
.48
(32.
78)
0.0
02 3.01
(1.
57)
0.0
56
39.1
2
(13.
83)
0.0
05
23.6
6
(5.
69)
p <
0.0
01
7.97 (1.
62)
p <
0.0
01
[0.09]
[0.12]
[0.08
]
[0.12]
[0.16]
Adjusted model
Pentadecanoic (C15:0)
54.60
(21.59)
0.011
2.92 (0.71)
p < 0.001
29.58
(8.71)
0.001
23.94
(3.52)
p < 0.001
11.77
(1.15)
p < 0.001
[0.08]
[0.19]
[0.10
]
[0.19]
[0.38]
Heptadecanoic (C17:0)
104.41
(34.54)
0.003
2.76 (1.46)
0.059
32.57
(13.57)
0.016
24.19
(5.73)
p < 0.001
7.31 (1.65)
p < 0.001
[0.09]
[0.11]
[0.07
]
[0.12]
[0.15]
Full model
Pentadecanoic (C15:0)
96.56
(22.50)
p < 0.001
1.46 (0.63)
0.020
35.12
(9.34)
p < 0.001
24.06
(3.69)
p < 0.001
8.47 (1.11)
p < 0.001
[0.13]
[0.10]
[0.12
]
[0.19]
[0.27]
Heptadecanoic (C17:0)
108.56
(34.57)
0.002
2.11 (1.37)
0.125
38.11
(14.13)
0.007
21.39
(5.56)
p < 0.001
5.14 (1.52)
0.001
[0.09]
[0.09]
[0.08
]
[0.10]
[0.10]
a Marginal effects from a Tobit model for corner solutions. b Variable in logarithm. Standard errors in
parentheses. c Regression coefficients. Standardized coefficients in brackets. Standardized
coefficients show the standard deviation change in the dependent variable when the independent
variable is changed by one standard deviation. Basic model adjusted for sex, age and age squared.
Adjusted model expanded to include smoking status, and standardized BMI. Full model: adjusted
model covariates plus country indicator variables. All models adjusted for total energy intake
(kcal/day).
Figure legends Figure 1. Receiver operating characteristic (ROC) curves for the discriminating power of
C15:0, C17:0 by total dairy, high-fat dairy and low-fat dairy categories produced using single
fatty acid models (top and middle panels) and a model containing both fatty acids
simultaneously (bottom panel). The low and high consumers were selected using the 10th
and 90th percentile. Details of the intake level cut-offs for low and high consumption are in
Table A.3. The x axis represents the false positive rate (1- specificity), the y axis represents

www.mnf-journal.com Page 23 Molecular Nutrition & Food Research
This article is protected by copyright. All rights reserved.
23
the true positive rate (sensitivity). The red dot represents the mathematically optimal cut-
off point for classifying subjects into “positive” (high consumption) or “negative” (low
consumption) outcomes.
Figure 2. Receiver operating characteristic (ROC) curves for the discriminating power of
C15:0, C17:0 by dairy product produced using single fatty acid models (top and middle
panels) and a model containing both fatty acids simultaneously (bottom panel). The low and
high consumers were selected using the 10th and 90th percentile. Details of the intake level
cut-offs for low and high consumption are in Table A.3. The x axis represents the false
positive rate (1- specificity), the y axis represents the true positive rate (sensitivity). The red
dot represents the mathematically optimal cut-off point for classifying subjects into
“positive” (high consumption) or “negative” (low consumption) outcomes.

www.mnf-journal.com Page 24 Molecular Nutrition & Food Research
This article is protected by copyright. All rights reserved.
24

www.mnf-journal.com Page 25 Molecular Nutrition & Food Research
This article is protected by copyright. All rights reserved.
25