
Alarm Management as a winning strategy - Instrumentation
15
Alarm Management as a winning strategy By Dave Wibberley, Managing Director: Adroit Technologies Keywords: [Alarm Management, bad actor, benefit, best practice, case study, champion, compliance, continuous, decision making, disaster, economic, EEMUA 191, flooding, guideline, ignore, incident, ISA, KPI, liability, loss, mass acknowledgement, motivation, nuisance alarm, overload, performance, quality, regulatory, risk, safety, strategy, trip] The objective of an alarm system is to minimize or prevent physical and economic loss through operator intervention. Abstract In this paper Dave Wibberly looks at some of the motivators and best practices for alarm systems and then discusses the conflict between the published KPIs, which are regarded as those required to meet best practice vs. practical means to achieve these metrics. Through two case studies he highlights some of the difficulties plant operators may face and the possible outcomes when they embark on implementing an alarm strategy. 1 Introduction The ultimate objective of an alarm system is to prevent, or at least minimize, physical and economic loss through operator intervention in response to the condition that was alarmed on any given process. Alarm management has taken on new meaning since being identified as one of the key protagonists in major process plant disasters of recent years, such as BP Texas City, Bhopal and 3 Mile Island. Spurred on by the findings of enquiries into these disasters some very interesting work has been done by the large process companies, vendors and industry organisations like the Electrical Equipment Manufacturers and Users Association (EEMUA) and the Instrumentation Society of America (ISA). By firstly recognising the problem; accepting the need for an alarm management strategy; and applying technology to the process, companies can achieve multiple benefits. These include a more motivated and
Transcript of Alarm Management as a winning strategy - Instrumentation
Alarm Management as a winning strategy
By Dave Wibberley, Managing Director: Adroit Technologies
Keywords: [Alarm Management, bad actor, benefit, best
practice, case study, champion, compliance, continuous,
decision making, disaster, economic, EEMUA 191, flooding,
guideline, ignore, incident, ISA, KPI, liability, loss, mass
acknowledgement, motivation, nuisance alarm, overload,
performance, quality, regulatory, risk, safety, strategy, trip]
The objective of an alarm system is to minimize or
prevent physical and economic loss through
operator intervention.
Abstract
In this paper Dave Wibberly looks at some of the motivators and best practices for alarm systems and then
discusses the conflict between the published KPIs, which are regarded as those required to meet best practice
vs. practical means to achieve these metrics. Through two case studies he highlights some of the difficulties
plant operators may face and the possible outcomes when they embark on implementing an alarm strategy.
1 Introduction The ultimate objective of an alarm system is to prevent, or at least minimize, physical and economic loss
through operator intervention in response to the condition that was alarmed on any given process.
Alarm management has taken on new meaning since being identified as one of the key protagonists in major
process plant disasters of recent years, such as BP Texas City, Bhopal and 3 Mile Island.
Spurred on by the findings of enquiries into these disasters some very interesting work has been done by the
large process companies, vendors and industry organisations like the Electrical Equipment Manufacturers
and Users Association (EEMUA) and the Instrumentation Society of America (ISA).
By firstly recognising the problem; accepting the need for an alarm management strategy; and applying
technology to the process, companies can achieve multiple benefits. These include a more motivated and
focused staff, clearly identified efficiencies and improved profitability while minimising the potential
liability of management.
2 Why change anything? Strategic motivators can be classified as forced or voluntary. Forced motivators may be compliance (or
regulatory) or they may relate to risk mitigation. Voluntary motivators are those which are driven by
perceived business benefits.
The adoption of an alarm management strategy may be driven by both forced and voluntary motivators.
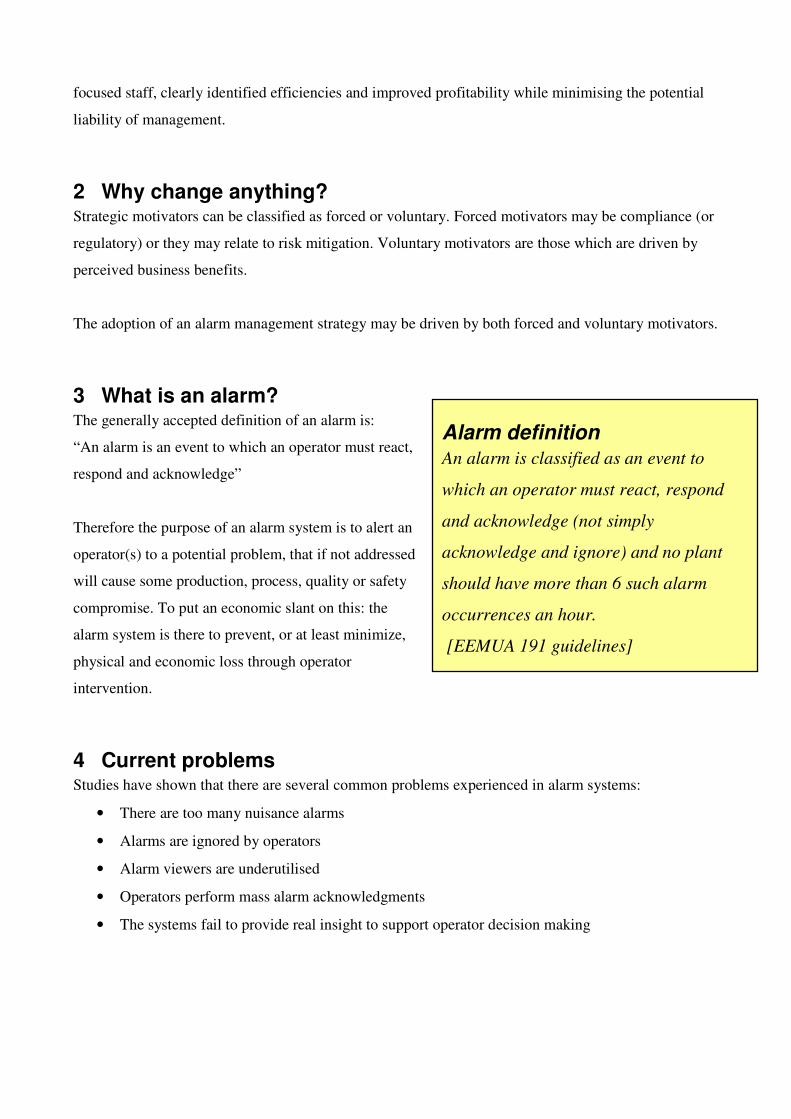
3 What is an alarm? The generally accepted definition of an alarm is:
“An alarm is an event to which an operator must react,
respond and acknowledge”
Therefore the purpose of an alarm system is to alert an
operator(s) to a potential problem, that if not addressed
will cause some production, process, quality or safety
compromise. To put an economic slant on this: the
alarm system is there to prevent, or at least minimize,
physical and economic loss through operator
intervention.
4 Current problems Studies have shown that there are several common problems experienced in alarm systems:
• There are too many nuisance alarms
• Alarms are ignored by operators
• Alarm viewers are underutilised
• Operators perform mass alarm acknowledgments
• The systems fail to provide real insight to support operator decision making
Alarm definition An alarm is classified as an event to
which an operator must react, respond
and acknowledge (not simply
acknowledge and ignore) and no plant
should have more than 6 such alarm
occurrences an hour.
[EEMUA 191 guidelines]
These problems lead to undesirable consequences. Operators presented with too many alarms may overlook
an important indicator of an abnormal situation, or be so overwhelmed that they choose to unnecessarily trip
the unit as a safety measure instead of trying to interpret the information being conveyed.
Both of these scenarios can significantly impact the safety of plant personnel and the efficiency of plant
operations. At the same time risk is increased. There is a higher chance of some catastrophic failure
occurring, leading to massive liability issues, as happened in incidents like BP Texas City, Bhopal and 3 Mile
Island. Less catastrophic but still significant are the risks associated with consequent reduced production,
quality issues and poor staff motivation.
4.1 Nuisance alarms
Most scada installations are configured to create an over-abundance of alarms. Cited here is a large diamond
mine customer who after the project was delivered had over 10 000 alarms configured. This is information
overload for operators. According to the EEMUA 191 guidelines, an alarm is classified as an event to which
an operator must react, respond and acknowledge (not simply acknowledge and ignore) and no plant should
have more than 6 such alarm occurrences an hour.
4.2 Alarms are ignored
Many alarms are simply ignored by operators because so many are either inconsequential and/or irritating.
Where the operator is overwhelmed by trivial information (s)he may miss or ignore genuine alarms.
4.3 Alarm viewers are underutilized
Most process faults are adequately displayed by graphical components on the mimic and these are used as a
starting point to initiate the correction process making a “noisy” alarm viewer redundant when it should be
the most important global view of any process indicating the current health of the process.
4.4 Mass alarm acknowledgement
Alarms on alarm viewers tend to be acknowledged blindly.
4.5 Lack of real information to support decision making
A lot of academic and industry body work has been done around this subject and there are 3rd party software
applications making their way into the industrial arena but they are often too complicated and expensive.
These focus on the events/alarms themselves without taking into account the dynamics of the process, for
example the time it takes for operators to simply acknowledge, clear and reset the alarm.
Systems, plants and processes are run by human beings. They are often under pressure, working the third
shift, late into the night and lack motivation. The operators running the plant are the people who need to
ensure that the process runs optimally. We need to assist and motivate them by focusing their attention in the
areas that will firstly make their lives easier (by identifying problem areas) and secondly give them
information that motivates them (by showing how they are performing against targets – i.e. they are on the
right track).
5 Current best practice and KPIs The two main reference standards used currently are EEMUA 191 and ISA 18.02. These introduce standard
alarm system KPIs such as:
• Average alarm rate (incident count per hour)
• Burst rate
• Percent upset
• Priority distribution
• Standing alarms
• Most frequent alarms
• Intermittent incidents
• Intermittent counts
• Count by agent
• Count by operator
• Total active time by incident
• Total unacknowledged time by incident
• Hourly count grouped by hour of the day.
• Hourly count by incident
• Daily count
• Average acknowledge time
• Average acknowledge time per type
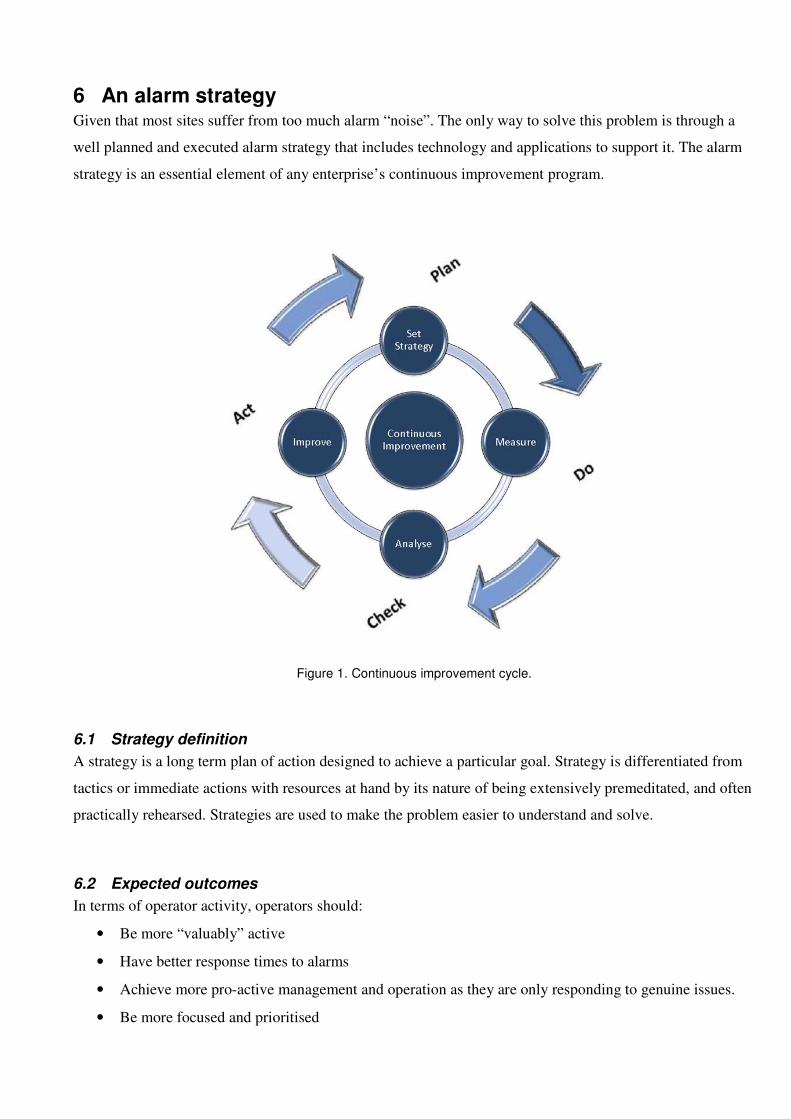
6 An alarm strategy Given that most sites suffer from too much alarm “noise”. The only way to solve this problem is through a
well planned and executed alarm strategy that includes technology and applications to support it. The alarm
strategy is an essential element of any enterprise’s continuous improvement program.
Figure 1. Continuous improvement cycle.
6.1 Strategy definition
A strategy is a long term plan of action designed to achieve a particular goal. Strategy is differentiated from
tactics or immediate actions with resources at hand by its nature of being extensively premeditated, and often
practically rehearsed. Strategies are used to make the problem easier to understand and solve.
6.2 Expected outcomes
In terms of operator activity, operators should:
• Be more “valuably” active
• Have better response times to alarms
• Achieve more pro-active management and operation as they are only responding to genuine issues.
• Be more focused and prioritised
In terms of process, expectations would be for:
• Improved product quality as a consequence of fewer stoppages
• Better focus on the process
• Better information around the key process variables
• Identification of problematic process equipment
• Identification of problematic process areas
From a business perspective, expectations would include:
• Better understanding of operator performance
• Identification of problematic teams
• superior decisions around asset management
6.3 Key success factors
Key factors for successful alarm strategy implementation include:
• Management’s buy-in in terms of commitment to the strategy and provision of the necessary
resources.
• Correct selection of technology that is standards based (uses an open database, OPC compliant
allowing for diverse data sources, follows EEMUA/ ISA guidelines) supports a value driven
information and knowledge approach and provides reporting capabilities, KPI measurement, alarms,
feedback mechanisms and configuration guidelines
• A culture of continuous improvement
7 The Adroit solution Adroit has developed an alarm strategy implementation methodology and it advises that this be followed.
Rather than doing a heap of work upfront, phase in the application of the strategy as you achieve milestones.
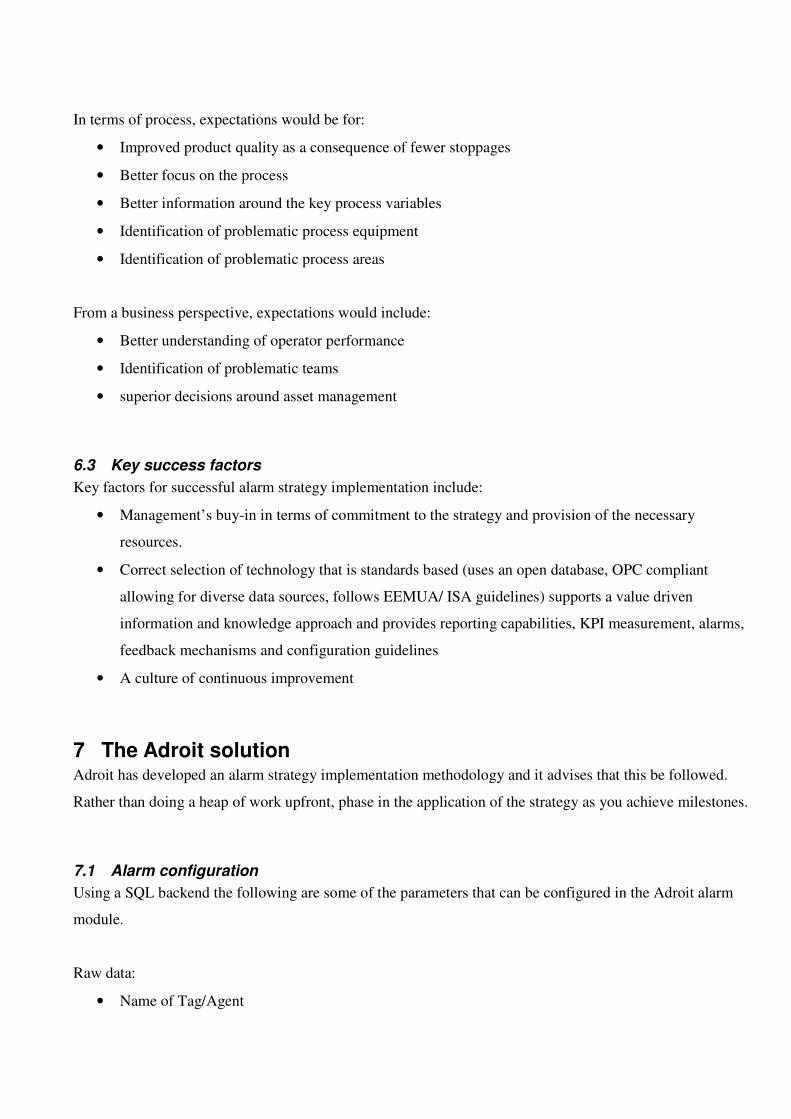
7.1 Alarm configuration
Using a SQL backend the following are some of the parameters that can be configured in the Adroit alarm
module.
Raw data:
• Name of Tag/Agent
• Description of the Tag/Agent
• Value of the Tag/Agent
• Time of alarm occurrence
• Time alarm was acknowledged
• Time alarm was cleared
Figure 2. Alarm agent configuration.
Inferred data:
• Shift data
• Delay
• Conditional aspects
• Plant name
• Plant area
• Operator logged on at the time of alarm
• Whether or not the operators need to add “Reasons and/or Notes” per incident
• Values of other relevant process variables
• Help files
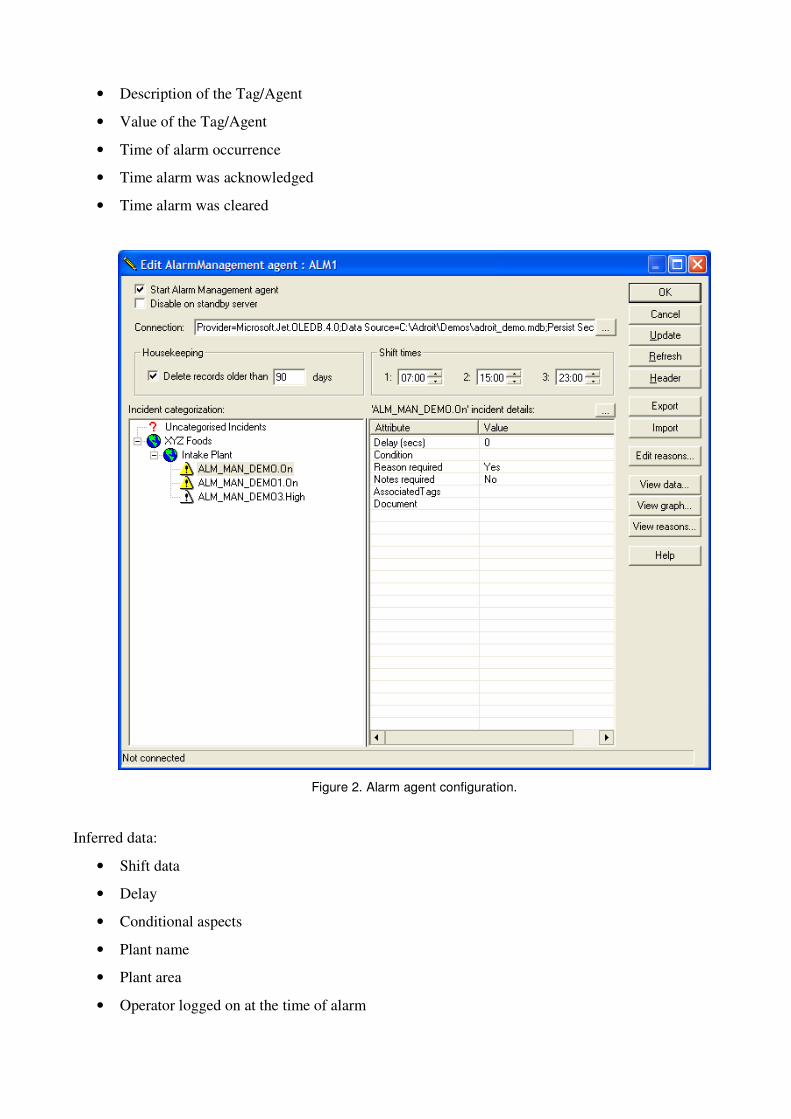
7.2 Alarm results and standard KPIs
As part of the solution the user has easy access to about fifteen different views, which provide an analysis of
the alarm data in tabular and graphical formats. Some of the standard queries are shown in Figure 3.
Figure 3. Standard alarm result queries.
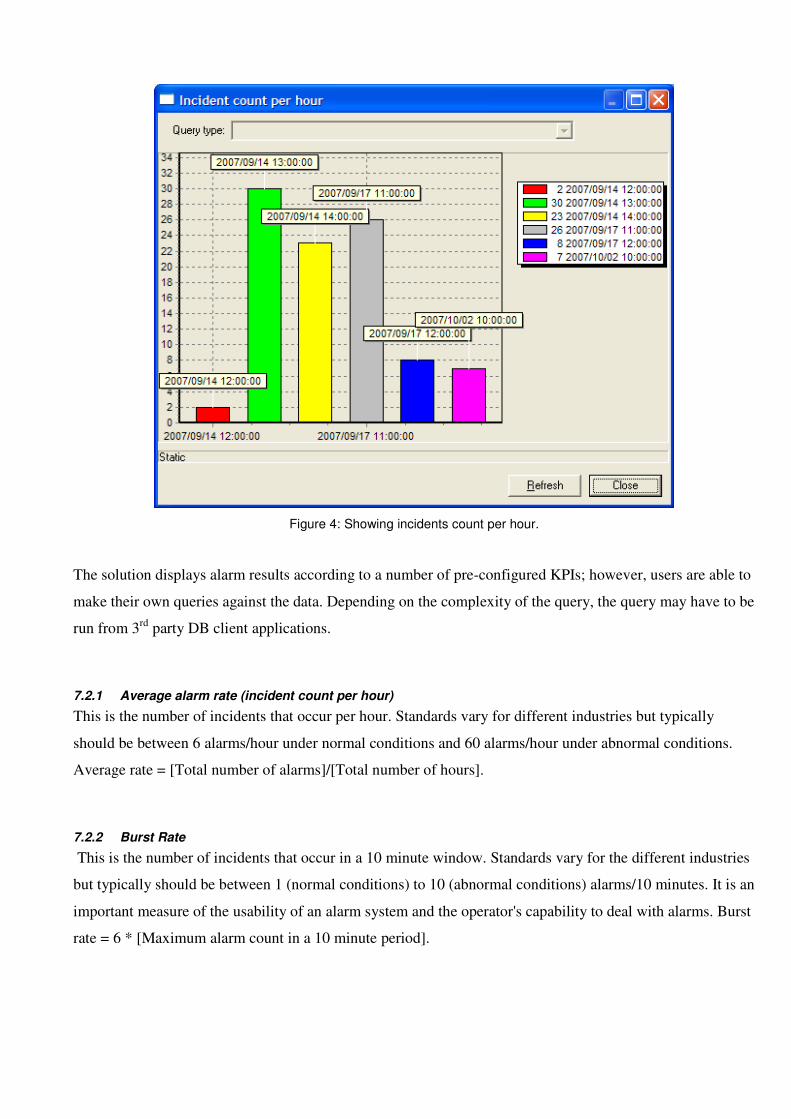
Figure 4: Showing incidents count per hour.
The solution displays alarm results according to a number of pre-configured KPIs; however, users are able to
make their own queries against the data. Depending on the complexity of the query, the query may have to be
run from 3rd party DB client applications.
7.2.1 Average alarm rate (incident count per hour)
This is the number of incidents that occur per hour. Standards vary for different industries but typically
should be between 6 alarms/hour under normal conditions and 60 alarms/hour under abnormal conditions.
Average rate = [Total number of alarms]/[Total number of hours].
7.2.2 Burst Rate
This is the number of incidents that occur in a 10 minute window. Standards vary for the different industries
but typically should be between 1 (normal conditions) to 10 (abnormal conditions) alarms/10 minutes. It is an
important measure of the usability of an alarm system and the operator's capability to deal with alarms. Burst
rate = 6 * [Maximum alarm count in a 10 minute period].

7.2.3 Percent Upset
This is the number of hours where there are more than 30 alarms per hour. It is a measurement of alarm
overload on operators. Percent upset = 100 * [Number of hours where alarms exceeds 30/hour]/[Total
number of hours]. Overloaded > 50%, Reactive 25%-50%, Stable 5%-25%, Robust 1%-5%, Predictive < 1%.
7.2.4 Priority Distribution
This is the priority distribution for alarms occurring over a period of time. Standards vary for the different
industries but typically the distribution should be 5% high priority alarms (>P3), 15% medium priority
alarms (=P3) and 80% low priority alarms (<P3)
7.2.5 Standing alarms
This is the number of current alarms at the end of an hour. Standards vary for the different industries but is
typically <=9.
7.2.6 Most Frequent alarms (count by type)
This is a view of the most frequent alarms over time. The top 20 of these alarms can account for almost 50%
of total alarm generation. If properly reviewed, you will find that most of these alarms should not be
classified as alarms at all in that they do not meet the proper criteria that define an alarm.
7.2.7 Intermittent Incidents
These are alarms that activate and deactivate within 10 seconds. If properly reviewed, you will find that most
of these alarms should not be classified as alarms at all in that they do not meet the proper criteria that define
an alarm.
7.2.8 Count by Agent
These are the number of incidents on a per agent basis.
7.2.9 Count by Operator
These are the number of incidents by operator.
7.2.10 Total active time by incident
This is the total amount of time an individual incident has been active.
7.2.11 Total unacknowledged time by incident
This is the total amount of time an individual incident has remained unacknowledged.
7.2.12 Hourly Count grouped by hour of the day
This is an indication of what time of day incidents tend to happen more frequently.
7.2.13 Hourly Count by Incident
This is the total number of individual incidents that occur per hour.
7.2.14 Daily Count
This is the total number of incidents occurring per day.
7.2.15 Average Acknowledge Time
This is the average time it takes for incidents to be acknowledged.
7.2.16 Average Acknowledge Time per Type
This is the average time it takes for individual incidents to be acknowledged categorised by alarm type.
8 Applying the technology - Two case studies We took our solution and put it on to two fairly large sites:
• PPC’s cement plant at Riebeck West
• Tata Nickel in Botswana
Both sites run large single Adroit server (redundant) systems, have in excess of 15 000 I/O, run 24-hour
operations and are fairly busy plants.
We used the experiences gained on these sites and believe that these lessons are the most valuable and the
ones we wish to share with you today.
8.1 Reality check
These are some of our initial observations from both plants, and they point to problem areas in alarm strategy
implementation that are common to most plants.
• There has to be a site champion, with strong management buy-in and commitment.
• Alarms are over-engineered. Probably as a result of what is common in most projects – a lack of
specification and understanding of alarming. People engineering the solution adopt a conservative
“alarm everything” approach. This is a similar syndrome to that when people first put in a historian –
they want to “log everything as fast as you can and we will sort it out later.” The end result is way too
much data at way too much resolution.
• The structured approach to alarm management requires months, maybe years to take a site from an
initial position like this to world class alarm management. But it is the usual 80/20 rule in that you
can get 80% of the way in 20% of the time, yielding massive improvements quickly. But it takes a
sustained approach to drive the system down to world-class positioning.
8.2 Initial implementation
We took the approach of getting the alarm system on in the rawest format in order to ascertain the “As is”
data and operation. So in both cases we spent the first day installing the Alarming System and getting the
databases installed.
We didn’t apply our minds to any categorisation or look to get complicated with the configuration. The idea
behind this was that if the system was “unstable” as defined by the KPIs then one should rather look to
address the “flooding” issue before knowing, for example that a certain area of the plant was worse than
another. Figuring that this focused strategy would come in when you were looking at the last 20% of the
system.
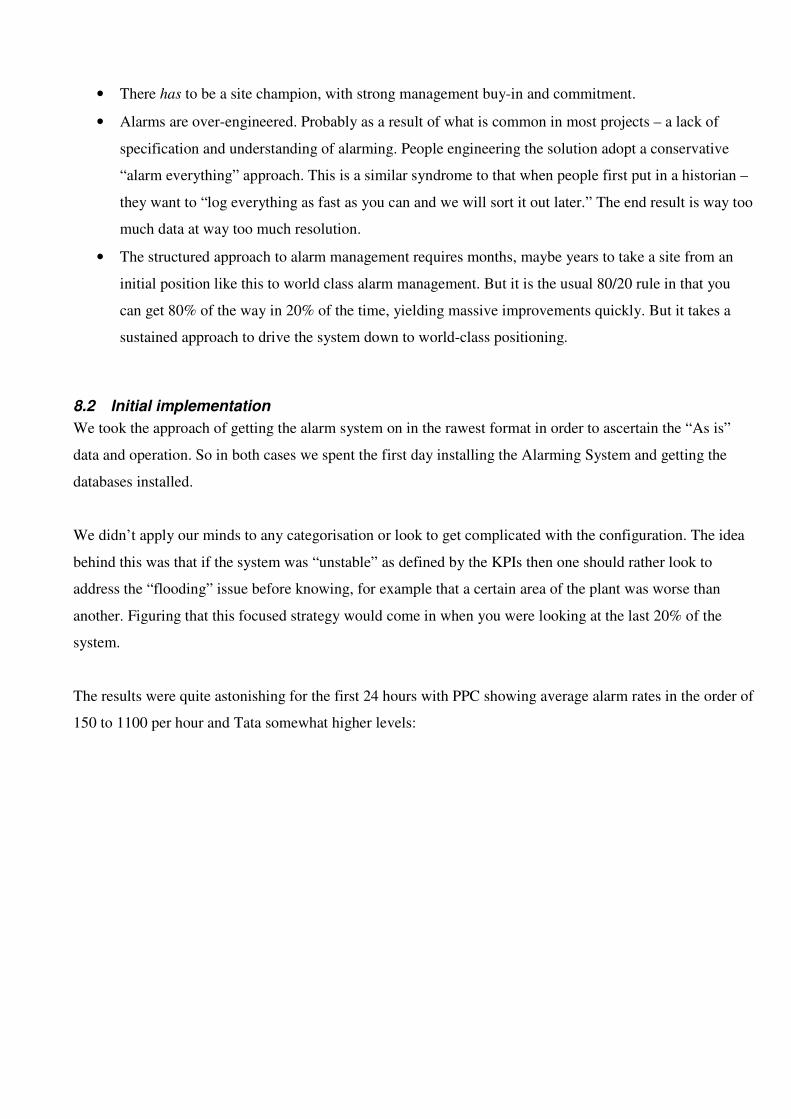
The results were quite astonishing for the first 24 hours with PPC showing average alarm rates in the order of
150 to 1100 per hour and Tata somewhat higher levels:
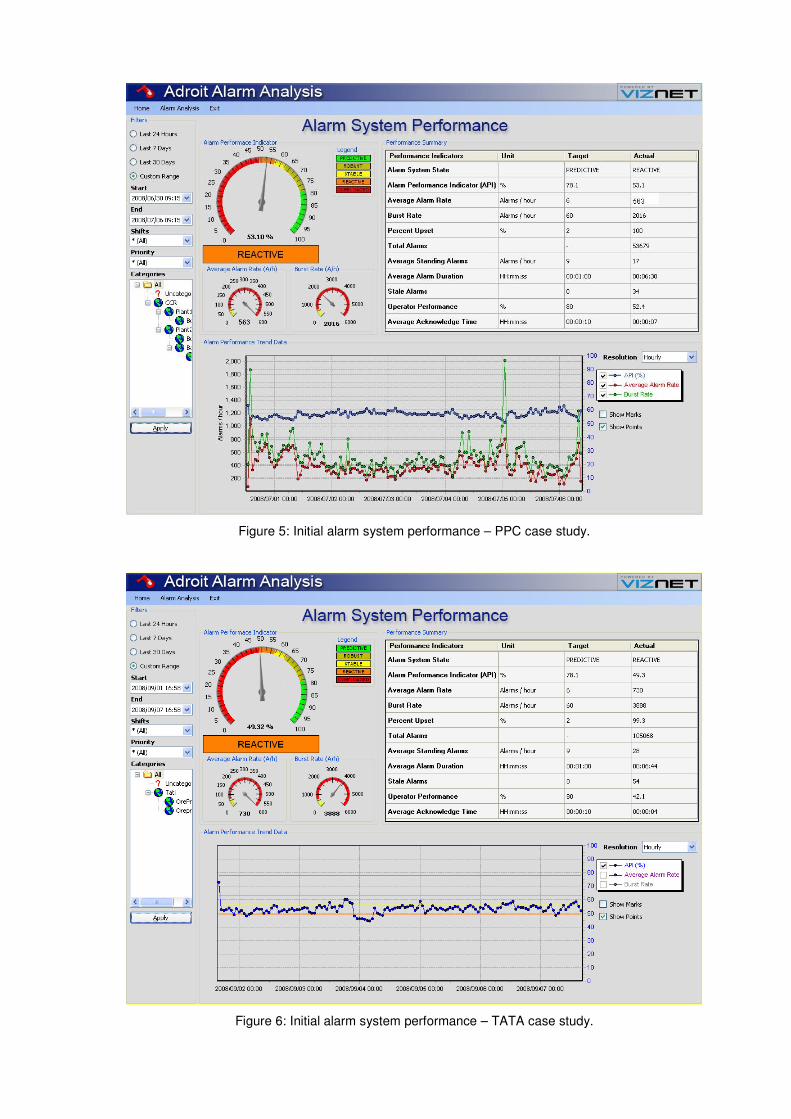
Figure 5: Initial alarm system performance – PPC case study.
Figure 6: Initial alarm system performance – TATA case study.
8.3 Tackling the “Bad actors”
Work was allocated to the PLC and SCADA guys to
address the top 10 “bad actors” and to address the
standing alarms, both of which impact quite heavily on
the system performance issues and again left for
another 24 hours.
After this exercise the alarm system performance
showed significant improvement with an improvement
in the basic measurement of incidents per hour
dropping by 35%!
8.4 A practical methodology
When an alarm strategy is first implemented on an existing plant, the initial observations are quite
overwhelming, but what is critical is to focus on the key areas that are exposed. As already stated, you can’t
focus on operator performance when your system is essentially “unstable”.
The following steps, which come from our case study experiences, can act as a guideline and it is critical to
remember that this is a journey that may take years to accomplish.
Focus on the low hanging fruit:
• Identify the top 10 protagonists – Top ten by count and Top ten by duration. You will find that
between them there are common problems.
• Identify and remove redundant alarms
• Identify and remove chattering alarms (short duration)
As your balance swings towards a more controllable situation you can then start looking at your own
situation and changing the targets accordingly. After you have gotten down to an acceptable alarm system
performance then look to start categorising alarms, adding in the Operator names in order to then allow you
to start focusing on the last 20%.
The continuing nature of such a program will see you then adding in supporting documentation like Standard
Operating Procedures (SOP) to support your operators.
“In the first 24 hours of running the
Adroit Alarm Management module, we
managed to decrease the average
incidents from around 500 incidents per
hour to 300 per hour.”
Danie Sadie from SAdkons, consulting for
a large cement producer in the Western
Cape

Regularly revisit your targets and continually review the performance of your alarms until you reach world-
class status.
8.5 Case study conclusions
This is a continuous program; there are no quick fixes or short cuts. There has to be complete buy-in from all
levels within the organisation. Allowances and budgets have to be allocated and made available. The rewards
will come.
You are not alone in this quest; 90% of all industrial control solutions are at the same point as you.
For more information contact Dave Wibberley, Adroit Technologies, +27 (0)11 658 8100,
[email protected], www.adroit.co.za
About the author
Dave Wibberley is the Managing Director of Adroit Technologies – the largest developer of SCADA
systems in Africa. He holds a BSc Mech. Eng. and a GDE in Industrial Engineering.