
H Jeremy Bockholt Ronald Pierson Vincent Magnotta Nancy C Andreasen
Upload
daniel-batista-galvaoCategory
view
1.234download
3description


01Andreasen/FM 8/11/02 3:02 PM Page i

Marketing Research That Won’t Break the Bank
01Andreasen/FM 8/11/02 3:02 PM Page iii

Marketing ResearchThat Won’t
Break the BankA Practical Guide to Getting
the Information You Need
Alan R. Andreasen
Foreword by William A. Smith
The Second Edition of Cheap But GoodMarketing Research
Prepared with the assistance of the Academy for Educational Development
01Andreasen/FM 8/11/02 3:02 PM Page v

Copyright © 2002 by Alan R. Andreasen.
Published by Jossey-BassA Wiley Imprint989 Market Street, San Francisco, CA 94103-1741 www.josseybass.com
No part of this publication may be reproduced, stored in a retrieval system, or transmitted in anyform or by any means, electronic, mechanical, photocopying, recording, scanning, or otherwise,except as permitted under Section 107 or 108 of the 1976 United States Copyright Act, withouteither the prior written permission of the Publisher, or authorization through payment of theappropriate per-copy fee to the Copyright Clearance Center, Inc., 222 Rosewood Drive, Danvers,MA 01923, (978) 750-8400, fax (978) 750-4470, or on the web at www.copyright.com. Requests tothe Publisher for permission should be addressed to the Permissions Department, John Wiley &Sons, Inc., 111 River Street, Hoboken, NJ 07030, (201) 748-6011, fax (201) 748-6008, e-mail:[email protected].
Jossey-Bass books and products are available through most bookstores. To contact Jossey-Bassdirectly call our Customer Care Department within the U.S. at 800-956-7739, outside the U.S. at (317) 572-3986 or fax (317) 572-4002.
Jossey-Bass also publishes its books in a variety of electronic formats. Some content that appears inprint may not be available in electronic books.
Library of Congress Cataloging-in-Publication Data:Andreasen, Alan R., date.
Marketing research that won’t break the bank: a practical guide to getting the information you need/Alan R. Andreasen; foreword by William A. Smith.—1st ed.
p. cm.—(The Jossey-Bass nonprofit and public management series)Includes bibliographical references and index.ISBN 0-7879-6419-0 (alk. paper)1. Marketing research. I. Title. II. Series.HF5415.2 .A486 2002658.8'3—dc21
2002010335
Printed in the United States of AmericaFIRST EDITION
HB Printing 10 9 8 7 6 5 4 3 2 1
01Andreasen/FM 8/11/02 3:02 PM Page vi

The Jossey-Bass
Nonprofit and Public Management Series
01Andreasen/FM 8/11/02 3:02 PM Page vii

Contents
ForewordWilliam A. Smith xiii
Preface xvii
Acknowledgments xxiii
The Author xxv
Part One: Planning a Low-Cost Research Program
1. Myths of Marketing Research 3Research Priests and the Low-Budget Manager • MovingForward • Organization of the Book • Concluding Comments
2. Planning a Research Program 17Framing the Research Problem • Looking for Opportunity• Research Planning • Serendipitous Research: RecognizingResearch Opportunities as You Go • The Decision Opportunity
3. Evaluating Individual Research Projects 43Setting Budgets • Decision-Based Research Budgeting• When to Resist Research
ix
01Andreasen/FM 8/11/02 3:02 PM Page ix

4. Backward Marketing Research 60How Research Goes Wrong • Turning the Process on Its Head• Conclusion
Part Two: Alternative Low-Cost Research Techniques
5. Using Available Data 75Archives • Internal Archives • External Archives• Conclusion
6. Systematic Observation 107Collecting Natural Observations • Controlling the Quality of Natural Observations
7. Low-Cost Experimentation 119Experimental Design • Types of Experiments • Conclusion
8. Low-Cost Survey Designs 142Survey Design • Low-Cost Sampling • Other Alternatives for Asking Questions
Part Three: Making Low-Cost Research Good Research
9. Producing Valid Data 181Nonquestion Sources of Error • Asking Questions• Questionnaire Design
10. All the Statistics You Need to Know (Initially) 198Fear of Statistics • Input Data • Descriptive Statistics• Statistical Analysis • Other Multivariate Techniques
Part Four: Organizing Low-Cost Research
11. Organization and Implementation on a Shoestring 235Financial Assistance • Acquiring Knowledge • AcquiringPersonnel • Acquiring Equipment
x CONTENTS
01Andreasen/FM 8/11/02 3:02 PM Page x

Notes 261
Recommended Reading 265
Index 269
CONTENTS xi
01Andreasen/FM 8/11/02 3:02 PM Page xi

For Seymour Sudman (in memoriam) and Jean Manning
01Andreasen/FM 8/11/02 3:02 PM Page xii

Foreword
Managers in a wide range of organizations with limited bud-gets face daunting challenges in competitive marketplaces. Theirtraining and experience make it clear to them that to be successful,their strategies and tactics must emerge from a clear, in-depth under-standing of their target markets, their competitors, and the environ-ment in which they all operate. Yet these managers lack the resourcesto routinely hire the best researchers, contract for the latest data-bases and information services, or staff a large research department.
This is true of thousands of managers in the private sector—thestart-up innovator, the niche marketer, the neighborhood entrepre-neur. It is even truer in the nonprofit world, where budgets for almosteveryone are very limited but where managers have immense chal-lenges set for them or that they set for themselves.
This book is designed to help such managers increase their effec-tiveness through the creative and judicious use of low-cost sourcesof information. It provides insight on how to use the Web, do low-cost surveys and focus groups, be clever at observing customers andcompetitors, use simple experiments to test tactics and strategies,and create internal records that yield maximum creative insight.
This book is valuable also for the frameworks it offers to helpmanagers with limited budgets in two other ways. First, it helpsthose who may be reluctant to entertain the idea of conducting a
xiii
02Andreasen/Foreword 8/11/02 3:03 PM Page xiii
xiv FOREWORD
significant amount of research by addressing head-on the mythsthat may be unnecessarily holding them back. It confronts suchmisconceptions as “research is only for big decisions” or “most re-search is a waste” or, the most important myth, “market research istoo expensive.” The simple truths that put the lie to these myths goa long way toward helping the reluctant investigator move out ofthe marketplace fog to crisp, clear insights into what is transpiringwith key target groups, major competitors, regulators, and otherswhose perceptions, attitudes, actions, and future plans will havemajor impact on the marketer’s success.
The second source of help is what the author calls backwardmarketing research. This simple concept has been proved to reducethe waste and increase the impact of research significantly in a widerange of organizations, including some very large ones, such as theDDB Needham advertising agency. It starts with a simple premise:if research does not help managers make decisions, it is not usefuland a waste of resources (including the manager’s time). The properapproach, the author argues, is to spend a significant amount oftime thinking about how the research will be used to help the man-ager choose among options and that this should be done long beforeany attempt is made to collect data. This strict regimen requires themanager and the research supplier (someone in the manager’s ownorganization or an outside supplier) to spend significant time think-ing about what is to be done with the data. This conversation leadsto a rough outline of the final report and then to decisions about datarequirements, possible analysis options, and the presentation format.Only then do questions about how to get the information arise. Theresult of this careful preplanning process is that when the report ar-rives, the manager is primed and eager to act on what he or she hasalready been anticipating.
Thus, this book is not only a primer on how to do research whenone has limited resources; it is also a guidebook to how to organizeand implement that process in ways that will maximize its value.Great managers thrive on information and insight. If you havefewer dollars and less staff than the corporate and nonprofit giants
02Andreasen/Foreword 8/11/02 3:03 PM Page xiv

does not mean that you must act on instinct. The tools are here. Theapproach is here. It takes only commitment and diligence to turnmarketplace fog into acute perceptions that make managerial choicesgrounded, inevitable, and effective.
July 2002 William A. SmithAcademy for Educational Development
Washington, D.C.
FOREWORD xv
02Andreasen/Foreword 8/11/02 3:03 PM Page xv

Preface
This book is designed for managers who want to do marketingresearch but think they cannot afford it. It shows them how to getthe information they need to be a better manager and how to do itat low cost.
The basic message of the book is that research need not be ex-pensive, overly complex, or highly statistical to be extremely help-ful to managers in a wide range of organizations. The marketingresearch community is sometimes guilty of making the researchprocess seem so subtle and complicated that it scares off too manypeople who could make valuable use of low-cost techniques. Any-one can do perfectly decent and useful research without fancy prob-ability samples, complex questionnaires, highly trained interviewers,or the latest in computerized statistical software. This book tells howand gets motivated readers started.
I believe there is a true need for this kind of treatment. Con-ventional textbooks give only passing reference to the potential ofmany useful low-cost techniques and seem barely interested in theproblems of those who are not working in large corporations or ma-jor marketing research agencies. And although there are a few bookson practical marketing research techniques, they tend to be how-to-do-it manuals primarily for those who want to do field surveys.
This book, then, is a heartfelt response to the cries for help Ihave heard from practicing and would-be marketing managers of
xvii
03Andreasen/Preface 8/11/02 3:03 PM Page xvii

xviii PREFACE
small and medium-sized organizations in the business, government,and nonprofit sectors—a group I call low-budget researchers. Forthem, the pages that follow are designed to achieve four basic ob-jectives:
1. Demythologize marketing research and do away with miscon-ceptions that keep too many managers from doing any kind of marketing research
2. Offer a basic approach that will ensure that any research thatis done is needed and useful to the managers for whom it is designed
3. Describe in a systematic fashion a wide variety of specific research techniques that are low cost and, if carried out withcare and appropriate attention to issues of bias, can providemanagement with crucial market insights to improve market-ing decision making
4. Motivate readers to get started—to begin to do the researchoutlined here and see how it can lead to better and better decisions
This book is also written for students. The techniques discussedtypically take up only a brief chapter or so of most basic marketing re-search texts. The treatment is usually cursory, and one senses thatmany textbook writers see these topics as preliminary approaches be-fore getting on to a really serious study: the major field study or thecomplex experiment. They seldom recognize that many of the stu-dents who read such books or take marketing research courses will goon to hold jobs or to advise organizations where they will be able tocarry out only low-cost studies. This book is also addressed to thesefuture managers and advisers and to those who would teach them.
Outline of the Book
Consonant with its twin objectives of motivating and tutoring, thebook is divided into four parts. The first and last parts focus on thelarger issues of getting started, adopting appropriate philosophies,
03Andreasen/Preface 8/11/02 3:03 PM Page xviii

and setting up the appropriate organization and systems to ensurethe gathering of both low-cost and useful marketing research. Themiddle two parts deal more with the nitty-gritty of specific low-costresearch techniques.
Part One is concerned with getting off on the right foot. Thismay mean sweeping aside some inhibiting misconceptions about re-search that many people have harbored over the years—for exam-ple, that good research is inevitably expensive, that research mustalways involve fancy sampling techniques, complex statistics, andelaborate computer programs, and that too much research is acad-emic and off-target and therefore of little use to busy, budget-minded managers. Chapter One indicates why these myths areincorrect. Chapter Two then turns to problems of deciding how toset up a marketing research program, that is, how to recognize needsand opportunities for research within individual organizations andhow to set in motion both individual studies and a long-term pro-gram of information development. The chapter emphasizes theneed to be systematic about the task of developing a program oflow-cost research and offers a general procedure for doing so.
Chapter Three continues the discussion of planning by offeringan approach to the crucial decision of specifically when it is justi-fied to do research and how much to spend on it. The chapter in-troduces both formal and rule-of-thumb approaches to the task ofestimating the cost and value of research.
Chapter Four tackles what is perhaps the most important issue inlow-cost research: how to make sure that every dollar spent on mar-keting research yields information that is unquestionably useful tomanagers. The chapter outlines a specific procedure, backward re-search design, that can help both beginning and more experienced re-searchers achieve the elusive goal of maximal managerial usefulness.
Part Two turns to detailing the major alternative approaches togathering low-cost data for marketing decisions. These chapterscover uses of existing internal and external archives including theInternet (Chapter Five), systematic observation (Chapter Six), low-cost experimentation (Chapter Seven), and low-cost survey design(Chapter Eight).
PREFACE xix
03Andreasen/Preface 8/11/02 3:03 PM Page xix

xx PREFACE
Part Three takes up issues of quality. For research to be helpfulto managers on limited budgets, it needs to be not only low cost butgood. For the research to be good, the researcher must ensure thatthe data are valid and that the conclusions reached are valid. In asense, the researcher must ensure that there is not “garbage in/garbage out.” Chapter Nine deals with the problems of achievingvalid measurements, particularly when asking questions in field sur-veys. Chapter Ten then discusses the often dreaded topic of statis-tics from the standpoint of its role in making sure that the output ofa study properly summarizes the major findings, reports only thosedifferences and relationships that are truly present, and milks themost information out of the data. The treatment here is common-sensical and not highly quantitative.
Researchers with low budgets could obviously use as much low-cost help as they can get. Thus the final chapter, Chapter Eleven,focuses on the problems of acquiring the financial, physical, intel-lectual, and human resources needed to carry out low-cost researchprojects. The chapter offers a number of approaches to using librar-ies, colleges, advertising agencies, and commercial research servicesby researchers with very restricted budgets.
What the Book Is Not
Before leaving the reader to plunge into the exciting possibilities ofthe world of marketing research that will not break the bank, it isimportant to keep one’s expectations within reason. This is not a basic marketing research text or a detailed handbook of low-costtechniques. A number of the traditional subjects that one ought tothink about to be a really accomplished, sophisticated marketing re-searcher are not covered here.
The reader will not find in these pages detailed suggestions onhow to design a questionnaire, or how to word questions, or how todraw a probability sample. The more routine aspects of research ad-ministration, data reduction, data analysis, and report writing arealso absent.
03Andreasen/Preface 8/11/02 3:03 PM Page xx

This is a book about a particular, neglected subset of all mar-keting research. It chooses not to dwell on what other authors coverwell but on what they do not. I hope that readers find that this bookprovides the raw material and the incentive to begin an innovativeprogram of market research that, even though constrained by lim-ited resources, will prove a significant boon to the organization andto the manager wanting to make more informed and less risky mar-keting decisions.
July 2002 Alan R. AndreasenGeorgetown University
Washington, D.C.
PREFACE xxi
03Andreasen/Preface 8/11/02 3:03 PM Page xxi

Acknowledgments
This book is a revision and updating of a volume first publishedby Dow Jones-Irwin in 1988. The book was out of print until twoyears ago, when colleagues encouraged me to update it. Bill Smith of the Academy for Educational Development was instrumental inlaunching the project. However, without the exceptional—nay,heroic—work of his assistant, Olivia Marinescu, in preparing the man-uscript, the task would have been impossible, and you would not havethis edition before you. She worked from original preparation carriedout by the support staff that I had at the University of California atLos Angeles in the mid-1980s and editing by Dow Jones-Irwin.
The original book was suggested by Bill Matassoni, then ofMcKinsey & Company, and benefited from a wide range of inputsfrom both practitioners and scholars. They have been followed bymany others who have contributed to my education in this specialdomain. Among those deserving of special thanks are Bill Smith,Bill Novelli of the AARP, Bill Wells formerly of DDB Needhamand more recently the University of Minnesota, Craig Lefebvre ofthe Prospect Center, Susan Middlestadt of the Academy for Edu-cational Development, and academic colleagues, including MichaelRothschild, Martin Fishbein, Bob Hornik, Paul Bloom, James Pro-chaska, Philip Kotler, Russell Belk, and Marvin Goldberg. Specialthanks must go to my former colleague, the late Seymour Sudmanof the University of Illinois. Seymour taught me a great deal of what
xxiii
04Andreasen/Acknowl 8/11/02 3:04 PM Page xxiii

xxiv ACKNOWLEDGMENTS
I think I know about field research over the years and provided mewith several opportunities to test and improve those skills. He alsogave the original manuscript a careful reading and offered manyvaluable suggestions.
The original book and this revision would not have appearedwithout the encouragement and contributions of my wife, Jean Man-ning. Jean provided many of the ideas contained here and through-out has been supportive and a constant inspiration.
A.R.A.
04Andreasen/Acknowl 8/11/02 3:04 PM Page xxiv

The Author
Alan R. Andreasen is professor of marketing at the McDonoughSchool of Business at Georgetown University and executive direc-tor of the Social Marketing Institute. He is the author or editor of fif-teen books and numerous monographs and reports. His most recentbooks are Ethics and Social Marketing (2001), Strategic Marketing inNonprofit Organizations (6th ed.), coauthored with Philip Kotler(2003), and Marketing Social Change (Jossey-Bass, 1995). He haspublished over one hundred articles and conference papers on avariety of topics and serves on the editorial boards of several majorjournals. He is a past president of the Association for ConsumerResearch.
xxv
05Andreasen/Author 8/11/02 3:04 PM Page xxv

PART ONE
Planning a Low-Cost Research Program
07Andreasen/Part 1 8/11/02 3:04 PM Page 1

1Myths of Marketing Research
Successful marketers are knowledgeable marketers. The worldhas many intuitively brilliant and sometimes lucky marketers, butthe most successful marketers I know are the best informed. Theyknow their target audiences, know their partners, and know whichmarketing tactics work and which ones don’t. They know what theircompetitors are doing almost as soon as they do it. Most impor-tant, they are aware of what they don’t know and resolve to find itout. They crave information. They devour it on the job and off thejob. They always want to know more, and when they acquire newinformation, they use it effectively.
Other managers intuitively know this. They know they needmore information and ought to be doing marketing research in or-der to be better marketers. Managers in large enterprises have accessto many types of information services and usually a healthy budgetfor their own research. Managers in small and medium-sized organi-zations in all three sectors—business, nonprofit, and government—do not have such opportunities. They say:
“We know we need marketing information to be goodmarketers, but how can we undertake it when we havevirtually no budgets?”
3
08Andreasen/Ch. 1 8/11/02 3:05 PM Page 3

4 MARKETING RESEARCH THAT WON’T BREAK THE BANK
“If I did have the money to do research, how can I do itwhen I really don’t know much about statistics andsampling and computers?”
“How dare I risk limited resources, not to mention mycredibility with my boss, by doing research that I’m toldall too often turns out to be a waste of time and effort?”
“If I decide to go ahead, how can I work effectively with a market research professional when I don’t really knowwhat I want, what the researcher can do for me, or how I can tell good research from bad when it gets done?”
This book responds to these cries for help. It is a book aboutlow-cost marketing research designed for both present and futuremarketing practitioners with limited research budgets and limitedexperience in carrying out specific research studies or extensive re-search programs. It offers a rich catalogue of techniques for keepingcosts down while maintaining acceptable, and sometimes high,standards of quality. The book’s ultimate goal is to make those whouse these techniques better managers through timely acquisition ofrelevant, useful marketing information.
The book is not simply a guide for carrying out a specific set oflow-cost research approaches. It also is designed to motivate readersto become active researchers, to take the first steps toward becomingfrequent, savvy beneficiaries of the rich possibilities of research. Twobarriers keep managers from being active researchers. First, wrongnotions about research keep many from even thinking about thetopic. Second, many managers simply aren’t aware of the wide arrayof simple, low-cost marketing research techniques that are available.
This book tackles both issues by confronting the myths and out-lining step-by-step procedures for setting up a research program andcarrying out specific, useful studies. It also describes in detail manytechniques for doing low-cost but high-quality research.
We begin by tackling some of the myths that are keeping manymanagers (consciously or unconsciously) from considering or un-dertaking marketing research.
08Andreasen/Ch. 1 8/11/02 3:05 PM Page 4

Research Priests and the Low-Budget Manager
Many managers with limited research experience hold mispercep-tions about marketing research. These misperceptions can be tracedto the marketing research community, which has created a forbid-ding mystique about its own profession and its products. Marketingresearchers have developed their own jargon, their own reverencefor the most sophisticated approaches, and their own propagandathat implies that only those who are properly trained—the researchpriests—can conduct valid, reliable marketing research.
In some cases, they are correct. Professionals should be the primesources of research on such sensitive topics as drugs and sex or ofresearch designed to tap complex or deeply rooted mental pro-cesses. Professionals must also be used when results have to be projected with a high degree of accuracy to a general populationbase or to some distant future period. They must also be used wherethe research is likely to be subject to close outside scrutiny, for ex-ample, by the government or the courts. And when a lot is ridingon the outcome of a decision or set of decisions that must be basedon research, paying for the very best professional work is clearlyjustified.
But many, many marketing decisions could benefit significantlyfrom marketing research that would not involve a high level of so-phistication or expenditure levels that mortgage the organization’sfuture. There are a great many research alternatives that can easilybe designed and implemented by any minimally knowledgeablemanager or his or her staff. This book is designed to encourage andinstruct these people to try their hand at marketing research. It is de-signed to give the neophyte manager-researcher the basic knowl-edge necessary to permit frequent and sensible use of a wide rangeof low-cost marketing research tools.
Many managers are intimidated about carrying out their ownmarketing research because of myths that have developed over theyears. If this book is really to be helpful to its readers, we must firstbring these myths into the open and confront them directly.
MYTHS OF MARKETING RESEARCH 5
08Andreasen/Ch. 1 8/11/02 3:05 PM Page 5

6 MARKETING RESEARCH THAT WON’T BREAK THE BANK
Myth 1: “I’m Already Doing Enough Research”
Many managers believe they already have enough marketing re-search information as a by-product of their organization’s account-ing and control activities. They point to stacks of performance data,profitability analyses, and so forth as proof of their contention. Al-though such information may be useful as research, the odds arevery good that it is both too much and too little. The problem typ-ically is that no one has ever really sat down and tried to specify justwhat kind of information the manager should have for day-to-daymarketing decisions or long-range strategic planning. Thus, themanager is offered only what is available and often in overwhelm-ing abundance. Too much of the wrong kind of data can swampwhat is really important. The manager is often left to find the pro-verbial needle in the haystack.
Data overkill, by its sheer bulk, can intimidate many managersfrom looking for these needles, while at the same time convincingthem that the company is already doing enough marketing re-search. Certainly the prospect of going into the field and generat-ing even more new and different data will seem highly unpalatableto the overwhelmed manager.
And, of course, the available data may also be too little. As longas the manager keeps making decisions that could have been sig-nificantly helped by a few modest additional research projects, wemust conclude that the existing information is clearly inadequate.It is Gresham’s Law applied to marketing research: bad data driveout good data. An overabundance of useless data is bound to quashany modest ambitions to collect more.
The only way to deal with the problem of data overkill is to sys-tematically identify the organization’s long-run research needs andask whether existing data meet these needs. In most cases, they willnot, and the researcher will have to build a research program tomeet those needs and find ways of turning off the supply of useless,inhibiting data. Simply hoping that existing data will be adequateis not enough. If existing data are not carefully designed to help
08Andreasen/Ch. 1 8/11/02 3:05 PM Page 6

make both short- and long-term decisions, they are probably just ac-counting or output data and should not be classified as research.
Myth 2: “Research Is Only for Big Decisions”
Many managers in small businesses or nonprofit organizations suf-fer from misplaced modesty. They feel that their decisions are smallpotatoes compared to those of Procter & Gamble or General Mo-tors. They feel they cannot justify the level of expenditures theythink any serious marketing research undertaking will require. Thiskind of thinking has two major flaws. First, there are many circum-stances in both small and large companies where relatively trivialdecisions can be significantly improved by a little bit of marketingresearch and where the research is well worth doing because of itsmodest cost.
Second, despite what many managers think, there are many sit-uations, even in very large organizations, where marketing researchis not justified, even though substantial amounts of resources are atrisk. The reason a lot of big decisions do not require research expen-ditures is that management already has little uncertainty about whatto do. By contrast, as we will see in Chapter Three, it is in caseswhere managers simply do not know which way to turn (even wherethe stakes are relatively modest) that research can be most helpful.The dollars at risk will, of course, determine the upper limit of theresearch budget, and therefore, other things equal, bigger decisionswill permit more research. But even where relatively modest amountsare involved, if the situation is one of high uncertainty as to what todo, there is usually some level of research expenditure that a man-ager should accept because it is very likely to tip the balance one wayor another.
In many situations with large amounts of money at risk, man-agers will order research even though it is not justified rationally.Managers often want to feel better about a major decision they areabout to make. They may want backup in case the decision is laterquestioned. In both cases, the manager should recognize that funds
MYTHS OF MARKETING RESEARCH 7
08Andreasen/Ch. 1 8/11/02 3:05 PM Page 7

allocated to unjustified self-protection are funds that probablyshould be used to provide information in other contexts that nowrequire management by the seat of the pants.
Myth 3: “Losing Control”
The lost-control myth in part reflects the deeply rooted perceptionsof many managers that marketing research is really some arcane re-ligion to which only a very few priests are admitted. They believethat they cannot acquire the level of sophistication needed to dothe research alone or specify what research needs to be bought fromoutside sources. If managers feel they must go outside for any re-search, many will refrain from going ahead because they feel thatthey dare not rely on others to gather and analyze data about theirdecisions. They feel they will have committed a part of their or-ganization’s destiny to an outsider who may or may not understandthe situation or the realities of its unique political and market en-vironment. In a sense, the managers feel they have lost control.
This would explain why many managers who recognize possi-bilities for research do not simply hire smart M.B.A.s to do in-housestudies or hire outside contractors to fill in critical information gaps.The manager fears losing control. If new information is allowed tobecome important to decision making and only certain people (notthe manager) have access to this specialized information, then they,not the manager, may really have the control. The manager will bebeholden to them.
This fear keeps managers from engaging in research and thenfrom using the results of research when it is (grudgingly) carried out.This is especially the case if the research results run counter to themanager’s own views. Most of us are reluctant to accept new infor-mation, and the problem is significantly exaggerated when man-agers feel that agreeing with unexpected research results and actingon them means giving up real control of their function.
Understandably, this fear of loss of control is a particular prob-lem for middle managers and those in small or nonprofit businesses.
8 MARKETING RESEARCH THAT WON’T BREAK THE BANK
08Andreasen/Ch. 1 8/11/02 3:05 PM Page 8

Personal survival is very important to them, and they often feel theydare not give others the control of their personal organizational fate.
They may also feel that the entire organization is at risk. Orga-nizational fragility is a real and understandable concern of smallbusinesses. If one believes that research is hard to understand andrequires a translation to be used effectively, certainly one will be re-luctant to delegate one’s very livelihood to outside specialists. Theoutside researcher may not work as hard on the project or on theanalysis and interpretation as the manager would like. Worse still,busy outsiders may unwittingly bias the results, understate or ne-glect key issues, or suppress important reservations.
Finally, many managers worry that outside researchers will beon some theoretical or academic plateau far above the practical re-alities facing the organization. This will be especially so if the man-ager has glanced recently at specialized journals in the marketingresearch field with their articles talking of “part-worths” “canonicalcoefficients,” “Cronbach’s Alpha,” or “Durbin-Watson statistics.”
These fears are not easily reduced. However, this book is de-signed to make the manager a more savvy research user, one whoknows when to hire outsiders and when to go it alone. It introducesa number of very good but not fancy research techniques that thecautious manager can order from outside or do in-house withoutfear of being unknowledgeable or unprepared. Should the managerhave to go outside, the book also describes (in Chapter Four) an ex-cellent technique that can ensure that what is done is on target andhighly useful.
Myth 4: “Market Research Is Survey Research”
Just as many nonmarketing people tend to think that marketing isjust advertising, so do many managers tend to think of survey re-search and marketing research as being virtually the same thing.There is a great range of research techniques that use simple obser-vation, archival analysis, and low-cost experimentation rather thansurveys.
MYTHS OF MARKETING RESEARCH 9
08Andreasen/Ch. 1 8/11/02 3:05 PM Page 9

Myth 5: “Market Research Is Too Expensive”
This is the major straw-man myth that this book is designed toknock down. It exists, in part, because of myth 4. If one equates mar-keting research with surveys with their large samples, substantialfield costs, complicated computer analyses, and so on, it is inevitableto assume that research has to be expensive. Surveys based on care-ful probability sampling are expensive, but there are many alterna-tives to survey research that can adequately meet management’sinformation needs at low cost. Furthermore, there are many ways inwhich the cost of survey research itself can be significantly reduced.
Myth 6: “Most Research Is a Waste”
Research can turn out to be wasteful for many reasons. This book isexpressly designed to make sure managers avoid such a fate.
There can be many culprits behind wasted research. Sometimesresearch is wasted because the manager has personal motives for noteffectively using the research after it is done. Inexperience, timepressure, or relying too much on the research supplier can also leadto miscommunication that will virtually ensure that the researchcannot be useful.
Often the researcher is an equally guilty culprit. Some researchspecialists keep a distance from management simply to protect theirown special status. Sometimes the researcher, whether by trainingor inclination, is not adequately concerned about making the re-search project managerially relevant. This is especially commonamong academics and freshly graduated Ph.D.s. The researcher maybe so caught up in the world of research sophistication that he orshe may not really understand, or may have strange ideas about,managerial relevance. It is not uncommon to hear researchers talkabout the quality of the design itself or the statistical significance ofthe results as the true test of whether research was good, rather thanhow relevant it was to the manager who asked for it.
Finally, the problem may simply not be the fault of anybody orcaused by a lack of trying. In many cases where both sides really
10 MARKETING RESEARCH THAT WON’T BREAK THE BANK
08Andreasen/Ch. 1 8/11/02 3:05 PM Page 10

want to make the research managerially useful, the parties do nothave a procedure that can make a piece of research manageriallyrelevant and useful. Chapter Four specifically sets out a procedurethat can go a long way toward ensuring a productive manager-researcher collaboration.
Moving Forward
Low-budget managers should not be put off from doing research forany of the following reasons:
• They think they already have enough data; almost always,they don’t. I suggest a procedure in Chapter Two for determin-ing what information they really need.
• They don’t face enough big decisions. Research is not only for big decisions, and sometimes big decisions do not need it.In Chapter Three, I explain how to determine when to do research and when not to.
• They fear loss of control of their destinies because they are not sophisticated enough to be good research users. But mostof the research discussed in this book requires only commonsense. Even the discussion of analysis techniques and statisticsin Chapter Ten is in simple terms.
• They think research is simply conducting surveys and surveysare expensive. But as I demonstrate in the later chapters, all research is not surveys, and even surveys can be done inexpensively.
• They fear it will be a waste of time and resources. Researchcan be a waste, but it need not be, especially if the approachoutlined in Chapter Four is carefully followed.
Research is essential for management success. Probably nowhereis this more obvious than when an organization is planning a newventure. In such cases, too many managers enamored over an idea
MYTHS OF MARKETING RESEARCH 11
08Andreasen/Ch. 1 8/11/02 3:05 PM Page 11

that can’t miss neglect to do the simplest basic research. For exam-ple, Polygon, a New York software company, developed a new prod-uct, Easy Path, that would increase the efficiency of hard drives.Despite the product’s relatively low cost and obvious usefulness,Polygon neglected to find out whether information technology pro-fessionals knew they had a need or problem that the software couldaddress. It turned out they were unwilling to pay $99 for somethingthat wasn’t apparently needed. For its next product launch, Poly-gon decided to spend $20,000 on marketing research.1
Even those who believe research may be valuable in launchinga new venture may still not embrace it enthusiastically. Take thecase of an entrepreneur who had developed a new coated-peanutsnack food and hired a researcher to help with initial marketing de-cisions. But he was “very suspicious of the whole thing. It all seemedlike a lot of talk.” Yet when the researcher got the entrepreneur di-rectly involved in the research process (an approach we advocatefervently), he became a believer. He was recruited to survey his pa-trons himself and found a large number of unexpected comments,including one likening the product to dog food. He subsequently reformulated the product and used research to decide on a distri-bution channel (supermarkets were not a good idea as this wouldrequire major advertising to build brand recognition), the most ef-fective packaging (stackable bags), and the price ($3.25 for an eight-ounce bag). Despite a considerable outlay, the entrepreneur felt thatthe research ultimately “changed my mind about how to sell theproduct.”2
This perception is now much more widely shared. Research onnew ventures such as this is deemed so crucial that venture capital-ists typically no longer consider proposals that are not backed bysolid market research.
This book is designed to make not only willing but eager usersout of all those attempting new ventures, whether they are prod-ucts, services, social change campaigns, or new ways to raise funds.It is also for managers in organizations with simpler decisions, suchas whether to change an offering, revise a Web site, raise or lower a
12 MARKETING RESEARCH THAT WON’T BREAK THE BANK
08Andreasen/Ch. 1 8/11/02 3:05 PM Page 12

price, or run with a new communications theme for an existing ven-ture. Research is essential in most of these cases. In a surprising num-ber of cases, it is not only essential but also affordable. The pages thatfollow will make that point crystal clear.
Organization of the Book
I assume that readers are at least willing to suspend major reservationsabout the prospect of doing more research and want to move ahead.
This book shows readers how to decide when to use marketingresearch even when the budget is small and the stakes are not veryhigh; describes an approach that can ensure that research that is undertaken is as useful as possible; and describes and evaluates arepresentative range of techniques for carrying out relatively inex-pensive research that is still of high quality—or at least of a qualitylevel commensurate with the decisions management faces.
The next two chapters address two sides of the issue of when todo research. First, we consider the opportunity for research. Manymanagers do not see the myriad chances for conducting relativelysimple investigations that would significantly improve their decision-making capabilities. They just don’t “think research.” In part, this isbecause too many managers are unaware of the diversity of uses towhich research can be put. Furthermore, they may be unaware of thediversity of approaches that research can take. Research can consistof something as simple and straightforward as planned, systematic ob-servation of facts and events around us. It can be a simple market ex-periment or a controlled case study. It can be analysis of secondarydata that already exist or a survey study of a convenient sample. Allare legitimate research approaches that can prove to be extremelyvaluable to open-minded managers if they are done right and fit thecircumstances.
But managers must be prepared to gather information, not justhope to recognize chances for research when they appear. ChapterTwo has as its major objective showing managers how to organizeto ensure that data are there when they are needed. Research is
MYTHS OF MARKETING RESEARCH 13
08Andreasen/Ch. 1 8/11/02 3:05 PM Page 13

much better if it is planned. Anyone who is serious about researchmust be systematic about it. A serious manager should prepare anannual plan for research just as one prepares an annual plan for ad-vertising or research and development.
Merely recognizing opportunities to do research does not meanthat managers should plunge forward heedlessly. There are manytimes when the opportunity to do research ought to be passed by.Sometimes this is because the state of the research art is not up tothe challenge of providing the needed information at a reasonablecost. This is especially the case with research designed to explorecustomers’ psyches—their attitudes, perceptions, motivations, andintentions.
And no one should do research when the economics of the de-cision situation argue against it. Chapter Three takes up the generalquestion of when it is economically sensible to go ahead with re-search and, if so, how much to spend on it. This chapter introducesthe concept of decision theory, showing how this formal approachleads to reasonable rules of thumb that will help a manager decidewhether to do projects A, B, or C or all of them or none of them. Italso shows how to determine the total budget.
If research is to meet its promise, the end product must meet thespecific needs that management sets out to fulfill. In Chapter Four,therefore, we will assume that both the manager and the researcherwant to make the research as relevant and useful as possible but donot know how. The chapter offers a relatively simple approach calledbackward research design that makes it much more likely that the re-search will be as useful as it can be. But both the manager and the researcher must be willing to devote considerable time to thinkingthrough the research problem in advance, and both must have real-istic expectations about what research can do. Research cannot ef-fectively tackle many topics, and it can be only partially helpful in agreat many others. If this book is to create satisfied users of research,it must ensure that they are not oversold users, especially when theoverselling is something they unwittingly do to themselves.
14 MARKETING RESEARCH THAT WON’T BREAK THE BANK
08Andreasen/Ch. 1 8/11/02 3:05 PM Page 14
Chapters Five through Eight get down to the nitty-gritty of thebook by spelling out alternative ways of doing low-cost, good re-search. Each of these chapters introduces a set of techniques anddiscusses ways in which they should and should not be carried out.Chapter Nine then considers the problems of collecting valid data,especially when using a questionnaire. Chapter Ten follows with anintroduction to statistics designed to make a little less formidable apotentially intimidating topic by showing how statistics can serverather than confuse neophyte researchers. Chapter Eleven con-cludes the discussion by outlining ways in which managers with alimited budget can acquire outside help and other resources to keepthe overall costs of a research program as low as possible.
Concluding Comments
It is important to emphasize two key cautions at this point. First, thelow-cost research approaches I am advocating here must be carriedout with the highest standards possible (commensurate with the de-cisions and with the dollars involved). Second, slovenly, low-costresearch is the most expensive kind since it can lead to worse deci-sions than those made without the research. The tragedy of muchinexpensive research carried out by the untrained and the unsus-pecting is that it is really cheap and dirty research and worse still—dirty often in ways that are hidden from management. It is alwayspossible that bad research by chance will yield correct insights—sometimes because only a dunce would miss the obvious. But in thelong run, the only way a manager can be sure that the research hasa pretty good chance of being right (and, if the procedure outlinedin Chapter Four is followed, on target) is if it is done with as high alevel of research standards as the technique and the circumstancespermit.
Only if managers are satisfied with the research—only if theyfeel that they got as close to the truth as possible under the circum-stances—are they likely to be repeat users of research themselves and
MYTHS OF MARKETING RESEARCH 15
08Andreasen/Ch. 1 8/11/02 3:05 PM Page 15

be vocal advocates of the idea of research to business colleagues,coworkers, and employees. Only then will this book achieve its goalof being itself an effective marketing tool.
I believe strongly that a product or an idea (such as the conceptof low-cost marketing research) will be accepted only if it meetscustomers’ needs and wants. In this first chapter, I have sought to ex-pose many of the irrational barriers and mystifications that havekept managers with limited budgets from seeing how research canmeet their real needs. The following pages provide the tools toachieve this end. But I have only opened the door. It will be up tothe reader to make the first daring steps in what can be an extremelyrewarding effort.
16 MARKETING RESEARCH THAT WON’T BREAK THE BANK
08Andreasen/Ch. 1 8/11/02 3:05 PM Page 16

2Planning a Research Program
Marketing research opportunities are much more numerousthan the typical limited-budget manager thinks. In many cases, asimple, relatively cheap research study can help the manager makea better decision. As with any other important managerial activity,it cannot be left to chance but must be planned. And planning forresearch requires both an appreciation of the many ways researchcan help and a systematic approach to specifying and carrying outboth continuing and special-purpose studies. The low-budget man-ager must first learn to recognize research opportunities in the day-to-day work environment. For those not trained in research, thismay take some time and conscious effort.
Consider the case of Phil Brady, the vice president for develop-ment of a public television station in the Midwest:
Brady’s principal marketing objective was to secure listenerand corporate donations to finance the station’s day-to-dayprogramming and its long-run capital expenditures. Once ortwice a year, he designed and conducted an on-the-air pledgedrive, a highly successful marketing technique now almostuniversally employed in public television funding. Despite theoverall success of the technique, Brady felt he could do betterin one important respect. Every year, 5 to 15 percent of theviewers who called to volunteer a pledge would neglect to
17
09Andreasen/Ch. 2 8/11/02 3:05 PM Page 17

18 MARKETING RESEARCH THAT WON’T BREAK THE BANK
make good on their commitment (bogus or prank pledgeswere rarely a serious problem), requiring the station to under-take some additional follow-up marketing. As a result of theseefforts (or perhaps independent of them), about half of theoutstanding pledges were fulfilled.
This was a frustrating situation for Brady. Because the typ-ical pledge week can generate $250,000 to $350,000 in poten-tial donations on each drive, even 6 percent nonfulfillmentcan mean a substantial loss of revenues. But Brady did not really know why the majority did not fulfill their pledges orexactly how to approach these donors. Most developmentmanagers simply send out reminder notices that treat nonful-fillers as if they fully intended to pledge and had simply let thematter slip their minds. This follow-up note is typically warmand friendly, thanking nonfulfillers for their pledges, welcom-ing them to the station’s “listener family,” and then gently reminding them that the pledged amount has not been re-ceived. It is assumed that nonfulfillers fall into three groups:those who had forgotten, those who were about to pledge any-way, and those who had changed their minds. It was assumedthat those who truly had let the pledge slip their minds wouldbe thankful for the reminder and that those who were aboutto mail the pledge anyway would not be offended by the let-ter’s tone. Finally, it was hoped that those who had changedtheir minds about pledging would either respond positively tothe warm note or be embarrassed by the fact that the stationwas counting on them. Brady had no idea what proportion of the no-shows fit into the third category and whether astronger letter would be more effective in motivating them to fulfill their pledge.
Brady was also uncertain about whether a mail follow-upstrategy was the best way to contact these nonfulfillers. Hewondered whether there would be any merit in marketing tothe recalcitrant pledgers by telephone. This could be easilydone by keeping on some of the volunteer telephone opera-
09Andreasen/Ch. 2 8/11/02 3:05 PM Page 18

tors who worked during pledge week and having them do thefollow-up. Brady didn’t know whether this modest expensewould be worth it.
Here we have an example of the classic problem that this bookaddresses: not a great deal was at stake, but it was enough to worryabout. At the same time, the manager had some important areas ofignorance. He did not know whether to change the follow-up mes-sage to offer a stronger motivation and whether to change the formof that communication. Both represent opportunities for research.The manager had two decisions to make, but in the absence of spe-cific research, he was inclined to go along with intuition and “whatwe’ve always done”: a mailed, friendly follow-up letter.
Brady did not see this as a research opportunity. Mainly, he didnot think it was worth the expense. He saw the potential gain fromany kind of study as modest and the mental and financial costs ofconducting the research to be significant. Part of the problem wasthat he also did not really know what research technique might beappropriate and feasible, and certainly not one that would also below cost.
Framing the Research Problem
In thinking about this modest research opportunity, we must first askjust what might be meant by “low cost” in this case. While formalconsideration of the question of research budgets will be taken up inthe next chapter, a sense of how a manager might proceed may beoffered by attempting to make a rough estimate of the maximum themanager might budget in this case. Assume the following:
• The typical pledge drive runs twice a year and collects an average $300,000 each time.
• Those who need to be contacted for not fulfilling their pledgesrepresent 5 percent of all pledges.
PLANNING A RESEARCH PROGRAM 19
09Andreasen/Ch. 2 8/11/02 3:05 PM Page 19

20 MARKETING RESEARCH THAT WON’T BREAK THE BANK
• One-third of those who need to be contacted would have fulfilled their pledges without a follow-up message, one-thirdneeded to be reminded, and one-third had changed theirminds about making a gift.
• The usual mailed message is effective with most of those inthe first two groups and only partly effective with the latter.
Given these assumptions, designing a better follow-up strategycould at best increase the station’s revenues only by bringing in moreof the $5,000 in pledges in each drive represented by the nonful-fillers who had not changed their minds (this figure is one-third of5 percent of $300,000). Assuming the marketing strategy used nowmotivates payment of $1,000 worth of these pledges and that theabsolute most the station would get with a new tougher message andusing a telephone follow-up is $2,500, then any improvement inmarketing strategy could yield at maximum $1,500 more per pledgedrive if there was no additional cost to implementing the new strat-egy suggested by the research. In the case of a new message, the costof changing to a stronger wording would be close to zero. If any re-search project recommended contacting nonfulfillers by telephone,there would be the added cost of this different approach. The $1,500gain would be extended over several pledge drives, however.
Two studies are possible. One could focus on learning about mo-tivations and figuring out how to design a better approach to thosewho had changed their minds. The other could focus on which me-dium is better, telephone or mail. Or the two could be combined. If the two studies had payoffs that were realized over, say, two years(that is, four pledge drives), the maximum one might invest is $6,000(4 x $1,500) in one or both studies. However, given that the researchwill inevitably be less than perfect, clearly a manager would want torisk considerably less than this amount, say, $1,000 to $1,500.
You might conclude that a telephone study is probably notworth it because even if telephone solicitation was found to yieldmore revenue, it would also incur more cost. On the other hand,
09Andreasen/Ch. 2 8/11/02 3:05 PM Page 20

you might feel that even an imperfect motivational study would beworthwhile because the cost of implementation would be so low.Both of these conclusions are wrong. The motivation study repre-sents an opportunity that should probably be passed up. On theother hand, the telephone study is a good, managerially useful re-search project that can be carried out for several hundred dollars ofout-of-pocket cost.
The Motivation Study
In the case of pledger motivations, discussions with any fundraiserwill make it clear that even if a different set of pledger motives wasdiscovered in a future research project, most managers would be re-luctant to use this information to change the follow-up message.One reason was implicit in the discussion about the target audi-ences. Although there are three segments within the set of pledgerswho do not initially fulfill their commitments, the motivationalmessage would be directed at only those who had changed theirminds. The manager will be legitimately worried that the other twogroups may react negatively to a stronger, more insistent new mes-sage that is perceived as more irritating than the warm and friendlyone already being used. The manager’s fear is that for every newlymotivated individual converted by a stronger letter, one or more ofthe others will decide not to pledge because of the more forcefultone. Thus, even if the research did discover the motivations ofthose who had changed their minds that could be worked on, mostmanagers would probably not be willing to take the risks involvedin changing the existing approach. For this reason, the researchshould not be done because it will not affect a marketing decision.This is an important point, and we will return to it in Chapter Four.
A reasonable alternative approach might be to recommend thatthe manager continue the existing mailing, wait several weeks, andthen send out the new, tougher motivational appeal to those whohave not still fulfilled their pleased, The manager might, quite legit-imately, express two reservations about this approach. First, a second
PLANNING A RESEARCH PROGRAM 21
09Andreasen/Ch. 2 8/11/02 3:05 PM Page 21

mailing means additional costs; bookkeeping to keep track of everylate nonfulfiller; designing, preparing, and mailing a second letter;and using a new set of stamped return envelopes. Second, the man-ager might suggest that a message delivered several weeks after theinitial pledge drive may be too late. Attitudes may have hardenedby then, the excitement of the pledge week will have worn off, andother economic priorities will have intervened in the pledger’s house-hold. The likely payoff from this second mailing will be much smallerthan if nonpledgers were reached soon after the pledge drive. Fur-thermore, one may also question whether a research study presum-ably designed to discover short-term barriers to pledging will provevalid for barriers remaining after several weeks.
There is another problem with the proposed motivational study:whether the findings could be trusted. Without a relatively heavy in-vestment in sophisticated methodology, there is a serious question ofwhether one could really learn why those in the third group changedtheir minds. If many are embarrassed by their change of mind, thereis good reason to believe that this same embarrassment would alsocause many of them to be less than candid in an interview designedto get at the real reasons for their change of mind. This is clearly aresearch opportunity that should be passed by.
The Telephone Study
The case for a low-cost research study on the telephone versusmail follow-up approach is much more encouraging. The hypothe-sis to test is clear: the net revenues generated in response to a tele-phone follow-up with nonfulfilling pledgers will be greater than thenet revenues generated by a mail follow-up. In both cases, net rev-enue is calculated as the return after the cost of the particular methodof solicitation is deducted. The research that the hypothesis sug-gests is a rather simple experiment: take all of those who have notfulfilled their pledges at a particular point (say, after fourteen days),randomly assign them to a telephone and a mail treatment group,contact them as the treatment indicates, keep track of the full costs
22 MARKETING RESEARCH THAT WON’T BREAK THE BANK
09Andreasen/Ch. 2 8/11/02 3:05 PM Page 22

of each treatment, and wait for the returns. The allocation of sub-jects to the two treatments need not be equal. Since telephone so-licitation is more costly, one way to keep research expenses in checkis to allocate less than 50 percent of the sample to the telephonecondition. Whatever the proportion, the allocation must be ran-dom for the experiment to be valid.
The proposed experiment is really one that virtually anyonecan design and implement with the prospect of a relatively high-quality outcome. The secret is to make sure that the assignment ofpledgers to treatment groups is random and that those doing thetelephone solicitation do not behave (perhaps due to the fact thatthey know they are part of an experiment) in ways that will influ-ence the study such that one cannot realistically project the resultsto normal future telephone solicitations.
Just such a study was done for Mr. Brady. The study came aboutbecause two students in the communications degree programat the local university were looking for a term project. Aftertalking with Brady, they recognized the research opportunityand went ahead and designed and carried out the required ex-periment. The only costs to the station were modest additionaltelephone charges. Although the researchers’ services werefree, net revenues for the telephone treatment were calculatedafter estimating what it would have cost to acquire enoughtelephone lines to handle all the needed calls in the experi-ment and to pay full-time operators to make the contacts.Even with these costs included and even though the samplewas small, the research clearly demonstrated (in statisticallysupportable fashion) the superiority of telephone solicitation.The station has since implemented the recommendations aspart of a broader telemarketing campaign.
It should be emphasized here that this was a student-initiated proj-ect and thus reinforces the central thesis of this chapter: that mostmanagers do not easily perceive research opportunities that routinely
PLANNING A RESEARCH PROGRAM 23
09Andreasen/Ch. 2 8/11/02 3:05 PM Page 23

come up in their daily marketing activities. A second point is thatthere is a surprising array of free or low-cost resources in the outsideworld that can keep research within manageable budgets. In this case,the students found the station. It could have been the other wayaround if the station had looked for the opportunity. Students are agood free resource and can be particularly helpful if the project is of therelatively straightforward type described here. Indeed, Chapter Elevenidentifies a wide range of sources of such relatively low-cost or free, andsometimes relatively sophisticated, market research help.
Looking for Opportunity
The extended example of the television station points out two keyfeatures of the problem of looking for and recognizing research op-portunities. The first lesson is that if managers are to recognize andtake advantage of research opportunities, they must learn to suppressthe mental barriers to research that they have acquired over theyears. As predicted in Chapter One, the development vice presidentin the preceding case automatically reacted to the two research pos-sibilities by saying:
“The decision isn’t really important enough to meritresearch. The dollars involved just aren’t great enough!”
“It is impossible to get any reasonably good research donefor the few dollars that can be afforded. I can’t afford asurvey!”
“Even if the research is affordable, it is impossible toimagine how to go about getting the research donewithout spending an arm and a leg for assistance.”
As we have seen, all three arguments are myths, the kind that canget in the way of a systematic program of marketing research.
The second lesson to be learned from the example is that re-search opportunities do not usually reach out and tap one on the
24 MARKETING RESEARCH THAT WON’T BREAK THE BANK
09Andreasen/Ch. 2 8/11/02 3:05 PM Page 24

shoulder as was the case when the students came to Brady. For cheapbut good research to become common practice in any organization,managers constantly have to look for these possibilities. This in-volves two changes in typical management practice. First, managersmust cultivate a sixth sense for the serendipitous research opportu-nity. From time to time in most organizations, there will appear notonly needs for research but also chances for research, and managersmust train themselves to be alert to both. Second, management mustdevelop an annual research plan as part of its annual planning cy-cle. The research plan requires that once a year, the manager set outa research want list and then either expressly budget to fill it in orfill it in with serendipitous projects as the occasions arise. We willconsider the problem of research planning first.
Research Planning
An appropriate framework for beginning research planning on anannual basis is to start by cataloguing the major types of marketingdecisions that managers in the researcher’s organization will facewithin a typical year’s time, including decisions to maintain the sta-tus quo. These can be the basis for determining what information isneeded to help make each decision better and should yield a list ofpotential research projects that can be prioritized and implemented.In each succeeding year, the planning task then becomes one of de-termining whether any new decisions are to be made and whetherthe research programs already in place need to be modified in anyobvious ways. This process is outlined in Figure 2.1.
The Decision Framework
Although the decisions for each individual manager will be to someextent idiosyncratic, the kinds of marketing decisions most managersface will require information differing along three broad dimen-sions.1 First, decisions will be either long run or short run. Managersoften must look ahead several planning periods in order to decide
PLANNING A RESEARCH PROGRAM 25
09Andreasen/Ch. 2 8/11/02 3:05 PM Page 25

whether to make investments that would put the organization in thebest possible position to exploit that future environment. Contrastedto these decisions are those short-term decisions that relate to thisyear’s, this month’s, or even this week’s activities.
The second dimension is the distinction between strategy andtactics. In the main, long-run decisions will involve broad issues ofstrategy: what groups to be influenced, what products or services tooffer or behaviors to promote, what general approaches to use tomotivate key behaviors, and what organizational structure, systems,and personnel to employ to carry out these strategies. Short-run de-cisions, although often focusing on strategic questions, usually in-volve tactical issues, such as choosing between audience segments
26 MARKETING RESEARCH THAT WON’T BREAK THE BANK
List one-time and repetitive marketingdecisions to be made in coming year
Determine information needed tohelp make each decision better
Prioritize research given both needsand research capabilities
Set timetable and budget forhigh-priority projects
Circulate a want list for projects to becarried out if the opportunity presents
Repeat cycle for subsequent yearin the light of changed needs
and present achievements
FIGURE 2.1 Research Planning Process.
09Andreasen/Ch. 2 8/11/02 3:05 PM Page 26

A and B or moving a service outlet to meet sudden shifts in popu-lation or economic conditions.
The third dimension for research planning is whether the deci-sions are about elements of the marketing mix, such as products,channels, prices, and promotion (advertising, personal influence,promotion, public relations), or about the resources and structuresneeded to ensure that the mix is effectively implemented.
The three dimensions yield a basic framework for assessing mar-keting research needs at the start of the annual planning process.The framework is reproduced in Exhibit 2.1.
The manager can begin the marketing research planning cycleby listing the kinds of recurring decisions to be made in each of thesix major sectors of Exhibit 2.1 over the course of the year. The nextstep in the research planning process is to ask what kinds of infor-mation are necessary and desirable to help make those decisions bet-ter. These information needs can then be translated into a fundedprogram of future research and a list of projects to be carried out ifthe occasion arises.
A suggested list of the kinds of research projects that may evolveis included in Table 2.1. Although this table reports the experiencesof relatively large and sophisticated organizations, it neverthelesssuggests the kinds of marketing research that an aggressive low-budget researcher might contemplate.
It turns out that the information management will need in agiven year will be descriptive, explanatory, or predictive.
Descriptive Information. Management is seeking to learn the stateof its present market environment. One approach to specifying thesedescriptive needs is to conduct a marketing audit.2 The market en-vironment comprises the following major dimensions:
• Customers: Who is currently responding positively to yourstrategy, and who is not? What are their preferences, attitudes,and intentions with respect to your offerings?
PLANNING A RESEARCH PROGRAM 27
09Andreasen/Ch. 2 8/11/02 3:05 PM Page 27

• Competition: What alternatives are your target audiencemembers considering? What strategy and tactics do competi-tors currently employ, what marketing mix, what spendinglevels, and with what audience focus?
• Channels: Where do target audience members encounter yourofferings and those of competitors? What partners are you using, and how satisfied are they with the relationship? Howcostly is the distribution system? Can the Internet be used to deliver options?
28 MARKETING RESEARCH THAT WON’T BREAK THE BANK
EXHIBIT 2.1 Decision Checklist for Market Research Planning.
Long-Run Short-Run Short-RunSubject Area Strategy Strategy Tactics
Segments to emphasizeBehaviors to emphasizePositioningMarketing mix
Benefits offeredServices offeredConsumer pricesChannels for distributionPromotion levelsPromotion channelsPromotion messagesWeb strategyPublic relations
Resources and systemsPartnershipsManagement staffLine staffSupport staffReporting systemsAnalysis capabilities
Databases
09Andreasen/Ch. 2 8/11/02 3:05 PM Page 28

PLANNING A RESEARCH PROGRAM 29
TABLE 2.1 Research Activities of 435 Companies in 1988 and 1997.
Percentage of CompaniesThat Perform This Activity
Research Activity 1988 1997
Business/Economic and Corporate ResearchIndustry/market characteristics and trends 83% 92%Acquisition/diversification 50 50Market share analysis 79 85Internal employee studies 54 72
PricingCost analysis 60 57Profit analysis 59 55Price elasticity 45 56Demand analysisMarket potential 74 78Sales potential 69 75Sales forecast 67 71
ProductConcept development and testing 63 78Brand-name testing 38 55Test markets 45 55Existing product tests 47 63Packaging studies 31 48Competitive product studies 58 54
DistributionLocation studies 23 25Performance studies 29Coverage studies 26International studies 19
PromotionMotivation research 37 56Media research 57 70Copy research 50 68Advertising effectiveness 65 67
09Andreasen/Ch. 2 8/11/02 3:05 PM Page 29

• Marketing system performance: How well are your various offerings performing? Are they self-sufficient? What are the trends?
• Economic and social conditions: What is the status of generalsocial approval or disapproval of the organization’s offerings ormarketing tactics? What is the state of social and economichealth for each of the major audiences served?
30 MARKETING RESEARCH THAT WON’T BREAK THE BANK
TABLE 2.1 (Continued)
Percentage of CompaniesThat Perform This Activity
Research Activity 1988 1997
Competitive advertising studies 47 43Public image studies 60 65
Sales Force ResearchCompensation 30 34Quotas 26 28Territory structure 31 32Sales promotion 36 47
Buyer BehaviorBrand preferences 54 78Brand attitudes 53 76Satisfaction 68 87Purchase behavior 61 80Purchase intentions 60 79Brand awareness 59 80Segmentation 60 84
Sources: Reprinted with permission from Thomas C. Kinnear and Ann R.Rott, 1988 Survey of Marketing Research (Chicago: American Marketing Associ-ation, 1988), p. 43; Thomas C. Kinnear and Ann R. Rott, 1997 Survey of Mar-keting Research (Chicago: American Marketing Association, 1997), p. 9.
09Andreasen/Ch. 2 8/11/02 3:05 PM Page 30
Explanatory Information. Management typically seeks cause-and-effect linkages among the bits of descriptive information so that decisions can be made as to whether to continue or change any el-ements of the marketing mix. This means eventually getting an-swers to several questions:
• Factors outside management’s control: Do changes in socialand economic conditions or consumers’ and system partners’goals, attitudes, and preferences significantly influence the organization’s marketing effectiveness, and how?
• Factors within management’s control: Does the nature andlevel of the marketing mix directed at target audiences signifi-cantly influence marketing effectiveness? If so, how?
• Changing market factors: What factors make today’s explana-tions consistent or inconsistent with those of the past, that is,in what ways, if any, are the dynamics of the program environ-ment changing?
Predictive Information. The descriptive and explanatory infor-mation can help to define what is most essential to effective man-agement: predictions about the future. Since the actions that themanager will take in the next year will have their consequences inthe future, it becomes essential to know what that future will be likeand what will work in that future. Any descriptive and explanatoryinformation gathered may or may not fill this role. It is up to man-agement to determine which of its current assumptions will holdtrue for the future.3
Additional kinds of predictive information that managementmay also feel the need for include the following:
• What are partners’ likely future strategies and tactics as theymight affect the organization’s operations?
• Are there important developments in the political and social
PLANNING A RESEARCH PROGRAM 31
09Andreasen/Ch. 2 8/11/02 3:05 PM Page 31

environment of which the manager should be aware that willpose critical opportunities or threats?
• What will the future technological environment be? Arethere developments in communications systems or the Inter-net that the manager ought to be prepared to adapt to?
• Are significant shifts in target audience attitudes and behaviorlikely to arise in the future that are not simply extensions ofthe past?
• What of the manager’s own organization? If it stays on thesame course, are its financial resources, personnel, and systemsgoing to be up to the tasks they will face?
Predictive information is mainly useful for strategic decisionswith implications for the longer run. Explanatory and descriptiveinformation, on the other hand, is most valuable in shorter-runstrategic and tactical decisions.
Getting Started
At this point, the reader may well be reeling from the apparent depthand complexity of the research planning process, especially when sev-eral products or divisions are involved. But three points must bemade. First, because something is challenging doesn’t mean that itshould not be done. Who said planning was easy? If a manager is tobe effective, sacrifices are going to have to be made. The hallmark ofmodern managers is that they do not run the organization, or theirpart of it, by the seat of the pants. Careful soundings must be taken ofthe environment and then just as carefully merged into thoughtfulplans. A manager must be organized and methodical, as well as cre-ative and daring, to be a success. There are, of course, times when amanager must make decisions on the basis of intuition because thereis no other course. This means going ahead without research or withonly partly successful research because either the situation doesn’t jus-tify the expenditure or the state of the art in research technology can-
32 MARKETING RESEARCH THAT WON’T BREAK THE BANK
09Andreasen/Ch. 2 8/11/02 3:05 PM Page 32

not provide the information needed. Still, a good manager must besystematic in making sure that seat-of-the-pants judgments are madeonly after, not instead of, the possibility of collecting research infor-mation has been carefully and systematically considered. This is therole of the annual research plan.
The second point to be made with respect to the planning pro-cess is that many of the possibilities enumerated may not be rele-vant. Topics within a category may simply not be important to themanager and others who may be consulted in the research planningprocess.
Finally, the first time this planning task is carried out, it mayprove formidable, but the manager should take comfort in the factthat in subsequent planning cycles, the task will be much moretractable, and maybe even easy.
Preparing the First Research Plan
The procedure recommended for the first cycling of this researchplanning task should have several characteristics that have provento be important to virtually all kinds of serious planning efforts. Tostart, all of the key management personnel who can usefully con-tribute to the planning process should be brought in on it—notonly key marketing staff members but others who may be expectedto use the information generated.
Also, if possible, an adviser from the outside market researchcommunity should be included in the initial planning steps. Theadviser can offer creative ideas for research projects based on tech-nology with which management may not be familiar and can in-troduce some realistic caution to the more ambitious or off-the-wallmanagement suggestions.
It is critical to set aside a specific time for the research planningtask early in the organization’s planning cycle. Allow enough timeto get the job done right. The time blocked off should, at least on thefirst iteration, be free of other obligations. A good approach is oftento undertake the research planning activity away from the office.
PLANNING A RESEARCH PROGRAM 33
09Andreasen/Ch. 2 8/11/02 3:05 PM Page 33

Research categories should be covered one at a time startingwith longer-range strategic needs in Exhibit 2.1 and then movingon to short-range strategy and then to short-range tactics. The firsttime, the manager must be dogged in insisting that each categorybe covered thoroughly.
Those participating should be instructed that the major objec-tive of the planning activity is to construct what is in effect a re-search want list. This should make the exercise more enjoyable thanmany other annual planning tasks. Staff should be urged to be un-inhibited, stating what they would ideally like to know to make bet-ter marketing decisions. At this step, they should be discouragedfrom arbitrarily censoring certain research wants as foolish or im-possible. The realities of the organization’s budget and its researchcapabilities can be introduced at a later stage.
Prioritizing
The next stage (preferably after a good pause and perhaps a night’ssleep) is to take each of the projects on the want list and group theminto categories (see Table 2.2):
• Category A: Projects that are doable, essential, and meritspecific funding during the planning year.
• Category B: Projects that are doable but not so essential as tomerit immediate commitment of funds. These projects are still highon the want list, and management must constantly seek opportuni-ties and funds over the year to carry them out.
• Category C: Projects that are doable but represent informa-tion it would be nice to have. Management should be alert to seren-dipitous opportunities to acquire the information free or at very lowcost (for example, using some of the secondary sources or cooper-ative data collection strategies mentioned in Chapters Five andEleven).
• Category D: Projects that would have fit into category A butappear not to be feasible now because of gaps in research knowledgeor because the organization does not have access to the necessary
34 MARKETING RESEARCH THAT WON’T BREAK THE BANK
09Andreasen/Ch. 2 8/11/02 3:05 PM Page 34

skills. Because they are potentially category A projects, that is, proj-ects to which management would clearly commit funds if theycould bring the study off, some amount of managerial effort shouldbe expended to ascertain whether the assumption about the infea-sibility of these project is indeed valid. To achieve this end, a sim-ple Request for Proposal (RFP) for a low-cost study on the topic couldbe sent out to several creative local research suppliers or individualconsultants to see if they can come up with ways of researching theproblem.
• Category E: There are currently nonfeasible projects thatmight fit category B. Here, almost all that management should dois maintain the vigilance suggested in the last paragraph. As in thecase of category B projects, learning that a project is now doable stilldoes not mean that the research should be done, only that it be puton hold until the opportunity presents itself.
• Category F: Nonfeasible projects that are both unimportantand not feasible given existing methodology. They should be ignored.
The final stage in the research planning process is a time-tableand specific budget for undertaking category A projects and puttinginto motion activities needed to carry them out. At the same time,
PLANNING A RESEARCH PROGRAM 35
TABLE 2.2 Ranking of Annual Research Projects.
Managerial Relevance Doable Not Doable
Highly important Category A: Fund Category D: Seekthis year. outside suggestions on
feasible methodology.
Somewhat important Category B: Do not Category E: Remain fund. Look for vigilant for new opportunities to methodology that can fund small studies. make study feasible.
Not important Category C: Acquire Category F: Ignore.only if free or very low cost.
09Andreasen/Ch. 2 8/11/02 3:05 PM Page 35

the manager should begin any steps that can be undertaken to ex-plore the feasibility of deferred category D projects. A list of cate-gory B projects can be circulated to other managers with suggestionsas to the kinds of occasions on which serendipitous data gatheringmight be undertaken.
Future Planning Cycles
Something like this procedure can then be repeated each subse-quent planning year with important modifications. Taking the pre-vious year’s research plan, the manager need simply ask:
• Which of last year’s research projects have been completedthat now do not need to be done again, at least for a while?
• Which of those projects can be deleted as now irrelevant orotherwise unjustifiable?
• What new projects need to be added either because over theyear management has become conscious of the need for themor because circumstances have changed?
• Which of the projects to be repeated will take the same form,and which projects need to be updated to take account of newknowledge or new circumstances?
An additional step should be added after the first year: a reviewof the process itself. Management, or perhaps an outsider, shouldlook at the research decisions that were taken on the basis of thefirst-year plan and ask whether the planning process needs to be im-proved. This would involve investigating at least the followingquestions:
• Was the categorizing system appropriate? Were projects invarious categories recategorized over the year? Was there any-thing that could have been done in the planning process thatcould have anticipated these reassignments and that could bebuilt into the next cycle?
36 MARKETING RESEARCH THAT WON’T BREAK THE BANK
09Andreasen/Ch. 2 8/11/02 3:05 PM Page 36

• What new wants were added to the list over the year, andcould these have been anticipated?
• What category D and E projects were shifted to categories Aand B, and why? Does this suggest any systematic ignorance in the organization about the world of research that wouldrecommend some sort of future management training or thegreater use of outside experts?
• Which category B projects were actually carried out, if any?What precipitated them, and can these precipitants be intro-duced in the future to ensure that more low-cost research iscarried out serendipitously?
All of this involves an evaluation of the research planning pro-cess. In the next chapter, we will address more directly the questionof evaluating each individual research project in terms of its ownspecific criteria.
Finding Research Opportunities
Many managers do not do good low-cost research because they donot see the opportunity for it. Not recognizing opportunities is theresult of three often understandable gaps in the knowledge of thelow-budget manager. First, opportunities may not be perceived be-cause the manager does not know what research can do. Second,they are not perceived because the manager does not want them tobe perceived. The manager may fear a loss of control or a revelationof ignorance that is to be avoided at all costs. Finally, many man-agers do not see research opportunities because they do not system-atically look for them.
To overcome this, I have proposed a procedure for systematicallyidentifying research needs and making room for serendipitous re-search possibilities. Although the task of setting up a research pro-gram may be forbidding the first time, recognizing and acting onopportunities for low-cost research over the long run will put the or-ganization in a significantly superior strategic position in relation toits competitors. If nothing else, the research planning process can
PLANNING A RESEARCH PROGRAM 37
09Andreasen/Ch. 2 8/11/02 3:05 PM Page 37

leave the new researcher-manager with a satisfied feeling that comesfrom knowing that the organization is making sound, if risky, mar-keting decisions that have been backed by the best research infor-mation that the stakes at issue can justify. These would seem to beadequate rewards for the thinking, evaluating, and planning involvedin the research planning process outlined here.
Serendipitous Research: Recognizing ResearchOpportunities as You Go
Not all research projects can be planned ahead. Some come aboutbecause occasions for filling in items on this year’s want list maketheir appearance.
Some years ago, an executive seminar provided me with justsuch an opportunity. I had been asked by the Public BroadcastingSystem (PBS) to spend an afternoon with its specialists in audiencedevelopment to discuss several of the topics raised in this book. Inpreparation for the session, I read a good deal of the literature onthe current turmoil in the telecommunications industry and quicklyrealized that I had a limited appreciation of which topics in thebroad area of marketing and marketing research might be of inter-est to this particular audience.
At the same time, I was also searching for ways to make my pre-sentation and discussion more realistic and more dramatic. I decidedthat it would be quite useful to poll the audience development spe-cialists at each of the 170 PBS affiliates around the United Statesand ask them which marketing problems they would like to see ad-dressed in my presentation. The poll would also ask about their yearson the job, their formal education in marketing (if any), and theirmarketing experience. Since this request for help was to be a mail so-licitation much like those that these audience development special-ists send out all the time to potential donors and subscribers, Idecided to try to demonstrate how this occasion could provide aserendipitous opportunity for research.
Many of the decisions that face those who use the mail for so-liciting financial aid involve the positioning of the letter that in-
38 MARKETING RESEARCH THAT WON’T BREAK THE BANK
09Andreasen/Ch. 2 8/11/02 3:05 PM Page 38

corporates the request for help. Two of the relatively minor deci-sions are who signs the letter and how much the mailing should bepersonalized. In this study, it was decided to determine whether itwould be more effective to have the mail request signed by some-one from PBS or by me. Would recipients of the solicitation re-spond better if the request came from a familiar source and to whomthey might feel a certain responsibility (PBS), or would the responsebe greater if the source was not personally known to the respon-dents but was an independent individual in a high-status position(a university professor) with whom they could be more candid andforthright?
The second issue was whether personalizing the correspondencewould be worth the cost. While many direct mailers routinely usecomputers to make cover letters speak more directly to each recip-ient, many respondents claim that they know when a letter has beenwritten by a computer. A way to truly personalize the letter would beto include a handwritten note. This would be time-consuming andcostly, but it might yield a higher payoff.
On the basis of these considerations, the decision was to splitthe sample of 170 specialists randomly into four groups. Half of thesample was to be sent cover letters with a handwritten note at thebottom stating, “I would very much appreciate your help in this re-quest” (the personalized treatment). The other half had no note.Half of each of these groups received notes I signed, and half re-ceived notes the PBS director signed. One virtue of using this ex-perimental design (formally called a fully factorial design) was thatit would permit us to see whether the combination of a personalizedsolicitation from a particular source would be even more effectivethan the effects of the personalization and the nature of the letterwriter taken separately. The criterion in testing the effects of thesefour experimental treatments was to be the overall rate of responseto the request for the questionnaire information.
This project was carried out with high research standards andwas virtually costless since we were going to send the questionnairesout anyway and did not feel we needed to place a stamp on the re-turn envelopes. (In fact, the overall response rate for this cheap,
PLANNING A RESEARCH PROGRAM 39
09Andreasen/Ch. 2 8/11/02 3:05 PM Page 39

good study was 61 percent, a rate achieved with no stamps and nofollow-up letters.)
The 170 organizations were assigned to the four treatment groupson a fully random basis. The four basic cover letters were identical inwording. The same handwriting was used for both personalized treat-ments. The letters were sent out the same day to everyone. All wereon PBS letterhead, and all were returned to me at the University ofCalifornia at Los Angeles (UCLA), where I was teaching at the time.UCLA’s computer was used to analyze the results, and care was takento apply only the appropriate analysis of variance statistics.
The findings were surprising: essentially, there were no effects.This was significant and important to know. Both the program di-rector and I (and much of the audience when I reported the results)expected that there would be a significant effect at least from thepersonalized note. Given these expectations, the results were veryuseful. It appears that the added cost of personalizing this kind ofmail solicitation, at least in the way we did it, is not at all worth theexpense. The research would save managers who send out frequentlarge mailings considerable amounts of money they might havespent on unnecessary personalization. (Indeed, this is a conclusionof experienced research practitioners.)
One other step in the analysis was taken. When it seemed likelythat the overall response rate was not going to show any significantdifferences between treatments, it was then decided to go back andsee whether there was any effect of the treatments on the speed ofresponse as indicated by the postmark on the return envelope. Inthis case, there did turn out to be a modest, although still not sta-tistically significant, effect here for one treatment combination: per-sonalized letters over my signature got marginally quicker responses.However, further computer analysis showed that a better predictorthan the nature of the letter of how fast someone would return thequestionnaire was how much formal training in marketing he or shehad. The greater was the respondent’s background in marketing,the faster was the response. This would suggest that those who willrespond quickest to any solicitation will be those who can most
40 MARKETING RESEARCH THAT WON’T BREAK THE BANK
09Andreasen/Ch. 2 8/11/02 3:05 PM Page 40

closely empathize with the solicitor’s needs. This too is a conclusionthat can be generalized to other contexts.
This last set of analyses illustrates two other features of a well-designed program of cheap but good research. First, I went back tothe database when a new researchable question occurred to me. Although in this case, it was only a matter of a few days before I de-cided to take a second helping from the data by looking at the post-marks to gauge the speed of response, this could have occurredmonths, even years, later (assuming the database was still avail-able). Digging into an existing archive can be a productive, virtu-ally free research opportunity (ignoring for the moment the cost ofthe researcher’s own time and effort). Such reworking of an exist-ing data archive, whether already in analyzable form or requiringfurther modification, can often prove a rich source of low-cost re-search. And to anticipate a point that will be made later, a non-trivial advantage of using the PBS database was that since it was myown, I knew its flaws and in fact could take pleasure in its relativelyhigh quality. This is often not the case when using someone else’sdata archives.
A second feature of my follow-up analysis is that the measure ofspeed of response used was not part of the original design. The post-mark data were available for me to use as an archive, but I had torecognize this possibility. Then all I had to do was to go back to eachenvelope and record its time trace. (In two cases, the cancellationmachine missed the entire envelope, so I could not discern the realdate, one of the many tribulations of real-world research.) There area great many traces such as this available in the marketplace thatare free for use if we only have the imagination to see them andknow how to fold them into our research program.
The last lesson that can be drawn from the PBS example relatesto the computer analysis. Although our original interest was in theeffects of the four experimental treatments on the quantity andspeed of response, an attempt was made to see whether any of theother information that was collected about respondents along theway (their marketing backgrounds) was a predictor of the speed of
PLANNING A RESEARCH PROGRAM 41
09Andreasen/Ch. 2 8/11/02 3:05 PM Page 41

response, as indeed was the case. Wringing as much information outof existing data sets as possible is a major technique for keeping thecost of research low.
The Decision Opportunity
There are a number of situations in which research can be done tocontribute significantly to anticipated decisions that a managerfaces in the day-to-day competitive world of marketing. Daily, man-agers have many chances to act and, therefore, where there is time,many chances to do research. Becoming a more effective decisionmaker through the use of low-cost but good research requires theproper mind-set. Learning to recognize research opportunities is notjust a matter of being more alert for research windows; it is also hav-ing research techniques ready to apply. Part Two offers just such anarsenal of techniques available at low cost that can be matchedwith relative ease to specific decision problems when they arise.
But research should not always be done even when a perfectlygood low-cost technique is available. What is needed is the judicioususe of research. Even when there is a lot at stake, research should notnecessarily be undertaken. But we will say more about this in thenext chapter.
42 MARKETING RESEARCH THAT WON’T BREAK THE BANK
09Andreasen/Ch. 2 8/11/02 3:05 PM Page 42
3Evaluating Individual Research Projects
We will assume you are ready to embark on a modest programof preplanned annual research and are much more open than youwere to serendipitous research opportunities that might crop up.You and your staff have already set aside a weekend in the woods tohammer out your first research plan.
But now you are beginning to have second thoughts. “Wheredoes it all end?” you say. “How will I know where to draw the line?How can I determine which projects to move ahead on and howmuch to invest in each? How do I set an annual budget for the en-tire research program? Basically, how do I figure out just how cheapthe research has to be to be worthwhile?”
This chapter addresses these questions. To do so, we will exploresome concepts borrowed from what management schools call for-mal decision theory.
Setting Budgets
Let us begin by reviewing some simplistic—and often wrong-headed—alternative rules of thumb for setting research budgets.
43
10Andreasen/Ch. 3 8/11/02 3:06 PM Page 43

44 MARKETING RESEARCH THAT WON’T BREAK THE BANK
The Percentage-of-Sales Pseudoequity Approach
This approach is based on some managerially divine notion of pro-portionality. It says, in effect, that there exists some magical per-centage rate that ought to be applied to whatever is at stake in a givenmanagerial decision to establish a reasonable budget for research.For the annual budget, it might be a fixed percentage of projectedsales. For a specific project, it might also be a percentage of the pro-jected sales or of the capital investment.
The approach has a nice simplicity. It is easy to compute andeasy to justify, and it deflects criticism and internal conflict withinthe organization. For example, suppose your CEO sees that you planto spend $51,386 on research this year compared to only $36,912last year and asks about the great increase. You can easily justify theincrease by pointing out that last year’s expenditure was just one-halfof 1 percent of the investment made in new product developmentand—lo and behold—the current budget is also one half of 1 percentof new product investment. Or suppose a division complains thatthe research budget set aside for its problems has been cut 25 per-cent, while another division’s budget has been increased 12 percent.The apparent inequities can be resolved again by showing that re-sulting final figures were one-half of 1 percent of sales in both cases.
This approach is like the advertising manager’s reliance on per-centage of sales as the determinant of the advertising budget. Thefallacy in research budgeting is the same as in advertising: the per-centage chosen may not be adequate or may be excessive for thetasks at hand. In advertising, the reliance on sales as the basis forthe budget calculation leads to the peculiar outcome that whensales are down, competition is toughest, and advertising should beworking its hardest, the percentage calculation leads the firm to cutback on its advertising budget. Conversely, when the sales and profitpicture is rosiest and customers are falling all over themselves to buyany and every product the firm and its competition can produce,the Iron Law of the Percentage dictates that the firm should spendmore on advertising.
In a sense, the same antilogic applies to research expenditures.Managers seem to think that research need is related to the stakes
10Andreasen/Ch. 3 8/11/02 3:06 PM Page 44

involved in a particular decision. If the stakes are great, you shouldspend a great deal, and when the stakes are smaller, you should spendless. Of course, what you can spend on research is not independentof what is at stake, and other things being equal, the more dollarsthat are at stake, the more ought to be spent on research. Neverthe-less, a moment’s reflection points to an obvious fallacy in all this.
In many cases, management is going to go ahead with a particu-lar course of action in some major sales category unless the researchwould indicate that management’s assumptions were 180 degrees offbase. Although the stakes in these projects would allow a significantamount of research, management would not make a different deci-sion because of the results. The same logic would apply to a boommarket. If sales are expected to be very strong, management may notbe worried about making the right decisions about, say, advertisingcopy. They may believe that almost anything will work. Again, re-search is less often justified even though sales are high. Conversely,when sales are down, management may be very worried about mak-ing just the right decision. On these occasions, the value of researchis much greater despite the smaller stakes.
The illogic of the percentage method for research budgetingcan also be seen dramatically when one considers the perfectly per-forming product line experiencing no major competitive problemsand no managerial issues. The Iron Law would suggest still spend-ing the Magic Percentage on this category. Does management hopethat the research in these circumstances will come up with strate-gic insights or undetected weaknesses that will justify the researchin the first place? This is the kind of fishing expedition we warnedagainst in the previous chapter.
The Affordable or Residual Approach
One rationale for the percentage-of-sales approach is that it makessure that the organization can afford the research. If sales are up, itcan afford more research. If sales are down, it can afford less.
The affordable philosophy is a little different from that found inthe percentage-of-sales approach in that it is based on a calculus
EVALUATING INDIVIDUAL RESEARCH PROJECTS 45
10Andreasen/Ch. 3 8/11/02 3:06 PM Page 45

46 MARKETING RESEARCH THAT WON’T BREAK THE BANK
that subtracts from sales or the stakes at issue all other direct justi-fiable expenditures plus a normal profit and then asks, “What is leftfor discretionary items such as research?” Unfortunately, this is astance that sees marketing research as a highly discretionary ex-penditure. In part, this attitude reflects years in which too much re-search has indeed proved to be less than fully useful, if not totallyirrelevant, to management’s needs. Given this history, managerscan easily convince themselves in times of financial stringency thatbudgets for research that is likely to be of limited use can be deci-mated to the immediate benefit of the bottom line with what is as-sumed are no major long-run negative impacts on the organization.
The affordability approach has the exasperating effect of makingthe research budget gyrate even more grotesquely than the company’ssale curve. When sales are off a little, discretionary research budgetsfall quickly to zero, and planned research projects are curtailed dra-matically, if not totally. And when sales are up, discretionary budgetsmay soar even more rapidly (although one suspects never as high asthe research director would like). This volatility under both the per-centage and affordable approaches tends to make a career in market-ing research even more fragile than one in advertising.
The fallacy here is the same as that for the percentage-of-salesapproach: there is no logical reason that the affordability calcula-tion will bear anything but the remotest relationship to the need forthis research. It is this latter criterion that should be management’sguide, not some arbitrary, inflexible rule of thumb.
The Free Market or Delegated Approach
This approach usually stems from management’s naiveté aboutwhat is needed to solve decision problems. In effect, it throws thebudget problem into the hands of the research supplier by means ofa request for research proposals. In its extreme form, it says in effect,“I have a rough idea about how much is too much, but I don’t reallyunderstand what kind of research I need, and I do know how muchit will have to cost. You educate me, and perhaps I’ll buy it.”
Ironically, the manager adopting this approach often feels that
10Andreasen/Ch. 3 8/11/02 3:06 PM Page 46

he or she will not be really at the mercy of the suppliers in deter-mining the research budget if the project is put out for bids. Themanager apparently assumes that there is some sort of competitivemarket out there. If several organizations respond to an RFP for theproject, the manager expects to become pretty well educated as tothe cost and design implications of doing the research by readingtheir submissions. Then, by taking one of the lower-priced alterna-tives, the manager may erroneously believe that everything possi-ble has been done to keep the cost appropriate to the problem.
The key fallacy in this commonly used approach is that themanager expects the bidding cost somehow magically to be in linewith the decision. Yet the cost-determining processes the managerhas set in motion are really driven by the technology the researcherschoose to bring to bear and to some extent by market forces and thesuppliers’ bidding strategies. It is as if in the days before the motorcar, a manager put out requests for bids for a method for moving rawmaterials over land without relying on fixed railbeds or waterways.Sending this problem out for bids may elicit a lot of very expensiveand sometimes strange proposals (reflecting the state of the art). Butunless the manager really has thought through what this thing calleda truck will do for the company, the budget may end up five, ten, orfifteen times what it ought to be.
So it is with the research RFP. One can spend a great deal morethan one ought. Different bidders will quote on different designs us-ing different overhead allocations based on different (often arbi-trary) accounting standards and profit rates, with the final totalbased in part on the supplier’s estimate of the requesting organiza-tion’s naiveté or generosity. Certainly, under this scenario, there isno reason to believe that the amount will be at all appropriate tothe management’s decision.
Other Factors
A number of other factors will come into play to either expand orcontract a budget even where the basic criterion is relatively ratio-nal. Budgets may be affected by the following considerations.
EVALUATING INDIVIDUAL RESEARCH PROJECTS 47
10Andreasen/Ch. 3 8/11/02 3:06 PM Page 47

Customer Relations. Sometimes questionnaires or depth interviewsare intended in part to gather information and in part to allow cus-tomers to voice opinions. A much larger sample than is necessary(perhaps the entire population) may be surveyed in part to developgoodwill. One author cites a university study of the opinions of allincoming freshmen as excessive from a sampling theory perspectivebut desirable from the standpoint of student relations.1
External Political Necessity. Sometimes studies are too extensivebecause of some perceived external requirement to leave no stoneunturned. This is typically the case when data are to be used in a le-gal case or in a regulatory setting.
Internal Political Necessity. When there is fear that a decision isabout to be attacked or a department is in some organizational jeop-ardy, research budgets can become bloated as researchers rush toprotect their jobs. This is not unlike the effect of growing malprac-tice threats on the research budgets of physicians and hospitals.
Rhetorical Necessity. For a researcher or a manager to win specificinternal corporate battles, it may be necessary to have a larger studythan is statistically essential. There may be some accepted samplesize below which those who must be convinced of the results willlack confidence. In a statewide telephone survey for a public healthagency, a sample size of five hundred was chosen because “prevail-ing wisdom, past experiences, and previous reports appeared to haveconspired to create the myth about the magic of 500.”2 In a corpo-rate setting, it is not uncommon to hear naive managers say, “Howcould you possibly conclude that when the sample size is so small?’
Decision-Based Research Budgeting
If the preceding examples outline approaches not to use to budgetresearch, then how should you do it? It will come as no surprise thatthe answer advocated here is to begin with the decision or decisions at is-
48 MARKETING RESEARCH THAT WON’T BREAK THE BANK
10Andreasen/Ch. 3 8/11/02 3:06 PM Page 48

sue. This, of course assumes that by the point at which the questionof how much to budget is raised, the potential researcher will haveframed the basic research issue in terms of one or more decisions tobe made by the organization. If this is not the case, then it is essen-tial that they or the managers involved go back and make this de-termination.
Structuring the Decision
What is it about the decision that will affect what should be spenton the specific research project—indeed, whether to spend any-thing at all? To answer this question, it will be useful to make a briefdetour into the academic world of decision theory, which is simplya structured way of thinking about management problems. It saysthat all decision situations have five major characteristics:
1. The decision alternatives
2. A decision environment
3. The expected outcomes
4. The probabilities of various future scenarios coming to pass
5. A decision rule
Decision Alternatives. The first step management must take is toset out all the realistic decision alternatives. These alternatives canbe very simple, such as whether to leave a price as it is or raise orlower it 6 percent, or relatively complicated, such as whether to (1)introduce product A containing raw materials 1, 2, and 3, at a priceof P, an advertising budget of $M, and an advertising theme of Q,or (2) introduce product B with raw materials 1, 4, and 6, at a priceof 2P, an advertising budget of $1/2M, and the same advertisingtheme Q. Nevertheless, the only requirement is that each alter-native should be mutually exclusive of every other alternative. The alternatives needn’t be exhaustive, but they should cover the ma-jor alternatives management is considering.
EVALUATING INDIVIDUAL RESEARCH PROJECTS 49
10Andreasen/Ch. 3 8/11/02 3:06 PM Page 49

A Decision Environment. The next step is to specify the majordimensions of the future environment that will affect whether thechoice of alternative 1, 2, or 3 is a good or a bad idea. These couldbe factors outside management’s control, such as future interestrates or the proportion of a market already owning a particular elec-tronic appliance or computer software. Alternatively, they could befactors over which management could have some influence throughthe alternatives it chooses, such as competitors’ prices and adver-tising budgets.
These environmental influences, formally called states of naturein the decision theory literature, also can be complex. For example,one future scenario facing a marketer of a new privacy softwarecould be that interest rates will be at 6 percent, 35 percent of themarket will own privacy software, competitors’ average price will be$312, and their average advertising budget will be $3.5 million. An-other future could be an interest rate of 7 percent, 20 percent pri-vacy software penetration, $350 average price, and advertising at$4.5 million. These alternative futures need not be exhaustive, butthey do need to cover the major possibilities.
Expected Outcomes. For each combination of decision alternativeand future environment, management must estimate an outcome.Typically, this outcome will be a dollars-and-cents estimate of theconsequences of taking some action in the face of some particularenvironment, such as net profits before taxes. For nonprofit organi-zations, the outcomes may be stated in other terms, such as votes fora candidate or for a referendum or the number of individuals takingup a good health habit or visiting a museum.
Probabilities of Future Scenarios Coming to Pass. Managers areusually not neutral about the future. They have hunches or intu-itions, often based on years of experience and sometimes on a re-cent similar situation, that some futures are more likely than others.Formal decision theory simply requires that management write downthese estimates as probabilities, called prior probabilities. They mustcollectively cover the most likely possible futures.
50 MARKETING RESEARCH THAT WON’T BREAK THE BANK
10Andreasen/Ch. 3 8/11/02 3:06 PM Page 50

A Decision Rule. This complex mix of alternatives, future envi-ronmental states, outcomes, and subjective probabilities must nowbe combined in order to come up with a final decision. This requiresthat management decide on a rule that it is going to use to chooseamong the alternatives. There are several rules that managementcould use. Two decision rules that are not usually recommended areoutlined in Exhibit 3.1.
A weighted average rule (called the expected value rule in formaldecision theory) is somewhere between the two extremes outlinedin Exhibit 3.1. It requires that the manager explicitly use the proba-bilities of the various future environments to weigh the outcomesunder each decision alternative. The recommended course of actionthen becomes the one that yields the best weighted sum of all possi-ble future outcomes, with each outcome weighted by the probabil-ity of its occurrence. This doesn’t guarantee one will be correct inany specific case. But in the long run, the weighted average rule willyield the best average payoffs. This is likely because in each decision
EVALUATING INDIVIDUAL RESEARCH PROJECTS 51
EXHIBIT 3.1 Decision Rules to Avoid.
Going for Broke. This rule, formally called the maximax criterion in decision theory, advocates that the manager choose that course ofaction that, across all combinations of actions and future environ-ments, yields the single best outcome. This is a rule expressly made forthe high rollers or for those organizations that believe they will standor fall on the basis of getting one big payoff. The major deficiency of this rule is that it expressly ignores all other (potentially negative)futures that are also possible.
Playing It Safe. The other extreme is to look at the worst outcomeunder each alternative course of action and choose the action that involves the best worst outcome. This is known formally as the mini-max criterion and is advocated for the very conservative organization.This might be one that is so financially strapped that it cannot sur-vive a very bad loss. For most organizations, however, this approach isalso faulty in that it does not consider other possible outcomes underthe chosen alternative that may greatly affect its overall desirability.
10Andreasen/Ch. 3 8/11/02 3:06 PM Page 51

instance, use is made of all that management knows about the deci-sion situation. The framework also gives needed direction in decid-ing when to do research and how much to spend on it.
A Simplified Example
To make this framework more concrete, let us consider a hypothet-ical, but typical, example of a simple research problem a low-budgetmanager might face.
Assume that the manager of a university conference center in awoodsy resort area wishes to increase room occupancy on week-ends. Weekends are a time with few conferences yet continuinghigh fixed costs of operation. Traditionally, the manager haspromoted weekend vacations at the center through a general-purpose brochure directed at three markets: university faculty,university staff, and alumni. The brochure describes the center’sprograms and features, trying to offer an incentive for everytaste and interest. He is now considering a brochure carefullytargeted at families with young children promoting familyweekends at the conference center. He believes such a brochurecan be narrowly distributed to those likely to have families bydeveloping a mailing list aimed at (1) assistant and associateprofessors, (2) staff who have been with the university five tofifteen years, and (3) alumni who graduated five to fifteen yearsago. Each of these groups can be precisely identified.
The proposed brochure would feature child-centered activities and would cost approximately $2,400 to produce.The manager’s principal concern at this point is that he is notsure that his target audience would be interested in family-centered weekends. Perhaps they may prefer childless week-end getaways. If that were the case, his new brochure mightactually decrease bookings by scaring away those who wish toescape. The key question he now faces is whether to conductresearch to assess the target audience’s preferences or to pro-ceed with his present best judgment.
52 MARKETING RESEARCH THAT WON’T BREAK THE BANK
10Andreasen/Ch. 3 8/11/02 3:06 PM Page 52

Assume that discussions with the manager produce the payofftable outlined in Table 3.1. If he continues to use the existing gen-eral brochure, his revenues will be unchanged (except for any trends)from what they are now. He estimates that if he uses the new bro-chure and is right about the audience being child centered, he willreap $10,800 added revenues from which he would have to deductthe cost of the brochure. If he is wrong, he will lose only $1,200 inrevenues, plus the $2,400 for the brochure. At the moment, he thinksthere is a 60 percent chance he is right.
Table 3.1 indicates that using the weighted-average criterion,the rational course without research is to go ahead with the newbrochure. The expected payoff is $3,600 greater than the payoffwith the traditional campaign. What is it worth to him to check outhis intuitions through research?
One way to approach the problem is to estimate the cost of un-certainty, that is, formally calculate how much he is worse off by notknowing the truth about his market. Let us assume the managercould acquire perfect information from the all-knowing MadameOlga. If Madame Olga found that the market wanted child-freeweekends, it would be better to send out the regular brochure andkeep the revenue as it is now (zero payoff). If Madame Olga said themarket wanted child-centered weekends, the manager would usethe new brochure and reap a payoff of $8,400. At the moment, hisbest guess is that there is a 60 percent chance that Madame Olgawill say the market is child centered and a 40 percent chance that
EVALUATING INDIVIDUAL RESEARCH PROJECTS 53
TABLE 3.1 Payoff Decision Table: Gains or Losses from Normal Campaign.
Alternatives Child-Free Child-Centered Weighted-Average Preference Preference Expected Payoff
New brochure –3,600 +8,400 +3,600Normal campaign 0 0 0Probability .4 .6
Weighted average expected payoff = .4 (–3,600) + .6 (+8,400) = +3,600
10Andreasen/Ch. 3 8/11/02 3:06 PM Page 53

she will say it is child free. Thus, the weighted expected outcomefrom perfect research (using Madame Olga) is $5,040 ([.6 x $8,400]+ [.4 x $0]). The difference between this expected payoff with per-fect information and the expected payoff without research is themost he would pay for this perfect study. This amount, $1,440, is adollar measurement of the cost of uncertainty. This manager is$1,440 worse off by not knowing with certainty what the truth is. Itrepresents the most he should pay for any research study since it isthe most that should be paid for a perfect study.
Determinants of the Cost of Uncertainty
Two factors directly affect the cost of uncertainty. The more obvi-ous one is the stakes in the decision. If we were dealing with dollaramounts ten times greater than those entered in Table 3.1, the costof uncertainty would also be ten times as great.
The other determinant is the manager’s uncertainty. But this un-certainty is not what you might think. It is not how uncertain themanager is about the state of the current market or what it will be inthe future. Rather, it is the manager’s uncertainty about the bettercourse of action to take. There are times when the manager will notneed research in spite of great gaps in knowledge about the marketif the organization is already quite committed to a specific programor course of action. Alternatively, research may be very important ifthe manager has strong feelings about the nature of the market butis quite unsure about what to do. The latter case often comes aboutwhen the manager has strong forebodings about the market but stillsees a particular venture as worth a try. For these reasons, we will re-fer to this second determinant of the research budget as decision un-certainty.
Imperfect Research
Of course, the manager cannot acquire a perfect study. We are thusstill left with the question of what the manager should do about
54 MARKETING RESEARCH THAT WON’T BREAK THE BANK
10Andreasen/Ch. 3 8/11/02 3:06 PM Page 54

buying a research study that will not be perfect. The first step in theexample is to ask whether there is any way to get a reasonable es-timate of the truth for less than $1,440. Since this is the upperboundary on research expenditure, it serves as a quick checkpointfor determining whether the study is feasible under any circum-stances.
Suppose the manager, after having read through the rest of thisbook, thinks that there are at least some techniques that might beuseful for this problem at a reasonable cost, such as conveniencesampling or telephone research using existing center staff. Thequestion now is how much should be budgeted for such researchgiven that it will be imperfect. There is a formal answer to this ques-tion using decision theory and a spreadsheet computer programwith which experienced decision makers are familiar. However, mostmanagers at this point simply use judgment and experience in thelight of the stakes and degree of decision uncertainty involved todecide just how much less than the maximum (perfect study) amountshould be committed.
Other Factors
Although dollars and cents of profit have been used as the measureof the stakes in the example, it is possible that the stakes may havesome nonmonetary elements, such as risks to a personal career or toa company’s Wall Street image or the possibility that a governmentagency will question a particular action. These consequences aredifficult to quantify, and a consideration of techniques to attemptto do so is beyond the scope of this book. However, it is perfectlyvalid, and indeed sound management practice, to augment or de-crease a particular dollars-and-cents outcome to take account ofnonquantifiable yet important outcomes in the decision environ-ment. For example, in the example, the manager might wish to adda value of $1,000 to the payoffs under the new brochure option toreflect an imputed value for the positive effects on staff motivationof trying any new approach.
EVALUATING INDIVIDUAL RESEARCH PROJECTS 55
10Andreasen/Ch. 3 8/11/02 3:06 PM Page 55

When to Resist Research
This book is premised on the notion that research should be a morefrequently used management tool once a wider audience becomesaware that research can be understandable, low cost, and useful.
There are two kinds of danger here. First, if managers becomemore aware of research approaches that are relatively inexpensiveand relatively simple, they may do too much research, arguing, “Sincethe cost of the research can be kept so low, why don’t we go aheadand do the research anyhow?” Such “Why not?” research can leadall too often to wasted research funds. The manager who too oftensays, “Why not?” may well be one who will eventually shift from apositive attitude toward research to a negative attitude. Since manyof the “Why not?” studies will be of little value to the managers,they may well come to conclude that research indeed usually iswasted.
There are two major rules to apply in order to resist the urge todo unnecessary research:
• Resist the research urge if the research is not directly relatedto some decision to be made.
• Resist the research urge if there is not some reasonable degreeof uncertainty as to the correct action to take.
The second danger in too much research is that attempts to dolow-cost research will quickly degenerate into the old faithful cheapand questionable research. Later chapters introduce a number oftechniques that are relatively simple and straightforward in conceptin addition to being low in cost. Each of these chapters contains ad-monitions to observe standards that will differentiate good fromquestionable research. I will try to make it difficult for the careful re-searcher to carry out questionable research unknowingly. Where costconstraints force an easing of quality constraints, however, the re-searcher must know where the potential biases will creep in and howto make allowance for them in subsequent decision making.
56 MARKETING RESEARCH THAT WON’T BREAK THE BANK
10Andreasen/Ch. 3 8/11/02 3:06 PM Page 56

Being able to carry out a quality research program successfully,even a low-cost one, requires considerable training (or at least care-ful reflection about what is written in this book) and care and con-scientiousness. Resist the research urge if the research is likely to be flawedin ways that cannot be estimated or adjusted for when making a decision.
There are also a number of other situations to avoid research:
• Resist doing research if it is really designed to bolster personal in-securities. A manager who has worked through the decision frame-work outlined above and come to the clear conclusion that researchis not a rational choice should not still go ahead because the re-search is not too expensive and will make him or her feel betterabout the risky action about to be taken.
• Resist research if it is designed only to provide ammunition to jus-tify a decision to others in the organization. If experience says that theboss or rival managers will insist on research to back up your ac-tions, do the research. This is a rational choice, but costs should bekept within reason. However, the research should not be done onthe rare chance it will be politically necessary.
• Resist research designed just to check up on how things are going.Unless such checking is part of a consciously designed program ofmarket monitoring or unless there is reason to believe something isup out there, this checking up is just another managerially coward-ly act. Keep an ear to the ground informally all the time; however,committing research dollars where an informal ear will suffice is anabuse of fiduciary trust.
• Resist research that is, at base, a fishing expedition. Over time,every manager faces spells of corporate malaise and vague uneasinesswhen someone may say, “Why don’t we take a look at . . . ?” If thelook can be justified by some concrete suspicions or supporting ratio-nale, then formal research can be justified. A fishing expedition canbe pleasurable, and if it is just the manager’s own time and money in-volved, it is not irresponsible. Indeed (like all fishermen, I suspect),the manager may catch fish just often enough to be convinced thatthe activity is justified by the payoff. However, in research, if the
EVALUATING INDIVIDUAL RESEARCH PROJECTS 57
10Andreasen/Ch. 3 8/11/02 3:06 PM Page 57

activity is not rationally justified as helping managers make specificdecisions now or in the future, avoid it.
• Resist research that is designed to appeal to the manager’s curiosity.Many wasteful research projects have grown out of the pregnant ex-pression, “Wouldn’t it be interesting to know if . . . ” (for example)more women used the product than men; corporate ads reached a lotof political bigwigs; the eastern region was more profitable becauseit had more large accounts; and so forth. Interesting research resultsare not useful research results unless they affect actions. Wheneverthe manager hears (or says), “Wouldn’t it be interesting . . .” a loudbell should ring. First analyze the decision carefully on paper, askingwhether further research information would change the decisionmaterially. If the answer to the question is no, the conclusion shouldbe to suppress curiosity and not waste company resources.
• Resist research that keeps up with the Joneses. Rare is the man-ager who hasn’t once in a while come back from a conference, ameeting with the advertising agency, or a telephone call to anothercompany division frustrated that someone else is doing more or dif-ferent research than he or she is. This is particularly a problem withresearch fads. Many years ago, I was asked to do a psychographicsstudy for a major eastern bank. (A psychographics study would de-velop information on customer demographics and lifestyles thatwould yield recognizable customer segment types; for example,“fearful seniors,” “risk-taking Boomers,” and so on.) It seems thatthe marketing director had just returned from a conference whereeverybody was talking psychographics. The manager felt left out,behind the times. His ego was bruised. And darn it, he was going tohave his psychographic study.
A two-hour discussion quickly revealed two things. First, themanager had not at all thought through how he was going to usethe psychographic study to affect advertising decisions, product of-ferings, or, indeed, much of anything else. He apparently expectedthis to emerge from the results (the fishing expedition problem).Second, our discussions revealed a lot of more important gaps in thebank’s marketing knowledge that cried out to be filled before doing
58 MARKETING RESEARCH THAT WON’T BREAK THE BANK
10Andreasen/Ch. 3 8/11/02 3:06 PM Page 58

a psychographics study. A simple inexpensive research project wouldanalyze internal records to learn which customers used more thanone service (had a checking account and a safety deposit box or hada mortgage and certificates of deposit, and so on). This exercisecould yield management much valuable information as to whichservices to sell to customers of other bank services and which to sellto single-service customers. A short survey of multiple-services cus-tomers might also be undertaken to assess reasons for heavy use andmotivations and barriers that seemed to affect multiple use. Suchinsights could then suggest how solicitations directed at single-service users could be worded. (The bank manager found someoneelse who would do his psychographics study.)
• Resist research for the sport of it. Research can be seductive.Many times, I have found myself going back to do one more com-puter run or send out one more particularly complex questionnaireor conduct a simple little experiment just because I was excitedabout the project. It is challenging to see whether I could do it! ButI try hard to avoid these urges, especially when I am spending some-one else’s money. Research can be fun. It can provide its own mo-mentum. It is absolutely crucial to make sure that this momentumis toward useful research and not toward research for its own sake.To do otherwise will make the researcher in effect an accomplice tomisappropriation of corporate resources.
EVALUATING INDIVIDUAL RESEARCH PROJECTS 59
10Andreasen/Ch. 3 8/11/02 3:06 PM Page 59

4Backward Marketing Research
An executive of a performing arts organization company de-cided that she knew too little about the consumer segments she wasserving or hoped to serve. She had been practicing an obvious seg-mentation strategy aiming some programs at younger audiences,some at older ones, some at families, and some at singles. She neededa more sophisticated strategy, so she commissioned a research agencyto analyze the company’s market. Despite high hopes, glowing prom-ises, and the production of a glossy report heavy with statistics, theexecutive was disappointed in the findings. She said, “The researchmostly told me things I already know.”
Her service operated in an industry whose primary consumershad already been studied more than two hundred times. Each studysaid virtually the same thing as this one: the audience was largely fe-male, economically upscale, well educated, urban, and mainly on ei-ther end of the age distribution scale.
“Even where the results were new,” she said, “they didn’t tell mewhat I needed to know so I could use them.” The consumer profilerelied on demographics as the principal segmentation variable.“Sure,” the manager added, I know that men attend less often thanwomen, but why? Do they see fewer benefits than women, or are
60
Much of the material in this chapter originally appeared as Alan R. Andreasen, “‘Back-ward’ Marketing Research,” Harvard Business Review, May–June 1985, pp. 176–182. Copy-right © 1985 by the Harvard Business School Publishing Corp.; all rights reserved.Reprinted with permission.
11Andreasen/Ch. 4 8/11/02 3:06 PM Page 60

there barriers to attendance that apply to men and not to women?And what about the age profile? Does the middle-aged group dropout because we don’t meet their needs, or are they just focused onthings that we can’t match, like building a family?” She had learnedwho her customers were but nothing about how to motivate them.
“When the researcher tried to explain the results, it was obvi-ous he hadn’t understood what I wanted. The results were all a bitoff the mark.” Consider the measurement of loyalty. The researcherassumed his client wanted a behavioral measure, so he sought in-formation on the proportion of recent entertainment purchases thatwere from each type of performing arts and each location. But hisclient also wanted an attitudinal measure revealing consumer in-tentions. She wanted to know less about their past loyalty than abouttheir likely future loyalty.
How Research Goes Wrong
We can sympathize with this executive’s complaints, although clear-ly she must share the blame for poor study design. She neglected tomake the undertaking a real collaboration with the researcher, acommon fault. Indeed, studies of research successes and failurespoint again and again to close collaboration between researcher andclient as the most important factor predicting a good outcome.
The typical approach of the two parties starts with defining theproblem. Then they translate the problem into a research method-ology, which leads to the development of research instruments, a sampling plan, coding and interviewing instructions, and other de-tails. The researcher takes to the field, examines the resulting data,and writes a report. This traditional approach is outlined in Figure 4.1.
The executive then steps in to translate the researcher’s submis-sions into action. She has, of course, already devoted some thoughtto the application of the results. From my observations, however, be-fore the research is undertaken, the intended action is left vague andgeneral. Managers tend to define the research problem as a broadarea of ignorance. They say, in effect, “Here are some things I don’t
BACKWARD MARKETING RESEARCH 61
11Andreasen/Ch. 4 8/11/02 3:06 PM Page 61

know. When the results come in, I’ll know more. And when I knowmore, then I can figure out what to do!” In my experience, this ap-proach makes it highly likely that the findings will be off-target.
I suggest a proven procedure that turns the traditional approachto research design on its head. This procedure, which stresses closecollaboration between researcher and corporate decision makers,markedly raises the odds that the company will come up with find-ings that are not only interesting but will lead to actionable con-clusions.
There are only two cases in which research is not expected tobe immediately actionable. The first is when the research is intended
62 MARKETING RESEARCH THAT WON’T BREAK THE BANK
Define the research problem
Check secondary sources
Determine primary research strategy
Estimate research cost
Design questionnaire
Design sample
Implement research design
Analyze data
Write report
FIGURE 4.1 Forward Research Design.
11Andreasen/Ch. 4 8/11/02 3:06 PM Page 62

to be basic—that is, to lay the groundwork for later investigation oraction rather than have any near-term impact. The second occa-sion is when the research is methodological—that is, designed toimprove the organization’s ability to ask questions in the future. Ex-cept for these two instances, research should be designed to lead toa decision.
Turning the Process on Its Head
The backward approach I advocate rests on the premise that the bestway to design usable research is to start where the process usuallyends and then work backward. We develop each stage of the pro-cess on the basis of what comes after it, not before. This approachis outlined in Figure 4.2. The procedure is as follows:
Step 1: Determine what key decisions are to be made usingthe research results.
Step 2: Determine what information will help managementmake the best decisions.
Step 3: Prepare a prototype report and ask management ifthis is what will best help them make their decisions.
Step 4: Determine the analysis that will be necessary to fillin the report.
Step 5: Determine what questions must be asked to providethe data required by the analysis.
Step 6: Ascertain whether the needed questions have beenanswered already somewhere.
Step 7: Design the sample.
Step 8: Implement the research design.
Step 9: Write the report.
Step 10: Assist management in implementing the results.
Step 11: Evaluate the research process and its contribution.
As one might expect, the first step is the most important.
BACKWARD MARKETING RESEARCH 63
11Andreasen/Ch. 4 8/11/02 3:06 PM Page 63

64 MARKETING RESEARCH THAT WON’T BREAK THE BANK
Determine what key decisions are tobe made using research results
Determine what information will helpmanagement make the best decisions
Prepare prototype report and askmanagement if this is what will best
help them make their decisions
Determine the analysis that will benecessary to fill in the report
Ascertain whether the neededquestions have been answered already
Assist management inimplementing the results
Evaluate the research processand contribution
Design the sample
Implement the research design
Write the report
Determine what questions must beasked to provide the data required
by the analysis
FIGURE 4.2 Backward Marketing Research.
11Andreasen/Ch. 4 8/11/02 3:06 PM Page 64

Step 1: Determine What Decisions Are to Be Made
To most managers, the research problem is seen as a lack of impor-tant facts about their marketing environment. A manager may say,“The problem is I don’t know if service A is preferred over service B,”or, “The problem is I don’t know if my collaborators are more satis-fied with my organization than my major competitor’s partners arewith them, and if they aren’t, what they’re unhappy about.” By de-fining the problem, the solution is simply a reduction in the level ofignorance. The data elicited may be very interesting and may givemanagers a great deal of satisfaction in revealing things they didn’tknow, but satisfaction can quickly turn to frustration and disappoint-ment when the executive tries to use the results.
Consider a lifestyle study done not long ago on over-the-counter drugs. Some respondents who claimed they were alwaysgetting colds and the flu were very pessimistic about their health.They frequently went to doctors, but the doctors were never muchhelp. The respondents thought that over-the-counter drugs were of-ten beneficial but weren’t sure why. This information, together withother details, caused the researchers to label this group the hypo-chondriacs.
What to do with these results? As is usually the case with seg-mentation strategies, there are quantity and quality decisions tomake. The company has to decide whether to pump more market-ing resources into the hypochondriac group than its proportion ofthe population would justify. The marketing vice president mightfirst say yes because the hypochondriacs are heavy over-the-counterdrug users, but the picture is more complicated than that. Perhapshypochondriacs are sophisticated buyers, set in their purchase pat-terns and loyal to favorite brands. If so, money aimed at them wouldhave little impact on market share. Light users, on the other hand,may have fragile loyalties, and throwing money at them could en-tice them to switch brands. Of course, just the opposite might be true:the hypochondriacs, being heavy users, might prove highly impres-sionable and responsive to compelling ads.
BACKWARD MARKETING RESEARCH 65
11Andreasen/Ch. 4 8/11/02 3:06 PM Page 65

On the qualitative side, lifestyle research could be much morehelpful. Since it generates a rich profile describing each group’s jobs,families, values, and preferences, this research could tell the com-pany what to say. But the frustrated manager is likely not to knowwhere to say these things. There is no Hypochondriac’s Journal inwhich to advertise, and there may be no viewing or reading patternsthat don’t apply to heavy users in general, hypochondriacs or not.
A self-selection strategy could be tried: the company developsan ad speaking to hypochondriacs’ fears and worries in the hopethat they will see the message and say to themselves, “Ah, they’retalking about me!” But nonhypochondriac heavy users who readthe ad might say, “Well, if this product is really for those wimpyworrywarts, it certainly is not for sensible, rational me! I’ll take mypatronage elsewhere.” In this case, the research will be very inter-esting (fine fodder for cocktail party banter) but not actionable.
Suppose that the company had first laid out all the action alter-natives it might take after the study. If the marketing vice presidenthad made it clear that his problems were whether to allocate mar-keting dollars differently and whether to develop marketing cam-paigns aimed at particular, newly discovered segments, he wouldhave set the project in a more appropriate direction. In the firstcase, discussions with the researcher would help the vice presidentdetermine the criteria that would justify a different budget alloca-tion. Naturally, before he can reach a decision, the vice presidentneeds research on the likely responses of different segments to ad-vertising and promotional money spent on them. In the second case,the manager needs to know whether there are indeed channels forbest reaching these segments. Only by management’s first thinkingthrough the decisions to be made with the research results will theproject be started with high likelihood of action.
Step 2: Determine Information Needed for Decision
Conversations with management will reveal the kinds of answersthat will allow the choice among the courses of actions being con-
66 MARKETING RESEARCH THAT WON’T BREAK THE BANK
11Andreasen/Ch. 4 8/11/02 3:06 PM Page 66

sidered. These can often be multiple answers to increase chancesthat the right course will be chosen.
Step 3: Prepare a Prototype Report
Management should ask itself, “What should the final report looklike so that we’ll know exactly what moves to make when the re-port is in?” The collaboration between the researcher and the man-ager should intensify and prove dynamic and exceedingly creative.
Scenario writing is a good technique for developing ideas for thecontents of the report. The initiative here lies with the researcherwho generates elements of a hypothetical report and then confrontsmanagement with tough questions like, “If I came up with this cross-tabulation with these numbers in it, what would you do?”
The first payoff from this exercise arises from improvement ofthe research itself. These prototype tables can take the project for-ward by sharpening the decision alternatives and backward by in-dicating the best design for the questionnaire or pointing out howthe analysis of the findings should be carried out. (See Table 4.1 foran example prototype table.) The forward effect is evident in thefollowing case:
A manager marketing a high-priced service is consideringcancelling a discount for multiple purchases because shethinks that most people taking advantage of it are loyal cus-tomers who are already heavy users, are upscale, and arelargely price inelastic. Therefore, she speculates, the discountis just lost revenue. She is seriously considering dropping thediscount altogether. To determine whether this is a sound decision, she needs to predict the responses of both old andnew customers to the elimination of the discounts.
Suppose the researcher hypothesizes that long-time customerswill be price inelastic and new customers will be price elastic. Re-sults from such an outcome would be like those in Table 4.1. Here,
BACKWARD MARKETING RESEARCH 67
11Andreasen/Ch. 4 8/11/02 3:06 PM Page 67

we see that only 8 percent of her sales represents new customers andthat eliminating the discount will have little effect on old custom-ers. These results confirm the manager’s decision to drop the dis-counts. However, reflecting on the results in Table 4.1 showing thatnew customers do respond to the discount, the manager thinks,“What if we offered a one-time discount to consumers who havenever tried the service?” In considering this alternative, the man-ager realizes that before she can reach this decision, she needs toknow whether potential new customers can be reached with thespecial offer in a way that will minimize (or, better, foreclose) pur-chases at a discount by long-time customers.
This new formulation of the decision leads to a discussion of theresults that indicates that the study really needs to ask not onlyabout the permanent discount but also about a one-time discount.The results of these questions can be captured in another dummytable showing responsiveness to the one-time discount by past pa-tronage behavior, as in Table 4.2. This table suggests that it doesmake sense to go ahead with the one-time discount.
As the manager reflects on this table, she realizes that she stillneeds a way of minimizing the chance that old customers will takeadvantage of the one-time discount. One way this could be accom-plished is by avoiding announcing the offer in media that old cus-tomers read or listen to. This indicates to the manager (and theresearcher) that the questionnaire should also contain some ques-tions on media habits. And so it goes.
This pattern of presenting possible results and rethinking designneeds can be very productive. The process can sometimes have unan-
68 MARKETING RESEARCH THAT WON’T BREAK THE BANK
TABLE 4.1 Hypothetical Sales Results Before and After Discount.
Sales at Sales at Number of Discounted Price Nondiscounted Price Respondents
New customers 100 53 40Old customers 100 92 460
11Andreasen/Ch. 4 8/11/02 3:06 PM Page 68
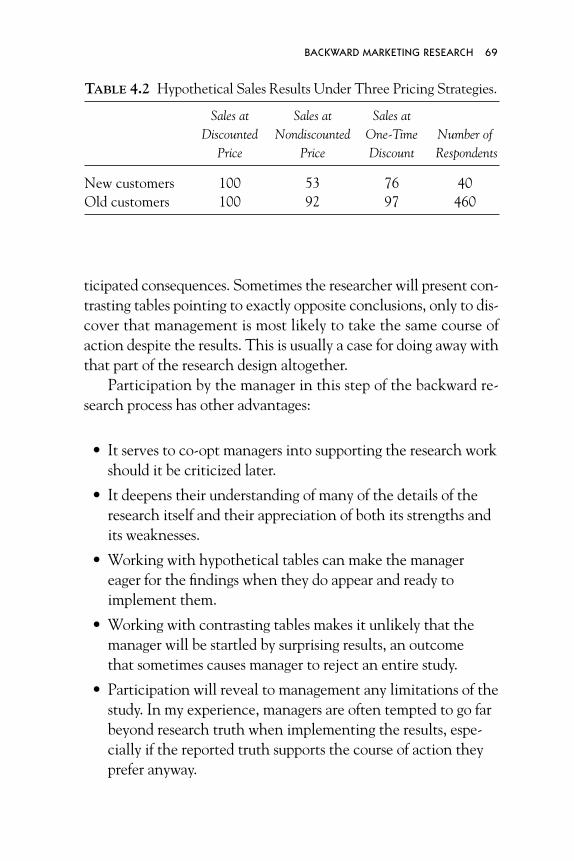
ticipated consequences. Sometimes the researcher will present con-trasting tables pointing to exactly opposite conclusions, only to dis-cover that management is most likely to take the same course ofaction despite the results. This is usually a case for doing away withthat part of the research design altogether.
Participation by the manager in this step of the backward re-search process has other advantages:
• It serves to co-opt managers into supporting the research workshould it be criticized later.
• It deepens their understanding of many of the details of the research itself and their appreciation of both its strengths andits weaknesses.
• Working with hypothetical tables can make the manager eager for the findings when they do appear and ready to implement them.
• Working with contrasting tables makes it unlikely that themanager will be startled by surprising results, an outcome that sometimes causes manager to reject an entire study.
• Participation will reveal to management any limitations of thestudy. In my experience, managers are often tempted to go farbeyond research truth when implementing the results, espe-cially if the reported truth supports the course of action theyprefer anyway.
BACKWARD MARKETING RESEARCH 69
TABLE 4.2 Hypothetical Sales Results Under Three Pricing Strategies.
Sales at Sales at Sales atDiscounted Nondiscounted One-Time Number of
Price Price Discount Respondents
New customers 100 53 76 40Old customers 100 92 97 460
11Andreasen/Ch. 4 8/11/02 3:06 PM Page 69

Step 4: Determine the Analysis Needed
The form of the report will clearly dictate the nature of the analy-sis. If management proves to be leery of analysis more complex thancross-tabulations in the earlier interactions, the researcher can de-sign a series of step-by-step tabulations for the report that can makea complex argument. If management is comfortable with the higherreaches of statistics, the researcher can draw out some of the moreadvanced analytic procedures. In general, however, the analysisphase should be straightforward. If the exercise of hypothetical tablewriting has gone well, the analysis should amount to little more thanfilling in the blanks.
Step 5: Decide on the Questions to Be Asked in the Study
The backward approach is very helpful in the data-gathering stagein indicating what kinds of data to gather. It can also help in word-ing questions. One large electronics manufacturer wanted to gaugeyoung consumers’ knowledge of and preferences for stereo compo-nents. Not until the researcher had prepared mock tables showingpreference data by age and sex did the client’s wishes become clear.By “young,” the client meant children as young as ten years old.Moreover, the client believed that preteens, being a very volatilegroup, undergo radical changes from year to year, especially as theyapproach puberty.
Original research design plans had set a lower age cutoff for thesample at age thirteen and grouped respondents by relatively broadage categories, such as thirteen to sixteen and seventeen to twenty.This design went out the window. If the researcher had been fol-lowing the usual design approach, the client’s expectations may nothave surfaced until the study was well under way.
Step 6: See If the Data Already Exist Somewhere
This exploration of existing secondary sources is now much easierthan it was a decade ago because of the Internet and because thereis simply much more marketing research going on.
70 MARKETING RESEARCH THAT WON’T BREAK THE BANK
11Andreasen/Ch. 4 8/11/02 3:06 PM Page 70

Step 7: Design the Sample
Backward design can also help determine the appropriateness of us-ing careful probability sampling techniques. If, for example, man-agement wants to project certain findings to some universe, theresearch must employ precise probability methods. On the otherhand, if the client is chiefly interested in frequency counts (say, ofwords that consumers use to describe the organization’s majorbrands or of complaints voiced about its frontline people), samplingrestrictions need not be so tight. In my experience, researchers of-ten build either too much or too little sampling quality for the usesthe company has in mind. Similarly, scenario writing will usuallyalso reveal that management wants more breakdowns of the resultsthan the researcher anticipates, requiring larger sample sizes or moreprecise stratification procedures than initially planned. Throughsimulating the application of the findings, the final research designis much more likely to meet management’s needs and permit lowfield costs.
Steps 8 Through 11
The first seven steps encompass the major advantages of the back-ward technique. Steps 8 through 9 revert to a traditional forwardapproach that applies the research decisions and judgments madeearlier. If all parties have collaborated well in the early stages, thesesteps will carry through what has already been largely determined.Note, however, that in this approach, the process does not stopwith writing the report. It is important to complete the research fol-low through, help management implement the results, and thenevaluate the research process itself (steps 10 and 11).
Conclusion
You can use the traditional approach and hope that careful think-ing about the problem will lead to the needed design improvements.However, the backward approach gives management and the re-searcher a specific step-by-step technique for ensuring that these
BACKWARD MARKETING RESEARCH 71
11Andreasen/Ch. 4 8/11/02 3:06 PM Page 71

improvements will emerge. The approach has the additional advan-tages of making management able to understand the results oncethey do appear, unsurprised by some outcomes, and eager and readyto put the findings to use immediately. More widespread adoptionof this approach will go a long way toward eliminating the percep-tion of too many managers that research all too often is obvious, off-target, or unimplementable.
Low-budget researchers cannot afford to fund projects that areobviously off-target or unimplementable. The backward approachtakes time, but in the long run, it is time well spent for both research-er and management. It guarantees the research the best possiblechance of being truly useful and used.
72 MARKETING RESEARCH THAT WON’T BREAK THE BANK
11Andreasen/Ch. 4 8/11/02 3:06 PM Page 72

PART TWO
Alternative Low-Cost Research Techniques
12Andreasen/Part 2 8/11/02 3:06 PM Page 73

5Using Available Data
In this chapter, we begin our consideration of techniques forproviding low-cost marketing research information. As we haveseen, many managers think that producing market informationmeans going into the field to collect data themselves. Field researchcan be done relatively inexpensively. However, it is always morecostly to gather new data than to analyze existing data. There is al-most always a gold mine of data in every organization simply lyingabout as archives waiting to be milked for their marketing and man-agerial insights. The primary goal of this and the next chapter is toalert low-budget researchers to the possibilities of discovering richmother lodes of information already available (often on the Inter-net) that are usually ignored, or at least greatly underused, by inex-perienced marketing managers.
One of the solutions is to get more information out of primarydata that you have already collected and superficially analyzed. It ismy experience that most primary commercial research data are sadlyunderanalyzed. Researchers sometimes lack the sophistication totake a deep cut into a study’s meaning. Sometimes they avoid suchsophistication because they believe that the managers for whomthey work would not understand the more complex results if theygave them to them. Most often, underanalysis is simply a matter ofnot having enough time. In the commercial world, often one studyis just barely done before it is time to move on to the next one.
75
13Andreasen/Ch. 5 8/11/02 3:07 PM Page 75
76 MARKETING RESEARCH THAT WON’T BREAK THE BANK
We will delay a consideration of advanced analytical techniquesthat could be applied to existing data (if time were available) toChapter Ten. We turn here to considering all of the other existingsources of data that often have never been thought of as a source ofmarketing research.
Archives
Existing data ready to be gathered and analyzed at a relatively mod-est cost represent an extremely diverse array. To put some order onthis diversity, it will be helpful to develop a classification scheme.This scheme not only helps organize the material in this and thenext chapter, but also offers a checklist for using the possibilities forthis kind of cheap in-house research.
There are two basic sources of existing information that arereadily accessible to conscientious low-budget researchers. First,there are existing records or documents that enumerate events, ac-tions, and outcomes that have already taken place. These recordsand documents, usually referred to as archives, include such runningrecords as billing invoices, fundraisers’ expense accounts, target au-dience complaint letters, and Web site hits. Archives can be furtherpartitioned into records that are generated by your own organiza-tion and records that are generated by somebody else. We will referto data collected in-house and by others as internal and externalarchives, respectively.
The second class of readily accessible data is phenomena thatare not already recorded but can be simply observed. Obvious ex-amples in marketing are observations of traffic flows of visitors to amuseum, license plates in a parking lot that can indicate geographicprofiles of customers, or conversations between contact people andcustomers. In the case of observation, some preliminary effort willhave to be made to record the data systematically before they canbe analyzed.
These two types of sources, archives and observations, have animportant feature in common: they do not involve questioning re-
13Andreasen/Ch. 5 8/11/02 3:07 PM Page 76

spondents or otherwise intruding on the subjects of the research.This helps keep the cost down. They also have another very im-portant benefit in improving research quality. A study conductedthirty years ago pointed out that research that is intrusive can havemajor distorting effects on the phenomena it is attempting to study.1
Asking people questions makes them wonder about the researcher’smotives, makes them cautious about what they reveal, and makesthem concerned about how they portray themselves, all of whichcan distort the answers they give. Overtly observing people as theyshop or watch television or talk to a salesperson can make them be-have more cautiously or rationally than they would otherwise. Inboth cases, the process of measurement alters that which is mea-sured. The advantage of the techniques that we will discuss hereand in the next chapter is that they can eliminate this potentiallymajor source of bias. Of course, if not systematically carried out, un-obtrusive observation or archival studies can have their own biases.But at least they are not compromised by distortions that the tech-niques themselves create.
In this chapter, we consider internal and external archives. InChapter Six, we explore the possibilities of using unobtrusive ob-servations.
Internal Archives
Most organizations are rich storehouses of data. These data can beseparated into two broad categories. First, there are records that rep-resent measurements of some kind—for example, sales records. Anexcellent cheap, good research project would be one that simply or-ganizes and analyzes such records in imaginative ways. The otherkind of internal record is what might be called measurable records:data that are transcribed in some nonnumerical form and so requireas a first step attaching numerical values to them. Examples of mea-surable archives that come most readily to mind are customer com-plaint letters, narrative reports of customer contacts, and reports ofvisits to competitive locations.
USING AVAILABLE DATA 77
13Andreasen/Ch. 5 8/11/02 3:07 PM Page 77

78 MARKETING RESEARCH THAT WON’T BREAK THE BANK
A simple enumeration or coding of the data in measured ormeasurable records can provide intriguing new insights to a mar-keting manager. Even in the rare case where the records are biased(as is the case with complaint letters), they can still be manageri-ally useful.
Internal Measured Records
Modern organizations collect and keep a great deal of data in nu-merical form. Such data are potential sources of rich insights to theperson who sets out to wring meaning from them.
Sales Reports. Sales reports are often a rich source of undetectedresearch insights. For example, magazine publishers routinely usenewsstand sales to judge the popularity of cover subjects and indi-viduals.
Consider the following example:
In the fall of 1997, Fran Herzog, the manager of a performingarts facility at a major midwestern university, was concernedabout the informal way she forecast attendance at variousevents. Forecasts were used to determine seating configura-tions for the facility and the number of ushers and concession-aires to hire and to estimate the likely revenues and profits (or losses). She was concerned that most of her forecasts wereseat-of-the-pants guesses based on her own experience andthat of her staff. She was eager to develop a better, more scien-tific approach, particularly if such a forecast could also serve asthe starting point for “What if?” speculations about the proba-ble effects of changing prices, increasing (or decreasing) advertising, or spending more for publicity.
Preliminary investigation into the problem by a seniorstaff member, Ardeth McKenzie, revealed that buried in thedrawers of the facility’s main office was a wealth of detaileddata in the form of sales records on performances over the past
13Andreasen/Ch. 5 8/11/02 3:07 PM Page 78

eleven years. Information for most, although not all, of the264 events over the period had been recorded on individualsheets of paper on the following performance characteristics:
• Prices charged in each of three seating categories
• Size of the total house
• Number of seats assigned to each price category
• Number of tickets sold at each price level
• Dollars spent on advertising
• Costs of the performance (for example, overhead,operating expenses, performers’ fees)
• Date and time of performance
• Weather on the day of the performance
McKenzie, a student in the university’s M.B.A. program,entered this rich trove of archival data into her personal com-puter and proceeded to apply multiple regression statisticalanalysis to it. The resulting equation showed management the extent to which sales were affected by price, advertising expenditures, time of year, and weather within each of severalevent categories, holding all the other factors constant. Although Herzog was hampered by small numbers of cases insome categories, the data gave her the more scientific platformshe desired from which to make her future predictions. Thenew model, of course, provided only ballpark figures. Herzogand her staff still added to the prediction base their own expe-riences and intuitions about the likely popularity of variousgroups and events they were thinking of booking. Still, thenew forecasting results were considered a major enhancementto what had been heretofore a seat-of-the-pants decision-making process. The forecasts were particularly useful at thebeginning of the planning year in helping management esti-mate the effects on annual revenue of different mixes of
USING AVAILABLE DATA 79
13Andreasen/Ch. 5 8/11/02 3:07 PM Page 79

events. Further use of the equations to explore alternativemarketing mixes was contemplated for the future.
A similar study some years ago analyzed season ticket prefer-ences of theater subscribers to the Mark Taper Forum in downtownLos Angeles. It analyzed sales data archives for 108 choices made bysubscribers each year from 1970 to 1976 using a complex multipleregression model. The model was very successful in explaining 79.2percent of the variation in sales. The researchers were able to tellmanagement that with other variables held constant:
• Saturday was the best day for performances, followed byThursday.
• Matinees were a bit more popular than evenings (other thingsequal, which they are usually not).
• Seating in section A was less preferred to section B, suggestinga possible price reduction for the former.
• Having a discussion after the performance had a positive motivating effect and should be continued.
• Subscribers preferred early weeks in the run of a particularshow. For this reason, they deserve particular attention as theywill have crucial word-of-mouth influence on later individualticket buyers.2
Pseudoexperiments. Attendance records can be the basis for track-ing the effects of unexpected occurrences in the organization’s en-vironment. Because attendance data comprise a continuing record,one can monitor the effect of some event or events by looking atperformance measures before and after that event. The occurrenceof unexpected events, like a blizzard or a strike at a major area em-ployer, is sometimes referred to as a pseudoexperiment. True experi-ments involve the random assignment of subjects (such as cities,outlets, or target audience members) to various treatment or control
80 MARKETING RESEARCH THAT WON’T BREAK THE BANK
13Andreasen/Ch. 5 8/11/02 3:07 PM Page 80

conditions so that effects due to factors other than the treatment (forexample, a new communication theme or the addition of a new be-havioral incentive) can be measured and eliminated. In a pseudo-experiment, the manager has not exerted such quality control. Thisoften means that the researcher will have difficulty separating outthe effects of the event under study from other things going on at thesame time.
In a pseudoexperiment, the researcher can dig back into theperformance archives to look at the effects of the uncontrolledevent on attendance. For example, compared to the previous pe-riod, did the four-week factory strike reduce attendance a little, a lot, or not at all? A problem of interpretation occurs if the re-searcher has no comparative contemporary situation in which theevent did not occur (in this situation, data from a similar operationin a similar community with no factory strike). There is always thepossibility that the change in attendance would have occurred with-out the strike.
Even where there is a comparison site with no strike, the re-searcher may still have problems. The comparison site communitymay be enjoying a long-term economic upturn (or downturn), orthe comparison institution may have recently changed its own of-ferings. Performance effects from the comparison site therefore maynot be generalizable to any other market. Consider a case whereone city raises its sales taxes and the researcher wishes to observe itseffect on performance. It may be that the taxes were increased onlybecause other city revenues, such as corporate or property taxes,were very low or declining. The performance archives may show adecline after the increase in city taxes compared to the period be-fore the sales tax increase. But the real (or major) cause may be ageneral decline in the local economy.
Pseudoexperiments using performance archives, however, canbe very helpful as a research approach, provided careful attention ispaid to thinking through (and discounting) all other possible causesof the effects observed. An example will be illuminating:
USING AVAILABLE DATA 81
13Andreasen/Ch. 5 8/11/02 3:07 PM Page 81

In a project in which I was involved, a sales contest was heldamong three salespeople of a distributor of contraceptiveproducts in a developing country. Analysis of sales archives for the contest period during a three-month period indicatedthat (1) sales for the three salespeople overall had risen com-pared to the year-earlier period, (2) the sales increase hadbeen greater for only one of the two product lines, and (3)only one of the three salespeople had exceeded expected sales.
Management wanted to know whether such contestsshould be used in future. A first problem was to see whetherthe contest did have an impact on sales as total sales had risenover the year-earlier period. The real question was, Whatwould have happened to these sales had there not been thesales contest? The year-earlier figures were the best benchmarkassuming there were no major year-to-year increases in overallsales. Unfortunately, the latter was not true. There had been amajor increase in sales over the previous year.
Reanalysis of the sales data archives showed that the in-crease over the year-earlier sales achieved in the three-monthcontest period almost exactly equaled the increase in sales for both products for the other nine months of the same year.Thus, it was tentatively concluded that the sales contest’soverall effects were due to a general upward trend in sales, not to any special sales efforts on the part of the contest participants.
But that did not explain why one salesperson exceededthe others. One possibility was that the winner was able per-sonally to increase sales as the contest intended. However, thewinner had a territory that contained the largest retail outletsin the country’s capital city, which contained half the coun-try’s population. This fact suggested that the higher level ofsales was made possible by the fact that the salesperson’s largeaccounts could more easily load up inventory under pressurefrom a persuasive salesperson who was trying to win a contest.The smaller retail stores served by the other salespeople pre-
82 MARKETING RESEARCH THAT WON’T BREAK THE BANK
13Andreasen/Ch. 5 8/11/02 3:07 PM Page 82

sumably would less often have the financial strength to be soaccommodating.
A few telephone calls to the larger outlets in the winner’sterritory could reveal the truth. If the results of the callsshowed no loading up, one would not be able to rule out suchbehavior. First, it is possible that the retailers might not haverecalled their behavior for one or two minor products in onespecific three-month period (in this country, one could notrely on their store records). Alternatively, the retailers mightsimply lie, not wanting to admit that they had been coercedinto excessive inventory accumulation.
Since this obtrusive procedure seemed likely to be unsatis-fying, an obvious use of another archive, invoices of sales tothe individual outlets, seemed a reasonable and potentiallyunbiased alternative. Although the database was small, theoverall indications from this analysis were that excessive load-ing up by the large retailers was not a factor. It was concludedthat sales in this one territory had benefited from the contest.However, the fact that two markets showed no effects ledmanagement to conclude that contests were probably not agood way to increase sales.
Individual Transaction Records. Sales invoices can give importantinsight into what is going on in a particular market and can be ana-lyzed in other ways too. For example, fundraising records can allowcalculation of average donation per transaction. When compared tothe cost of each transaction, figures can indicate whether some do-nors are not worth visiting or some proposals not worth making.
Dates on transactions can be used to calculate how often contactpeople visit customers or donors and the average length of time be-tween visits (assuming that most contacts result in transactions). Ananalysis of transaction proceeds can show whether contact people al-locate their visit frequencies proportional to the expected returns.They can also reveal which contact people have favorite customersthey seem to like to visit regardless of potential.
USING AVAILABLE DATA 83
13Andreasen/Ch. 5 8/11/02 3:07 PM Page 83

Separate analysis of refund slips can provide early warnings ofweak products or services. Also, the analysis of the number of voidedinvoices or of the thoroughness with which invoices are filled outcan help evaluate the quality of individual staff members.
Sales invoices can be used to double-check other data collectedin primary studies, for example, to validate a survey respondent’s re-ported purchases. A study of the family planning product distribu-tion system in Bangladesh made detailed use of distributor’s callrecords to help verify data on purchases reported by retailers in a re-tail audit. These archival data gave the researchers confidence inthe primary field data that could not be obtained in any other way.
Postal code locations of customers can be analyzed. Is greater at-tention suggested for a particular area? Should additional personnelbe assigned? When new products or services are introduced, in-voices can lead to the discovery of target markets by showing whethersome kinds of customers or some postal code areas are more likely totry the offering than others.
Contact Reports. Many organizations have personnel prepare ver-bal reports of customer comments, trade show gossip, and other sig-nificant market behavior. Evaluation of the quality of such reportscan be used as one measure of staff performance.
Mileage per day, when controlled for territory size, can suggestthe extent to which contact people such as fundraisers are usingtheir time efficiently. And mileage data uncontrolled for territorysize can support a fundraiser’s claim that territories are too large andcause too much driving time.
Miscellaneous Records. In some service businesses, purchase or-ders for various supplies (such as soaps or shampoos for clinics orchildren’s game cards in child care centers) can be good indicatorsof demand for particular services. In addition, the number andlength of long-distance calls or Internet “conversations” can bemonitored to indicate staff activity and pattern of contacts.
84 MARKETING RESEARCH THAT WON’T BREAK THE BANK
13Andreasen/Ch. 5 8/11/02 3:07 PM Page 84

When the organization markets services to its own staff, ac-counting records can often identify important sales opportunities.Several years ago, a major university’s transportation department wasseeking new opportunities for renting its cars and trucks to facultyand staff. A computer analysis of accounting archives pinpointed de-partments that were heavy users of outside auto and truck rentalagencies. These departments were then targeted for direct personaland telephone selling by the transportation division’s staff.
Internal Measurable Data
Many kinds of archives are not in numerical form. Someone hasto quantify the data to make them usable for research purposes.Some archives of this type are complaint records and inquiries andcomments.
Complaint Records. Virtually all organizations receive letters andtelephone calls from irate target audience members. Surprisingly,though, few organizations routinely record the data in these poten-tial archives or analyze them. What is required is some relativelysimple master coding scheme that sets categories for (1) the orga-nizational activity or offering involved, (2) the nature of the com-plaint, (3) the original contact person, (4) the date and location ofproblem, and (5) complainer characteristics (plus whatever otherdata the organization may wish to track). Someone then must codeeach complaint letter or telephone call according to the preestab-lished categories so that the results can be added up and analyzed.
These data are potentially very rich, but they are biased in twoimportant ways. First, many studies suggest that those who volun-tarily complain are not fully representative of all of those with com-plaints. For one thing, someone with a problem who wants tocontact the organization must know how to complain and be some-what assertive and articulate, traits associated with higher edu-cation and higher social status. Poorer, less educated, more timid
USING AVAILABLE DATA 85
13Andreasen/Ch. 5 8/11/02 3:07 PM Page 85

customers are less likely to speak up. And in many categories, thelatter group of customers can represent a major target audience, andtheir unrelieved frustration may be the source of significant nega-tive word-of-mouth against the organization and its offerings in cer-tain communities. To tap the concerns of these noncomplainers, itwill be important from time to time to elicit their complaints usingsome other supplementary research technique, such as a limitedtelephone survey. For organizations with a more upscale clientele,the Internet might be used for the follow-up study.
The other source of bias in complaint data is that the com-plaints received are not necessarily representative of all types ofcomplaints. Not surprisingly, people are more likely to speak upwhen large costs or inconvenience are involved. They are also morelikely to speak up about things that are manifestly wrong and clearlythe marketer’s fault. If they are not sure that there really is a prob-lem (for example, they left the clinic with a headache they did nothave when they came) or if they think they might be partly orwholly to blame (“Maybe I should not have had so much coffee onan empty stomach”), they are less likely to speak up and registertheir complaints. But these unvoiced complaints have the poten-tial to be important problems for an organization because minorproblems can silently destroy a well-developed reputation. Perhapsmore important, these subtle dissatisfactions are just the kind ofthing that cause unhappy clients to decide not to come back or usea service again without telling anyone about their distress. Again,direct telephone or Internet studies from time to time may be neededto make sure that there are not whole classes of problems lurkingundetected in the community.
Although complaint data are flawed, they can still be very use-ful in identifying potentially serious organizational problems. Thisis particularly the case if complaint data are analyzed repeatedlyover time. One may choose not to trust the absolute level of com-plaints of various kinds at a single time because of the biases alreadynoted. However, changes in the number and types of complaintsover time may be a significant signal of either growing problems or
86 MARKETING RESEARCH THAT WON’T BREAK THE BANK
13Andreasen/Ch. 5 8/11/02 3:07 PM Page 86

(when they decline) improved performance. Even if the data arenot to be used over time, statistically large numbers of complaintsmay not be needed at all. A few cases may be enough to alert a man-ager to a problem that must be fixed before it sabotages a carefullywrought marketing strategy.
A good example of the latter is an observant analysis by theU.S. Consumer Product Safety Commission (CPSC). Many yearsago, the CPSC noted that among the medical complaints it was re-ceiving routinely from a small sample of hospital emergency roomswas a noticeable number of cases involving young boys who re-ported injuring their genitals while bike riding, This small numberof unusual cases led to investigation and eventually to the commis-sion’s recommending major changes in the placement and design of gear levers on boys’ bicycles sold in the United States. What thecommission discovered was that on many models, these levers werestill located on the crossbar, and boys in minor accidents were be-ing thrown painfully into the protruding gearshift levers. Only a fewentries in these medical archives were needed for the CPSC to dis-cover and correct a serious product design problem. This was pos-sible only because the CPSC had set up a system to assemble andtrack the complaints that hospitals had. Without a system, no one,except by chance, would have put together all the unique occur-rences to come up with such an important conclusion.
Finally, analysis of complaint data may have an important sec-ondary value in helping to evaluate personnel or partners who con-tribute to the organization’s mission. Many organizations seek outcomplaints through field surveys as a way of getting independent as-sessments of how their staff or partners are performing.
Inquiries and Comments. Consumers often write to or call organi-zations to complain. But they also write to and call to raise questionsand offer praise. When properly analyzed, these communicationscan give management a good notion of what is on people’s mindsand what might be emphasized in future. An imaginative use of suchrecords is the practice of magazines to carry out a yearly analysis of
USING AVAILABLE DATA 87
13Andreasen/Ch. 5 8/11/02 3:07 PM Page 87

its letters to the editor. Such analyses reveal significant shifts inreader interest. For example, letters about domestic news issues mayhave dropped, while letters on foreign issues have increased signifi-cantly. The letters also can reveal shifts to and away from supportingparticular groups or positions.
Miscellaneous Internal Measurable Records. Other sources ofunobtrusive internal measurements are notations on desk calendarsor appointment books or data in personal computer files (where or-ganizational policy permits such inspections) that, when collatedwith expense records and telephone bills, can help a manager eval-uate how effectively he or she is allocating personal time betweenmeetings, customer contacts, sales supervision, and other duties.Also, computers can be programmed to collect data on how peopleuse the system, what software routines they use most, and where vis-itors go on the organization’s Web site (and where they come from).
Information Centers
One approach that relatively large organizations are using to syn-thesize and process these internal data is to establish an informationtechnology (IT) center. It is, in effect, an internal consulting andservice unit that creates software and networks linked to the com-pany’s server so that computer users around a organization can haveaccess to the organization’s own internal databases. It helps trainmanagers in what databases are available and how to use them. Itguides managers in using the Web to mine data sources outside theorganization.
IT staff members are responsible for setting up the system andchoosing the software and hardware. They then spend many hoursconsulting and coaching early users to get them effectively on-line.Consulting begins in person and graduates to the telephone andeventually e-mail. Word-of-mouth spreads, and users typically tendto be highly satisfied with what is now really decentralized data pro-cessing.
88 MARKETING RESEARCH THAT WON’T BREAK THE BANK
13Andreasen/Ch. 5 8/11/02 3:07 PM Page 88

IT systems are not cheap. The low-budget researcher should pur-sue the IT idea only when other company departments will share thecost and where there is an overall organization commitment to theconcept.
External Archives
It is possible to divide data produced by others (that is, externalarchives or, as they are sometimes called, secondary data) into datathat are either measured or measurable. Obvious examples in thefirst case are the major marketing research data sources one couldpurchase or in an increasing number of cases acquire free on the Web(examples are census data and journal articles). In the case of mea-surable secondary data, the most obvious examples that come tomind are public evidence of donor interests, organizations, and po-tential partners’ strategies.
External Measured Records
Many sets of data, such as Census files, are already in numerical form.They may be in the form of raw data or already digested data.
Raw Data in Secondary Sources. The marketing world in devel-oped countries contains an extremely diverse and growing array ofsecondary data that a marketer can acquire at anywhere from virtu-ally no cost to rather hefty one-time or yearly fees. These data canbe separated into two broad categories depending on whether theyare raw data or data that have already been analyzed by others tosome greater or lesser degree. Raw data include census data tapes,purchased panel records, and academic researchers’ raw data, whichcan often be acquired at the cost of a few CD-ROM disks and a fewhours of programmer time. They can then be subject to the pur-chaser’s own analysis. However, when using someone else’s raw data,it is crucial to understand the potential biases in the data and, if nec-essary, adjust for them. This is always possible with one’s own data,
USING AVAILABLE DATA 89
13Andreasen/Ch. 5 8/11/02 3:07 PM Page 89

but sometimes it is difficult to learn from external sources. On theother hand, available raw data from outside sources have the distinctadvantage that they can be manipulated, categorized, summarized,or otherwise analyzed in any way the researcher wishes.
Predigested Secondary Sources. Sometimes the low-budget re-searcher may not have the time, equipment, or sophistication toanalyze someone else’s raw data. On such occasions, predigested ex-ternal data may be an excellent, and often superior, substitute.
An excellent source of predigested information for marketingmanagers is state, federal, and local government studies and reports,widely available in libraries, from government agencies, and on theWeb in increasingly accessible form. They are inexpensive and usu-ally very accurate. Marketers generally find particularly valuable thefollowing:
U.S. Bureau of the Census (www.census.gov)
• Decennial census of the population
• Census of housing
• Censuses of various industries (for example, retailing, whole-saling, services, manufacturing, transportation, agriculture,and minerals)
• Current population reports
• County business patterns
• Current business reports
• Selected characteristics of foreign-owned U.S. firms
• Quarterly financial reports for manufacturing, mining, and trade corporations
Other Federal Government Sources
• Federal Reserve Bulletin (monthly)
• Monthly Labor Review
• Commerce Business Daily
90 MARKETING RESEARCH THAT WON’T BREAK THE BANK
13Andreasen/Ch. 5 8/11/02 3:07 PM Page 90
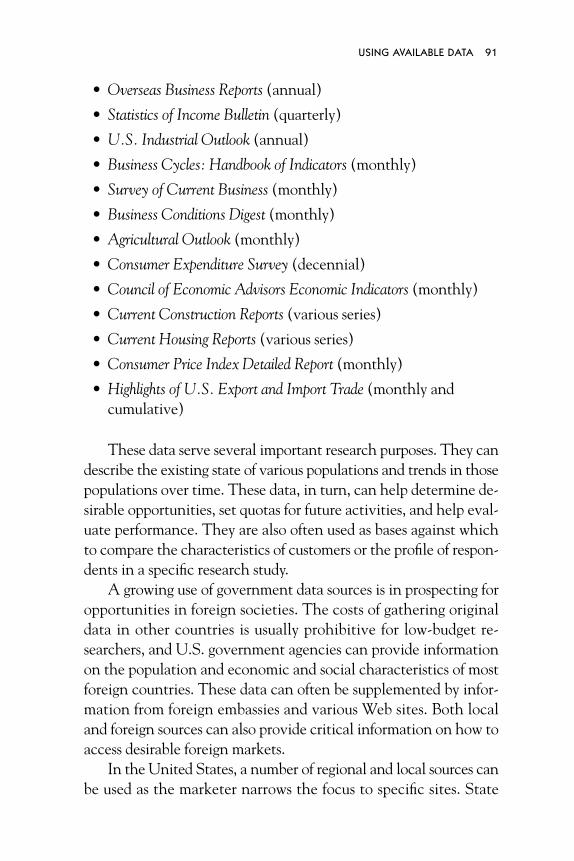
• Overseas Business Reports (annual)
• Statistics of Income Bulletin (quarterly)
• U.S. Industrial Outlook (annual)
• Business Cycles: Handbook of Indicators (monthly)
• Survey of Current Business (monthly)
• Business Conditions Digest (monthly)
• Agricultural Outlook (monthly)
• Consumer Expenditure Survey (decennial)
• Council of Economic Advisors Economic Indicators (monthly)
• Current Construction Reports (various series)
• Current Housing Reports (various series)
• Consumer Price Index Detailed Report (monthly)
• Highlights of U.S. Export and Import Trade (monthly and cumulative)
These data serve several important research purposes. They candescribe the existing state of various populations and trends in thosepopulations over time. These data, in turn, can help determine de-sirable opportunities, set quotas for future activities, and help eval-uate performance. They are also often used as bases against whichto compare the characteristics of customers or the profile of respon-dents in a specific research study.
A growing use of government data sources is in prospecting foropportunities in foreign societies. The costs of gathering originaldata in other countries is usually prohibitive for low-budget re-searchers, and U.S. government agencies can provide informationon the population and economic and social characteristics of mostforeign countries. These data can often be supplemented by infor-mation from foreign embassies and various Web sites. Both localand foreign sources can also provide critical information on how toaccess desirable foreign markets.
In the United States, a number of regional and local sources canbe used as the marketer narrows the focus to specific sites. State
USING AVAILABLE DATA 91
13Andreasen/Ch. 5 8/11/02 3:07 PM Page 91

agencies, banks, chambers of commerce, and local media produceconsiderable information to attract enterprises to their area. Thesedata are usually free and sometimes can be customized for the user.However, since some of these sources have a vested interest in in-fluencing others’ marketing decisions, the marketer should be cau-tious about the completeness and interpretations of data from thesesources.
Syndicated Services. Increasingly useful secondary sources for mar-keters are various regular series of data provided for a fee by syndi-cated services. One place to start is with the search engines availableon the Web. In addition to the general engines like Yahoo! andGoogle, there are what are called market research aggregator Websites, which have their own search capabilities and contain infor-mation on research reports from a wide selection of sources—for example:
www.AllNetResearch.Com
www.Bitpipe.com
www.MarketResearch.com
www.Profound.com
www.USADATA.com
After this, one can use a range of general-purpose and special-ized sources—for example:
• American Demographics magazine (www.marketingtools.com)—texts of the magazine’s publications
• Dow Jones and Company (www.dowjones.com)—Web linksto a wide range of financial and company data
• Mead Data Central—LEXIS-NEXIS databases (www.lexis-nexis.com) that provide full-text information on legal, business, and general news (fee for subscription)
92 MARKETING RESEARCH THAT WON’T BREAK THE BANK
13Andreasen/Ch. 5 8/11/02 3:07 PM Page 92

• Find/SVP (www.findsvp.com)—provides fee-based informa-tion searches
• USA Data (www.usadata.com)—reports on industries, geographical locations, and brands (available for a fee)
• The Dialog Company (www.dialog.com)—over 450 databaseswith millions of documents
• Forrester (www.forrester.com)—information on the Web andother business issues
• allnetresearch.internet.com—a wide range of data sources
There is a great deal of economic information from brokerageservices such as these:
• Ameritrade (www.ameritrade.com)
• Charles Schwab (www.schwab.com)
• Fidelity Investments (www.fidelity.com)
• E-Trade (www.etrade.com)
• CNN Financial News Network (www.cjjfn.com)
• Dun & Bradstreet (www.dnb.com)
In addition, there are a number of discussion sites where onecan ask others for help. A general-purpose site is USENET, whichhas thousands of discussion sites. Some of these groups have beenaggregated by other services—for example:
• Egroups (www.egroups.com)
• ForumOne (www.forumone.com)
• Topica (www.topica.com)
In addition, many academic and trade associations maintainlistservs that can be queried.
USING AVAILABLE DATA 93
13Andreasen/Ch. 5 8/11/02 3:07 PM Page 93

Predigested syndicated sources are well exemplified by the PRIZMsystem. For PRIZM, the Claritas Corporation collects a huge amountof primary data on the 35,600 postal code areas in the United Statesand then clusters these areas into sixty-two categories, which aregiven such colorful names as “Money and Brains,” “Shotguns andPickups,” and “Norma Rae-Ville” (see Table 5.1). Marketers can usethese data to help locate new markets or learn what sells in existingmarkets. They can acquire a list of all the postal codes in a selectedarea in the lifestyle categories that are deemed to be the best targetsfor their organization’s goods and services. Alternatively, PRIZMcan help define markets. A marketer can learn from PRIZM justwhich markets are the best prospects for particular products or ser-vices. PRIZM can
tell you more than you probably ever wanted to know about[an] area’s typical residents: what they like to eat; which carsthey like to drive; whether they prefer scotch or sangria, tunaextender or yogurt, hunting or tennis . . . which magazinesthey read, which TV shows they watch, whether they aremore likely to buy calculators or laxatives, whether they’resingle or are potential customers for a diaper service.3
Similar services are provided by the ACORN and MOSAICsystems. MOSAIC provides geoclustering data in several non-U.S.markets. These systems offer several advantages. A much broaderand richer database (for example, product purchases, demographicand economic data, television watching, magazine readership, andother relevant behavior for each postal code in the United States)can be brought to bear on a research problem than any individuallow-budget marketer could possibly afford. The data are subjected tomuch more sophisticated analysis by the research supplier than mostlow-budget researchers can afford. Finally, purchase of some part orall of these kinds of services usually includes some amount of con-sulting help from the database supplier that can materially supple-ment the low-budget researcher’s own skills. The disadvantage, of
94 MARKETING RESEARCH THAT WON’T BREAK THE BANK
13Andreasen/Ch. 5 8/11/02 3:07 PM Page 94

USING AVAILABLE DATA 95
TABLE 5.1 PRIZM Cluster Categories and Percentage of Population,2000.
Percentage of
Label Description Population
01 Blue Blood Estates Elite Super-Rich Families 1.3502 Winner’s Circle Executive Urban Families 2.4503 Executive Suites Upscale White-Collar Couples 1.1504 Pools and Patios Established Empty Nesters 1.8905 Kids and Cul-de-Sacs Upscale Suburban Families 3.4806 Urban Gold Coast Elite Urban Singles and Couples .3707 Money and Brains Sophisticated Townhouse 1.1
Couples08 Young Literati Upscale Urban Singles .76
and Couples09 American Dreams Established Urban Immigrant 1.74
Families10 Bohemian Mix Bohemian Singles and Couples 1.0211 Second City Elite Upscale Executive Families 1.9612 Upward Bound Young Upscale White-Collar 1.94
Families13 Gray Power Affluent Retirees in Sunbelt 1.67
Cities14 Country Squires Elite Exurban Families 1.5315 God’s Country Executive Exurban Families 2.9616 Big Fish, Small Pond Small Town Executive Families 1.4117 Greenbelt Families Young, Middle-Class Town 1.59
Families18 Young Influentials Upwardly Mobile Singles 1.08
and Couples19 New Empty Nests Upscale Suburban Fringe Couple 2.1220 Boomers and Babies Young White-Collar Suburban 1.13
Families21 Suburban Sprawl Young Suburban Townhouse 1.34
Couples22 Blue-Chip Blues Upscale Blue-Collar Families 2.2123 Upstarts and Seniors Middle Income Empty Nesters 1.12
13Andreasen/Ch. 5 8/11/02 3:07 PM Page 95

96 MARKETING RESEARCH THAT WON’T BREAK THE BANK
TABLE 5.1 (Continued)
Percentage of
Label Description Population
24 New Beginnings Young Mobile City Singles .9225 Mobility Blues Young Blue Collar/Service 1.54
Families26 Gray Collars Aging Couples in Inner Suburbs 1.9527 Urban Achievers Mid-level, White-Collar Urban 1.40
Couples28 Big City Blend Middle-Income Immigrant 1.16
Families29 Old Yankee Rows Empty-Nest, Middle-Class 1.26
Families30 Mid-City Mix African-American Singles 1.21
and Families31 Latino America Hispanic Middle-Class Families 1.5832 Middleburg Managers Mid-Level White-Collar 1.65
Couples33 Boomtown Singles Middle Income Young Singles .7334 Starter Families Young Middle-Class Families 1.5935 Sunset City Blues Empty Nests in Aging Industrial 1.65
Cities36 Towns and Gowns College Town Singles 1.3437 New Homesteaders Young Middle-Class Families 1.6438 Middle America Midscale Families in Midsize 2.34
Towns39 Red, White and Blues Small Town Blue-Collar Families 1.8540 Military Quarters GIs and Surrounding Off-Base .67
Families41 Big Sky Families Midscale Couples, Kids and 1.63
Farmland42 New Eco-Topia Rural White/Blue-Collar/Farm .87
Families43 River City, USA Middle-Class, Rural Families 1.9044 Shotguns and Pickups Rural Blue-Collar Workers 2.03
and Families
13Andreasen/Ch. 5 8/11/02 3:07 PM Page 96

USING AVAILABLE DATA 97
45 Single City Blues Ethnically-Mixed Urban Singles 1.446 Hispanic Mix Urban Hispanic Singles and 1.74
Families47 Inner Cities Inner City, Solo-Parent Families 1.9948 Smalltown Downtown Older Renters and Young 1.51
Families49 Hometown Retired Low-Income, Older Singles .93
and Families50 Family Scramble Low-Income Hispanic Families 2.2851 Southside City African-American Service 1.94
Workers52 Golden Ponds Retirement Town Seniors 1.4753 Rural Industrial Low-Income, Blue-Collar 1.75
Families54 Norma Rae–Ville Young Families, Bi-Racial Mill 1.37
Towns55 Mines and Mills Older Families, Mine and Mill 1.96
Towns56 Agri-Business Rural Farm-Town and Ranch 1.56
Families57 Grain Belt Farm Owners and Tenants 2.3658 Blue Highways Moderate Blue-Collar/Farm 2.02
Families59 Rustic Elders Low-Income, Older, Rural 1.77
Couples60 Back Country Folks Remote Rural/Town Families 2.1861 Scrub Pine Flats Older African-American Farm 1.58
Families62 Hard Scrabble Older Families in Poor Isolated 1.92
Areas
Source: Copyright 2001, Claritas Inc. Reprinted with permission.
13Andreasen/Ch. 5 8/11/02 3:07 PM Page 97

course, is that predigested results may not be exactly what the mar-keter needs since someone else has done the analysis according tothat person’s specifications or according to what that person thinksthe average client would want.
Thus, the summaries may not be the ones the marketer needs,critical details may be left out, and so on. It also means that the datawill likely be more expensive than the raw data since one must buythe analysis also. Nevertheless, the low-budget manager may chooseto accept these limitations and the likely higher cost because he or she doesn’t have the time or expertise to carry out the neededanalysis.
On-Line Databases. A major source of external data is now avail-able on-line. These external databases include such diverse infor-mation as:
• Newspaper and magazine stories
• Market characteristics for specific geographical areas
• Economic time series
• Stock quotes
• Company profiles
• Regulation, legislation, and legal cases
• Yellow Page listings in four thousand places
• Patents and trademarks
• Newspaper, radio, and television audiences
• Public relations releases
• Biographies
• Bibliographies and citations
• Ad placements by competitors
Many of these data are available for both the United States andother countries and can be accessed as full texts, data files, and in-
98 MARKETING RESEARCH THAT WON’T BREAK THE BANK
13Andreasen/Ch. 5 8/11/02 3:07 PM Page 98

dexes. Using different data files on-line, a low-budget researcher candefine a specific geographical area to be targeted; develop a demo-graphic profile of the market for today and five years into the future;develop psychographic profiles, audience preferences, and mediabehavior patterns for individuals in the target area; get Yellow Pageslistings of possible partners; learn if similar organizations are head-quartered or have branches nearby; access recent articles on orga-nizations to learn if they have any plans for a particular market; andreview general articles on the geographical area indicating whetherthere are important economic or political trends that may affect theorganization’s prospects.
All that is necessary to have access to this rich treasure trove ofdata is a computer terminal and a password to each needed databaseor database vendor. The password will be provided once the re-searcher has signed up with the system and sometimes paid an ini-tial or monthly subscription fee.
It is possible in most cases to go directly to the original sourcesof the data. However, most experienced on-line database users godirect or sign up with one or more intermediary vendors or infor-mation brokers. For one fee, a subscriber can have access to a rangeof databases. Among the best-known and widely used vendors arethe following:
• BRS (BRS Wormation Technologies, Latham, N.Y.): Biblio-graphical citations, abstracts, and (sometimes) full texts froma wide range of sources.
• CompuServe, Inc. (CompuServe, Columbus, Ohio), a divi-sion of H&R Block: Wide range of business data, includingStandard & Poor’s ratings, electronic clipping services, travelinformation, computer shopping, and a base of technical report information.
• DIALOG (DIALOG Information Services, Palo Alto, Calif.):The Business Connection service can provide corporate intel-ligence, financial screening, sales prospecting, and productand market analysis.
USING AVAILABLE DATA 99
13Andreasen/Ch. 5 8/11/02 3:07 PM Page 99

• Dow Jones News/Retrieval (Dow Jones News/Retrieval,Princeton, N.J.): Databases support two categories of services:Business and Investor Services (business data, news, stockquotes) and General Services (world news, travel, shopping).
• Mead Data Central: LEXIS, NEXIS and MEDIS (Mead DataControl, Dayton, Ohio): Full-text databases of legal, news,business, and general information, including medical refer-ences and financial and accounting information.
• SDC/ORBIT (SDC Information Services, Santa Monica,Calif.): Databases primarily in science and technology, although also patents and accounting,
• I.P. Sharp Associates: InfoService, InfoMagic (I.P. Sharp Associates Limited, Toronto, Canada): Primarily numericdatabases weighted toward aviation, economics, energy, finance, and news, with the data often in time series.
• The Source (Source Telecomputing Corporation, McLean,Va.): Business and financial information plus electronic networking.
• NewsNet (NewsNet Inc., Bryn Mawr, Pa.): News and information from newsletters, wire services, and specialty publications on industries and professions.
Costs for these services vary by supplier. In some cases, theremay be a sign-up fee. Beyond this, there may be a basic connect-timecost, usually varying by time of day or week (for example, prime time versus non–prime time) and by the speed with which data aretransmitted.
There may be additional costs for specific kinds of database spe-cific information. At first, the costs may seem relatively low. How-ever, considerable time can be eaten up with unproductive searches.Many of these systems are relatively difficult to use. Indeed, in manycommunities, there exist independent search specialists who can
100 MARKETING RESEARCH THAT WON’T BREAK THE BANK
13Andreasen/Ch. 5 8/11/02 3:07 PM Page 100

make searching more efficient by thinking the problem through off-line. Finally, even when the search is done, additional costs will beincurred in downloading or printing the accessed information. Tothe extent possible, on-line researchers prefer to copy informationonto a hard drive or floppy disc and then print it off-line, since thefiles can be very large.
The data can be extremely valuable, as suggested by one com-mercial company’s experience:
The company had learned that a competitor might be plan-ning an attack on one of its personal care products. The firmconsidered cutting price to meet the challenge, but first con-tacted the Helicon Group Ltd., a consulting firm specializingin competitive intelligence, to learn what it could from sec-ondary sources. Helicon developed the following informationfrom on-line sources:
• The competitor had been purchased several years earlierby a conglomerate.
• Local business newspaper databases did not report thecompetitor’s hiring an ad agency for a new product.
• The parent company had once tried to sell theunprofitable subsidiary.
• The parent’s commercial debentures were beingdowngraded, and a lawsuit was being filed by a debentureholder.
• A business news database indicated that a seniorexecutive had recently retired with no successor named,and two other executives had left.
The company realized from Helicon’s data gathering thatthe competitor posed no threat at all. A hasty price cut wouldhave been a very foolish action.4
USING AVAILABLE DATA 101
13Andreasen/Ch. 5 8/11/02 3:07 PM Page 101

Measurable External Archives
Some external archives are not in numeric form.
Competitors’ Advertising Expenditures. It is critical that man-agers know about important social and economic characteristics oftheir target audience and their industry and how they are changingover time. Many archives can provide this information: newspapers,magazines, the trade press, and even television and radio.
Managers may wish more detail, or they may find press reportsnonexistent. In such cases, they may wish to access an on-line data-base or collect the data themselves. If the marketer proceeds alone(for example, if the database does not include key communities orgroups), it will be difficult to assemble all of the newspapers or mag-azines that will give a full picture. Still, if the typical span of mediais relatively narrow (for example, if print media are the major ve-hicles in the sector), the manager may select a few representativeprint media and set an assistant to sampling such media routinelyon a monthly or quarterly basis to assess trends. Assuming the ma-jor media are covered, the manager’s repeated measures, althoughbiased, can reveal changes in important social and economic in-dexes. Alternatively, commercial clipping services can be engagedfor this task.
Communication Behavior. There are numerous possibilities forcollecting and analyzing the content of communications of keyplayers in the organization’s environment. For example, an anti-tobacco organization can assemble sample communications of to-bacco marketers and conduct an analysis to identify major themes,differences in strategy across target markets, and, perhaps most im-portant, subtle shifts in strategies over time. Managers may believethat a careful reading or viewing of these communications is enough.However, one person’s perceptions may be faulty or idiosyncratic.Worse, they may change over time so that changes that seem to betaking place in the real world are really changes in the manager’s in-terests and orientation.
102 MARKETING RESEARCH THAT WON’T BREAK THE BANK
13Andreasen/Ch. 5 8/11/02 3:07 PM Page 102

Systematic content analysis is required to provide objectiverecorded evidence. It is a technique that can be applied to adver-tising and several other measurable external archives, like com-petitors’ annual reports, publicity releases, direct mail messages,product packages, and inserts. The content analysis should observesome important precautions:
• The selection of the materials to be analyzed must be objec-tive and randomized in some fashion.
• Characteristics of the content to be measured should be de-fined in advance so that what the analyst sees does not undulyinfluence the determination of what should be seen. This setof characteristics can be modified subsequently if the analysisscheme is found to be incomplete in some important respect.
• Trial analyses of a subset of the materials should be conductedand rules established for ambiguous cases. (Is a goldfish a pet?Is the headline “greater-than-ever value” an indication of anemphasis on price or an emphasis on quality?)
• If at all possible, more than one individual should analyze thematerials, and at least some documents should be assigned tomore than one person simultaneously to establish interanalystconsistency and indirectly test the logic and consistency ofthe coding scheme.
Content measures will not tell management anything aboutwhich competitors’ messages work and which do not. However, insome rare cases, the anti-tobacco manager may notice effects on hisor her firm’s own performance (such as receptivity among policy-makers) following some measured change in tobacco company ad-vertising. This represents another example of a pseudoexperimentthat may yield some insight into what does and does not seem towork well in the organization’s environment.
Publicity. How the world views an organization and its perfor-mance is often clearly reflected in various public and semipublic
USING AVAILABLE DATA 103
13Andreasen/Ch. 5 8/11/02 3:07 PM Page 103

archival records. Two important sources here are (1) articles aboutthe organization and its offerings in newspapers, popular magazines,and the trade press, and (2) evaluations by rating agencies. Clearly,management will be interested in what is said about the organiza-tion and about its partners and competitors and undoubtedly willnotice such publicity when it chances across the desk. This casualreading can be turned into true research if the details of these pub-lic comments are routinely and objectively evaluated and recorded.On-line databases can be very valuable here.
Other Intelligence Gathering. Repetitive archival records of theactivities of key players in the organization’s environment can tellmanagers a lot about systematic changes in their strategies and tac-tics over time. One-time critical changes are equally important, butthey may be harder to detect. Fortunately, there are a number ofarchives that can be accessed to provide important intelligenceabout what is going on within other organizations’ managementsuites. Among the documents that would serve this function fromon-line databases are these:
• Publicity releases (for example, from the PR Newswire database).
• Speeches by organization personnel, including nonmarketerssuch as treasurers and lawyers, who often do not realize thevalue to a marketer of what they are saying.
• Articles by organization personnel in the trade press, academic journals, and popular periodicals.
• Any internal organization communication that may be acquired ethically.
• Patents applied for.
• Court records if the organization has been sued lately. Theseare rich sources of data on past practices and sometimes revealstrategy. (This is a reason that many firms avoid public trials.)
• Biographies of key executives whose past may give a good indication of future strategies. This can be particularly valu-
104 MARKETING RESEARCH THAT WON’T BREAK THE BANK
13Andreasen/Ch. 5 8/11/02 3:07 PM Page 104

able when the leadership at a major organization or politicalinstitution changes.
In addition to on-line databases, managers can do the following:
• Subscribe to all of the periodicals, trade magazines, academicjournals, and conference proceedings where valuable com-ments by key players might appear.
• Subscribe to an independent clipping service (some on-lineelectronic database vendors do this automatically).
If business information is needed, subscribe to the Wall StreetTranscript, which reports details of corporate presentations tosecurity analysts or brokerage firms.
• Require someone to consult search engines like Google regu-larly for references to key players (and to yourself).
• Require all organization personnel to routinely submit anydocuments acquired on visits to customers, attendance at conferences, and reading on airplanes that contain even thesmallest snippet of intelligence about other important organi-zations and institutions (and your own firm too).
• Purchase a few shares of business stock if you need to secureinsiders’ data on company plans and past performance.
• Send periodic letters of inquiry to industry or country analystsat the U.S. Department of Commerce, the Department ofAgriculture, the Department of State, or the National Refer-ence Center on industry topics.
Conclusion
Whatever the source, it is important to make the data flow rou-tinely into a low-cost competitive intelligence data bank. For thispurpose, a summary report of each secondary document should berecorded and put into a carefully indexed, preferably electronic fileto be collated and reviewed periodically. As the examples in this
USING AVAILABLE DATA 105
13Andreasen/Ch. 5 8/11/02 3:07 PM Page 105

chapter indicate, even the slightest advance warning of changes inthe organization’s environment can have major benefits for the alertand rapidly responding marketer.
106 MARKETING RESEARCH THAT WON’T BREAK THE BANK
13Andreasen/Ch. 5 8/11/02 3:07 PM Page 106

6Systematic Observation
We saw in the previous chapter that archival data are all aroundus. We just need to find them and, in some cases, apply measurementsto them to change them from inert data into managerially useful in-formation. What sets the truly superior manager apart is not leavingthese insights to chance. The superior manager realizes that a sys-tematic application of low-budget research techniques directed in theright places can make rare insights routine.
Knowing where to look and being systematic about looking arethe two keys of effective and efficient use of archives. These sametwo principles apply equally well to mining information from otherfeatures of the environment that are not written records. In this chap-ter, we are concerned with the use of observations of the physical,human, and electronic environment as a means of conducting low-cost marketing research.
The chapter focuses on each step of the observing process. First,researchers must create the opportunity to observe. These opportu-nities can be classified as episodic or repeated observation and di-vided into natural and contrived occasions. Contrived observationsare episodes where the researcher intervenes in natural events andwatches what happens. They are usually found in formally designedexperiments, which are considered in the next chapter.
Setting up the opportunity to observe is not enough. The effec-tive researcher needs to know how to observe. Thus, the chapter
107
14Andreasen/Ch. 6 8/11/02 3:07 PM Page 107

108 MARKETING RESEARCH THAT WON’T BREAK THE BANK
considers briefly the kinds of observations that can be made andprocedures for doing so.
Systematic observation represents the ultimate in cheap butgood research. Observations represent free goods. Marketers alreadyuse these free goods daily. They watch customers. They look at andevaluate other organizations’ advertising and their own. They visitother service establishments or eat in their restaurants. They signup for a service to see how a competitor treats a customer. And theytry new approaches and see how they work. They try calling clientsby their first names for a while and see if they warm up faster orseem to buy more. They reshuffle their displays or change their roomarrangements and see if these make a difference in traffic patterns.Good marketers are doing this kind of free research all the time, butmost of it is neither systematic nor purposeful.
Too often, marketers treat casual observation as if it were trulya free good. They shouldn’t. Good observational research is notcostless at all. It must be systematic and objective. This can be hardwork. It requires that systems be put in place, that at least moderatepreplanning be undertaken, and that observers be trained to be ob-jective and thorough in what they observe. It is only when these investments are made that chance voyeurship turns into serious re-search.
Collecting Natural Observations
Observations and archives can be episodic or continuing. An epi-sodic observation is a one-time look at a phenomenon of interest.This can come about as a result of a particular one-time research in-terest. For example, a manager considering a relocation may observethe ages and types of automobiles passing a proposed new site orparked at nearby shopping centers to gather information to help de-cide how much volume to anticipate, what price level might be ap-propriate, and how fancy the premises should be. A social serviceagency might observe what waiting room brochures are most oftenthrown in the wastebasket to learn what topics or content are leastappealing. The manager of a cafeteria might observe the number of
14Andreasen/Ch. 6 8/11/02 3:07 PM Page 108

orders placed for a new menu item and then how much of each serv-ing is left on plates to decide whether to keep the item on the menu.
Observations in both episodic and continuing situations typi-cally comprise one or more of three activities: counting, measuring,or seeking patterns. They can be carried out both obtrusively, aswhen one visits a competitor’s fundraising event and takes notes, orunobtrusively, as when a child care center uses two-way mirrors toobserve how children play with the toys and how they interact.These observations can be done by people or by mechanical or elec-tronic devices.
Counting
This research typically involves quantifying objects (including peo-ple) or behaviors of special interest. Counting typically has as itsgoal either estimating demand for something or assessing responseto some marketing tactic. Web sites can be equipped with softwareto do such counting automatically.
Counting was the principal research method DioLight Technol-ogy used to decide which markets to target for its new long-lastinglight bulb. DioLight’s marketing director, Kevin Callaghan, visitedoffice buildings and counted the average number of exit signs thatwould need long-lasting bulbs. He also developed secondary data tolearn the number of hospitals in the United States that would needtwenty-four-hour-a-day lighting. Based on these observational andarchival data, Callaghan concluded that industrial buyers would bea better market than consumer households. In its first year of opera-tions, the firm had $1 million in revenue from its new bulbs, 95 per-cent of which came from industrial sources.1
Other examples of counts of natural phenomena made at verylow cost that are helpful for marketing purposes include the fol-lowing:
• Counting the number of pedestrians or automobiles passing aproposed site
SYSTEMATIC OBSERVATION 109
14Andreasen/Ch. 6 8/11/02 3:07 PM Page 109

110 MARKETING RESEARCH THAT WON’T BREAK THE BANK
• Counting the number of competitors within various distancesof a proposed service location
• Counting the incidence of some correlate of potential productor service use, such as the number of homeless people livingnear a proposed shelter or the number of youngsters loiteringon street corners after school who might need special programs
• Estimating the proportion of men, women, or children at particular fundraising events
• Counting the number of out-of-state license plates from specific states passing through a specific tourist town
Counting is often the only means of assessing the effects of com-petitors’ actions or unexpected events. Empty spaces in the parkinglot can suggest the effects of a competitor’s promotions or a suddensnowstorm. So can counts of people entering nearby sites. One cancount people stopping at specific new museum displays or showinginterest in a new poster.
A major virtue of simple counting is that it can be carried outby unskilled researchers. For example, one or two teenagers couldbe hired and sent out to make observations at other museums orother competitive forms of entertainment. Careful training is stillnecessary and procedures must be carefully specified, but costs canbe kept low.
Measuring
Rather than simply counting people or objects or behaviors, obser-vation is more useful if it involves some sort of measurement. Thiscan prove particularly fruitful in the measurement of physical traces.Often an environmental characteristic of interest leaves behind aresidue that we can observe and measure. The researchers who usethese physical traces are in a sense modern-day archaeologists.
Physical traces may be divided into three broad groupings: ac-cretion, erosion, and traces. They were all the stock-in-trade of per-
14Andreasen/Ch. 6 8/11/02 3:07 PM Page 110
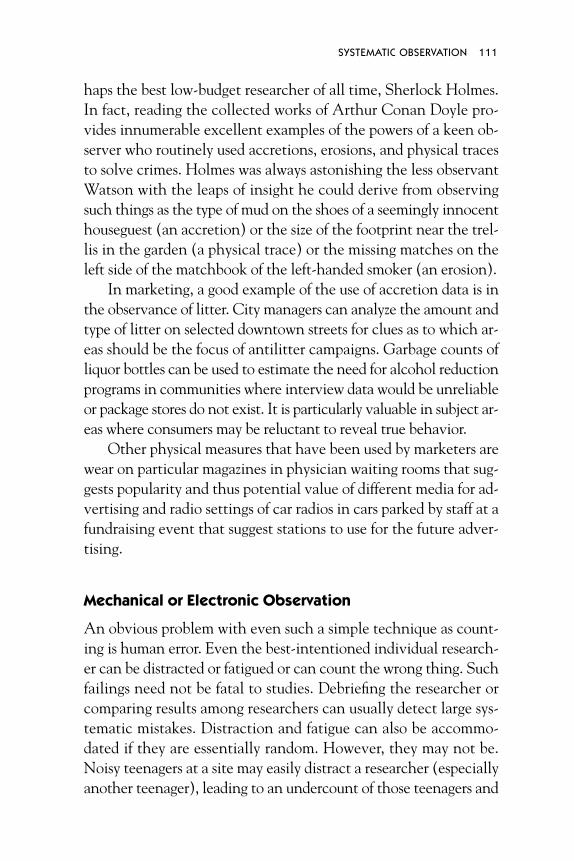
haps the best low-budget researcher of all time, Sherlock Holmes.In fact, reading the collected works of Arthur Conan Doyle pro-vides innumerable excellent examples of the powers of a keen ob-server who routinely used accretions, erosions, and physical tracesto solve crimes. Holmes was always astonishing the less observantWatson with the leaps of insight he could derive from observingsuch things as the type of mud on the shoes of a seemingly innocenthouseguest (an accretion) or the size of the footprint near the trel-lis in the garden (a physical trace) or the missing matches on theleft side of the matchbook of the left-handed smoker (an erosion).
In marketing, a good example of the use of accretion data is inthe observance of litter. City managers can analyze the amount andtype of litter on selected downtown streets for clues as to which ar-eas should be the focus of antilitter campaigns. Garbage counts ofliquor bottles can be used to estimate the need for alcohol reductionprograms in communities where interview data would be unreliableor package stores do not exist. It is particularly valuable in subject ar-eas where consumers may be reluctant to reveal true behavior.
Other physical measures that have been used by marketers arewear on particular magazines in physician waiting rooms that sug-gests popularity and thus potential value of different media for ad-vertising and radio settings of car radios in cars parked by staff at afundraising event that suggest stations to use for the future adver-tising.
Mechanical or Electronic Observation
An obvious problem with even such a simple technique as count-ing is human error. Even the best-intentioned individual research-er can be distracted or fatigued or can count the wrong thing. Suchfailings need not be fatal to studies. Debriefing the researcher orcomparing results among researchers can usually detect large sys-tematic mistakes. Distraction and fatigue can also be accommo-dated if they are essentially random. However, they may not be.Noisy teenagers at a site may easily distract a researcher (especiallyanother teenager), leading to an undercount of those teenagers and
SYSTEMATIC OBSERVATION 111
14Andreasen/Ch. 6 8/11/02 3:07 PM Page 111

their behavior. Fatigue often sets in late in the day or just beforemeals. If researchers are not scheduled to work at different timesover the course of the study, data on late-afternoon shoppers or thelunchtime crowd may be systematically distorted.
There may be other problems using human observers. Re-searchers may not want to work late at night or early in the morn-ing, leaving a major potential bias. A more serious problem is thatthe presence of a human observer during the observation processmay itself be obtrusive. A researcher hovering around a particulardisplay or doorway with a clipboard or mechanical counter may dis-courage customers from looking over the goods on the display orvisiting a particular service outlet.
Nevertheless, biases may not be fatal if the manager’s interest isin comparison or trend data and the biases are relatively similar be-tween observations. Although all data are biased, the differencescan be assumed to be meaningful.
A low-cost alternative is to eliminate the potential for humanerror or bias by using electronic or mechanical observation tech-niques. Indeed, several major commercial research services are basedon just such mechanical or electronic observation. Nielsen’s televi-sion rating service electronically records (observes) the stations towhich its sample households are tuned with a “people-meter.” Eyecameras are used by some advertising researchers to study how peo-ple look over an ad.
A significant development in marketing research in the packagedconsumer goods industry (scanner research) is the use of electronicscanning of the purchases of a preselected sample of households asthey check out in supermarkets. In sophisticated scanner research sys-tems, advertising input into sample households by cable is exper-imentally manipulated and the effects on supermarket purchasesselectively observed. Any item with a bar code is potentially suscep-tible to measuring electronically
All of these techniques require great cost and levels of sophisti-cation beyond the low-budget researcher. Other options are avail-able, however:
112 MARKETING RESEARCH THAT WON’T BREAK THE BANK
14Andreasen/Ch. 6 8/11/02 3:07 PM Page 112

• Pneumatic traffic counters. These are the rubber hoses stretchedacross highways or streets to count automobiles. Although subject tocertain errors (for example, three-axle trucks or playful teenagers re-crossing a counter), these counters can monitor traffic passing po-tential outlet locations or cars entering a shopping mall before andafter specific promotional events.
• Electronic eyes. These devices count bodies breaking a beamof light and can be used to note unobtrusively the number of peo-ple passing a display or entering a room or building.
• Digital cameras. Photographs can provide important observa-tional data. For example, a marketer in a performing arts centercould photograph an audience at a preconcert lecture and note thegender and possibly age distribution. If repeated, this techniquecould help measure the popularity of different performances or per-formers for different segments.
• Videotape recorders. Customers in many outlets are accus-tomed to video cameras. Recorded images can provide useful obser-vations of the types of clothing attendees wear, the relative numberof males and females, and the number of elderly attending a partic-ular event. They can also indicate movement patterns, such as wherepatrons spend their time before a concert or play. Cameras can re-cord how quickly service staff approach clients, how long clients stayon the premises, which direction they move as they circulate through-out the store, and so on.
• Computer software. Web sites can be programmed to recorditems considered on a Web page or the length of time a visitor spentviewing a particular page.
Seeking Patterns in Natural Observations
Using electronic or mechanical devices to count and measure ig-nores one of the most important human faculties: the ability to findpatterns in what we see. In the field of anthropology, observation isthe principal research tool. For the anthropologist, the key concernis finding patterns, getting a full, rich sense of what it is that makes
SYSTEMATIC OBSERVATION 113
14Andreasen/Ch. 6 8/11/02 3:07 PM Page 113

opera audiences in Houston different from theatergoers in Seattle.While anthropologists count and use physical traces, more often,cultural and social anthropologists simply go into the field, watchwhat people do, and try to synthesize their observations by detect-ing the patterns that seem to be there.
A good example of the kind of insight that can be gained fromseeking patterns through low-cost, relatively unobtrusive observa-tion of naturally occurring consumer behavior is in supermarket ob-servations. Several years ago, two university researchers exploredthe potential for direct observation of supermarket shoppers in threeproduct categories: cereal, detergent, and candy. Fifteen hundredobservations were made by three students in supermarkets in north-ern New Jersey. The students observed any shopper entering theaisle where the products in question were offered who appeared in-tent on making a purchase.
The kinds of questions this study methodology could answer are:
• Who actually chooses the products, and who or what influences the choice at the point of sale?
• To what extent are the brand choices made before the shopperenters the store versus at the point of purchase?
• How many people check price?
• Do shoppers check the package before purchase?
The first major finding of the study was that the observations wereeasy to make. The only problems occurred at the training stage, whenit was discovered that the observers were not getting sufficient de-tail into their records. In practice trials, the students were inclinedto record only the bare bones of each transaction, omitting the de-tail that is the essence of the method. A second problem was in get-ting the researchers to record their observations immediately afterthe episode. Thorough training overcame both problems.
The study sought both to count behavior (for example, howmany cereal shoppers had children with them) and to seek patterns.
114 MARKETING RESEARCH THAT WON’T BREAK THE BANK
14Andreasen/Ch. 6 8/11/02 3:07 PM Page 114

The difficulty in trying to see patterns was exemplified when the re-searchers attempted to estimate the proportion of shoppers whoknew what they wanted when they approached the cereal counter.It is difficult to infer a state of mind. When the shopper marchesright up to a specific spot at the display and grabs a box, the evi-dence suggesting a preformed choice is all but conclusive. But whena shopper hesitates, searches, and physically inspects several pack-ages, it is hard to guess whether the shopper doesn’t know what heor she wants or knows what he or she wants and can’t find it. In casessuch as these, the students learned to make judgments based on theoverall patterns they observed.
Although the study was only a pilot venture, the following pat-terns were suggested:
• Women do more of the family shopping than men, but mendo enough to warrant a marketer’s attention.
• Husbands who accompany wives and try to influence purchasedecisions almost always succeed.
• Children, especially urban children, are also influential, although this varies by product class.
• Urban shoppers show more concern with price than suburbanshoppers. This also varies by type of product and by sex.
• Many shoppers of all types inspect packages before they buy.The tactile dimension therefore deserves more attention thanit usually receives in most package research.
Another example of anthropological research in marketing is astudy by consumer researchers of a swap meet in Arizona. A teamof three professionals with diverse skills in consumer research tooka minivan, a set of tape recorders and television cameras, comput-ers, and large notebooks to a small town and over several days talked,filmed, and recorded buyers and sellers at a permanent local swapmeet. They observed people buying and selling and asked them
SYSTEMATIC OBSERVATION 115
14Andreasen/Ch. 6 8/11/02 3:07 PM Page 115

questions about their activities and the meanings the transactionshad for them personally. The researchers found that such naturalisticinquiry can yield thick data on important market phenomena. Thetechnique is labor intensive, but the researchers found that theirodyssey was relatively low cost yet richly insightful.2
Controlling the Quality of Natural Observations
While it is easy to look at phenomena, there are many dangers inefforts to draw meaning from them.
Problems of Inference
Some observations, such as garbage counts or observations of cloth-ing preferences or client gender, require a considerable leap of in-ference before the implications for marketing strategy are clear. Forinstance, if there is an increase in the proportion of symphony at-tendees who dress casually, does this indicate that the orchestra isattracting a more downscale or younger audiences, or is this simplyan indication of broad changes in clothing styles? The researchmanager must make strong assumptions before allowing the data to affect marketing strategy. In many such situations, it will be de-sirable to back up the observations with other measurement meth-ods. For example, in the case of clothing preferences, a few discreteinterviews might quickly resolve some of the ambiguities in the ob-servations.
Indeed, when using low-budget techniques, it is always excel-lent strategy to attempt to assess key phenomena in many differentways, that is, to practice triangulation (get several different readingsof the phenomenon of interest). Many of the techniques proposedin this book must make some compromises in methodology in or-der to keep costs down. As a consequence, the results of any givenlow-cost study must always be viewed with at least some skepticism.However, if the researcher can develop multiple measures of severalaspects or traits of the same phenomena, preferably using differentkinds of research methods, the unique biases of each technique may
116 MARKETING RESEARCH THAT WON’T BREAK THE BANK
14Andreasen/Ch. 6 8/11/02 3:07 PM Page 116

often cancel each other out. If the same conclusion emerges fromseveral different approaches (for example, focus groups plus a fewinterviews plus observations), the researcher can have much moreconfidence in what is found. I am a strong advocate of what re-searchers have come to call the multimeasure multitrait technique.This means measuring many facets of some important market char-acteristic using many measurement approaches.
Problems of Collection
Observation should be systematic and objective if it is to be trustedby management and reliable. The goal is to secure a representative,accurate sample of the phenomena to be observed. Two steps mustbe taken to achieve this goal: (1) a sampling procedure must be care-fully developed to ensure that each potential observation that onecould make has a known (perhaps equal) chance of being recorded,and (2) the field observer has as little freedom as possible in what isobserved when the observation is made.
Making observations is a method of collecting data, just likeasking questions with a questionnaire. Yet many researchers whowould be very systematic in designing a careful sampling plan be-fore sending interviewers into the field are often extremely casualabout sending individuals out to observe phenomena. Of course, itisn’t always the case that a sampling plan is needed for an observa-tional study. Just as with a questionnaire survey, the research objec-tives may require only a limited number of typical contacts (forexample, to help develop hypotheses or to detect serious problemswith a new toy or appliance). However, if one wishes to project theresults to a broader population or to conduct statistical tests, theusual rules of sampling (discussed in Chapter Nine) need to be fol-lowed. Typically, this requires procedures for three kinds of obser-vational sampling:
• Places. If one is to observe a phenomenon at different loca-tions, then observations must be taken with either equal observationsat each site or observations proportional to expected occurrence. In
SYSTEMATIC OBSERVATION 117
14Andreasen/Ch. 6 8/11/02 3:07 PM Page 117

both cases, the researcher must first estimate how many events, phe-nomena, or potential observations will occur at each location. This willpermit the results at each location to be postweighted by the expectednumber of observations. Alternatively, the prior estimates may be usedfor assigning quotas for the number of observations at each site.
• Times. All possible times for observations should be sampled.Results can be severely biased if observers always go at the same time,for example, when it is convenient for them or when there are fewpeople at the site. Again, one must estimate in advance the likelydistribution of events over time and assign observations to coverthe spectrum. The time allocations can be proportional, or they canbe equal and then postweighted.
• Individual events. Even if places and times are randomly se-lected, interviewers should be given some guidance in event sam-pling. The simplest approach is systematic sampling. The observercan be told to observe every nth event, for example, every fifth per-son passing on the north side of the ficus tree just inside the Chil-dren’s Museum’s southeast entrance. If this is problematic, analternative rule could be to take the fifth person after the last ob-servation is completed. Whatever the procedure, the objective is togive the observer a firm rule so that he or she will not just observewhat seems interesting or easy.
Observing Accurately
Field researchers can be attentive, objective observers or sloppy andcasual. The secret to ensuring the former is to follow four guidelines:
1. Recruit a potential set of field observers who are likely to beattentive and objective.
2. Give them an observation test to screen out the poorerprospects.
3. Establish clear written guidelines specifying what and how to observe.
4. Have the observers practice, practice, practice.
118 MARKETING RESEARCH THAT WON’T BREAK THE BANK
14Andreasen/Ch. 6 8/11/02 3:07 PM Page 118

7Low-Cost Experimentation
In the previous chapter, we took the world as it is, doing ourbest to observe and record what it had to tell us. An obvious re-striction on observed data is that we must accept reality. This is of-ten desirable because it means the data are not contaminated by ourintrusions. On the other hand, we cannot observe something thathas not taken place, such as a marketing tactic never tried. Mar-keters are doers, and it is their mission in the corporate or nonprofitworlds to make changes rather than to respond to them. Thus, whenmanagers look to research for help, it is almost always to tell themwhat to do in the future. (As I noted in Chapters Three and Four,this is the only time they should ask for research help.) Managersare typically very suspicious of research that tells them only whatworked in the past or (worse still) that requires great feats of infer-ence and analysis to tell them even that. What managers really wantto know is what will work tomorrow. Trying things out on a pilotbasis is a very good way to gain just this kind of insight.
This is the role of experimentation: trying things out. Exper-imentation is immediate. It will help managers learn whether im-plementing tactic A will lead to result X. And assuming the rest ofthe world holds still, it can suggest pretty strongly that doing A to-morrow will lead to X the day after. Experimentation is intentionallyintrusive. But the cost in potential bias is often well compensated byfour major virtues important to managerial applications:
119
15Andreasen/Ch. 7 8/11/02 3:08 PM Page 119

120 MARKETING RESEARCH THAT WON’T BREAK THE BANK
1. It permits the experimenter to control the intervention sothat it closely parallels just what management’s strategic options are likely to be.
2. By careful design, experimenters can control a large part ofthe natural world’s chaos, factors that tend to foul up othernaturally occurring pseudoexperiments.
3. Experimentation often can prove cause and effect; it can saythat since everything else was held constant, the result X musthave been caused by A.
4. Since experimenters can dictate the timing of the interven-tion, experiments are often speedier and more efficient thanmany other approaches, especially field observation, whichhas to wait for events to occur naturally.
Most major marketers in the private sector routinely use exper-imentation. Test marketing, a form of real-world experimentation,is a standard technique in most new-product and service develop-ment processes. Market tests are used to assess such things as likelydemand levels, responses to alternative advertising budgets, and thedesirability of changes in building design and ambience or signage.
In a classic market study, a major brand marketer systematical-ly varied its advertising budgets in different markets over severalmonths. Historically, the company had changed advertising in onlysmall increments and so did not have any experience with bigchanges. In some of its market tests, it doubled its advertising bud-get; in others, it halved it. As a result of the study, the firm gainedprecise knowledge of the responsiveness of sales to significant changesin advertising and concluded that in general, it could cut its bud-gets significantly and reap substantial rewards in improved profit-ability.
Experimentation is not a research approach that naturallycomes to the mind of the limited-budget manager. Yet it can be avery effective and often very cheap research technique. Experi-mentation can have an extremely favorable benefit-cost ratio. Yetit is all too rarely used. Why is this? The answer, I believe, lies in
15Andreasen/Ch. 7 8/11/02 3:08 PM Page 120

what I have come to call the one-best-strategy mentality of manymanagers. The manager feels under a great deal of pressure to pro-duce and to do so without spending much money. To accomplishthis goal, the manager typically tries to be as cautious as possible.The limited-budget manager is usually very risk averse. This meansthat he or she changes the status quo only when the case for thechange is convincing. And, typically, to reduce the insecurity whensuch a change is made, the manager settles on the one best alter-native and, once the decision is made, avoids thinking about anyoption that is assumed to be less than best. This approach tends toinhibit experimentation. The manager thinks, “Why try anythingthat is less than my best choice, even on an experimental basis,since almost by definition, it is very likely to reduce my revenues?”
There are fatal flaws in this reasoning. Most important, it as-sumes that the manager is really correct: that the best strategy hasindeed been chosen. But if the cost of an experiment can be keptlow, it may well be worth it if there is some probability of a majorgain in knowing what really is best—for example, if the best strat-egy is substantially off-target. To see why this is so, recall the ap-proach to analyzing the costs and benefits of research outlined inChapter Four.
Suppose a fundraiser is planning to send 10,000 letters to poten-tial donors at a cost of $8,200. The best strategy is expected to yield500 replies, generating an estimated $25,000 in donations and, al-lowing 25 percent for other related expenditures, net proceeds of$10,550 after deducting the cost of the mailing. Suppose further thatfor an extra $1,000, a second mailer could be prepared using a strat-egy that is thought to be second best but could be better in the longrun. Suppose that the manager predicts that if this second-best mail-er is sent to 20 percent of the mailing list, only 80 replies instead of100 would be received (because it is second best). At an average re-turn of $50 per response and proceeds after other costs of $37.50, theexperiment would cost $1,750, including the cost of the second mail-er and the lost profits.
Now suppose the manager is willing to admit that perhaps thesecond-best mailer could really be better and could increase returns
LOW-COST EXPERIMENTATION 121
15Andreasen/Ch. 7 8/11/02 3:08 PM Page 121

122 MARKETING RESEARCH THAT WON’T BREAK THE BANK
at maximum by 15 percent. In this case, the better strategy wouldyield 575 replies at an average donation of $50 and an average profitof $37.50, for a total increase in proceeds of $2,812.50 per mailing.If a strategy lasts, say, four mailings to 10,000 potential donors, thisis an overall $11,250 gain in future proceeds. Furthermore, if thesecond strategy was better, there would be no loss from this mailing,and returns would rise from 100 to 115, meaning that the experi-ment would really cost only $562.50, so overall, management wouldbe $10,687.50 ahead.
If the manager concedes there is a 20 percent chance the sec-ond strategy will turn out to be better, there are two possible pay-offs associated with experimenting when compared to the strategyof just continuing with the present one-best-strategy: (1) a 20 per-cent chance of being better off by $10,687.50 and (2) an 80 percentchance of being worse off by $1,750. The weighted expected valuethen is a positive $737.50. Management, on average, would gainthis amount by conducting experiments like this even if there wasonly a relatively modest chance (20 percent) that the one best strat-egy really wasn’t best.
Although this example is hypothetical and the amounts aresmall, it clearly demonstrates why the very best managers are alwaysexperimenting. First, experimental managers tend to be less risk averseand are not quite so fearful that a risky second strategy would turn outto be a big disaster, that is, that expected losses from forgone returnswould be very high. At the same time, they are more likely to enter-tain the possibility that they are wrong. Furthermore, their market-ing aggressiveness leads them constantly to look for ways of doingthings better. And so they often conclude that even if a careful esti-mate of the expected value from experimentation is negative, it is stillworth the research because something will be learned, even if it is onlythat this second-best alternative can be eliminated in future.
The sophisticated manager is also more likely to think strategi-cally about the long run. That is, the manager will be willing to ac-cept quite a number of failures in experimentation in the short runrecognizing that if experiments are done in series, over time he orshe can accumulate a sharp sense of what does and does not work
15Andreasen/Ch. 7 8/11/02 3:08 PM Page 122

in a particular market environment. Experimentation for thesemanagers is really systematic wisdom building.
Experimental Design
The opportunities for experimentation are almost boundless, lim-ited for the most part only by the imagination of the researcher.The object of experimentation is to try something different and, byfollowing a few simple rules of proper experimental design, learnwhat the effect of this difference is, if any, on a result of interest tomanagement, such as brand awareness or product preference. Therules are very important, however, because there are many thingsthat can go wrong with experimentation.
Experimentation can apply to almost any aspect of the market-ing mix. New-product and service offerings can be tried out, pricescan be manipulated, new benefits promoted, or changes made inhours of operation or in organization logos or mission statements.Different communications options can be exposed to different tar-get audiences alone or in various combinations. Experimentationcan address large and small issues. For example, for print communi-cations, one can learn whether to use pictures or no pictures, whetherto show people or show statistics, whether the copy should be longor short, or whether the organization logo should go on the left sideor the right side. One can also study the effect of totally withdraw-ing communications from a Web site or doubling it. Experimentationcan help explore alternative client presentations, media combina-tions, timing of messages, and approaches to services. New outletscan be tried, as can new types of staff contact people and even newsalary incentive schemes.
Experiments can be done in the real world or in the laboratory.The real world has the virtue of being like the eventual environ-ment the organization will face. But a lot of other events will be go-ing on (such as a change in economic conditions or actions of otherorganizations) that can cloud a result. In the laboratory, all else canbe held constant. But what one gains in control of the experimen-tal setting, one obviously loses in realism.
LOW-COST EXPERIMENTATION 123
15Andreasen/Ch. 7 8/11/02 3:08 PM Page 123

Results of experiments can be measured in terms of cognitions oractual behavior, or both. Cognitions include measures of awareness,perception of various communication features, preferences, attitudestoward future patronage, and potential favorable word-of-mouth. Be-havioral measures include customer responses, staff behavior, and be-havior of various organizational partners or potential partners.
To be most useful to a manager, an experiment should ideallypossess three characteristics. First, there should be random assign-ments of different experimental treatments (for example, differentcommunications) to different groups of subjects (for example, loca-tions or individuals). Second, the experiment should be designedsuch that (ideally), nothing else could have caused the results ob-served. Third, the results of the experiment should be projectable tothe future real-world marketing situation the organization will face,with few doubts as to its applicability. The major variations in ex-perimental design discussed in this chapter are simply different waysof controlling one or more of the major kinds of threats to these lasttwo characteristics, sometimes called internal or external validity.
These requirements help us distinguish between a true experi-ment and research that seems like an experiment but isn’t. The fol-lowing hypothetical cases look like experiments but are not:
• One month after a major plant layoff, the local theater manager notices a 20 percent decline in attendance.
• A national wildlife organization observes that when a rivalCalifornia environmental group reduced its membership feesby 10 percent while no other local group in the United Statesdid so, membership applications for the national organizationfell 20 percent in California with no changes elsewhere.
• A government health clinic is shut down, and client visits to three of your own clinics rise significantly.
These all look like experiments in the sense that something ischanged and there appear to be consequences that the something
124 MARKETING RESEARCH THAT WON’T BREAK THE BANK
15Andreasen/Ch. 7 8/11/02 3:08 PM Page 124

caused. But these situations are really what we call pseudoexperi-ments. Can an analysis of the impact of these natural events meetthe test of internal validity? That is, can one eliminate the possi-bility that the observed results are due to something entirely differ-ent from the factor thought to have caused it? In each of the cases,at least one reasonable alternative hypothesis can be offered.
In the theater case, suppose the plant layoff occurred at thesame time as a new state-of-the-art movie complex was opened, at-tendance in the previous three months was 30 percent above aver-age, the local college basketball team was in the NCAA finals, orthe current production saw a change of two key cast members. Allof these might have been the real cause of the decline.
In the California case, the competitors have cut membershipfees because they sensed a decline in interest in wildlife issues inCalifornia. Your sales may have declined anyway, not as a result oftheir actions.
In the clinic case, there may have been a major residential shiftin population that made the government clinic not cost-effective.At the same time, the population may have moved to new low-income housing near your clinics, and so demand would have riseneven if the government clinic had not closed.
In all three cases, the problem with the experiment was thatthere was no control for other possible explanations. The reasonswere threefold. First, since we didn’t systematically control the cause,there was no random assignment of the subjects of the experimentto the conditions. In the theater and clinic cases, everybody was ex-posed to the condition. In the other case, although residents in Cal-ifornia, and not other states, were the target of the intervention,many other local factors may have led to the fee reduction.
Second, all three cases have the additional problem that be-cause the change affected everyone, we had no comparison or con-trol group. We don’t know what would have happened in theabsence of the treatment.
Third, in the California case, since we didn’t control the timingof the treatments, we cannot even say that the fee reduction preceded
LOW-COST EXPERIMENTATION 125
15Andreasen/Ch. 7 8/11/02 3:08 PM Page 125

our membership decline rather than appeared at the same time, thusconfusing association with causation.
This then leads us to define three requirements of a true ex-periment:
1. The experimental treatment must precede the effects it is designed to cause.
2. There must be a comparison group that did not receive thetreatment or received a different treatment.
3. There must be random assignment of treatments (or the absence of a treatment) to groups.
The last point is especially crucial. Unless one randomly assignstreatments to targets, there is always the danger that those exposedto the treatment (for example, those who volunteer for it) will bedifferent from those not exposed. Unless there is random assign-ment, we cannot by definition rule out the possibility that any dif-ferences that show up are due to the fact that the two groups aredifferent to begin with.
This is not to deny that pseudoexperiments can be informative.Sometimes they are the only way to observe an effect such as themarket’s responses to some sudden action by a rival organization oran environmental shock like a plant closing. In such instances, low-cost researchers should attempt to learn as much as possible fromthe pseudoexperiment, making every effort to consider and adjustfor whatever biases may be present. Often, there is no reason to be-lieve that the occurrence of the natural event was not randomly dis-tributed. If the results from the pseudoexperiment are believable,this may be quite adequate as a basis for a risk-taking manager totake action.
Types of Experiments
True experiments can take many forms and can be complicated. Wewill restrict our attention here to relatively simple experiments.The experiments discussed here differ in two respects; (1) whether
126 MARKETING RESEARCH THAT WON’T BREAK THE BANK
15Andreasen/Ch. 7 8/11/02 3:08 PM Page 126

measures were taken before and after the treatment or only before,and (2) whether there was a control group with which to comparethe group receiving the treatment. In this framework, pseudo-experiments would be classified as after-only experiments with nocontrol.
The Simplest Designs
We will consider two of the simplest and most commonly used de-signs first and then introduce some more complex alternatives forthose who have more difficult decision problems to investigate.
After Measure with Control. The simplest experiment to designand administer is called the after measure with control design. It re-quires that the researcher randomly assign subjects to two or moregroups, leaving one group alone as a control and applying a treat-ment to each of the remaining groups. The effects of each treatmentare then measured and compared with the untouched control group.The difference provides a measure of treatment effect that eliminatesany systematic bias between the groups (as when subjects self-selectthe treatment they will expose themselves to) although there canstill be random differences between the groups.
Let us consider an example. Suppose the manager of twentychild care centers for low-income families in a major urban area iscurious as to whether a modest direct mail campaign aimed at resi-dents near a center would have an effect on enrollments for thecoming season. A simple after-measure-with-control experimentcould be used with two or more centers assigned to each group:
Group Treatment After Measure
1 Yes Yes
2 No Yes
To ensure that this is a true experiment, the manager must ran-domly assign centers to the two conditions and not, for example, con-duct the mailing around centers nearest headquarters (so someone
LOW-COST EXPERIMENTATION 127
15Andreasen/Ch. 7 8/11/02 3:08 PM Page 127

can keep an eye on traffic in the centers). Random assignment hasthe advantage of eliminating systematic bias, and the presence of thecontrol group not only gives a basis for comparison but helps moni-tor another harsh reality of real-world market experiments: the worlddoes not stand still, and other events, such as an economic downturn,may affect outcomes. But such potentially contaminating events willaffect the control sites just as much as the treatment sites, so that thedifferences in results will still indicate treatment effects.
This approach has one other feature to recommend it. Becausemeasurements are taken only after the treatment, one does not riskthe possibility of unduly influencing a treatment group before ap-plying the treatment. Let us, however, consider why we might wantto measure a group before a treatment.
Before and After Measures with Control. Suppose the results ofthe above experiment turned out as in Table 7.1. The question theresearcher must now ask is, Are there any explanations for the ef-fects other than the treatment? One possibility is that the after mea-sures simply reflect differences in the groups (centers) that existedbefore the study and that the treatment had no effect. This is pos-sible even though the centers were assigned randomly.
Suppose the center owner in our example had only four loca-tions to assign to the two conditions described. Suppose further thatthe centers ranged in size from very small to very large. The prob-lem quickly becomes obvious. If the larger centers by chance wereassigned to the direct mail treatment condition, enrollments will bevery high and the treatment will appear to be more effective. But if
128 MARKETING RESEARCH THAT WON’T BREAK THE BANK
TABLE 7.1 Hypothetical Experimental Research Results: After-Only with Control.
Average Enrollments
Direct mail 227No direct mail 198
15Andreasen/Ch. 7 8/11/02 3:08 PM Page 128

the larger centers end up in the control group, no treatment wouldappear to be effective. The explanation of the after results thenwould be confounded by the unmeasured before conditions.
If it is feared that random assignment may leave the groupsgreatly different even without any systematic bias (for example,where one is using a small sample), an obvious precaution would beto take a reading on the groups before the treatment as well as after.One could then proceed to compute before-and-after differences foreach of the groups and compare the difference for the treatmentgroup with the difference for the control group. This would have theeffect of eliminating the effects of differences in starting positionacross the groups. (An alternative way of handling this problem iscalled blocking. It can be used if one already has a measure of someimportant prior difference or some characteristic that is believed tobe highly associated with it. Blocking in this case would put largestores in one block and small stores in the other. Assignment is ran-dom within blocks, ensuring that each treatment has one randomlychosen small store and one randomly chosen large store.)
A hypothetical result is reproduced in Table 7.2. Here, we can seethat the effects of the mailing were much less dramatic than Table 7.1suggested.
So why not do this all the time? Certainly, where it is easy totake a before measure in an unobtrusive fashion (as when recordscan be collected or retrieved), this should be done. However, in othercases, there are two reasons that a researcher might not want to take
LOW-COST EXPERIMENTATION 129
TABLE 7.2 Hypothetical Experimental Research Results: Before-After with Control.
Average Enrollments
Before Mailing After Mailing Difference
Direct mail 201 227 +16No direct mail 190 196 +6
15Andreasen/Ch. 7 8/11/02 3:08 PM Page 129

a before measure. One is cost; the more measurements that aretaken, the greater the cost. The other is the danger of contaminat-ing the groups. If someone takes a prior measure, it is not inconceiv-able that either (1) the before measure itself will cause a change or(2) the before measure will cause the treatment to have more impactthan it would have if the before measure was not taken.
These two possibilities can most easily be seen in the context ofcommunication research. Suppose our child care center managerwishes to test the effectiveness of a new poster theme on reenroll-ment intentions of parents of children now in their centers.
Premeasures are taken in both treatment and control centersasking a sample of mothers about their intentions to enroll theirchildren in the next season. Scores for each center are computed.The posters are displayed in the treatment centers, and after sixweeks, the same parents in both areas are reinterviewed. The before-and-after results are shown in Table 7.3.
It appears from the results that the posters in the treatmentgroup were a great success. They increased enrollments more thanin the control group. But a closer look will reveal three problemswith the results:
1. The before measures in the two sets of centers are not thesame. This would suggest a nonrandom factor in the selectionof treatment and control centers, such as putting the postersin centers that already have higher reenrollment rates.
130 MARKETING RESEARCH THAT WON’T BREAK THE BANK
TABLE 7.3 Hypothetical Results of Enrollment (percentage indicatingreenrollment).
Treatment Control
Before After Before After
Reenrollment 55 73 46 58
15Andreasen/Ch. 7 8/11/02 3:08 PM Page 130

2. Intentions rose in the control group as well as the treatmentgroup. Since there were no posters there, the only plausibleexplanation is that the first interview spurred some respon-dents to think more carefully about their reenrollment plans,and some changed their minds. This could be an example of a pretest effect.
3. Because we suspect that the pretest influenced the parents, itis possible that the pretest could also have caused the parentsto notice and be influenced by the new posters to a greater degree than they would have without the pretest effect. Thisis called a potential interaction between the premeasure andthe experimental treatment.
The bottom line is that we do not know whether the “poster ef-fect” is due to differences in starting conditions, a pretest effect, aninteraction between the pretest and the treatment (the posters), orthe treatment. Because of all of these problems, we must reluctantlyconclude that the experiment is inconclusive.
Most studies involving cognitive changes are very susceptibleto premeasure contamination. In such cases, after-only measures arepreferable. But in many studies, the need for a premeasure will beimportant, and the researcher will have to make a judgment as towhich set of potential problems is more worrisome: not having apremeasure or having a premeasure that confounds the results. Ingeneral, the larger the number of cases one can assign to each con-dition, the less one has to worry about prior differences across groupsand can choose the after-only approach. But contaminating pre-measures could be used if one is looking only at differences amongvarious treatments, and there is reason to believe that premeasureswill inflate postmeasures for all groups alike and will not exaggeratethe effect of any one treatment. In such cases, the assumption isthat the difference scores are all biased to the same degree, and theresearcher can proceed to compare the (biased) treatment differencesto the (biased) control group differences. (This is another case oflearning to live with bias.)
LOW-COST EXPERIMENTATION 131
15Andreasen/Ch. 7 8/11/02 3:08 PM Page 131

If a premeasure is crucial—for example, where one is worriedabout important differences across groups, such as in neighbor-hoods—and if a premeasure may inflate only the treatment effect(that is, the biases will not be constant), there is sometimes anotheroption: to measure different samples of people before and after thetreatments. This could have been done in the poster study. Some-one could have interviewed one group before the posters went upand a different group after. However, the conclusions of the studywould rely on the assumption that the sample group studied afterthe posters went up would have shown the same prior status as thepremeasure group, that is, there are no differences in starting posi-tion between the pre- and posttreatment groups. But this is not al-ways reasonable, especially when the sample is small. Rememberthat the reason for the premeasure in the first place was to take intoaccount just such sampling differences between groups. A secondproblem with using two different samples is that the researcherwould not be able to learn which households were affected by thetreatment. For example, in the poster study, the child care centermanager would not know if the increased awareness came fromyoung or old, large or small households, or different ethnic groups.
Other Biases. Even where the researcher can safely assume thatthere are no premeasure effects or interactions, other possible sourcesof bias can appear. Subjects of many experiments may realize theyare part of a study. In so-called laboratory studies, this is always aproblem. Subjects in laboratory settings know they are part of a studyand may not behave as they ordinarily would in the situation. Forexample, if they are watching slides of advertisements or packaging,they will likely examine the image much more carefully than theyusually would. If a control group is subject to the same effect due tobeing part of a lab experiment, then the researcher may safely usethe “constant bias” assumption. Even in the real world, the experi-mentation bias is a possibility. For example, suppose a clinic managerwishes to experiment with a new clinic poster. It is possible that per-sonnel in the clinics with the new posters will simply try harder toget reenrollments because they know they are part of a study. Higher
132 MARKETING RESEARCH THAT WON’T BREAK THE BANK
15Andreasen/Ch. 7 8/11/02 3:08 PM Page 132
enrollments, then, cannot be attributed to the new posters but maybe due to the hothouse effects of the study itself.
This effect may sometimes apply to the control group as well. InMRFIT, a famous $40 million heart-risk study, the researchers hadto inform doctors in the control group that they were part of thestudy, in part because the researchers needed careful records on pa-tients of all physicians. Ironically, the researchers found that therewas a greater control of heart problems in the control group than inthe group practicing the approved regimen, exercising more, and reducing salt intake. They attributed this to the fact that doctors inthe control group were more diligent with their patients becausethey knew they were being watched.1
More Complex Experimental Designs
In the examples so far, we have considered only one treatment. Inmany marketing situations, management will wish to know whichof several alternatives is best. In such cases, a simple solution is toincrease the number of randomly selected treatment groups andhave one control sample that remains touched. Alternatively, ifthere is no intention to leave the market as it is now and the man-agerial decision is to choose among several new alternatives, thenthere is no need for a control group. That is, for management’s pur-poses, one does not need to know whether there is any effect, butonly which treatment (if any) has the most effect.
Suppose management is considering new tactics that are notsimply substitutes for each other (such as, different posters) but mightbe used in combination (such as different reenrollment fees)? Here,managers typically want to know main effects (Did any of the tacticsby itself have a differential effect?) and interaction effects (Did somecombination of tactics yield greater effects than predicted by the sep-arate main effects)?
To make this point clear, consider the case of a nonprofit fund-raiser. The fundraiser wishes to know whether she should recommenda minimum donation of $30, $50, or $75 and whether to include anannual report in the mailing or a specially crafted flyer. The criterion
LOW-COST EXPERIMENTATION 133
15Andreasen/Ch. 7 8/11/02 3:08 PM Page 133

is dollars donated per response. The fundraiser might think that con-sidered alone, the $30 donation level and the special flyer would gethigher average returns. However, it may be that the combination ofa $50 donation level and the annual report would do the best. Froman experimental standpoint, the manager is asking:
• Is there a main effect due to donation level? That is, do returns differ significantly depending on what level of donation is suggested?
• Is there a main effect due to communication piece? That is,are significantly more revenues generated with the flyer or the annual report?
• Is there an interaction effect between donation level andcommunications piece?
To answer these questions, we must have a much more compli-cated design. Here we need to use six experimental treatments: onefor each combination of donation level and communications piece.Without all possible combinations, we cannot estimate the inter-action effects. In each of the six conditions, or cells, we will want asignificant number of mailings so that a good measure of randomvariation within the cells can be secured. Suppose the results overseveral weeks turned out as in Table 7.4.
Although we must apply statistical tests to each of the threepossible effects (see Chapter Ten), the following results are sug-gested:
134 MARKETING RESEARCH THAT WON’T BREAK THE BANK
TABLE 7.4 Average Returns for Direct Mail Experiment.
Suggested Donation Level
Mail Piece $30 $50 $75 Average
Flyer $30,000 $19,000 $17,000 $22,000Annual report 5,000 17,000 20,000 14,000Average 17,500 18,000 18,500 18,000
15Andreasen/Ch. 7 8/11/02 3:08 PM Page 134

• There is no main effect due to donation level. That is, if nothing else were changed, management should not care what it suggests as a minimum donation.
• There is a main effect due to communications piece. Thefancy flyer does much better than the usual annual report.
• Most important, there is an interaction effect. Clearly, thebest strategy is to set a donation level of $30 and use the special flyer.
Although this experiment is complex, with many mailings thecost of the study is very low, and the potential returns can be high.Compared to the average strategy return of $180,000 the optimalcombination yields $120,000 more. Assuming no great differencesin the number of responses, the added payoff can be in the thousandsof dollars, even after the cost of developing, testing, and preparingthe flyer.
There are a great many possibilities for this more complex kindof low-cost experimentation through direct mail. A great many or-ganizations spend a lot of effort mailing letters, brochures, publicityreleases, advocacy letters, volunteer recruitment solicitations, andother pieces, all designed to generate responses. Clearly, learninghow to increase the response would be very valuable.
Experimentation is the obvious approach here. There are a num-ber of reasons that direct mail experiments are popular:
• It is easy to assign subjects to treatments randomly.• Because large numbers can be assigned to each treatment,
the need for a premeasure is virtually nonexistent.• It is easy to keep track of which responses are associated with
which treatments. Slightly modified layouts of return envelopes canbe used to indicate different treatments. Code numbers can be in-corporated on the mail response form itself or on the return enve-lope. Different post office box numbers can be assigned to differenttreatments (at a slight added cost), or the return envelope can be
LOW-COST EXPERIMENTATION 135
15Andreasen/Ch. 7 8/11/02 3:08 PM Page 135
addressed to different people or to one person with different middleinitials corresponding to different treatments. For telephone responses(for example, in catalogue sales or public service announcements),callers can be asked to identify the mailing material (treatment) num-ber to which they are responding.
• The treatment conditions can be carefully controlled as tothe precise character and timing of the stimulus and all irrelevantfactors that must be held constant.
• The private nature of the mail system makes it unlikely thatcompetitors will learn of the experiment. (Of course, if they too havelearned to use low-cost competitive intelligence techniques, they ortheir employees may already be on several of your mailing lists.)
• External validity is great because usually what is tried out ina mail experiment is what the marketer will use over the long term.
• Because mail pieces are relatively complicated and becausemost recipients are on only one mailing list, subjects are unlikely torealize that they are part of an experiment. In this sense, mail stud-ies are unobtrusive.
• Complete combinations of treatments that can assess inter-actions are possible because of large sample bases.
Direct mail experimentation should be a routine part of anylow-budget researcher’s arsenal. Similar possibilities are now be-coming possible with e-mail campaigns.
Laboratory Experiments
Despite their problems, laboratory experiments can be valuable al-ternatives to field experiments. They can be carried out in hotelrooms, trailers in shopping center malls, university classrooms, or theresearcher’s or the marketer’s offices. The advantage of laboratorystudies is that a great many factors can be controlled in these cases.Participants can be carefully assigned to treatments, stimuli preciselyintroduced, and extraneous factors totally eliminated. For such rea-sons, laboratory experiments are popular for taste, touch, or sniff
136 MARKETING RESEARCH THAT WON’T BREAK THE BANK
15Andreasen/Ch. 7 8/11/02 3:08 PM Page 136

tests, communications copy studies, pricing studies, and new-productor service concept tests. In the laboratory, mechanical or electronicmeasuring devices can be used that would be cumbersome in thefield. These could include measures of responses to marketing stim-uli in the form of changes in heartbeat, eye movement, conductiv-ity of sweat, and pupil diameter or delay times on a computer.
An example of a simple laboratory study was one conducted bya group of my students at UCLA. At the time of the introduction ofNew Coke, the students were curious about the effects of the newproduct’s advertising on perceptions of its taste. They set up a tableon a campus quadrangle and poured subjects drinks in random or-der from three cola bottles labeled “New Coke,” “Old Coke,” and“Pepsi.” They asked respondents to rate the three drinks on a num-ber of dimensions, including traits emphasized in early New Cokeadvertising and their preference among the three samples. They alsoasked each subject for their favorite cola in the past and whetherthey recalled seeing or hearing any ads for New Coke in recent days.Comparisons across subjects showed:
• There were no significant differences in perceptions of thethree drinks on all dimensions for all subjects.
• There were significant differences for those who reported recalling the New Coke ads, and the differences were in the direction emphasized in the advertising copy.
• Most respondents had little difficulty indicating a clear preference among the three drinks.
What was most interesting about this laboratory study was thatunlike the real world, the researchers could control what was in thebottles. And the colas were all the same: they were all old Coke.The study could clearly demonstrate that what advertising leads oneto expect is what one thinks one gets. Advertising, even in such asimple product category, is much more powerful than many peoplesuspect. No wonder we are inundated with ads calling colas “thereal thing” or part of a “new generation.”
LOW-COST EXPERIMENTATION 137
15Andreasen/Ch. 7 8/11/02 3:08 PM Page 137

However, laboratory experiments give up a lot for what theygain. Subjects who know they are guinea pigs have been known tobehave in ways that would be out of character for them. Many willtry to guess what the researchers want them to do (sometimes calledthe experimental demand effect) and try to please them.
Still, lab experiments are usually inexpensive to set up and can bedone quickly. Often there is little need for representativeness in thesamples as long as the participants are members of the target marketand, where appropriate, randomly assigned. As a consequence, sim-ple lab experiments are usually a good first step in testing new ideasor alternative strategies. One can recruit friends, church members, orsometimes employees, randomly assign them to groups and see whichtreatment works best, taking care to control the other sources of ex-planation outlined earlier in this chapter.
Making Experimentation Easy
In the course of exploring these approaches to experimental design,the reader should have begun to appreciate both the potential ben-efits and the potential problems of the basic technique. There are agreat many circumstances, perhaps the majority of cases, where elab-orate controls and close checking of outside contamination are notreally needed. Here are some instances in which experimentationshould be relatively easy to accomplish:
• Often in experimental situations, premeasures already exist.For example, in studies where markets or outlets are the experi-mental unit, sales are often the measurement of primary interest.Since sales data usually are already available (although not alwaysin the form one wants), premeasures can be avoided. If sampleswithin cells must be small due to cost considerations, blocking onpast revenues or customer responses can be used to control for po-tential bias due to size differences across cells that could occur bychance if there was random assignment.
138 MARKETING RESEARCH THAT WON’T BREAK THE BANK
15Andreasen/Ch. 7 8/11/02 3:08 PM Page 138

• Even where no premeasure exists, it may be possible and real-istic to record premeasures unobtrusively, again eliminating possiblenegative premeasure effects. For instance, the effect of specific se-lections of toys in a preschool might be tracked by visual counts ofthe number of children handling the toys observed unobtrusively be-fore and after an experiment, for example, by a television camera.
• Often the time interval involved between a treatment and ameasurement is so short that no external environmental effects arelikely to confound a field study. Thus, one need not worry about try-ing to monitor these potential contaminants. The same would betrue in longer-term studies if the competitive environment was nor-mally highly stable or if the researcher could easily disguise an ex-periment (for example, with mail studies or in subtle advertising orservice facility changes).
• The population may be very homogeneous, and if random-ization is carefully done, a premeasure may be unnecessary.
• Multiple measures of experimental outcomes can be used ifthere is a concern that one or two could be biased. Their individualbiases may cancel each other out.
• As the researcher accumulates experience in experimenta-tion, it will often be possible to make a confident estimate of possi-ble biasing effects. Even using experiments without estimates maybe better than doing no experimentation at all if it can be assumedthe biases are reasonably constant or proportional across groups.
• Given an appropriate opportunity (as in the case where hu-man beings are the guinea pigs), there is nothing at all wrong withasking the subjects of an experiment after the study whether theywere in fact biased by some aspect of the study design and, if so,how. This is usually called debriefing. Debriefing is routine in mostprofessional and academic experiments involving human subjects.Codes of ethics require that subjects be informed of their rights notto participate and that they be told after the fact in the debriefing,except under unusual circumstances, what the aim of the study re-ally was and who was its sponsor.
LOW-COST EXPERIMENTATION 139
15Andreasen/Ch. 7 8/11/02 3:08 PM Page 139

Conclusion
Before leaving the subject, let us recall several key points to keep inmind even when doing relatively inexpensive, simple experiments:
• Always be sure that the experiment is designed to help man-agement make decisions. The researcher should get management tothink through the uses of a set of hypothetical experimental resultsto make sure that future actions will be taken. Try out a different butplausible set of results, and make sure management is clear that itwill accept and act on surprising outcomes, and you know what thoseactions would be.
• Plan to make multiple measures of the experiment’s out-comes to ensure that detected effects are real and that measurementpeculiarities and biases do not either cover up something importantor suggest something that isn’t important. Also, it is important torandomize the sample population across treatment groups.
• In field studies, always monitor potential outside influencesby competitors or in the socioeconomic environment in which thestudy is done that may contaminate the outcomes.
• Allow enough time after the treatment for the effects to showup. Make sure that if lasting effects are wanted, the researcher doesnot settle for a quick, favorable response. For example, humorouscommunications always get quick, favorable reactions from subjects,but the effects tend to fade rather quickly. Less lively communica-tions often have much more substantial lasting effects.
• Consider the possibility of using multiple treatments in theexperiment. The incremental costs of added complexity are oftenrelatively low.
• Be careful that employees or other accomplices do not bias thefindings. For example, make sure that if a new in-house experimentis tried, the staff do not act in ways such that the real results are dueto their actions, not the experimental treatments themselves.
• If possible, debrief the subjects after the study to see if any biases were introduced (this applies to the staff members too).
140 MARKETING RESEARCH THAT WON’T BREAK THE BANK
15Andreasen/Ch. 7 8/11/02 3:08 PM Page 140

• After the experiment is all over, write a brief methodologicalnote about what was learned about how to do experiments that youwill be sure to incorporate (or avoid) next time. Wisdom accumu-lates not only by providing findings that improve management’smarketing strategies, but also by improving the researcher’s abilitiesto be an even more effective low-budget experimenter in the future.
LOW-COST EXPERIMENTATION 141
15Andreasen/Ch. 7 8/11/02 3:08 PM Page 141

8Low-Cost Survey Designs
Many low-budget researchers automatically think of surveysand questionnaires as their only research alternatives. It is impor-tant to become aware of and appreciate the potential of other tech-niques before moving on to survey design.
Chapter Seven focused on one such possibility: experimenta-tion. Experiments are relatively easy to do and, because they can de-termine cause and effect, usually give managers direct insight intowhat works and what doesn’t. Thus, experiments are both cheapand usually highly practical. A researcher with a limited budget haslittle freedom to conduct research that is not practical.
Chapters Five and Six discussed two other alternatives to sur-veys: archives and observation. These techniques are sometimes lessimmediately practical since they do not easily lend themselves toassessing cause and effect. They still have the prime virtue of beingvery inexpensive. Despite inadequacies, they can often help givemanagers the small edge in decision making that can help themconsistently outperform their competitors.
A major reason for considering these alternatives is that surveysare both costly and difficult to do well. It is not easy to design sensi-ble samples and well-worded questionnaires. Unfortunately, thisdoes not keep amateurs from barging ahead to get something intothe field without proper attention to making the research valid. Thisbook is devoted to good low-cost research, not just low-cost research.
142
16Andreasen/Ch. 8 8/11/02 3:08 PM Page 142

Surveys are difficult for two major reasons. First, you must typi-cally draw a representative sample, and this is not always an easygoal to accomplish. Second, you must ask people questions. Thereare a number of reasons that this can be a major source of problems.Asking questions is always intrusive. This means your subjectsknow they are being studied, and because they know they are beingstudied, they will usually speculate about why you are asking. Thiscan have one of two effects. One is that it makes people suspiciousof your motives, and they may decide either not to participate at all(thus fouling up a carefully designed sampling plan) or to withholdor distort important information. A friend always tells researchersstudying fast food preferences that he is a heavy, heavy consumer(which he isn’t) and that he really would like to be offered health-ier ingredients in his burgers, chicken nuggets, and tacos. He alwaysanswers this way because he wants to encourage fast-food marketersto offer healthier fare to their real heavy consumers.
The second effect of the awareness of being studied is that somerespondents try to please the researcher. Well-meaning respondentsmay try to be helpful and claim they have a very favorable opinionof whatever it is you are asking about. Or they may try to guesswhich behaviors you are interested in and try to slant their prefer-ences that way.
Asking questions always involves respondents and their egos.Whether we are aware of it or not, we all attempt to influence theway in which others perceive us. We do this with our dress, our choiceof our furniture, the way we speak, whom we associate with, and soon. It is therefore inevitable that when we tell researchers thingsabout ourselves, we may answer subtly or directly in ways that willenhance our self-image. Reader’s Digest fans will say instead that theyonly read the New York Review of Books or the Atlantic Monthly.The soap opera lover will swear to a preference for public television.The heavy beer drinker will develop a sudden taste for wine.
Asking questions always involves language, and words are slip-pery things. A favorite word in studies of retail and service outletsis convenience as in the question, “Do you find YMCA #2 more or
LOW-COST SURVEY DESIGNS 143
16Andreasen/Ch. 8 8/11/02 3:08 PM Page 143

less convenient than YMCA #1?” What the researcher means byconvenient may be a lot different from what the typical respondentmeans. For example, the researcher may assume that respondentsare being asked how close the location is to their home or normalcommuting routes, whereas some respondents may think the ques-tion is asking how easy it is to park and get in and out of the build-ing. Others may think it is referring to the particular YMCA’s hoursof operation. In such cases, differences across respondents may sim-ply reflect differences in how they interpret the question. For ex-ample, executives may find YMCA #1 more convenient than YMCA#2, while homebodies may indicate the reverse. Executives inter-pret your question to mean ease of parking, and homebodies mayinterpret it to mean closeness to home. The difference in the resultsis merely an artifact of the language.
All of these types of problems are unavoidable in survey research.Questions will always crop up as to the validity of the study. You cantry hard to minimize their effects, but the nasty problem is that youusually never completely know that you have eliminated potentialbiases or even whether you understand them. This is particularlythe case if you try to save money in the design by not pretesting thequestionnaire thoroughly or training interviewers carefully. Man-agement needs valid research results on which to act. In the YMCAexample, it would be a mistake to promote the nearness of your out-let to executives as well as to homebodies. The two are very differentin their goals and interests.
Conducting surveys and asking questions is often essential to aspecific management problem. Researchers must use these tech-niques in hundreds of situations. If, for example, you want data onattitudes, you have no other recourse. But when surveys are not es-sential, researchers should exhaust other nonintrusive methods be-fore going forward with a full-blown survey study.
Survey Design
If asking questions is the best approach to helping managementmake a decision, three basic strategic design decisions must be made:
144 MARKETING RESEARCH THAT WON’T BREAK THE BANK
16Andreasen/Ch. 8 8/11/02 3:08 PM Page 144

(1) how to ask questions, (2) what questions to ask, and (3) whoshould answer.
Methods of Asking Questions
Modern technology offers researchers a wide array of approaches toasking questions. They vary mainly in the extent to which the re-spondent and the question asker interact. To decide on an approach,the researcher should ask a number of basic questions:
• Should the respondent be given a significant amount of timeand the opportunity to talk with others before answering?
• Can the answers to the questions be reduced to a few simplechoices?
• Do the questions need to be explained to the respondent?
• Is it likely that the respondent’s answers will often have to be probed or clarified?
• Does anything have to be shown to the respondent, such as an advertisement or a package or a set of attitude scales to be filled in?
• Is it likely that many potential respondents will be unmoti-vated or turned off by the questions or the issue without personal encouragement by an interviewer?
The answers to these questions and several others, includingthose relating to the availability of personnel and financial resourcesto carry out fieldwork, will determine the basic approach. In the ma-jority of cases, the alternatives likely to be considered will be mail,Internet, telephone, and face-to-face interviews. However, there areother possibilities. For example, respondents can be interviewed insmall groups, as in focus group studies. Or individuals can be queriedin a shopping mall by a computer video screen or over the telephoneby a prerecorded voice with pauses for answers. In some circum-stances, a combination of methods may be the best approach. One
LOW-COST SURVEY DESIGNS 145
16Andreasen/Ch. 8 8/11/02 3:08 PM Page 145

could ask questions in person that require face-to-face contact andthen leave behind a mail-back questionnaire on which respondentscan record further details, such as purchase histories, personal pref-erences, and socioeconomic characteristics.
Mail Studies. To my continuing dismay, when researchers withlow budgets think of surveys and asking questions, they inevitablythink first of doing a mail study. Many think this is the only alter-native possible given their meager resources.
You can see why they might think so. It is often not difficult toget a mailing list. There are many such lists for sale and many listsuppliers that will provide labels for a mail sample and even do themailing at a modest cost. Even without such a commercial list, manyresearchers feel they can always develop a list themselves using theirown database, the Yellow Pages, or the regular white pages tele-phone directory. A photocopier is usually close at hand, or a printshop can run off hundreds of questionnaire forms at low cost. Staffat the office can stuff envelopes at little or no out-of-pocket cost.The office postage meter and bulk mail rates can be used to keepthe outbound cost of mailed questionnaires low. Business reply en-velopes can be used for the returned responses, which means pay-ing postage only for questionnaires that are in fact returned.
Given these low costs, the neophyte researcher says, “Why not?”and sits down and designs a questionnaire and a compelling coverletter and sends out five thousand forms in the mail. If it is an av-erage study sent to a randomly drawn but moderately interested audience, the researcher will be lucky to get 10 to 15 percent of thequestionnaires back. (If the audience is not interested, 4 to 5 percentwould be good.) Nevertheless, this can mean 500 to 750 responsesreturned. The researcher thinks, “Certainly this is a substantial ba-sis on which to make statements about a market. Don’t most CNNpolls reporting the president’s popularity ratings base these on onlynine hundred to eleven hundred respondents?”
The major problem with mail questionnaire studies, however, isnot the respondents: it is the nonrespondents. Professional pollsters
146 MARKETING RESEARCH THAT WON’T BREAK THE BANK
16Andreasen/Ch. 8 8/11/02 3:08 PM Page 146

who need results that can be projected to the entire population witha known level of error are very careful to develop probability samplesand then attempt to interview everyone in their samples. Becausethey spend a great deal of money and use face-to-face or telephoneinterviewing techniques, they usually have high rates of cooperation.When they do not contact a respondent or are refused participation,they make very careful analyses of just who did not respond and ei-ther adjust their analyses accordingly or alert users of the results topotential problems through a “limitations” section in their report.With the typical cheap but dirty mail study with a low response rate,the nature of the nonresponse bias is usually unknown.
Nonresponse is not necessarily bad. If the nonrespondents wouldhave answered the questions in the study in the same way as the re-spondents, then there would be no bias. Nonresponse can occur intelephone or face-to-face interview studies when a respondent re-fuses to cooperate or is out of town or busy for the moment or be-cause the telephone number or address was wrong. Assuming thatpersonal interviews were scheduled at random times on weekdaysand weekends and there are several follow-up attempts, nonre-sponse is more likely to be a chance occurrence where one shouldnot expect nonresponders to be greatly different from responders.
In mail studies, this is virtually never the case. Those who getsomething in the mail asking them to fill in a modest (or great)number of answers will inevitably feel imposed on. The same is of-ten true with telephone interviews. In a face-to-face interview ortelephone study, the personality and skills of a highly trained inter-viewer can often overcome these negative initial reactions. But athome at one’s desk or at the kitchen table, it is very easy for a po-tential respondent to throw out a mailed questionnaire. Those whodo not react this way are likely to be different in one of two impor-tant ways. One group of responders will have an inherent interestin the topic of the study. The second group will want to help the re-searcher out either because they are a helping kind of person or be-cause they are for the moment swayed by the convincing argumentin the study’s cover letter. Those who are interested in the topic are
LOW-COST SURVEY DESIGNS 147
16Andreasen/Ch. 8 8/11/02 3:08 PM Page 147

likely to be further divisible into two additional types: those whoare positively excited about the topic (for example, those who buythe product or use the service) and those negatively disposed to-ward the topic who see the study as a grand opportunity to get a fewgripes off their chest. As an additional biasing factor, it has gener-ally been found that the higher the education level, the higher theresponse rate.
What, then, does this imply about the 10 to 15 percent who dorespond to the typical mail study? It means they are almost alwaysnot at all like the nonrespondents. Unfortunately, too many re-searchers do not attempt to assess these potential differences be-cause they do not recognize the problem, do not know how tohandle it, or feel they do not have the time or budget to do so.
Not too long ago, I was asked by the publisher of a series of mag-azines aimed at different types of retail outlets to give a speech dis-cussing the value of their annual statistical profiles of each retailcategory. On reviewing the publisher’s methodology, I discoveredthat the statistics were based on responses to a single mailing fromtheir magazine publishers (with no follow-up) and that no check-ing had ever been made of those who didn’t respond. Yet each mag-azine was publishing its study as a profile of its industry, reportingsuch data as average store sales, widths of product lines, numbers ofemployees, various expenses, and profits broken down by variousoutlet categories.
But what, I asked, did their profiles really describe? Their re-sponse rate was usually 50 percent, which is quite good and not un-common when mailing to a highly interested group. However, theydid not know who really did respond. Although I was not concernedwith the response rate, I was concerned with possible biases at bothends of the distribution of outlet size. Did the largest outlets partic-ipate? They may not have, feeling either that they would be expos-ing too much internal information that could be identified withthem or that they were already part of a large organization that hada great deal of its own internal archival data and so they didn’t needto contribute to a magazine’s profile. At the other extreme, smaller
148 MARKETING RESEARCH THAT WON’T BREAK THE BANK
16Andreasen/Ch. 8 8/11/02 3:08 PM Page 148
or marginal outlets may not have participated because they werenew to the industry, lacked appreciation of the value of such co-operation, or perhaps were embarrassed by their small size or poorperformance. If either of these groups was underrepresented, theprofiles have very limited value. The magazines apparently shuttheir eyes to these problems, never investigating who did and didnot respond.
As a consequence of this and a great many similar experiences,I am very reluctant to encourage the use of mail questionnaires forlow-cost research.
Some steps can increase response rates, and we will note someof these. There are also ways to investigate nonresponse bias, al-though usually at considerable cost. For example, you can conducttelephone interviews of a small sample of nonrespondents to a mailsurvey if they can be identified. Alternatively, characteristics of re-spondents can be compared to census data or, in a business study, togovernment business censuses. If there is a close match between thesample characteristics and the universe from which it was suppos-edly drawn, researchers can be encouraged that their sample may berepresentative. However, such close matching does not prove thatthe results are valid.
Even when nonresponse rates are satisfactory or understood,mail studies have a great many other, and often fatal, flaws. For ex-ample, it is possible that someone other than the intended respon-dent may fill out the questionnaire. A wife may ask her husband torespond, or vice versa. An executive may delegate the task to a sub-ordinate. A doctor may ask a nurse to give the necessary particulars.Each of these situations may seriously distort the findings.
Also, there are unlimited chances to improve answers beforethey are returned. For example, suppose a respondent is asked for“top-of-the-mind” awareness of various cancer organizations earlyin the mail questionnaire and then later recalls additional organi-zations. He or she may go back and add the newly remembereditems. On the other hand, by the end of the questionnaire, he orshe may have discovered the study’s sponsor and go back to change
LOW-COST SURVEY DESIGNS 149
16Andreasen/Ch. 8 8/11/02 3:08 PM Page 149

certain answers to conform more to what is presumed to be thesponsor’s objectives.
Despite these problems, there are still three situations in whichmail questionnaires should be the preferred choice:
First, in some situations, the respondent will need time to gatherinformation to report in the questionnaire. This might involve con-sulting with someone else. For example, if the researcher wished toknow whether anyone in the household had bought a product, useda service, or adopted a new behavior, then time would have to be allowed for consultation with others. This usually would not be prac-tical (or sometimes even possible, given people’s schedules) in a tele-phone or face-to-face interview situation. A more common exampleis where records must be looked up, such as when organization ex-ecutives are asked for performance details or when households areasked to report on last year’s taxes or asked what safety equipmentthey currently have in their household inventories.
Second, in some situations, it is desirable to give the respondenttime to come up with a well-considered answer. Many years ago, Iparticipated in what is called a Delphi study. This is a techniquewhere respondents (usually a small select group) are asked to makejudgments about the future or about some existing phenomena.The answers of the group are then summarized by the researcherand fed back to the original respondents, who are then asked to re-vise their answers if they wish.
The study in which I participated was an attempt to forecasttime usage (for example, how much leisure or work time we wouldhave and how we would use it) twenty-five years in the future. Thestudy went on over three rounds of feedback, and at each stage, re-spondents needed several hours, if not a day or two, to give theresearcher our carefully considered opinions. This could be achievedonly by a mail study.
Third, a mail questionnaire is probably the only form that manybusy respondents would answer. If the survey has a great many ques-tions, those surveyed may be willing only to respond to a writtenquestionnaire claiming they do not have the time to participate in
150 MARKETING RESEARCH THAT WON’T BREAK THE BANK
16Andreasen/Ch. 8 8/11/02 3:08 PM Page 150

a telephone or face-to-face interview (and if they are a physician orbusy executive, they usually expect to be paid).
Even when one or more of these conditions exists, a potentialmail study should also meet the following requirements:
• The fact that respondents will have long time in which to fillin the answers is not a problem.
• It is not a serious problem if someone other than the addresseefills in the questionnaire.
• A mailing list (or a procedure for sampling) that is truly representative of the population of interest can be obtained.
• A careful attempt is made to estimate the nature of the nonresponse bias.
• The respondent population is literate and reachable by mail(requirements that may make mail surveys difficult in somedeveloping countries).
• There is a high probability that a large proportion of the respondents will be interested in the topic and respond. Inter-est is likely to be high where the target population has a tie tothe research sponsor—for example, for members of a trade as-sociation or a club, patients recently in a hospital, employeesin the researcher’s organization, holders of an organization’scredit cards, or subscribers to certain magazines. Even in suchsituations, it is essential that an estimate of the nonresponsebias be made.
There are two conditions when a biased mail survey can beused. One is when the researcher really does not care about non-response. This would be the case whenever projectability is not im-portant. In a great many situations, this is the case—for example,when one wants to learn whether there are any problems with acertain product or service or with the wording of a particular ad-vertising message or product usage instruction. A second reason for
LOW-COST SURVEY DESIGNS 151
16Andreasen/Ch. 8 8/11/02 3:08 PM Page 151

using a biased study is when the study is exploratory, seeking a fewideas for an advertisement, testing a questionnaire, or developing aset of hypotheses that will be verified in a later nonbiased study.
If the decision is to go ahead with a mail study, there are a num-ber of very important and basic techniques that should be employed:
• The cover letter asking for assistance should be made as mo-tivating as possible (especially the first couple of sentences). The let-ter should (1) be enthusiastic (if you are not excited about the study,why should the potential respondent?); (2) indicate the purposes ofthe study, if possible showing how it will benefit the respondent (forexample, by helping provide better products and services); (3) en-sure anonymity (for all respondents or for those who request it); and(4) ask for help, pointing out that only selected individuals are be-ing contacted and each answer is important.
• The cover letter and the questionnaire should be attractiveand professional with dramatic graphics and color where possible.
• The letter should be addressed to a specific individual.• If possible, a motivating or prestigious letterhead should be
used.• If the sponsor of the study can be revealed and awareness of
it would motivate respondents (for example, UNICEF or a key tradeassociation), the letter should do so.
• The questionnaire should be kept as brief as possible and easyto follow and understand. It should be accompanied by a self-addressed stamped return envelope or a fax number. If the budgetpermits, one or more follow-up contacts (even by telephone) shouldbe used to increase response rates.
• Giving advance notification to the respondent by telephone(better) or by postcard (worse) that the questionnaire is coming hasbeen useful to increase the total number of responses, the speed ofresponse, and the quality of the responses.
• In some cases, offering gifts, cash, or a chance at a major prizeto those who mail back the questionnaire (or including a coin or adollar bill “for charity”), and using stamped rather than metered re-
152 MARKETING RESEARCH THAT WON’T BREAK THE BANK
16Andreasen/Ch. 8 8/11/02 3:08 PM Page 152

turn envelopes increases the number, speed, and quality of re-sponses.
Lovelock and his colleagues strongly urge the use of personaldrop-off and pick-up of what otherwise would be a mailed ques-tionnaire. They believe this technique is particularly appropriate forlengthy questionnaires where considerable motivational effort andperhaps some explanation needs to be carried out. The results oftheir study indicate that response rates can be as high as 74 percent.While this rate is achieved by incurring the costs of personnel tohandle questionnaire delivery and pickup, they can be lightly trainedand low cost (students fit this bill). Cost-per-returned-questionnairewas found to be no different from the traditional mail question-naire. In addition, those delivering the questionnaire can elimi-nate individuals obviously ineligible for the study (if anyone is), anddata about the respondent’s sex, age, living conditions, and neigh-borhood can be recorded by observation to enrich the database.Reasons for refusals can be elicited, and because the fieldworker can observe and screen the respondents, fieldworkers can providethe researcher with a very good sense of the nature of the non-response bias.1
This approach requires that the study be done in a concentratedgeographical area rather than nationally. The technique is particu-larly useful in organizational or office studies where respondents areeasy to locate but so busy they would not ordinarily agree to a per-sonal interview.
Internet Research. The Internet is another medium for contact-ing potential informants. Estimates by Nua Internet Surveys indi-cate that over 400 million people worldwide were on-line in early2001, with over 40 percent of these in the United States and Canada.Internet surveys allow you to ask complicated series of questions tailored to each individual respondent. The Internet has addition-al advantages in that respondents can be shown visual and audiostimuli such as television commercials or print ads and asked their
LOW-COST SURVEY DESIGNS 153
16Andreasen/Ch. 8 8/11/02 3:08 PM Page 153
responses. Such research is difficult to design, but there are manyorganizations that can help design and implement Internet researchprojects. Among these are Nua Internet Surveys, ActivMedia Re-search, and Opti-Market Consulting.
The major caution when conducting such research is decidingwhom to contact and then understanding who has responded. Clear-ly, those now on the Web are not representative of the entire popu-lation of a specific country, especially countries in early stages ofInternet development. Furthermore, those active on the Internet aredemographically skewed toward those who are young, better edu-cated, and upscale economically. Finally, it is not possible to controlwho responds to an inquiry; the person claiming to be a forty-three-year-old woman with three children could well be her preteen son.
The Net can be an excellent medium to study a precise popula-tion known to be active on the Web, especially one with whom themanager has some sort of contact. For example, a nonprofit can studyclients or partners with whom it has regular contact and achieve areasonably representative profile of this group. In the same way, non-profits could study donors who make their gifts over the Web.
Perhaps the best use of the Web is in formative research de-signed to get impressions, insights, and other guidance for manage-rial decisions. Where the manager is interested in getting help withdirections to go in or for ideas to pursue with more formal researchlater, respondents on the Web can be very helpful.
Telephone Interviewing. Telephone interviewing with or withoutcomputer assistance is now the method of choice in most developedcountries when a researcher needs to interact with respondents andachieve a projectable sample. A major reason is the lower cost. Alarge number of interviews all over the country or even internation-ally can be conducted from a telephone bank at one site in a veryshort period of time. Telephone interviewing also has some advan-tages that alternative techniques do not:
• The person-to-person contact yields all the advantages ofmotivating responses, explaining questions, and clarifying answers
154 MARKETING RESEARCH THAT WON’T BREAK THE BANK
16Andreasen/Ch. 8 8/11/02 3:08 PM Page 154

in face-to-face interviews. However, the number of cues that the in-terviewer as a person presents to the respondent are very few (sex,voice, vocabulary), yielding fewer chances for biasing effects thanif the respondent also could react to the interviewer’s clothes, facialexpressions, body language, and the like.
• The facelessness of the telephone interviewing situation canloosen the inhibitions of respondents who might withhold a person-ally embarrassing piece of information if a flesh-and-blood person wasstanding or sitting opposite them taking down information.
• Appointments and multiple callbacks permit interviewers tofind precisely defined individuals (for example, high-income poten-tial donors).
• Because telephone interviews are conducted from one loca-tion, a supervisor can easily monitor the work of interviewees throughsystematic eavesdropping, thus greatly increasing quality control anduniformity of techniques.
Despite these advantages, telephone interviewing has three ma-jor drawbacks. First, it is harder to motivate and establish rapport withpotential respondents over the telephone than in person; it is easierfor them to hang up the telephone than to close the door on an in-terviewer. This problem is worsening in the age of telemarketing asmore unscrupulous sales organizations use the pseudo–telephone in-terview as a technique for generating sales leads.
Second, some things cannot be done in a telephone interviewthat could be done in person. No visual props can be used (one canstill test radio commercials, though), and certain sophisticated mea-surements, such as scales with cue cards, cannot be used.
The third drawback is that increasing numbers of telephonesare not publicly listed, especially in major cities, and many house-holds have multiple numbers for their kids and their home-basedbusinesses. For these reasons, the telephone directory is not a goodsampling frame for interviewing in most major centers. Telephonebooks, which typically are published yearly, tend to exclude threekinds of households: phoneless households, unlisted households,and not-yet-listed households.
LOW-COST SURVEY DESIGNS 155
16Andreasen/Ch. 8 8/11/02 3:08 PM Page 155

Over 20 percent of all owners of residential lines choose not tobe listed. In larger cities like Chicago, Los Angeles, and New York,this figure can be as high as 40 percent or more. These householdsare more likely to represent younger heads, single females, those withmiddle rather than high or low incomes, nonwhites, and those inblue-collar or sales and service occupations. Not-yet-listed house-holds include those moving into an area or out of their parents’ housesince the last directory was published. These may be crucial targetsfor many marketing efforts, such as those aimed at immigrants, re-cently unemployed, or college graduates.
For these reasons, those planning to do telephone sampling areencouraged to use some variation on random digit or plus-one dial-ing. These approaches involve first randomly selecting listings fromthe existing directory to ensure that the researcher is using blocksof numbers the telephone company has released. At this point, thelast one or two digits in the listing number are replaced with otherrandomly selected numbers. Alternatively, the researcher couldsimply add one to the last digit in the selected number. These ap-proaches still omit blocks of numbers released since the previous di-rectory was published, but this should be a nominal bias (mostlyaffecting new movers) when compared with that of using only num-bers in the directory itself.
The random digit dialing approach has its drawbacks. Most im-portant, the technique increases costs because often the randomlyselected numbers turn out to be ineligible institutions or fax lines.(Indeed, in one unusual case, an interviewer randomly called a ra-dio call-in show and, to the amusement of both the audience andthe interviewer’s colleagues and supervisor, proceeded to interviewthe host on the air.) However, this cost is one that most researchersare usually willing to bear.
Face-to-Face Interviewing. After mail surveys, researchers planningoriginal fieldwork consider face-to-face or telephone interviews. Fora great many purposes, face-to-face interviews are the ideal mediumfor a study for several reasons. For example, respondents (once con-
156 MARKETING RESEARCH THAT WON’T BREAK THE BANK
16Andreasen/Ch. 8 8/11/02 3:08 PM Page 156

tacted) can be strongly motivated to cooperate. By choosing inter-viewers carefully, matching them as closely as possible to predicted re-spondent characteristics, and giving them a motivating sales pitch,the refusal rate can be kept very low. This can be critical, for exam-ple, when studying small samples of high-status individuals who mustbe included in the study and will participate only if a high-status in-terviewer personally comes to them and asks questions. Also, stimulican be shown to or handled by respondents in particular sequences.This is very important where one wishes to assess responses to pro-motion materials such as advertisements or brochures or where aproduct or package needs to be tasted, sniffed, or otherwise inspected.
As in telephone interviews, there are opportunities for feedbackfrom the respondent that are impossible in self-report, mail, or com-puter methods. This permits elaboration of misunderstood ques-tions and probing to clarify or extend answers.
The interviewer can add observation measures to traditionalquestioning. For example, if a set of advertisements is shown, theinterviewer can informally estimate the amount of time the re-spondent spends on each stimulus. Facial expressions can be ob-served to indicate which parts of the messages are confusing torespondents and need to be refined. Respondents’ appearance andthe characteristics of their home or office can be observed and re-corded. Sex, race, estimated age, and social status can be recordedwithout directly asking respondents (although some measures, likesocial class, should be verified by alternative means).
Against these considerable advantages are some important, of-ten fatal, disadvantages. For example, because the interviewer isphysically present during the answering process, two sorts of biasesare very likely. First, the interviewer’s traits—dress, manner, physi-cal appearance—may influence the respondent. The interviewermay be perceived as upper class or snooty, or slovenly or unintelli-gent, which may cause the interviewee to adjust, sometimes un-consciously, his or her answers. Second, simply because there isanother person present, the respondent may distort answers by try-ing to impress the interviewer or hide something in embarrassment.
LOW-COST SURVEY DESIGNS 157
16Andreasen/Ch. 8 8/11/02 3:08 PM Page 157

In addition, the fact that interviews are conducted away fromcentral offices means that the performance of interviewers is verydifficult to monitor for biases and errors (as compared to central of-fice telephone interviewing). Also, physically approaching respon-dents can be very costly when there are refusals or not-at-homes.Callbacks that are easy by telephone can be very costly in face-to-face interviews.
Finally, delays between interviews are great. Telephone lines orthe mail can reach anywhere in the country (and most parts of theworld) very quickly and with relatively little wasted time. Travel be-tween personal interviews can be costly.
The last two factors tend to make the field staffing costs forface-to-face interviews in most developed countries very high.They are so high that one-on-one personal interviews are proba-bly prohibitively expensive for the low-budget researcher exceptwhere the technique’s advantages are critical to the study (for ex-ample, graphic materials must be shown or handled or high-statussubjects, such as doctors or lawyers, must be interviewed), the sam-ple size is very small, or the study is local. Situations in which thesecriteria would be met include studies in local neighborhoods, malls,offices, or trade shows.
In the developing world, personal interviews are still relativelylow cost and often the only way to reach target audiences. Further-more, potential respondents often have limited education and read-ing and writing skills and thus may need help in answering evenrelatively simple questions (such as rating scales).
If the decision is to go ahead with personal interviewing, thereare a number of low-cost sampling techniques to consider.
Low-Cost Sampling
If a researcher wishes to carry out a study that is projectable to someuniverse of interest, such as all adults in an area or all hospitals, eachpotential sample member must have a known probability of beingselected. Two approaches are typically used. In a simple random sam-
158 MARKETING RESEARCH THAT WON’T BREAK THE BANK
16Andreasen/Ch. 8 8/11/02 3:08 PM Page 158

pling study, a list (or sampling frame) is prepared and enough indi-viduals selected on a probability basis so that, given expected ratesof not-at-homes, refusals, and the like, the desired sample size can beachieved. A variation on this approach is called stratified sampling.This approach requires that the sample first be divided into groupsor strata (such as census tracts or store size categories) and then ei-ther proportional or disproportional random samples drawn withineach group. This approach has advantages over simple random sam-pling if there is special interest in some strata, the variation withinstrata is low compared to the variation across strata, or the costs ofinterviewing vary significantly across strata.
While simple random and stratified sampling are appropriatefor projectable studies, they can raise costs dramatically beyond alimited-budget researcher’s capabilities. When this is the case, theresearcher should consider several techniques to cut down on per-sonnel time and increase efficiency in studies that still must useface-to-face interviewing:
• Focus groups
• Mall intercepts
• Quota sampling
• Convenience sampling
• Judgment sampling
• Snowball and network sampling
• Sequential sampling
Some of these approaches will still yield statistically projectableresults.
Focus Groups
One extremely popular low-cost technique for conducting face-to-face interviews is to do so in focus groups. These studies bring
LOW-COST SURVEY DESIGNS 159
16Andreasen/Ch. 8 8/11/02 3:08 PM Page 159

together eight to twelve individuals in a room (or more recently, bytelephone conference call) to talk for sixty to ninety minutes abouta specific research topic. The discussions are typically led by a trainedmoderator. Focus groups are qualitative and nonprojectable. Theyare typically used for the following purposes:
• Generating hypotheses
• Generating information helpful in designing consumer questionnaires
• Providing background information on an exchange category
• Securing reactions to new offerings, a proposed organizationrepositioning, communications messages, or other promotional materials
• Stimulating new ideas about offerings or communications
• Interpreting previously obtained quantitative results
Desirable Features of Focus Groups. While cost efficiencies areimportant reasons for using focus groups, they have other desirablefeatures specifically attributable to the group interaction, which ac-counts for much of the technique’s popularity among researchers.Even if focus groups were not cheaper per respondent, many re-searchers would still use them because of the following advantages.
• Synergism. Because each group member can respond to, elab-orate on, criticize, modify, or otherwise react to the comments ofother group members, focus groups can significantly increase the total volume of information gleaned over what would be the sum ofeight to twelve individual interviews.
• Minimal interviewer effects. Although the moderator will actto stimulate the group at times or to move the discussion in a par-ticular direction, participants will be responding to the remarks ofothers like themselves for the most part. For this reason and becausefocus group members are usually actively caught up in the discus-
160 MARKETING RESEARCH THAT WON’T BREAK THE BANK
16Andreasen/Ch. 8 8/11/02 3:08 PM Page 160

sion, respondents are less likely to try to guess the purpose of thestudy or try to please or impress the moderator. The process will beless intrusive.
• Increased spontaneity. In an individual interview situation,the respondent has to pay attention and answer all questions. In agroup situation, participants usually feel that they needn’t speak ifthey don’t want to. The lack of pressure tends to make respondentsfeel more spontaneous and enthusiastic in their participation.
• Serendipity. Because there are eight to twelve interviewees inthe group, many more questions, perspectives, and comments maybe introduced than the researcher and moderator would ever havethought of on their own.
• Higher-quality interviewing. Because several people are inter-viewed at once, the research organization can afford a more expen-sive moderator-interviewer than if hour-long interviews had to beconducted one by one. This is a very important point because themoderator’s role is crucial in what is really a group depth interview.(A focus group session can sometimes appear not unlike a grouppsychotherapy session.)
• Natural setting. A one-on-one interview situation is usuallyhighly artificial. In a focus group, one can create an atmosphere ofa “bunch of people sitting around chatting” about a product, a healthproblem, or a set of advertisements. This will seem to the partici-pants to be much more like the real world. The comments and re-actions therefore will have much more projectability to the actualreal world.
Guidelines for Focus Groups. High-quality focus group interviewsare achieved by following a number of basic guidelines.
• Keep the group size from eight to twelve. Smaller groups tendnot to have enough input to be valuable and run the risk of beingdominated by one or two individuals. Larger groups are likely to findmany members who are frustrated at not having enough time totalk or are just plain bored.
LOW-COST SURVEY DESIGNS 161
16Andreasen/Ch. 8 8/11/02 3:08 PM Page 161

• Select participants carefully. Usually focus groups should bekept relatively homogeneous so that members share the same val-ues, experiences, and verbal skills and so that some members do notintimidate others. Those with previous group experience should beavoided, and members should not be previously acquainted. In mostmajor cities, there are commercial organizations that recruit focusgroup participants designed to meet precise specifications. One fo-cus group I observed was composed of twelve women twenty-one tothirty-five years old who had two or more children and did not workoutside the home. This group was asked to evaluate new cake mixproducts. A local focus group recruiter generated the group.
• Make the atmosphere for the group session as nonthreaten-ing and natural as possible. Ideal focus group locations include a re-spondent’s home or a hotel or motel room. Many research agenciesmaintain their own focus group rooms at their offices with com-fortable chairs, cookies, soft drinks, coffee, and minimum distrac-tions. Many agencies try to make the focus group interview arearesemble a kitchen or living room as much as possible.
• Keep the session to two hours or less. Fatigue and repetitive-ness set in quickly after two hours. The modal length of focus groupsis around one and one-half hours.
• Hire the very best moderator the budget can afford. Themoderator will be responsible for guiding (focusing) the discussionwithout seeming to and for catching hidden or subtle points andbringing them out for elaboration (for example, by saying, “I don’tcompletely understand that point”). A good moderator also willdraw out shy or inhibited participants and be able to quiet or dis-tract those who wish to dominate the group. To establish and main-tain a conflict-free, permissive environment, the effective leaderwill encourage participants not to criticize the thoughts of othersbut instead to elaborate on them or provide another perspective.Also, the moderator must stimulate participants to talk to eachother (not always look to the moderator for guidance) and be ableto close off the discussion at the appropriate moment. Last, a reviewand summary of the major findings after the session ends is the
162 MARKETING RESEARCH THAT WON’T BREAK THE BANK
16Andreasen/Ch. 8 8/11/02 3:08 PM Page 162

moderator’s responsibility. Not just anyone can conduct a good fo-cus group.
• Tape-record or videotape each focus group session if possible.This puts less pressure on the moderator to take notes or remembereverything that goes on and allows concentration on group dy-namics and the focus of the session. The existence of such a per-manent archive also permits going back over tapes for additionalinsights or clarification of unclear points and having two or moreexperts review and summarize the same material. The archives canalso be used for comparisons over time, for example, as the cake mixor advertising message is improved.
• Have two-way mirrors available for others to observe and hearthe group without influencing the participants. This is usually pos-sible only in specially constructed focus group rooms at research oradvertising agencies. Many research clients like to observe focusgroups, although one must be careful not to let an attending execu-tive’s “instant analysis” influence more carefully considered findings.Two-way mirrors also permit other focus group experts to watch theproceedings and share in the eventual interpretation. It also allowsthem to send in new questions that particularly interest them.
• Have clear objectives for each session, and, if possible, use aclear agenda of topic sequences. It is typical in focus groups to be-gin the discussion generally (such as discussing child care) and thengradually narrow the topic to the researcher’s specific interest (per-haps awareness and use of specific sanitation practices). It is this as-pect that led to the term focus group.
If the budget merits, conduct several focus group sessions. Someof the additional focus groups should replicate the original group’scomposition, and others should be quite different. This will allow theresearcher some insight into the extent to which the original insightstend to generalize or have to be modified for specific populations.
Good focus groups are not particularly low cost, ranging from$1,000 to $3,000 each. Thus, research managers need to be frugalin their use and precise in their objectives.
LOW-COST SURVEY DESIGNS 163
16Andreasen/Ch. 8 8/11/02 3:08 PM Page 163

Mall Intercepts
Mall intercepts are probably the second most popular technique forcommercial survey research in the United States after telephone in-terviewing.2 One researcher has referred to them as the modernequivalent of the old street-corner interview.3 They are relativelyinexpensive since interviewees in effect come to the interviewerrather than vice versa, significantly reducing travel costs and keep-ing the interviewer perpetually occupied with questioning.
Although the efficiencies are considerable, the major worry withmall intercepts is the quality of the sample. Two concerns are typi-cally raised. First, it is suggested that those coming to a mall do notrepresent the population about which the study wishes to say some-thing (such as all households in the community). It is argued thatmall shoppers constitute a biased sampling frame of the universe; forexample, they are more likely to have automobiles and are not bed-ridden. The second problem with mall interviews is that there is adanger that interviewers will choose to interview atypical people,such as those who are alone (without distracting children or friends);of the same characteristics as the interviewer in terms of age, race,sex, and social status; not in a hurry; or appearing to be the kind ofperson who would be unlikely to reject the interviewer’s request.
Controlling for Sampling Frame Bias. Virtually all householdsshop in a shopping mall at least once a year and two-thirds havebeen there in the previous two weeks. So unless the population ofinterest is the very ill, the elderly, or the very poor, the mall sam-pling frame is in principle a reasonable one. Indeed, those who nevergo there may be of little interest to most marketers. The problem,then, is that if the researcher wants a projectable result, how canthe fact that some people go to malls more often than others be ac-counted for?
In a mall study, two steps are taken to deal with this problem.First, malls in the study area can be selected on a probability basis,with their probability of selection proportional to the number of
164 MARKETING RESEARCH THAT WON’T BREAK THE BANK
16Andreasen/Ch. 8 8/11/02 3:08 PM Page 164

customers they serve. Second, a procedure can be developed to sam-ple individuals on a random basis within each selected mall. (Theterms random and probability sampling are used interchangeablyhere. In the strict sense, random sampling is a special case of prob-ability sampling, where all member of the sampling frame have anequal probability of selection.) If done correctly, such a procedurewould assume that everyone in the mall over a given time periodhas a nonzero chance of being in the sample. However, the more agiven individual goes to shopping malls, the greater is his or herchance of selection. This possibility can be explicitly taken into con-sideration if, in the course of an interview, the researcher obtains anestimate of the respondent’s frequency of mall shopping in a givenperiod, say, the past year. All that is then necessary to get a pro-jectable representative sample is to reweight the final sample propor-tional to the inverse of each respondent’s frequency of visits. In thisway, those who come rarely will receive greater weight than thosewho come often.
Controlling for Interviewer Selection Bias. Interviewers can sab-otage a carefully designed mall sampling procedure if they tend topick easy subjects. Basically, all that is needed to control for suchpotential interviewer selection bias is to develop and enforce a tight-ly specified procedure that allows the interviewer virtually no freedomin the choice of interviewee. People within a mall must be selectedon a probability, not judgment, basis either when they arrive or whilethey are moving around the mall. If the latter is the approach used,several locations must be chosen to account for traffic patterns andthe differential popularity of stores in the mall.
One needn’t worry about how long the interviewee was in themall if the researcher decides to sample people when they arrive.With such a procedure, it is necessary to select several entrances atrandom and then interview every nth arrival at each chosen entry.(Two persons will be needed: one to count and select arrivals andone to carry out the interviews.) This would effectively weight theentrances for the number coming through: there would be more
LOW-COST SURVEY DESIGNS 165
16Andreasen/Ch. 8 8/11/02 3:08 PM Page 165

respondents at busy entrances than at less busy ones. (If the goalwere to have equal interviews per hour at an inlet, then a prelimi-nary estimate of arrivals at each entrance would be necessary, withentrances then selected with a probability proportional to their vol-ume and the fraction n established as inversely proportional to theentrance volume.)
Several entrances must be used because different types of cus-tomers may park at different sides of a mall (or arrive on public trans-portation) and because major retailers at different ends of the mallattract different clienteles. Finally, the researcher should be carefulto conduct mall interviews on different days and at different timesof the day. Again, it would be desirable to set the probability of se-lecting a day or time period proportional to the number of customersexpected to be in the mall at that time. Malls that will cooperate of-ten have already collected some of the preliminary data the re-searcher needs on number of customers per day and hour and perhapseven the proportion using each entrance.
If the sampling procedures outlined are followed and properreweighting is introduced, mall surveys can often yield good popu-lation estimates plus the advantages of face-to-face interviewing atcosts the low-budget researcher can afford.
Not all malls permit interviewing on their premises. Some mallsrestrict interviewing to commercial agencies or firms leasing a per-manent interviewing site in the mall. In the latter case, it still maybe economically feasible for the low-budget researcher to contractfor these agencies’ services.
Finally, malls have one advantage over in-home face-to-face in-terviews: large displays of products can be set up at mall sites, moviesor television commercials run, and measurements taken with so-phisticated equipment. It would be rather expensive for car manu-facturers to bring two or three new test models to everyone’s houseto preview. But they can be brought to a central mall location (andalso kept relatively well hidden from competitors, a nontrivial ad-vantage) where interviewees can study and evaluate them.
166 MARKETING RESEARCH THAT WON’T BREAK THE BANK
16Andreasen/Ch. 8 8/11/02 3:08 PM Page 166

Quota Sampling
A popular technique for keeping down field costs in commercialmarket research is quota sampling. Quota sampling, in fact, is fre-quently used in combination with convenience or mall interview-ing. It is also very common in telephone studies. The approach isextremely simple, highly cost-effective, and, its advocates claim,virtually identical to results that would be obtained from a strictprobability sample. However, quota sampling is not a probabilitysampling technique, and, strictly speaking, the researcher shouldnot apply to quota studies statistical tests that require the assump-tion of random selection.
The procedure for developing a quota sample is to develop aprofile of the population to be studied and then set quotas for in-terviewers so that the final sample is forced to fit the major charac-teristics of the population profile. For example, a researcher whowished a projectable sample of opinions of hospital senior exec-utives in a town could use a chamber of commerce directory andnote that 20 percent of local hospitals are religiously affiliated, 30percent are for-profit, 10 percent are government, and 40 percentare nonprofit. A sample size of two hundred is set, and interviewersare sent out to interview forty managers in religious hospitals, sixtyin for-profit hospitals, twenty in government facilities, and the re-mainder in nonprofits. The quotas may be more complex than this,however. The interviewers could be asked to meet the distributionwhile at the same time making sure that 30 percent of the respon-dents were female and 10 percent were ethnic minorities.
The advocates of quota sampling argue that if the quotas arecomplex enough and interviewers are directed not to interview justeasy or convenient cases, the results will be as projectable as any prob-ability sample, and the costs will be dramatically lower than proba-bility sampling. The key to this cost saving is the fact that any fortymanagers from religious hospitals or any sixty female respondents willbe as good as any others. Fieldworkers need not worry about sample
LOW-COST SURVEY DESIGNS 167
16Andreasen/Ch. 8 8/11/02 3:08 PM Page 167
members’ refusals. They just keep trying to interview anyone who willcooperate until the various cells of the quota are filled.
There is a legitimate role for quotas in some telephone studies.Here, quotas can be used to help control for possible nonresponsebiases. The initial sample may be drawn probabilistically, perhapsby random digit dialing methods. However, in some designs, to keepcosts at a minimum, it will be desirable to conduct few or no call-backs. In other studies, callbacks may not be possible because of thetopic under investigation, for example, instant reactions to a sig-nificant political or social event or a specific television show. Insuch cases, quotas are used to minimize the chances that the sam-ple is grossly unusual.
The major risk of error in quota sampling is that the final sam-ple members are still selected by the fieldworkers. If they are biasedin their choices, the research will be biased. The answer to gettingcheap but good quota research is, as usual, careful control and sys-temization of the process.
Convenience Sampling
Mall intercepts are efficient because they include a very high propor-tion of most populations of interest and because respondents come tothe researcher rather than vice versa. There are a number of other sit-uations in which the advantages of convenience may be important.Convenience samples include people in university classes, an office,or a social or religious organization or those coming daily to a clinic,the lobby of the organization’s building, and so on.
Convenience samples may be useful for four kinds of occasions.First, there are a few rare occasions when the results of a conveniencesample can be generalized to make some projectable statements. Sec-ond, convenience sampling can be used for some kinds of experi-ments where the researcher needs a reasonably representative groupto assign randomly to various treatment and control conditions.Third, convenience samples can be useful when the researcher sim-ply wants exploratory data. Finally, convenience samples may be usedif the researcher wishes to conduct so-called depth interviewing.
168 MARKETING RESEARCH THAT WON’T BREAK THE BANK
16Andreasen/Ch. 8 8/11/02 3:08 PM Page 168

Projectable Convenience Samples. If the researcher wishes to learnsomething about the convenience population itself, then there isevery reason to study them. Obvious examples would be a study ofthose patronizing the client organization or one or more of its ser-vices, patrons at a single mall or neighborhood center, and thoseworking in a given building or simply passing a particular location(for example, if a health program were planning to open a clinic thereor to change an existing product or service mix there) or visiting aWeb site.
It would be easiest to draw a projectable sample for such con-venience samples with a list of possible respondents or an approx-imation to it. Suppose, for example, someone considering openinga health clinic or day care center in a specific office building wishesto sample the building’s workers. It may be possible to obtain in ad-vance a list of offices in a building and the number of employees ineach office. Offices could then be selected with probability pro-portional to size, and for every nth worker on a list the office couldsupply then interviewed or given a questionnaire to fill out. If, inaddition, the researcher wanted to study not just the workers in abuilding but also everyone entering it, the approach would be iden-tical to that described for mall intercepts.
Finally, in some kinds of studies, any respondent will suffice.This would be the case in many exploratory studies where one canassume one brain processes information from the marketer in aboutthe same way as any other brain, or where the relationships between,say, age, sex, and experience and some purchase characteristic canbe assumed to be the same for the convenience sample as for anyother. These arguments explain why many academic researchers arenot at all apologetic about using student samples when seeking tounderstand the principles of basic consumer behavior.
Convenience Experimentation. Taste, feel, or sniff experiments ortests of advertisements or packages or even new-product conceptsare naturals for convenience sampling if one can assume that thepopulation conveniently nearby is not unusual in some obvious way.One simply needs to develop a procedure for randomly assigning
LOW-COST SURVEY DESIGNS 169
16Andreasen/Ch. 8 8/11/02 3:08 PM Page 169

subjects to treatments and ensuring that the presentation of stimuliis carefully controlled, that there is no cross-talk among participantsduring or after the study, and otherwise adhering to the tenets ofquality laboratory experimental design outlined in Chapter Six.
Qualitative Research with Convenience Samples. Conveniencesamples are ideal for a great many qualitative research purposes.These purposes could involve developing a set of attitude or otherscales or a set of questions to be included in a later questionnaire,learning what words people use to describe something, what fea-tures they evaluate, or what motives they bring to bear in a partic-ular behavioral context.
It is also an effective method for pretesting the questionnaire fora later study or testing advertisements, brochures, or any othergraphic or written materials. In this way, the researcher can deter-mine whether there are glaring problems with the materials (for ex-ample, whether anybody notices the possible sexual connotation ina phrase or the portrayal of teenagers in an antidrug ad), whether asituation portrayed or the models used seem realistic, or whether amessage seems to get across what the marketer intends it to. Theconvenience sample may also be used to develop hypotheses to betested later.
In qualitative studies, it is merely necessary to use people with-out special traits, such as those especially knowledgeable about thesubject matter.
Depth Interviewing with Convenience Samples. Many researchersadvocate the use of lengthy in-depth interviews of a limited numberof convenient individuals as a very valuable approach for drawingout deep-seated basic motivations, hidden meanings, or fundamen-tal longings and fears that may be kept hidden from other researchersin group situations or inadequate responses to superficial question-naires. In comparing these so-called depth interviews with focusgroups, Sokolow suggests the following advantages:
170 MARKETING RESEARCH THAT WON’T BREAK THE BANK
16Andreasen/Ch. 8 8/11/02 3:08 PM Page 170

• The respondent is not influenced by the need to conform togroup norms or to avoid embarrassment for unusual thoughtsor behaviors.
• The respondent is the sole focus of the interviewer’s attentionand therefore is more likely to open up.
• Because of the intense involvement of the interviewer, the respondent is highly focused and therefore yields richer datathat are more clearly to the point of the study.
• Most interviews are brief, and the time a respondent may haveto speak in a focus group is limited. In a depth interview, therespondent has ninety minutes or more to talk about thetopic. This inevitably leads to richer data that are bothbroader and deeper than in the alternative format.
Solokow points out that depth interviewing is especially valu-able for sensitive topics; for interviews with individuals, such asteenagers, who are especially likely to be influenced by group pres-sure; and for interviews with groups that may be especially worriedabout confidentiality. The last group would include staffers dis-cussing their employers and media figures talking about those theyrely on for information and leads.4
Judgment Sampling
Sometimes it is desirable to seek out particular informants becausetheir answers are good predictors of what the general populationwould say. To develop a forecast of future general environmentaltrends, one might interview leaders in a particular industry or servicecategory who are thoughtful, expert observers of the target popula-tion. Alternatively, one could simply concentrate interviews in anarea of the country (or the world) that is seen as especially represen-tative of the target market or is often a leading indicator of what willcome about in future. To predict high-fashion trends, designers study
LOW-COST SURVEY DESIGNS 171
16Andreasen/Ch. 8 8/11/02 3:08 PM Page 171
Paris, Milan, and New York. More adventurous designers study themarket in Los Angeles. Political analysts look to key precincts topredict elections (quite accurately), and most marketers have theirfavorite test cities. In all cases, these researchers are judging that theywill learn more from intensive study of a few nonrepresentative in-dividuals than a broader, shallower study of a statistically represen-tative group.
Another judgment sample that marketers often use is key infor-mants. In many social and political sectors, key consultants, journaleditors, staffers at think tanks, and knowledgeable academics or foun-dation leaders can often be the best source of trend information anddescriptions of the current market environment. To tap this informa-tion, many organizations assign staffers routinely to conduct lengthyinterviews with these individuals for insights about what might behappening in the next six to twelve months or longer. These inter-views (often really structured conversations) can yield early warningsthat the marketer can use to considerable advantage. What is criticalis that they be conducted on a systematic, routine basis.
The major problems with judgment samples are two. First, thereis the possibility of selection bias. Researchers may try to choosepeople who are easily approachable. Second, if experts are used,there is the danger that they may be too familiar with the subject tobe objective about it.
Snowball and Network Sampling
Many techniques that involve probability sampling of the generalpopulation are very inefficient and costly for studying a small, veryspecial population. For example, if one wished to study paraplegics,a high proportion of the telephone calls one would make in mostmarkets would be wasted. Normally, one would use a procedure calledscreening: asking each randomly selected individual a set of qualify-ing questions that determines whether he or she falls within thepopulation of interest (in this example, “Do you have a physicaldisability?”). In many studies, the researcher will reluctantly absorbhigh screening costs in order to get projectable results. But what if
172 MARKETING RESEARCH THAT WON’T BREAK THE BANK
16Andreasen/Ch. 8 8/11/02 3:08 PM Page 172

the research is about a topic such as prostheses or the use of hearingaids where screening would be prohibitively expensive because ofthe high proportion of ineligible respondents who would have to becontacted?
One technique to use in such cases is network sampling. Thetechnique is based on the notion that individuals are involved in net-works of other individuals who are like themselves in important ways.The researcher begins with a few respondents who possess the char-acteristic of interest and then asks them for the names of any otherswith the same characteristic within a precisely defined network (suchas immediate family, uncles, aunts, grandparents, nieces, and neph-ews) who can be contacted later. This approach takes advantage ofinterpersonal networks. Not surprisingly, many people with unusualtraits tend to know others with the same trait. The sampling ap-proach is not only more efficient in finding potential sample mem-bers; it also makes it much more likely that those contacted onsecond or third waves will agree to cooperate since the researchercan say, “So and so suggested I contact you!” Sudman and Kaltenhave developed techniques whereby network sampling can yieldprojectable population estimates.5
A similar procedure can be used to obtain a sample to contrastwith a convenience sample. For example, suppose a hospital doesan attitude survey of its own past patients (sampled from account-ing archives). But the hospital realizes that it is not studying po-tential new customers. To do so, it could ask its patient-respondentsfor the names of one or two friends who had not been patients. Theadvantage of this snowball approach is that the second sample willbe closely matched socially and economically to the patient sam-ple. Neither sample, of course, is projectable; the comparisons shouldbe the key focus.
Sequential Sampling
This technique is a form of probability sampling that can yield pro-jectable results while keeping costs low. Sequential sampling in-volves taking successive dips into the pool of randomly chosen
LOW-COST SURVEY DESIGNS 173
16Andreasen/Ch. 8 8/11/02 3:08 PM Page 173

respondents and checking the results after each dip. As soon as theresults are acceptable in precision or some other dimension, thesampling stops. Often this occurs well below the sample size speci-fied by conventional formulas, at significant savings in cost.
Sequential sampling is also appropriate in studies with largelyqualitative objectives. If a researcher is seeking to learn about anyproblems with a hospital service or about the reasons people give fortaking up exercise or going on a diet, sequential dips can be takenuntil the researcher stops getting any new insights.
Other Alternatives for Asking Questions
Mail or Internet surveys, face-to-face interviews, and telephone in-terviews are the major alternatives a researcher typically considers asa means of obtaining answers to questions from individuals. There areother low-cost approaches that may be valuable from time to time.
One of the most common is the so-called self-administered ques-tionnaire, which is really a hybrid of a mail study and a face-to-faceor telephone interview technique. The interviewer asks the respon-dent for cooperation personally (as in a store, office, shopping mall,or other public place) or by telephone. The questionnaire is thenhanded over or mailed out for prepaid return, often with a financialincentive. It is frequently used in hotels and restaurants. This hybridtechnique has some obvious advantages:
• Respondents can be personally asked to cooperate.
• Any questions about the purpose of the study can be answeredin advance.
• A large number of people can be contacted and recruited forrelatively little cost in personnel time.
• Questionnaires (or stamps) are not wasted on those unlikelyto respond.
One area in which the self-administered survey is used very ef-fectively is in hospitals. Patients scheduled to be released are given
174 MARKETING RESEARCH THAT WON’T BREAK THE BANK
16Andreasen/Ch. 8 8/11/02 3:08 PM Page 174

satisfaction-complaint questionnaires by a nurse or customer rela-tions specialist, who returns at a prearranged time to retrieve thecompleted instrument. Participation rates are extremely high in suchstudies, yielding extensive, valuable tracking data for hospital mar-keting managers.
Another approach to the self-administered questionnaire beingused by some research organizations is the use of computer terminals.A few people are unfamiliar with computers, but where respondentswill cooperate, the computer can be used to administer question-naires to consumers in malls or offices. Laptops can be taken into thefield and left for interviewees to use while the researcher sets upother interviews.
Computers also have important advantages in conducting inter-views, and they are now also routinely used by telephone interview-ing organizations. Perhaps the most prominent of computer-driveninterviewing advantages are the following:
• Complex skip patterns can be handled without confusing re-spondents. One of the serious problems with self-administered andmailed questionnaires is that one can only use limited skips. Skipsare necessary where respondents must be directed to different partsof the questionnaire depending on their answers to a specific ques-tion. For example, in an alcohol consumption study, the organi-zation might wish to ask different questions of beer, wine, andscotch drinkers and those who don’t drink at all. If a respondent isa wine drinker, the organization may wish to ask different questionsof heavy and light consumers and different questions of those pre-ferring foreign over domestic wines, those whose spouses or matesdo or do not also drink wine, those who are recent wine converts,and those who are oenophiles. This complex set of subcategories requires a great many branching instructions—for example, “If youanswered No to Question 6, go to question 23. If you answered May-be, go to question 30. If you answered Yes and also answered Yes toquestion 5, go to question 15.” It is difficult to get a respondent tofollow all the implied arrows in such a written instrument. But witha computer, it is easy.
LOW-COST SURVEY DESIGNS 175
16Andreasen/Ch. 8 8/11/02 3:08 PM Page 175

• The respondent does not know how long the instrument isand will not be intimidated by a long questionnaire that (becauseof elaborate branching) is really very short.
• Unlike traditional mail and self-administered questionnaires,respondents can’t go back and correct an answer or can’t skip aheadto see what is coming and anticipate it. Thus, in a computerizedstudy, a sponsor could be revealed at the end of the instrumentwithout worrying that this will cause bias in earlier answers.
• Inconsistent answers can be corrected on the spot. While theadvantages noted also apply to telephone and personal interviews(skip patterning and disguising sponsors until later), catching in-consistencies may be very hard for interviewers to do. Furthermore,if the inconsistency is the interviewer’s fault, the interviewer wouldnot catch it. The computer would be infallible in this connectionand could ask the respondent to indicate what the correct answershould be.
• The computer can instantly create the database for the analy-sis just as the respondent inputs the answers. This has two payoffs.First, it leaves out one or two steps in the typical research design thatcan cause errors. Where an interviewer transcribes the answer andsomeone else enters it into a computer, minor or major errors cancreep in. In large studies, this will only create noise. In the smallstudies typical for low-budget researchers, errors made in the answersfor only a few respondents may seriously distort the results.
The second advantage of creating an instant database is thatmanagement can get a daily (even hourly) summary of the resultsto date. This has three uses. First, analysis of early returns may sug-gest problems with the questionnaire. For example, if there are pre-set categories for, say, consumption of a product, the researcher maydiscover that 90 percent of the answers fall in one category. Thismay require changing the category boundaries for the study fromthat point on. The second possibility is that further questions maybe suggested. For example, respondents may report large numbers ofcomplaints about product or service features that managementthought were noncontroversial. This could well prompt new ques-tions probing the nature of the problem.
176 MARKETING RESEARCH THAT WON’T BREAK THE BANK
16Andreasen/Ch. 8 8/11/02 3:08 PM Page 176

Third, the availability of daily analyses may permit the researchmanager to terminate the study with fewer respondents and less costthan originally planned. This is, in effect, an example of the se-quential sampling method.
Computers are still only rarely used as a means of getting directinput from respondents. However, they are being used extensively toguide telephone interviewers through computer-assisted telephoneinterviewing (CATI) systems. The approach is increasingly beingused to generate and manage questionnaire studies over the Inter-net. While not something a low-budget researcher could afford,computer-assisted research techniques can be a reason for choosinga specific supplier because of the complicated studies they will per-mit, the lower error rates, and sometimes the lower research charges.
LOW-COST SURVEY DESIGNS 177
16Andreasen/Ch. 8 8/11/02 3:08 PM Page 177

PART THREE
Making Low-Cost ResearchGood Research
17Andreasen/Part 3 8/11/02 3:09 PM Page 179

9Producing Valid Data
For any curious human being, asking questions is easy. But forprofessional researchers, it can be a daunting challenge fraught withinnumerable chances to destroy a study’s validity. The basic objec-tive is simple: the researcher wishes to record the truth accurately.The closer the questioning process comes to this ideal, the more oneis justified in claiming to have valid measurements of what one is try-ing to study. There are, however, a great many points where bias,major and minor, can creep into the process of transferring what isin a respondent’s mind to numbers and symbols that are entered intoa computer.
Consider the problems of measuring target audience preferences.Suppose a California householder has three favorite charities. Shegreatly prefers the American Red Cross to the American Heart As-sociation and slightly prefers the latter to the American Cancer So-ciety. All of the following things could go wrong in the measurementprocess:
• She may not reveal the truth because she doesn’t understandthe nature of her own preferences, wants to impress the inter-viewer, is trying to guess what the right answer is (that is, whatthe sponsor would prefer her to say), or simply misunderstandsthe question.
181
18Andreasen/Ch. 9 8/11/02 3:09 PM Page 181
182 MARKETING RESEARCH THAT WON’T BREAK THE BANK
• The question used to measure the preference may be wordedvaguely or not capture the true relationship of the charities.
• The interviewer may record the response incorrectly becausehe or she mishears the respondent, misconstrues what the re-spondent meant, or inadvertently records the wrong numberor symbol (or someone else assigns the wrong number or codeto what the interviewer wrote down).
• The data entry person may enter the wrong information intothe computer.
If any or all of these events transpire (or many others pointedout below), the researcher will have a clear case of “garbage in.” Noamount of sophisticated statistical manipulation can wring thetruth out of biased data; it is always “garbage out.”
In keeping with the backward approach introduced in ChapterFour, we will first consider data entry and coding errors and thenturn to the more complex problems of eliciting and recording hu-man responses.
Nonquestion Sources of Error
Information from respondents does not always get transcribed ac-curately into databases that will be analyzed subsequently. There areseveral things that can go wrong.
Data Entry Errors
Data entry errors almost always occur in large studies. In expensivestudies, entry error can be almost eliminated by verifying every en-try (that is, entering it twice). This option is often not open to low-budget researchers.
Four alternative solutions exist. First, separate data entry can beeliminated by employing computers at the time of the interview,conducting surveys over the Internet, or having respondents sit at acomputer terminal and record their own answers (the last two would
18Andreasen/Ch. 9 8/11/02 3:09 PM Page 182

also eliminate a lot of interviewer errors). Second, if more than onedata entry person is used, a sample of the questionnaires entered byeach operator can be verified to see if any one operator’s work needs100 percent verification. Third, a checking program can be writteninto the computer to detect entries that are above or below the validrange for a question or inconsistent with other answers (for exam-ple, the respondent who is recorded as having a certain health prob-lem but records taking no medication). Finally, if it is assumed thatthe entry errors will be random, they may be accepted as simply ran-dom noise in the data.
Coding Errors
There are different kinds of values to assign to any phenomenon wecan observe or ask about. They can be nonnumerical values, suchas words like positive or symbols like plus or minus, or they can benumerical. Numerical values are the raw material for probably 99percent of all market research analyses and all cases where statisti-cal tests or population projections are to be made.
Assigning numbers (or words or symbols) is the act of coding. Ina questionnaire study, coding can come about at various stages ofthe research process and can be carried out by different individuals.There are three major possibilities for coding. The first possibility isthat precoded answers can be checked by the respondent (as in mailor Internet studies or any self-report instrument). Also, precodedanswers can be checked by the interviewer (as in telephone or face-to-face interview studies). Finally, postcoded answers can have codesassigned by a third party to whatever the respondent or the inter-viewer wrote down.
Most researchers would, I think, prefer it if answers could beprecoded and checked or circled by either the respondent or the in-terviewer on the spot. Precoding has several advantages, such as re-ducing recording errors and speed, so that a telephone interviewer,for example, can ask more questions in a given time period. Pre-coding makes mail or self-report questionnaires appear simpler for
PRODUCING VALID DATA 183
18Andreasen/Ch. 9 8/11/02 3:09 PM Page 183

184 MARKETING RESEARCH THAT WON’T BREAK THE BANK
respondents, which increases their participation rate. Also, it per-mits data to be entered into the computer directly from the ques-tionnaire (thus keeping costs down by eliminating a step in theresearch process).
Sometimes precoding helps clarify a question for the respon-dent. For example, it may indicate the degree of detail the researcheris looking for. Thus, if asked, “Where did you seek advice for thathealth problem?” a respondent may wonder whether the correct an-swer is the name of each doctor, neighbor, or coworker or just thetype of source. Presenting precoded categories will help indicate ex-actly what is intended. It may also encourage someone to answer aquestion that he or she otherwise might not. Many respondents willrefuse to answer the following question, “What was your total house-hold income last calendar year?” But if they are asked, “Which ofthe following categories includes your total household income lastyear?” many more (but still not all) will reply. In addition, precod-ing ensures that all respondents answer the same question. Supposerespondents are asked how convenient several health clinics are forthem. As suggested in the previous chapter, some respondents maythink of convenience in terms of ease of parking or number of en-trances. Others may think of it in terms of travel time from home.If you ask respondents to check whether the clinics are “10 minutesor less away,” “11 to 20 minutes away,” and so on, this will ensurethat every respondent will be using the same connotation for theterm convenience.
Suppose respondents are asked, “Where have you seen an ad-vertisement for a cancer treatment program in the past three months,if anywhere?” Unaided by precoding, respondents will offer feweranswers than if offered a checklist. For example, the question can ask,“Have you seen an advertisement for a cancer treatment program inany of the following places: newspapers, magazines, billboards, or inthe mail?”
There are two main drawbacks in using precoded questions.First, precoding assumes the researcher already knows all the possi-ble answers or at least the major ones. While research can always
18Andreasen/Ch. 9 8/11/02 3:09 PM Page 184

leave space for an “other” category on a mail or Internet question-naire, most respondents will ignore anything that is not listed.
Another drawback to precoding is that it may frustrate a re-spondent who does not quite agree with the categories or feels un-duly restricted. For example, if someone is asked, “Do you think thePresident of the United States is doing a good job: Yes or no?” manyrespondents would like to answer “Yes, but . . .” or “No, but . . .” Ifthey experience such frustration, many respondents will terminatean interview or not reply to a mail or Internet questionnaire.
Postcoding involves coding a set of answers after a questionnaireis filled in. It is typically necessary in one of the three major circum-stances:
• The researcher does not know in advance what categories to use. For example, if the researcher is rushed or has a verylimited budget, it may not be possible to conduct any prelimi-nary focus groups or pretests to develop the appropriate precodes.
• The researcher is afraid that presenting precoded alternativeswill bias the answers.
• The researcher wishes to accumulate verbatim answers thatcan be used to give depth and interest to a final report.
If a third party is brought in to do the postcoding, there is alwaysthe possibility that the wrong code will be assigned to a particularwritten answer (of course, the interviewer could make this mistakealso). The main difficulties will crop up when the answers are am-biguous. Suppose a coder is asked to assign a “liking” rating for a se-ries of physician descriptions. The coder has three categories: (1)likes a great deal, (2) likes somewhat, or (3) doesn’t like. The de-scription from the respondent is, “Doctor Arneson is very authori-tative. He always has a solution and insists you follow it without alot of backtalk.” A coder would like to have the respondent nearbyto ask a number of clarifying questions: “Do you prefer doctors who
PRODUCING VALID DATA 185
18Andreasen/Ch. 9 8/11/02 3:09 PM Page 185

are authoritative? Is it important to you that the doctor have all theanswers, or would you like to express your opinions? Are you frus-trated by not being able to challenge a diagnosis?” Interviewers whodo the coding on the spot can interrogate the respondent. Third-party postcoders may have to make intelligent guesses that can in-troduce bias into the study.
The example is truly ambiguous about whether the respondentlikes the doctor and probably should be coded as a fourth category:“Not clear.” In most studies, coding problems can be minimized byfollowing some well-accepted procedures.
After a set of questionnaires is completed, it is helpful to reviewa sample of verbatim answers and, along with some or all of theprospective coders, develop a clear, exhaustive set of coding cate-gories. If necessary, write these down in a codebook, with a numberof examples for each category. It is important to make sure codersunderstand the categories and how to use the codebook.
Coders should practice on sample questionnaires to ensure theyassign the correct codes. And if possible, use multiple coders andhave them code a sample of each other’s work to detect inconsis-tencies among coders or to discover questions where the codingscheme is producing a great deal of inconsistency among coders.
Asking Questions
Most of the threats to measurement validity discussed to this pointare partially or wholly controllable. But even where control is min-imal, their potential for bias pales in significance compared to theproblems in eliciting the truth from respondents. Problems canarise from three sources: the interviewer, the respondent, and theinstrument.
Interviewer-Induced Error
Respondents may report something other than the truth becausethey respond to the way the interviewer looks and how he or sheasks the questions. Interviewers can induce respondents to exag-
186 MARKETING RESEARCH THAT WON’T BREAK THE BANK
18Andreasen/Ch. 9 8/11/02 3:09 PM Page 186

gerate, hide, try to impress, or be distracted. As a general rule, onewould like interviewers to be as unobtrusive as possible. This meansthat in face-to-face interviews, interviewers should possess socio-economic characteristics as much like those of their respondents aspossible. A neat and unobtrusive appearance (while still being en-thusiastic and motivating in behavior) is important. Personal in-terviewers with distracting characteristics (or unusual clothing ormakeup) may be effective over the telephone but not in the field.
The interviewer should be physically and emotionally non-threatening to respondents and avoid body or vocal cues that maygive away or distort answers. The more the interviewing involvesdifficult questions and interaction with the respondent over thecourse of the interview, the more the interviewer’s characteristics,style, and specific actions can influence the results. If the interviewermust explain questions, probe for details, or encourage fuller re-sponses, his or her manner of doing so can have profound conse-quences for both the quantity and quality of data elicited. For thesereasons, the researcher should be very careful in selecting and train-ing both telephone and personal interviewers. Someone with a lim-ited budget may be tempted to hire low-cost (or free) amateurs suchas their employees and think that minimizing training sessions is agood way to cut costs. This is usually very short-sighted behavior.
If the researcher is forced to use amateurs, then careful training,extensive use of precoded questions, and a detailed set of inter-viewer instructions ought to be built into the study design. Eventhen, the dangers of interviewer-induced error are great. In a clas-sic study, Guest had fifteen college-educated interviewers apply thesame instrument to the same respondent, who was instructed to givethe same responses to all. The number of errors was astonishing. Noquestionnaire was without error, and the number of errors rangedfrom twelve to thirty-six. Failure to follow up questions for supple-mentary answers occurred sixty-six times.1
Another problem with amateurs is that there is always the smallpossibility that they will fabricate total interviews or responses toparticular questions (for example, those they are fearful of asking,such as income, drinking, and sex habits). Fortunately, it is almost
PRODUCING VALID DATA 187
18Andreasen/Ch. 9 8/11/02 3:09 PM Page 187

certain that such amateurs will not know how the results to partic-ular questions should be distributed. Consequently, their answerswill look markedly different from the rest of the study and can bedetected in computer checks.
In a study I conducted many years ago on radio station prefer-ences using student interviewers, one interviewer apparently choseto do his fieldwork in his dorm room. And, of course, when it cametime to record station preferences, he used his own preferences,which, not surprisingly, were not at all like the general populationin the area studied. Such cheating can also be controlled by recon-tacting respondents in a small percentage of each interviewer’s workto verify that they were contacted. Postcards or brief telephone callscan serve this purpose. Such validation is routine in most commer-cial research organizations.
Respondent-Induced Bias
There are four major sources of respondent bias: forgetting, deliber-ately withholding information, simple mistakes or unintentionaldistortion of information, and deliberate distortion of information.
The largest source of respondent bias in surveys is forgetting.With time, subtle details of purchases can be lost, and even majorfacts, such as brand names or prices, disappear. Aided recall canhelp reduce this problem (although potentially introducing its ownbiases), as can carefully limiting the time period for recall to that forwhich the respondent’s memory should be reasonably accurate. Thelow-budget researcher should guard against the tendency to be greedyfor information, asking for recall of data further and further back intime where such recall may be highly suspect.
Mistakes or neglect of information can be minimized by properquestioning. First, one must make sure that definitions of each desiredbit of information are very clear, possibly with the use of precoded an-swers. A frequent problem is household income. Respondents maynot know what to include as household income or may forget criticalcomponents. Worse still, different respondents may have different de-
188 MARKETING RESEARCH THAT WON’T BREAK THE BANK
18Andreasen/Ch. 9 8/11/02 3:09 PM Page 188

finitions that could make them appear different when they are not.For example, there is the problem of whose income to include:spouses, teenage children, live-in parents? What if a household hasa boarder? Is this person included? What about spending moneyearned by a child away at college? Are dividends included? Whatabout the $1,000 lottery winning? Is social security included if oneis over sixty-five or dividends from a retirement account? Althoughnot all contingencies can be handled in a simple questionnaire for-mat, questions can be worded so as to specify most of the informa-tion desired. In face-to-face or telephone studies, interviewers canbe instructed about the real intent of the question and armed withprompts to make sure that respondents do not inadvertently givebiased or incomplete information.
Another broad class of unintentional respondent problems istime distortion. Often a study will ask for a summary of past experi-ences. That is, a researcher may wish to know how many head coldsrespondents have had, or vacations they have taken, or doctors theyhave seen within some specified period. The typical problem is thatpeople will telescope experiences beyond the specified time frameinto the period in question. A questionnaire may ask about sixmonths’ worth of head colds and really get eight months’ worth. Ifeveryone used the same amount of telescoping (eight months intosix), this would not be a problem. But if they differed, this will pro-duce artificial differences across respondents.
The solution is again a matter of design. First, the study shouldhave as few of these kinds of questions as possible. Second, ques-tions requiring memory should ask only about relatively prominentevents (for instance, do not bother asking how many cans or bot-tles of beer a respondent has consumed over the past six months).And third, whenever possible, each question should clearly boundthe starting point of the period. This boundary would depend onthe subject, the respondent, or the date of the study. For example,one could anchor the period to the start of the year, Thanksgiv-ing, the beginning of the school year, or the respondent’s previousbirthday.
PRODUCING VALID DATA 189
18Andreasen/Ch. 9 8/11/02 3:09 PM Page 189

Telescoping is an unconscious distortion on the part of the re-spondent. Respondents can distort results in other ways. If given ascale of answers, some respondents will use the full range of the scale,and others may use only a small part in the middle. Naysayers, asthey are called, will tend to use the negative end of the scale andyeasayers the positive end. These systematic biases can often be con-trolled by having the computer normalize an individual’s responsesafter the data are collected, in effect rescoring each answer in termsof the respondent’s answer tendencies (see Chapter Ten).
Harder to detect and control are deliberate efforts by respon-dents to portray themselves as they are not or to answer as theythink the researcher would like them to answer. Deliberate responsebias in general is much harder to analyze and adjust for because theresearcher doesn’t know what the truth would have been. About allthat can be done is to make the stimulus (the question and the in-terviewer) as unlikely as possible to encourage such distortion andto stress to the respondent the importance to the study that they beas candid and objective as possible. Repeating the researcher’s ini-tial guarantee of anonymity when introducing particularly worri-some questions can sometimes help.
Questionnaire Design
This book is not intended to make an expert question writer out ofits readers. To some extent, writing questions that both motivateand get at the truth is a skill acquired only by considerable practice.It is not something any intelligent person can automatically do.One way the low-budget researcher can appropriate experiencequickly is to borrow questions from others, preferably questions usedby several other researchers. Using questions from secondary sourcesnot only ensures that the questions have been pretested; it also guar-antees that a database will exist elsewhere to which the researchercan compare the present results.
The U.S. Census is a good source of such questions, in part be-cause its categories (for example, for income or occupations) are theones used by most researchers and in part because the Census Bu-
190 MARKETING RESEARCH THAT WON’T BREAK THE BANK
18Andreasen/Ch. 9 8/11/02 3:09 PM Page 190

reau provides vast quantities of data against which to validate theresearcher’s own work.
Once the borrowing possibilities have been exhausted, the neo-phyte researcher should seek the help of an expert question writerif the cost is affordable. Alternatively, once a questionnaire is pre-pared, the draft instrument should be reviewed by as many col-leagues as possible, especially those who will be critical. Finally, theresearcher should test the instrument with potential respondentseven if it is only the office staff and in-laws.
I have never yet written a questionnaire that did not have ma-jor flaws, ambiguities, and even missing categories despite the fact Iwas sure that each time I had finally done it right. It takes a thoroughpretest to bring these problems out. My own preference is to con-tinue pretesting each redraft until I am confident the instrument isright. I keep reminding myself that if I do not measure whatever I amstudying validly at the start, all the subsequent analysis and reportwriting I might do will be wasted.
Following are possible questionnaire biases that could crop upin research instruments.
Question Order Bias
Sometimes questions early in a questionnaire can influence laterones. For example, asking someone to rank a set of criteria for choos-ing among alternative service outlets makes it very likely that alater request for a ranking of these same outlets will be influencedby the very criteria already listed. Without the prior list, the respon-dent may have performed the evaluation using fewer or even dif-ferent criteria. The solution here is to try different orderings duringa pretest and see whether the order makes any difference. If it does,then the researcher should either place the more important ques-tion first or change the order in every other questionnaire (calledrotating the questions) to balance the effects overall.
A more obvious questionnaire order effect is what might becalled giving away the show. This problem seldom survives an out-side review of the instrument or a pretest. However, I have seen first
PRODUCING VALID DATA 191
18Andreasen/Ch. 9 8/11/02 3:09 PM Page 191

drafts of a questionnaire where, for example, wording that mimic-ked an advertising campaign was used as one of the dimensions forevaluating a political candidate. Later, a question asking for recallof advertising themes got a surprisingly high unaided recall of thatparticular theme.
A third kind of questionnaire order effect involves threateningquestions that if asked early can cause a respondent to clam up orterminate the interview altogether. If a researcher must ask ques-tions about sex, drugs, diseases, or income, it is better to leave theseas late as possible in the instrument.
A final order effect applies to lengthy questionnaires. As re-spondents tire, they give shorter and less carefully thought out an-swers. Here again, put the more important questions early or rotatethe questions among questionnaires.
Answer Order Bias
There is one major problem when respondents are given a choiceof precoded categories to answer to a question: a tendency for re-spondents, other things equal, to give higher ratings to alternativeshigher on a list than those lower on a list. In such instances, pretest-ing and (usually) rotation of answers are recommended. Practically,rotation is achieved during face-to-face or telephone interviews byhaving the supervisor highlight different precoded answer cate-gories where the interviewer is to begin reading alternatives. (ACATI computer or Internet survey can do this automatically.) Onmail questionnaires, the researcher must have the word processorreorder the alternatives and print out several versions of the ques-tionnaire to be mailed out randomly.
Scaling Bias
Wording and formatting of individual questions that attempt toscale attitudes, preferences, and the like can be an important sourceof bias. If the researcher must construct his or her own scales, the
192 MARKETING RESEARCH THAT WON’T BREAK THE BANK
18Andreasen/Ch. 9 8/11/02 3:09 PM Page 192

best approach is to use one of a number of pretested general tech-niques that can be customized for a specific study.
Thurstone Scales. In this approach, a large number of statementsabout an object of interest (such as a company, a charity, or a brand)are sorted by expert judges into nine or eleven groups separated alongsome prespecified dimension such as favorableness. The groups or po-sitions are judged by the experts to be equally far from each other.The researcher then selects one or two statements from each groupto represent each scale position. The final questionnaire presents re-spondents with all statements and asks them to pick the one that bestportrays their feelings about each object. Their choices are assignedthe rating given by the judges to that statement. The ratings are as-sumed to be interval scaled (discussed in Chapter Ten).
Likert Scales. A problem with Thurstone scales is that they do notindicate how intensely a respondent holds a position. Likert scalinggives respondents a set of statements and asks them how much theyagree with each statement, usually on a five-point continuum: (1)strongly agree, (2) somewhat agree, (3) neither agree nor disagree,(4) somewhat disagree, or (5) strongly disagree. Responses to a se-lected series of such statements are then analyzed individually orsummed to yield a total score. Likert scales are very popular, in partbecause they are easy to explain and to lay out on a questionnaire.They are also very easy to administer in telephone interviews.
One problem with the technique is that the midpoint of a Lik-ert scale is ambiguous. It can be chosen by those who truly don’tknow and by those who are indifferent. For this reason, some re-searchers allow respondents a sixth option, “don’t know,” so thatthe midpoint will really represent indifference.
Semantic Differential. Respondents are asked to evaluate an ob-ject such as a company, nonprofit organization, or brand on a num-ber of dimensions divided into segments numbered from 1 to 9 or 1
PRODUCING VALID DATA 193
18Andreasen/Ch. 9 8/11/02 3:09 PM Page 193

to 11. In contrast to Likert scales, positions are not labeled. Rather,the scales are anchored on each end with opposing (semanticallydifferent) adjectives or phrases—for example:
Strong 1 2 3 4 5 6 7 8 9 Weak
Friendly Unfriendly Staff 1 2 3 4 5 6 7 8 9 Staff
Respondents indicate where on each scale they perceive the ob-ject in question to be. Two problems are common with semanticdifferentials. First, there is again the confusion of whether the mid-point of the scale represents indifference or ignorance. Second, thereis the problem that the anchors may not be true opposites; for ex-ample, is the opposite of healthy “unhealthy” or “sick”?
Stapel Scale. Some dimensions on which the researcher may wishto rate something may not have obvious opposites, for example,“fiery,” “cozy,” or “classic.” Stapel scales were designed for this con-tingency. The interviewer asks the respondents to indicate the de-gree to which a particular adjective applies to an object in question.Usually Stapel scales are easier to explain over the telephone thansemantic differentials and require little pretesting.
Graphic Scales. If the respondent can be shown a scale graphi-cally, for example, in a mail, Internet, self-report, or face-to-face in-terview study, then a scale where the positions look equal can beused. Researchers sometimes use a ladder to represent social class di-mensions along which respondents are asked to place themselves.The ladder can also be used on the telephone, as can the image ofa thermometer to give people unfamiliar with scales an idea of whatthey look like. Graphic scales are particularly useful for respondentswith low literacy levels.
194 MARKETING RESEARCH THAT WON’T BREAK THE BANK
18Andreasen/Ch. 9 8/11/02 3:09 PM Page 194
Threatening Questions
Studies may touch on issues that are threatening to some or all re-spondents, for example, topics like sex, alcohol consumption, men-tal illness, or family planning practices, all of which may be of interestto a marketer. These are touchy issues and hard to phrase in ques-tions. Respondents usually do not wish to reveal to others somethingprivate or that they feel may be unusual. Some seemingly innocuousquestions may be threatening to some respondents. For example, aman may not wish to reveal that the reason he gives blood regularlyis that a nurse at the blood donation center is attractive. Or a house-wife may not be anxious to admit she likes to visit the city art galleryso she can get a shopping bag in the gift shop to impress her middle-class neighbors.
There are several approaches to reducing threat levels. One isto assure respondents at the start of the study that they can be ascandid and objective as possible since the answers will be held incomplete confidence. This point can then be repeated in the intro-duction to a specific threatening question.
A second approach that tends to ease individuals’ fears of beingunusual is to preface the question with a reassuring phrase indicat-ing that unique answers are not unusual for a specific question. Thus,one might begin a question about alcohol consumption as follows:“Now we would like to ask you questions about your alcohol con-sumption in the past week. Many have reported consuming alcoholat parties and at meals. Others have told us about unusual occasionson which they take a drink of whiskey, wine, or beer, like right af-ter they get out of bed in the morning or just before an importantmeeting with a coworker they don’t like. Could you tell us abouteach of the occasions on which you had an alcoholic beverage in thepast week, that is, since last [day of the week]?”
Another approach is to use an indirect technique. Respondentsmay often reveal the truth about themselves when they are caughtoff-guard, for example, if they think they are not talking about
PRODUCING VALID DATA 195
18Andreasen/Ch. 9 8/11/02 3:09 PM Page 195

themselves. A questionnaire may ask respondents to talk about “agood friend” or “people in general.” In this case, the assumption isthat in the absence of direct information about the behavior or at-titudes of others, respondents will bring to bear their own percep-tions and experiences.
Finally, the researcher could use so-called in-depth interview-ing techniques (mentioned in Chapter Eight). Here, the interviewertries not to ask intrusive questions. Rather the topic (perhaps alco-hol consumption) is introduced, and the respondent is kept talkingby such interjections as, “That’s interesting” or “Tell me more.” Inthe hands of a skilled, supportive interviewer, respondents shouldeventually dig deeply into their psyches and reveal truths that mightbe missed or hidden. However, such approaches are very time-consuming, can be used only with small (and probably unrepresen-tative) samples, and require expertise that is often unaffordable forlow-budget researchers.
Constricting Questions
Respondents may withhold information or not yield enough detailif the questions do not permit it. They may also terminate out of frus-tration. The questionnaire should almost always include an “other”option, where there is the real possibility that all the possibilitieshave not been precoded. Multiple choices should be allowed wherethey are relevant, and people should be able to report that some com-bination of answers is truly the situation.
Generalization Biases
Bias can often creep into answers by respondents who are asked togeneralize about something, particularly their own behavior. For ex-ample, neophyte questionnaire writers often ask respondents to in-dicate their favorite radio station, the weekly newsmagazine theyread most often, or how often they exercise each month. The prob-lem is that these questions require the respondents to summarize
196 MARKETING RESEARCH THAT WON’T BREAK THE BANK
18Andreasen/Ch. 9 8/11/02 3:09 PM Page 196

and make judgments about their own behavior, yet how they makethese generalizations will be unknown to the researcher. For exam-ple, when asked for a favorite radio station, one person may reporta station she listens to while in the car, another may report a favoritestation at home, and a third may report one that pleases him mostoften rather than the one he listens to most frequently.
When asking questions about behavior, it is almost always betterto ask about specific past behaviors than have a respondent general-ize. Rather than asking about a favorite radio station, a respondentcan be asked, “Think back to the last time you had the radio on athome, work, or in the car. What station were you listening to?” In thiscase, the respondent perceives the task as reporting a fact rather thancoming up with a generalization. In such cases, the interviewer islikely to get much more objective, error-free reporting than if con-sumers are asked to generalize.
PRODUCING VALID DATA 197
18Andreasen/Ch. 9 8/11/02 3:09 PM Page 197

10All the Statistics You Need to Know (Initially)
As we noted in Chapter Two, management’s needs are forthree types of information: descriptive, explanatory, and predictive.Management will want to know what something is, what caused it,or what it will be in future. Answering these kinds of questions cor-rectly is a two-part process. First, managers must have the right rawmaterial, that is, valid measurements. Second, the right meaningmust be extracted from those measurements, so managers needvalid descriptive summaries, valid measures of association and cau-sation, and valid predictions. We considered some of the problemsof developing valid measures in Chapter Nine. Now, we will ex-plore the major analysis techniques, both simple techniques and afew of the more complex multivariate techniques for those whowish to extract even more from a given data set.
Fear of Statistics
Most people are frightened of statistics. They seem to think thatstatistical analysis is some kind of mystical rite not to be compre-hended or used by ordinary people. They avoid statistics like theplague and take a curious pride in doing so. The view seems to bethat those who avoid statistics are somehow more plain speakingand down-to-earth, while those who use statistics are either tryingto make something simple appear unnecessarily complex and so-
198
19Andreasen/Ch. 10 8/11/02 3:09 PM Page 198
phisticated or trying to hide something from others. One oftenhears, “Don’t confuse me with all your statistics.” In my view, thisfear of statistics is irrational but understandable. Unfortunately,sometimes simple truths have been obscured by statistics and sta-tisticians. But statistics can be very valuable tools for the budget-minded researcher. They make it significantly more likely thatmanagement will make decisions based on a valid interpretation ofthe information at hand.
Statistics, as we use the term here, can serve researchers and man-agers in two critical roles. First, there are descriptive statistics: simplefrequency counts, measures of central tendency like the mean, me-dian, and mode, and measures of variability like the range. Thesestatistics do not frighten most people. However, some fancier de-scriptive measures, like standard deviation and standard error, do. Descriptive statistics perform a crucial function for harried managers:they provide ways of reducing large amounts of data to more concise,comprehensive values. A fundraising manager would rather not befaced with a report of funds raised for every volunteer in every cityin every state through every medium (telephone, personal visit, andso on). Descriptive statistics such as means, modes, and ranges aremuch more manageable and therefore much more useful. By com-paring these summary numbers, insights that would be lost in themass of original data may become clear and courses of remedial or re-inforcing action suggested.
The second, and more fearsome, connotation of statistics is moreproperly called statistical testing. Statistical tests are a bit intimidatingif the researcher focuses on the method of applying the tests: the cal-culations, the theory, and the assumptions. We will try to avoid thisas much as possible and instead will concentrate on the uses of statis-tical tests. These uses can be boiled down to one expression: statisti-cal tests are designed to keep management honest. Statistical testsmake sure that if management thinks that fundraising proceeds areup in Atlanta, or that Sally is really outperforming Irving, or that onlymiddle-size cities respond positively to the new direct mail campaign,these conclusions are truly there and not artifacts of management’s
ALL THE STATISTICS YOU NEED TO KNOW (INITIALLY) 199
19Andreasen/Ch. 10 8/11/02 3:09 PM Page 199

imagination. There is a great temptation to all of us to want to findsomething in a set of data, particularly if that something supports aprior assumption or will lend strong support to a course of action thatmanagement was planning to take anyway. But if that something hasan unacceptably high probability of being a chance aberration, a man-ager would be ill advised to commit the organization to actions basedon it. Statistical tests can keep management from unknowingly tak-ing such chances: they keep one honest.
Managers should not fear statistics. Rather, they should be thank-ful they are there.
This chapter introduces the most important statistical tools likelyto be used in an introductory program of low-cost research. I assumethat research analysts will make extensive use of a computer to gen-erate the statistics and conduct the statistical tests by using one of themyriad statistical packages currently available (such as SPSS, SAS,Minitab, or the statistical capabilities of spreadsheet software). All areavailable in versions for personal computers. The use of computershas two implications. First, it means that no researcher will actuallyhave to calculate any of the statistics discussed here. Thus, we can fo-cus on making sure you understand what the computer will produce.
The easy access of computers has a second implication, and onethat presents a very serious danger for the naive researcher. Com-puters are dumb processors. They will take any set of values and crankout any statistics requested. Thus, if males are precoded as 1 in astudy and females as 2, the computer can certainly tell you that theaverage sex of your respondents is 1.6239 with a standard deviation(presumably in sex-ness) of .087962. This, of course, is patently ri-diculous. But there are many occasions on which a similar but not-so-obvious error can easily occur if the researcher asks for statisticsthat are inappropriate. It is the old problem of garbage in, garbageout. If statistics are to keep a researcher honest, the researcher mustknow when and where to use them legitimately. Thus, the goal ofthis chapter is to describe the use of different kinds of statistics sothat they can be requested appropriately.
I purposely simplify many of the treatments in order to provide
200 MARKETING RESEARCH THAT WON’T BREAK THE BANK
19Andreasen/Ch. 10 8/11/02 3:09 PM Page 200

readers with a layperson’s understanding that is not intimidating. Ido not discuss any assumptions and variations in calculation meth-ods and suggest that before using the statistics described here, theresearcher either seek advice from a more experienced user or con-sult the Recommended Readings for this chapter found at the backof the book.
Input Data
If a researcher is going to use statistics properly, it is essential to con-sider the kind of data about which descriptive statistics are to be cal-culated or to which will be applied some kind of statistical test.Statistical analysis, even such simple analysis as counting, requiresthat each characteristic to be studied be assigned a unique value.Sometimes, especially in qualitative research with small samples,this value can be a word or a symbol. For example, the interviewercould assign the word yes or positive or the symbol + to indicate thata respondent liked a product, or a flavor, or a company. Analysiscould then produce a statistic called a frequency count of these wordsor symbols to reveal overall perceptions of various stimuli or variousgroups of respondents. However, even in these cases, when the sam-ple is large and we wish to do a lot of cross-tabulations or plan to usea computer, we will want to assign each measurement a number.
For the computer to prepare summary statistics or conduct a sta-tistical analysis, each measurement of the sample population mustbe assigned a number. These numbers can differ significantly in theirlevel of sophistication, and it is this level of sophistication that de-termines what should and should not be done to them. There arefour categories in which numbers are generally grouped. In increas-ing order of sophistication, they are (1) nominal numbers, (2) or-dinal numbers, (3) intervally scaled numbers, and (4) ratio-scalednumbers. We will examine each briefly, noting that numbers of aparticular higher-order status can always be treated as if they had alower-order status. For example, ordinal data can always be treatedas if they were merely nominal.
ALL THE STATISTICS YOU NEED TO KNOW (INITIALLY) 201
19Andreasen/Ch. 10 8/11/02 3:09 PM Page 201
Nominal Data
In a surprisingly large number of cases, the number we assign to someobject, idea, or behavior is entirely arbitrary, although in some casesa tradition may establish the rules of assignment. If measurementsare assigned arbitrary numbers, they are called nominal numbers,and their sole purpose in the analysis is to differentiate an item pos-sessing one characteristic from an item possessing a different char-acteristic.
Consider, for example, the assignment of numbers to footballplayers. Each player has a number that distinguishes one player fromanother. The numbers allow coaches and fans to tell them apart andallow referees to assign penalties to the correct person. The num-bers here have no meaning other than differentiation. Despite whata boastful wide receiver may tell the press, players with numbers inthe 80s are not necessarily smarter than those with numbers in the70s, nor do they deserve bigger salaries. They are probably fasterthan those with numbers in the 70s, but not necessarily faster thanthose with numbers 16 to 20 or 30 to 50. The fact that someone hasa higher number than someone else does not mean that he is moreor less of anything.
Ordinal Data
Ordinal numbers are assigned to give order to measurements. In aquestionnaire, we may ask two respondents to rank charities A, B,and C. Typically, we would assign a 1 to their most preferred char-ity, 2 to their second most preferred, and 3 to their third favorite.Note that if someone prefers A over B over C, we do not know howmuch A is preferred to B or how much B is preferred to C. For ex-ample, Gordon may prefer A a great deal over B, but Gary may bealmost indifferent between the two, though giving a slight edge toA. Both would have the same rankings. It is perfectly permissible toassign any numbers to the respondents’ first, second, and third choicesas long as we retain the same ordering distinction.
202 MARKETING RESEARCH THAT WON’T BREAK THE BANK
19Andreasen/Ch. 10 8/11/02 3:09 PM Page 202

Interval and Ratio Data
The next two classes of data represent a substantial jump in sophis-tication from the first two classes. Nominal and ordinal measure-ments are frequently described by researchers and statisticians asnonmetric numbers. Interval and ratio measurements are called met-ric (or parametric) numbers. Most of the sophisticated summary sta-tistics and statistical tests strictly require metric measurements. Forthis reason, it is desirable, but not essential, for researchers to seekto develop interval or ratio data whenever possible. Experience hasshown that assuming data are metric when they might be rankedonly does not usually produce serious distortions in results. For ex-ample, if a magazine reader rates Time as 5 on an “informative” scaleand Newsweek as 4, it may seem safer (more conservative) to inter-pret these results as saying only that the reader rated Time higherthan Newsweek (that the data are really ordinal). However, makingthe stronger assumption that one has produced an interval scale willtypically not materially affect any conclusions.
Interval data are similar to ordinal data in that the assignednumbers order the results. In this case, however, the differences be-tween numbers have an additional meaning. In an interval scale,we assume that the distance or interval between the numbers has ameaning. The difference between interval data and ratio-scaleddata is that the latter have a known zero point and the former donot. Thus, we may be able to say that on an “honesty” scale, char-ity A is as far from charity B as charity C is from charity D (the in-terval assumption). We cannot say that charity A seems to be fourtimes as honest as charity D. The distinction may be made clear byusing two common examples.
A Fahrenheit temperature scale is an example of an intervalscale. Any four-degree difference in temperature is like any otherfour-degree difference. But since the zero point on a Fahrenheitscale is arbitrary, we can say that if the temperature rose from 76 de-grees to 80 degrees in the morning and later dropped from 44 degreesto 40 degrees just after midnight, the changes were equal. However,
ALL THE STATISTICS YOU NEED TO KNOW (INITIALLY) 203
19Andreasen/Ch. 10 8/11/02 3:09 PM Page 203

we would be foolish to say that the morning was twice as warm asthe night. Is 80 degrees twice as warm as 40 degrees? Is 10 degreesfive times as warm as 2 degrees? We can speak confidently abouttemperature intervals and not temperature ratios.
In contrast, age is an example of a scale with a real, known zero.In this case, we can say that someone who is forty is twice as old assomeone who is twenty. In many analyses in marketing, the dis-tinction between interval and ratio-scaled data is not very impor-tant managerially.
Some examples of marketing measurements that fall under eachof the four levels of numerical sophistication are given in Table 10.1.
Descriptive Statistics
The problem with much research is that it produces too manypieces of data. Some of the information we will wish to simply re-port just as it comes, and some of it we will wish to relate to otherdata to show differences, relationships, and so on.
For a great many decision problems, we may be satisfied with adescription of the population under study. At the very least, merely
204 MARKETING RESEARCH THAT WON’T BREAK THE BANK
TABLE 10.1 Numerical Qualities of Some Typical Marketing Measurements.
Nonmetric Metric
Nominal IntervalSex Some rating scales (for example, Marital status semantic differentials, Likert Store or brand last patronized scales)Ownership of various items Knowledge and awareness levelsEmployment status Ratio
Ordinal AgeOccupational status EducationService outlet preferences SalesSome rating scales Time elapsedSocial classes Income
19Andreasen/Ch. 10 8/11/02 3:09 PM Page 204
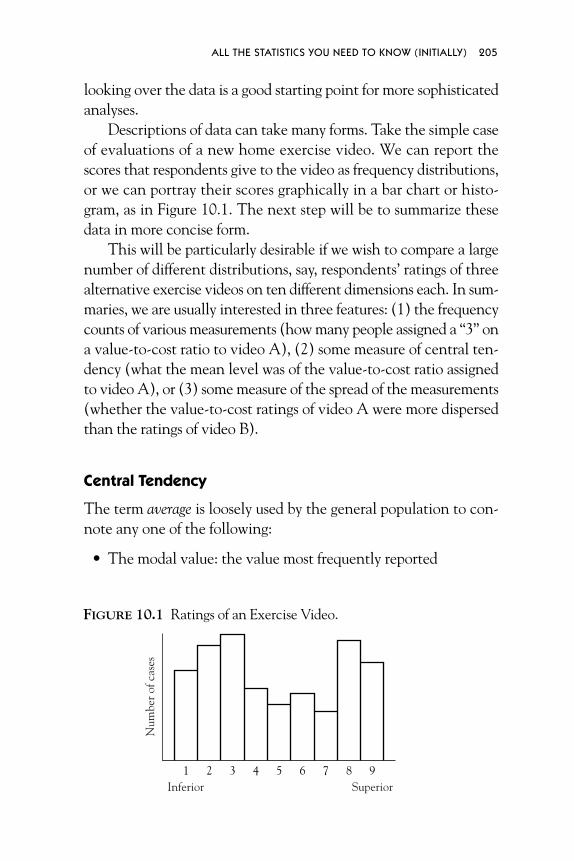
looking over the data is a good starting point for more sophisticatedanalyses.
Descriptions of data can take many forms. Take the simple caseof evaluations of a new home exercise video. We can report thescores that respondents give to the video as frequency distributions,or we can portray their scores graphically in a bar chart or histo-gram, as in Figure 10.1. The next step will be to summarize thesedata in more concise form.
This will be particularly desirable if we wish to compare a largenumber of different distributions, say, respondents’ ratings of threealternative exercise videos on ten different dimensions each. In sum-maries, we are usually interested in three features: (1) the frequencycounts of various measurements (how many people assigned a “3” ona value-to-cost ratio to video A), (2) some measure of central ten-dency (what the mean level was of the value-to-cost ratio assignedto video A), or (3) some measure of the spread of the measurements(whether the value-to-cost ratings of video A were more dispersedthan the ratings of video B).
Central Tendency
The term average is loosely used by the general population to con-note any one of the following:
• The modal value: the value most frequently reported
ALL THE STATISTICS YOU NEED TO KNOW (INITIALLY) 205
Num
ber o
f cas
es
8Inferior
1 2 3 4 5 6 7 9Superior
FIGURE 10.1 Ratings of an Exercise Video.
19Andreasen/Ch. 10 8/11/02 3:09 PM Page 205

• The median: the value at the midpoint of a distribution ofcases when they are ordered by their values
• The arithmetic mean: the result of weighting (multiplying)each value by the number of the cases reporting it and thendividing by the number of cases
Applying a measure of central tendency is not always straight-forward. Suppose fifteen respondents rated the value-to-cost ratioof video A on a seven-point scale as follows (their ratings have beenreordered for convenience):
1 2 3 3 3 3 4 4 5 5 6 6 7 7 7
Here, we can see that the mode is 3, the median is 4, and the meanis 4.4—all different. Which is the best measure of central tendency?To some extent, it depends on management’s interests. If they wantto know what was the most frequent rating of the video, they woulduse the mode. If they want to know at which point the sample wasdivided in half with respect to this measure, they would use the me-dian. If they wanted to weight respondents by the scores they as-signed, then they should use the mean.
Not all measures of central tendency can be applied to all kindsof data. The kinds you can use vary depending on the type of datayou have, as follows:
Numbers Permissible Measures
Nominal Mode
Ordinal Mode, median
Interval Mode, median, mean
Ratio Mode, median, mean
Although it is all too frequently done, no one should attempt tocompute an arithmetic mean using ordinal data. It is not at all un-common to hear untrained researchers speak of the average ranking
206 MARKETING RESEARCH THAT WON’T BREAK THE BANK
19Andreasen/Ch. 10 8/11/02 3:09 PM Page 206
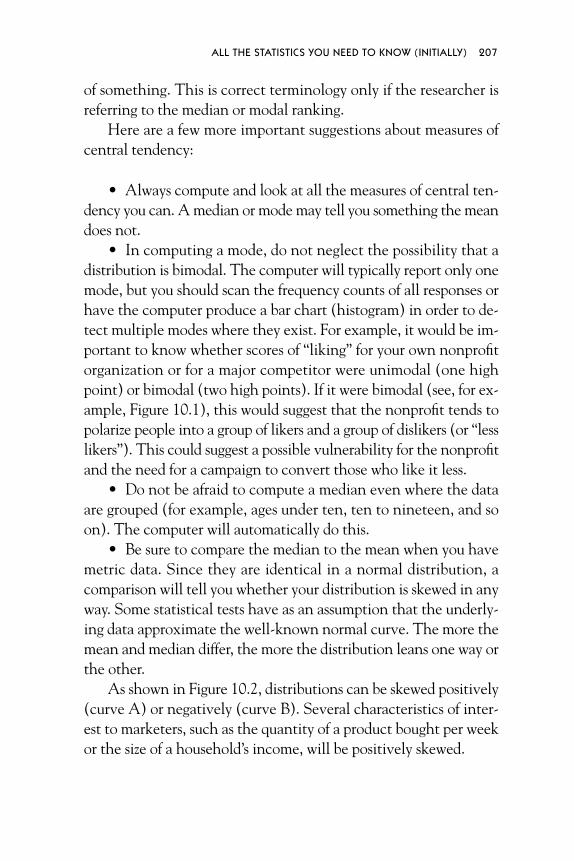
of something. This is correct terminology only if the researcher isreferring to the median or modal ranking.
Here are a few more important suggestions about measures ofcentral tendency:
• Always compute and look at all the measures of central ten-dency you can. A median or mode may tell you something the meandoes not.
• In computing a mode, do not neglect the possibility that adistribution is bimodal. The computer will typically report only onemode, but you should scan the frequency counts of all responses orhave the computer produce a bar chart (histogram) in order to de-tect multiple modes where they exist. For example, it would be im-portant to know whether scores of “liking” for your own nonprofitorganization or for a major competitor were unimodal (one highpoint) or bimodal (two high points). If it were bimodal (see, for ex-ample, Figure 10.1), this would suggest that the nonprofit tends topolarize people into a group of likers and a group of dislikers (or “lesslikers”). This could suggest a possible vulnerability for the nonprofitand the need for a campaign to convert those who like it less.
• Do not be afraid to compute a median even where the dataare grouped (for example, ages under ten, ten to nineteen, and soon). The computer will automatically do this.
• Be sure to compare the median to the mean when you havemetric data. Since they are identical in a normal distribution, acomparison will tell you whether your distribution is skewed in anyway. Some statistical tests have as an assumption that the underly-ing data approximate the well-known normal curve. The more themean and median differ, the more the distribution leans one way orthe other.
As shown in Figure 10.2, distributions can be skewed positively(curve A) or negatively (curve B). Several characteristics of inter-est to marketers, such as the quantity of a product bought per weekor the size of a household’s income, will be positively skewed.
ALL THE STATISTICS YOU NEED TO KNOW (INITIALLY) 207
19Andreasen/Ch. 10 8/11/02 3:09 PM Page 207

Measures of Dispersion
Measures of dispersion indicate the relative spread of the data weare studying. Heights of a line of chorus girls will be much less di-verse (spread) than heights of children in a primary school. Mea-sures of dispersion are relatively underused by neophyte marketingresearchers. They form an important part of many statistical analy-sis procedures (such as testing whether an experiment’s results weredue to chance), and they can be useful in their own right.
There is, of course, no such thing as a measure of dispersion fornominal data. It makes no sense to talk about the spread of maritalstatus data. Dispersion, however, can be computed for ordinal data.The most common dispersion measures here are the range from max-imum to minimum, and the interquartile range, that is, the differencebetween the seventy-fifth and twenty-fifth cases. The interquartilerange is often used because it produces a measure that eliminatesthe effects of extreme values at either end of the rankings, whichwould exaggerate the full range.
For metric data (interval or ratio scaled), the most commonmeasure of dispersion is the variance or its square root, the standarddeviation. Variance is computed by subtracting each value from themean of all of the values, squaring the results, and then averagingthese squared values (actually, dividing by one less than the num-ber of cases). The variance has two virtues. First, it tends to weightvalues far from the mean more than those near the mean. This
208 MARKETING RESEARCH THAT WON’T BREAK THE BANK
Num
ber o
f cas
esNormal curveA B
FIGURE 10.2 Normal and Skewed Distribution.
19Andreasen/Ch. 10 8/11/02 3:09 PM Page 208

makes it a relatively stringent measure when incorporated in statis-tical tests of relationships or differences. The second virtue is that(assuming we have a normal distribution) it allows us to say some-thing rather precisely about how many cases will fall within a cer-tain distance from the mean (in standard deviation units).
The standard deviation or the variance can also be used to com-pare two distributions expressed in the same units. For example, wecan compare perceptions of a Boys & Girls Club in one city withthose of a Boys & Girls Club in another city on both mean andvariance. It may be possible that the means are the same in the twocities but the variance is much higher in one than the other. Thiswould suggest that the club’s image is relatively clear in one city andpretty fuzzy in the other. (See Figure 10.3.) In the same way, we mightcompare variances within a city to see whether the club’s image isfuzzier for some market segments than for others.
Another role for the standard deviation is to tell somethingabout the typicality of a given case. Calculating how many standarddeviations a case is from the mean will yield a quantitative measureof how typical or atypical it is. We could say, for example, that percapita tuxedo sales in Reno are a lot different from the average forthe United States: only 2 percent of reporting cities have greatertuxedo sales. (Indeed, since the Greek symbol for the standard de-viation is the letter sigma, it is not unusual to hear a member of theresearch community describe an offbeat colleague as being “at leastfive sigmas off center.”)
A final role of the standard deviation for experienced researchersis in normalizing data. This process is described in Exhibit 10.1.
A final measure of dispersion that is of great interest to statisti-cians is the standard error. This measure has much the same mean-ing and use as the standard deviation, but it describes the spread ofsome summary measure like a mean or a proportion. Because weknow the percentage of cases that fall within specific distances fromthe midpoint of a normal curve as expressed in standard errors, wecan say something about the likelihood that the true mean we are
ALL THE STATISTICS YOU NEED TO KNOW (INITIALLY) 209
19Andreasen/Ch. 10 8/11/02 3:09 PM Page 209

trying to estimate in a specific study is within a certain distance (instandard error units) from the mean we actually did find.
Assume that we studied a sample of heads of household in acommunity and found that the mean contribution to charity was$1,000 per year and the standard error was $10. We can say that weare 95 percent sure that the true annual household donation in thiscommunity is between approximately $1,019.60 and $980.40—thesample mean plus or minus 1.96 standard errors (the confidencelevel for two standard errors is 95.44 percent). This is because weknow that 95 percent of all cases under a normal curve fall betweenthe midpoint and points approximately 1.96 standard errors above
210 MARKETING RESEARCH THAT WON’T BREAK THE BANK
Num
ber o
f res
pond
ents
1High qualityLow quality
City A
2 3 4 5 6 7 8 9 10 11 12 13 14 15 16 17 18 19 20
Num
ber o
f res
pond
ents
1High qualityLow quality
City B
2 3 4 5 6 7 8 9 10 11 12 13 14 15 16 17 18 19 20
FIGURE 10.3 Ratings of Program Quality of Boys & Girls Clubs inTwo Cities.
19Andreasen/Ch. 10 8/11/02 3:09 PM Page 210

and 1.96 standard errors below that midpoint. The band expectedto envelop the true mean is often called the 95 percent confidenceinterval.
Statistical Analysis
Statistical analysis helps researchers and managers answer one oftwo questions: Does a specific result differ significantly from anotherresult or from an expected result, or is a specific result associated
ALL THE STATISTICS YOU NEED TO KNOW (INITIALLY) 211
EXHIBIT 10.1 Normalization.
The fact that one can describe a particular case as being so many stan-dard deviations away from the mean introduces one other importantrole that this dispersion measure can serve for researchers. A frequentproblem when comparing responses to certain kinds of psychologicalquestions across respondents is that people tend to differ in the pro-portion of a given rating scale they tend to use. For instance, whenrating different stores on an 11-point interval scale, an extroverted respondent may use the full range from, say, 2 to 11, while more re-strained respondents may venture ratings only between 4 and 7. If we were to compare only their raw scores, the computer would treat ascore of 7 as being essentially the same for both. But as we have seen,a 7 for the extrovert is just barely above average; for the introvert, itrepresents outright enthusiasm, the highest score he or she gives.
To accommodate these basic differences across individuals (orsometimes across questions), it is customary to transform the originalrespondent scores into scores measured in terms of numbers of standarddeviations. Thus, a computer would be instructed to divide each re-spondent’s original score on a given scale by that respondent’s personalstandard deviation on all similar scales. This is called normalization ofthe data. By this procedure, the introvert’s score of 7 will get trans-formed into a higher normalized score than the extrovert’s score of 7.
Normalization is also a method for making many different kindsof variables comparable, that is, to express them all in standard devia-tion units. This approach is often used when employing multiple regression equations.
19Andreasen/Ch. 10 8/11/02 3:09 PM Page 211

with or predicted by some other result or results, or is this just dueto chance?
Such analyses are typically performed on one of three kinds ofdata: frequencies, means, or proportions. Do more people buy froma jumbled or a neat display? Is the proportion of target audiencemembers noticing a newspaper ad different for men and women?Can mean donation levels be predicted from occupation, income,and family size?
The sections that follow introduce the major statistical analysistechniques that a beginning researcher may wish to use. The tech-niques are organized on the basis of the kinds of data for which theyare most appropriate: nominal, ordinal, or metric. However, we needfirst to understand the concept of significance.
Levels of Significance
An important question in statistical analysis is what we mean whenwe say there is a very low probability of a particular result being dueto chance. If a probability is very low, we may decide that our actualresults are really different from the expected results and take someaction on it. But suppose the analysis yielded a .15 chance that theresults are really not different. Should we act on this, or do we actonly if the probability they are not different is .05 or lower? That is,what is the appropriate level of significance? In classical statistics, sta-tisticians tend to use either the .05 or the .01 level of significance asthe cutoff for concluding that a result is significant. In my opinion,this classical notion is of little relevance to marketing decision mak-ers, especially in this age of computer analysis.
Historically, statisticians have instructed us that good scienceinvolves the construction of hypotheses usually in null form (thatthere is no difference or association) before the results are in (so weare not tempted to test what we have in fact already found), and thesetting, in advance, of a level of statistical significance level beyondwhich we would reject the null hypothesis. The cutoff is typically
212 MARKETING RESEARCH THAT WON’T BREAK THE BANK
19Andreasen/Ch. 10 8/11/02 3:09 PM Page 212

stated as the probability of rejecting this hypothesis. Classically, thisprobability was set at either .05 or .01 depending on how tough theresearcher wanted to be before accepting a positive outcome.
But these levels are arbitrary. Why not .045 or .02, for example?Furthermore, they ignore the important managerial context. Thereal issue is not whether the data are sufficiently strong to permit usto make statements about the truth but whether the results are strongenough to permit the manager to take action.
Implicit in this action orientation is the view that (1) it is themanager’s perception of the significance of the result that is relevant,not the researcher’s use of some classical cutoff; (2) significance is really in terms of whether the result will lead to action; and (3) sig-nificance is ultimately a matter not just of statistical probability butalso of the manager’s prior information, prior conviction about whichway to act, and the stakes involved. In this conceptualization, it be-comes obvious that the researcher’s responsibility is simply to reportthe absolute probability that a result is significant and then let themanager decide whether this is significant in terms of the decision athand. Significance in some cases (for example, where the stakes arelow and management is already leaning toward a particular course ofaction) may be acceptable with a .15 probability or better. In othercases where the stakes are larger and management is quite unsurewhat is best, only a .03 or better probability will decide the matter.In modern managerial decision making, the classical role of the .05and the .01 levels of significance should be irrelevant.
Nominal Data: The Chi Square Test
Where we have nominal data, we are forced to analyze frequencycounts since there are no means and variances. Two kinds of ques-tions are typically asked of these frequency counts. When looking atonly one variable, we usually ask whether the results in the study dif-fer from some expected distribution (often referred to as the model).For example, we might wish to know whether the distribution of
ALL THE STATISTICS YOU NEED TO KNOW (INITIALLY) 213
19Andreasen/Ch. 10 8/11/02 3:09 PM Page 213

occupations in a target population is different from that found in themetropolitan area as a whole or in an earlier study. The second kindof analysis we may wish to conduct is to ask whether the distributionof one variable is associated with another, for example, whether oc-cupation depends on the geographical area of the respondent. Theappropriate statistical test to use for either type of analysis is calledthe chi square (χ2) test. Because it is especially appropriate for nom-inal data and because it can also be used for higher-order numbers,chi square may well be the most frequently used statistical test inmarketing research.
The chi square test is exceedingly simple to understand and al-most as easy to compute. I have calculated the chi square on backs ofenvelopes on airplanes, on my pocket calculator during a client meet-ing, and countless times in the classroom. All that is needed is theraw frequency count (Fi) for each value of the variable you are ana-lyzing and a corresponding expected frequency (Ei). The chi squaretechnique then calculates the difference between these two, squaresthe result, and divides by the expected frequency. It sums these cal-culations across all the values (cells) for the variable to get the totalchi square value. (Division by the expected frequencies is a way ofmaking sure that a small absolute difference for a case with a lot of re-spondents expected in it is not given as much weight in the final re-sult as the same absolute difference for a smaller cell.)
Comparison to a Given Distribution. Suppose that prior to anelection a political candidate has her campaign staff interview a sam-ple of shoppers outside a particular department store on a randomsample of days and nights. The candidate wants to know whetherthe shoppers’ party affiliations differ from what would be expectedif her staff had obtained a random sample of all voters in her dis-trict. Of a sample of 130 shoppers, 80 said they were Democrats, 30were Republicans, and 20 were listed as Independents. Suppose thatvoter registrations in the district show that 54 percent of all votersare Democrats, 27 percent are Republicans, and the rest are Inde-
214 MARKETING RESEARCH THAT WON’T BREAK THE BANK
19Andreasen/Ch. 10 8/11/02 3:09 PM Page 214

pendents. The question is, Do the affiliations of the shoppers differfrom the expected pattern? The chi square for this example is cal-culated from the data in Table 10.2.
If the analysis is done by hand, the analyst then refers to a chisquare table that indicates the likelihood of obtaining the calculatedtotal chi square value (or greater) if the actual frequencies and theexpected frequencies were really the same. (If the calculation is doneby computer, this probability will be printed on the output.) If theprobability is very low, it means that results are clearly not what wasexpected. Conversely, subtracting the probability from 1 gives theprobability that the results are really different. For example, a chisquare probability of .06 means that there is a 6 percent chance thetwo distributions are really the same and a 94 percent chance theyare not.
It is important to use the appropriate degrees of freedom whendetermining the probability. (The computer does this automati-cally.) Degrees of freedom is a measure that reflects the number ofcells in a table that can take any value, given marginal totals. In theexample, we estimated the expected number of cases for three cells.Since we started with 130 cases, once we had calculated the ex-pected frequencies in any two cells, the remaining cell has no free-dom to assume any value at all; it is perfectly determined. Thus, twoof the cells were free to take on any amount and one cell was not.Therefore, degrees of freedom in this case is two: the number ofcells minus one. In a cross-tabulation, degrees of freedom is (r – 1)
ALL THE STATISTICS YOU NEED TO KNOW (INITIALLY) 215
TABLE 10.2 Actual and Expected Party Affiliation.
Party Actual (F) Expected (E)
Democrat 80 70Republican 30 35Independent 20 25Total 130 130
19Andreasen/Ch. 10 8/11/02 3:09 PM Page 215

(c – 1), where r is the number of cells in a row and c is the numberof cells in a column.
The chi square calculation for Table 10.2 is:
(Ei – Fi) χ2 = Σ ———–
Ei
(70 – 80)2 (35 – 30)2 (25 – 20)2
= ———–– + ———— + ———— = 3.143.70 35 25
Cross-Tabulations. A second research issue involving nominal val-ues is whether two or more nominal categories are independent ofeach other or are associated. In the example, we might ask whetherthe distribution of party affiliations differs between men and women.The chi square analysis procedure used in this case is very similar tothat in the previous case, and the formula is unchanged. That is, weare again simply asking the chi square analysis technique to tell uswhether the actual results do or do not fit a model.
Suppose we had surveyed eighty men and fifty women in thestudy, and their party affiliations were those reported on the left sideof Table 10.3. Are these distributions affected by the sex of the shop-per, or are they independent? To answer this question, we must firstconstruct a set of expectations for each of the cells in Table 10.3 andthen go through the cells and, one by one, compute chi square val-ues comparing expected to actual outcomes. As in all other cross-tabulations, we are testing whether there is no relationship betweenthe variables, that is, that they are independent. The first step is tofigure out what the expected frequencies would be if the two vari-ables were really independent. This is easy; if they were indepen-dent, the distribution within the sexes would be identical. Thus, inthe example, we would hypothesize that the proportion of Democ-rats, Republicans, and Independents is the same for the two sexes.
In Table 10.3, we can see that only slightly over half the men(actually 54 percent) are Democrats, but three-quarters of the women
216 MARKETING RESEARCH THAT WON’T BREAK THE BANK
19Andreasen/Ch. 10 8/11/02 3:09 PM Page 216

are (74 percent). Therefore, we must ask whether the proportion ofDemocrats depends on one’s sex or whether any apparent associ-ation is due to chance. The expected frequencies based on a no-difference model are given on the right-hand side of Table 10.3.(Note that the marginal totals have to be the same for the actualand expected frequencies.)
The calculated chi square is 5.27. Is this significant? As noted, de-grees of freedom refers to the number of cells in the rows minus one,multiplied by the number of columns minus one. In this case it is (r –1) (c – 1) = 2. (The correctness of this can be seen by arbitrarily fill-ing two cells of the expected frequency section of Table 10.3. Notethat the other four cells can take on only one value given the mar-ginal totals.) In this case, with two degrees of freedom, we would con-clude that there is between a .9 and a .95 probability that the nullhypothesis is not true—that there is a relationship between sex andparty affiliation. It is now up to the manager to decide whether this isenough certainty on which to act (that is, to assume that femaleshoppers are much better targets for Democratic party candidates).
Some Caveats. There are two things to guard against in carrying outa chi square analysis since the computation of chi square is sensitive
ALL THE STATISTICS YOU NEED TO KNOW (INITIALLY) 217
TABLE 10.3 Party Affiliation by Sex.
Actual Expected
Party Male Female Total Male Female Total Percentage
Democratic 43 37 80 49.2 30.8 80 61.5Republican 22 8 30 18.5 11.5 30 23.1Independent 15 5 20 12.3 7.7 20 15.4
Total 80 50 130 80 50 130 100.0
(43 – 49.2)2 (37 – 30.8)2 (22 – 18.5)2 (8 – 11.5)2 (15 – 12.3)2 (5 – 7.7)2χ2 = ————– + ————– + ————– + ———–– + ————– + ———–– = 5.27
49.2 30.8 18.5 11.5 12.3 7.7
19Andreasen/Ch. 10 8/11/02 3:09 PM Page 217

to very small expected cell frequencies and large absolute samplesizes. To guard against the danger of small expected cell sizes, a goodrule of thumb is not to calculate (or trust) a chi square when the ex-pected frequency for any cell is five or less. Cells may be added to-gether (collapsed) to meet the minimum requirement.
With respect to total sample size, it turns out that chi square isdirectly proportional to the number of cases used in its calculation.Thus, if one multiplied the cell values in Table 10.3 by 10, the cal-culated chi square value would be ten times larger and very signifi-cant rather than barely significant, as it is now.
There are statistical corrections for large sample sizes that moreexperienced researchers use in such cases. Neophyte researchersshould simply be aware that large sample sizes can result in bloatedchi squares and for this reason should be especially careful whencomparing chi squares across studies where differences in signifi-cance levels may be due to nothing more than differences in sam-ple sizes.
Metric Data: t Tests
The next most frequently used statistical test in marketing is the ttest. Because it is applicable only to interval or ratio data, it is calleda parametric test. It is used to compare two population estimationssuch as means or proportions and assess the probability that they aredrawn from the same population. It is computed in slightly differ-ent ways depending on whether one is analyzing independent ornonindependent measures.
t Test for Independent Measures. The t test can be used to com-pare means or proportions from two independent samples. For ex-ample, the t test can be used to indicate whether a sample of donorsin New York gave larger average donations than a sample in SanAntonio. The procedure to conduct this test is first to use a proce-dure to estimate the (combined) standard errors of these means.(Remember that the standard error is a measure of the spread of a
218 MARKETING RESEARCH THAT WON’T BREAK THE BANK
19Andreasen/Ch. 10 8/11/02 3:09 PM Page 218

hypothetical series of means produced from the same sampling pro-cedure carried out over and over again, in this case, in New Yorkand San Antonio.) One then divides the difference between themeans by the combined standard error, which is actually a com-bined standard error of difference in means. (To combine the stan-dard errors and conduct this test, the original data in the samplesmust be normally distributed and have equal variances. If these as-sumptions do not appear to be met, a more sophisticated analysisshould be conducted.) This in effect indicates how many standarderrors the two means are apart. The resulting figure is called a t sta-tistic if the sample size is small (under thirty) and a z statistic if it islarge. This statistic then allows us to say something about the prob-ability that two means are really equal (drawn from a more generalpopulation of all customers). A low probability indicates they aredifferent. The same analysis could be conducted comparing two pro-portions instead of two means.
Independent t tests can also be used for two other purposes thatare often important in research. First, they can test whether a meanor proportion for a single sample is different from an expected value.For example, a researcher could determine whether the averagehousehold size in a sample differs from the Bureau of the Census figure for the area. Using this same logic, the t test can also assesswhether the coefficients in a multiple regression equation are reallyzero as indicated in Exhibit 10.2.
Sometimes we wish to see whether the means or proportions forthe answers to one question in a study are different from similarmeans or proportions elsewhere in the same study or in a later studyof the same sample. For example, we may wish to know whether re-spondents’ evaluations of one positioning statement for an organi-zation are more or less favorable than another positioning. (Notethat the means or proportions must be in the same units.) Since thisprocedure would compare respondents to themselves, the two mea-sures are not independent. In this case, the computer takes eachpair of respondent answers and computes a difference. It then pro-duces a t statistic and an associated probability that indicates the
ALL THE STATISTICS YOU NEED TO KNOW (INITIALLY) 219
19Andreasen/Ch. 10 8/11/02 3:09 PM Page 219

likelihood that the mean of all of the differences between pairs ofanswers is really zero. If the probability is low, we would concludethat the respondents did perceive the concepts as different.
Metric Data: Analysis of Variance
Very often, managers are interested in learning about differencesacross many groups or cases. A useful tool for these purposes in analy-sis of variance. There are two main variations referred to as one-wayand N-way analysis of variance.
One-Way Analysis of Variance. Suppose we want to comparethree or more means. That is, suppose we want to ask whether meandonation levels are different across five cities. The parametric test
220 MARKETING RESEARCH THAT WON’T BREAK THE BANK
EXHIBIT 10.2 t Test for Dependent Measures.
Testing Regression CoefficientsMultiple regression equations are typically developed to produce alinear combination of significant predictors of some phenomenon. Forexample, one might develop an equation estimating the ability of age,family size, or education in combination to predict the average dona-tion of a household.
The resulting equation will have coefficients for each factor (forexample, age or family size) used to produce the predicted donationsize for each respondent. For example, age might have an estimatedcoefficient of $23, saying that for every year a person ages, the indi-vidual will give $23 more in donations, with the other factors in theequation held constant. In the process of estimating this coefficient,the typical computer program will also produce a t statistic and proba-bility that will help us conclude whether the coefficient of $23 is really zero. If the computer printout says that the probability is highthat it is zero, then we should be inclined to conclude that age is nota valuable predictor and ought to be dropped from the predictionequation (which then should be reestimated).
19Andreasen/Ch. 10 8/11/02 3:09 PM Page 220

to use here is the one-way analysis of variance (ANOVA), which is,in a sense, an extension of the t test described above. For the t test,we compared the difference between two means to an estimate ofthe random variance of those means (expressed as the standard er-ror of the difference). The more general ANOVA technique pro-ceeds in essentially the same way. It calculates a measure of varianceacross all the means (for example, the five cities) and then com-pares this to a measure of random variance—in this case, the combined variances within the five cities. Specifically, ANOVA di-vides the variance across the cities by the variance within cities toproduce a test statistic and a probability of significance. The test sta-tistic here is called an F ratio (of which the t ratio or t statistic is aspecial case). Again, a low probability and a high F statistic is in-terpreted to mean that the variance across the cities is greater thanchance.
Note that we did not conclude that any one city is differentfrom any other specific city, only that there was significant varianceamong them all. We may have a hypothesis that a specific pair ofcities are different. In this case, we would simply have the computerrun a t test on the difference between the two means.
N-Way ANOVA. Analysis of variance is probably most often usedas the primary statistical tool for analyzing the results of experiments.It is highly flexible and can be used for quite complicated designs.
Consider by way of illustration a simple study of the effects onmuseum gift shop sales of (1) offering or not offering free beveragesand (2) using each of four different types of background music. Sup-pose the researcher conducted a fully factorial experiment (that is,every possible combination) in which each of the four kinds of mu-sic was tried out for a specified period of time at a sample of gift shopswith and without a free beverage service. Hypothetical results foreach of the eight combinations offered in five shops for each cell areshown in Table 10.4.
N-way analysis of variance proceeds to analyze these results inthe same way as we did in one-way ANOVA. We first compute an
ALL THE STATISTICS YOU NEED TO KNOW (INITIALLY) 221
19Andreasen/Ch. 10 8/11/02 3:09 PM Page 221

222 MARKETING RESEARCH THAT WON’T BREAK THE BANK
TABLE 10.4 Sales Results of Hypothetical Experiment (thousands of dollars).
Music Type Beverages No Beverages Music Mean
Classical 122 98136 106153 111109 103120 94
X–
11 = 128.0 X–
12 = 102.4 X–
1. = 115.2
Semi-classical 136 111127 119104 104131 121136 110
X–
21 = 126.8 X–
22 = 113.0 X–
2. = 119.9
Middle of the road 97 110110 12095 113
107 131122 106
X–
31 = 106.2 X–
32 = 116.0 X–
3. = 111.1
Contemporary pop 86 9985 10193 11078 9093 95
X–
41 = 87.0 X–
42 = 99.0 X–
4. = 93.0
Beverage mean X–
.1 = 112.0 X–
.2 = 107.6 X=
.. = 109.8
19Andreasen/Ch. 10 8/11/02 3:09 PM Page 222

estimate of random variance, in this case, the combination of thevariances within each of the eight cells. We (actually a computerdoes this) then calculate three tests for significant effects. The com-puter program asks:
• Is there a main effect due to having the beverages present ornot, that is, is the variance across the two beverage conditionssignificantly greater than the random variance when the music treatments are controlled?
• Is there a main effect due to the different music types (ignor-ing beverage treatment)?
• Is there an interaction effect due to the combination of musicand beverage service; that is, are the results in each of theeight treatment cells higher or lower than would be predictedfrom simply adding the two main effects together?
In each case, the computer reports an F ratio statistic and a prob-ability of no effects. A glance at the means for the various cells inTable 10.4 shows that (1) beverages yield more sales than no bever-ages, (2) semiclassical music yields the most sales and contemporarypop the least, and (3) beverages added to classical or semiclassicalmusic increase sales, but when added to contemporary or pop musicdecrease sales. Are these results statistically significant? The ANOVAresults for the data in Table 10.4 are as follows:
Sum of Mean Squares Df Square F Ratio Probability
Music main effect 4151.0 3 1383.67 12.764 .000
Beverage main effect 193.6 1 193.6 1.786 .191
Interaction effect 2521.0 3 840.33 7.752 .000
Error 3468.8 32 108.40
Here, we see that the type of music does have a significant ef-fect: the differences in means with the beverage treatment con-trolled seem to be real. However, despite appearances, the presence
ALL THE STATISTICS YOU NEED TO KNOW (INITIALLY) 223
19Andreasen/Ch. 10 8/11/02 3:09 PM Page 223

or absence of beverages has no effect. Finally, there is an interactioneffect indicating that the combination of beverages and classical orsemiclassical music is the manager’s best bet. It may be that the twocreate a much more desirable ambience. At least our statistics keptus from concluding that beverages by themselves would be a goodaddition.
Association: Nonmetric and Metric Data
In many cases, we wish to know whether variables are associatedwith each other, either singly or in sets. If variables are associated,we may be able to use one variable or set of variables to predict an-other. Furthermore, if we have some plausible prior theory, we mayalso say that one variable or set of variables explains or causes theother (although always remember that association is not causation).We have already discussed nominal measures of association usingchi square. Other measures of association can be computed for bothranked data and metric data.
Ordinal Data: Spearman Rank-Order Correlation. Spearman’srank-order correlation procedure can compare the rankings of twovariables, for example, a hospital’s rankings on staff knowledge andfriendliness. Spearman’s rho coefficient indicates whether a higherranking on one variable is associated with a higher (or lower) rank-ing on some other variable. If the two rankings move in the samedirection, the sign of rho will be positive. If the rankings move inopposite directions, rho will have a negative sign. In either case, rhocan range between zero and one; the closer to one it is, the more wecan conclude that the rankings really are associated.
Metric Data: Pearson Product Moment Correlation. This ap-proach seeks the same result as the Spearman analysis but is used forinterval or ratio-scaled variables. The Pearson correlation coeffi-cient, called r, can be positive or negative and range from 0 to 1.Most computer programs produce both the Pearson r and a proba-bility that the actual value of r is zero. Its square, the Pearsonian r2,
224 MARKETING RESEARCH THAT WON’T BREAK THE BANK
19Andreasen/Ch. 10 8/11/02 3:09 PM Page 224

is an indication of the proportion of the original variance explainedby the relationship.
Metric Data: Simple Correlations. Another use of the Pearsoniancorrelation coefficient is as a measure of the extent to which astraight line plotted through the points representing pairs of mea-surements fits the data poorly (and has a low r) or rather well (andtherefore has a high r). Figure 10.4 shows a line with a good fit (5a)and a line with a poor fit (5b).
Metric Data: Multiple Regression. If one variable is good at pre-dicting another variable, the researcher may wish to look further tosee whether a second or third variable will help improve this ex-planatory power. Multiple linear regression is the technique mostoften used for this. In a manner similar to simple two-variable cor-relation, multiple regression seeks to construct a linear combinationof two or more independent variables (that may be metric or di-chotomous) that predict the value of a dependent metric variable.(A dichotomous variable in a regression equation is a special case ofa nominal variable where the values zero and one are used to indi-cate the presence or absence of some characteristic, for example, be-ing a woman or being married.) An example would be using age,income, education, size of household, and sex to predict the numberof hours a month a person would spend exercising.
ALL THE STATISTICS YOU NEED TO KNOW (INITIALLY) 225
Var
iabl
e A
Variable B
Var
iabl
e A
Variable B
5a 5b
FIGURE 10.4 Two Hypothetical Regression Lines.
19Andreasen/Ch. 10 8/11/02 3:09 PM Page 225

If a researcher has a great many variables that might be used insuch a multiple regression but is not sure which to use, there are twobasic approaches to finding the better set (using a computer). Thefirst approach is theory driven. The researcher can specify the set ofvariables in advance, usually on the basis of some theory aboutwhich variables ought to predict well. Since the computer will printout a t statistic measure indicating the probability that the coeffi-cient for any given variable is really zero, the researcher can thenlook at the initial output and eliminate predictors with high prob-abilities of being nonsignificant and rerun the analysis. This mayhave to be done two or three times before the final best set of pre-dictor variables is determined.
Alternatively, the researcher can ask the computer to look forthe best set of predictors among what is usually a very large set ofcandidate variables using a procedure called stepwise regression analy-sis. Under this procedure, the computer takes the original variancein the dependent variable and proceeds to enter into the equationthe predictor with the highest explanatory power (for example, thehighest simple r). It then subtracts out the variance explained bythis variable, computes new correlations of each remaining poten-tial predictor variable and the adjusted dependent variable, andthen picks the variable with the highest correlation at this step. Inthis manner, variables from the candidate set are added to the pre-diction equation until they are all exhausted or some predeterminedstopping point is reached (such as when the variance about to beexplained at the next step is less than 1 percent).
Stepwise regression is a good technique at the exploratory stageof a study. However, care should be taken with it since it has proper-ties that make it possible that a truly significant predictor will bemissed because it happens to be highly correlated with a variable en-tered at an early step in the analysis. Furthermore, if the sample islarge enough, researchers should test the model eventually discoveredon a different subsample from the one on which it was developed.
Once the multiple regression analysis is done, the researcher willwish to look at three measures produced by the computer program:
226 MARKETING RESEARCH THAT WON’T BREAK THE BANK
19Andreasen/Ch. 10 8/11/02 3:09 PM Page 226

• Multiple R measures how well the equation fits the data. Theprobability that this statistic is really zero is important as an indica-tor that the equation really does predict.
• Multiple R2 is analogous to the Pearsonian r2. It indicates theproportion of variance in the dependent variable accounted for bythe linear combination of the predictor variables. It is as importantas the probability of the multiple R being zero. If the data set islarge, it is often possible to have a highly significant multiple R foran equation that explains very little of the variance in the depen-dent variable.
• Standardized variable coefficients. The researcher will alsowish to know the relative contribution of each of the independentvariables to the overall prediction equation. He or she could lookat the relative size of the coefficients for each predictor variable totry to learn this, but this would be misleading because the variablesare usually in different units; for example, the coefficient for incomemay be very small because income is expressed in thousands or tensof thousands of dollars, while sex may have a large coefficient be-cause it can be only 0 or 1. The solution to this dilemma is to con-vert all of the variables into standard deviation units. The resultingbeta coefficients (as they are called) are simply the original coefficients(often called B coefficients) divided by the respective standard devi-ations (see Exhibit 10.1). Variables with larger beta coefficients canbe considered to make more of a contribution to the overall pre-diction than those with smaller coefficients.
Other Multivariate Techniques
Many researchers may already be familiar with the techniques just de-scribed and would like to move on to more sophisticated analyses. Itis not appropriate to treat more advanced techniques in depth in thisbook. However, to acquaint the reader with some of the possibilities,several of the major alternatives will be described briefly. The Rec-ommended Reading list at the back of the book cites other sources fordetailed information on the various approaches. A general useful and
ALL THE STATISTICS YOU NEED TO KNOW (INITIALLY) 227
19Andreasen/Ch. 10 8/11/02 3:09 PM Page 227

nontechnical book for a good overview is Multivariate Data Analysis,by Joseph Hair et al.
Factor Analysis
Many measurements in a study are related. In studies with verylarge databases, it will often be very valuable to ask whether themeasures obtained can be reduced to a smaller set of underlying fac-tors to which each of a set of measurements is related. Factor analy-sis investigates the correlations among measurements and providesone or more factors that apparently underlie the data. Factor analy-sis looks at all the variables in a set simultaneously. None is speci-fied as a dependent or independent measure.
An example of the use of factor analysis is that carried out bythe United Way of America in the 1980s to help its 297 local chap-ters evaluate their performance against other comparable localchapters. In the past, chapters had been compared to others likethemselves only in total market size. But United Way realized thatcomparing a city in an economically troubled part of Pennsylvaniato a city of the same size in booming Arizona or Florida made littlesense, so it sought to develop measures that would better describedifferences in markets. To do this, its Research Division assembledninety-two indicators on each of its 297 solicitation areas, in partusing several of the secondary sources mentioned in Chapter Five.The Research Division then used a factor analysis computer pro-gram to reduce this unwieldy set of ninety-two indicators to a man-ageable set of five basic factors that seemed to capture much of thecomplexity of the local social and economic profiles:
• An income and affluence factor
• A type-of-employment and labor-force-structure factor
• A factor indicating the relative preponderance of impover-ished and minority counties
• A growth rate factor
• A factor indicating the relative age of adults and presence ofchildren in area households
228 MARKETING RESEARCH THAT WON’T BREAK THE BANK
19Andreasen/Ch. 10 8/11/02 3:09 PM Page 228

These labels for the factors were added by the researcher and werenot automatically produced by the computer program.
Cluster Analysis
Often marketers would like to know whether members of a large setof objects being studied (for example, respondents, governmentagencies, classical composers, and countries) clump together ingroups exhibiting relatively homogeneous characteristics. Clusteranalysis is designed for this type of problem. It takes whatever in-formation the researcher has on each object and proceeds to de-velop groupings that maximize the homogeneity within the groupsand heterogeneity across the groups. Again, no variable is depen-dent or independent.
In top-down clustering, the analysis begins with all objects inone large group and proceeds to split the group step by step untilsome homogeneity-heterogeneity ratio level is reached. In bottom-up clustering, the program begins with each object in its own groupand proceeds to combine them into groups until the specified stop-ping point is reached.
The United Way used cluster analysis to partition its 297 localsolicitation areas into 12 relatively homogeneous groups based ontheir scores on the five factors mentioned above. The clusters rangein size from 7 to 51 communities. Organizations within clusters nowcould share performance data and experiences with greater confi-dence that they are dealing with others facing very much the samekind of market challenges they are.
Discriminant Analysis
Simple and multiple correlation analyses typically have metric mea-surements on their dependent variables, but sometimes marketersmay have a nominal measure that is of interest. Discriminant analy-sis is a technique similar to regression in that it develops a set of vari-ables that best help marketers predict whether a given case (that is,a respondent) falls into a particular nominal category.
ALL THE STATISTICS YOU NEED TO KNOW (INITIALLY) 229
19Andreasen/Ch. 10 8/11/02 3:09 PM Page 229

For example, suppose the United Way wished to understandwhat variables differentiate three groups: nondonors, new donors,and repeat donors. Discriminant analysis can be used to determinethe best combination of predictors of group membership. As withmultiple regression, the analysis can also indicate the relative im-portance of each of the predictor variables in the final solution.
The equation that predicts group membership is called a dis-criminant function. One complication of discriminant analysis is thatthere can be more than one discriminant function if the researcheris trying to discriminate among more than two groups. A second im-portant difference from regression is that discriminant analysis doesnot produce a statistic like R2 that indicates how well the discrimi-nant function predicts. Typically, researchers take as a measure ofsuccess how often the final function correctly predicts a subject’strue group membership.
Multidimensional Scaling
Marketers are often interested in understanding how objects in agroup are perceived in relationship to each other by target con-sumers. A strategic planner for the YMCA will be interested in un-derstanding which other youth service organizations are most andleast similar to it in parents’ minds and what these consumers areusing as the key dimensions in evaluating the entire set of organi-zations. Multidimensional scaling is a technique used to positionobjects in some physical or perceptual space. It does so by analyzingone of three kinds of measures: objective measures of an object’scharacteristics, such as the number of programs, number of employ-ees, or square footage of buildings; subjective measures of an object’scharacteristics, such as perceptions of staff quality, equipment vari-ety, or attractiveness of the premises; or subjective measures of sim-ilarity or dissimilarity among the objects, letting respondents usewhatever dimensions they wish to use to determine those relation-ships. In all three cases, the computer analysis routine produces amap of the objects relating them in geometric space along one or
230 MARKETING RESEARCH THAT WON’T BREAK THE BANK
19Andreasen/Ch. 10 8/11/02 3:09 PM Page 230

more underlying dimensions (in a sense like factor analysis). It is then up to the researcher to label these underlying dimensions.When the raw data analyzed include subjective perceptions, the re-sult is sometimes referred to as a perceptual map.
Multidimensional scaling studies that use subjective input inthe form of either object ratings or similarities judgments can alsoask respondents about their ideal object (such as their ideal youthcenter). A YMCA planner can then look at which respondents haveideal youth centers near to the researcher’s own perceptual position(their natural constituency) or see whether there are sets of respon-dents with no youth centers near their ideal points. The latter wouldcomprise a potential target for an entirely new type of youth centeroffering.
Conjoint Analysis
A great many consumer choices involve trade-offs between featurespossessed by different alternatives. For example, when consideringwhich youth center to patronize, a young woman might have a realset of choices:
Option A: high fees, large variety of equipment, staff who arenot very knowledgeable, poor parking, short driving time
Option B: medium fees, large variety of equipment, staff who arenot very knowledgeable, great parking, short driving time
Option C: very low fees, average variety of equipment, staff whoare very knowledgeable, average parking, long driving time
The consumer’s preference ranking of these three alternatives willdepend on the extent to which she is willing to trade off, for exam-ple, poorer staff knowledge and a longer drive for lower prices.
Conjoint analysis is a technique for exploring these trade-offs. Ina conjoint study, objects such as products, services, or other choicesare described in terms of attributes to be traded off. Consumers rank
ALL THE STATISTICS YOU NEED TO KNOW (INITIALLY) 231
19Andreasen/Ch. 10 8/11/02 3:09 PM Page 231

sets of these objects, and then the conjoint analysis routine proceedsto indicate the relative value respondents attach to each of the dif-ferent dimensions. It will also indicate which combination of thespecified attributes will be most attractive to the entire population(including combinations not offered in the study) and which con-sumers will find an existing or proposed combination of attributesmost appealing.
Multivariate Analysis of Variance
Often a researcher in an experimental study may wish to see whetherthere are differences across groups in some set of metric characteris-tics rather than a single characteristic as in an ANOVA design. Inthe ANOVA example presented earlier (Table 10.4), the effects of beverage availability and music type were studied with respect toone outcome: total sales in a museum gift shop. But suppose the re-searcher wishes to look at the effect of the two types of treatment on:
• Average length of time spent in the store
• Total sales of high-priced merchandise
• Total sales of posters
• The ratio of items sold at full price to items sold at a marked-down price
The manager will be interested in this combination of outcomes.Multivariate analysis of variance (MANOVA) proceeds in much thesame way as ANOVA with similar outputs to answer this question.
232 MARKETING RESEARCH THAT WON’T BREAK THE BANK
19Andreasen/Ch. 10 8/11/02 3:09 PM Page 232

PART FOUR
Organizing Low-Cost Research
20Andreasen/Part 4 8/11/02 3:10 PM Page 233

11Organization andImplementation on a Shoestring
The preceding chapters have outlined both a procedure forplanning and implementing a program of low-cost research and a wide-ranging set of techniques for carrying it out. It is now timeto tackle the serious problem of how to get it all done, particularlywithin a very limited budget. The glib answer is to beg or borrow asmuch as possible and keep the costs of the research as low as possi-ble, with the constraint that one always has an obligation to man-agement to provide good as well as low-cost research. However, inreality, the task of system building is more complex. To see some ofthe ways in which it may be possible to keep costs down, we needto list the basic requirements for carrying out a beginner’s researchprogram. These requirements can be roughly divided into three cat-egories: ideas, people, and things. A partial list of some of the re-quirements in each of these categories is outlined in Exhibit 11.1.We will consider some of the tactics available to low-cost researchersin each of the categories.
Financial Assistance
Assuming the research manager has been assigned a modest budgetfor a program of research, how can it be augmented? Several sourcesof additional funding can be explored.
235
21Andreasen/Ch. 11 8/11/02 3:10 PM Page 235

236 MARKETING RESEARCH THAT WON’T BREAK THE BANK
EXHIBIT 11.1 Resources Needed for an Extended Program of Marketing Research.
1. Money to supplement the manager’s limited budget.
2. Know-how to do the following:a. Learn from management what decisions they need to make
and what information will help them make those decisions.b. Estimate the costs and benefits of research.c. Develop protocols for observation.d. Design experiments.e. Design sampling plans.f. Write questionnaires.g. Train a field force and their supervisors.h. Write coding manuals and schemes.i. Design and carry out statistical analyses (including any
computer programming necessary).j. Run focus groups.k. Write reports (including preparation of graphics, possibly
a separate skill).l. Present the results and see that they are implemented.
3. Personnel to do the following:a. Conduct and supervise interviews.b. Mail and follow up questionnaires.c. Carry out experiments.d. Conduct observations.e. Code results.f. Enter results.g. Run computer analyses.h. Produce final reports and presentation materials.i. Collect and analyze archives.
4. Equipment and facilities:a. Rooms for experiments or focus groups.b. Telephone equipment (including monitoring facilities for
interviewing).c. Computers for:
(1) Cover letters for mail studies.(2) Questionnaires.
21Andreasen/Ch. 11 8/11/02 3:10 PM Page 236

Immediate Superiors
Chapter Two outlined an approach in which the knowledgeable andpersuasive research manager could demonstrate to management thebenefits from additional expenditures on research that will morethan justify those expenditures. The research manager needs to fol-low those steps to get the manager who approved the initial basicresearch budget to supplement it because of the value this will bring.The first step is to begin a long-term campaign to educate the man-ager in the benefit-cost approach to research funding developed inthis book. The manager must learn to appreciate the extent to whichthe provision of some information in many situations will helpmake for better decisions even if the stakes are low. The managermust learn that inexpensive information can be very helpful in theface of uncertainty.
One problem is that the research manager’s superiors may be in-hibited by the myths outlined in Chapter One. The research man-ager should undertake a subtle but purposeful campaign to destroythem. In addition, management should become aware of many ofthe low-cost research possibilities outlined in this book. At the sametime, following suggestions in Chapter Two, the researcher shouldconstantly look for opportunities to point out over and over againhow a particular problem can be helped by research. In a sense, theresearch manager should force serendipity.
One technique that may be helpful in this regard is the unautho-rized low-cost research demonstration project. An occasion may arisewhen the research manager senses an opportunity to demonstrate
ORGANIZATION AND IMPLEMENTATION ON A SHOESTRING 237
(3) Statistical analyses.(4) Report writing and graphic preparation.
d. Software for word processing, analyses, report publication and graph preparation.
e. Mailing lists or other materials for sampling.f. Libraries and Web connections for secondary source material.
21Andreasen/Ch. 11 8/11/02 3:10 PM Page 237

238 MARKETING RESEARCH THAT WON’T BREAK THE BANK
(not just describe) how research can help improve a particular man-agement decision. If at all feasible, the researcher should surrep-titiously carry through a pilot study of modest proportions usingexisting funds focused on this decision. Although such a strategy isrisky, the hope is that the results of the ad hoc study will be so com-pelling that management will grant ex-post authorization of the bud-get to the daring researcher. Peters and Waterman indicate that oneof the hallmarks of a well-run organization is its tolerance of organi-zational mavericks.1
Other Organization Divisions
If the low-budget researcher is employed by a multidivision enterprise(say, a nonprofit with many regions or chapters), other low-budget re-searchers may well be hidden elsewhere in the organization. Jointlyundertaken projects typically can achieve much greater payoff thanwould be possible from each budget separately. But it may be thatother company divisions may not appreciate the possibilities of re-search at all. If this is the case, from time to time the researcher couldadd a few questions to planned studies to suggest the value of researchto other divisions. Subsequently, financial contributions for projectscould be solicited initially on a marginal cost basis. Once one jointventure is successful, other divisions could be enticed to join the en-terprise.
Competitors
There may be certain kinds of projects where participation by com-petitors (who would obviously share in the findings) would be betterthan no research at all. For example, a cooperative effort by severalcharities or performing arts centers on the effectiveness of joint ad-vertising might appeal to multiple participants. If such projects are tobe mounted, any of the organizations could manage the research con-templated. Alternatively, a joint task force could be established. Al-though this can lead to conflict and, in my experience, will inevitably
21Andreasen/Ch. 11 8/11/02 3:10 PM Page 238

delay the project, it will at least ensure that each contributor has avoice in the final research design, thus increasing the likelihood eachwill participate. The disadvantage of this type of low-budget financ-ing is that there is no confidentiality.
Other Partners
Other organizations with which the organization works may be per-suaded to participate in a research project that would benefit mu-tual interests. Despite this mutuality, there is still the possibility thatcompetitors would learn about the project. However, if projects canbe designed that are of clear benefit to other partners, they may wellbe willing to maintain confidentiality.
Trade Associations or Universities
In the private sector, going to competitors for collaborative researchmay raise antitrust questions in addition to confidentiality prob-lems. Furthermore, in any sector, joint projects may be aborted orcompromised due to wrangling over who is in charge, what getsdone, who does it, and how the results are to be used. If these arelikely to be problems, it may be useful to induce a neutral entity likea trade association to take on the projects. If an association does notexist, an accounting firm or university may be persuaded to performthe same function. The obvious advantages are several, not theleast of which is that there may be certain cost economies inherentin the tax-free status of the nonprofit association. Furthermore, tothe extent that intraindustry data will be involved, having the proj-ect under the aegis of an association or university may increase respondent participation and candor. The association or univer-sity may be willing to commit its own resources if it sees a researchstudy, especially a continuing study, as a benefit to its own mission.Universities often see research projects as opportunities to advance science—and academic careers.
ORGANIZATION AND IMPLEMENTATION ON A SHOESTRING 239
21Andreasen/Ch. 11 8/11/02 3:10 PM Page 239

Acquiring Knowledge
All of the activities of a year-long program of research activity canbe carried out by the researcher and a separately dedicated staff. Al-ternatively, virtually all can be carried out by outside agencies. Full-service market research agencies can do virtually any activity aresearcher wishes to carry out, as do organizations and individualsspecializing in certain specific marketing research functions such asconducting focus groups (or focus group recruiting), telephone in-terviewing, laboratory experimentation, computer programmingand statistical analysis, and preparation of graphics. Many of theseoutside suppliers have close competitors, and a few have their ownproprietary approaches, such as unique methods of new producttesting. The top fifty research organizations are listed in Table 11.1.
Unfortunately, there are no data indicating which functions are most often delegated to outsiders by major firms. In my experi-ence, most organizations do not carry out their own field inter-viewing. Fieldwork requires specially trained people who would beput to work only from time to time as needed. Managing such a sig-nificant part-time labor force does not appeal to most firms. Outsidefield research agencies can achieve significant scale economies insuch activities that individual firms cannot. Again, because of thespecialized skills, focus group interviewing is also frequently con-tracted out, although here it is as often to individuals as to firms.
It is most likely, however, that a beginning researcher with alimited budget will have little financial capacity for hiring a greatdeal of outside know-how. However, there are a number of otherlower-cost, and sometimes free, sources of assistance that can beused. Several of these are covered next, in an ascending order of dif-ficulty of acquisition.
The Manager’s Own Organization
If an organization has other divisions that work with or prepareanalyses or reports, you may be able to secure their assistance. Someof the possibilities are:
240 MARKETING RESEARCH THAT WON’T BREAK THE BANK
21Andreasen/Ch. 11 8/11/02 3:10 PM Page 240
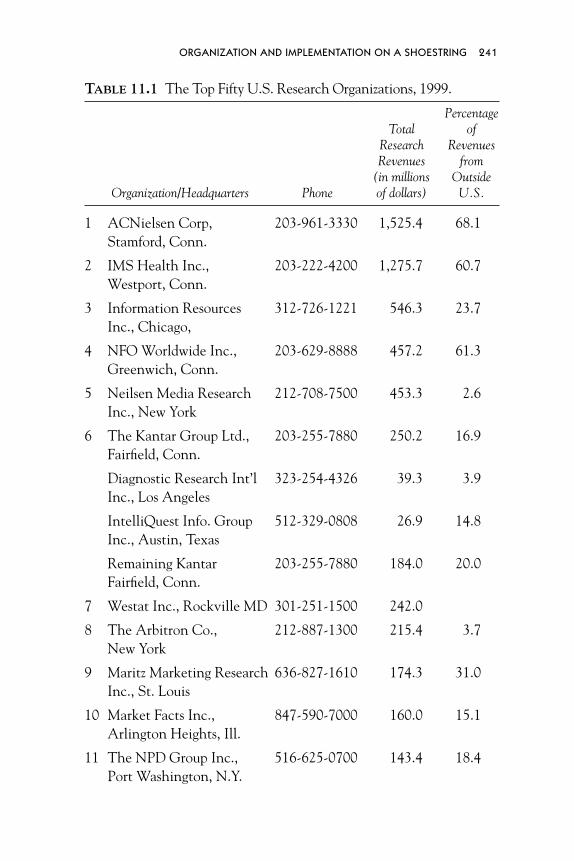
ORGANIZATION AND IMPLEMENTATION ON A SHOESTRING 241
TABLE 11.1 The Top Fifty U.S. Research Organizations, 1999.
PercentageTotal of
Research RevenuesRevenues from
(in millions OutsideOrganization/Headquarters Phone of dollars) U.S.
1 ACNielsen Corp, 203-961-3330 1,525.4 68.1Stamford, Conn.
2 IMS Health Inc., 203-222-4200 1,275.7 60.7Westport, Conn.
3 Information Resources 312-726-1221 546.3 23.7Inc., Chicago,
4 NFO Worldwide Inc., 203-629-8888 457.2 61.3Greenwich, Conn.
5 Neilsen Media Research 212-708-7500 453.3 2.6Inc., New York
6 The Kantar Group Ltd., 203-255-7880 250.2 16.9Fairfield, Conn.
Diagnostic Research Int’l 323-254-4326 39.3 3.9Inc., Los Angeles
IntelliQuest Info. Group 512-329-0808 26.9 14.8Inc., Austin, Texas
Remaining Kantar 203-255-7880 184.0 20.0Fairfield, Conn.
7 Westat Inc., Rockville MD 301-251-1500 242.0
8 The Arbitron Co., 212-887-1300 215.4 3.7New York
9 Maritz Marketing Research 636-827-1610 174.3 31.0Inc., St. Louis
10 Market Facts Inc., 847-590-7000 160.0 15.1Arlington Heights, Ill.
11 The NPD Group Inc., 516-625-0700 143.4 18.4Port Washington, N.Y.
21Andreasen/Ch. 11 8/11/02 3:10 PM Page 241

242 MARKETING RESEARCH THAT WON’T BREAK THE BANK
TABLE 11.1 (Continued)
PercentageTotal of
Research RevenuesRevenues from
(in millions OutsideOrganization/Headquarters Phone of dollars) U.S.
12 United Information Group 212-627-9700 130.0 17.8USA, New York
13 Opinion Research Corp., 908-281-5100 109.4 36.0Princeton, NJ
Opinion Research Corp., 908-281-5100 56.7 34.9Princeton, NJ
Macro International Inc., 301-572-0200 52.7 37.2Calverton, MD
14 Taylor Nelson Sofres 215-442-9000 83.6 21.8Intersearch, Horsham, PA
15 J. D. Power and Associates, 818-889-6330 75.4 12.5Agoura Hill, Calif.
16 Roper Starch Worldwide 914-698-0800 65.7 13.2Inc., Harrison, N.Y.
17 Ipsos-ASI Inc., Norwalk, 203-840-3400 64.1 47.6Conn.
18 Abt Associates Inc., 617-492-7100 50.8 15.1Cambridge, Mass.
19 Burke Inc., Cincinnati 513-241-5663 48.8 29.1
20 Total Research Corp., 609-520-9100 47.8 29.3Princeton, NJ
21 MORPACE International 248-737-5300 44.4 19.5Farmington, Mich.
22 M/A/R/C Research, 972-506-3400 38.8 4.4Irving, TX
23 C&R Research Services 312-828-9200 38.3Inc., Chicago
21Andreasen/Ch. 11 8/11/02 3:10 PM Page 242

ORGANIZATION AND IMPLEMENTATION ON A SHOESTRING 243
24 Harris Interactive Inc., 716-272-9020 37.3 6.4Rochester, N.Y.
25 Market Strategies, 734-542-7600 34.3 4.4Livonia, Mich.
26 Wirthlin Worldwide, 703-556-0001 33.5 19.3McLean, VA
27 Lieberman Research 310-553-0550 31.2 23.7Worldwide, Los Angeles
28 Walker Information, 317-843-3939 29.1 23.8Indianapolis
29 Custom Research Inc., 612-542-0800 28.2 9.2Minneapolis
30 Yankelovich Partners, Inc., 203-846-0100 27.9Norwalk, Conn.
31 Elrick & Lavidge Marketing 770-621-7600 27.2Research, Tucker, GA
32 ICR/Int’l Communications 610-565-9280 25.3 1.5Research, Media, PA
33 RDA Group Inc., 248-332-5000 23.0 20.0Bloomfield Hills, Mich.
34 Media Metrix Inc., 212-515-8700 20.5 4.0New York
35 Data Development Corp., 212-633-1100 18.6 8.6New York
36 Lieberman Research Group, 516-829-8880 18.3 2.8Great Neck, N.Y.
37 Marketing and Planning 781-890-2228 18.2 30.2Systems Inc., Waltham, Mass.
38 National Research Corp. 402-475-2525 18.2Lincoln, Neb.
39 Schulman, Ronca & 212-779-7700 16.9Bucuvalas Inc., New York
21Andreasen/Ch. 11 8/11/02 3:10 PM Page 243

244 MARKETING RESEARCH THAT WON’T BREAK THE BANK
TABLE 11.1 (Continued)
PercentageTotal of
Research RevenuesRevenues from
(in millions OutsideOrganization/Headquarters Phone of dollars) U.S.
40 TVG Inc., 800-368-7556 16.8 22.0Fort Washington, PA
41 Ziment Associates Inc., 212-647-7200 15.9 1.9New York
42 Directions Research Inc., 513-651-2990 15.7Cincinnati
43 Cheskin Research, 650-802-2100 15.0 30.0Redwood Shores, Calif.
44 Greenfield Consulting 203-221-0411 14.7 4.8Group Inc., WestportConn.
45 Market Probe, Milwaukee 414-778-6000 14.4 42.2
46 The PreTesting Co. Inc., 201-569-4800 14.3 7.0Tenafly, NJ
47 Questar Data Systems 651-688-0089 14.0Inc., Eagan, Minn.
48 The B/R/S Group Inc., 415-332-4430 13.5 6.6Mill Valley, Calif.
49 Marketing Analysis Inc., 843-797-8900 13.0 3.6North Charleston, S.C.
50 Savitz Research Cos., 972-386-4050 13.0Dallas
Total $6,808.3 38.6%
Source: Adapted with permission from Jack Homonichl, “2001 Study of U.S.Research Organizations,” Marketing News, June 4, 2001 (Chicago: AmericanMarketing Association, 2001), p. H4.
21Andreasen/Ch. 11 8/11/02 3:10 PM Page 244

• Long-range planning department. There may be economists orothers in a long-range planning group with advanced social sciencetraining who can be helpful with some kinds of statistical analysis.Economists in particular are likely to be familiar with regression,correlation, and such arcane topics as confidence intervals.
• Quality control department. Those who have been trained inthis area may be familiar with concepts of experimental design andtests of significance (for example, whether twelve defects per hourconstitute a serious quality control problem).
• Advertising or marketing department. Recently hired M.B.A.swith marketing majors may have been exposed to marketing research(possibly) or statistics (probably) courses in their graduate programs.
• Information technology and accounting department. These de-partments frequently have computer programming experts or indi-viduals familiar with handling large data sets.
• Public relations department. These specialists are often skilledin producing newsletters and reports and may be able to help withgraphics and report design. They may also be familiar with or canhelp the researcher evaluate desktop publishing computer software.
• Secretarial and word processing department. Here is a goodplace to get advice on word processing software. It may also be a placewhere one can find a secretary who is adept at producing attractivequestionnaires, specialized research reports, and complex tables andfigures.
Local Colleges and Universities
Institutions with programs in undergraduate or graduate businessand economics can be very helpful in several ways.
Professors have been known to do consulting and may be hiredat less-than-market rates (and sometimes for free) if the professorbelieves there will be some publishable outcome or something valu-able for the classroom in the work. While clients are rightfully con-cerned about confidentiality of their own studies, most proprietary
ORGANIZATION AND IMPLEMENTATION ON A SHOESTRING 245
21Andreasen/Ch. 11 8/11/02 3:10 PM Page 245

data can be well disguised for publication or classroom use (the pro-fessor will almost always agree to this in writing). The assistancemay well be worth some very small potential that information willbe leaked to competitors.
The researcher should not be limited for possible sources of helpto business schools or economics departments. Psychology, socialwork, public health, and education departments may have peoplewith skills in experimental design, computers, or statistical meth-ods. They may also provide focus group leaders with good group dy-namics skills and psychological insight. Anthropologists may behelpful in observation studies.
Beginning researchers should be cautious about some hiddencosts of hiring professors. If the professors are not paid or are paid atbelow-market rates, they may not feel under pressure to meet dead-lines the researcher sets.
At institutions with advanced degree programs, master’s anddoctoral candidates almost always need supplemental income.Graduate students can be particularly helpful in implementation(rather than design) roles, especially in areas where they may havetechnical training, such as computer programming or statisticalanalysis. However, be cautious about engaging students, even if theyhave an M.B.A. or are working on a Ph.D., to provide advice onproblem formulation and research design where seasoned experi-ence is a job requirement.
Special Assistance Available to Nonprofits
Researchers in nonprofit organizations can avail themselves of helpunavailable to others except at considerable cost. An enterprisingnonprofit researcher could tap the following sources.
Pro Bono Professionals. A selected number of professional fieldshave an ethic that encourages their members to donate their timeto voluntary service in worthy causes. For example, the nonprofitresearch director could seek help from the major accounting firms
246 MARKETING RESEARCH THAT WON’T BREAK THE BANK
21Andreasen/Ch. 11 8/11/02 3:10 PM Page 246

since they have considerable experience at massive data handling.They typically have computer programmers and statisticians onstaff and possibly specialists in report writing whom they may bewilling to lend free of charge to nonprofit organizations. An area inwhich accountants can be of special help is in archival analysis. Au-ditors take great pride in being able to delve into records to learnthe hidden secrets of an organization. They can have excellent sug-gestions on where to look for unsuspected marketing insights.
Volunteer Board Members. Key executives in the private sectorhave traditionally volunteered to serve on the boards of directors ofnonprofit organizations. While some of these board membershipsare intended more to add to the executive’s resumé or to facilitatebusiness contacts with other board members, in the main, boardmembers can be very hard workers and very helpful. In my experi-ence, nonprofit managers are much more likely to think of stockingtheir boards with politicians, lawyers, accountants, and heavyweightfundraisers rather than marketing experts. They rarely think of add-ing research experts. It may not be easy for research directors toconvince nonprofit managers of the desirability of having the headof a local multiservice marketing research agency on the board, es-pecially if he or she is seen as potentially taking the place of some-one more valuable. However, such individuals can be immenselyhelpful to the research operation. They can provide direct advicethemselves, encourage or assign their own junior staffers to providetechnical advice, and provide volunteer staff for certain tasks, ac-cess to computer equipment and software, and opportunities for piggy-backing research.
One of the most valuable roles they can serve for the researchmanager is in changing the attitudes of top management. The in-house research manager may have limited influence over the way theorganization plans and sets policy. However, an independent, experi-enced outside director trained in marketing research can keep point-ing out to top management how research can help this segmentationdecision, that new service decision, that forecasting problem, and so
ORGANIZATION AND IMPLEMENTATION ON A SHOESTRING 247
21Andreasen/Ch. 11 8/11/02 3:10 PM Page 247

on. This intervention will eventually do much to promote businessfor the research manager. At the very least, the researcher on theboard will gradually change the climate so that the in-house researchdirector’s future proposals will be better understood and appreciatedand, eventually, more often acted on.
Retired Executives. Many retired executives are eager to keep ac-tive and use their skills in work they feel is socially productive. Inthe United States, the Service Corps of Retired Executives has hada long tradition of providing government-sponsored help to smalland nonprofit enterprises. They can be wise and experienced coun-selors for researchers thinking about different ways of formulatingand researching management problems.
Acquiring Personnel
Research takes people, often a considerable number of them. It maybe preferable for management to hire outside skills for certain re-search tasks because these tasks require unusual, precise skills or because these skills can be obtained at much less cost (includinglearning time) than would be involved if the researcher tried to dothe task inside the organization. Several additional options are avail-able for low-cost or even free help.
Volunteers
Most nonprofits and some for-profits (such as hospitals) have vol-unteers available to them who work anywhere from a few to manyhours a week. These volunteers can be used for many of the low-skill research tasks described elsewhere in this book:
• Address and stuff envelopes for mail questionnaires, keeptrack of mail returns, and initiate follow-up-mailings
• Hand out or drop off self-report questionnaires
248 MARKETING RESEARCH THAT WON’T BREAK THE BANK
21Andreasen/Ch. 11 8/11/02 3:10 PM Page 248

• Carry out simple observations such as counting customersstopping at a particular display, counting cars in a competitor’sparking lot, or writing down (and later looking up the resi-dence associated with) license plates in a mall parking lot
• Transcribe archival records, such as addresses in a visitor’sguest book or information from expense account vouchers
• Clip competitive information, such as articles or advertise-ments from local newspapers or magazines
• Assist in experiments
• Do simple analyses if a computer is unavailable
With training, volunteers can be given more specialized and re-sponsible tasks, such as conducting telephone or personal interviews,coding questionnaires, carrying out experiments, or processing data.The training component is crucial. At first appearance, volunteerswould seem like the ideal low-cost resource. They are often over-educated for the tasks to which you wish to assign them. Some ofthem will be very dedicated.
Volunteers are not, however, without their costs. Those who vol-unteer often are very difficult to manage. One executive I know hassaid that he has a “rule of thirds” for volunteers: one-third work veryhard without much supervision and encouragement, one-third workif given the right incentives and directions, and one-third hardlywork at all. Part of the difficulty can be laid to the education, socialstatus, and motivation of many volunteers. Many believe that the or-ganization should be grateful for their help and so are patronizing intheir attitudes. This often leads them to disdain certain kinds of work(“Stuff envelopes! Are you kidding; I have a graduate degree in art!”).Others, because they feel they earn more elsewhere or are better ed-ucated than the research manager, may argue about the way thingsare done or go off on their own and try to do things in a better way.
For many activities (stuffing envelopes, for example) relativelypoor performance by volunteers may not matter greatly. However,
ORGANIZATION AND IMPLEMENTATION ON A SHOESTRING 249
21Andreasen/Ch. 11 8/11/02 3:10 PM Page 249

it is more often the case in research that perseverance and attentionto detail are critical in order to draw a representative sample, askunbiased questions, prove causation, or perform a precise analysis.For this reason, be careful about using volunteers unless they aretrained carefully, it is made perfectly clear to them what standardsof performance are expected, and they are told that anyone not per-forming to the extent and at the quality level the research requireswill be “fired.” Volunteers usually respond favorably to being treatedas responsible professionals who have an obligation to their organi-zation to do excellent work.
Students
Advanced students can be hired by researchers who need specificknowledge skills. Students can also serve as temporary help in car-rying out many (or all) of the day-to-day tasks on research studies.There are five academic vehicles for this:
• Case studies. Many professors in management or marketingclasses require their students to undertake a real-world case study asa term project. These may be specialized in areas like consumer be-havior or marketing research. Typically, these projects are requiredin advanced courses taken by senior undergraduates or second-yearM.B.A. students. While many students will already know what or-ganization or problem they wish to study, many are at a loss or areat least open to suggestions by a researcher who contacts them.
• Work-study programs. Some institutions have work-study pro-grams in which students attend class part of the time and work partof the time. While the low-budget researcher would have to paywork-study participants to help out on a research project, such work-ers may command relatively low wages while having a sophisticationand an intellectual interest not found in typical part-time employees.
• Independent studies. Many schools permit students alone or inteams to put together independent study projects equal to one or
250 MARKETING RESEARCH THAT WON’T BREAK THE BANK
21Andreasen/Ch. 11 8/11/02 3:10 PM Page 250

two courses. These could be defined to incorporate a specific re-search project.
• Community volunteering. Many universities have vehicles forinvolving students in communities. Some require students to vol-unteer. Some M.B.A. programs have chapters of NetImpact, whichwill undertake volunteer consulting in the community.
• Master’s and doctoral theses. Not all schools have master’s the-sis requirements anymore (they are more commonly found in Eu-rope). Master’s theses are typically less scientific and less often needto be intellectually earthshaking than do Ph.D. theses. A propermatch with the low-budget researcher’s needs may be possible. Sucha match is usually much less likely for a doctoral dissertation. Theobjective of a doctoral dissertation is to advance some scientific the-ory or perfect some methodology. In some rare cases, a doctoral stu-dent may be interested in obtaining a real-world site at which todevelop data or test a model or some methodology.
If these opportunities appeal to the low-cost researcher, the firststep in securing student help is to write a general letter to the deansof local schools of business indicating an interest in matching orga-nizational research needs and the academic needs of the school andits faculty. A brief description of the organization should be included,as well as a general overview of the kinds of projects in which theorganization would be interested. An offer should be made to visitthe school and discuss the possibilities with interested faculty. If theschool is interested (the dean will likely pass your letter on to rele-vant staff), the researcher may be asked to come by or to write amore precise description of the company and its current concernsto be circulated to potentially interested students.
As in the case of volunteers, students do not come without costs.Although they are likely to be at advanced stages of a business pro-gram, do not expect great wisdom and experience or even a greatdeal of technical competence (except for doctoral students or indi-viduals with special skills such as programming). Furthermore, thereare some disadvantages to using students:
ORGANIZATION AND IMPLEMENTATION ON A SHOESTRING 251
21Andreasen/Ch. 11 8/11/02 3:10 PM Page 251

• Students will be interested in the project because of its po-tential for learning. Thus, the researcher should be prepared towaste some time with them to educate them about the organizationand how research is carried out in the real world.
• They are not employees. Even with volunteers, the organi-zation can exert a great deal of control over what is done. With stu-dents, there has to be mutual agreement as to objectives. Managersshould be careful not to treat students as if they were employeesand, especially, not leave them to do only routine jobs. Studentswill stuff envelopes if they see it as a reasonable cost of their real-world education or if they see that organization staff members aredoing their share of the least interesting work.
• Students have other obligations. As a consequence, theymay not work as fast as the organization wants and may miss meet-ings and deadlines that are important.
• Projects will have to fit into a semester or quarter timetable(except for theses and independent study projects). Students shouldnot be expected to undertake major long-term projects.
• Students can sometimes be arrogant (especially those fromelite institutions). They will have been exposed to what their pro-fessors have been telling them are the very latest management andmarketing concepts and technology. If the researcher or organiza-tion is not using this technology or is not enthusiastic about it (or,worse still, doesn’t know about it), students may become patronizingor attempt, none too subtly, to offer enlightenment. (This is some-times also a problem working with the professors themselves.) Forthe new research manager, this may be a special problem if he or sheis still a bit insecure in using new research techniques. On the otherhand, a researcher may occasionally find the students to be adeptteachers.
Government Services and Public Librarians
To the extent the organization is seeking secondary source data,public libraries and government organizations, such as the Depart-ments of Agriculture and Commerce and the Bureau of Labor, may
252 MARKETING RESEARCH THAT WON’T BREAK THE BANK
21Andreasen/Ch. 11 8/11/02 3:10 PM Page 252

be willing to do some of the background legwork. Librarians withaccess to on-line database information retrieval systems may be ableto provide the expertise needed to cope with these systems and mayeven carry out low-cost computerized information searches for anovice researcher.
Database Research Services
If a librarian cannot help, there are a number of services that the re-searcher can pay to do secondary source analyses or carry out archi-val research, for example, providing citations to articles by and aboutcompetitors or a new technology. Some services may also provideon-line reproduction of the articles themselves.
Customer-Contact Staff
It is tempting for a researcher with a low budget who wishes to getdata from clients whom staff contact routinely to use the latter asfield survey workers. There are obvious cost savings from such a move,and one would expect staff to have rather high response rates if theywere asked to conduct formal interviews with selected clients. How-ever, in this role, staff have a number of serious disadvantages:
• They are likely to resent the assignment or request. Thismeans they may hurry the work and make major errors ofcommission and omission.
• If given latitude to select respondents, they may be expectedto make choices that are easy to survey or who will either en-hance or not detract from the staff person’s own reputation.This will make it more likely they will pick their favorite customers or those they think will give the most upbeat answers. This selection will give an upward bias to many responses, including attitudes toward the firm and, especially,attitudes toward the staff.
• The staff person may well be tempted to turn the interviewinto a promotional opportunity. This will not only bias the
ORGANIZATION AND IMPLEMENTATION ON A SHOESTRING 253
21Andreasen/Ch. 11 8/11/02 3:10 PM Page 253

immediate results, but also potentially lose the customer as apossible future research subject.
• Even if the staff person doesn’t try to promote something, thecustomer may be suspicious that he or she is being set up forsome purpose and hold back or distort answers.
This does not mean that staff cannot be trained to be effectivefield researchers. They may well see a research project as an oppor-tunity to become involved in broader planning issues and thus en-hance their skills and knowledge. However, on balance, because oftheir basic orientations, customer-contact staff should be used as in-terviewers only as a last resort. They may, however, be used to carryout observations of interest to the researcher, such as noticing whichtrade magazines are on a customer’s desk.
Personnel Department
This department can assist in hiring and training part-time person-nel and conducting evaluations of those in the research project.
Purchasing
This department can help when the researcher wishes to hire out-side suppliers for research services. Purchasing professionals canseek out alternative suppliers, establish bidding procedures, andevaluate bidding submissions at least in terms of costs and fulfill-ment of bidding requirements. They can also (along with companylawyers) prepare a contract with the supplier that ensures that theresearcher’s needs are met as required, on time, and at the lowestpossible cost.
Securing Low-Cost Samples from Outside ResearchServices
Several organizations maintain pools of respondents who have agreedin advance to participate in research studies, thus cutting non-response problems and achieving overhead efficiencies.
254 MARKETING RESEARCH THAT WON’T BREAK THE BANK
21Andreasen/Ch. 11 8/11/02 3:10 PM Page 254

National Family Opinion. This organization has a large sample poolof over 400,000 families who have agreed to return self-administeredquestionnaires without compensation. Many are contacted over theWeb and can be hired by the low-budget researcher. Since charac-teristics of the households are already known, the organization canalso construct highly controlled panels of specific kinds of householdsfor particular marketing research purposes, such as older women fora new health care program or families with young children for childcare services. (Its URL is www.nfow.com.)
Market Facts Consumer Mail Panel. This pool of 70,000 will re-spond to mail questionnaires and test products. Respondents alsokeep records over time. Market Facts’ system permits careful selec-tion of a very specific sample or several matched groups that caneach be exposed to different experimental treatments, such as dif-ferent ads, products, or even questionnaire designs. (Its URL is www.marketfacts.com/products/cmp.)
Piggybacking. Many independent survey organizations, both lo-cally and nationally, permit researchers to add (piggyback) a fewquestions onto a survey designed for other purposes. Sometimes thiscan also be done within the researcher’s own organization, wheremarketing questions can be added to research done by other depart-ments such as public relations or personnel. These other studiesshould be selected carefully to make sure the main topics don’t in-fluence marketing results.
Omnibus Surveys. A select number of research suppliers carry outstudies in which a number of organizations pool their questions ina single omnibus instrument (or series of instruments). This permitsthe participants to share overhead costs. However, it also meansthat the researcher’s questions will be mixed in with an unknownset of others, which could cause major or minor biases dependingon the particular study. The Roper Organization administers Limo-bus, which interviews two thousand adult Americans in their homes
ORGANIZATION AND IMPLEMENTATION ON A SHOESTRING 255
21Andreasen/Ch. 11 8/11/02 3:10 PM Page 255

face-to-face every month. In a 2001 ad, it claims, “Sample size, andcomposition are tailored to your needs. A simple question asked of2,000 respondents costs 90 cents per interview, asked of 1,000 re-spondents, it’s $1.10.”
Outside Computerized Databases
Several organizations make available databases comprising variouskinds of market data, Usually disaggregated at the city, census tract,or postal code level, these are often based on U.S. Census or otherdata. Specific secondary analyses can be carried out by suppliers ofthese data, or the raw data can be purchased for analysis on the re-searcher’s own computer. The PRIZM system (mentioned in Chap-ter Five) works this way.
Cooperating Businesses
One final source of personnel for research available only to non-profit organizations is the private business firm. Corporations haverecognized the significant advantages of employee volunteering onmorale and turnover. Many give employees paid time off and some-times contribute in-kind or cash resources to the nonprofit withwhich the employee volunteers. Both employees and in-kind helpcan be applied to research.
Acquiring Equipment
Low-cost research usually does not require a great deal of physicalhardware. Most equipment needs are for computers, telephones,software, and temporary facilities. The following possibilities mayhelp keep these costs low.
Focus Group Rooms
One’s own home or the company conference room or cafeteria canbe used for focus group interviews. These locales obviously can biasrespondents, and the spaces will not be equipped with the two-way
256 MARKETING RESEARCH THAT WON’T BREAK THE BANK
21Andreasen/Ch. 11 8/11/02 3:10 PM Page 256

mirrors or videotaping capabilities available in professional sites.Still, the ambience can be made very pleasant and audiotape re-cording is usually possible.
Telephones
Volunteers or staff may be willing to allow their home telephonesto be used for limited interviewing provided their costs are reim-bursed.
Computer Software
No one who wishes to undertake a continuing program of researchshould be without the following kinds of software. They are listedin decreasing order of importance.
Word Processing. Word processing software is essential for draftingproposals, writing questionnaires, developing observation protocols,or coding manuals and preparing final reports. Word processing pro-grams with mail-merge capabilities can prove especially valuable formail studies to prepare labels and write cover letters customized toeach respondent. Software capabilities to prepare tables or simplecolumns of figures are desirable features of chosen word processingsoftware.
Spreadsheet Software. Spreadsheet software such as Microsoft Ex-cel can be used to record raw data from research and perform sim-ple analyses. Most statistical software programs accept spreadsheetinput. Spreadsheet software can also be used to generate attractivetables and graphs for reports and presentations.
Statistical Software. For organizations planning a continuing re-search program, investment in a statistical package will be wellworthwhile over the long run. The most extensive statistical soft-ware packages commonly found in the major research agencies areSPSS and SAS. All are available in PC versions. However, these
ORGANIZATION AND IMPLEMENTATION ON A SHOESTRING 257
21Andreasen/Ch. 11 8/11/02 3:10 PM Page 257

systems are relatively complex and expensive, and they requiresome time to learn. The beginning researcher may want to startmore simply. Less expensive statistical packages such as Minitabcontain all of the major statistical procedures discussed in this book.
Investigate these programs to see which is most compatiblewith your organization’s system and your own orientation to com-puters. Some of the less expensive programs have limits on thenumber of cases or the number of variables per case they can han-dle, so give some thought as to what the system’s maximum capac-ity should be.
Graphics Software. Otherwise dull reports can be significantly im-proved in attractiveness and clarity through the use of effectivegraphics. A wide range of graphics software packages serves this pur-pose. Most do the standard bar and pie charts, and several producedramatic three-dimensional presentations.
Review the alternatives, in particular paying attention to label-ing capabilities and the complexity that can be obtained for relatedsets of data. Attention should also be paid to whether the graphicspackage is compatible with the organization’s word processing andstatistical software.
Desktop Publishing. Recent developments in desktop publishingoffer a wide range of capabilities for composing final documents andquestionnaires with elaborate and attractive headlines, borders, draw-ings, and flowcharts as well as the standard graphs, tables, and text.This software represents a significant advancement over early com-binations of word processing and graphics programs. Desktop pub-lishing can add considerable drama to each research report.
Other Software. Other kinds of software have also been developedthat may save time and money. There are now programs and Websites to help prepare questionnaires, develop and monitor samples,and guide and monitor telephone interviewers (as described in Chap-ter Eight).2
258 MARKETING RESEARCH THAT WON’T BREAK THE BANK
21Andreasen/Ch. 11 8/11/02 3:10 PM Page 258

Choosing Software. Each software package has its own idiosyn-crasies, so I advise researchers to take two steps. First, undertakeconsiderable investigation among friends or through published in-dependent evaluations, such as those in PC World, before makingan investment. Second, pay attention to compatibility among soft-ware systems in both style of use and interchangeability of materi-als (such as data files, tables, text, and graphs). It is frustrating toprepare a table or graph in a statistical package and then find thatit must be reentered to fit into a word processing program. The pop-ularity of integrated systems like Microsoft Office reduces this an-noying problem. Unfortunately, standard integrated programs donot yet contain very sophisticated statistical capabilities.
ORGANIZATION AND IMPLEMENTATION ON A SHOESTRING 259
21Andreasen/Ch. 11 8/11/02 3:10 PM Page 259

Notes
Chapter One
1. Amy Saltzman, “Vision vs. Reality,” Venture (Oct. 1985): 40–44.
2. Ibid.
Chapter Two
1. For further discussion of influence decisions, see Alan R. An-dreasen, Marketing Social Change (San Francisco: Jossey-Bass, 1995).
2. Philip Kotler and Alan R. Andreasen, Strategic Marketing for Non-profit Organizations, 5th ed. (Upper Saddle River, N.J.: PrenticeHall, 1995), pp. 74–78.
3. An inquisitive manager would do well in this regard to read some ofthe current popular predictions about the future environment, suchas Faith Popcorn and Adam Hauft’s Dictionary of the Future (NewYork: Hyperion Books, 2002) or Neil Howe and William Strauss’sMillennials Rising: The Next Great Generation. (New York: VintageBooks, 2000).
Chapter Three
1. Benjamin Sackmary, “Deciding Sample Size Is a Difficult Task,”Marketing News, Sept. 13, 1985, pp. 30, 33.
2. Ibid.
261
22Andreasen/Notes 8/11/02 3:11 PM Page 261

262 NOTES
Chapter Five
1. Eugene J. Webb, Donald T. Campbell, Kenneth D. Schwartz, andLee Sechrist, Unobtrusive Methods: Nonreactive Research in the SocialSciences (Skokie, Ill.: Rand McNally, 1971).
2. Lee G. Cooper and Masao Nakanishi, “Extracting ConsumerChoice Information from Box Office Records,” Performing Arts Review 8:2(1978): 193–203.
3. Bob Minzesheimer, “You Are What You ZIP,” Los Angeles Magazine(Nov. 1984): 175–192.
4. Online Access Guide 2:2 (Mar.–Apr. 1987): 44.
Chapter Six
1. Amy Saltzman, “Vision vs. Reality,” Venture (Oct. 1985): 40–44.
2. Russell W. Belk, John F. Sherry, Jr., and Melanie Wallendorf. “ANaturalistic Inquiry into Buyer and Seller Behavior at a SwapMeet,” Journal of Consumer Research 14:4 (Mar. 1988): 449–470.
Chapter Seven
1. George D. Lundberg, “MRFIT and the Goals of the Journal,” Journal of the American Medical Association, Sept. 24, 1982, p. 1501.
Chapter Eight
1. Christopher H. Lovelock, Ronald Stiff, David Cullwich, and Ira M.Kaufman, “An Evaluation of the Effectiveness of Drop-Off Ques-tionnaire Delivery,” Journal of Marketing Research 13 (Nov. 1976):358–364.
2. Much of the material from this section is drawn from Seymour Sudman, “Improving the Quality of Shopping Center Sampling,”Journal of Marketing Research (Nov. 1980): pp. 423–431.
3. Ibid.
22Andreasen/Notes 8/11/02 3:11 PM Page 262

4. Hal Sokolow, “In-Depth Interviews Increasing in Importance,”Marketing News, Sept. 13, 1985, pp. 26–27.
5. Seymour Sudman and Graham Kalten, “New Developments in theSampling of Special Populations,” Annual Review of Sociology 12(1986): 401–429.
Chapter Nine
1. L. L. Guest, “A Study of Interviewer Competence,” InternationalJournal of Opinion and Attitude Research, Mar. 1, 1977, pp. 17–30.
Chapter Eleven
1. Thomas J. Peters and Robert H. Waterman, Jr., In Search of Excel-lence: Lessons from America’s Best-Run Companies (New York:HarperCollins, 1982).
2. Ellen Burg, “Computers Measures Interviewers’ Job Performances,”Marketing News, Mar. 14, 1986, p. 36.
NOTES 263
22Andreasen/Notes 8/11/02 3:11 PM Page 263

Recommended Reading
Chapter One
Robert C. Blattberg, Rashi Glazer, and John D. C. Little. The MarketingInformation Revolution. Boston: Harvard Business School Press, 1994.
Gilbert A. Churchill, Jr. Basic Marketing Research (4th ed.). Orlando, Fla.:Harcourt, 2001.
Rohit Deshpande and Gerald Zaltman. “A Comparison of Factors Af-fecting Researcher and Manager Perceptions of Market ResearchUse.” Journal of Marketing Research 21 (Feb. 1984): 32–38.
Joshua Grossnickle and Oliver Raskin. The Handbook of Online MarketingResearch. New York: McGraw-Hill, 2001.
Jack Honomichl “Growth Stunt: Research Revenues See Smaller In-crease in ‘00.” Marketing News, June 4, 2001, pp. H3-H37.
A Web directory of market research firms can be found at www.zarden.com.
Chapter Two
Vincent P. Barraba. “The Marketing Research Encyclopedia.” HarvardBusiness Review (Jan.–Feb. 1990): 7–18.
Randall G. Chapman, “Problem-Definition in Marketing Research Stud-ies.” Journal of Consumer Marketing 6 (Spring 1989): 51–59.
Elizabeth C. Hirschman, “Humanistic Inquiry in Marketing Research:Philosophy, Method, and Criteria.” Journal of Marketing Research 23(Aug. 1986): 237–249.
265
23Andreasen/Rec 8/11/02 3:11 PM Page 265

266 RECOMMENDED READING
V. Kumar, International Marketing Research. Upper Saddle River, N.J.:Prentice Hall, 2000.
Pnenna P. Sageev. Helping Researchers Write, So Managers Can Understand.Columbus, Ohio: Batelle Press 1995.
Chapter Three
Russell I. Ackoff. The Art of Problem Solving. New York: Wiley, 1978.Howard Schlossberg. “Cost Allocation Can Show True Value of Re-
search.” Marketing News, Jan. 8, 1990, p. 2.R. Kenneth Wade. “The When/What Research Decision Guide.” Mar-
keting Research 5:3 (Summer 1993): 24–27.
Chapter Four
Alan R. Andreasen. “`Backward’ Marketing Research.” Harvard BusinessReview 63 (May-June 1985): 176–182.
Lawrence D. Gibson. “Defining Marketing Problems—Don’t Spin YourWheels Solving the Wrong Puzzle.” Marketing Research 10:1 (Spring1998): 5–12.
Chapter Five
Diane Crispell. The Insider’s Guide to Demographic Know How. Burr Ridge,Ill.: Irwin, 1992.
Lorna Daniels. Business Information Sources. Berkeley: University of Cal-ifornia Press, 1985.
J. H. Ellsworth and M. V. Ellsworth. The Internet Business Book. New York:Wiley, 1996.
Gale Directory of Databases. Detroit, Mich.: Gale Research 1996.Gordon L. Patzer. Using Secondary Data in Marketing Research: United
States and Worldwide. Westport, Conn.: Quorum Books, 1995.David W. Stewart and Michael A. Kamins. Secondary Research: Informa-
tion Sources and Methods (2nd ed.). Thousand Oaks, Calif.: Sage,1993.
23Andreasen/Rec 8/11/02 3:11 PM Page 266

Chapter Six
Paula Kephart. “The Spy in Aisle 3.” American Demographics MarketingTools Supplement. (May 1996): 16, 19–22. [http://www.marketingtools.com/publications/MT/96_mt/9605MD04.htm].
Lee Sechrest. New Directions for Methodology of Behavioral Science: Unob-trusive Measurement Today. San Francisco: Jossey-Bass, 1979.
Chapter Seven
Bobby J. Calder, Lynn W. Phillips, and Alice M. Tybout. “The Conceptof External Validity.” Journal of Consumer Research 9 (Dec. 1992):240–244.
Donald T. Campbell and Julian C. Stanley. Experimental and Quasi-Experimental Design for Research. Skokie, Ill.: Rand McNally 1963.
Geoffrey Keppel. Design and Analysis: A Researcher’s Handbook (2nd ed.).New York: Freeman, 1995.
Douglas C. Montgomery. Design and Analysis of Experiments. New York:Wiley, 1991.
Chapter Eight
James H. Frey and Sabine Mertens Oishi. How to Conduct Interviews byTelephone and in Person. Thousand Oaks, Calif.: Sage, 1995.
Laurence N. Gold. “Do-It-Yourself Interviewing,” Marketing Research 8:2(Summer 1996): 40–41.
Thomas L. Greenbaum. The Handbook of Focus Group Research (2nd ed.).Thousand Oaks, Calif.: Sage, 1998.
Richard A. Kreuger. Focus Groups: A Practical Guide for Applied Research.Thousand Oaks, Calif.: Sage, 1994.
Richard L. Schaeffer and William Mendenhall. Elementary Survey Sam-pling (5th ed.). Belmont, Calif.: Wadsworth, 1996.
Chapter Nine
William Bearden, Richard Netemeyer, and May Ann Mobley. Handbookof Marketing Scales. Thousand Oaks, Calif.: Sage, 1993.
RECOMMENDED READING 267
23Andreasen/Rec 8/11/02 3:11 PM Page 267

268 RECOMMENDED READING
Gilbert A. Churchill, Jr. “A Paradigm for Developing Better Measures ofMarketing Constructs.” Journal of Marketing Research 16 (Feb. 1979):64–73.
Arlene Fink. How to Ask Survey Questions. Thousand Oaks, Calif.: Sage,1995.
Seymour Sudman and Norman M. Bradburn. Asking Questions: A Practi-cal Guide to Questionnaire Design. San Francisco: Jossey-Bass, 1982.
Chapter Ten
L. Bruce Bowerman and Richard T. O’Connell. Linear Statistical Models:An Applied Approach. Boston: PWS-Kent, 1990.
Wayne W. Daniel. Applied Nonparametric Statistics. Boston: PWS-Kent,1990.
Joseph F. Hair, Jr., Rolph E. Anderson, Ronald L. Tatham, and WilliamC. Black. Multivariate Data Analysis (5th ed.). Upper Saddle River,N.J.: Prentice Hall, 1998.
John A. Ingram and Joseph G. Monks. Statistics for Business and Econom-ics. San Diego, Calif.: Harcourt Brace Jovanovich, 1989.
Short articles on various measurement and analysis tools are available atwww.marketfacts.com/publications.
Chapter Eleven
Lee Adler and Charles S. Mayer. Managing the Marketing Research Func-tion. Chicago: American Marketing Association, 1977.
Paul Boughton. “Marketing Research Partnerships: A Strategy for the‘90s.” Marketing Research 4 (Dec. 1992): 8–13.
William D. Neal. “The Marketing Research Methodologist.” MarketingResearch 10:1 (Spring 1998): 21–25.
John Russell. Strategic Database Management. New York: Wiley, 1996.
23Andreasen/Rec 8/11/02 3:11 PM Page 268

A
Accounting department, 245Accretion physical traces, 110–111ACORN system, 94ActivMedia Research, 154Advertising department, 245Affordable (or residual) approach, 45–46After measure with control design,
127–128allnetresearch.internet.com, 93American Demographics Web site, 92Ameritrade Web site, 93Analysis of variance: ANOVA one-way,
220–221, 223t; multivariate, 232; N-way ANOVA, 221, 222t–224
Answer order bias, 192Archives: using external, 89–105; using
internal, 77–78; reducing researchcosts by using, 76–77
Arithmetic mean, 206, 207Association measures: multiple regres-
sion in metric data, 225fig–227; Pear-son correlation coefficient, 224–225;simple correlations in metric data,225; Spearman’s rank-order correla-tion, 224
Average Returns for Direct Mail Experi-ment, 134t
B
B coefficients, 227Backward marketing research: proce-
dural steps in, 63–64fig; step 1: deter-
mining decisions to be made, 65–66;step 2: determining informationneeded for decision, 66–67; step 3:preparing prototype report, 67–69t,68t; step 4: determining analysisneeded, 70; step 5: deciding on studyquestions to be asked, 70; step 6:checking if data already exists, 70;step 7: designing the sample, 71; steps8–9: reverting to traditional forwardapproach, 71; steps 10–11: complet-ing research follow through and evaluation, 71
Before/after measures with control design, 128–132
Beta coefficients, 227Biases: answer order, 192; controlling
mall intercepts interviewer selection,165–166; controlling mall interceptssampling, 164–165; generalization,196–197; monitoring face-to-face in-terviewing, 158; question order, 191–192; respondent-induced, 188–190;scaling, 192–194; in simple experi-ment design, 132–133. See alsoRespondents
Bimodal, 207Brady, P., 2, 17–19BRS Wormation Technologies, 99Budget setting: affordable or residual
approach to, 45–46; decision-based,48–55; free market or delegated ap-proach to, 46–47; other factors toconsider in, 47–48; percentage-of-sales pseudoequity approach to, 44–45
Index
269
24Andreasen/Index 8/11/02 3:11 PM Page 269

C
Callaghan, K., 109Central tendency, 205–207Channels, descriptive information about,
28Charles Schwab Web site, 93Chi square test: caveats for using,
217–218; comparing nominal data to given distribution using, 214–216;cross-tabulations using, 216–217; statistical analysis using, 213–218
Cluster analysis, 229CNN Financial News Network Web site,
93Coding errors, 183–186Coke/Pepsi experiment, 137Collaborative research: with competitors,
238–239; with other partners, 239;with trade associations/universities,239
Communication behavior, 102–103Competitive intelligence, 100Competitors: advertising expenditures of,
102; descriptive information about, 28;joint research projects with, 238–239
Complaint records, 85–87Complex experimental designs, 133–136CompuServe, 99Computer software: additional kinds of,
258; choosing, 259; desktop publish-ing, 258; graphics, 258; spreadsheet,257; statistical, 257–258; word processing, 257
Computer survey databases, 176–177, 256Computerized data collections, 88Confidence interval, 211Conjoint analysis, 231–232Constricting questions, 196Contact reports, 84Continuing observations, 108–109Convenience experimentation, 169–170Convenience sampling: depth interview-
ing with, 170–171; described, 168; experimentation with, 169–170; pro-jectable, 169; qualitative researchwith, 170
Cost of uncertainty, 54Counting observations, 109–110CPSC (U.S. Consumer Product Safety
Commission), 87Cross-tabulations, 216–217
Customer-contact staff, 253–254Customers: analyzing postal code loca-
tions, 84; analyzing sales invoices/refunds to, 83–84; budget setting andrelations with, 48; descriptive informa-tion about, 27; records on complaintsby, 85–87; records on inquiries/comments by, 87–88
D
Data: using archives to gather, 77–78; using external archives, 89–105; input,201–204; from internal measurable,85–88; from internal measuredrecords, 78–85; interval, 203–204t;from IT (information technology)center, 88–89; metric, 218–227; nomi-nal, 202, 204t, 213–218; normalizationof, 211; using observations, 76–77; ordinal, 202, 204t, 224; ratio, 203–204t. See also Observations; Statistics; Validity
Data entry errors, 182–183Database computer survey, 176–177, 256Database research services, 253Databases: computer survey, 176–177;
external measured records from on-line, 98–101; instead of Personnel acquisition, 256; LEXIS-NEXIS, 92,100; outside computer survey, 256;personnel acquisition using, 253;PRIZM system, 94, 95t–97t, 256
Debriefing, 139Decision framework: descriptive informa-
tion and, 27–28, 30; explanatory information and, 31; predictive infor-mation and, 31–32; research planningprocess, 26fig; three dimensions of,25–27
Decision opportunity, 42. See alsoResearch opportunity
Decision rules: avoiding going for broke,51; avoiding playing it safe, 51–52; described, 51
Decision structuring: considering priorprobabilities, 50; estimating expectedoutcomes, 50; five major characteris-tics of, 49; setting decision rules,51–52; setting realistic decision alter-natives, 49; specifying decision envi-ronment, 50
270 INDEX
24Andreasen/Index 8/11/02 3:11 PM Page 270
Decision theory, 50Decision-based research budgeting: addi-
tional factors to consider in, 55; described, 48–49; determinants of cost of uncertainty and, 54; imperfectresearch and, 54–55; simplified exam-ple of, 52–54; structuring decision in, 49–52
Degrees of freedom, 215–216Delegated (or free market) approach,
46–47Delphi study, 150Demand effect, 138Depth interviewing, 170–171, 196Descriptive information, 27–28, 30Descriptive statistics: central tendency
and, 205–207; described, 199, 204–205; measures of dispersion and,208–211
Desktop publishing, 258Dialog Company Web site, 93DIALOG Information Services, 99Digital cameras, 113DioLight Technology, 109Direct mail experiment, 133–136, 134tDiscriminant analysis, 229–230Discriminant function, 230Doctoral theses projects, 251Dow Jones and Company Web site, 92Dow Jones News/Retrieval, 100Doyle, A. C., 111Dun & Bradstreet Web site, 93
E
E-Trade Web site, 93East Path, 12Economic/social conditions: descriptive
information about, 30; explanatory information on, 31
Egroups Web site, 93Electronic eyes, 113Electronic observations, 111–113Episodic observations, 108–109Equipment acquisition: of computer soft-
ware, 257–259; of focus group rooms,256–257; of telephone services, 257
Erosion physical traces, 110–111Expected outcomes estimates, 50Experimental designs: after measure with
control, 127–128; before and aftermeasures with control, 128–132; biases
in simple, 132–133; complex,133–136; overview of, 123–126; requirements of, 126
Experimentation: convenience, 169–170;design for, 123–126; four major virtuesof, 120; internal or external validity of,124, 136; laboratory, 136–138; makingit easy, 138–139; overcoming one-best-strategy to use, 121–123; pros of, 120–121; pseudoexperiments vs.,80–83, 125, 126; role of, 119; test marketing as real-world, 120; three requirements of true, 126; types of,126–127
Explanatory information, 31External archives: external measured
records, 89–101; measurable, 102–105External measured records: data in sec-
ondary sources, 89–90; on-line data-bases, 98–101; predigested secondarysources, 90–92; syndicated services,92–98
External political necessity, 48External validity, 124, 136
F
F ratio, 221Face-to-face interviewing: advantages/
disadvantages to, 156–158; focusgroups and, 159–163; techniques increasing efficiency of, 159
Factor analysis, 228–229Federal government data sources, 90–92Fidelity Investments Web site, 93Financial resources: approaching immedi-
ate superiors for, 237–238; approach-ing other organization divisions for,238; exploring additional, 235; jointprojects with competitors as, 238–239;joint projects with trade associations/universities, 239; needed for extendedresearch program, 236e–237e; throughother partners, 239
Find/SVP Web site, 93Focus group rooms, 256–257Focus groups: described, 159–160; desir-
able features of, 160–161; guidelinesfor, 161–163
Forrester Web site, 93ForumOne Web site, 93Forward research design, 62fig
INDEX 271
24Andreasen/Index 8/11/02 3:11 PM Page 271

Free market (or delegated) approach,46–47
G
Generalization biases, 196–197Going for broke decision rule, 51Google (search engine), 92, 105Government data sources, 90–92Government service personnel, 252–253Graphic scales, 194Graphics software, 258
H
Hair, J. F., Jr., 228Helicon Group, 101Herzog, F., 78, 79Holmes, Sherlock (fictional character), 111Hypothetical Experimental Research Re-
sults: After-Only with Control, 128tHypothetical Experimental Research Re-
sults: Before-After with Control, 129tHypothetical Results of Enrollment, 130tHypothetical Sales Results Before and
After Discount, 68tHypothetical Sales Results Under Three
Pricing Strategies, 69t
I
In-depth interviewing, 170–171, 196Individual transaction records, 83–84Inference problems, 116–117InfoMagic, 100Information: descriptive, 27–28, 30;
explanatory, 31; needed for decision,66–67; predictive, 31–32
InfoService, 100Input data: described, 201; interval and
ratio, 203–204; nominal, 202; ordinal,202
Interaction effects, 133Internal archives, 77–78Internal measurable data: complaint
records, 85–87; inquiries and com-ments, 87–88; miscellaneous, 88
Internal measured records: contact reports, 84; individual transactionrecords, 83–84; miscellaneous records,84–85; pseudoexperiments, 80–83;sales reports, 78–80
Internal political necessity, 48Internal validity, 124Internet research survey design, 153–154Interquartile range, 208Interval data, 203–204tInterviewer-induced error, 186–188Interviews: computer-driven, 175; con-
trolling selection of mall intercepts,165–166; convenience sampling anddepth, 170–171; face-to-face, 156–163; telephone, 154–156; threateningquestions and in-depth, 196. See alsoRespondents
I.P. Sharp Associates, 100Iron Law of the Percentage, 44, 45IT (information technology) center,
88–89, 245
J
Judgment sampling, 171–172
K
Kalten, G., 173Kinnear, T. C., 30Knowledge acquisition: exploring re-
sources for, 240; special assistanceavailable to nonprofit, 246–248;through colleges/universities,245–246; through manager’s own organization, 240, 245
L
Laboratory experiments, 136–138Level of significance, 212–213LEXIS-NEXIS databases, 92, 100Librarians, 252–253Lifestyle study example, 65–66Likert scales, 193Limobus, 255–256Long-range planning department, 245Low-budget managers: acquiring knowl-
edge on a shoestring, 240, 245; acquir-ing personnel, 248–256; approachingcompetitors for joint projects,238–239; approaching immediate superiors for resources, 237–238; approaching organization divisions forresources, 238; decision framework for,25–32; decision opportunity and, 42;
272 INDEX
24Andreasen/Index 8/11/02 3:11 PM Page 272

descriptive information gathered by,27–28, 30; predictive informationgathered by, 31–32; research priestsand, 5. See also Managers
Low-cost research: exploring acquiringequipment for, 256–259; exploring financial assistance resources for,235–237e; exploring knowledge acqui-sition resources for, 240–248; explor-ing personnel acquisition for, 248–256
Low-cost research techniques: usingarchives and observations, 76–78; using external archives, 89–105; usinginternal measurable data, 85–88; usinginternal measured records, 78–85; using IT (information technology)centers, 88–89; looking for solutionsusing, 75–76; using low-cost experi-mentation, 119–141; using low-costsurvey designs, 142–177; using obser-vation, 107–118. See also Researchprojects
Low-cost sampling, 158–159Low-cost survey design: as alternative to
traditional surveys, 142–144; alterna-tives for asking questions, 174–177; using convenience sampling, 168–171;using focus groups for, 159–163; usingjudgment sampling, 171–172; usinglow-cost sampling, 158–159; usingmall intercepts for, 164–166; quotasampling, 167–168; using sequentialsampling, 173–174; using snowball/network sampling, 172–173
M
Magic Percentage, 45Mail follow-up approach, 22–24Mail studies: cover letter sent with,
152–153; personal drop-off/pick-uprecommendation for, 153; question-naires of, 144–153
Main effects, 133, 134Mall intercepts: controlling for inter-
viewer selection bias, 165–166; con-trolling sampling frame bias, 164–165;described, 164
Managers: example of simple researchproblem facing, 52–54; explanatory information gathered by, 31; fear of
statistics by, 198–201; intelligencegathering by, 105; overcoming one-best-strategy mentality of, 121–123;participation in prototype report by,69; perception of the statistical resultsby, 213; reasons to move forward withresearch, 11–13. See also Low-budgetmanagers
MANOVA (multivariate analysis of variance), 232
Mark Taper Forum, 80Market Facts Consumer Mail Panel, 255Marketing department, 245Marketing research: backward, 63–71,
64fig; by 435 companies (1988, 1997),29t–30t; low-budget manager and, 5.See also Marketing research projects
Marketing research myths: “I’m alreadydoing enough research,” 6–7; “losingcontrol,” 8–9; “market research is sur-vey research,” 9; “market research istoo expensive,” 10; “most research is a waste,” 10–11; overcoming the,3–4; “research is only for big deci-sions,” 7–8
Marketing research opportunities: learn-ing to look for, 24–25; procedure forsystematically identifying, 37–38; rec-ognizing, 38–42. See also Decision opportunity
Marketing research planning process: de-cision framework for, 25–28, 26fig,30–32; framework for beginning, 25;future cycles of, 36–37; getting startedwith the, 32–33; preparing first re-search plan, 33–34; prioritizing, 34–36
Marketing research problem: example ofsimple, 52–54; framing the, 19–21;payoff decision table used for hypo-thetical, 53t; process of acquiringknowledge about, 240, 245
Marketing research program: conse-quences of not planning a, 17–19; decision framework for, 25–32; frame-work for beginning research planning,25; framing the research problem,19–21; looking for opportunity, 24–25;motivation study prior to planning,21–22; resources needed for extended,236e–237e; telephone study prior toplanning, 22–24
INDEX 273
24Andreasen/Index 8/11/02 3:11 PM Page 273

Marketing research project evaluation:decision-based research budgeting and,48–55; setting budgets, 43–48; whento resist research based on, 56–59
Marketing research projects: acquiringknowledge on a shoestring on, 240,245; dealing with imperfect studies in,54–55; done jointly with competitors,238–239; financial assistance for,235–237; forward research design,62fig; how it goes wrong, 61–63; otherpartners in, 239; prioritizing/rankingof, 34–36, 35t; recognizing opportuni-ties for, 38–42; setting budgets for,43–48; when to resist, 56–59. See alsoBackward marketing research; Low-cost research techniques; Marketingresearch
Marketing research services: database,253; outside, 254–256; syndicated,92–98
Marketing system performance, 30Master’s theses projects, 251McKenzie, A., 78–79Mead Data Central (MEDIS), 92, 100Mean, 206, 207Measurable external archives: communi-
cation behavior and, 102–103; com-petitors’ advertising expenditures, 102;other kinds of intelligence gathering,104–105; public/semipublic records,103–104
Measures of dispersion, 208–211Measuring observations, 110–111Mechanical observations, 111–113Median value, 206, 207Metric data: analysis of variance and,
220–224, 232; association betweennonmetric and, 224–227; multiple regression in, 225fig–227; simple corre-lations in, 225; t (or parametric) testused for, 218–220
Microsoft Excel, 257Microsoft Office software, 259Minitab, 258Miscellaneous records, 84–85Modal value, 205MOSAIC system, 94, 98Motivation study, 21–22MRFIT study, 133Multidimensional scaling, 230–231Multimeasure multitrait technique, 117
Multiple regressions, 225fig–227Multivariate analysis of variance
(MANOVA), 232Multivariate Data Analysis (Hair et al.), 228Multivariate techniques: cluster analysis,
229; conjoint analysis, 231–232; dis-criminant analysis, 229–230; factoranalysis, 228–229; MANOVA (multi-variate analysis of variance), 232; multidimensional scaling, 230–231
N
N-way ANOVA, 221, 222t–224National Family Opinion, 255Natural observations: controlling quality
of, 116–118; counting, 109–110;episodic or continuing, 108–109; measuring, 110–111; mechanical orelectronic, 111–113; seeking patternsin, 113–116
Naysayers, 190Network sampling, 172–173New Coke, Old Coke, Pepsi experiment,
137NewsNet, 100NEXIS-LEXIS databases, 92, 100Nominal data: comparison to given distri-
bution, 214–216; cross-tabulations of, 216–217; degrees of freedom and,215–216; described, 202; examples of,204t; statistical analysis/chi square testof, 213–218
Nonrespondents, 146–147, 149Normalization of data, 211Nua Internet Surveys, 153, 154Null form, 212–213
O
Observational sampling, 117–118Observations: characteristics of system-
atic, 108; collecting natural, 108–116;controlling quality of natural,116–118; counting, 109–110; creatingopportunity for, 107–108; data gather-ing through, 76–77; episodic or con-tinuing, 108–109; measuring, 110–111; mechanical or electronic, 111–113; seeking patterns in natural, 113–116. See also Data
Omnibus surveys, 255–256
274 INDEX
24Andreasen/Index 8/11/02 3:11 PM Page 274

On-line databases, 98–101One-best-strategy mentality, 121One-way analysis of variance (ANOVA),
220–221, 223tOpti-Market Consulting, 154Ordinal data, 202, 204t, 224Organizations: exploring financial assis-
tance resources by, 235–239; fifty topresearch (1999), 241t–244t;internal/external political necessityand, 48; joint projects between divi-sions of, 238; process of acquiringknowledge within, 240, 245; researchcollaboration by, 238–239; special assistance available to nonprofit,246–248
Outside research services: using computer-ized databases, 256; from cooperatingbusinesses, 256; purchasing, 254; se-curing low-cost samples from, 254–256
P
Payoff decision table, 53tPBS (Public Broadcasting System), 38–42PC World, 259Pearson correlation coefficient, 224–225Percentage-of-sales pseudoequity ap-
proach, 44–45Perceptual map, 231Personnel acquisition: of customer-con-
tact staff, 253–254; government ser-vices/public librarians, 252–253;outside computerized databases insteadof, 256; personnel department for, 254;purchasing outside suppliers, 254; se-curing low-cost samples from outsideresearch services, 254–256; students,250–252; through cooperating busi-nesses, 256; through database researchservices, 253; volunteers, 248–250
Physical traces, 110–111Piggybacking questionnaires, 255Playing it safe decision rule, 51–52Pneumatic traffic counters, 113Political necessity, 48Polygon, 12Precoding, 183–186Predictive information, 31–32Predigested secondary sources, 90–92Prior probabilities, 50PRIZM system, 94, 95t–97t, 256
Pro bono professionals, 246–247Projectable convenience samples, 169Prototype report, 67–69t, 68tPseudoexperiments, 80–83, 125, 126Public librarian personnel, 252–253Public relations department, 245Public/semipublic archival records,
103–104
Q
Qualitative research, 170Quality control department, 245Quality of observations: guidelines for
accuracy of, 118; problems of collec-tion, 117–118; problems of inference,116–117
Question order bias, 191–192Questionnaire design, 190–191Questionnaires: coding errors on,
183–186; computer-driven interviewsalternative to, 175; constricting ques-tions on, 196; cost-or-returned vs. traditional mail, 153; difficulties in designing, 143–144; mail studies,146–153; methods of asking questionsin, 145–146; nonrespondents to,146–147, 149; other alternatives to,174–177; piggybacking, 255; self-administered, 174–175; skip patternsin, 175; survey design decisions regrad-ing, 144–145; threatening questionson, 195–196; validity and design of,190–191. See also Respondents
Quota sampling, 167–168
R
Random digit dialing approach, 156Ratio data, 203–204tRefund slips analysis, 84Residual (or affordable) approach,
45–46Resisting research projects, 56–59Respondents: computer-driven interview,
175; naysayers and yeasayers, 190;nonresponse by, 146–147, 149; precod-ing for, 183–186; threatening ques-tions and, 195–196; validity and biasof, 188–190. See also Biases; Inter-views; Questionnaires
Retired executives, 248
INDEX 275
24Andreasen/Index 8/11/02 3:11 PM Page 275

RFP (Request for Proposal): bidding on a, 47; to help prioritize projects, 35
Rhetorical necessity, 48Roper Organization, 255–256Rott, A. R., 30“Rule of thirds” for volunteers, 249
S
Sales invoices analysis, 83Sales reports, 78–80Sales Results of Hypothetical Experiment,
222tSampling: controlling bias of mall inter-
cepts, 164–165; convenience,168–171; judgment, 171–172; low-cost, 158–159; quota, 167–168;sequential, 173–174; simple random,158–159; snowball and network,172–173; stratified, 159
Scaling bias, 192–194Screening, 172–173SDC/ORBIT, 100Secondary sources: predigested, 90–92;
raw data in, 89–90; syndicated servicesfor, 92–98
Secretarial/word processing department,245
Self-selection strategy, 66Semantic differential, 193–194Sequential sampling, 173–174Service Corps of Retired Executives, 248Sigma, 209Simple experiment designs: after measure
with control, 127–128; before and after measures with control, 128–132;biases in, 132–133
Simple random sampling, 158–159Skip questionnaire patterns, 175Snowball sampling, 172–173Sokolow, H., 170–171The Source, 100Spearman’s rank-order correlation,
224Spreadsheet software, 257Standard deviation, 199, 208–209Standard error, 199, 209–211Stapel scale, 194States of nature, 50Statistical analysis: association measure-
ments used in, 224–227; described,
211–212; levels of significance and,212–213; of metric data, 218–227;multivariate techniques used in,227–232; of nominal data, 213–218
Statistical software, 257–258Statistical testing, 199–200Statistics: descriptive, 199, 204–211; fear
of, 198–201; input data and, 201–204;statistical testing and descriptive,199–200. See also Data
Stratified sampling, 159Student case study projects, 250Student community volunteering, 251Student independent studies, 250–251Student personnel, 250–252Student work-study programs, 250Sudman, S., 173Survey designs: face-to-face interviewing,
156–158; Internet research, 153–154;mail studies, 146–153; methods of ask-ing questions and, 145–146; telephoneinterviewing, 154–156; three basic,144–145
Survey research: cost and difficulty of,142–143; forming appropriate ques-tions for, 143–144; piggybacking onto,255; three basic strategic designs,144–158
Syndicated data services, 92–98Systematic observation. See Observations
T
t (or parametric) test: for dependent mea-sures, 220e; described, 218; for inde-pendent measures, 218–220
Telephone interviewing: advantages of,154–155; disadvantages of, 155–156;random digit dialing approach to, 156
Telephone services/equipment, 257Telephone studies, 22–24Telescoping distortion, 190Test marketing, 120Testing regression coefficients, 220eThreatening questions, 195–196Thurstone scales, 193Time distortion problem, 189The Top Fifty U.S. Research Organiza-
tions (1999), 241t–244tTopica Web site, 93
276 INDEX
24Andreasen/Index 8/11/02 3:11 PM Page 276

U
UCLA (University of California at LosAngeles), 40
United Way of America, 228, 229, 230Universities: acquiring personnel via stu-
dents of, 250–252; available consult-ing/knowledge acquisition using, 245–246; research collaboration with, 239
U.S. Bureau of the Census, 90, 190–191U.S. Consumer Product Safety Commis-
sion (CPSC), 87USA Data Web site, 93
V
Validity: answer order bias and, 192; cod-ing errors and, 183–186; constrictingquestions and, 196; data entry errorsand, 182–183; difficulties associatedwith, 181–182; generalization biasesand, 196–197; internal and external,124, 136; interviewer-induced errorand, 186–188; question order bias and,
191–192; questionnaire design and,190–191; respondent-induced biasand, 188–190; scaling bias and,192–194; threatening questions and,195–196. See also Data
Videotape recorders, 113Volunteer board members, 247–248Volunteer personnel, 248–250
W
Wall Street Transcript, 105Web sites: government data sources using,
91–92; programmed to record items/information, 113; syndicated service,92–98
Weighted average expected payoff, 53t–54Word processing software, 257
Y
Yahoo!, 92Yeasayers, 190YMCA planners, 230–231
INDEX 277
24Andreasen/Index 8/11/02 3:11 PM Page 277


