
Alan Monroe, Alan D. Monroe-Essentials of Political Research (2000)
215
-
Upload
cristhian-uribe -
Category
Documents
-
view
342 -
download
31
Transcript of Alan Monroe, Alan D. Monroe-Essentials of Political Research (2000)

8/20/2019 Alan Monroe, Alan D. Monroe-Essentials of Political Research (2000)
http://slidepdf.com/reader/full/alan-monroe-alan-d-monroe-essentials-of-political-research-2000 1/214

8/20/2019 Alan Monroe, Alan D. Monroe-Essentials of Political Research (2000)
http://slidepdf.com/reader/full/alan-monroe-alan-d-monroe-essentials-of-political-research-2000 2/214

8/20/2019 Alan Monroe, Alan D. Monroe-Essentials of Political Research (2000)
http://slidepdf.com/reader/full/alan-monroe-alan-d-monroe-essentials-of-political-research-2000 3/214
Essentials of Political
Science
j a n ~ e sA&. hu rb er , A&rnericanUniversity, Ecfitor
T h e Essentials of Pcllitical Science Series will present
faculty
a n d
s tudent s with co ~lc isc exts designcrf as p rir r~ er s or a given col lege
course, Many
will
be
200
pages
or
shorter. Each will cover core concepts
central
to
mastering
the
topic un de r scutly, I> ra w ing
on
their reaching as
well as
research cxgericnccs , the authors present narra t ive and
analytical treatments designecf to fit well within the conf?-ines
of
a
crt~wtlecJ ourse syl'iabrts.
Essentials c?fAmericun Gover12ment,
I>avid AMcKay

8/20/2019 Alan Monroe, Alan D. Monroe-Essentials of Political Research (2000)
http://slidepdf.com/reader/full/alan-monroe-alan-d-monroe-essentials-of-political-research-2000 4/214
Essentia
RESEARCH
A Menlber of
the
Perseus Books Group

8/20/2019 Alan Monroe, Alan D. Monroe-Essentials of Political Research (2000)
http://slidepdf.com/reader/full/alan-monroe-alan-d-monroe-essentials-of-political-research-2000 5/214
All rights reserved. fjrinted in the United Scates of America.
No
part of rhis
publication may be reproduced or transmitted in any form or by any means,
electronic or mechanical, inctudirzg phott~copy?ecording, or any information
sttlrage and retrieval systern, without permission in writi~lgrom the putllisber,
Copyri&t 000 by Westview 13ress, A Member of the 13erseusBooks Group
13ublished in 2000 in the United Stares of Ainerira by Wesrview Press, 5SUIl
Central Avenue, Boulder, Colorado 80301-2877, and in the United Kingdom
by Wesrview Press, 12
Hid's
Copse Road, Cumnor
Hill,
Clxford
OX2 9JJ
Find us on the W<>rIdWide Web at ww.westviewprerssorn
L,lkrary of C:ongress Caratoging-in-Publicatic~nData
Monroe, Alan D.
Essentials of politicaI research / AIan 19. Monroe.
p.
em
-
Essentials of political science)
Includes biograpl~ical eferences and index.
ISBN 0-8 133-6866-V(pbk.1
1.
Political science-Research.
2.
fjolirical science-Methodology I. Tide.
11. Series.
The paper used in this publication meets the requirements of the American
National Standard for Permanence of Paper for Printed
Library Materials
239.48-1984.

8/20/2019 Alan Monroe, Alan D. Monroe-Essentials of Political Research (2000)
http://slidepdf.com/reader/full/alan-monroe-alan-d-monroe-essentials-of-political-research-2000 6/214
For Paula, Ill'elissa, and Mollie

8/20/2019 Alan Monroe, Alan D. Monroe-Essentials of Political Research (2000)
http://slidepdf.com/reader/full/alan-monroe-alan-d-monroe-essentials-of-political-research-2000 7/214
This page intentionally left blank
8/20/2019 Alan Monroe, Alan D. Monroe-Essentials of Political Research (2000)
http://slidepdf.com/reader/full/alan-monroe-alan-d-monroe-essentials-of-political-research-2000 8/214
Contents
List of Tables izzd
Figures
Preface
1
The
Scienrific
Study of Research Questiians
1
What Does It Mean to Be Scientific?,
2
Distinguishing Empirical and Normative Questioils, 3
Reformulating Norm ative Questions
as
Empiricill,
6
Research Q t~estion s,
The Scietltific Research Process,
10
Exercises,
12
Suggested Answers to Exercises, 23
2
Building
Blocks
of
the Research Process
Theories, Hypotheses,
and
Operational
Definitions:
An
Overview,
'7
Types
of
I-Iypotheses, 19
Theoretical Role, 20
Units of Analysis,
22
Operational D efinitions,
25
Exercises,
28
Suggested Answers to Exercises,
29
3
Research
Design
The Concept
of
Causality, 31
Types af Research Design, 32.
Exercises, 4 3
Suggested Answers t o Exercises, 4 4
8/20/2019 Alan Monroe, Alan D. Monroe-Essentials of Political Research (2000)
http://slidepdf.com/reader/full/alan-monroe-alan-d-monroe-essentials-of-political-research-2000 9/214
4 Published Data
Sources
The Xnternet as
Data
Source,
48
The X~nyortance f Units of Analysis,
48
Strategies for Finding Data Sources,
SO
Some Genera1 Data Sources,
S2
Dem ographic Da ta, 52
Political and Governm ental Data for N atioils,
54
Data
x1
U,S, Government
and
Po itics,
S4
Survey Data ,
5'7
Co nten t Analysis,
SS
Steps
in
Content Analysis,
S9
lssues in Co nten t Analysis,
44
Exercises,
64
Suggested Answ ers t o Exercises, 65
5 Survey Research
Sampling,
67
Interviewing, 71
Writing Survey Items, 73
Exercises,
78
Suggested Answ ers t o Exercises,
79
Levels of Measurement,
83
Uilivariate Statistics,
90
The Concept
of
Relationship,
92
Multivatriate Statistics,
98
Exercises, 180
Suggested Answ ers t o Exescises, 102
7
Graphic Display
af
Data
Graph ics far Univariate Distributions,
106
Graphics for Muftivariate Relationships, l U7
H ow N ot to Lie with Grapl-rics,
1 OS)
The Need far Standardization, 112
Principles
for
Good Graphics,
1 13
Exercises,
1
1
Suggested A nswers to Exercise A,
116
8/20/2019 Alan Monroe, Alan D. Monroe-Essentials of Political Research (2000)
http://slidepdf.com/reader/full/alan-monroe-alan-d-monroe-essentials-of-political-research-2000 10/214
8
Nominal and Ordinal Statistics
Correlations for
No~ninal
Variables,
1 1
7
Correlations for Ordinal Variables,
20
Chi-Square; A Significance Test,
124
Additional Correlations for Nominal Variables, 130
Interpreting Contingency Tables Using Statistics,
1 33
Exercises,
135
Suggested Answers to Exescises, 136
9
Interval Statistics
The Regression Line,
1
4 l
Pearson"
r,
I44
Nonlinear
Relationships, 147
Relationships Between Interval and
Nominal Variables,
" 1 1
Exercises, 15
Suggested Answers to Exercises, 153
10 MuXtivariate Statistics
Coxztrolling
with
Corztingeliicy Tables, 1 59
What Can Happen When You Control, 160
Controlling with Ilntervali Variables:
Partial Correiations, 167
The Multiple Correlation, 173
Significance Test for
R"
176
Beta WeigI~ts,177
Causal Interpretation, 178
Exercises, 186
Suggested Answers to Exescises,
190
References
I n d a

8/20/2019 Alan Monroe, Alan D. Monroe-Essentials of Political Research (2000)
http://slidepdf.com/reader/full/alan-monroe-alan-d-monroe-essentials-of-political-research-2000 11/214
This page intentionally left blank

8/20/2019 Alan Monroe, Alan D. Monroe-Essentials of Political Research (2000)
http://slidepdf.com/reader/full/alan-monroe-alan-d-monroe-essentials-of-political-research-2000 12/214
es
and Figures
Tabke.c
5.1 faxnple
size
an d accuracy
C;, 1 C om m on bivsriate statistics
8.1
Probability of chi-square
10.1 ProbahiIity of F for partial
and
multiple
correlations
(0.5
proba lsi iry Ievel
Figure5
1 ,1 Stages in the research process
2.1 Types
of
hypotheses and exaxnples
3.1 The classic experiment and
a n
e x i i l ~ ~ p l e
3.2 Th e quasi-experimental design and a n exam ple
3.3 The correlatioilal design and
examples
5.1 faxnple
size
an d accuracy
7.1 Popular vote for presidetit, 1996
'7.2 Popu lar vote for president, 1996;
7.3 Reported voter tu rnou t, by ethnicity, 1996
7.11 Reported voter turnout, by ethnicity
and
education, 1996
7.5 Turnout of voting-age population in
presidetitial elections, 1960-2 996

8/20/2019 Alan Monroe, Alan D. Monroe-Essentials of Political Research (2000)
http://slidepdf.com/reader/full/alan-monroe-alan-d-monroe-essentials-of-political-research-2000 13/214
7.68
A
U S , per pupil speriding
o n
education,
1990-1 996-correctly presented
7.6B
U.S, per pupil
spending cm education,
1990-1 996-incorrectly presented
'7.7 Percentage af persons below poverty level,
by ethnic status, 1996
7.8
Percentage
of
persolis below poverty
level,
19%-1996
9.1
Example
of a
curvilinear relationship
10 , Causa l rnadefs for three variables an d tests
10.2
An
example
of
a causai m odel:
1972 presidential election

8/20/2019 Alan Monroe, Alan D. Monroe-Essentials of Political Research (2000)
http://slidepdf.com/reader/full/alan-monroe-alan-d-monroe-essentials-of-political-research-2000 14/214
Preface
This
book
is intended as a comprehensive text for a n introductory
course
in
research methods for the sr>cial sciences* W hile w ritten
with students
of
Political Science in mind, it would be appropriate
for similar disciplines.
The inteiltioil in this
book
is t o concentrate
on
the
essentza:als,
Given
the broad scope
of
this
book
and its relatively brief length,
I
have attexnpted to concentrate on wllat seem to be the most ixn-
porrailt pr>intsnecessary to understanding the research process, At
the same time,
I
have attempted to cover those points in sufticie~~t
depth tl-rat the reade r
will
be
able
t o understand them. Therefore, it
has been necessary to dispense with some technical details that a
longer an d m ore advanced tex t inight include,
In
w rltir~g his
book,
X have drawn o n over twenty-five years of
teaching this subject matter to students
of
Political Science at Hi-
nois State University, Drafts
of
the manuscript have been used
as a
text for several semesters, and
my
students have been helpful in
correcting an d refining the text, Any erro rs tha t =main, hr~wever,
are
my
respmsibility

8/20/2019 Alan Monroe, Alan D. Monroe-Essentials of Political Research (2000)
http://slidepdf.com/reader/full/alan-monroe-alan-d-monroe-essentials-of-political-research-2000 15/214
This page intentionally left blank

8/20/2019 Alan Monroe, Alan D. Monroe-Essentials of Political Research (2000)
http://slidepdf.com/reader/full/alan-monroe-alan-d-monroe-essentials-of-political-research-2000 16/214
T h e
Scientific Studv
of
Research Questions
The reason we have accumulated knowledge of any subject-
w he ther pl-rysics, philosopl-ry, o r political science-is th a t o th ers
have undertaken systematic investigations of particuiar topics and
reported the results. Brtt why is it important for people who are
nut professionals in those fields, particularly students, to know
ab ou t research methi>dology-that is, how research is do ne ? Th ere
are several answers to this question. First
of
all, students in any
subject spend most of their class time and study tirne Learning
about the results of past research, They can better understand
what those findings mean
if
they have sorrte familiarity with the
rnethods used to obtain thern. When they
ga
beyond textbooks
and the classroom, they may have to ~udge hether a piece of re-
search
is
valid
and
whether its results ought to be believed, Second,
students are often asked to do some research on their own-tl-re
dreaded term paper. Although they may be able to get by with just
su~rtmarizirtgwhat others have said, their papers will be more
m ea niw fu l and rewarding if they can actually conduc t original in-
vestiga tions. In adv anc ed courses-and certa inly
in
graduate
school-this is a x~ecessity.
The need to understand and t o
be
able to use research metl-rods
continue s beyond
one"
formal education. In all sorts of occupa-
tions, particularly those into which students
from
political, science
and related disciplines go, employees are asked to rnake decisions
about the value of research methods and findings, Consultants
often use such methods, and those contracting for their services

8/20/2019 Alan Monroe, Alan D. Monroe-Essentials of Political Research (2000)
http://slidepdf.com/reader/full/alan-monroe-alan-d-monroe-essentials-of-political-research-2000 17/214
should be able to evaluate their reports and findings, Similarly,
people may have to conduct some sort of research project on their
own, such as a swvey of potential clients. Understanding research
methods is useful to all
of
us beyond tile workplace as well-ffjr
example, as citizens wl-ro rnay be asked to vote o n a tax referendum
for a project recom m ende d by a consu ltant" rreearch findings,
Those who become active in politics, in local government, and in
citizen organizations have a particttfar need to
know
something
abo ut research methods.
This book is an introduction to the process of research, Jt deals
only with scielztific research, the meaning of whick is discussed
below. Altl-rough the book is designed for students of politics and
therefore uses examples f%om ha t field an d gives more a ttention to
the techrliqrres that political scientists use most frequently, the
rnethods are comxnon to all social sciences, including sociology,
econt-jmics, and psychology,
What Does ]It Mean
to Be
Scientific?
There are many definitions of science.
Perhaps
the simplest one
would be a n attem pt to
i d e ~ z b b
n d test
erapirictlf gerzemlirntions.
The first key part here is e~npirical.The te nn refers to the facts, or
the real
world:
tha t which exists and can
he
know n through the ex-
periences of o u r senses-what cart be seen, touc hed , hea rd, an d
smelted. M uch of w llat we m ight believe ab ou t things is not em pir-
ical, bu t rath er nornative-that is, it reflects ou r judgments ab out
what should be,
A
vitally import'dnt point to understand is tha t sci-
entific methods cannot deal directly with nonempirical questions;
the next section of this chapter explains
how
to identify them,
The purpose of the methods and techniques
of
scie~lces to test
empirical statements. The testing must be
ol2jective,
tbat is, its re-
sults must not be dependent on any particular researcher's biases,
Under this requirement-which is know n by its technical term,
in-
tersuhective
&s~"al;ilit~~-ainding cannot be accepted unless it can
be
replicated by others.
For
that reason, political science journals
are increasingly requiring that authors of articles reporting empiri-
cal researcl1 m ak e their da ta available for analysis by otl-rers. M ore-
over,
it:
is always im po rtan t tb at scientific research repo rts carefully
explain how d ata were coltected and analyzed.

8/20/2019 Alan Monroe, Alan D. Monroe-Essentials of Political Research (2000)
http://slidepdf.com/reader/full/alan-monroe-alan-d-monroe-essentials-of-political-research-2000 18/214
The Sciefztific Stzady nf Research Qzaestions 3
Th e other key part
of
science is
genemlzzation.
Scientists seek to
rnake statements abo ut entire classes of a b ~ e c ts , ot just individual
cases, thou gh the observation m ust he
of
individuals. The f ~ t shat
Mr, Smith has only a grade school education and does not vote,
whereas MS,J m e s has a n advanced degree and always votes, are of
little value
by
themselves, But when we collect that information o n
a large number
of
people from many places and across time, we
can make a generalization that people with rnore education are
more likely t o vote tha n people with less education.
The
main
purpose of science is to explain and predict, an d scien-
tific explanation requires generalizations. Gonsicter this simple log-
ical syllogisxn:
1 . Jf
there is a high rate
of
economic growth , the incu~~bent
president is usually reelected. (Generalization)
2 ,
There was a high rate
of
growth in 1996, (Observation)
3. Therefore, President Glintt~n, he incumbent, was reelected
in
1996,
This argurnerit is an explanation, thoug;h not the
only
one, for the
election outcome. Note that the same reason could also be a basis
for a
prediclion
of w ho would w in the election, assuming tha t the
econrlmic data were availahfe befcjrehand, The point is chat we
must have generalizations to explain what has happened and to
predict w ha t will happen-and indeed, to understand h < - ~ whe
world works.
Tf we
have generalizations about m a n y phenomena,
we can pu t them togetl~ef. nto
theories,
a term defined in the next
chapter.
The election e x m p l e il lustrates another imp ortant point , The
generalizations made in the social sciences are almost never ab-
solute. Some presidents runlling in good economic times are de-
feated. Some people
with
high leveis education do riot vote, and
some with little schooling vote regularly. Alrlzough generalisations
may not state this probabilistic quality explicitly, it
is
alrnr>st al-
ways implied.
Distinguishing Empirical and
Normative Quesrcions
As noted earlier, science can answ er only empirical questions or test
empirical statc;ments. Therefore, it is imp ortan t to be able to dis-
8/20/2019 Alan Monroe, Alan D. Monroe-Essentials of Political Research (2000)
http://slidepdf.com/reader/full/alan-monroe-alan-d-monroe-essentials-of-political-research-2000 19/214
4
The
Scientific Strcciy o f Research Qzcestions
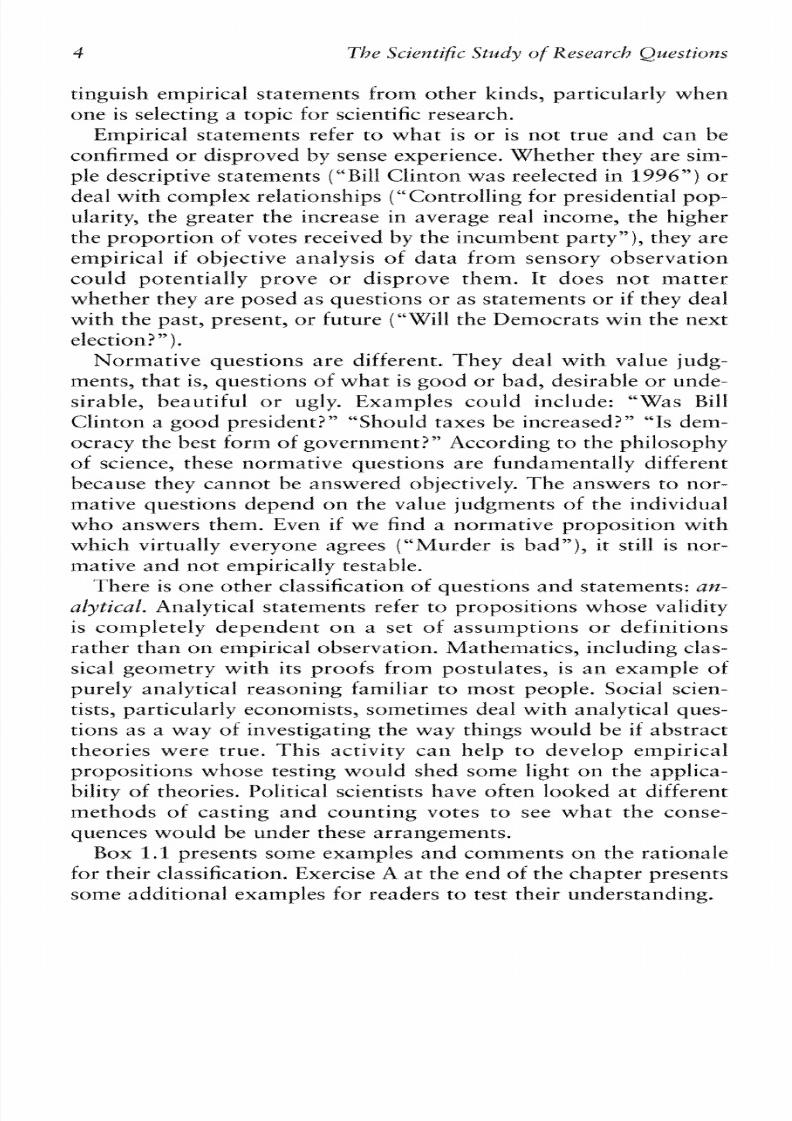
tinguish empirical statements from other kinds, particularly when
one is selecting a top ic fo r scientific research.
Empirical statements refer to what is or is not true and can be
confirmed o r disproved by sense experience. W hethe r they are sim-
ple descriptive statem ents ("Bill C linton was reelected in 199 6") o r
deal with com plex relationships ("Co ntrolling for presidential pop-
ularity, the greater the increase in average real income, the higher
the proportion of votes received by the incum bent pa rty n) , they a re
empirical i f objective analysis of data from sensory observation
could potentially prove or disprove them. I t does not matter
whether they are posed as questions o r as statements or
i f
they deal
with the past, present, o r future ("Will the Dem ocrats win the nex t
election?").
Normative questions are different. They deal with value judg-
ments, tha t is, questions of wha t is good o r bad, desirable o r unde-
sirable, beautifu l o r ugly. Exam ples could include: "Was Bill
Clinton a good president?" "Should taxes be increased?" "Is dem-
ocracy th e best form of governm ent?" According to the philosophy
of science, these normative questions are fundamentally different
because they cannot be answered objectively. The answers to nor-
mative questions depend o n the value judgments of the individual
who answers them. Even
i f
we find a normative proposition with
which virtually everyone agrees ("Murder is bad"), it still is nor-
mative and n ot empirically testable.
The re is on e othe r classification of questions an d statements:
an-
alytical.
Analytical statements refer to propositions whose validity
is completely dependent on a set of assumptions or definit ions
rather than o n empirical observation. M athem atics, including clas-
sical geometry with its proofs from postulates, is an example of
purely analytical reasoning familiar to most people. Social scien-
tists, particularly economists, sometimes deal with analytical ques-
tions as a way of investigating the way things would be
i f
abstract
theories were true. This activity can help to develop empirical
propositions w hose testing would shed som e light on the applica-
bility of theories. Political scientists have often looked at different
methods of cast ing and count ing votes to see what the conse-
quences wo uld be under these arrangem ents.
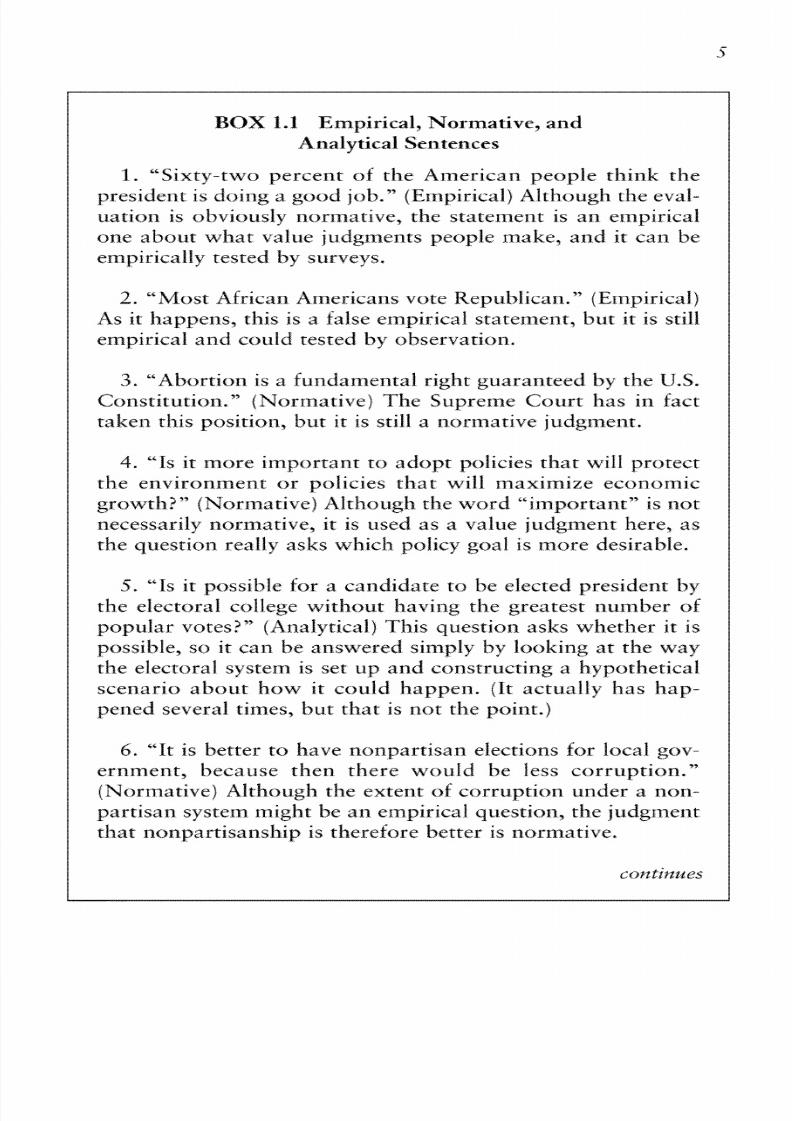
Box 1
.l presents some examples and comments on the rationale
for their classification. Exercise A a t the end of the cha pte r presents
som e additional exam ples for readers to test their understanding.
8/20/2019 Alan Monroe, Alan D. Monroe-Essentials of Political Research (2000)
http://slidepdf.com/reader/full/alan-monroe-alan-d-monroe-essentials-of-political-research-2000 20/214
BOX,
1.1 Empirical, Normaaive, and
Analytical Sentences
1. ""Sxty-two percent of the Arnerican people think the
president is doing a good job." ((Empirical)Although the evai-
uaticrrt is obviously normative,
the
statement
is
an empirical
one about what value judgments people make, and it can be
empiricaliy tested
by
surveys,
2,
"iM ost African Am ericans vote Republican.'" Em pirical
As it l-rappens, tllis is a false empirical statement, but it is still
empirical and could tested by observatioil,
3. ""Abortion is a fundamental right guaranteed
by
the
U.S.
Constitution." "c~rmative) Th e Supreme Cou rt
has
in fact
taken this position, but it
is
still a norm ative judgment,
4. "is it more im pc ~r tan t o ad op t policies that will protect
the environment
or
policies that will
maximize
economic
grow th? " "ormative) Although the word "ixnportant" is not
necessarily normative, it is used as a value ~udgment ere, as
the questiolz really asks which
policy
goal is more desirable,
S.
"is it possible for a c andid ate to be elected president by
the electoral college withou t havi~zg he ggreatest n u r ~ b e r
f
popula r votes?" "nalyticalf This question asks wl~etl-rert is
possible, so it can he answered simply
by
looking a t the way
the electoral system is set up an d constructing
a
hypothetical
scenario a bou t how it could l-rappen. (It actually has l-rap-
pened several times, hut that is not the point.)
6,
"It is better to have nonpartisan elections for local gov-
ernment, because then there would be Iess cc~rruptic>il."
jn'czrmative) Afthough the extent
of
corruption under a non-
partisan system rnight be an empirical question, the judgment
that llonpartisailship is therefore better is normative,

8/20/2019 Alan Monroe, Alan D. Monroe-Essentials of Political Research (2000)
http://slidepdf.com/reader/full/alan-monroe-alan-d-monroe-essentials-of-political-research-2000 21/214
7. A democratic political system is one in which govern-
ment tends to respond to the wishes of tlze citizens." "naiyt-
ical) This is simply a definition and dues not require any em-
pirical observation to test it,
Reformulating Normative
Questions
as
Empirical
O n learning tha t scientific study does not attempt t o answer nor-
mative questions, one might well abject that this excludes many of
the m oft interesting a nd im po rtan t topics, especiatly in politics. In-
deed, this was the basis of much of the objection to the scientific
orien tation tha t became dominan t in political science in the
1950s
and
1960s.
Afrer all, the political process is largely concerned with
questions ab ou t wllat ough t t o be.
In
fact scientific research can deal with normative phenomena, but
it can d o so only indirectly as it seeks to answ er empirical questitms.
This can be done by taking the normative qtlestions that motivate
ou r interest an d reformulating: them as empirica questions in one of
two ways. Th e first m e t h d , which is the easiest, tlzough often not
the most valuable, is to change the frarne of reference. This means
moving from a normative judgment to a question abou t the n o m a -
tive ~u dg m e~ itsome persol1 o r p ersm s make, We have already seen
an example of this in Box
1.1.
Althougfi the question of wlzetizer the
president is doing a good
job
or not is a normative one, the question
of whether the public thinks his performance is good is an empifical
one, Such refor1nu1ations can be made with any set of individuals-
the public, political sc ientists, or Left-handed civil servants,
Although chm~girrghe f rame of reference
may
be quite useful ftrr
svrne topics, such as presidential appro va l ratings, fa r o the rs tlze re-
sults produced would be trivial. Tlze other method of refc~rm ularing
normative into empirical questions is to ask empirical questions
abou t the assum ptions bel-rind narrna tive ~udgxnents.
Most normative judgments are based in part on beliefs about
what is empirically true. For instance,
m a n y
people believe that
democracy is a betcer form of government than dictatorship be-
cause they believe that democracies are more stable, are less likely
to s ta rt wars , and produce greater eco no i~ i c ev e l o p ~ ~ en t ,
ut
are
8/20/2019 Alan Monroe, Alan D. Monroe-Essentials of Political Research (2000)
http://slidepdf.com/reader/full/alan-monroe-alan-d-monroe-essentials-of-political-research-2000 22/214
The Sciefztific Stzady nf Research Qzaestions
7
BOX 1.2 Keformda tiag Normative Sentences as
Empirical
by
the Frame
of
Reference
and
En?pirical
Assumptions
Meehads
I. Should term limits he adopted far Gongresd (Normative)
Do mtlst political scientists favor term limits? (Frame)
VCiould
term limits increase the influence of interest groups on con-
gressional decisionmaking? (Assum ptions)
2 ,
Wc3ttld it be
a
go s~ d dea to legalize drugs? (N orm ative)
Do most Arxtcricans favor legalization of drugs? (Frame)
Would legalization of drugs decrease the occurrence of other
crimes? (Assumptions) How tnuch would legalization of:
drugs increase the frequency of add iction? (Assum ptions)
3. Th e United States should csntin ue to send troop s t o the
third w orld t o attemp t to restore order. (No rm ative) Na tions
in
the European
Union
favor the U.S. sending of troops in
trtost cases. (F ram e) The s up po rt of p eac ek eep iw activities
with
U.S.
troops generally l-ras not resulted in long-term pre-
vention of disorder in the past. (Assumptions)
4.
Strict l imits on campaign spending far congressional
elections should
be
adopted. (No rm ative) Dem ocrats favor
spending limits more tha n d o Republicatls, (F ram e) Spend-
ing limits tend
ta
increase the reelection r ate for incumbents.
(
Assumptions)
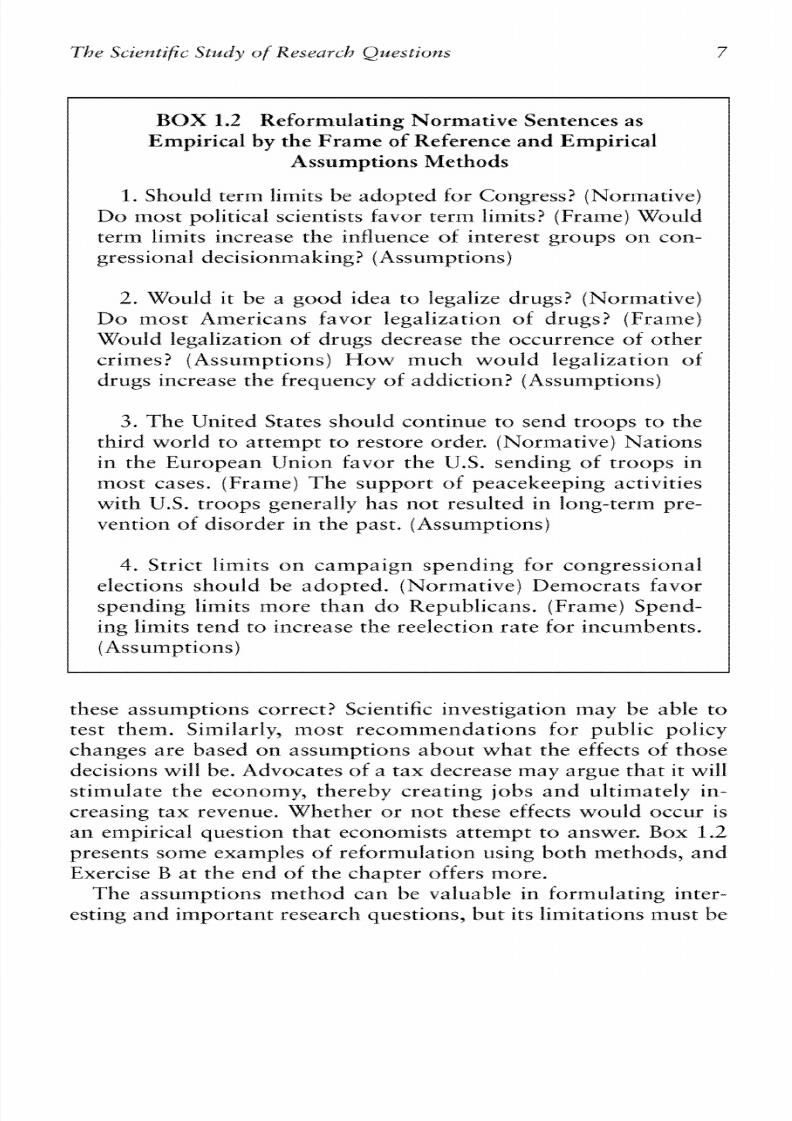
these asslullptio~ls orrect? Scientific investigatiorz trtay be able to
test them, Similarly, most reco~rtmendationsfor public
policy
changes are based on. assumptions about wllat the effects of tl-rose
decisioils wilt he, Advocates
of
a ta x decrease may argkle tha t it will
stimulate the economy; thereby creating lobs and ultimately
in-
creasing tax revenue, Whether or not these effects would occur is
an empirical question that economists attempt to answer.
Box 1.2
presents some examples
of
refc3rmulation rrsirlg both methods, and
Exercise
B at
the end of the cha pter offers more,
The
assumptions method can be valuable
in
formulating inter-
esting and impor tant research questions, but its lim itations must be

8/20/2019 Alan Monroe, Alan D. Monroe-Essentials of Political Research (2000)
http://slidepdf.com/reader/full/alan-monroe-alan-d-monroe-essentials-of-political-research-2000 23/214
kept in mind, Athctugh empirical reformulation
may
lead to re-
search that will aid normative decisionmaking, ernpiricai research
can never actually answer a normative question, To use the previ-
ous exatrtples, a believer in democracy trtight favor that fonn of
governmetlr even if it were nor more stable, peaceful, or prosper-
ous, and persons with part icular economic inte~sts ay favor or
oppose a tax cut regardless of its overal effect
t m
the economy
Research Questions
Scientific research, like any other serious intellect~~afnvestigation,
begins with a question that the research is intended to answer,
Since this starting point will determine the design and conduct
of
the inquiry, the fo rm tr la tio ~ ~f a research question (also
called
a re-
search problem) is of paramount importance, It is not only proks-
sional scientists
who
must articulate a research question, but also
beginners, Mow often do stuclents start with term paper topics-
but no t research questions-and assemble stack s of inform ation
and write extetlsive summaries, only to have instructors criticize
the resulting papers for lack of focus? A thoughtfully chosen and
clearly establisi-red researcl-r qu es tion c an avo id thi s proble m in
both scientific an d ntjnscientific i n q ~ i i q .
But w ha t are the elements of a desirable research questioll?
This
is ctiffic~1i.r:o answer in the abstract, but several criteria shoufd be
kept in mind
in
choosing a topic and Eormulating a scientific re-
search question. The first criterion is c l ~ r i t y , side from siinply
being comprehensible in t l ~ e sual sense, this means that a question
must be specific enough to give direction to the research, and gen-
eral enough that it suggests what a possible answer would be. For
instance, the question "Wl-ry is voter turnout low in the United
States?" "ves no direction
as
to whether we should
look
a t citizen
attitudes, election laws,
or
a n y
number
of
other possible factors. A
inore useful version would be
Is
voter ttlmout reduced by politi-
cal aiieilation?'\or, even better, "Does the use
of
election day voter
registration increase turno ut? 'Yim ilarly3 a question such as ""Wow
can poverty in less-developed nations be rernedied?'+ould be im-
proved
by
asking, "Does foreign investment result in long-term in-
creases in the standard
of
living?'"
Although research questions require specificiry for clarity, limit-
ing
their scope in time or place is neither necessary nor generalily
desirable, To restrict the e h v e examples to particular cities or elec-
8/20/2019 Alan Monroe, Alan D. Monroe-Essentials of Political Research (2000)
http://slidepdf.com/reader/full/alan-monroe-alan-d-monroe-essentials-of-political-research-2000 24/214
The Sciefztific Stzady nf Research Qzaestions
9
tions in the case
of
voter turnom, or a single n a t i o ~ ~n the case
~f
economic development, would reduce the theoretical significance
an d practical relevance of the findil-rgs (these tw o criteria are dis-
cussed be iow f. Although a given research project m ay weil be con-
fined to a single time or place as a practical maccer, it is the more
general qu estion tha t science seeks t o answer.
The second criterion is testiabilifiu, and it is an absolute require-
ment. The research question must be one that can be potentially
answered by empirical inquiry, First of all, it must be an empiri-
cal question, not a normative question; two methods for refor-
mulating
a
normative question as
an
empirical one have already
been presented. A second consideration is whether the necessary
investigation can be devised and carried out with the resources
available. Researching questiorls a bou t attitudes of vo ters in pres-
idential elections may require c ond t~ ct in g ational surveys, wl-rich
is a costly enterprise beyond the budget of even professional
po-
litical scientists, Brit those who lack this abilith including under-
graduate students, may still pursue such questions
by
rnaking use
of surveys conducted by others or by conducting surveys of lim-
ited p opuiations.
Anotlzer criterion is theoreticill siglzifiunce, Answering the ques-
tion should potentially increase our general knowledge and under-
standing of the topic, Evaluating a potential research question
therefore requires finding out what past research findings exist or,
at least, what others have geilerally ass~lmed
o
be true. Although
political scientists
map
not have corzducted much theorizing on a
given subject, researchers in orher fields may have developed theo-
ries that can be applied. W c~rking rom existing theories or past re-
search does not mean that the irlvestigator necessarity believes
tkexn to be correc t. Indeed, tl-re suspicion th at existing exp lana tions
are fundam entally inaccurate or no longer applicable in a changing
world is often a major m otivation h r research. But whether the re-
search proves tlze past suppositions to be right o r wrong, its signif-
icance would greater than if the question came
only
from the re-
searcher" iimagina tion, because it represents building
o n
previous
research,
A
similar criterion is practiat relevance, Answering the research
question should be useful in some real-life application. This is par-
ticularly true for questions dealing with causes of social yroblerns
and their possible solutions
(' E-iave
time limits on eligibility for
welfare paym ents increased employm ent rates a m on g past recipi-

8/20/2019 Alan Monroe, Alan D. Monroe-Essentials of Political Research (2000)
http://slidepdf.com/reader/full/alan-monroe-alan-d-monroe-essentials-of-political-research-2000 25/214
ents?'". A th ough there is a commtrn tendency to think
of
theoret-
ical significance an d practical relevance as opposing qualities, the
strongest research questions have some
of
both. The point
is
that
there should be some poteritial value in answering a research ques-
tion-eitlzer it should increase our general knowledge of tlze world,
o r it should help in accomplishing sc~mething omeone wa nts t o do,
If neither is true, then why pursue tha t topic?
A final criterion is orzgiinulity. This does not mean that a re-
search question must he completely new, but it does meall that
the answ er sh ou ld riot be so weif established th a t there is fittie
reason to expect a different outcome. For example, the general-
izat ion that people with mare educat ion have a higher voter
turnout rate than people with Iess education is so well estah-
lished-in the United States a n d in the w or ld in generai-that
pursuing it as a research topic would not be a wise use of re-
sources, even for an undergraduate student, Howewr, there may
well be refatc;d questions-such
as
why c ontem porary college stu-
dents have low rates of poli t ical part icipation, or condit ions
under which members of ethnic minorities with limited education
become activists-that wt>rrld be more prom ising,
Th us the re are five criteria to keep in mind in selecting a ques-
tion for scientific research. It shouId
be
clear and reasonably spe-
cific. X must
be
empirical to be -&file, an d it must be a q~zestion
that can be investigated given available resources. X slzouid have
some degree
of
either theoretical skrtificitnce o r pmclical
r e k -
uance,
an d prefcrahly b oth , Finally,
it
shou ld have sorr.le degree
of
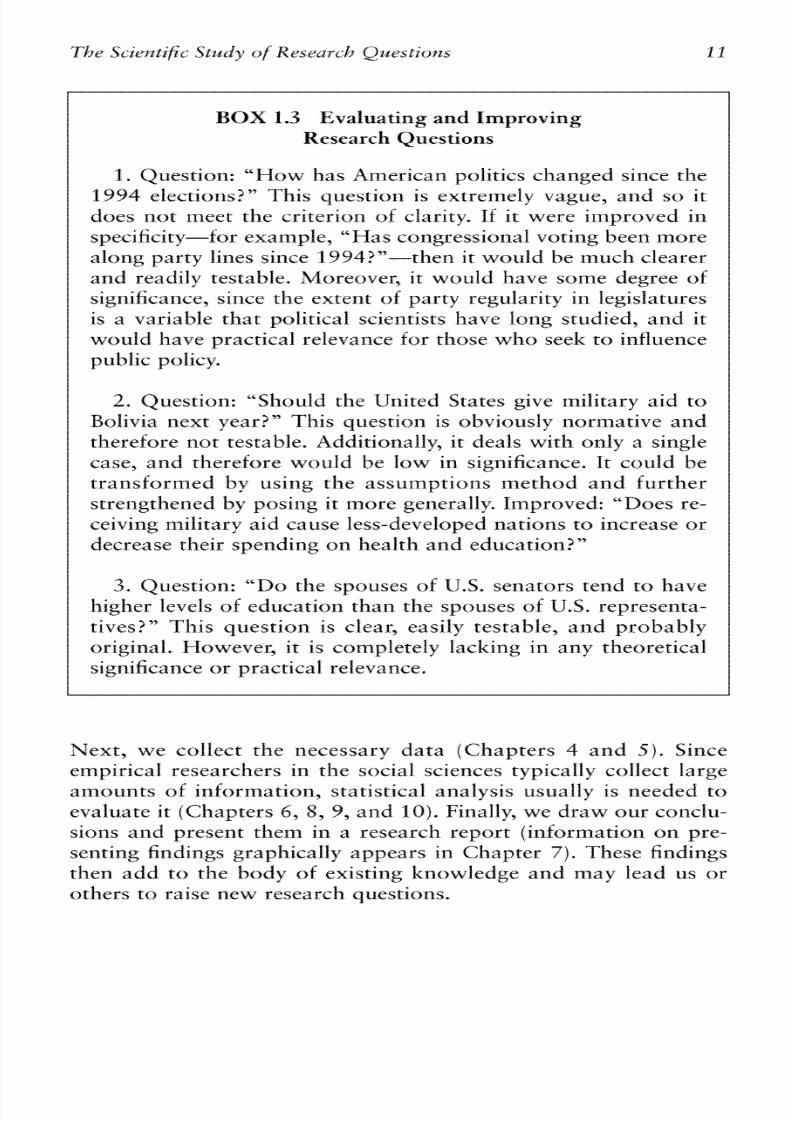
oriXinality, Box
1.3
presents several exarllples of passible research
questions, their strengths and weaknesses, and ways in which
they m ight be strengthened.. Exercise C a t the end of the chapter
does the same.
The
Scientific Research
Process
Figure 2 . 1 presents an oudine of the entire research process, each
stage
of
which will be covered in this book. As discussed earlier,
we rnust always start with, a survey of past research and tlzeorizing
on
a
topic. Then one or more =search questions that meet the
f ive
criteria
can
be formulated. From there, keeping in
inincl
what was al-
ready known, hypotheses are developed (Chapter
2).
Then we pre-
pare a research design that could test those hypotheses (Chapter
3).
8/20/2019 Alan Monroe, Alan D. Monroe-Essentials of Political Research (2000)
http://slidepdf.com/reader/full/alan-monroe-alan-d-monroe-essentials-of-political-research-2000 26/214
The Sciefztific Stzady nf Research Qzaestions f
f
BOX 1.3 Evaluating and Improving
Research
Questions
I. Question: "How has Axnerican politics changed since the
1994
elections?'" This question is extremely vague, and so it
does not meet the criterion
of
clarity,
ff
it were improved in
spccificity-for example,
Has
co ng ess ion al voting been rnore
along
party
lines since 154943'"then it would be much clearer
and reaclily testable. Moreover, it would have some degree of
significance, since the ex ten t
of
party regularity in legislatures
is a variable that politicai scientists have long studied, and it
would have practical relevance
for
those w ho seek to influence
public policy
2 ,
Questioil: ""Slould the United States give military aid to
Bolivia next year?'This question is obviously normative and
therefore nut testable. Additionally, it deals with only a single
case, and therefore would be low in significance. It could be
transformed
by
u s i n g t h e a s s u ~ ~ p t i o n sethod and further
strengtlzened
by
posing it rnore generally, Improved: "Does re-
ceiving military aid cause less-developed nations to increase o r
decrease their spending
o n
health and education""
3.
Question:
"'Do
the spouses
of
U.S. sen ato rs tend t o have
higher levels of education than the spouses
of U,S,
representa-
tives?"
This
question is clear, easily testable, and probably
original. However, it is completely lacking in any theoretical
significance or practical relevance,
Next, we collect the necessary data (Ct~apters and 5 ) . Since
empirical researchers in the social sciences typically collect large
amourlts
of
infrirmation, swtistical artalysis usually is needed to
evaluate it (Chapters Q, 8,
9,
and
10).
Finally, we dra w o ur concltl-
sions and present them in a research report (in fo rn at io n o n pre-
sexitir-rg findings graphicall y appears in Chapter
7).
These
findings
then add to the body
of
existing knowledge and may
lead
us or
others t o raise
new
research questions.

8/20/2019 Alan Monroe, Alan D. Monroe-Essentials of Political Research (2000)
http://slidepdf.com/reader/full/alan-monroe-alan-d-monroe-essentials-of-political-research-2000 27/214
FIGURE-,
1.1
Stages
in
thc
rcscarcf~
rocess
Formullate research
questions
-1
Formulare hypotheses
-t
Research design
-1
llata
collection
4
Data analysis
-t
Draw
conctuslons
Exercises
Suggested answers to these exercises appear at the end. It is
strongly suggested that the reader a ttem pt
to
com plete the exercises
before
iookiag at
the answers. Note that
o n
Exercises
B
and
C
the
answers provided are only suggestions, as the problerns could be
answered well
in
a number of ways,
Identify each
of
the following as em pirical, normative,
or
analyticrtl.
1, If a fareign palicy decision would increase
U,f ,
exports,
then that's what should be done.
2. Ptltting courtrooEE trials o n television distorts the ~udicial
pracess and defeats justice,
3,
Why
do
c o m m u i ~ i s tand socialist nations have lower
irrcsmes than capitalist nation s?
4,
Allowing people to carry concealed weapons lowers the
crime rate.
5.
If guns are outlawed, only oudaws wili have guns.
B , The cur ren t practice of cam paign fund-raising is cor rup ting
the character of American democracy,
7. PeopIe who think that potiticiarrs are dishonest are less
likely to vote than those who trust government,
8, 1s affirmative action an unconstitutional form of reverse
discrimination?

8/20/2019 Alan Monroe, Alan D. Monroe-Essentials of Political Research (2000)
http://slidepdf.com/reader/full/alan-monroe-alan-d-monroe-essentials-of-political-research-2000 28/214
The
Sciefztific
Stzady of Research
Qzaestions
f .?
9. Political parties have fulfilled a majority of their platform
promises over the years,
10. Is political instability related t o political chang e?
Each of the following sentences is normative. Reformulate them
using the empirical assumptions m ethod.
1. Should the United States increase the axnount of foreign aid
it gives to poor natioils
2.
Would
we
be
better
off
i f
Congress and the presidency were
controlled by the sam e political party
3. Since
po or ed ucation is the biggest problem facing the na-
tion, spending for schools should be increased.
4.
Negative ca~llpaiglt dvertising is what's wrong with elec-
tions today,
5.
Do we need a new political parry in this country to repre-
sent middle-of-the-road views
Z
Exer~.I'seC
Following are some po te~ ltia l esearch questions, Evaluate each o n
the critetria of clarity, testability, theoretical significance, practical
relevance, and originality
ff
there are serious weaknesses, suggest
an improved version,
I .
How
democratic is the
U S ,
political sysrern?
2.
W ho shot President Kennedy?
3. D o
appointed judges make fairer decisions than elected
judges
do?
4. Which
member of the U.S. House had the poorest atten-
dance record oil rotf calf votir-zg
in
the last session?
5.
Are votersVecl.isions
in
recelit presidential elections influ-
enced more by their at ti tudes o n ab o r t i m or by their
per-
ceptions of the economic situation?
Suggested Answers
to
Exercises
I . Normative
2.
Normative

8/20/2019 Alan Monroe, Alan D. Monroe-Essentials of Political Research (2000)
http://slidepdf.com/reader/full/alan-monroe-alan-d-monroe-essentials-of-political-research-2000 29/214
3. Empirical
4.
Ernpirical
S.
Analytical
C;. Normative
'7. Empirical
8, Norm ative
9. Empirical
10,
Analytical
1.
Is tl-re am ount of
U.S.
econornic aid received
by
a nation re-
Iated to subsequent graw tk in per capita income?
2 , Are federal budget deficits greater in years of unified party
control than
in
years
of divided
control?
3.
D o students
in
scl-rool. districts that spend m are o n public
education have higher test scores after the average educa-
tion an d income
of
paren ts in those districts are taken into
account?
4. Was the hequency
of
negative advertising greater in the
1990s than in the
198QsZ
S.
Would a new political party with an ideologically centrist
pc-~sition n
most
issues receive more than
20
percent of
the votes?
1.The problem here is a lack
af
clarity, as tl-re term
democracy
is used in rnany ways
and
each has many aspects.
X
made
more specific, the question certainly could have consider-
able theoretical sigt~ificance nd lor practical relevance, for
example, 'W ow much of the time are the policy decisions
of the
U.S.
government in agreement with the preferences
of
a
inajority
of
the people?'"
2.
Th e yuescion is clear a nd specific, an d its m sw er could con -
ceivably have some practical relevance. But it is not Likely
to be testable, and it is definitively unoriginal. Xn addition ,
it lacks theoretical significance, as it deals with only a sin-
gle event. Improved: ""Dopolitical assassinations in mod-
ern Jexrlocracies
lead
to changes in the governing political
party
Z
3.
The problem here is that fairness is a normative concept, so
the question nut testable.
Xf
some empirical m easure were

8/20/2019 Alan Monroe, Alan D. Monroe-Essentials of Political Research (2000)
http://slidepdf.com/reader/full/alan-monroe-alan-d-monroe-essentials-of-political-research-2000 30/214
The Sciefztific Stzady nf Research Qzaestions f 5
subsrituted, then the q~ ze stion ould be testable, sigz~ifi-
cant, and relevant, for example, ""Are elected judges mare
likely than appointed judges to render verdicts favoring
the del'enbant in crirninail cases?"
4,
This is a clear question that could easily be tested, but it
lacks any theoretical significance and has little practical
relevance, Improved:
'Wms a
representative's attendance
record affect his or her chances
of
reelectic~n?"
S.Th is is a rea so ~l ab ly lear an d testable question that has
considerable theoretical significance for o u r knowledge
of
voting
behavior
and
same practical relevance
for
contem-
porary politics. Although it is not coxnpletely original, the
question is still of interest, as the answer is not completely
clear and i t r~ ee ds o be reinvestigated f c ~ r ach new elec-
tion, Therefore, nu improvement is needed.

8/20/2019 Alan Monroe, Alan D. Monroe-Essentials of Political Research (2000)
http://slidepdf.com/reader/full/alan-monroe-alan-d-monroe-essentials-of-political-research-2000 31/214
This page intentionally left blank

8/20/2019 Alan Monroe, Alan D. Monroe-Essentials of Political Research (2000)
http://slidepdf.com/reader/full/alan-monroe-alan-d-monroe-essentials-of-political-research-2000 32/214
ding
Blocks o f the
Research Process
This chapter presents a number
of
different concepts involved in
the research process. The goal here is not to teach terminology but
to help
you
keep these ideas straight as you work with them, The
concepts discussed
in
tl-ris chapter c o n s t it ~ ~ telze very heart of social
science research, and familiarity with them
is
not
only
helpful
in
understanding how othe rs conduc t research but also viral to being
able to d o it yourself. AIthough tlzese concepts might seem very ab-
stract a t first, by the end
of
the cha pter you shouid
be
able to apply
some of them to specific examples yourself.
Theories, Hypotheses,
and Operational Definitions:
AnOverview
One of tlze difticulties
in
simply describing these building b locks of
researcfi is that science operates a t several levels. Box
2.1
contains a
diagram
of
these levels with two examples. Science starts and ends
with
theories,
Although, the term
theor;\
is used in wide variety of
ways, it could be defined as a
set of empirinll gcmemEixatiuns
abuzgt
a
q i c ,
A theory consists
of
very general statements abou t
hr>w
some
phenomenon, such as voting decisions,
ect~nomic evelopments,
or
outbreaks of war, mcurs, But tlzearies are to o general to test directly
because they make statemetlts about the re latioilship between abstract
concepts-sttch as econom ic development an d political alienation-
8/20/2019 Alan Monroe, Alan D. Monroe-Essentials of Political Research (2000)
http://slidepdf.com/reader/full/alan-monroe-alan-d-monroe-essentials-of-political-research-2000 33/214
f 8
R ~ i l d l f z g
Locks C> &:re Research Prc~cess
BOX
2.2 An Overview of the Levels o f Research
L E V E L
THEORY: Concept 1 is related to Concept
2 ,
HYPOTH ESES: Variable 1 is related tc-, Variable
2.
OPERATIONAL: Operational Definition l is related tct
Operational Definition
2 ,
E X A M P L E
1;
THEORY: Eco no~ nic eveioprnerit is related to political
development.
HYPO THESES: Th e m are industriafized
a
nation, the
greater tl-re level
al
mass political participation,
OPER ATION AL: Th e higher the percentage of the labor
force
engaged in manufacturing, according t o the
U~2tel-l
ations Yearbook,
the higher the
percentage of the population of voting age tha t
participated
in
the most recent national election,
according the StatkrstnanUearbook.
E X A M P L E
2:
THEORY: S~c ioe co liom ic tatus affects political pa rticiption.
HYPO THESES: The higher a person" incorne, the rnore
likely he or she is to vote.
OPER ATION AL: The higher a survey respondent" answer
when he or she is asked, "Wfiat is your house-
hold" ailnual income," the more likely that
person wili ailswer "Yes" when asked, ""Did you
vote in the election fast
November?'"
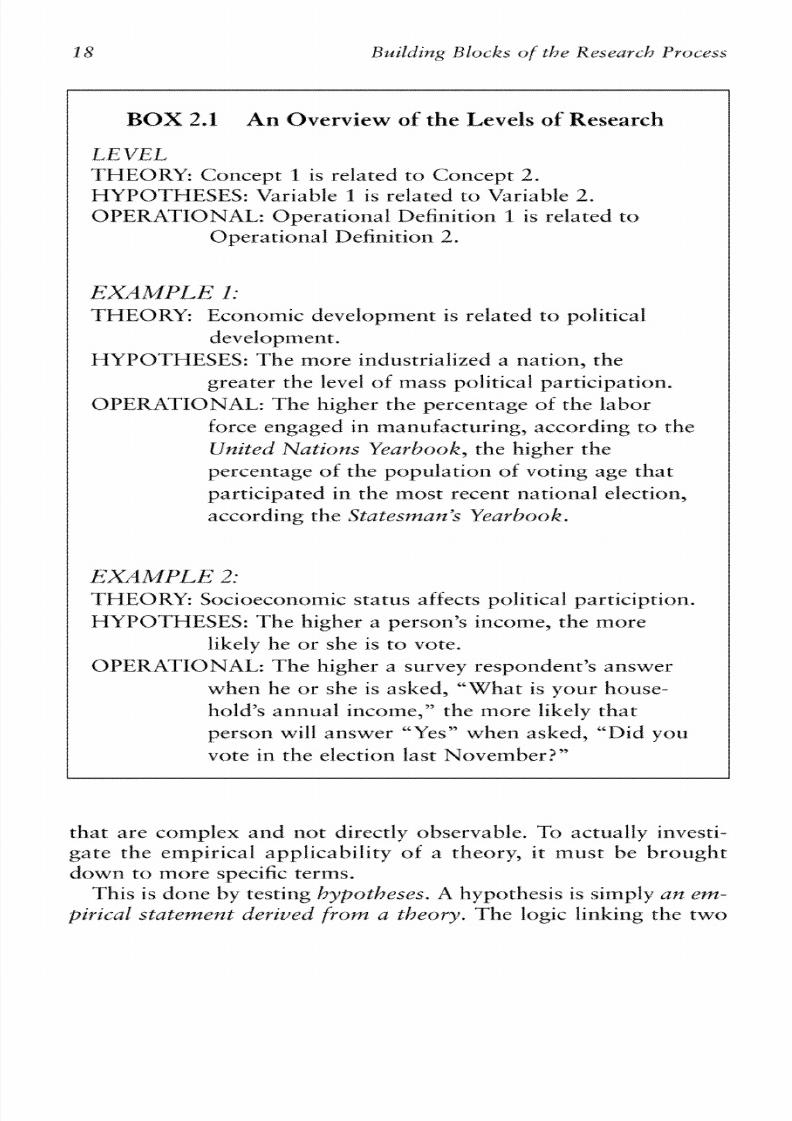
that are co~nptex
n d
not directly observable. To actually investi-
gate the empirical apglicabitity
of
a theory, it inust be brought
down
t o m ore specific terrns,
Th is is
done by
testing
h3~12otheses.A
hypothesis is simply an
em-
pirical statemertt derived from a theory, The logic linking the two
8/20/2019 Alan Monroe, Alan D. Monroe-Essentials of Political Research (2000)
http://slidepdf.com/reader/full/alan-monroe-alan-d-monroe-essentials-of-political-research-2000 34/214
is that i f a genera1 theory is correct, then the more specific hypoth-
esis derived from it ought to be true, Moreover, if the hypothesis is
confirmed by empirical observation, then our confidence in the
general theory is inrreased. However, i f a hypothesis is no t con-
firmed, we must question the validity of the theory Gorn which it
was derived. Hypo theses are also related to o u r research questions,
which were discussed in the yrevic>uschapter. Hypotheses are those
answers to o ur research questions tha t seem to be the most pram is-
ing o n the basis of theory an d past research,
Hypotheses a re statem ents abo ut v~rzables .A variable is an em-
pirica/ proper9
that
ca,z take
on
two
or
more
differerzt
v a i ~ e s .
s
the examples in Box 2.1 illttstrate, hypatlleses are much more spe-
cific than theoretical statements. But even variables are not specific
enough
lor
observatitrn, Each variable
in
a hypothesis must have an
operatio~lal
lz(init-lo~,
hat is,
la set
o f directions
as
t o how he vari-
abkr is to
be observed
and measzdred. Co nstructing operatioilal de-
flnitiolls is a vital p art
of
the research process and is discussed later
in this chap ter,
The
stages illustrated in
Box
2.1 sho w hr>w we move from very
gerieral theoretical p ropos itions dow n t o specific instructions ab ou t
how to m easure variables, w hether by looking o n a particular col-
um n in a reference
book
o r asking a specific ques tion in a surve y
Types o f
Hypotheses
Hypotheses rnake staternents about variables. These statements
can take a variery of fcrrms, as shown in Figure 2.1.
If
the hy-
pothesis makes a s ta tement a bo ut only one proper ty o r var iable ,
then it is referred to as a lilrszvarkte hypothesis. h rtzuitirrarilate
hypothesz's
rna kes a statement ab o u t l-row tw o o r rnore variables
ar e related.
Most scieritific hypotheses are mrritivariate as well as
direc-
tional, that is, they specify not just that the variables are related
to one another but also what the direction of the relationship is,
In a
positive
o r
direct
relationship between two variables, as one
variable rises, the o th e r tend s t o rise; for exaxnple, ""The rnore ed-
ucation on e has, the greater one % ncom e," h1
negative
o r
inverse
relat ionsh ips , the opposite ~ c c u r s , ha t is, as one variable rises,
tile oth er tends t o fall; for exam ple, Tbe wealthier a nation, the
lower its Level of illiteracy," nrzorni~nielationships, the hypoth-
esis does predict th e direction, but on e or both
of
the variabtes
are

8/20/2019 Alan Monroe, Alan D. Monroe-Essentials of Political Research (2000)
http://slidepdf.com/reader/full/alan-monroe-alan-d-monroe-essentials-of-political-research-2000 35/214
20
R ~ i l d l f z g locks
C> &:re
Research Prc~cess
FICiliRi-,
2.1 Types
of
hyporl~eses nd exampies
H y p o$h ses
U~sivariate Xblultiva~iatc
Turnout was
49%
Nonassociatiorzal
Getlcter is n ~ refaced
to turnout,
1
Directional No~dzrecrional
l
Agc
i s
retated
to
tQ turnout,
l
I3osz';cive
Negative Nonzi~zaE
The higher
Thc rnorc alienated,
Catholics have
one's sinco~ne, the tower
the
turnout, higher turnout
the
higher the than Protestants.
turnout.
such that they can.tlot be described in quantitative terms. An ex-
ample
of
such a oofrtinal reiatic~nshipwould be ""Catholics are
rnore likely t l ~ a n 3ratestants to vote Republican."
Theoretical RaXe
Trr
mtlst
mltivariate hypotheses, each variable takes on a particu-
lar
theoretical
role; the presumed causal relaionship between the
variables is specified. Causality is discussed in greater detail in
Chapter
3,
but here a n introduction
to t he
concept is needed.
Iadepe~zdent
auicables are those presumed in the theory underly-
ing the hypothesis to be the
caz.lse
and
dependent variablles
are the
effects
or consequences, Although this distil~ctions sometimes
dif-
fmft to make, in trtost hypotheses it is apparent,
The
statement
may include explicit langua ge t o th at effect-for exam ple,
"causes," ""ads
to,"
or "resutrs in." h other instances, the sub-
stantive nature of the variables pe rmits only on e direction, For in-
stance, if we hypothesize a relationship between a person" gender
and his
or
her a~i tudes,t is cr~nceivable nly that gender is the inde-
pei ident variable and at t i tude is the depende~~tariable.
(Which

8/20/2019 Alan Monroe, Alan D. Monroe-Essentials of Political Research (2000)
http://slidepdf.com/reader/full/alan-monroe-alan-d-monroe-essentials-of-political-research-2000 36/214
gerider you are might intluencr: your thoughts, but i t is n ~ tassible
for your thoughts to affect your gender,)
Often the nature of the relationship lies in the timing between
variables. Gender and race, for example, are determined before
birth, As a practicai m atter, m ost social characteristics of individu-
als, such as education , reiigion, an d region of residence, are usually
determined early in life. In contrast, aspects
of
political behavior,
such as voting decisions and opinions, a re subject to altera tion with
the passage of time. Hence we usually presume that the stjciai fac-
tors are independent variables and tlze behaviors are dependent
variables. Similarly,
if
we hypothesize
a
relatit3nship betweell de-
rnographic a ttribu tes (econoxnic development, urban ization, an d
the like) of geographic or political units (e.g., nations, states, or
cities)
o n
the one hand, and their behaviors
(e.g.,
policies they
ad op t) o n the other, then the dexnographics wou ld probably be the
independent variables. Ifitimateiy the decision as to which are the
independent and whii-h the dependent variables is based
o n
o u r
theoretical tznderstanding of the phenomena in question,
Tlze
control
variable takes on a third theoretical role. Control
variables are
additiurral vwkbles tha t mkhr affect the relation-
ship between the independ~nt
nd
dependent variables,
W h e n
control variables are used, the intent is to ensLtre that their ef-
fects ar e excluded-that is, to ensu re th at it is not these vari-
ables that are in fact responsible for the variations observed in
the depellderrt variable. Con trol v ariahies in a hypo tbesis ar e ai-
ways expiicitly fabeled as such, ~zsuaflywith the terms
cauttrol-
ling Jar
o r
holding constant.
Co ntro l variables can g o a Iollg way tow ard clarifying relation-
ships between variables. It can be
al
too easy, when we find that
two variables are related and we look no further, to conclude that
on e caused the other. But we must always he alert t o the possibility
tha t o the r h c to rs rr.lay be involved.
7 )
ake
a
well-know example,
African Am ericans l-rave lowe r rates of voter t ur no ut th an d o
whites. O tle might readily co ndud e tha t race is somehow the cause
of
hwer turnout and advance explarxations based
c m
racial dis-
crixnination in voter registration o r cultural Q ifkren ces in politicai
attitudes, Yet, as a num ber of studies have shown,
if
we statistically
control for other characteristics such as education, economic sta-
tus, and region of' residence, the difference largely
or
even entirely
disappears,
In
other words,
if:
we compare Afi.ican Americans and
whites who have the same Xevel of education and in co ~ ne nd live

8/20/2019 Alan Monroe, Alan D. Monroe-Essentials of Political Research (2000)
http://slidepdf.com/reader/full/alan-monroe-alan-d-monroe-essentials-of-political-research-2000 37/214
22
R ~ i l d l f z g
Locks C> &:re Research Prc~cess
in the sam e pa rt
of
the courltry3each is as iikely as the o the r t o vote
(WoIfinger and Rosenstone,
1980, 90-91 j.
This would lead us to
conclude that the main reasons for racial disparity in voter turno ut
are these de ~r tog ra gh ic actors; certainly, any investigation
of
turnout should control for tbexn.
Box 2.2
presents several examples of hypothaes, identifying the
variables an d their roles, Note tha t although most multivariate hy-
potheses l-rave only on e independent a nd one depend ent variable,
it
is possible to have more than one of each.
Bttx 2.2
also identifies
the anit o fn~cz ly s i s mplied in the hypothesis, a collceyt discussed
in the next section, Exercise
A
provides additional examples.
Units
o f
Analysis
As mentioned earlier, variables are empirical. properties, hut
of
what arc they properties?
The
answer is the unit
c>f
analysis in the
hypothesis, that is, t h e olr jects tha t the hypothesis describes. Jn
rnany hypotl-reses the un it of analy sis is exp licit, If we say th at
people w ith on e characteristic also tend tc-, have ano the r cha racter-
istic, then the unit is the individual person.
Tf
the hypothesis says
that some types of nations are higher in some factor than otlzers,
then natioils are the unit
of
analysis,
Sometimes the unit of analysis in a hypothesis is not so obvious.
Indeed, there may be a choice, If the hypothesis is simply that
in-
come is related to voter turnout," the unit of analysis could he in-
dividuais, or it could be groups
of
people, such as the populations
of states or cities, for both individuals and groups have both in-
comes and voting, thc~ ugh
n
the case
of
groups
it
would he totals
OF
averages. Th e choice of which unit t o use in testing a hypothesis
is extrexnely im portan t, In the exam ple just given, the re lationship
between income and turnom may he very different, depending on
which unit
of
analysis is used.
One of the major pitfaits that can occur if the wrong choice of
unit of analysis
is
made
is
com m itting the
ecologictzt fallacy: e r m -
rrecr~sEydrawing conchs iorrs abou t i rrdiv idu~lsrom J ~ t a t z
grozfps.
"fhis error is well illustrated in
a
paper subxnitted by a stu-
den t in a poiitical scieizce class a t Illinois Sta te tlniversity, The stu-
dent collected data
o n
coun ties in the Southern s tates for a xlumber
of variables and coxnputed correlations for all
the
variables. O ne of
his findings was a strong positive relationship between the propor-
tion of a co~zntg'spoyuiation that was African Arrterican and

8/20/2019 Alan Monroe, Alan D. Monroe-Essentials of Political Research (2000)
http://slidepdf.com/reader/full/alan-monroe-alan-d-monroe-essentials-of-political-research-2000 38/214
BOX 2.2 Examples of Hypotheses,
Identifying Independent, Dependent, and
Control
Variables and the U nit o f Analysis
1,
Urban areas have lower crime rates than rural areas.
Independent
variable:
Urbanization
Dependent variable: Grime rates
Unit of analysis: Geographic areas, such
as
states or
counties
2. Wirh
age held constan t, edttcation
and
political partici-
p"rion are po&tivety =lated .
Independen t
variable:
Education
Dependent variable: Political parcicipatian
Cotltrol variable: Age
Unit
of
analysis: Individuals
3. The more negative the advertising in a U.S. senatorial
campaign, the lower the voter tu rnout rate.
Independent
variable: Negativity of campaign
advertising
Dependent variable: Turnort~ ate
Unit of analysis:
U.f,
states
4. With GNP
hefd ci>nstant, com munist nations spend inore
tltan capitaiist nations for the m ilitary.
Independeslt variable: Tiipecof economic system
Deperidexit variable: Military sgeriding
Control varia blie: GNP
Unit vf analysis: Nations
S. 'The better the stare of the economy, the greater the
proportion of votes received
by
the party of the
president.
Indep endent variable: State of the economy
Dependent variable: Proportion
of
votes for incumbent
party
Unit of analysis: Elections
corzti~ilues
8/20/2019 Alan Monroe, Alan D. Monroe-Essentials of Political Research (2000)
http://slidepdf.com/reader/full/alan-monroe-alan-d-monroe-essentials-of-political-research-2000 39/214
24
R ~ i l d l f z g
Locks C> &:re Research Prc~cess
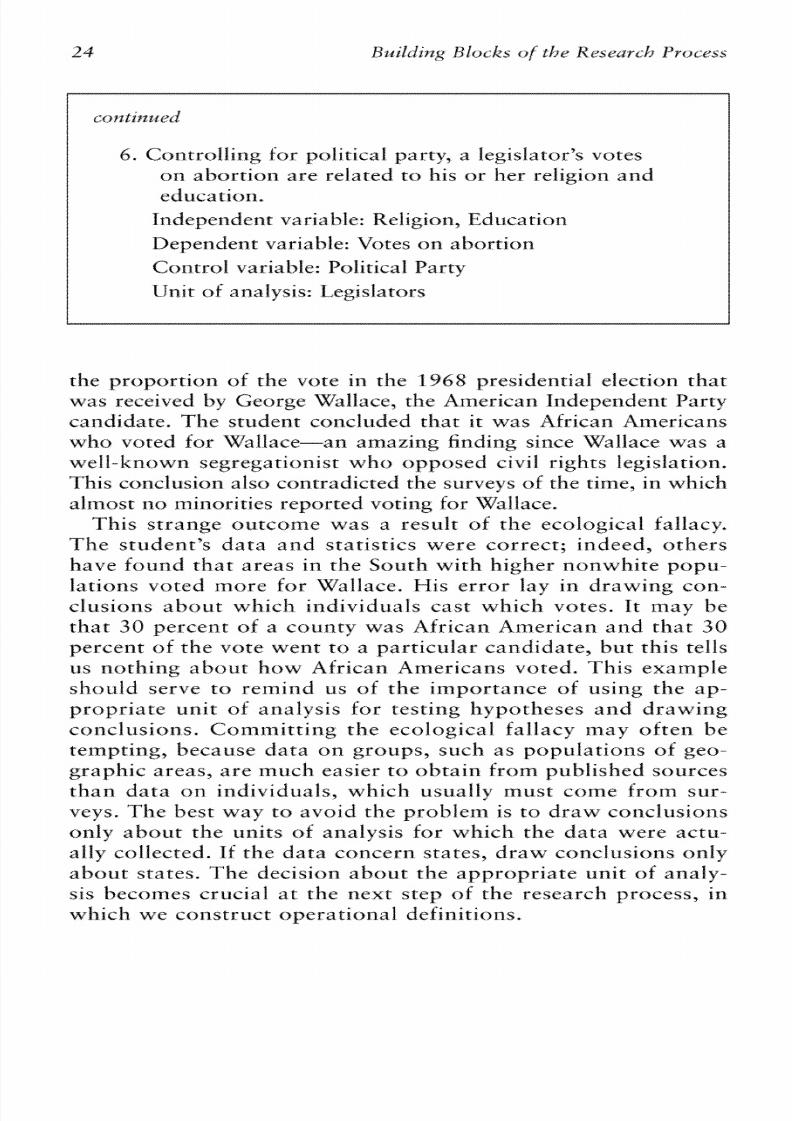
6.
Controlling for political party, a legisiator" vvotes
o n ab ortion a re related t o his o r her religion an d
educatioil,
Independent variable: Religion, Education
Dependent variable: Votes o n a bo rtion
Contro l variable:
Po itical Party
Unit of analysis: Legislators
the proportion of the vote in the
1968
presidential election that
was received by Ceorge Wallace, the American Illdependent Party
candidate, The student conclrtded that it was African Americans
w ho voted for wailace-an axnaaing finding since wallace was a
well-known segregationist who opposed civil rights legislation,
This conclusion also contradicted the surveys
of
the time, in which
almost no minorities reported voting for \Vallace,
This strange outcome was a result of the ecological fallacy,
T he studexlt" da ta a n d s ta tis tics were correct ; indeed, others
have found t ha t areas in the South with higher nonwlaite pa pu -
lations voted more for Wallace,
His
e r ro r
l a y
in drawing cun-
clusions a b o u t which individuals cas t which votes. Tt may be
tha t
30
percent of a county was African Axnerican an d th at 30
percent
of
the vote went to a part icular candidate, hut this
tells
us wtfi ing about how African Americans voted, This example
& m i d serve t a rernind us of: the ixnportance of using the ap-
propriate unit of analysis f>r testing hypotheses a n d drawing
conclusi t>ns.
Committing
the ecological fa llacy t rtay s f t m be
texnpting, because data on groups, such as populations of geo-
graphic areas, are m uch easier to obta in from published sources
than data on individuals, which usually must come from sur-
veys, Tlae best way t o av aid the prob lem is t a d ra w conclusions
only about the units of analysis for which the data were actu-
ally collected.
Xf the
d at a coxlcern sta tes, d ra w collclusions only
about states.
The
decis ion ab ou t the app ropria te unit
af
analy-
sis becomes crucial at the next step
of
the research process, in
which we construct operational defini t iom.
8/20/2019 Alan Monroe, Alan D. Monroe-Essentials of Political Research (2000)
http://slidepdf.com/reader/full/alan-monroe-alan-d-monroe-essentials-of-political-research-2000 40/214
Operational
Definitions
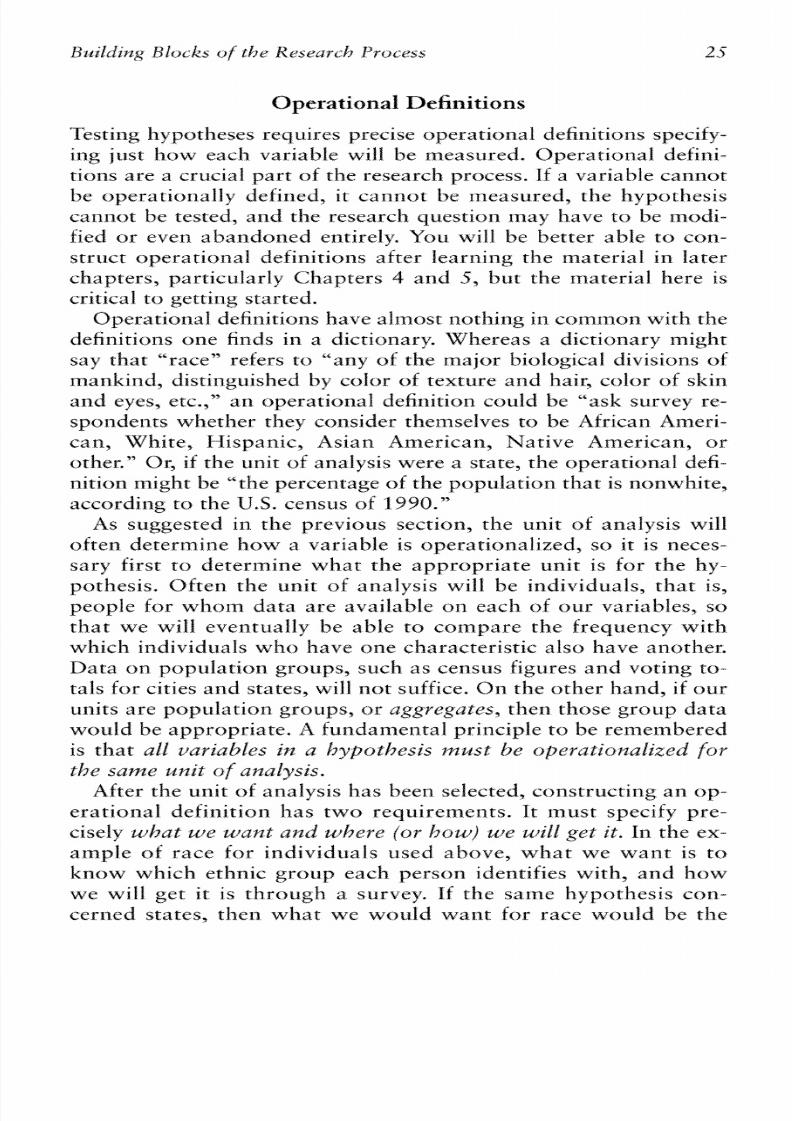
Testing hypotheses requires p ~ c i s e perational definitions specify-
ing just how each variable will he measured, Operational defirti-
tions are a cruciai par t of the research process,
X
a variable cannot
he operationally defined, it cannot be measured, the hypothesis
cann ot he tested, an d the researcl1 question may have to be modi-
fied or even abandoned entirely,
You
will be better able to con-
struct operationai definitions after learning the material in later
chapters, particularly Chapters 4 and 5, hut the 1natc;rial here is
critical to geteing started.
Operational definitions have alrrtost nothing in com m on w ith the
definitions one finds in a dictionary. Whereas a dictionary might
say that "race" refers to ""anyof the major biological divisiolls of
mankind, distinguished by color of texture and hair, color of skin
an d eyes, etc.," a n ope ration al definition could
be
'%ask survey re-
spondents whether they csnsider themselves to be African
Ameri-
can, White, Hispanic, Asian American, Native American, or
other," Or, if the unit of analysis were a state, the operational defi-
nition might he
the
percentage of the population tha t is nonwhite,
according to the
U.S.
census of
1990."
As suggested in the previous section, the unit
of
analysis will
often determi~le ow a variable is operationalizcd, so it is neces-
sary first to determine wl-rat the appropriate unit is for the
hy-
pothesis, Often the unit
of
analysis will he individuals, that is,
people for whom data are available
o n
each of our variables, so
that we wiif eventually be able to compare the frequency with
which individuals w ho have one ch aracteristic also have ailc~ther,
Data o n pop ulation group s, such a s census figures and voting to-
tals fo r cities an d states, will no t suffice. O n th e oth er band ,
i f
our
units are population g roups, or aggregates, then those g r o w da ta
would he appropriate.
A
fundam ental principle t o
be
remembered
is cllac
all variLzbles in a hypothesirs must
be
operatiorsnlked firr
the same zhnit of nnaIysis.
Afler the unit of analysis has been selectc;d, con struc ting an s p -
erattional definition has two requirements, It must specify pre-
cisely ~ h a r
e w a ~ t
nd whew (or h o d
we wit /
get it. In the ex-
ample of race for individuals used above, what we want is to
know which ethnic group each person identifies with, and how
we will get it is through a survey. If the same hypothesis con-
cerned states, then what we would want for race woutd be the

8/20/2019 Alan Monroe, Alan D. Monroe-Essentials of Political Research (2000)
http://slidepdf.com/reader/full/alan-monroe-alan-d-monroe-essentials-of-political-research-2000 41/214
26
R ~ i l d l f z g
Locks C> &:re Research Prc~cess
propor t ion
of
the populat ion that i s nonwhite , and where we
would get it could be the
U,S.
Bureau
of
the Census,
As this example stlggests, two units of analysis are very com-
mon in political science, and each has a typical type of da ta
sou rce, 11 the unit of analysis is the individual, m ean ing people in
general, then the source us~talfymust be a survey, for tl ~ e r e re
very few pieces
of
politically relevant information about ordi-
nary people tkat can be obtained in other ways. The methodol-
ogy of
surveys will be presented
in
Chapter
5.
Elowever,
if
the
"iindividual" is a special type of person, such as the holder of a
government office, then many other variables are readily avail-
able. For example, for mexnbers of Congress, persmal history
data , campaigr.1 contributic->nsand spending, and votes on legisln-
tive issues are a rr.latter
of
public record. ""lndividrrals 'hs a unit
of ana lysis ca n also be insticu tians, sucl-r as interest groups , cor-
porations, and political parties; often sources may be found of
infclrmation already co ll e c td o n them, though surveys of institu-
tions may aXso be necessary,
Data sources for geclgraphic populat ion groups and govern-
ments a t
ail
levels ar e discussed in Cha pter
4,
An astonishing
va-
riety of info rm atio n is collected by go vernm ents across the w orld
as well as by other agencies. Ehwever, one prillciple to keep in
mind when constructing operational defini t ions using data on
groups is that the data usually must be st.r;l;r"td~rdz'x~d~his means
that i t should be measured in a way that makes comparison
of
different cases meaningful, usually
by
standardizing to the popu-
lation. Unstandardized xneasures usually reflect tl-re total size of
the population group more than anything else. Thus if the vari-
able is ' 'how De m ocratic a state voted," the app rop riate rr.leasure
wo uld be the percentage of the vote tk at w as Dem ocratic, not tile
total number u l vrltes, 11 we are concerned w ith the wealth of na-
tions, then per capita gross rlatioxlal product
(GNP)
would be
a
better measure than total
GNP.
(If
we do not standardize these
aggregate measures, then almost any variable will correiate with
any other, simply heca~zse arger states o r rlations have more of
almost everything than smaller ones.)
Box
2.3 presents examples
of
hypotheses and of how the w r i-
ables might be operationalized, Exercise
B
a t the end
of
the chap-
ter presents other exaxnpies for self-testing.

8/20/2019 Alan Monroe, Alan D. Monroe-Essentials of Political Research (2000)
http://slidepdf.com/reader/full/alan-monroe-alan-d-monroe-essentials-of-political-research-2000 42/214
BOX
2.3 Examples
o f
Hypotheses and
Oprrarionat
Definitions
1 .
The more a congressional calldidate spends, the more
successful his
or
her campaign.
S p e n d i ~ g : lze amount of campaign spending re-
ported to the Federal Election Comm ission.
Succas:
The percellrage
o f
he
total
votes received
by
the candida te according to America
Votes,
2, The more econoxnicaily developed a nation, the lower
the level
of
political instability
Economic development: Per capita GNP as reported
by the United
Nations Yearbook,
Poiit ical insmbili ty;
Th e average num ber
of
coups
d ' i t a t , assass ina t ions , a n d i rregular execrl t ive
transfers per year since
1970,
according to the
Worfd
Haadbook of Political a ~ docial Indi-
cators.
3.
The higher the level
of:
a person's education, the more
likely he o r she
is
to favor legal abortion.
Eiiucati~pl:Ask
a
survey responden t, "How far
did
you
go i n s c l ~ o o ~ ? "
Opinion on
abortion:
Ask the survey respandent,
"Do
you believe that ahort ion should be legal
under any circu~nstances
or
not?"

8/20/2019 Alan Monroe, Alan D. Monroe-Essentials of Political Research (2000)
http://slidepdf.com/reader/full/alan-monroe-alan-d-monroe-essentials-of-political-research-2000 43/214
28
R ~ i l d l f z g
Locks C> &:re Research Prc~cess
4,
The trtore csmpetitive political parties are in a state,
the more the state spends on education,
Party cc~mpetz'tionzThe difference between the Re-
publican and Democratic percentages
of
the vote
k ~ r
overrlor subtracted from
100,
c i t l ~ ~ l i l w dr01rt
data in A n z e r i c ~
Votes,
Spend ing fc~reducation:
Per pupit spend ing for pub-
lic elemeiltary an d secondary education, according
to the
U.S,
Statistical Abstract.
Exercises
Suggested answers far these exercises appear at the end of the
chapter. It is suggested that you attempt to complete the exercises
before looking a t the answ ers,
For each af tl-re following hypotheses, identify wl-rat appear to be
the independent, dependent, and (if any', con trol variables a nd the
unit of analysis.
l.
Media atten tion is necessary fo r a cand idate to succeed in a
primary election,
2. With education, income, and region held constant, there
is
little difference in turnout between whites and African
Americans.
3.
Southern states have
less
party competition than Northern
states.
4,
W11en Length of time since i~~dependeilces held constant,
democracies are trtore stable than dictatctrships.
5.
The Larger a city, the higher the crixne ra te tends to be.
Far each of the following hypotheses, construct opemtional defini-
tions for the variables,

8/20/2019 Alan Monroe, Alan D. Monroe-Essentials of Political Research (2000)
http://slidepdf.com/reader/full/alan-monroe-alan-d-monroe-essentials-of-political-research-2000 44/214
1 .
Cantroil ing for education, the more urban an area, the
lower the voter ttlrno ut,
2 ,
People
w h o
perceive that they are better
off:
economicalfy
tend t o vote for the incumbent candidate for president,
3. Nations that receive U.S. foreign aid are more likely to sup-
port the Uilited States in foreign policy.
4.
Winning candidates have more positive perceptions of vot-
ers than d o losing candidates.
S. The
better the sta te of the econr>my, the better the can di-
dates s f the incum bent president" party d o in congres-
siona l elections.
Suggested Answers
ta Exercises
l ,
Indepelldent variahle: media attention; dependent variable:
electinn success; unit of analysis: candidates
2.
Independent variable: race; dependent variable: voter
turnout; controf variables: education, race, region; unit of
analysis: individuals
3. Independent variable: region; dependent variable: party
competition; unit of analysis: states
4,
Independent waria ble: ty ye of governm ent; dependent wari-
able: stability; control variable: time since independence;
unit af analysis: nations
S.
Independent variahle: size; dependeilt variable: crime rate;
~ l r ~ i t
f
ar~alysis: ities
1,
Education: The median years
of
education
af
persons
25
years
af
age and over, according ta the
U.S. Statistical
Abstract.
Urbanization: The proportion of persons living in places
with poyulations
of
2,500 or more, according to the
U.S.
Bureau of the Census,
Voter turnout: The proportion of persogls of voting age cast-
ing ballots in the
1996
presidential election, accord ing to tlze
U,S. Statistical Abstract.
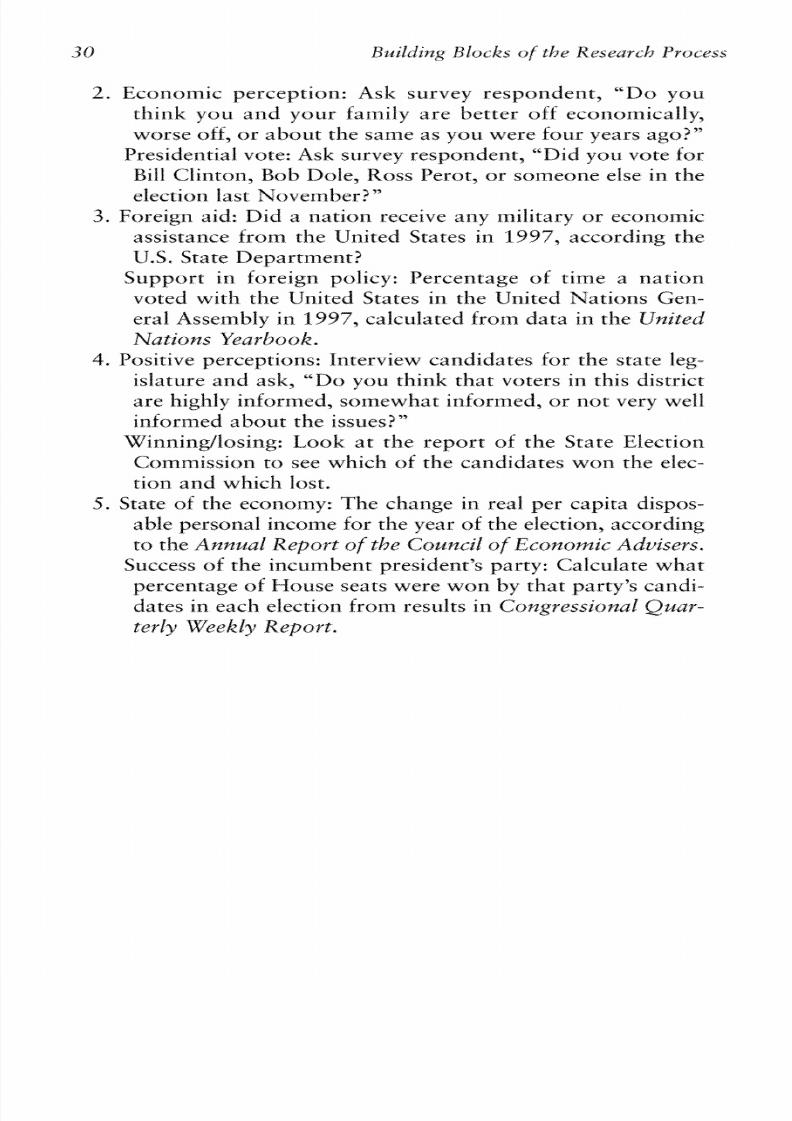
8/20/2019 Alan Monroe, Alan D. Monroe-Essentials of Political Research (2000)
http://slidepdf.com/reader/full/alan-monroe-alan-d-monroe-essentials-of-political-research-2000 45/214
fl
R ~ i l d l f z g Locks C>(
&:re
Research Prc~cess
2.
E c o n o ~ ~ i cerceytic~n:Ask swvey respondent,
""Do
you
think you and your hmily are better off eccrnotnically,
worse off, or ab ou t the same as you w ere four years ago?"
Presidential vote: Ask survey responden t, "Did you vote for
Bill Clintan, Bob Dole, Ross 13erat, o r surneone else in the
electioil last N c~vem ber?"
3.
Foreigxl aid: Did a nation receive
any
military or economic
assistance from the United States in
1997,
according the
U.S.
State Department?
Support in foreign policy: Percentage
of
t ime a nat ion
voted
with
the United States in the United Nations Gen-
eral Assembly in 1997, calculated from data in the Uni&d
RTatz'ons Yearbook,
4.
Positive perceptions: Interview candidates for the state
leg-
i s l a t ~ ~ r end ask, "D o you ttlink tl-rat voters in this distric t
are highly ink>rm ed, som ew hat informed , o r n ot very well
informed about the issties?'"
WinninglXosing: Look at the report of the State Election
Crjmmission to see which of the candidates w on the
elec-
tion
and
which iost,
5.
State of the economy: The change in real per capita dispos-
able personal income for the year of the election, according
to the
Annual Report of $he Council of
Ecorromic
AduiSe~s.
Success of the incuxnbent president" party: CaXculate w hat
percentage of House seats were wail
by
tha t party" scndi-
da tes in each election from results in
Coqressionab
Qsdau-
terly W eek ly Report ,

8/20/2019 Alan Monroe, Alan D. Monroe-Essentials of Political Research (2000)
http://slidepdf.com/reader/full/alan-monroe-alan-d-monroe-essentials-of-political-research-2000 46/214
Research Design
Once
we
have selected a research question and set forth one: o r
more testable hypotheses, the next step is to fc~rm ula te research
design.
This
step, alon g with the building blocks covered in the pre-
vious chapter, i s critically ixnportant in the research process.
People use the term research
design
in t w o different ways. In this
chapter, research design refers to the logical
method
by
which we
propose
to test
a
hypothesk.
But in a braa der sense research design
can refer to a whole proposal fur a research project tha t would also
include the review of the literature, details
of
how data will be col-
lected, a discussion of the statistical tests that will he used once the
data are collected, and possibly even a budget far the proposed ex-
penditures. This broader so rt
of
research
design i s
what
you
would
submit
if
you were asking for financial support for a projecc or ap-
proval Eor a graduate thesis proposal,
The Concept
o f
Causality
The types of research designs presented in this chapter are all in-
tended to test wllether one variable causes anutl-rer or causes tl-re
variatioil in another, As explained
in
the previous chapter, many
hypotheses use the language
of
callsation-far example,
"influ-
ences," ""leads o," o r i s a result
of.
The previous chapter itlcro-
d w e d the idea of a n independent variable (the cause) an d a depen-
dent variab le (th e effcct). Here we will see more completely wha t
this idea of causality means and how it can be determined,
In order to draw the conclusion that one thing causes another,
we m ust determine tha t three criteria have been m et, The first is co-

8/20/2019 Alan Monroe, Alan D. Monroe-Essentials of Political Research (2000)
http://slidepdf.com/reader/full/alan-monroe-alan-d-monroe-essentials-of-political-research-2000 47/214
uaricatiorr, that is, evidence that two phenomena tend to occur at
the same tirnes or for tl-re same cases.
If
we observe, for example,
that every time there is a crisis in foreign policy, presidential popu-
larity increases, or that people with high incomes are more likely
than poor people to be Republicans, we are noting evidence of co-
variation. Govariation is also called correlagkon, an d statistics that
measure the strength
of
covariatic~nare referred to as correlatiofz
coefficients-or simply
curreliatiorzs,
Ail types of research designs
intellded t o determine whether causation exists are set
up
to mea-
sure the extent
of
covariation,
People s o ~ ~ e t i m e save stopped there and assumed that covaria-
tion alone is grounds for concluding that causation exists. This
kind of reasoning can lead to the conclusion, for example, that
storks are respm sible for babies
or
that umbrellas cause rain. But,
as is often repeated in methodology courses, correlation does not
mean causality. Two other criteria must also
he
met, One is
time
order. fW;e rr.lust have evidence that the presumed cause (t he inde-
pendent variab le) happened before tl-re presumed effect (the depen-
dent variable), The third criterion is nonspurkousness, We must be
sure that any c~ va ria t io nwe observe betweeri the independent and
dependent variables is not caused
by
other factors. As we will see,
each type of research design attem pts to fulfil these criteria, with
varying degrees of success,
Types of Research Design
The
"?).ueW
Experirne~ztul
Dexigli~
W hen many people tl-rink of ""science," they th ink of experiments.
It is true that the physical and biological sciences and some of the
social sciences use experimentation frequently, though never exclu-
sively. It is i~ npo rtt ln t o understand
how
an experiment is set up,
not because experiments are terribly comxnon in political science,
but because the logic involved is relevant to all types of research de-
sign.
We
sometimes use the modifier ""true'3ltecause the term
ex-
perr'p~enir.s sometimes used to describe all sorts of tl-rings that are
not experiments a t ail,
Figure
3.1
presents an outline of what is required bp the 'kcias-
sic" experiment-the sixnpless version of a tru e ex pe rim en t.
Experimentation has its own vocabulary, employing such terms

8/20/2019 Alan Monroe, Alan D. Monroe-Essentials of Political Research (2000)
http://slidepdf.com/reader/full/alan-monroe-alan-d-monroe-essentials-of-political-research-2000 48/214
FIGURE
3.1 The
dassic
experiment
and a n example
A,
The C:lassic Experiment
Expcrimcntat Stimulus Pasttcst
group
{
f~tdcpcrmdermt
i
Assip subjects variable)
randomly or
by
L
matching
Control group Posttcst
il
(Llepcndcnt
variablc)
B, An Example: Hypothesis: Taking an introctuctory American
C;overnment course increases political interest,
Expcrimsntal S t i~~~utus Posttcst
R'Oui? {rake {Political
Assign students/fl course Interest
randomly
\
score) $
Compare
Control group {D onor 130srrcst
f
take
(
ffolitical
courscf Interest
score)
as
sul2jecd.s
and
slinzulus;
we will use them, but we will also see
how they are translated
into
the terms we have used to describe
hypotheses.
Th e classic experiment star ts
with
a gro up af subficts, tl-rat is, the
units
o f a ~ a I y s i s , hether individual people, labo ratory animals, o r
anything else. These subjects or
units
are then divided into two
gro ups by soxne method tha t would assure tl-rat the tw o group s are
as identical
as
possible on the dependent variable in the hypothesis,
The best: way t o do this is to rartdomb iasskrz the subjects tct the
two groups by sam e inethod such as flipping a coin,
X
this is done,
then the tw o groups shou ld, statisticalljf,
be
identical
in
their distri-
bution
on n o t only
the depende~it ariable but. also
o n
any otlzes
variables, wllether
or
not those variables can be measured. Sorne-
times random ization
is not
used, mainly because the number
of

8/20/2019 Alan Monroe, Alan D. Monroe-Essentials of Political Research (2000)
http://slidepdf.com/reader/full/alan-monroe-alan-d-monroe-essentials-of-political-research-2000 49/214
34 Research I>wign
subjects in the experiment is too small, Under those circumstances
it is necessary to use a pretest to rneasure the dependent variable.
Then a procedure catted "matching" is used to divide the subjects
into two groups that have very similar distributions on the depen-
dent variable.
The subjects in the first group, often called the experimental o r
treatment group,
then receive a
stimuists.
The st imulus (o r lack
of
it) is the indep enden t variable in the hypothesis. T he oth er gro up,
called the
colztrol g r o w ,
does not receive the stimulus. After the
stimulus has hacj time to work its expected effects, all subjects in
both groups are given
a
posttest
that measures the dependent
variable, Finaliy, the results of the two groups' ppasttests are coxn-
pared.
If
they are significantly different in the way predicted by
the hypothesis, then we can conclude that the hypothesis is con-
firm ed, (""Significantly"
k
a statistical term that will be explained
later in the
bor>k,)
Tc) understand ho w the classic exyerimerit can ""pove39he hy-
porhesis, it is useful to see how the three causaliq criteria are met.
First, it is the posttest comparison that shows whether there is co-
variation.
If,
for example, the experimen tal group measures higher
o n the dependent variable in the posttest, tl-ren we see th at she sub-
jects who received the stimulus measure higher on the test than
those who are not, Second, we inust be certain that the results are
nonspurious. Tlnis is assured by the fact tha t the exp er i~ne ntai nd
treatment gro ups were exactly the sam e
in
all ways before the stirn-
ulus was applied. T hat is why it is so importan t tha t
the
sstbjetlts be
assigned to groups by a n ap propriate m ethod, suck as randarniza-
tion o r matching.
If
they were assiglled t o grt.>ups n any oth er way,
then we could not be sure that any difference between groups was
caused by the stixnulus. (It is aiso assumed that all sub~ectswere
treated in the same way in all other regards.) Finally, the criterion
of time order is clearly satisfied by the fact that the stimulus (inde-
pendent variable) is applied
before
the posttest measures the de-
pelldent variable, Thus, a properly conducted experilneat call pro-
vide a ct~nvincingest of a hypothesis that one variahle causes
has a causal effect on-another.
Let us see
how
the classic ex prir ne llt could be used to test the hy-
pothesis that
taking
an introductory American Go ve rn~ ne nt ourse
increases the degree of political interest among college students.
(This example is also diagramm ed in Figure
3.1,)
First of all, we
might take as our subjects
ail of
the incoming freshmen a t a college

8/20/2019 Alan Monroe, Alan D. Monroe-Essentials of Political Research (2000)
http://slidepdf.com/reader/full/alan-monroe-alan-d-monroe-essentials-of-political-research-2000 50/214
on e year,
Using
the ~zniversity" corrtputer, we random ly separate
them into tw o gro ups, W e schedule one g rou p (tl-re experim ental
group) to take the course (let 's call it
PS IM),
whereas those in
the other g roup (the control gro up ) are not allowed to take the
course, At the end of the semesler, we require every freshman to
fill out a questionn aire that asks a list of questions ab ou t their in-
terest in politics. The questionnaire, which is the posttest in this
exp erim ent, is structu red such th at tl-re responses yield a score re-
flecting degree of political interest. If the experimental group-
the group that too k
PS
101-has a lzigher ave rage sco re than the
controt group, then we conclude that PS
101
caused greater in-
terest, confirm ing ou r hypothesis.
It is important to emphasize that manip~ fa f iu~
f
subjects is a
rlecessary part
of
any true experiment, Xn the PS 101 example, we
had to tell students wl-rether or not they would take tl-re course,
rather than allowing them tc-, m ake that decision, Such manipufa-
tion is necessary because self-selection would probably yield two
groups tl-rat wou ld n ot be identical in their political interest ini-
tially. Indeed, students
wh o
have more interest in politics are more
likely to choose t ~ tnroll. in A merican Governm ent, so the fact that
they have more interest a fter tak ing the course th an tl-rose wllo did
not take the course would prove ~ lo th in gn itself.
Although true experiments are generally considered to be the
best test of hypotheses, they are also subject to a num ber of practi-
cal limitations. One of the biggest problems is that it is difficult or
impossible
to
trtanjpulate trtany independent variables.
We
cannot
change a person's gender, race, age, ar rnany atlzer social charac-
teristics o r people" beliefs o r attitudes. N or can
we
manipulate
larger social phenomena, such as wars, econom ic con ditisns , elec-
tions, ar ather events. In fact, the use of
experimentation
in politi-
cal science has largely been iimited to investigations
of
communi-
cations, for we can manipulate,
at
least temporariIy, individuals'
exposure to sucl-t stimuli as cam paign speeches, advertising, news
reports, and ins trw tiona l events such as lectures,
Another problem with experimentation is a lack of representative
saxnples, W hereas nonexperirnexltal researchers usually make a care-
ful effort to use random samples of the entire adult populaticrn for
surveys, it is rarely possible to involve anythir~g ike a sa~rtple
f
the
general public in. an experiment. Typically researchers conducting a n
experiment advel-tise for people willing t o spend
a
few hours
of
their
time a t a specified location participating in a study in exchange for a

8/20/2019 Alan Monroe, Alan D. Monroe-Essentials of Political Research (2000)
http://slidepdf.com/reader/full/alan-monroe-alan-d-monroe-essentials-of-political-research-2000 51/214
36 Research I>wign
mtrdest fee, but this inevitably will excfude large segments
of
the
population. In the
PS I01
example this was not a problem, since
the relevant population consisted only
of
college studems.
Another freq~zent roEtlexrl is that experimeaits often are con-
ducted
in
an artificial setting, Cons ider the typical. situation in ex-
periments on effects of the mass media: Most people do not usu-
ally watch television in a strange place, surrounded
by
strangers,
know ing th at they will have to fill ou t a q uestionna ire afcerward.
Indeed, the experim ent may require w atching material ab ou t pol-
itics by people who would never expose themselves to such stim-
uli on their own, Hence we can never he completely sure about
wl-rether the effects observed in the exp erim enta l situation wou ld
be the same in real life.
A related probkm is that of outside influences, Most experi-
rnents in political science use hurnan beings as subjects, and hu man
beings cannot he as closely controlled as Laboratory animals. Thus
it is always possible tha t oth er stimuli, such as corrversations, new s
events, and personal experiences, might affect surne subjects.
If
the
time between the stimulus and the posttest is minimal, as it might
well be
in
a
highlf
artificial setting, then this corrcerrt is minimized.
But if tl-re experim ent runs fa r weeks o r m onths, as in tl-re
13S 101
example, there are innumerable possibilities for other influences to
exert an effect and contaminate the experiment, It is often a
diternxna fa r the researcher as to wl-rether to cons truct a Iixnited,
well-controlled experiment in a higMy artificial setting or to use a
real-world setting over a longer period a i d run the risk of havixlg
external influences affect the outcom e.
Finally, ethical considerations are of particular concern in hum an
experimentation. Unlike other research designs, in which subjects
are only observed, presumably with minimal or no disturbance to
them, ex p rim en ts d o som ethi t~g o subjects that they might n ot
otherwise experience, This is obviously a serious consideration in
biological, medical, and even some psycholr~gical esearch, where
stimuii or other experimen tal conditions (suc k as the w ithholding
of
medical treatment) could be very harmful. It is seldosrl a serious
probiexn in political science experiments, where stimuli usually are
limited to c.r>mmui~icatioils,ut possil?ie dangers must aiwa ys be
considered. Indeed, federal law requires that researcfi invoivitlg
hum an subjects undertaken
by
any institution receiving federal funds
(wi~ichncludes almost all colleges and universities) he approved by

8/20/2019 Alan Monroe, Alan D. Monroe-Essentials of Political Research (2000)
http://slidepdf.com/reader/full/alan-monroe-alan-d-monroe-essentials-of-political-research-2000 52/214
a local panek (The rule even extends to nr)nexperimeiital research
involving any contact with individuals, including survey research.)
Despite all these potentiaf prc.>blems,experimentation does have
consideratlte merit as a technique for testing hypotheses. Indeed,
every method has its limitations. The preceding discussion should
serve t o point ou t that aitho ugh experimellts are logically the best
way to fulfil1 the causalit)i criter ia, in many situations they are nut
the best choice of research design,
A
number of variations
in
experimental design expand on the
si~rtple lassic model to circn~ rtvent om e
of
the potential prob-
lems. One addresses the possibility that giving a pretest inay have
an effect o n the subjec ts, If the subjects a re initially given a yues-
tiuilnaire o n some political topic, tha t alo ne may increase their in-
terest or affect their opinions and thus potentially influence their
responses o n the posttest given an h our or tw o later,
A
solution to
this problem
is
the
Solomon four-group design, in
which the ex-
periment is done twice, once with pretests and once without.
13asttestcom parison can then determine the effect of the pretest as
well as tha t
of
the stimulus. Th e Solom on four-group design is ac-
tually
a
version
of
the f;sctorial
desigfs,
which
is
used when there
i s
rnore than one s t imulus (and thus mare than one independent
variable) o r d ifk rin g levels of the same stimulus. The experiment
i s
simply done two or more times with different subjects, so that
each possible combination of stirnuli can be applied, An example
would be a study
on
the effect
of:
precinct-level campaigning in
which o ne gro up of subjects were exposed t o politicat appeals only
by Democrats, one only
by
Republicans, one by both parties, and
a co ntrol g rou p tha t received
n o
appeals. Regardless
of
the
num-
ber of groups and combination of stimuli, the logic
of a11
experi-
rnent is the same,
The Quaii Eperiment
(Natgral
Experiment)
The second type of research design
i s
comrrtoniy called the quasi
experiment or na tural experiment, This is an u nfo rtrli~ate ahel as
it
is not a true experiment. It can be presented in rnuch the same
terms as a true experiment, hut it is [>h en used w ithou t any such
references.
A
better name might he the before-and-after design, f c x
that is clre essence: comparison of the dependent variable belore
and after the independent variable has heten applied.

8/20/2019 Alan Monroe, Alan D. Monroe-Essentials of Political Research (2000)
http://slidepdf.com/reader/full/alan-monroe-alan-d-monroe-essentials-of-political-research-2000 53/214
38 Research I>wign
Figure
3.2,
diagrams the quasi-experimental design. It does look
similar to the classic experiment, but it differs in two vital ways.
First, the subjects are not assigned to groups. Rather, we observe
which subjects have something happen to them and then go hack
and sort them into the experi~xtenta an d control groups. T hu s the
quasi experiment lacks manipulation of the independent variable,
which is the essence
o f
a true experiment, Second, the quasi ex-
periment requires a pretest af the dependent variable, so that t11e
amount of change can be measured for each group. It is a signifi-
cant difference in change between groups that would lead to a
conclusion th at the independerit variable influences the dependent
variable,
In
this way, the criterio n of cova&tz'tzn is met in this de-
s ig~ l ,We can observe whether the stimulus fix., the independent
variable) is associated with a different amouxlt
of
chaxlge in the de-
pendent varia ble.
But what about the other two criteria? The criterion of time
order is met, as this before-and-after design always includes a
rneasure of the dependen t variab le after the stixnulus-and so we
always know that the independent variahle came before the de-
p e d e n t variab le , But what about the c riter ion
of
nonspurious-
ness?
A
true experiment assures nonspurious results by starting
out with identical experimentai and cnlltrol groups,
But
in the
qua si-exp erim entd design, the tw o group s may be (a n d ~zsually
ar e) quite different from on e an at he r in many respects. Tile quasi
experim ent relies
on
the assu mption th at all of the oth er possible
factors, kaiown an d u nkno wn , th at m ight influence the depe nden t
variab le l-rave had their effects o n
all
subjects at the time
af
the
pretest, a nd there fore any differences between the g rou ys in the
extent
of
change f r c r r n pretest to posttest is presumed to result
f rom
tl-re stixnulus, that is, the independent variable. Admittedly,
this assumption is something we can be less sure about than the
principle that large, randomly assigned groups will be identical,
as is the case in a true experiment, But it makes possible the test-
ing
of
causal
hypotheses
in situations where a true experiment
would be difficult o r even imyr>ssibfe,
Figure
3.2
also outlines an example af a quasi experiment tl-rat is
similar to the example of a classic experiment in Figure
3.1,
The
hypothesis to be tested is that watching a presidential debate in-
creases intensity of support for candidates. The subjects are stu-
dents enrolled in large sections of an introductory political science
course. Before the debate, they are given a survey that measures

8/20/2019 Alan Monroe, Alan D. Monroe-Essentials of Political Research (2000)
http://slidepdf.com/reader/full/alan-monroe-alan-d-monroe-essentials-of-political-research-2000 54/214
FIGURE-,3.2 The quasi-cxpcrimcntal
dcsigrl and
an cxarnpIc
A,
The
Quasi-experimental Llesign
f feresr
(Delsendcnt
Subjects are no t
ass~gncdo groups f
m advance; they
are sorted after
~t
is
known
whrcls
experienced the \\
sr~mulu?;
JI
f feresr
(Delsendcnt
VartabIe)
Stim ulus 130srtesr Compute
(Independent (Deperldent Change
Vartable) VdriabIe)
+
Compare
Change
r
Stimulus 130srtesr Compute '
(Independent (ll"eper~dent Change
Variable) %nabre)
B.
An Example: Hypothesis:
Watching
a
presidenral debaee increases
itltensit-y
of support,
f'rereur
(Intensity
of
s u m a r t )
Suhjecn: all
studerlts tn a ctass
\\
Pretest
(intensity
of support)
Stimulus
(Report
watchmg
debate)
Stinzulus
(Report
nor watchit:
debate)
ot support)
Conzpare
their atti tudes about the candidates, including which catldidate
they prefer and
how
strongly they hold that preference. After the
debate,
a
second survey is administered, again
asking
for strength
of
preference and also asking whether o r not the stud ent watched
the debate. The surveys include
a
coded means
of
identification
so
that the results of a n individual's p retest can be com pared with his
or
her posttest while guaranteeing confidentiality or anonymity.
With matched pretests
and
postrests
in
hand, it is possible to calcu-
late whether the intensicy
of
can dida te preferences increased m ore
in
those wh o saw the debate (the experimental gro up ) than
in
those
who missed
the
debate (the contro l grttup). Tncidemall?i,a variet):
of studies over the years, including one by the au thor using this de-
sign,
have
generally confirmed this hypothesis. Presidential debates,
it seems, d o no t generally make voters favor on e cand idate over the

8/20/2019 Alan Monroe, Alan D. Monroe-Essentials of Political Research (2000)
http://slidepdf.com/reader/full/alan-monroe-alan-d-monroe-essentials-of-political-research-2000 55/214
40 Research I>wign
other; rathes, they srrengthen the preference for the choice the voter
has already made,
Th e
Correlational
Design
The correlational design is very simple. At a hare minimum it re-
quires
only
collecting data
o n
an independent and a dependent
variable a nd determ ining whether tl-rere is a pa tte rn of relationship.
I-.Iowever, it is usually advisable also to colfect data on other po-
tentially relevant variables an d statistically control for them, Figure
3.3
presents
a11
outline
of
this sirtlple procedure, The correlational
design differs from the quasi-experimental design in that it does no t
require any repeated measurements of a variable over time, (For
that reason, it is
also
called
a
"crross-sectionaImdesign,) It is bp far
the 111ost common a~proachn political scieltce research. To avoid
confmion,
it:
shoutd be pointed ou t th at "cr>rrelations,'"thnt is, sta-
tistical measurements of the strength of the relationsl~ip etween
variables, can be used not just in this type of design but also in
quasi experiments and in true experiments.
How
does this s i~ np le esign fulfil1 the three criteria
of
carzstlfiw
The exten t of covariation is clearly deterrnined by rneasuring the ex-
tent of correlatioil between the independent and dependent vari-
ables. The correlational design attempts to meet the criterion
of
nonspuriousness by analyzing the effects of control variables. This
metho d is nc>tas stro ng as that achieved by true experiments o r even
quasi experiments, because here we can contro l
only
k)ir those vari-
ables of which we are a ware a nd can measure, A1tkougl-s. some cor-
relational research may control for a considerable number of other
factors,
it
is rlever possible to control for eve~thinghat rllight he
relevant, Hawever, it is olren possible to ensure that some of the
most prom inent complicating h c to rs are not creating a spurious re-
lationship between the independent and dependent variables.
It is on the criterion of time order tha t the correlational design is
weakest, Since no difference is required in the point in time when
the indeyendent anif dependent variables are collected, we can never
be sure tha t o ne m ust be the cause an d the atl-rer the effect. Ho w-
eve4 as the discussion of independent and dependent variables in
Chapter
2
poiltted o ut, o ur knowledge
of
many subjects makes tha t
determination fairly easy,
VVe know
that although a person" gender
or race might affect his or her vote,
it:
could nor be tile other way
around, Hence, although the correlational
desigr~
s funda~nentally

8/20/2019 Alan Monroe, Alan D. Monroe-Essentials of Political Research (2000)
http://slidepdf.com/reader/full/alan-monroe-alan-d-monroe-essentials-of-political-research-2000 56/214
FIGURE-,3.3 The corrclationaI
dcsigrl
and exaxnpIcs
A,
The
Correlational
I3csign
Control variabtes
L\
i
h
Independent Correlation? Dependent
varia
hle variable
K,
An example: Hypothesis: Voter turnout
is Iower in
urban arcas.
Contrat
for income,
education
/
age,
party competition, etc.
\
\
Urbanization Voter
tumout
C , An example: Hyporl~esis:Campaign contact afiects voter;.
Czontrat for respondent's
/
arty identif cation
\\
Recall call-tpaign C:arrelation?
M-
Voted for
contact contacting party
weaker than the experimental and quasi-experiment4 designs,
it
can
provide considerable evidence of causality. And since it does no t
require any manipulation or even continued measurernenrs over
time, it can
be
applied
in
any situation
where
data can
be
collected
a n two a r m are variables.
Here is an example
ot:
a ca rrelational design (also diagramm ed
in Figr~re
3.3).
he a~ zt h or ished to test the hypothesis tha t voter
turnout is tower in urban areas. The units af analysis were cou n-
ties within a state. The indepellde~lt ariable, urbanization, was
operationalized as the percentage of population
Iivirlg
in "iurhan
places" according to
U.S.
census data, The dependent variable,
voter turnout, was simply the number
of
votes cast divided
by
the
votitlg-age popula tion.
When
these tw o figr~ res ere analyzed, the

8/20/2019 Alan Monroe, Alan D. Monroe-Essentials of Political Research (2000)
http://slidepdf.com/reader/full/alan-monroe-alan-d-monroe-essentials-of-political-research-2000 57/214
42 Research I>wign
relationship was vesy apparent. The ct~ un tie s ith no urban popu -
lation had the l-rigl-rest urnout, and turnout declined as urbaniza-
tion increased; the Ic~west urnou t was iil the m etropo litail areas,
which were alm ost entirety urban . But on e trtight questiort whether
it is realty urbanization that affects turnout; after all, urban and
rural areas differ o n many o ther characteristics kno wn t o he related
to turnout. Therefore, several other variables, ail availabie from
published sources, were used as control variables, including median
income, median education, percentage employed
in
manufacturing,
percentage in professic~nal nd managerial occ~tpaticjns, ercentage
nonwhite, median age,
and
a measure
of
party cs~rtpetition.When
these other variable were controlled statistically (using multiple re-
gressioil, a procedure that will be discussed in Chapter
IQ),
he re-
lationship between urbanization and turnout was only slightly
di-
rninisl~ed M onro e
1977).
Correlationa l designs are frequently used in connection with d ata
from surveys, Here is an exam ple (also diagrarrtmed in Figure 3.3)
where a control variable proved to be important. The researcher
(Mramer
1970)
wished to test the hypothesis that c o n ta ~ tl n g oters
in a doocto-door campaign caused them to vote for the party that
rnade the contact, The independent variable was measured by a sur-
vey question that asked whether the respondem remembered being
contacted by any workers from either
of
the political parties before
the election, The dependent variable was the respondent" reported
vote. Analysis of these tw o variables revealed a definite pattern , Re-
spondents w ho recalled having been contacted
by
Republican w ork-
ers tended to vote Republican, and those wlla had heard from the
Dem o~crats sually vr~ ted or the
Democratic
candidate.
But did this mean that door-to-door contact really affected
votes? When the respondents>party identification (i.e., whether re-
spondents identified themselves as Republicans, Democrats, a r in-
dependents) was used as a control variable, the relationship be-
tween contact an d vote disappeared. W hat had happened was that
party workers tended to contact vtlters who had supported their
party in the past, Those people voted for the party of the contact,
but they would have anyway. Like many other studies of cam-
paigning, this example showed tha t such attem pts to persuade vot-
ers rarely change their prek rences.
Tl1e example also ilfustrates the importance of using control
variables. Some correlational research reports can he found in
which, for one reason or another, the analyst does not attempt to
8/20/2019 Alan Monroe, Alan D. Monroe-Essentials of Political Research (2000)
http://slidepdf.com/reader/full/alan-monroe-alan-d-monroe-essentials-of-political-research-2000 58/214
control for any variables, The results nevertheless have some value,
because tlzey tell us that two variables da occur together. However,
our ability to draw any cr~nclusions bout causaliq between the vari-
ables is more limited. Methods
of
statistical controlling and their
ap-
plication to causal interpretation are presented in Cl~apter 0,
Although there are a great number of vtariatic~ils
n
these three basic
types of design as well as ways of combinkg them, there is also a
great deal
of
research
in
the literature
of
political and social science
that does not meet the requirexnents of even a correlational design
without control variables, Often this research does not invc~fve:
quantitative data (though it could do so), but it may be quite ern-
pirical. Essentially, such work is descriptive and may serve to in-
crease our knowledge, hut it cannot "'prove" anything
in
a scientific
sense. An example of such descriptive work is the
case
stgdy, in
which the history of a particular event is recounted and analyzed,
sometimes in great depth. There many examples of lengthy studies
on how particular policy decisions were made, Their authors seek to
shed some tight on why those decisions were reached, hut since only
one
case is studied, we have
no
way of knowialg what the outcome
would have been i f conditions and actions had beexi differexit. The
weakness of a case study is that it Iacks the ability to measure co-
variation. Even il
a
case study could determine causality in some
way, its conclusions would not he generalizations. However, case
studies and other, similar types of research can be valut~bie ecause
they may suggest research questions and hypotheses to which more
rigorous designs involving larger numbers
of
cases can be applied,
Exercises
Suggested answers follow the exercise questions, It is suggested that
you attempt to write these designs hefore you
look
at the answers.
Propose a hypothesis m d a research design of the type specified,
l . Write an experimental desigil for the research question "Dc3ets
negative political campaigning decrease voter turnout?'"

8/20/2019 Alan Monroe, Alan D. Monroe-Essentials of Political Research (2000)
http://slidepdf.com/reader/full/alan-monroe-alan-d-monroe-essentials-of-political-research-2000 59/214
44 Research I>wign
2.
Write
a
qua si-ex per iment4 design for the research question
""Boes increasing speed limits increase the number of traf-
fic
fataiities?
3. Write a corre latiollal design for the research question ""Does
election day registration lead to higher voter t t~ rn o u t? "
13ropose -rypotheses and w rite research designs of each type for the
research question
""Do
the efforts of precinct workers contacting
voters drrring a campaign
g a k
votes for their party" candidates?'"
1.W rite a n ex pe ri~ ne nta l esign for this question.
2 , Write a quasi-experimental design h r his question,
3.
W rite a correlational des igr~ or this question,
Suggested Answers
to Exercises
1. The hypatl-resis is th at exposure to negative advertisernents
will decrease tl-re intention to vote. Subjects are recruited
by
advert isements and offered
$15
to participate
in
a
stucly of iw a l news, They a re randomly assigned to tlze ex-
perimentai and control groups. T he experimental gro up is
shown a videotape
of
a
recent local newscast into which
has been inserted an advertisement far a U,S, Senate can-
didate tl-rat is ""negative" in nature, that is, it makes criti-
cal comments about the cmdidate's opporrent. The con-
trol group watches a tape with the same conten t except
that a nonpoliticai product commercial has been inserted
instead of the political ad. Afterward, the subjects are
asked
if
they intend to vote in the Senate election or x~ot,
The percentages of each group intending to vote are tl-ren
compared, This experimental design was used by An-
solabehere et ai.
( 1994);
the researchers also iwestigated
the sarne research question with a quasi-experirnencal de-
sign using agg eg ate data,
2. The
hypothesis is that increasinlg speed
limits
inrcreases high-
way fatdicies. When Congress allawed states to increase
speed limits on interstate highways, som e states did s o and

8/20/2019 Alan Monroe, Alan D. Monroe-Essentials of Political Research (2000)
http://slidepdf.com/reader/full/alan-monroe-alan-d-monroe-essentials-of-political-research-2000 60/214
others did not, This makes a quasi-experimental design
possible. Th e pretest is the traffic fatality rate in each state
during the last year that the speed limit was
SS
mifes per
hour in aII states, States are then divided into tvvo groups:
those that increased the speed Limit dtlring the next year
and those that did not. The posttest is the traffic fatality
rate in each state during the first year that some increased
the limit. T he cl-ranges in de ath rates from pretest to
posttest Eor the tw o gn(> ups re then compared .
3. The hypothesis is th at election day voter registration results
in higher voter t u r n ~ u t . he units
of
analysis are states.
Tl-re independent variable is whether or not a state had
election day voter registration in
1496,
The dependent
varia bIe is the percentage of voting-age population casting
batlots
in
tl-re
1996
presidential election, The relationship
between these tvvo variables
is
analyzed, controlling for
other characteristics
of
each state's population, includitlg
medial1 years of education, xnedian hm ity income, m edian
age, degree of party competition, percentage living in
~ lr b a n reas, an d whether it w as a southerr-r state or not,
1. The l-rypothesis is tl-rat people contac ted by someone work-
ing for a candidate will be xnore likely to vote for the can-
didate.
A
random sample
of
registered voters is selected,
and the s m p l e is rm dom ly divided into experimental and
control groups. Workers go to the homes of voters in the
experimental group and give a piece of Democratic party
campaign literature to the selected voter arid deliver a
short speech asking for support for the candidate b r Gon-
g e s s * Those in the con trol grou ps receive a nonpartisan
brochure and message urging them to vote, Xmmediately
after the election, the postcesr is administered by using a
tetep ho ~le survey asking wh ether each person in the
sampte voted and, if so, fur whom they voted. The per-
centages voting for the Democratic candidate supported
by the campaign workers is then compared for the two
groups,
2.
The hypothesis is that voters who recalt having been con-
tacted
by
a campaign worker for a candidate will
be
more
8/20/2019 Alan Monroe, Alan D. Monroe-Essentials of Political Research (2000)
http://slidepdf.com/reader/full/alan-monroe-alan-d-monroe-essentials-of-political-research-2000 61/214
Research I>wign
likely t o vote for th at cand idate. A random sample of reg-
istered voters is selected.
A
panet survey is conducted three
months beiore a gubernatorial election, and all respon-
dents are asked their voting ilatenticzn in the coming elec-
tion for governor,
Immediately
after the electian, the same
individuals are interviewed and asked for whom they
voted. They are also asked if they recalf havirtg been per-
sonally contacted
by
workers for either candidate. 'The
voting intention fi-om the first survey for each individual is
c o ~ ~ p a r e do his o r her response from the postelection sur-
vey to see whether there was arty change. The data are
then analyzed to see whether there was greater cl~ange
amoilg those who were contacted by either party, con-
tacted
by
both parties, or not contacted. Note that this is
similar to the research by Krarner
(1970)
used as an ex-
ample
of
a correlational design
in
Figure
3.3C.
But the de-
sign proposed here is a quasi-experimental design because
the dependent variable (voting inten tion) is measured bo th
before a nd after the independent variable (possible con tact
by a party worker) is measured.
3.
T he l-rypathesis is th a t the m ore time p ut in by precinct
workers fc ~ r party during an eiection campaign, the bet-
ter that party
will
do in the etect ion, The independent
variable, worker time, is measured by surveying botlz the
RepuI?.iican an d Dem ocratic precinct committee mem bers
fro117 a random sample
of
precincts in a state a t the time of
an election. They are asked haw much time they put in
during the c a m p a ip , and the net advantage in time to
Re-
p u b l i c a n s o v e r t h e D e ~ ~ o c r a t ss computed for each
precinct. Tlze dependent variable is the Republican per-
centage of the vote for a m inor office in each precinct, The
relatiomhip between these two variables is analyzed, con-
trolling
for
otlzer clzaracteriscics of the precinct available
from census data, including median income, percentage in
professionat and managerial employment, percentage non-
white, and m edian age.
A
num ber of studies have used this
sort of
design,
includinf: Katz and Eldersveld
(1961
and
Cutright
(1963);
mtlst have found tha t pre ci na campaign-
ing had oniy a small impact o n the vote,

8/20/2019 Alan Monroe, Alan D. Monroe-Essentials of Political Research (2000)
http://slidepdf.com/reader/full/alan-monroe-alan-d-monroe-essentials-of-political-research-2000 62/214
Published Data Sources
H o w do we get the data rlecessary to execute our research designs
and test hypotheses?
Often it
is possibie to use inform ation othe rs
have collected and made available to the public. This is fortunar-e,
because it is rare that even
a
very well funded project would
allow
the researcher t o travel to m any cities o r states, let alone to
aII
the
nations of the world, to collect information first-hand. Tl~is llap-
ter introduces some of the major published sources of data that po-
litical scientists use in their researctl and suggests some strategies
for discovering other sources, The chapter concludes with a de-
scription
of
content analysis, a technique for turning verbal mes-
sages into quantitative
data.
An explanation of the term
d n a
is needed here. Data xnight be
defined as empirical observations of;one or more zilnriables
for
a
rr~mber
f
cases, collected acrordil.tg t o t he
same
opercltional
def-
init io~s. he examples of operalional defini t ions presented in
Chapter
2
included several that were based oil published data
frorrl a reference source. W hen we have t o rely on existing sources
for our data, we must construct our operational defini t ions in
terms
of
the data available, P-iaving some familiarity with what
kinds
of
data are available and where they might be
found
makes
this task less difficult,
Although we usually think of data
as
numerical, this is not nec-
essarily the case.
Many
variables a re actually a record
of
which cat-
egory a case falls into-for exam ple, Repu blican, N or the as tern,
Catholic, high, medium, or low-but since the in fc ~ m a ti o n c~u nd
in published sorirces often csncerns
groups
or
aggregates,
the data

8/20/2019 Alan Monroe, Alan D. Monroe-Essentials of Political Research (2000)
http://slidepdf.com/reader/full/alan-monroe-alan-d-monroe-essentials-of-political-research-2000 63/214
Published
Data .Sozarccs
are in x~urnerical erms, usually a s totals o r in strine standardized
form such as percentages o r averages.
The Internet as Data Source
This chapter is mainly collcertled with published data, which gen-
eratly can be found in a library
or,
increasingly9on the -Internet, In
the saxnpling of data sources presented here, some Internet ad-
dresses are nt->ted ha t c an provide access t o such sources. (T he In-
ternet addresses cited here were accurate a t the tirne of this writing,
but keep
in
mind tha t they may have changed,) Da ta obtained h a m
the Internet should be used with caution, however,
for
several rea-
sons, One is that since there is virtually nt-> imitation ,
legal
or prac-
tical,
o n
what can
be
placed on the In t e r ~ ~ et ,here are ""data" to be
found there th at rnay be l-righfy misleading, if no t completely inac-
curate. Probabiy the safest strategy would be to limit
one"
use
of
the Internet for research purposes to those sites that contain infor-
rnation such as government documents and standard reference
books of
the type one w ould find
in
the library.
Second, although searching for data over the -Internet offers the
advantage of not having to travel to a library, actually going to a
research library ( s ~ t c h s mo st college an d universitjr l ibraries),
armed with the kind of background provided in this chapter, is
l kely to be mucl-r less tirne consuming than randornly searching
Web sites.
A
major advantage
of
searching the Internet for data
is
the possibility of finding informatio~~hat is more up-to-date than
printed data.
The
Importance
o f
Units
o f
Analysis
As
the discussion of hypotl-reses and variables
in
Chapter
2,
should
have rnade clear, the choice of unit of analysis is vitally imporcam
in planning a research project. This is especially true for research
that relies on published data,
as
these data sources usually are or-
ganized by type of unit of analysis. Much of such data is reported
by geographic
or
pc>litical units, such as nations, states, counties ,
municipalities, districts, cexisus tracts, and precincts, In planning a
research project that will use published data, it
is
necessary first to
make sure tha t the inform ation
is
reported for the particular unit
of
analysis needed. Often a given reference book includes data on
8/20/2019 Alan Monroe, Alan D. Monroe-Essentials of Political Research (2000)
http://slidepdf.com/reader/full/alan-monroe-alan-d-monroe-essentials-of-political-research-2000 64/214
Published Data Sozdrces 49
many different kinds
of
variables (economic, political, social) but
only fo r a single kind
of
unit, such as s ta v s or cities. T lzerebre, the
presentation of major sources of data below is organized not only
by the substantive type of data but also by the units for which the
data are reported.
The sowces suggested in this chapter are primarily of the type
that would provide the information necessary for testing hypothe-
ses, Fur exaxnple, if you wish to test a hypothesis about the rela-
tionship between the per capita income
of
nations an d their level
of
voter turnout, you obviously need to find sources that repo rt these
data for a large number
of
nations, preferably almost all
of
tfzem,
If you had to reiy on individual sources fur each nation, your
search would be much more time consuming, and you might wel
find that different sources use somewhat different definitions.
Hence the sources sugested here report data for many cases, and
often for d l possible cases,
Most published data relevant to political research are aggregate
data , that is, they rep ort summary figures o n the popu lation of
ge-
ograph ic a r polit ical units, Therefure, t w o reminders
of
points
made in Chapter
2
might be useful here, First, one must
be
careful
to avoid the ecological fallacy: D o not a ttem pt t o
draw
conclusions
about individuals from aggregate data. Second, aggregate data usu-
ally are m eaningf~rl nly i f they are standardized in some way, such
as in terms of percemges. Aggregate data ofren are akeady in an
appropriate standardized form, but not always. Usually the re-
searcher can convert the data into a useful form, such as
by
divid-
ing a total by the popu lation
of
the unit of analysis to produce the
percentage or per capita figure,
Most published data are aggregate, but soEBe are irtdividual,
rnainly where tl-re individuals a re not ordinary peopie. For example,
dara on a number of personal characteristics
of
members
of
the
U,S,
Congress, including their individual votes
o n
bills, is reacliity
avaita bie, And "individuals"
h
he sense of unit of analysis can in-
clude goverilment agencies, political parties, corporations, and
unions, to name only a few institutions o n which published data
can be found. But in general, published so w ces provide little i h r -
mation of relevance to political research about ordinary people as
individuals, though there is
a
great deal about groups of per~ple.
Therefore, it is sometimes necessary to collect such in lormatio n nor
from
a library but through an original survey, the methodoIogy of
which is presented in Chapter 5.
8/20/2019 Alan Monroe, Alan D. Monroe-Essentials of Political Research (2000)
http://slidepdf.com/reader/full/alan-monroe-alan-d-monroe-essentials-of-political-research-2000 65/214
50 Published
Data .Sozarccs
The following sectiorzs of the chapter; arranged by type
of
infor-
rnation a nd unit of analysis, are intended to introduce you t o a few
of
the published da ta sources frequently used in political science re-
search; it is just a sampling to get you started, Note also that the
sources Listed here are
suggested
only as places to find
data.
They
would not be helpfwfin locating research findings or generally
doing the background Iiterature review rlecessary to form ulate a re-
search question.
Strategies
for
Finding Data Sources
The resorirce to which many students turn first to find id or m at io n
in
a
library is the subject catalttg, ALtbough this is
a n
appropriate
resource for finding books that discuss research topics, it is nut nec-
essarily the most promising for locating data sources a n those top-
ics. Many of the most important collections of data, such as the
Statistical Abstract
of
the
United
States
(discussed be low), include
information o n so many topics that not ail would
be
inc1w&d in
the catalog, Jn additiorz, you will probably be interested only in a
particular unit of analysis, such as states, so information on cities
or
nations would not
be
useful fc~r ou, Here are some tips that
might lead you to what you need more quickly,
G i n Familiarity
with
Major
Source-
The
m are ftzmiliarity you have with the important sources, whether
you read them it1 the library
or
a t a n Jnternet site, the easier your
search will be. This cha pter is intended to provide the begir~nings f
that familiarity, Given the way libraries are organized, when you
find one reference sowce, you may well find similar and possibly
mtrre useful sorzrces nearby
As was emphasized
in
Chapter I, it is im port a~ lt o review past re-
search literature when fo m u la ti n g your research questions and hy-
potheses. The Iiterature review is
also
useful for l o a ti n g data, be-
cause you can see wl-rere otl-rers foun d their info rmation . This tells
you what was avaihabie and where it was found. However, to get
8/20/2019 Alan Monroe, Alan D. Monroe-Essentials of Political Research (2000)
http://slidepdf.com/reader/full/alan-monroe-alan-d-monroe-essentials-of-political-research-2000 66/214
Published Data Sozdrces
51
this information, often
you will.
need to
go
to the original report,
typically a journal article, rather than relying on a summar)r, such
as you might find in
a
textbook , Even when you have located a ref-
erence source, you may need to check the orig ind source
of
its datca
for more detailed information, suck as exactly how the variables
were defined..
Consult Librarians or Other "Expert.("
When at a loss for where to find inforrnatiorz on a particnlar type
of variable, consult the library staff, M ost college
and
university
li-
braries have personnel who specialize in different subject areas.
Your questions are likely to be better received if you have thought
ou t exactly wh at
yori
need, including the unit of analysis.
But
he re-
ceptive for sugestions on alternative indicators for your variables.
Cansuiting the library staff may he particularly important when
using U.S. government documents, because fibraries often catalog
this material in different ways from other publications. Your ii-
brary also may have databases o n CD-ROAMS, nd some material
rnay
be
available
only 0x3
inicrotitm o r micrt~ficlne, o advice f r t~ m
staff mem ber is partic t~larlyuseful for the uninitiated,
Faculty members are mother source of expertise. They have a
great deal of experience with subjects in their disciplir~es nd rnay
be able to poin t you directly to the source you need, M uck help is
available if
you
ask fa r it,
Take (rcurefgl
Note
of
the
Soulz-6.c
You
F h d
Once you
do
find inform ation that may fill your research needs, be
sure to write dow n just w here you found it, including all of the in-
formation about the publication.
This
is important for two rea-
suns. F irst, you may need to consult tl-rat source again. Second, and
more importailt,
any
research you present using those d ata will re-
quire a full c ita ti~ rz f the source, Recorditzg complete information
is particularly important for Xnterrlet sites, Although bibliographic
formats for citing electroilic sources have not yet been staildard-
ized, it is certainly necessary to include the author
(if
available), the
title, and tl-re da te as well a s tl-re exact site address an d tl-re da te you
accessed it
f
Scott and Garrison 1998, 123-1241,

8/20/2019 Alan Monroe, Alan D. Monroe-Essentials of Political Research (2000)
http://slidepdf.com/reader/full/alan-monroe-alan-d-monroe-essentials-of-political-research-2000 67/214
Published
Data .Sozarccs
Some General
Data
Sources
A
few
sources encompass a number of categories of both types of
data and r~ni ts
of
ax~a'iysis. he Stat is t ical Ah~tract f the United
States, published annut~lly y the U.S. Department of Coxnmerce,
includes data o n a wide variety of variables-political,
demo-
graphic, economic, artd social-for the United States as a whole
and for tl-re fifty states as well as a limited amount of inforrnation
on U.S. m etropolitan areas, m 4 o r cities, an d oth er nations. Al-
though most of the information in the Statistical Abstract comes
frorn the
U,S.
Brtreau
of
the Census and s th er government agencies,
it includes xnaterial lrom a wide variety
ol
private sources as well.
Also worthy of melltion is the World Almanac,
which
has been
privately published every year for over a century.
The W c ~r l d
Almarrac
reports information on an enorxnous nuxnber of topics, and
the latest edition
will
include some information more recent than
other published books. it is also the most widely available reference
book, an d is reasonably priced an d sold on newsstands.
The
America~
riazisdw I ~ d e xs a comprehensive guide to data
found
in
inost
U.S.
g u v e m e n t publications. i t allows searches by
subject matter as well as by ge og ap hic, econoxnic, an d
demographic
categories,
Iatrrrret sit-f.:Fedstats i s an on-line source that provides access to
statistical reports from many
U,S.
governxnent agencieschttpz
fedstats.gov>.
Demographic
Data
This section lists some sources of data on general po pula tion char-
acteristics, incl~~dingconomic an d social indicators-data such as
income, employment, race, age, literacy rates, and government
spending, Th e sou rces are preselited
in
terms
Of
units of analysis re-
ported,
For the world as a whole and the nations as units, the primary
sources a re pub lications
by
the United Nations. The
most
general
source is the United N ations Yearbook. M ore detailed inforrnation
can
be
found in other UN volumes such as the
Demogmphk Y e ~ r -
hook , Sd-atzstz'cal
Yearbook,
and U N E S C O Statistical
Yearbook,

8/20/2019 Alan Monroe, Alan D. Monroe-Essentials of Political Research (2000)
http://slidepdf.com/reader/full/alan-monroe-alan-d-monroe-essentials-of-political-research-2000 68/214
Published Data Sozdrces 53
Note that the information on individual x~atior~s
n
these (a nd most
other sources) is compiled from reports submitted by the govern-
ments
of
those nations. Therehre, it is always possible that there
are considerable irraccuracies in solBe of the data, whether by de-
sign o r by acciden t,
A number of other international agencies publish statistics on na-
tions, particularly e c o n o ~ ~ i c
ndicators.
The International Monetar).
Fund ( IMF)
publishes the lnterniational Financial Sli;ltistics Year-
book . The Wc~rlci
Bank
publishes the World Develczgf~ent eport
and World Tables. The Organization for Econt~m ic ooperation and
Development
(
QECD)
publishes the annual
Economic
O~tloi>k.
A num ber of private pubiications a lso repo rt these kinds of da ta,
usually dra wing them from the more ofGcial sources, but o ften p=-
setitir-rg hem
in
a more convenient farm, Examples include the an-
nual Sr~atennan'sYearbook, Polibicnl H a ~ d b o o k f t h e World, and
World
Econo1.7.iricDafa.
U.S. States
and LOL-alitZeS
The most convenient an d coxnprel-rensive source for dexnographic,
cconoxnic, atld social data for staees is the S~.arislical ~ S L ~ C I 'f
the
United States, described earlier, The basic source
of
almost all
U,S.
demographic inhnnation is the US. Bureau of the Census, which
reports it in a nurnber of publications. The census af the United
States is conducted every ten years, and each census produces a set
of
vofu~nes.Tw o overall volumes cover the x ~ at io r~s a whole and
by state:
U.S.
General Population ChariacteriPstics and
U.S.
Social
and Economic Characteristiw,
Separate volumes Eor each state pro-
vide more detailed breakdowns for units within the state, including
counties a nd xnunicipaiities, Soxnewhat easier to use is the c o u n t y
and City Dat;a Book, which includes a number of widely used vari-
ables
for
all counties and larger cities
in
every state, and the
State
and Metropolitan
Area
Data Book , which con tains similar data fo r
those units.
Intt.rrlet size: The site fc ~r n-line cetisus da ta is qhttp: cesus.
gov>.
Privately published reference books for demc~ graphic a ta on
states an d units within them include the Alfifanac of
the
Fifty States
and Katlzleen
0 ,
Morgan"
State R ~ x n k i ~ g ~ ,
A
list of scjurces for c~ th er atiotls c an
he
found in
Th e Stat is t iat
Abstract of the Ul-zitsd States,
8/20/2019 Alan Monroe, Alan D. Monroe-Essentials of Political Research (2000)
http://slidepdf.com/reader/full/alan-monroe-alan-d-monroe-essentials-of-political-research-2000 69/214
Published
Data .Sozarccs
Political and Governmenr;ll Data for Nations
This section lists a
few
sources of infc~rmation bout the govern-
mental structure and politics fcjr a large number
of
nations. This
sort of data is generally no t fo und in United Nations publications,
which are, as noted earlier, based on information reported by the
rlations themselves. This is particularly true of indicators that
might be used to measure variables such as political instability,
democracy, and civil liberties,
h a n g he possibfe sources tha t report some of this political in-
formation are the
Politic~al
Handbook
of
the World , World
Encly
clopedia of Political
S y s t e t ~ s
nd Parties, the Statesman's Year-
book, and the Ipzfernational Yearbook and Statesman2 WhoS
W h o .
Particularly valuabie
fo r its
data
0x1
variabies such a s assassi-
nations , politicai rights, an d irregular executive transfers is Charles
L,
Taylor and David
A,
Jodice,
World Ha ndbook o(Politic7al and
S o c i ~ lrtdiccltors, Williarn D , Cr>plin and Mictzael M. O'Leary3 Po-
litical
Risk
Yearbook,
offers up-to-date assessments an d predictions
about likely political and economic conditioils in all nations,
Of considerable interest to students
of
international politics are
da ta on m ilicary and defetlse activities. Sources for this sort
of
data
include Ruth Silvard,
World Mil i tary and Soczal Expenditures,
Wcjrld Military Expendztures and Arms Transfers, World Arufa-
mct3nts and Disl-krmanzct3n;ls Yearbook, and Military Balance.
The
largest collection of international voting results data
is
Thornas T. Mackie and Richard Rose,
The l~ternat iu lzal lmanac
o
Electoral History,
Kenneth janda"
Political Parties
contains
data evaluating parties and related topics for fifty-three nations,
Data
an
U.S,
Governmentand
Politics
This section lists a few of the most useful sources for finding infar-
mation on the branches of the
U,S,
federal government as well as
state and loca1 units. One geileral, though hardly compreheilsive,
source is Harsld W Stanley
and
Richard
6..Nierni, Vi;t~al
tatbfics
0%A~ntrricnvrPolilics, wl~ickis designed for undergraduate students.
Congre-~snd the
Presidency
As American political scientists have probably devoted
more
time
to studgillg the U.S. Congress than any oth er ins titution; a vast
8/20/2019 Alan Monroe, Alan D. Monroe-Essentials of Political Research (2000)
http://slidepdf.com/reader/full/alan-monroe-alan-d-monroe-essentials-of-political-research-2000 70/214
Published Data Sozdrces 55
xiumber
of
sources
of
data are available
0x1
the two houses, their
members, and the districts tl-rey represent, The mast basic source
for Coltgress is the Cclrzgressional Record , published every day
Cotigress is in session. The Congressiovtisf Record reports every-
thing said on the floor (and text that is inserred "into the record'"
but was not said) as well as all of the votes cast by individual mem-
bers. However, the Congrwstonal Record is large
and
not particu-
larly well organized, an d a nurnber of priva te publications a re usu-
all); more useful for most research projects.
Th e mtlst imp ortant referefices o n C ~ n g r e s s re the vario~zs ub-
lications
of
Corlgressional Quarterly, Inc.
The
basic source is the
C Q Weekly Report, which includes news stories on what is l-rap-
pening in Congress and in gowmmeitt and politics generally as
well as the votes of each member
o n
biifs an d im por tant procedural
questions, If your research deals with past years, the annual Con-
gress io~alQuar&rly Ajmanac compiles much
of
the weekly infor-
mation systematically, The biennial Pi?l'itics in America provides
profiles of mernbers m d el-reir distr icts,
Cortgress
alzd
the N i l t i o ~
s
a set of books that compiles information over many years. Con-
gressional: Q uarte rly has long provided measures such as the presi-
dential support score, a measure of how often Congress has agreed
with the administrat ion. A competing
weekly
publication is the
Nationai Jourvtal, which is similar to C Q Weeky Report but con-
centra tes so rnew hat rnore on. the executive branclt.
To track down the content and status
of
hills currently under
consideration, the researcher may consult a Commerce Ctearing
House publication, the Congressional
Index.
There a re malty othe r private pub lications on Congress. Particu-
larly useful is the bienxiial Al-ma~zac fA8"tterican Politics, which in-
cludes personal data on every member of Congress, their votes,
their districts, their campaign finances, and ratillgs
of
their voting
records by interest groups. John F. Bibby and N orm an
J,
Ornstein's
Vital Statkt tcs Co15gressassembles many useful sets of variables.
More detailed data
o n
campaign finance may be found in the
Al-
manac
of Federat'
PACs arid Larry Makinsoxi arid Joshua Cold-
stein, Open Secre&:
The DolEur
Power of PACs in Coggress,
The ultimate source
fu r
the data on congressional. districts that
appear in maliy
of
the aforementioned sources is a publication
of
the
U.S.
B ~l re au f the C ensus called
Population arzd Housing
Characteristics far Congressional Districts,
which presents data
in
separate volumes for each state,

8/20/2019 Alan Monroe, Alan D. Monroe-Essentials of Political Research (2000)
http://slidepdf.com/reader/full/alan-monroe-alan-d-monroe-essentials-of-political-research-2000 71/214
56 Published
Data .Sozarccs
Many
of
the sources cited above for Crjngress, such as the
CQ
Weekly Report and
the
A l ~ ~ a n a cre
also very useful far informa-
tion on the presidenr. Other sources include Coilgressional Quar-
terly's
Guide
t o
the Presiderscy
and
Lyn
Ragsdale,
Viul Statistics
ciln
the Presidency.
I ~ t e r n e t
ites:
Information on the two houses
of
C ong ess , in -
clud ing docu m ents an d votes fc>r recent years, may be forzlxd a t
~I-xttp://uvww.clerkwetn.X~otlse.g~vrnd
<http:llwww,senateegovr.
The mast general source for data on state governments is the an-
nual Book
of
t he
S t d k s ,
published by the Council of State Covern-
ments. O th er sources include Kathlcen
0 . Morgan,
S a t e R a n k t ~ g s ,
which deals mainly with spending; Kendra
A,
Hovey and HaroXd
A,
Hovey, C Q S
Stage
Fact Finder: Rankings
Across America;
and
Alfred
N .
Garwood, Almanac
of th e Fifty
States.
M ore derailed inform ation may require rekre ltce t o publications
from ir-rdividual states. The
Statistical
Abstract ir-rcludes a list of
major state sources, and
M ,
Balachax~dran nd
S.
BaXachar~dran's
State and Local Statistics Soz-lrces
provides a detailed Listing,
For local governments, the basic sowce is the
M u ~ i c i p a lYear-
hook*
Results of federal eilections-that is,
f c ~ r
he presidench the Senate,
an d the House-are refativeiy easy t o find. Congressional Q ua r-
terly's Cude
m U.S. Eleiticms
reports statewde and district figures
for these offices since 1824. The
America
Votes series, published
every two years since 1956, r e p r t s vr>tesfOr federal offices and
governor by county.
America at the
Polk
does
the same at the state
level for tile earlier years of the twentieth century. Walter Dean
Bumham"
Preszde~~iclJallots,
2
8.36-1
842
has presidential results
by counties, The World Alrntzrt~zcprovides county-by-county re-
turns fo r recent presidential elections, Many of the general sources
cited above, including the
Satist ical
Al~s t rac t , lso provide some
state-level data .
Results for s tate
and
focal elections are rnore problematic. M os t
state governments publish reports on each election for statewide
and state legislative elections for the district and county level. For

8/20/2019 Alan Monroe, Alan D. Monroe-Essentials of Political Research (2000)
http://slidepdf.com/reader/full/alan-monroe-alan-d-monroe-essentials-of-political-research-2000 72/214
Published Data Sozdrces 57
smaller llnits, such as wards and precincts, typically one must turn
to Local sources, Sometimes election results are published in local
newspapers shortly after the election. But for precinct returns it
may well he necessav to go to the city o r csunty office responsible
h r administering elections
to
obtain such inbrmation, Tf you are
contemplating a project that would require such localized election
data, it is especially important to make sure that the data can be
obtained before proceeding any further,
Survey
Data
Although political science research frequently relies on survey data,
most researchers are na t in a position to con duct their own surveys
on a large scale and must instead make use of the results
of
surveys
conducted by others. The largest body of pubtished survey resuits
is fc~un d n the
American Public
Qpi~ion
n d m
and the accompa-
nying Americiarl
P ~ b l i cOpirtion
Datu, which begin
with
l 9 8
l
data. The
Igdex
is just that , a topically arrangcd list of survey ques-
tions, To find ou t the answers t o a question cited in the I ~ d e x , ne
must then consult the
D a t ~ ,
microfiche collection of survey re-
ports from a wide variety of sources.
A
number of other sources are available, The Gallup Poll pub-
lishes The Ciallup Report (m on th ly since 53651, which provides a
breakdow n of the responses to each question by a standard set of de-
mographic variables.
The
Galiap
Poil
is
a set
of
volumes going hack
to X935 reporting all Gallup surveys in a more lim ited form * Eliza-
beth H an n H astings an d Philtip K, Hastings"
Igdex
to
International
Publr:c Opi~ion
annual since
1978)
reports surveys from the United
States and many o ther nations, Floris W moll% A ~nzeric~~zro-
file
reports results from a nurnber of questions repeated from
1972
to 1989 in surveys by the Natioilai Opinion Researcfr Genter,
Although published results
of
srtrveys from sources such a s those
cited above are necessarily aggregated, they can be used as sources
of
data for research designs that compare the results
of
different
surveys. E x a ~ ~ p l e s
f
this type of research include the many analy-
ses of how presidential popularity changes over time je.g+, Mueller
1973; Edwards 1983) .There is also a body of research th at uses re-
sults of surveys from many sources and co i~ b ir te shis with data on
governxnent policy decisions to assess the relationship between
public opinion and public policy
(e.g.,
Page and Shapiro
1983;
M o r~ ro e 5398).

8/20/2019 Alan Monroe, Alan D. Monroe-Essentials of Political Research (2000)
http://slidepdf.com/reader/full/alan-monroe-alan-d-monroe-essentials-of-political-research-2000 73/214
58 Published
Data .Sozarccs
Jatenzet site: Recent survey results from the G allup Poll may be
found at
<http://www.galIup.corn>.
O t l ~ e r ites include the P rince-
toil Srrrvey Research Center *1http:Nwww.pri~-~~etc1n~edul-ahe1sc~n
index>, The Q du ~r tXnstitute at the University of North Carolina
<http:l/www.irss.unc.edu>, the Roger Center <http://www,roger-
center,uconn,edul>, and the Social Science Data Archives-Nl"ortt-2
Arrterica .=http:llwww,nsd.uib.no/cessda/namer, htrnlz. T he N a-
t iona l Elec t ion St~~dies ,iscussed below, may be consulted at
*~http://www~umi&,ed~-nes;. .
Political
scientists also make considerable use of the individuai
responses to surveys conducted by others, thus
allowing
them to
test hypotl-reses ab out individual behavior. Indeed, a Iarge pa rt of
the research oil voting behavior in the United States since 19413 is
based on the National Election Studies ( N E S ) onducted every two
years by tl-re In st itu te
for
Social Research at the University of
M ichigan, Data files containing the answers g v e n
by
individual re-
spondents to each of these extensive surveys are distrib~zted
through the Inter-University Cansortiurn for Political and Social
Research (ECPSR), a n o rganization
to
which most uiliversities and
many colleges belong, The
TCPSR
also archives the results
of
hun-
dreds of other surveys as well as other data sets, all available in
computer-readable form, The ECPSR representative at a member in-
stitution should be contacted for frrrther information, The complete
set of
NES
survey data from 1948 to 199"7s available on CD-RO:V.
Content Analysis
The sources cited in the previous sections provide information that
is already in th e fcjrm rleeded for da ta ana lysis s r can be tu rned
into a data set relatively easily, But often researchers in the social
sciences wish to make use of information structured very differ-
ently, such as the text of speeches, news articles, or
o t h e r
docu-
ments, Is it possible to analyze such material in the same objective
and systematic way as aggregate data, including the use of statisti-
cal analysis? Xn fact it is.
Tex tual da ta ca n be analy zed quan titatively througl-2 co nte nt
analysis. This method has been defined as "a ny technique f i r m~zkirzg
i n f ; ? r ~ r ~ ~ e ~
y
objectively a m sysztmnticc7EEy identif5ti~zg pecified cCf~7r-
acteristics
of
messdges" "erelson
19 7it),
Content: analysis
is
mast
ctm moniy associated with published verbal texts, but can also be used
in conjunction with answers to spen-ended q~zestions
n
surveys.

8/20/2019 Alan Monroe, Alan D. Monroe-Essentials of Political Research (2000)
http://slidepdf.com/reader/full/alan-monroe-alan-d-monroe-essentials-of-political-research-2000 74/214
Published Data Sozdrces 59
Content analysis was developed in the early twentieth century
an d wa s first used for the analysis of newspapers, Later it w as ap -
pl ied to propaganda, part icularly during World War
II.
It has
been used by researchers in many fields, including literature, [in-
guistics, history, cornxnunications, and education as well as all of
the social sciences.. Exam ples fro m pc-~liticai cience include the
analysis
of
diplomatic messages (North et a1,
1963),
speeches by
presidents , and pol i t ical party pla t forms (Pomper
19&0),
n d
countless studies
of
news media content (e.g., Patterson
f 980;
Robinson an d Sheehax~$983).
Content analysis is a
valrtable
research tool that should not be
overir~oked n planning a research project. It is obviausly app ropri-
ate and often essential if the research question deals with content
itself, such as the question of whether news coverage
of
a political
caxnpaign is biased. But content analysis is also valuable as an in-
direct measure in situations where more direct observational meth-
ods c a m o t be used. For instance, we cannot interview the popnia-
tion from past gene rations, bu t we can systexnatically analyze what
they wrote in speeches, letters, Ilewspapers, and other documerrts.
Content analysis is a
datld
collection
method,
not a type of re-
search design. Indeed, content analysis can be used in conjunction
with
any
of the research designs presented in Chapter
3, All
of the
usual stages in the research process apply when ~zsing ontent
analysis, but some deserve particular ernpl-rasis. One is the impor-
tance of having a clear theoretical framework, research question,
and hypotheses, These are highly advisable for any kind
of
re-
search, but they are particularly im portant w l ~ e n lanning conten t
analysis, because fai iure to do so could mean that the whole
process
of
analyzing a large amount
of
textual material is wasted
effort, The steps that must be taken in a content analysis are the
same as those in any other scientific investigation, but they have
some slightiy different twists,
Steps in Content Analysis
In the following explanation, content analysis will he illustrated
with the example of
a
simple research yuestion:
D o
newspapers
give better coverage to incumbent candidates than to c ha lle ~ ~ g er s?
This
question rnight produce two hypotheses. One is that newspa-
pers tend to g ive more coverage to incumbent candidates far local
office, an d the o ther is tha t new spapers tend to give more favorsthle
8/20/2019 Alan Monroe, Alan D. Monroe-Essentials of Political Research (2000)
http://slidepdf.com/reader/full/alan-monroe-alan-d-monroe-essentials-of-political-research-2000 75/214
6 0 Published Data .Sozarccs
coverage tct incumbents, These hypotheses csuld
be
tested with a
correlational design, We would also need to control for other po-
tentially relevant variables, such the party affiliation of each candi-
date for the eoffices we are studying.
Define the
Population
We m ust first define tl-re popu lation, th a t is,
specify
the
b o b
of
content to which
we
wiSh t o 6r(?~em&e. n our example, we are
obviously interested in newspaper stories ab ou t cand idates, but in
which
newspapers-air
newspapers, all daily papers,
only
papers
with a circulation over a certain number, papers in a single state,
or only one particular p ap er? Ou r decision would be based on the
arnourlt of time and effort we can devote to the content analysis
as well as o n h ow accessible the p ape rs are to us, In tl-ris case we
can , as discussed below, define a Iarge: population-say, all daily
newspapers in the United States with a circulat ion of over
50,000-and then take a sample of tha t population-say, a ra n-
dom sample of twenty of those newspapers.
Since
we are not in-
terested in everything prirtted
irt
those papers, we must specify
wllat kind of stories we will analyze. For our example, we might:
select al l stories about candidates
in
any general elections for
courltJr offices. F in a ll j~ ~e m ust specify the time period to he c m -
ered, In this example, it miglzt be from
May
t o th e N o v e r n k r
election
in
a particular year.
Sele6.t the
liecording
Unit
The recording unit is not necessarily the same as tl-re unit of analy-
sis that the hypotl-resis would seem to imply. Rather, it is the seg-
FEent of content
for which
data o n th e variables
wilE
be collected..
Trr
this respect, content analysis is s o ~ ~ e w h a tifferent from other
data coIlection metl~ods,because verbal texts can be divided sev-
eral different ways.
The smallest recordirlg unit in content analysis is the
word.
We
can do frequency counts on the occurrence of individual words,
such as how many times an individual's name is me.tltioned,
How-
ever, the context in which a word is used is so important that
longer units are frequently needed.
f
econd, tl-rere is the sentence (or
possibly the i~ ldepe lldent lause in a com pou nd sentence). Each
serltence could be classified o n a n u ~ ~ b e r
f
variables. P o ~ ~ p e r

8/20/2019 Alan Monroe, Alan D. Monroe-Essentials of Political Research (2000)
http://slidepdf.com/reader/full/alan-monroe-alan-d-monroe-essentials-of-political-research-2000 76/214
Published Data Sozdrces
6
l
(1980)
used the sentence as a unit in his analysis
of
Republican and
Democratic platforrns froxn
1948
t o
1 976,
The must commonly used recording unit is the
item,
meailing a
whofe unit of communication. What constitutes an item can vary
greatly depending on the type of comxnunication being studied.
With newspapers, the story is typically selected; in news broad-
casts, it would also be the story or
sqmsnt.
An a n a lp i s of televi-
sion entertainment program s, such as on e investigating the axnount
of violence depicted, might well use the
program
as the recording
unit. Although an item can be of any length,
far
most purposes
very long iterns, such as whole books, are problematic because of
the difficulty of classifying such large bodies of content,
Another possilsle unit is the
theme,
A theme is rather bard to
de-
fine; it might be described as any occurrence of a particular idea
that we are interested in. Themes might be used as recording units
in analyzing, h r example, a single
book,
but more typically
we
woufd record the occurrence and frequency
of
a particular theme
within each recording unit.
These examples are just a sampling of the ways verbal content
can
be
divided for the purposes
of
analysis. The choice of
unit
de-
pends greatly on tl-re type of con ten t to be analyzed a s well as on
the research question t o be investigated.
In
the example of newspa-
per coverage of local elections, we would select each story about
candidates for coumy office as ou r recording unit,
I den t f i
and
Operationully
Defi~zehe Variables
Next come the variables. In our two hypotheses, the independent
variable is whether the candidate was an i ~ ~ c u m b e n tr a challenger.
The dependent variables are the quantity of coverage an d the qua l-
ity of coverage, But there are several ways to operationalite each,
and we might wish to use more than one.
The qutlntity of coverage is an exaxnple of
a st-iuctural
character-
istic of a message, a relatively objective and unambiguous variable.
We can m easure the quan tity
of
newspaper coverage in terms of the
nurnber of w or ds o r the 1errgtl-r of the s to ry in coluxnn inches.
Broadcast news stories are usually measured in terms of time, that
is, minutc;s and seconds. The length-of-.story measure we select be-
comes our operational definition of quantity
In our newspaper example, we might find it useful to measure
other strucrural attributes as well, such as whether the story

8/20/2019 Alan Monroe, Alan D. Monroe-Essentials of Political Research (2000)
http://slidepdf.com/reader/full/alan-monroe-alan-d-monroe-essentials-of-political-research-2000 77/214
62 Published Data .Sozarccs
appeared on the front page or whether it was accompanied by a
picture of the candidate, We would also need t o record wl-rich can-
didate and office was the subject of the story, and it would be ad-
visable to keep a record of which newspaper it appeared in, the
date, an d th e page number, if only to rnake it possiHe t o check for
erro rs in da ta collection. VVe would have to know, preferably in ad-
vance, who a11
of
the possible candidates were and which were in-
cumbents.
The
other dependent variable, quality of coverage, involves the
sgbstarttive characteristics of a message. We might attempt simply
to classify each campaign story as positive or negative toward the
candida te, but tl-ris can be difficult t o d o, M ore useful would be
first to specify the
catqor ies
we will use to evaluate each story,
After reading a
good
num ber of stories, we could identifr the corn-
rnon categories of
commentary
about local candidates-experi-
ence, persmai at tributes, part isanship, and issues, plus the
in-
evitable "iotf-ter.'"ach of these categories would then be
subdivided into comments that were positive, negative, and neu-
tral towar d the cand idate in question, We should then attempt to
specify the
kind
of w c~ rds nd phrases th at w ould qualify for each
subcategory, For exam ple, ""hoesty" would be a positive persona
refer etlee,
Sample the
Pop#
lu
tion
Whetl-rer o r no t we I r~ ok t all of the con tent in the p opu lation w e
have defined is a question of how much time and other resources
are available,
In
ou r example, we have already decided
to
look at a
sample of twenv daily newspapers, hut we might not have the re-
sources to analyze all of the local campaign stories over a six-
m onth period, Instead we c m take a random sample of those sto-
ries. Randonl sampling is discussed in Chapter
S
n
connection
with survey research, but with content analysis it is usually a sim-
ple process, as we usually can identify all
of
the possible text mate-
r i d an d specify where to find it, In tlze case
of
these newspapers, we
know tha t they are published each day, so we could take a random
sample
of
thirty days from each paper, either by using a random
rlumher table or simply
by
taking every sixth day. (It would no t be
advisable to tak e every seventll day, as that w ould give us the same
day of the week every time.)
8/20/2019 Alan Monroe, Alan D. Monroe-Essentials of Political Research (2000)
http://slidepdf.com/reader/full/alan-monroe-alan-d-monroe-essentials-of-political-research-2000 78/214
Published Data Sozdrces
Glkect the D a t ~
We would then be ready to go through the selected issues of the
newspapers. It would be advisable to prepare a form for the data
collection, such as a sheet of payer that lists each variable, includ-
ing all categories
of
the quality of the coverage, We would record
that inlormation
for
each story we found ab ou t a local catrtpaign-
this is referred to as coding. There are tw o ways to record the data
on
the various categories c>f pc~sitive nd negative coverage, O ne is
simply to record whether or not there were any rekrences such as,
for e x m p l e , positive comrrtents on experience,
Slightly
more time
consuming, but more valual>le, wo uld be to record the rlttmber of
rekrences in each category, When we have finally gone through all
of
the selected newspapers and csded
all
of the relevant data, the
information from o ur coding sheets can be entered into a n app ro-
priate computer program for analysis.
Analyze the Data
It is now passible to test o u r hypotheses. The m etl-rods of statisti-
cal analysis to be used wilt be described in later chapters,
but
we
can preview some of' it now. Data prc~duced
by
content analysis,
like m y oth er da ta, can he evaluated in tw o general ways. First
of
all is
frequency
analysis, anotl-rer name for univariate sta~istics
(Chapter
4 ) .
Tjfpically this entails simply tabulating how often
different variables occur, In our example, frequency analysis
would tell us such things as how much coverage the newspapers
gave to the local campaigns and the extent to which it concen-
trated
o n
the different categories of evalu ation , such a s issues and
experience, But CO test our hyyocheses, we wou ld have to p er fo r~ n
contingency anafysis, w hich is ano ther n am e fur mu ltivariate sta-
tistics (Chapters
8
a1-d
9).
Contingency analysis w t~ u ld nable us
to coxnpare incumb ent candidates an d challengers o n the q uantity
of coverage each received, as measured bo th in the number of sto -
ries
artd in
their
length
in column inches, as well as the quality, as
rneasured by the number of positive and negative comments each
received. We could also control for the party of the candida te and
the particular office being contested (C ha pte r 50). hese analyses
cou ld be conducted fo r each newspaper as well as for tl-re sample
as a whole.

8/20/2019 Alan Monroe, Alan D. Monroe-Essentials of Political Research (2000)
http://slidepdf.com/reader/full/alan-monroe-alan-d-monroe-essentials-of-political-research-2000 79/214
Published
Data .Sozarccs
Issues in C ontent Analysis
An inherent problem in any content analysis, particularly that of
the substantive varieth is objectivity. A decisiorz as to whether or
not a particular word or phrase fafis into one of our categories is
often somewhat subjective, that is, it may depend on the personal
j~ldgment
of
the person dt.,intg the coding a t that moment. Although
this problexn cannot be avoided entirely, there are some steps that
can be taken t o minimize it. First
of
all, this is particularly a prob-
lem when several people are intvolved in the data collection. The so-
lution is t o have more than one person cs de the same subsam ple
of
text and then compare their resuits to see whether they coded the
same m aterial in the same way,
The
extent of the similarity of their
decisions is called intercoder reliability and can be evaluated by
several statis tical measures. Even if o ne individual will be do ing all
of
the da ta colfection, the same a pproac h could be used
by
having
several othe r people code som e
of
the same material to see if there
are any subjectivity probfexns. It is also im po rtan t to m ake as clear
as possible what kinds of
words
an d phrases should
be
included
in
each category Finally, when the results of the content analysis are
presented, it is impor tant to include as many exam ples as possible
of how
actual statements were coded.
1st using content analysis, as with many other methods
of
dam
collection, it is va l~la ble o incorporate data from different sources.
This is particularly im po rtan t wh en
a
content analysis seeks to draw
conclusions about the effects
of
communications. Thus researchers
such as 13atterson
(1980)
and Graber
(1988)
have combined surveys
of
individuals with content analysis
of
the news coverage to which
their responderlts were exposed. Pomper (1380)not only used the
content analysis of party platbrxns to catalog the promises rnade by
the parties hut also used documentary sources to determine the ex-
tent to which those promises were fulfilled in later years.
Exercises
Answers to the exercises follow, It is suggested that you attem pt to
formulate solutions before
fookirrg
a t the answers,
Follt~witlg re several variables that might appear in hypotheses.
For each, one, the unit
of
analysis is given, Your task is to devise an
8/20/2019 Alan Monroe, Alan D. Monroe-Essentials of Political Research (2000)
http://slidepdf.com/reader/full/alan-monroe-alan-d-monroe-essentials-of-political-research-2000 80/214
Published Data Sozdrces 65
operational definitiorl based
olx a
published data source, This datca
source should be one tha t would provide the information for all o r
most of the possible cases.
The
exact data source should he cited
with csmplete bibfiogragflic information. fn order to do this, it is
necessary to actually look a t tha t source to see exactly w hat infor-
ma tion is available.
1 .
The levei
of
mass political participation in U,S, states
2. Milit21ry spending of
a
nation
3.
Liberalism of a
U.S.
representative's voting record
4.
Economic development
of
a
nation
5. f uccess of a U.S. president in dealing with Congress
Propose a research design using content analysis tha t could be used
to investigate the research questions 'Tb what extent have Ameri-
can party platlorxns increased their attention to the problexn of
crim e over th e years?" a d TElave Republican platforms given
mtrre attention to crime than Dem ocratic platfC~rms ave?"
Suggested Answers to Exercises
1.The percentage of the population eighteen years of age and
older in each state ca s ti w votes for presidential electors in
1996. Source: US. Bureau
of
the Census,
Statktical Ab-
struct
of he U ~ i t e d tates, 3998
(Washinrgton,
DC: U.S.
Government P rinting Office, 1998),298.
2 , M ilitary expenditures as a percentage of each nation" grc~ss
national prod uct in
1996
(or
latest year availab le). Source:
Ruth Leger Sivard,
World Military
arzd
Sockl Expendi-
lures,
1996
(Washington,
DC:
Wcjrld Pric~rities,19961,
45-47,
3.
The rating given to each representative's voting record by the
interest group Americans for Democratic Action in
1994,
Source: Michaei Barc~ne nd Gran t If~ifusa,The
Almanac of
Amertcapl Politics 2000
(Wi;nshington,
BC:
Nationai
Journal , 1 9 9 ) . (D ata o n individual representatives are
found throughout the bhook.)

8/20/2019 Alan Monroe, Alan D. Monroe-Essentials of Political Research (2000)
http://slidepdf.com/reader/full/alan-monroe-alan-d-monroe-essentials-of-political-research-2000 81/214
66 Published Data .Sozarccs
4. The per capi ta gross domest ic produ~t GDP) of each na-
tion. Source:
The
World Almarzac
and
Book
of Facts,
999 (IWalnvvah, NJ:
Wc~rld
Aimatlac Boo ks), 760-861,
5. Averai&-epercentage total Mouse and Senate concurrence.
Source: t;yn Ragsdale, Vi;taE
Statktz'cs
the
Presidency,
revised edit ion (Washington,
DG:
Congressional Quar-
terly, 1998f ,
390-391.
(The se data are available only from
1953
on, )
The hypotheses to he tested could he that parties have g v e n more
attetltion t o crime since 1 98 0 than they
did
in th e 1960s and 19";;"s
an d th at Republican platforms tend to give more attention to crime
than Dcrnocratic p ia th rm s, Th e unit of analysis wo uld he the Re-
prtblican an d Dem ocratic platforms since 19 60 , the texts of wh ich
can be found in the annual Congrassictnal
Quarterly
Alitnnnrlc f s r
each presidential election year and also
in
tl-re
C Q
Weekly
Report
after each national party convention,
The content analysis could be conducted in several, ways. The
recording unit could be the sentence, in which case one wauld
count the number
of
sentetlees in which some reference to crime
appears, Alternatively,
(me could count the number
of
times the
word "crime"
(m
a synonym ) aype ars o r xneasure the length
of
the
sections deaIi13g with crime (in wo rds, lines, o r inches). W hatever
method is used, the measureEnent should be
standardized,
that is,
computed in comparison to the total num ber
of
sentences, words,
lines, or inches, This is important because party platforms vary in
length, generally increasing over the years.
If
these data were collected,
i t
would then be possible to calcu-
late whether relatively more attention was given to criine in later
platforms than earlier and whether there
was
a differelice between
the politicai parties.

8/20/2019 Alan Monroe, Alan D. Monroe-Essentials of Political Research (2000)
http://slidepdf.com/reader/full/alan-monroe-alan-d-monroe-essentials-of-political-research-2000 82/214
Survey Research
Survey research, also called "" p o lli n g, 'k ea ~ ~ si l k i ~ g sample
ofa
l ~ q e ropuhtiort, asking qzresgiorrs, arsd r e c o r d i ~ g he a;rzswers.
Survey research is a such a cornrnon rnetliod of data coIXection-it
is used not only in social science research hut also
in
political cam-
paiglls an d m arket research-that und erstandin g how it is con -
ducted is valuable for everyone, Survey interviews are used for
large samples
of
the general population as weil as far specialized
g r o u p such
;I$
hofders of govertlrrtent pr>sitions.
The logic of
sam-
pling is tl-re same wl-retlzer one is selecting citizens for a survey, lab-
oratory animals for experimental and control groups, or anything
else.
Sampling
Since researchers are us~talIIy nterested in d raw ing conclus ions
about poyuiatitlns that are so large that it would be impossible to
interview ail
of
the individud members, they ~zse amples. People
sarnetimes express doubt that estimates based on only a tiny frac-
tion, perhaps
2,000
out of a population of
209
million, can
be
ac-
curate, but they usually are. Altkotlgh this is derntrnstrated by
long
experience w ith surveys, such as election predictions, tl-re rationale
far savnplil~gs mathematical, based o n probability theory
Suppose
you
were faced with the task
of
determ ining the relative
num ber of red m d black m arbles in a very large basket. Tf you
lcroked at only a single marble, th at would tell you very little, If you
started to draw more marbles out of the basket,
a
pattern would

8/20/2019 Alan Monroe, Alan D. Monroe-Essentials of Political Research (2000)
http://slidepdf.com/reader/full/alan-monroe-alan-d-monroe-essentials-of-political-research-2000 83/214
6 8 Survey R wearch
tend to emerge. By the time you had drawn 100 marbles, the per-
centages of red and black would resemble those of the whole bas-
ket. As the sample pew, the proportions would remain fairly con-
stant hut would come closer and closer to the proportions of the
total. For accuracy, however, this process must be free of bias, The
researcher cann ot select more marbles of one color on purpose, an d
the basket should be well mixed beforehand. Such considerations
are necessary to assure a ""random sample." Note tha t the results
are a m atter
vf
chance, Even
if
the basket is evenly divided in color,
it is possible to draw a sample of ten red marbles or even a
bun-
clred, and no black marbles, tkorrgh that is extremely unlikely.
The paint of this example is that if sufficiently Large random sam-
ples are taken horn a populatitril, they will rend to approximate the
characteristics
of
that population. Furthemore, the dis~fibution
of
these samples takes the form of
a normal disfl'ibaidkn-a
bell-shaped
curve-which allows us to estimate the accuracy
of a
given sample,
The larger the sample size, the emore accurate the measurem ent is
likely to be, Table
5,1
illustrates this principle. The column t~eaded
"95% Confidence Interval" &sht>ws the maximum am ouilt of error a
sample would make
95
percent
of
the time. In other words, for a
sample of 1,000, we could be 9.5 percent sure that a sample would
be
off
by no more than
3.1
percentage points in either direction.
If
we were taking a survey of how people had voted in an election in
which the total vote was 5.5 percent Republican, then a saxnple of
1,000
should almost always come out between about
52
and
$8
percent Republican. ( O n average-----S0percent
of
the time-we
would expect to not be off' more than about one percentage point.)
Note
that the figures in Table
5.1
are based
on
several assumptions,
the most imp ortant of which is that a simple random sample is used.
A
frequently asked question is
How
large should a sam ple be?"
As nc~ted bove, the ailswer is ""the larger the better," bu this re-
quires some qualification. As Figure
5.1
shows, the relationship be-
tween sarnple size an d accuracy is no t a straight line. Increasing the
size
of
small samples considerably increases accuracy, but the rela-
tive gains di~ninishwith larger samples. (This relationship occurs
because the amo unt of sampling error is proportional to the square
root of sam ple size ,) I-fowever, the cons iderab le costs
of
survey re-
search are directly proportional to the number
of
interviews con-
ducted. Hence even well-financed commercial surveys rarely exceed
2,000
cases unless there is some special
need,
such as a desire to
~ b t a i n ccurate trteasurernents for sultsamples of the popu lation.

8/20/2019 Alan Monroe, Alan D. Monroe-Essentials of Political Research (2000)
http://slidepdf.com/reader/full/alan-monroe-alan-d-monroe-essentials-of-political-research-2000 84/214
Survey
Research
6 9
TABL,E S , I Sample Size and Accuracy
95
%
Confidence
Sample
stzc
Xntervai
f
NOTE: These
figures
assuxne simple rarldorn samplir~g
rom
a n it&-
nitely large popula tion
of a
characteristic
lzeltl
by one-half
the
pop-
tlfation.
Keep in mind also that the ranges sl-rown
in
Table 5.1 are what
could be conside red the ""maxixnuxn error," th at is, nineteen tixnes
out
of
twenty (an oth er way of expressing
95
percen t), the survey
wiII be more accurate than the intervat s h o w . SampIes of a few
hundred o r even fewer c m be quite useful for many research yur-
poses. One factor that makes little difference is the size of the
population
from
which the sarnple i s
drawn.
It
i s
true that
a
saiin-
pie of any given size take n from a single city wifL be m ore accu ra te
than one drawn from the whole world, bm unless the sample size
is one half or more of the population size, the gain in accriracp is
very small.
Sampling can he dune in several different ways. A simple or pure
rundvm
siznzpk
i s
a
sample taken
by
a
inethod ensuring that
each
mgnzber
of a population
has an
equal
chance
of be&welected, If
we have a list
of
all of the members
of
a population, then there are
many w ays of selecting such
a
sample. ff o u r population is the stu-
den ts enrofted a t a p articu lar university, tl-zen we cou ld num ber
them and use a random llunlber table to select the needed sample;
a
csEnputer csuld readily
perform
the same frznction, The nam e
of
each student could be placed on a slip of paper and the saxnpie
draw n from tbe figurative hat.
A
variation that produces essentially
the same result
is
the s y s te m t ic sr-znzpk,
in
which a random start-
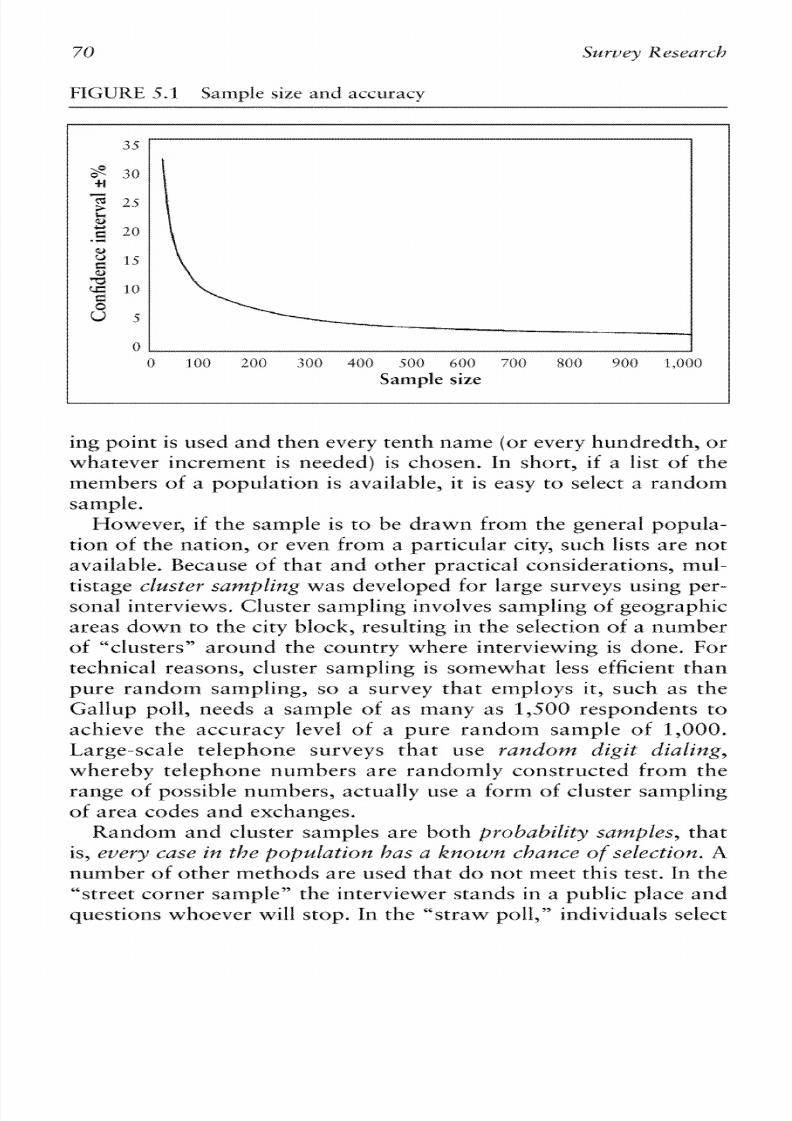
8/20/2019 Alan Monroe, Alan D. Monroe-Essentials of Political Research (2000)
http://slidepdf.com/reader/full/alan-monroe-alan-d-monroe-essentials-of-political-research-2000 85/214
70 Survey
R
wearch
FIGURE 5.1 Sall-tple
size
and
accuracy
0 20f2 200 300 400
500 600
700 800 90f2 1,000
Sample
size
ing point is used a nd then every tenth nam e
(or
every hundredth, o r
whatever ir-rcrement is needed) is chosen, In short, if a list of the
members of
a
population is available, it is easy to select
a
random
sample,
Haw evet; if the sample is t o be dra w n from the general popula-
tion of the na tion, o r even h0117 a par ticula r city, such lists are no t
available, Becmse of that and other practical considerations, mul-
tistage
C ~ B S ~ L ~ Y
ampI2'ng
was developed for large surveys using per-
sonal interviews. Cluster sam pling involves sampling of geographic
areas da w n t o the city block, resulting in th e selection of a nuxnber
of '"clusters" arou nd the country where interviewing is done. Fur
technical reasons, cluster sampling is somewhat less efficient than
pure random saxnpling, so a survey that employs it, such as the
Gallup poll, needs a sampIe of as many as 1,500 respondents to
achieve the accuracy level
of
a pure random sample
of
I , O Q Q ,
Large-scale telephone surveys that use r a n d o m
digit dialing,
whereby tellephoile numbers are randomly coilstructed from the
range of possible n~zmbers, ctually use a fcjm of cluster s a m p i i~ ~ g
of area codes and exchanges.
Rand om and cluster samples arc both probabiIity
samples,
that
is, ezier3l case in
the popcejatiorz
has ia
know%
cltlia~ce
f selectiarz,
A
num ber of other m ethods are used that Qanot meet tl-ris test. In the
"street corner sa m p le 9 9 he nterviewer stands in a
public
piace and
questions whoever will stop, Jn the ""straw poll," individuals select
8/20/2019 Alan Monroe, Alan D. Monroe-Essentials of Political Research (2000)
http://slidepdf.com/reader/full/alan-monroe-alan-d-monroe-essentials-of-political-research-2000 86/214
Survey
Research 71
themselves to be respondents. One versiorz of the fatter is the prac-
tice of encouraging people to pl-rone in to express the ir opinions .
Neither of these has any guarantee
of
relative accuracy, and they
are no t used for serious research, academic or athewise,
Th e "exit po lls 'k o n du ct ed by journalists on election day, in
which iilterviewers approach people leaving the pc~lling lace, may
appear to be a variat ion
of
""street corner sampling," but they
avoid tile usual bias of chat ayyroacl~n th at everyone wl-ro is vot-
ing tha t day (aside from those casting absentee ballots) must leave
a polling place. By sampling precincts and usinrg a predetermined
formula
br
what proportion of voters should be approached, it is
possible t o select a reasona bly representa tive sample. T he exit polls
conducted by the television networks since 1980 appear t o be
highly accurate, at least
in
their estimates of
election
outcomes.
There are two ways that people can be asked questioils, and each
is commonly done by two different methc~ds,In interviewer-
adm ir~istered surveys, the interviewer reads the question an d
records tile response, This can be done in a personal (o r Eace-to-
face) interview, usually in the respondent's home, o r over the tele-
phone.
Personal interviews are generally considered to result in a higher
quality
of
measurement than telephone interviews, Respondents in
personal interviews have been found to be som ewhat rnore at ease,
to unde rstand questions better9 an d to be rnore likely t o express
preferences. Personal interviews can he longer than telephone in-
terviews, and visual displays can be shown to the respondent..
However, personal interviews conducted by going door- to-door are
extremely expensive, and so most surveys in recent decades have
been done by telept~one,Some degree
of
bias is
built
into this
metl-rod, since some people d o n ot have telephones, but today tl-ris
is a relatively small problem, Telephc~ne urveys also offer the ad-
vantages being conducted
more
quickly, presenting fewer problems
of access (s uch as respondents unwilling to o pen their doors t o
strangers), a i d allowing m ore callbacks to households where 110
one was horrte,
in
c ~ ~ l f p a r i s ~ nith personaI interviews.
An alternative rneans of conducting a survey is the self-
administered srarvq,
in which the respondent reads the questions
and records his or her own answers. One problem with this

8/20/2019 Alan Monroe, Alan D. Monroe-Essentials of Political Research (2000)
http://slidepdf.com/reader/full/alan-monroe-alan-d-monroe-essentials-of-political-research-2000 87/214
72 Survey R wearch
method is that a significant proportion
of
the adult population of
the United States (as high as 30 percent by soxne estimates) has a
low reading level. Th is mealls th at some p ote~ ltia l esponden ts will
no t he able to re sy o~ rd t all to a self-.administered questionnaire,
and many otl-rers will be reluctant to d o so o r no t understand the
q uestions,
O ne m ethod of co n h c t in g self-administered surveys is to mail
the quest ionnaires out and hope that the respondents re turn
them. The great disadvantage
of
this approach is that response
rates a re typically very fow. T he I o w a the response rate, the
greater the probable bias in sample selection. Those who
do
choose t o p ar ri ci p a~ e nay well be different from tl-rose w ho d o
not; for example, they may he those with more intense feeli~lgs
abo ut the survey's general, topic* R e s p o ~ ~ s eates can be increased
by including a cash payment o r calling responden ts to encourage
their participation, but such steps erode the cost advantages of
self-admirristered surveys.
The self-administered survey also has a potential sarnpling prob-
lem, In a well-done mail survey, questionnaires are sent by first
class inail addressed to a specific respondelrt. However, since cssrt-
plete lists
ot
he general population are not available, the mait sur-
vey is not a good app roach far this pop ulation , Mail surveys
can
be
mtrre useful in researching specialized populations, such as mem-
bers of a n organ ized g roup o r occupation. In these circuxnstances a
list
of
the population is available and those sampled Iikeiy have
greater interest and possi
hly
a hove-average reading levels, feadirlg
to higher response rates. Even tl-ren, a well-done mait survey re-
quires sending one or more additional w aves of surveys an d follow-
up reminders to those who have not responded, and the project
will necessarily take several weeks o r m onths .
Another com m on method o f conducting a self-administered sur-
vey is to use a
captive
pupulatiurz,
tha t is, a grou p that
is
assembled
for soxne other purpose
and
over w hom the researcl-rer has som e
mill imal control . The most common example would
be
a class-
room of stndelrts. People attend ing a meeting an d employees
o n
the
job are other
possibilities.
The adv anta ge of using a captive pop u-
lation is that it is inexpensive. The great disadvantage is that this
method can never resuit in a random sample or even a representa-
tive sample of the whole pop ula tion , However, it can be quire use-
ful if the research question deals with a specific gr ou p whose mem-
bers are available and willing to filf out a survey questionnaire.
8/20/2019 Alan Monroe, Alan D. Monroe-Essentials of Political Research (2000)
http://slidepdf.com/reader/full/alan-monroe-alan-d-monroe-essentials-of-political-research-2000 88/214
Survey
Research
Writing Survey Items
The most critical step in survey research is writing the questions, o r
i&ms, to be presented to respondents, There are tw o basic types of
questions:
close~d-ended,
n which respondents are given all of the
possible answers, and oj>en-encklrl',n which respondents are given
a m ore general question an d asked to articnlate their ow n answers.
Most surveys consist of closed-ended items. This is nut because
closed-ended questions are better measurements, but b e c a s e they
are easier an d less costly to adm inister, process, and analyze,
The case can be made that open-ended questions are often better
h r xneasuring tile opinions, attitudes, and concerns of respondents.
M os t pe[~PIwvvilf make choices o n long lists
of
typical yes-or-no
questions even
i f
they have no prekrevices 17 those topics. But i f they
are given open-ended items, their real feelings can be expressed. The
problem with open-ended items is that
it
is more difficult fa r the in-
tenriewer to record the responses an d fc~rhe analyst to classify the
responses into categories for tabula tion, The latter process is actually
a
form of content analysis, discussed in Chapter 4.
Closed-ended items can take
a
variety
of
kxrns, with the yes-or-
no, agree-or-disagree, or other dichotoxnies being tl-re simplest, In
an
effort to measure more precise degrees of intensity, more com-
plex sets
of
choices can be ~zsed, or example, '"Bo you strongly
agree, agree, disagree, or strongly disagree?" When it is possible to
show visual aids t o respondents, various kinds of visual scales can
be employed, in whch respondents indicate where along the scale
their opinions fall, Whatever the format, the answers to a closed-
ended question should meet two criteria: They must
be
mutanaliy
exclusive and collectzvely exhaustive.
In
other words, the axlswers
sl-roufd not overlap, and the categories must cover alt possibilities,
so tha t anyone's o pinio n would fall into one of them,
There are a number
of
common prohle~xls
n
the c s n s t r u c t i o ~ ~f
survey items, These are summarized in Box
5.1
along with
examples and how the problems might be corrected. (Mditional
examples can be ft2und in the exercise at the end
of
this chapter.)
One of the most im portant considerations is tha t respotlitlmts m11st
be competent
to
answer a question. This means tha t there is
a
rea-
soElable expectation that most
of
the p op ulation to be saiixlyled has
some ho w le d g e of the subject matter an d terminoiogp t o be used.
Asking members
of
the general public whether they favor passage
of H ouse Resolution 1314 is silly, even if the resolution refers to a

8/20/2019 Alan Monroe, Alan D. Monroe-Essentials of Political Research (2000)
http://slidepdf.com/reader/full/alan-monroe-alan-d-monroe-essentials-of-political-research-2000 89/214
74 Survey R wearch
prominent issue. However, it is permissible and often advisable to
present a surnmary of a proposal before asking about preferences.
In this way, all respondents are being asked ab out the same subject.
Another technique is to use a flter
questiorr?
whereby respondents
are first asked whether they a re familiar with a topic, T he problem
of competency arises not only with technical knowledge, but even
with personal: knowledge, as we cannot assume that most people
know such things as tfte amount of incorne tax their family paid
last year or the population
of
their
own
community.
An obvious requisite is t o avoid crsing any binsed
or e~fotionali
kangzkiage
in
survey questio~ls.The choice
of
wording should
be
as
neutral as possible so that tfte phrasing of the question does not
sway the respo ~ld en t o on e side. Asking whether the death pellalty
should
be
used
for
""bloodthirsty killers w ho tor ture their innocexit
victims" is inappropriate and unnecessary. Although such extreme
emotionalism is ntjt iikely to be used, the problem of bias can
be
lntrre subtle when any csntroversial individual or g r i ~ u ps unnec-
essarily introduced into a question, such as associating a political
figure with a su bs ta nt he policy p roposai,
A common pitfall in writing survey
items
is failure to avoid lead-
ing
questions-items that f2il to present all of the possible alte rna-
tives.
If
we ask respondents only, ""Do you agree with this
pro-
posall 'ke are ""leading'9hern into a positive response, F-fence it is
necessary to include phrases such as
d
you agree or disagree,"
"Id0
you f a v ~ ror oppose,'" "would you say we should or should
lot, Because some respondents are eager to agree with an inter-
viewer, it is especialty irnparcant to xnake clear that negative re-
sponses are acceptable, Most surveys
do
not customarily present
(ino
opinion"
to the respondent as a possible choice, bu t interview-
ers should always be ready to accept it as a response and not at-
tempt to force a choice.
111
survey questions,
short
and
s i m l e
items
are
best,
Tf
a
question
is long and coxnplicated, it is harder for the respondent to under-
stand wha t is Lteing asked, A dmittedly, some topics ar e more com -
plicated a1-d req uire more exylartation, hu t the so lutio n in such
cases is to set fo rth the details, in several sentences if necessary, and
then ask a simple yrrestion,
h o t h e r rule is t o rrever
stutc qmestions in the negative.
For ex-
axnple, asking ""Do you agree or disagree that the United States
should not reduce its contributirons to the United Nations?" is
likely to he csnfusing to the respondent,

8/20/2019 Alan Monroe, Alan D. Monroe-Essentials of Political Research (2000)
http://slidepdf.com/reader/full/alan-monroe-alan-d-monroe-essentials-of-political-research-2000 90/214
BOX 5.1 Rtrfes for Writing Survey
I
terns,
with
Examples
2 ,
Respondent must
be
competent to answer.
Wrc)ng:
" D o ycju think Section
14-B
of the
I947
Taft-
HartIey Act should be repealed or not?"
Better:
""At the present time, states can p rohibit contrac ts
that require w r k e r s to join a ~znion.Wc3uld you favor or
oppose taking away a state" power to prohibit such
contracts?
2. Avoid biased or emotiorzal language.
Wro~sg:
Do you favor or oppose the United States continu-
ing
to waste your hard-earned tax dollars
o n
foreign aid?9'
Better:
" D o
you think that the aEnount
of
money the
United States spends on foreign aid should he increased,
decreased, or remain the sam e?"
3. "Avoid leading questions.
Wro~sg:
you agree tlzat there should he term lixnits for
all elective c~ffices?
Better:
" D o
you agree or disagree with the idea that there
sl-routd be term limits for all elective offices?"
4,
Short a nd simple questions are best.
Wrong:
"Would you favor or oppose the idea that
all
em-
pir~yers e required to provide health insurance for all
their employees meeting certain m inimum staildards,
with the goverrzment providing health insurance klr peo-
pie who are unemployed?"
Better: I has k e n proposed tha t all employers be required
to provide health insurance for
all
their e m p k e e s meet-
ing
certain rninixnurn standards. The government would
provide health insurance
Eor
people who are unemplcryed.
Wc~uId ou favor or oppose this idea?
5.
D o no t s tate questions in the negative,
Wrong: ""Toyou think the United States should not de-
crease its invofvernerit in Bosnla or not?"

8/20/2019 Alan Monroe, Alan D. Monroe-Essentials of Political Research (2000)
http://slidepdf.com/reader/full/alan-monroe-alan-d-monroe-essentials-of-political-research-2000 91/214
Better:
"Do you think the United States should decrease
its involvement in Bosnia or keep it at the current
level?
6. Avoid unhmiliar language.
TXryo~g:
"1s ideological proximity more important in your
electmal decisit~nmakingh an fiscal c ~ ~ i l s i d e r a t i ~ n s? ~ '
Better:
"Which
is
more imp ortant to you
in
deciding how
to vote-how liberal o r conservative a can dida te is, or
how
the can dida te stailds on taxes and spending?"
7 , Avoid
ambiguous
questions,
Wrong: ""DO you
favor
(12
t)ppOse the prt>ptxal o im-
prove edticatit~n
Better:
It
has been proposed tlzat all public scllools test
children in the third and sixth grades and the
senior
year in high school to make sure they
have
learned wha t
they should. Would
you
favor or oppose this idea?"
S, Minimize threats.
TXryo~g:"Do Y O U want to keep black people our: of your
neigtzbcjrh~~c~d?
'
Better:
"'Suppose a family w ho had a bo ut the same
in-
come an d education as you were going to move into
your neighborhuad, but they were
of
a
different race.
W ould this bother you o r x~ot?'"
9, Avoid dr>ul.tle-barreledquestions.
Wro~zg:
(Should
Central
High
Schoof
and
North High-
School be merged
and
the new school be named Cen-
tral or
no t ?
Better:
"'Do you agree OF disagree with the proposal to
merge Central Higlz School and North High School? X I
the tw o schoo ls were merged, should the new school
be named Central OF NOTPI?~ romething eke? "

8/20/2019 Alan Monroe, Alan D. Monroe-Essentials of Political Research (2000)
http://slidepdf.com/reader/full/alan-monroe-alan-d-monroe-essentials-of-political-research-2000 92/214
Survey
Research
77
h b v i t ~ ~ ~ son sid era tit~n s vocabulary used: Never
w e
''big9'
worrl's
that w~ukII
e t,nJanzilirlr
to
the
avemgc
person.
Terms such
as ""ideological," "recidivism," an d "philanthropic"' might
be
ap-
pro priate in a college classroom, bu t certainly no t in a survey
In
al-
most all cases, Language familiar t o alm ost everyone can be substi-
tuted. If a technical term cannot be avoided, then it must he
explained,
Ambzguous questions
must
be
avoided, An ambiguous question
is one that cou ld have more than one meatling. This is a matter no t
only of tlze wording but aiso of the substance of the qrzesrion. For
instance, asking someone a question using the aphorism tha t "pol-
itics makes strange bedfellows" m ig l~ t ause some respondents to
come up with some very interesting interpretations today. Even a
reference to such fam iliar phrases as "'Right
to
Li fe" a t~dFreedom
of Choice" might be misinterpreted
i f
it was unclear whether the
question concerned abortion,
A
c o m m ~ t l eason h r ambiguity is
vagueness. It m s t be clear to the respondent just wh at the question
is about.
Some survey questions may be threatening to respondents;
threafi
shotjld be avoided, o r a t least mzutivutixed,
When
asking
a bou t w hethe r the respa nde nt engages in socially unaccepta bte
bebavior, such as use of dangerous or il legal substances or ex-
hibiting racial prejudice, there is a risk that the respondent wilt
refuse to answer or, more likely, be less than honest, This problem
can occur with less con troversial topics as well. For exam ple, ask-
ing whether a person watched the presidential candidate debates
may seem to imply that they were not good citizens if they did
not, The threat in this case could he reduced
by
asking, "Were
y o u
able to watch the debates or no t?" T his offers an implied ex-
cuse for those w ho did not w atch, an d it extracts the sam e inlor-
matioil,
A
final rule is
avoid
do~lrk-barre led
mestions.
These a re i t em
that ar-tempt to get on e answer to tw o different questions, for ex-
ample,
'90
ou think tha t the United States should reduce fc~reign
aid and spend the money
o n
welfare here at homel'TThese subjects
can and should be covered
in
tw o sepa rate questions,
Writing good survey irems is a combination
of
good com-
mu nic atio n sk ills a n d ex pe rie nc e, h e a y t o he lp en su re t h at
questions are clearly worded and unlikely to be confusing to re-
spon dents is to try the questions a number
of
times hefore adrnin-
8/20/2019 Alan Monroe, Alan D. Monroe-Essentials of Political Research (2000)
http://slidepdf.com/reader/full/alan-monroe-alan-d-monroe-essentials-of-political-research-2000 93/214
715
Survey R wearch
i s ~ r i n ghe
final:
version.
f
ndeed, in wel l -do~~eurveys researchers
ofken select a samyfe of actual respondents far a pretest and con-
duct a small-scale survey in the same way they proposed for the
actual project. As for experience, even novices c a n draw c l c l the ex-
perience of others by looking at questions that have been used in
oth er surveys, (~W any f the sources of survey data presented in
Chapter
4
include the wording of qrzestic>ns.)ff your survey uses
the same wording as another survey has used, you may gain the
adde d adva ntage of com paring your results with those from a dif-
fererit sample, Even if' he precise topic is not covered in another
survey, similar wording can Often be adopted,
This
is
not to say
that all published surveys, cornrnercial and acadexnic, are well
written, but they offer a good stafting pa in t f c~ r he researcher
in
training.
Exercises
Following are soxne survey questions, each of which contains one
or more of th e com m on probterns discussed in this chaptea; Identify
the problems
in
each and then write an improved version of the
question that would avoid the problems.
I .
Arenk yyou concerned about the state
of
the economy a nd
in
hvor of the bcziariced budget amendment?
2. D o you think we should d o more t o reduce crixne?
3.
Do you think that people should be allowed to do things
that are not good for them o r n o t ?
4.
D o you agree or disagree that we stloufd not get involved
in
the situatioil in Kosovo?
5.
D o you think that those money-hungry tobacco companies
should be severely p ua isl ~ ed or
killing
all those innocent
people?
6.
Which candidates for county office did you vote for in the
election?
'7, Should the United States use reta liatory tariff barrie rs tc-, re-
duce our balance of payinents deficit, o r shou ld we rely on
bilateral negutia tion s?
8,
D o
you agree tha t the d eath penalty should nc>t
he
used as a
punisl-rment for m urder?
8/20/2019 Alan Monroe, Alan D. Monroe-Essentials of Political Research (2000)
http://slidepdf.com/reader/full/alan-monroe-alan-d-monroe-essentials-of-political-research-2000 94/214
Survey
Research
Suppose that you wished to test the hypothesis that the more edu-
cation people have, the trtore liberal they tend tct be o n social is-
sues. Propose a research design using survey research to test tl-ris
hypothesis. Uou should specify the type of design you would use,
details of the survey (population, saiirtpling method, sarnple size,
and interviewing inethod), and operational definitions of
all
vari-
ables (these wilf
be
the survey questions you would as k) ,
Suggested Answers to Exercises
l .
This is a leadirlg question and it is double-barreled
Im-
proved: 'V-Iow concerned are you about the state of the
economy today-would you say that you are very con-
cerned, somewhat concerned, or not very concerned at
all?"" " ' D o you favor or oppose the idea: of an amendment
to the
U.S.
Constitution that would require a balanced
budget every year? '
2 ,
This is a n ambiguous question, as there are many proposals
o n
this topic. Improved: "Do you fa:vor or
sppose
Icjnger
prison sentences as a means to reduce crime?"
3.
This
is a n ambiguous question, a s the respol-rdent would no t
know w ha t kinds of ""things" are being considered..
Tm-
proved : 'T~~ou tdt be a gaod idea or a bad idea
if
smoking
cigarettes were made ijlegal??'
4, This question is stated in the negative and also map raise
questions of coxnpetency to answer, as respondents may
not he familiar with this situation is1 the former
Yu-
goslavia. Im proved: ""As you may have heard, there is a
section of tile former Yugoslavia called Kosovo, where
most of the people are of A ibas~ ian ncestry and w here the
Serbian government has been accrised
of
kiIling civilians.
D o you think tha t the United States should send troop s to
try to keep the peace in the area or nat?"
5.
The question includes emotional language and it is leading.
Improved: "Would
you
firvor or oppose imposing heavy
fines on tobacco companies to cover the costs of health
care h r
people
w ho smoked cigarettes?"

8/20/2019 Alan Monroe, Alan D. Monroe-Essentials of Political Research (2000)
http://slidepdf.com/reader/full/alan-monroe-alan-d-monroe-essentials-of-political-research-2000 95/214
80 Survey R wearch
C;.
Respondents wouid not be competent to answer this ques-
tion, because they would probably not remember their
votes, Improved: ""Did you happ en to vote in the election
last No vem ber for Sheriff?" "D id you vote I'c~r oh n
Smith, tl-re Republican, o r Bill jones, the D em ocrat?"
7.
This question uses unfamiliar language, Improved: What
should the United Seates d o ab ou t the trade i~n ba lan cehat
comes af ou r buying m ore from atl-rer countries than we
sell to them-should
we
raise our taxes cm goods we im-
port or should we try to work it ou t
with
those countries?
f3 ,
This is
a
leading qriestion and
is
stated in the negative,
Im-
proved: "D o you agree a r disagree that the d eath penalty
should
be
used as a punishment for mu rder?"
The most appropriate design here would be a correlational design
in wl-rich the independent variab le is an individual" education, the
dependent variable is the individual's degree of social Iiberalism,
a n d control variables are the inrdividnal's age, social status, race,
and religion,
The pvpuiatlon to
he
surveyed wouid
he
the adult population
of
the United States. Th e data ctluld be obtained by means of telephone
survey using random digit diaiing with a sample size of 1,500.
The respoildent" seducation would be determined
by
asking,
How
far did you go in school-did you attend
high school,
graduate from
high school, attend college, or graduate from college? Social liberal-
ism could be determined
by
askirtg the following questions:
1, Would you favor or oppose adoption af a constitutional
amendment that would make abortion illegal under any
circu~nstances?
2.
W ould you favor a r ap pose making it illegal to discrixninate
against hiring som eone because he or she was a homosex-
ual?
3. Would you favor a r app ose a const i tu t ional amend ment
that would allow prayer in the public schools?
4.
T t has been proposed th at the US . government make a pay-
ment to all African Americans to make up
for
what they
suffered as a result
of
slavery in the United States. Would
you h v o r o r oppose this?

8/20/2019 Alan Monroe, Alan D. Monroe-Essentials of Political Research (2000)
http://slidepdf.com/reader/full/alan-monroe-alan-d-monroe-essentials-of-political-research-2000 96/214
Survey
Research 81
5.
Would you favor or oppose stranger laws that would re-
s tr ic t the sale of yo r n ~ g r a p ~ ly;
The
answers
to
these questions
would
then be coded as
to which
was liberal ( l , oppose; 2 , favor; 3, oppose; 49 favor; 5, oppose),
and each respondent h e n would be given a score equal to the
num-
ber of liberal Rsponses,
The
control variables wc~uld e measured by answers to the fol-
lowing questions:
Age: HOW
ld a r e y ~ > u ?
Social status: Wc~ufdyou describe yourself and your
family
as
generally being in the upper class, rniddle class, working class, or
lower class?
Race:
Would you describe your racial or ethnic status as white,
black
or
African American, Hispanic or Latino, Asian Axnerican,
or
Native Am erican?
Religion:
Is
your religiorz Protestant, Catholic, Jewish, or some-
thing else?

8/20/2019 Alan Monroe, Alan D. Monroe-Essentials of Political Research (2000)
http://slidepdf.com/reader/full/alan-monroe-alan-d-monroe-essentials-of-political-research-2000 97/214
This page intentionally left blank

8/20/2019 Alan Monroe, Alan D. Monroe-Essentials of Political Research (2000)
http://slidepdf.com/reader/full/alan-monroe-alan-d-monroe-essentials-of-political-research-2000 98/214
Statistics:
A n
Introduction
Once the observations of tlze variables in a hygotlzesis have been
rnade and assernbied into a data set, the next step in the research
process is to analyze those data in order to draw conclusir>ilsabout
the hypothesis. Mwever, the bits
of
data are often numerous ir~deed.
This is particularly true in tlze social sciences, wlzere we may have
stlrvey results
a n
dozens of questions from hundreds or even thou-
sands of respondents. Tb
look
over such a vast array of data to "xe"
what
is there would he a very difficult task, In order to evaluate our
data and determille what patterlls are present, we need statistics.
There are many satistical measures, Chapters
8, 9, and 10 wilt
show you how ta compute several of them. This chapter presents
an overview, hegir-rning with some basic irlformation that is neces-
sary to be able to use any statistical measures correctly.
Levels of Measurement
The term Eevel o f n z e a s u r e ~ ~ e n ~efers tc-, the classifications or units
that result when a variable has
been
operationally
defined.
There
are three levels of IneasureInent with which you need to be
famil-
iar: nominal, ordinal, and interval data.
The
""lowest"
Ievef of measurement, that is, the feast precise, is the
nominal level.
12
rtominal
variable
simply
places each case into one

8/20/2019 Alan Monroe, Alan D. Monroe-Essentials of Political Research (2000)
http://slidepdf.com/reader/full/alan-monroe-alan-d-monroe-essentials-of-political-research-2000 99/214
of
several u ~ o rd e re d ~ t eg o ri es .Examples would include an indi-
vidtlalk raclallethnic stattts (African American, wl-rite, Hispanic,
Asian, Native American, or other), religious preference (Protestant,
Catholic, Jewish, none, other), and vote for president (Clinton,
Dole, Perat, other, nut voting), Note tkat it would make no sense
to describe such variables in quantitative terms.
Ti,
speak of "'more
race,'"'Eess religion,' ^ "more voting" 'from data t ~ nhese mea-
sures wauld be silly, Marninal variables contain inforrnation on
"what kind," not hc>wmuch,"
As the name implies, ordilzal variables rank cases in relation to
each other. This can take two fc~rms.The first, mnk
order,
puts the
cases in exact order according to svrne characteristic. For example,
we could rank states in order
of
population, with California being
first,
New
Ycxk second, and so on. Note that these rank values do
not carry as rnuch ir~formation s the actual population figures on
which they are based would,
A
state that is railked tenth in popu-
lation drxs not have twice as trtan)r people as the state ranked
twentieth. Rank order is not rnuch used in analysis
for
research
pwposes, In order to
get
an exact ranking, we usually would need
numerical measures of the actual quantity of the variable. These
would be i t~&rz~alalues (discussed below), and it is preferable to
treat such variables as interval, In the rest
of
this hook any refer-
ences to ordinal variables will mean
ordr?red catggoYiesr
the more
common form of an ordinal variable.
With ordered catqordes,
variables are put into categories-as
are noirtirtal variables-h~zt the categories have an
inhererst order,
This could be done by taking a variable for which numerical (in-
terval) data are available and grouping the cases into categories,
For example, states could be grouped by population into cate-
gories such as aver
10
million, 1 rnillian to
10
xnitlion, and under
I
million. Note that this sheds some
of
the information originally
available, Ordinal category variables may also come directly f rom
rneasures tkat do not have interval precision. For example, survey
respondents might be ranked in
social
class by asking them
if
they
consider themsefves to be upper class, middte class, or wt~rking
class.
litllike nominal variables, ordinal variables, whether rank order
OF ordered categories, may he described in quantitative terms. It is

8/20/2019 Alan Monroe, Alan D. Monroe-Essentials of Political Research (2000)
http://slidepdf.com/reader/full/alan-monroe-alan-d-monroe-essentials-of-political-research-2000 100/214
proper to say that some cases in a data set have more education
tl-rall others , even tl-rough educa tion is measured only
in
tenns of
grade school, high sch r~o l, r college,
Jn determining whether a set of categories may be considered as
ordinal, it is imyortmt to rexnetnber that all categories xnust fir
a
pa tte rn of high t o iovv (crr low to high) on the variable. The census
categories of scc up atio n (pro fessio nal an d m anagerial, clerical
and sales, skilled xnanual, and unskilled manual) could
be
used as
an ordinal measure of social status. However, tlie addition of the
c at e g o v of "farmers and farm lab o re rs 'k o u ld render the level as
only nominal. The addition
of
residual categories such as "dc)ri3t
know," "n ot ascertained," o r ""other" will always cause the ordi-
nal qual i ty to be lost, f n actual practice, this problem may he
avoided if the researcher is willing to exclude all such cases from
the analysis.
The highest Ievel
of
measurement is the interval level. An i n ~ r v a l
variable provides an exact rlurnher
of
whatever is being measured.
Th is xnay be an actu al co un t? for example, the to tal nu mber of
votes received by a cand ida te in a district o r a person" annual in-
come. O r it may be a st;'zndardized form, such a s the percentage of
the d istrict voting Wernocratic o r the average income of families
in
a state , This m eans th a t n ot only may ir-rterval variables
be
de-
scribed in quantitative terms ("the higher the income, the lower the
percentage Wexnocratic"
j
but also exact comparisons may be
made. For example, the dirference between
$5,000
and
$10,000
of
income is the safBe
as
the difference bew ee n $ I 0,000 and $15,000.
There is also anotl-rer, similar level of measurexnent called a m~r'o
s a l e ,
As the difference between interval and ratio levels is rarely
importmt in social statistics, it will not be discussed here.
Box
6.1
provides a number of examples of variables and their
level
of
measurement. Exercise A at the end of the chapter provides
additional examples for you to test your un derstanding.
Rulc~fi~rsing Levels o Mm:
urement
These three levels of measurement are relatively simple concepts,
though which level applies
in
some actual cases may be debatabie,
But the application is c o i~ p ti c a te d y the fact tha t there are tw o

8/20/2019 Alan Monroe, Alan D. Monroe-Essentials of Political Research (2000)
http://slidepdf.com/reader/full/alan-monroe-alan-d-monroe-essentials-of-political-research-2000 101/214
BOX
6.1 Exampies of Level
of
Measurement
Interval level;
*
Gross national p rodu ct
(in
r~ i l l ions
f
U S , d ~ l l a r s )
*
Voter turn ou t (a s percentage of voting age population )
e
Perceiltage Ga tho lic
* Years of education
*
Crime rate (num ber
of
crimes per
100,000
population)
Ordinal:
e
Seniority in the Senate
(as of
this writing, Senator
Strorn Thurmox~ds first, etc.)
* Level of econoxnic development (developed, newly in-
dustrialized, less developed)
* Age
(
8-20,2 1-39, 40-59,
60
and older)
*
Opinion o n
dekrlse
sy e nd iw (increase, keep at present
level, decrease, eliminate entirely)
*
Ideology (very conservative, som ew hat conservative,
middle of the road, som ew l~a tiberal, very liberal)
Moxnina l:
e
Region (Northeast, midw w est, South, West)
*
Farm
of
goverIIment
(democrat).;
monarchy, military
authoritarian, marxist, other)
e
Source of political infc~ rm ation television, radio , news-
papers, r~ ag az ine s, alking to others, n o ~ ~ e )
* Party preference (Republican, Democrae, independent,
other, noile)
*
Opinion
o n gays
in the military (allow, not allow, no
opinion)
Lowest
rules that allow variables tc-,
be
treated as other levels under certain
circumstailces,
Rule
I
is
that a
tlavirzble may
always be treated
its
a lower lezlel
of measurement, This means that an interval variable rnay be
treated as ail ordinal o r nr~nzinalvariable, and an vrdiilal variable

8/20/2019 Alan Monroe, Alan D. Monroe-Essentials of Political Research (2000)
http://slidepdf.com/reader/full/alan-monroe-alan-d-monroe-essentials-of-political-research-2000 102/214
as a nominal variable, Thus, the percentage
of
a state" vote that
went to tl-re Democratic candidate, a n interva l variable, could be
used to put the states into rank order from most Democratic to
least Democratic, States csuld also be put into ordinal categories,
such as ave r 60 percent Democratic, SO percent to
60
percent De-
mocratic,
40
percent to
49
percellt D em ocra ic, an d so
o n ,
3
treat
these categories a s n o ~ ~ i n a lata, no changes are needed; one sim-
ply ignores tl-re fact th at tl-rey l-rave a n orde r-
In applying rule I , it is critical to keep in mind that although
you may go down in level of measurement from interval ttr srdi-
rlal to nominal, it is not permissible to go up, that is, to treat a
nominal variable as ordinal ar an ordinal variables as interval.
There is uile exception to that statement, and it constitutes the
other rule,
Rule
2
is that a dichotomy ma y be
treated as a ~ z yevel
of
mea-
surement, A
dickotomy is a variable that has two and only
two
possible values o r categories. An exam ple would be a perso~ l'sgen-
der (female or male), assuming that there were no cases in which
that infamation was missing, A state could he classified as having
a Republican or a Democratic governor. This
would
be a di-
chotomy as
Long
as no state had a n independent a r third party gav-
ernor, But if there are only
two
possible categories into which any
cases can fall, the variable inay be treated as interval, ordinal,
or
nominal, regardless of i t s substantive concent. Thus, rule
2
might
be expressed as "d ichotomies a re
wildm-in
the card-playing sense,
of course,
In order t o take advantage of rule
2,
it is com mon for researchers
to modify their da ta tc-,create dichott3mies. The m otivation for this
is that the statistics that can be used
only br
interval variables are
more powerful than those for ordinal and nom inal data. Hence, for
example, the ethnicity
of
individuals might he condensed from the
nominal set
of
categories
of
white, African American, Hispanic,
Asian American, an d o the r into the d ichotom y of wl-rite an d non -
white,
In
political analysis it is common to collapse the regions of
the
United
States into a
S ~ u t h e r n / N o n - S c ) t ~ t h e r ~ l
i c h o t o ~ ~ y ,
0-
phisticated multivariate analyses sometimes create what is called a
&mmy
variable
by
using each categclry in
a
nominal variable, such
as religious prefe re~ ice , o create new dichotomous variables-for
example, P ra tes tan tm on -P ro tes t nt, CatholiclNon-Cat holic, and
SO
on.

8/20/2019 Alan Monroe, Alan D. Monroe-Essentials of Political Research (2000)
http://slidepdf.com/reader/full/alan-monroe-alan-d-monroe-essentials-of-political-research-2000 103/214
Box
6.2
provides some examples of the application
of
these two
rules, as does Exercise
B
at the end of tlze chapter,
Why
LeveL
of
Meusuremmt
Are
Important
The reason it is so im portan t t o be able t o identif.y the level of m ea-
surement and correctly apply the rules is that each
of
the many sta-
tistics designed far data analysis makes assum ptions ab ou t the vari-
ab le sq w el of measurement. If you use a n inappropriate statistic to
evaluate your data , the results may be ~nean ingless nd lead you to
draw erroneous conclnsit>ns,
This
is something to bear in mind
when using computers in staeisticaf analysis. The coxnpmer pro-
grams we use to calculate statistical values d o not know what the
content of your variables is and therefore caxlnot determine what
statistics should be used. Since it is common to enter all kinds
af
data as numbers, the computer w ill readily treat any variable as
in-
terval data, even though the numbers may represent arbitrary
codes for naxninal categories. A variable such as region may be
coded
1
for Northeast,
2
for
midw w est,
3 for South, an d 4 fo r West.
To com pute the ""average region" would be senseless, hut a sk~ ti s ti -
cal
program will
do it if you request it.
Therefr~re, lways be aware of the level of measurement of your
variables and of what leveIs the tvvo rufes will aiXow you to treat
them as. As noted earlier, you may choose to modify a variable,
such as
by
collapsing it into a dichotomy, tto take advantage of rule
2 ,
M ost co m pute r program s can d o this for you autctmaticaf y.
What
s ~ S~at i~t ic -7
As noted at the start of this chapter, in social science research we
are often faced with the task
of
looking a t a large collection of
ob-
serva tio~ ls nd trying t o see what patterns a re present. Such
a
task
would be diff"icrtlt. an d in many cases impossible if we did nor have
statistics to assist us,
A statistic
may he defined as
a nur~ericat
mea-
sgre t/?at
summarizes
some characteristic of a larger
bod$i
of dcntil.
That is why statistics are useful, They can reduce very Large
am ouilts of inform ation, such as the census of the United States, to
single num bers th at convey information we need.
Statistics are found
in
everyday life, an d everyone uses tlzem. The
most common statistic is the total, such as the total population of
a nation or the total amount of Enolley in one" pocket. Anather

8/20/2019 Alan Monroe, Alan D. Monroe-Essentials of Political Research (2000)
http://slidepdf.com/reader/full/alan-monroe-alan-d-monroe-essentials-of-political-research-2000 104/214
BOX 6.2
Rules
far Using Level
of Measurement
and Exampies
sf
Their Application
Rule k ""own, Bttt Not Up":
A
variable may always be
treated as a Eower level
of
measurement (is., interval may he
treated as ordinal, or nof~ ir~aXnd ordinal may be treated as
a nominal. But never treat a variahle as a higher level.
Rule 2: ""r>ichotr>mies re Witd" A dichotomy-a varia hle
with
only
two
possihie values-may be treated
as
any ieve)
of
measurement.
Percentage
of
a nation's budget spent on defense: This is an
i~ lter va l ariable, so it could also be treated as ordinal or n cm -
inal (rule
l
f.
Party com petition in a state
f
highly competitive, less competi-
tive, one p arty) : This is an ord inal variable, s o it could
also
be
treated as x~om inal rule
l f .
NATO
membership
( ~ n e m k r , nm ember): This is a dichotomy,
so it could
be
treated as nominal, urd ir~a l,
or
interval (rule
2 ) .
Form 01 municipal government (stro ng mayor, council-
manager, cornmissinn, other): This is a ncjminal variable and
not
a dichotomy, so it could only be treated as nominal.
Level of education,
variation I
(g ra de scl-rool, som e kigl-2
school, high school gmdtrate, some
college,
college gradu-
ate): This is ordinal, so it could also be treated as nominal
(rule I f .
Level of education, variation
2
(gra de schtlol, som e high
school, high school grad uate , som e coliege, college gradu ate,
trade scbooi, stilt in school , unknown): TI.ris
is
a x~orninal
variable because clre add itio n of m y of the last three cace-
gories deprives it of
its
otherwise ordinal quality, Therefore,
it can be treated
only
as x~orninal,
csl.tbfzzlc?s
8/20/2019 Alan Monroe, Alan D. Monroe-Essentials of Political Research (2000)
http://slidepdf.com/reader/full/alan-monroe-alan-d-monroe-essentials-of-political-research-2000 105/214
Population density (number
of
people per squ are m ile): Th is
is an interval variable, so it could be treated a s nominal an d
ordinal as well (rule
1).
Legislator's vote oil bill fyea, nay): This is a dichotc.>my, c.3 it
map be treated as nominal, ordinal, or interval (rule
2 ) .
common statistic is the proportiorz, which can be expressed
as
a
decimal, a fraction, or a percentage, Ra&s are also a familiar sta-
tistic, such
as
miles per gallon fclr automobile fuel consumption.
The average, the term mast people use for tl-re
arithmtt3tZc mean,
is
a well-knom statistic. Uewed in this way, the subject of statistics
is not an exotic undertaking, hut simply a n extensiorl of a tool you
have been using far years, Since scientific research goes beyond
sirnple descriptioil and attempts to analyze relationships and test
hypotheses, you
will
need some new tools in your toolbox,
All of the examples of everyday statistics cited above are gniuari-
ate,
that is, they describe characteristics of one variable at a time,
Since most readers already have some knowledge
of
them
a n d
since
scientific research is usually concerned with multivariace questions,
the discussion here
wilf
he brief,
Measures o Cmtml
Tendency
The mast familiar univariate statistics are measures of central ten-
dency-r, as they are cornxnonly called, averages. There is a mea-
sure for each Level of measurement. Each one is way of describing
what the "'typical" ccas in a set looks like on some variable.
Th e best known is the
mean,
or arithxnetic average, which can be
computed only for interval data . The mean is com puted by adding
up
alt of
the individual values an d dividing by the number
of
cases.
A, similar measure is the median, or "middle" value in a distrib-
ution: Half of the cases have higher values and half have lower val-
ues. Technically, a inedian can be determizzed froin ordinal data,
8/20/2019 Alan Monroe, Alan D. Monroe-Essentials of Political Research (2000)
http://slidepdf.com/reader/full/alan-monroe-alan-d-monroe-essentials-of-political-research-2000 106/214
but it is usually computed for interval values. Suppose we have a
very small town of five farnilies and their incarnes are $2,000,
$2,000, $3,000,
$4,000,
and $89,000.
The
meail family income for
this town wo~zldbe $20,000, but the median would be only
$3,000. In cases such as this, with highly skewed distributions (i.e.,
where there are some extreme cases, which can geatly affect the
mean), the median is often considered to be a better measure of
central tendency, In this example, the median income of $3,000
better describes the typical family than the m ean of $20,000. But
it:
should be remembered that the mean actually includes more infor-
mation than the rnedian.
A
measure af central tendency that can be applied even to nam-
inal data is the mode, which is simply the most frequently occur-
ring value or category
fn
the example above, the mode would be
$2,000, Modes are not very useful for inrerval data, especially
when the values
have
a large potential range, ~ V o d e s re sometimes
useful for describjng orditlaf category or nurni~taldata. For exam-
ple, the modat ethnic category in the
U.S.
is white, because inore
people fail into that category than any other.
Another characteristic af a set of observations is the extent ta
which they are dispersed, that is, l-row closely- or widely cases are
separated
o n
a variable, Measures of dispersictn can be cc~mputed
only
for interval d a ta , We
could
have tw o distributions
of
sbserva-
tions with the sam e mean a nd rnediall tha t ar e very differem from
one another, For example, t o take t w more very small towns, o ne
might have five families with incssrtes of $2,000, $2,000, $20,000,
$38,000, an d $38 ,000, and th e atl-rer five families with incornes af
$18,000, $19,000, $20,000, $38,000, and $38,000. In both corn-
munities the meal? and the rnediar? income is
$20,000.
But
in
the
first cornmunitgr, income is dispersed over a w ide range, whereas
in
the second the incomes are m tlre similar tc-, on e ailother,
The simplest rneasure
of
dispersion is the
mlsge,
which is simply
the difkrerlce between the
highest
an d the lowest values. In the first
town the range is $36,000, and in the second it is $4,000, The
range is not a very usefut measure, however, because it
is
so easily
affected by the presence of even one extrem e case, There are inore
sophisticated versions such as the
guartike range,
which is half the
difference betweeri the values
of
the cases that rank one-fourth an d

8/20/2019 Alan Monroe, Alan D. Monroe-Essentials of Political Research (2000)
http://slidepdf.com/reader/full/alan-monroe-alan-d-monroe-essentials-of-political-research-2000 107/214
three-fourths of the way between the highest an d lowest scores, But
even this sort of Ineastire is not as precise as one xnigbt wish.
The most common measure of dispersion is the
standard devza-
tz'on,which is based
0x3
a summation of the differexice of each case
from the mean, Although tl-ris is sometimes useful as a measure in
itself, it is most commonly used in performing certain tests of sta-
tistical significance,
The
Concept
of
Relationship
As sl-rauld be clear from earlier chapters, scientific research is usti-
ally concerned with multz'vavht~:uestions-the relationsh ip be-
tween tw o or m ore variables, The concept of relationships between
variables was introduced earlier, but x~ owwe will see what such re-
lationships look like. In o rder to d o this, w e must first understand
how data can be assembled to view possible relatir>nships.
The way data on two nominal or ordinal category variables are
customarily presented is by use of a cross-tabulation, or contin-
gency
table,
This is a table showing the frequencies
of
each comhi-
x~ ation f categtjries o n the t w o variables. Coxistructing
one
is sim-
ply a process of counting tip how xnany cases fall into each
combinatioil,
Box
6.3A
shows a set of "raws3data and the result-
ing contingency table. 1st this example, one woufd first go through
the data and count up how many males voted Republican, then
how many females, an d so
on,
Contingency tables are often presented in terms of percentages.
This can be do ne in several ways; the percentages might ad d up t o
100
for each column, ii>r each row, o r for the elltire table, H ow -
ever, it is usually clearest
fo r
the reader if the fotlowjng conventions
are followed:
( 1 )
Let the independent variable define the columns
and the dependent variable define the rows,
( 2 )
Compute column
percentages by dividing the frequency
of
each cell by the total for
that coluxnn. (fl his is done, the percentages for each coluxnn will
add up to
100,)
Box
6,3B
show s a contingency tahle with raw fre-
quericies and their percentages in proper form, Note that it is de-
sirable to include tl-re
N,
which is the number of cases on which
each set of percentages
is
based, The variables and categories
should also be clearly iabeled.
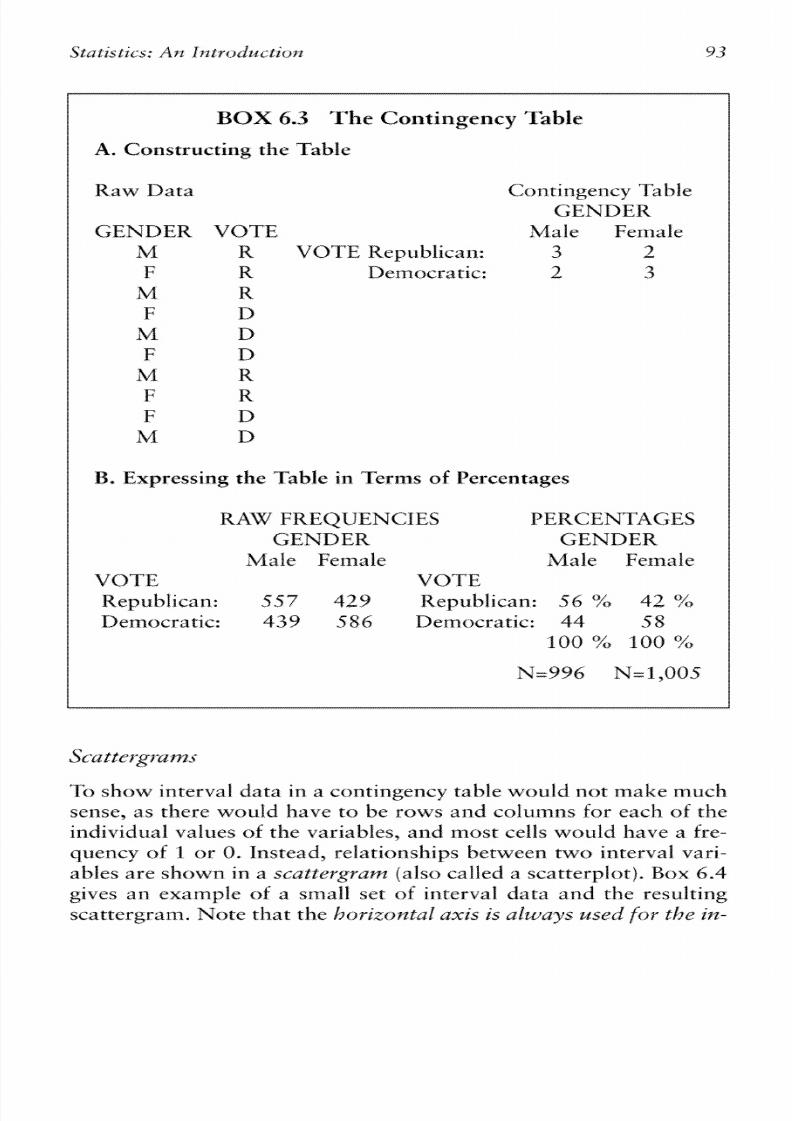
8/20/2019 Alan Monroe, Alan D. Monroe-Essentials of Political Research (2000)
http://slidepdf.com/reader/full/alan-monroe-alan-d-monroe-essentials-of-political-research-2000 108/214
BOX 6.3 The Contingency Table
A,
Constructing
thc
Tabfc
GENDER
M
F
M
F
1M
F
M
F
F
M
Contingency
T3blr:
GENDER
VOTE Male Female
R VOTE Republican: 3
2
R Democratic: 2 3
R,
W
D
D
R
R
D
W
B,
Expressing the Table
in
Terms of Perccnttlges
RAW
FREQUENCIES PERCENTAGES
GENDER GENDER,
M ale Female Male Female
VOTE
VOTE
Republican:
557 423
Republican:
56 % 42%
Democratic:
439
586 Democratic:
44 58
100
%
100
%
To
show interval da ta in a contingency table would no t make much
sense, as there would have to be rows and columns
for
each of the
individual values of the variables, and most cells would have
a fre-
quericy
of l or 0.
nstead,
reiationships
between tw o interval
vari-
ables are show n
in a scattergram
(also called
a
scatte rplo t), Box
6,4
gives
an
example
of a
small set
of
interval data
and
the resulting
scattergram,
Note
that the ehorizrr~fial xis is a l w y s z-rsed fix the irt-

8/20/2019 Alan Monroe, Alan D. Monroe-Essentials of Political Research (2000)
http://slidepdf.com/reader/full/alan-monroe-alan-d-monroe-essentials-of-political-research-2000 109/214
BOX
6.4 Constructing
a
Scattergram
MEDIAN
INCOME
$
z 0,000
$2"7"500
$72,000
$3 ,900
$46,000
$40,700
$s2,500
$1
9,000
Data
PERCENT"
REPUBLICAN
33
46
73
S4
60
62
65
3s
Scattergram
M edian Incaxne
( 1 000's)
dependent
variable and the vertical
axis for
the
dependent
vanable.
70
construct
this
scattergram, one would first go acmss the hori-
zontal axis
to the
value
of the
independent
variable-income
in
rl-ris
case-and
then
straight
up t o
the height of
the dependent
vari-
able--percent Republican--and at that intersection place a dot

8/20/2019 Alan Monroe, Alan D. Monroe-Essentials of Political Research (2000)
http://slidepdf.com/reader/full/alan-monroe-alan-d-monroe-essentials-of-political-research-2000 110/214
indicating the p ositisn
of
the case. When this is done for
all
cases,
the result is a scattergram , (In some cases, nuxnbers o r letters iden-
tiityiag the cases are used instead of dots.)
What Doo-
u
Relationship Look Like?
To say that there is a relationship between two variables implies
that the cases are not distributed randomly, hu t rather tha t there is
some
identifiable
pattern, W ith ordinal or interval data this can be
described in quantitative terms; for example, the more education
one has, the higher one's income tends to be, Relationships be-
tween nominal variables may be described in terms of contrast be-
tween categories, for example, that Catholics are more likely to be
Dem ocrats than are Protestants, But the different types
of
possible
relationsl-rips ca n best be illustrated with contingency tables a nd
sca ttergrams.
Box -6.5 ttemp ts to d o this by shsw itlg w ha t contingency tahles
and scattergrams would
look
like if there were absoluteiy no rela-
tion sh ip between tw o w riab les a s com pared with a "'perfect" rerela-
tionship, which cart take either a positive or negative
fonn
with
ordinal and interval variables. Consider part A for noxninal vari-
ables. m e r e there is no relationship, the percentage co lu m ~l sn
the contingency table are exactly the same. As one m oves across a
row, tl-re figures d o no t change. It m akes n o dit-tierence in th is hy-
pothetical data set whether a persc-~ns Protestant, Catholic, or
Jewish; 37 percent of each religiuri is Republican. Religion would
be of no value in predicting a person's party affiliation.
On
the
other ha nd, the example
of a
perfect relationship sho ws a different
situation entirely, All Protestants are Republican, all CathoIics are
Wexnocratic, and all Jews are independent. This xneans that we
could perfecrly predict a person" party identification by knowing
his
OF
her religion.
v T
I
he same is true of the examples for ordinal variables in part
B
of
Box 6.5. The
no-relationship example shows that each educa-
tional group has exactly the same income distribution. But in the
exam ple of a perfect positive relationship, all individuals w ho wen t
to college have a
high
income, those w ho went t o high schc~ol ll
have a medium income, and those w ho went only to grade school
all have a low incoxne. Therefore, for this ilypotl-recical da ta set, we
can say tha t tile more education a person has, the higher his o r her
income, and one variable csuld perfectly predict the other,
In
the
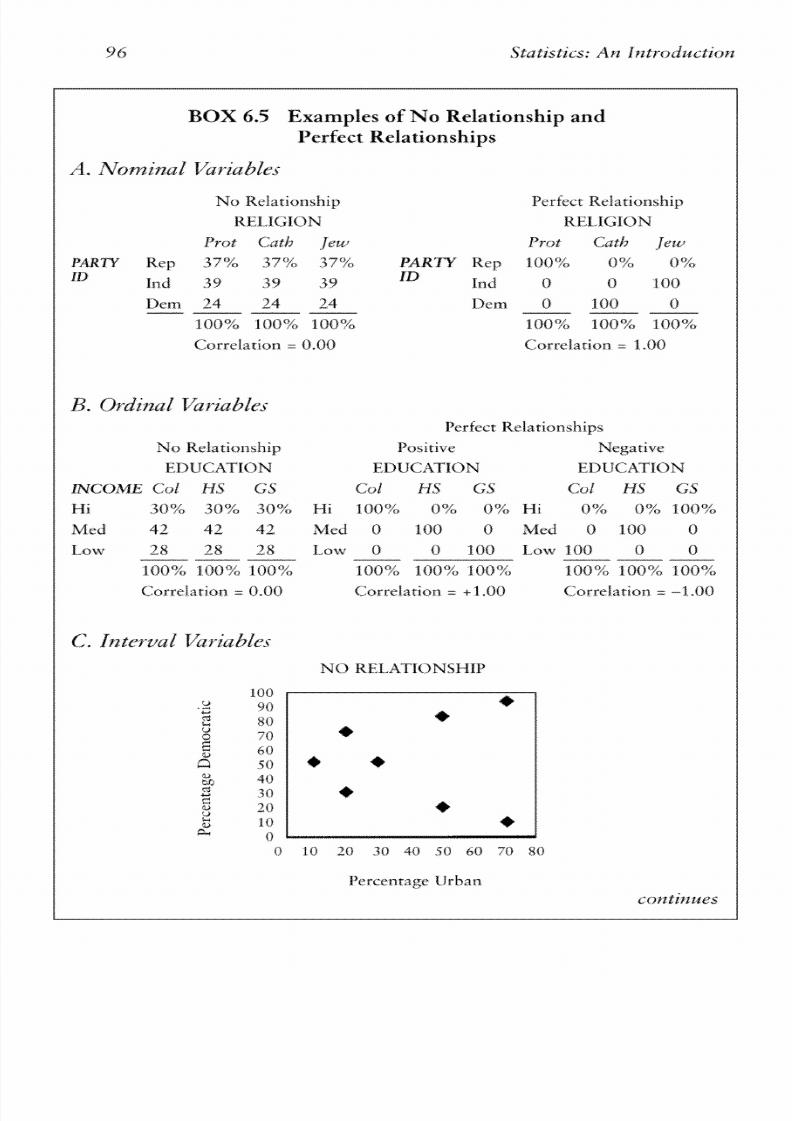
8/20/2019 Alan Monroe, Alan D. Monroe-Essentials of Political Research (2000)
http://slidepdf.com/reader/full/alan-monroe-alan-d-monroe-essentials-of-political-research-2000 111/214
BOX
6.5
Examples of No Relationship and
Perfect
Relationships
No
Iielarionship Perfect Iielarionship
REI,IC;IC)N
Prot
Cktj?
feu)
Prot
Cath Jew
In
Ind 39 39
39
I ) c m x x L
Tlem
00
100% 10001, 100% IOfb% 100% 100%
Correlation = 0.00
Currclation
=
1.00
R, Ordinal
V~ria61es
Pcrfecr Relatiotlships
Na Relationship
EI3UCATIC)N EI>UCATION
m C O M E C d HS GS' C01 IfFI GS Col HS
C;S
-30% -30% 30% Hi 100% 0%
0%
Hi
0% 0%
100%
Med 42 42 42 MeJ O 100 O MeJ 0 100 O
Low 28 28 28
tow
O 0
100 to\v10O
O O
PP p
100% 100% 100% 100% 100% fO0%
100% 100% 100%
Correlation
=
0.00 Correlation
= +
1.00 Currclation
=
-1.00
NO IiE:I,ATIONSHlI~
Perrcntage Urban

8/20/2019 Alan Monroe, Alan D. Monroe-Essentials of Political Research (2000)
http://slidepdf.com/reader/full/alan-monroe-alan-d-monroe-essentials-of-political-research-2000 112/214
continued
Perfect
Posit ive
Relationship
Perfect
Negative Relationship
Percent Urban
example of a negative relationsh ip, tl-re predictability is again per-
fect, but in the oppos ite direction . In this unlikely exaxnple, all col-
lege people have low incomes and ail those
who
went only t o grade
scboof have high incomes.
In part C of Box
6.5,
scattergrams are presented for a pair of in-
terval variables. In the no-relationship example, the cases are ran-
domly distributed with no patterzl.
In
the example of a perfect
pos-
itive relationship, all the cases fall on a straight line, so it is clear
tha t the m ore urban a n area, the higher the Democratic percentage
of the vote,
This
wouM allow us to compute the equation for that
scraigfic line and therefore predict the vote for any case from its ur-
banization score
(how
t o 40 this win be covered in Chapter 9 The
same is true in the negative relationship example, except that the
8/20/2019 Alan Monroe, Alan D. Monroe-Essentials of Political Research (2000)
http://slidepdf.com/reader/full/alan-monroe-alan-d-monroe-essentials-of-political-research-2000 113/214
line slopes downward, indicating that the more urban an area, the
less W exnocratic its voting pattern .
Three characteristics of a relationship between variabkes can he
summarized by statistics:
stre~zgth,dkection,
and
significrlnce,
Jt is
critical to understand the difkrence between tlzem.
Strength
of
Relationship
The s t ~ n g t h f a relationship is a measure of where the relation-
ship
falls
between n o reiationship an d a pe rk ct relationship. It can
also be thought
of
as a relative rBeasure
of
how good a predictor
the independent variable is of the dependent variable.
There are many statistics designed t o meclsure strength
of associ-
ation. These are com monly called correlatiuns.
( A
nrlmber of them
are summarized below in 'Table
6.1,
and several are presented in
detail in Chapters 8,
9,
and 10,) Although these statistics are de-
signed fo r d ifk re n t c s ~ ~ b i n a t i o n s
f
levels of measurem ent
and
dif-
fer in their sensitivity to various aspects of the distribttcion of the
variables, they all have tw o things in com m on, First, if there is ab -
solutely n o relationship between the variables, they will have a
value of zero. (However, soxne define
no
relacionship" a little dif-
krentliy than others,) Second,
if
there is a '"gerfect" re la tionship , all
will
have a value
of
one, though it might he either pius
one
o r
rninus one, depending on tlze direction of tlze relationship, as dis-
cussed below Thus, for example, the "no relationship" tables and
graph
in
each part
of Box
6.5 all would have a correlation
of
ex-
actly zero , using any of tlze many measures of strengtl-r of associa-
tion. The ""perfect relationsh ip" tables an d graphs would each have
a correlat ic~nvalue
of
plus one
or
rr.linus one, depending on
wlzetlser the relationship is in a positive or negative direction.
Direction of u Relationship
The
diwctiovt of
a relationship is a simple concept, Jt alswers the
question of what happens to the dependent variable as the inde-
pendent variable increases. If the dependent variable also increases,
then the relatioi-rship
s
said to be positive,
If
the dependent variable
decreases, the relationship
is
negative.

8/20/2019 Alan Monroe, Alan D. Monroe-Essentials of Political Research (2000)
http://slidepdf.com/reader/full/alan-monroe-alan-d-monroe-essentials-of-political-research-2000 114/214
Direction in this sense applies only to ordinal or interval vari-
ables.
A
purely nominal va ria ble, such as a n individual's religious
preference or
ethnic it)^,
canno t he said t o increase o r decrease. The
direction of relationships as indicated by statistics computed o n or-
dinal category data is completely dependent on the order of the
columns and rows,
In
the example in part I3 of
Box
6.5, reversing
the order
of
the co lu ~ n ns n education o r the rows on inc o~ ne httt
no t b oth ) would reverse the plus o r minus sign for any correlation.
Tha t is one reason
why
it is always imp ortan t to
look
closely a t the
contingency table, preferably one in terms of percentages, before
draw ing conclusions a bout relatiolls between categorized variables.
The term
significdlzce
has a special meaning in statistics. Signifi-
cance refers t o the
probability that ca reta ttonshii~ etween variiables
could h ~ v eccurred by d a m e irr.a
rartdom
s a ~ ~ p l t ) .f there
UI(?'JP
E O
r e l ~ t i o ~ s h i i t ,e tween them
in
the p o p ~ l u t i o ~
iom
which
he
sam-
ple was dwwn. Recall f%om the discussion of survey sam pling
in
Chapter
5
that even properly taken samples are a matter
of
chance.
For that reason, there is always a confidence interval around an es-
timate m ade
from
a sample, The sam e idea applies to relationships
between variables in sample data, though it is expressed differently.
The probability of a relationship occlrrring by chance is, essen-
tially, the probability that one might make a mistake
by
drawing
the conclusion that the relationship observed in the sample is true
of the Larger population. Therefore,
t he smaller that p ro ba b i l i ~ ,
th e m or e signifisan$ the relafl'onship.
In most social science re-
search,
if the probabilit), is .05 o r h s , he% the relationsh@ is s a d
t u
be
s z g n i f i ~ ~ $ l ; ,here are quite a nuxnber of significance tests,
some of which are listed below in Table
6.1
and several
of
which
are covered
in
detail in Chapters
8,
9,
and
I
Q.
But the
O T
lezjel
of
sigrziJicavrce lapplks t o all signjlicance tests, This,
incidentally,
is
the
same thing as the
9.5
percent level
of
confidence cited in the discus-
sion
of
survey sampling in Chapter 5.
It is important to re~n em ber hat szg~zificance ests sliouM
be
zdsed
only if the data are
fiom
a random sample, If the data are
from
a
sample that has not been selected
by
one
of
the appro priate rneth-
ods described in Chapter
S,
then significance tests have n o validity
But
what if the d ata a re not fro m a sam ple a t all, but constitute a
whofe population, such as
all
fifty
U.S.
states or all I
Q0
Senators?
8/20/2019 Alan Monroe, Alan D. Monroe-Essentials of Political Research (2000)
http://slidepdf.com/reader/full/alan-monroe-alan-d-monroe-essentials-of-political-research-2000 115/214
Then signiticarxcr: tests, while no t necessarily inaccurate, are unnec-
essary If there is even a very weak correlation between two char-
acteristics of the fifty states, then we can be sure that it exists,
though it may not be of any importance.
As will becorne clear when you learn how to conduct surne sig-
nificance tests in iater chapters, the significance of a relationship is
determined by two factors: the s t r c ~ g t h
f
the
correlcation
and the
sample size. The
stronger tl-re correlation between two variables,
the less the probability that it was a chance occurrence and, there-
fore, the more significant it will be. But it also depends on how
large the smyle is. The same degree
of
ritrerigth might he signifi-
cant in a large sample, but not achieve significance in a small sam-
ple. It is important to keep this in mind when interpreting data,
whether in analyzing your own or reading the results
of
another
person" rreearch. In large samples, such as surveys with over
1,000
eases, even very weak relationships map
be
"statistically signifi-
cant," ever1 though they are
of
littfe substantive importance,
With a11 of this background, we can now take a Look at Table
6.1,
which summarizes a number of (hut certainly not all) the sta-
tistics designed to evaluate relationships.
A l l of
these are biwriate
scatistics-they evaluate relationships becween two variables. TI~ere
are also statistics that deal with the relatioilship between three or
more variables, but these are al extensions
of
Pearson" rr, so the
same assumptions and interpretations apply, These statistics are
discussed in Chapter 10.
Table
6-1
can be useful when reading the results
of
someone
else's rreearch and encountering
m
unfamiliar scatistic. It can also
he useful when analyzing data using a computer program that of-
fers a wide choice of possible statistics. But it is highly inadvisable
to
use
a statistic with whicl-r one is not familiar, There are many
details and variations that a simple summary like Table 6.1 cailnot
cover,
Exercises
For each of the
fclllowing
variables, identify the level of measure-
ment (nominal, ordinal, or interval).
I , Opinion on legality of abortion (always, only under certain
circumstances, never).

8/20/2019 Alan Monroe, Alan D. Monroe-Essentials of Political Research (2000)
http://slidepdf.com/reader/full/alan-monroe-alan-d-monroe-essentials-of-political-research-2000 116/214
TABL,E 6.1 Cornrnc~nUivariate Statistics
Level
o Measz-zresof Tests of
N aszdremenf Association
Range
Sigazficilnce
T k o noxntnal
variables *Lambda
if tocl.0 *Chi"
*l3l1i 0 to+l O
Cramer" V Vt) to+ l .O
F&uB
if
tocl.0
Thc ordinal
*[Gamma
-1 .0
to 4-1.0
*<:hi2
variables MendafPs Taug
-Z.if to +
1.0
Mendati's Tau, -1.0 to cl.0
Two interval
variables *13earsr>nk - l
.O
to
c l
,O
*F-test
One nominal Eta if tocl.0 F-test
variable
and
one intavaf t-test
variable I>iffcrenee
of
Means
*Statistics covered in
detai
in Chapters 7, 8, and 9.
2. Outcoxne af a congressional vote on. a bill (pass, faif),
3. Nuxnber of irregular executive transfers in a nation since
1980 ,
4.
Previous
coionial
power (Britain, France, Spain,
other,
none) ,
S. Size of largest city (Over 1 million,
200,000
to 1 million,
less than
lO O ,O Q O f .
Far the exam ples in Exercise A, apply rules 1 and 2 an d identifii aSI
of the levels of measurement the variable could
be
considered as,
incf
udirrg
the original: level,

8/20/2019 Alan Monroe, Alan D. Monroe-Essentials of Political Research (2000)
http://slidepdf.com/reader/full/alan-monroe-alan-d-monroe-essentials-of-political-research-2000 117/214
Below are
data on religion and turnout for fifteen people, Far these
data:
1. Construct a contingency table showing the frequencies,
2 , Present the table in terms
of
percentages, using proper form ,
3.
Draw a conclusion
about
the relationship between religion
and turnou t for tl-rese individuals,
Retiglsn Turnout Retiglsn Turnout Retigion Turnout
P V J V 6" V
G
V G W
P
W
.l V
G
V .l V
X
W
X V
G
W
G
V X3 V
P W
Codes
for briables: Refigion: f3
=
I)rotestant, C
=
C:achofic, j
=
Jcwis l~
Turnout: V
=
Vc?ter, N
=
Nctt~voter
Suggested
Answers to Exercises
1. Ordinal
2. Moxninal
3,
Interval
4. Nominal
5. Ordinal
I . Ordinal, nominal (rule
1
)
2. Interval,
ordinal, nominal (rule
2 )
3.
Interval, ordinal, nominal (rule I )
4,
Nom inal (neither rule app lies)
S.
Ordinal, nominal
(rule 1 )
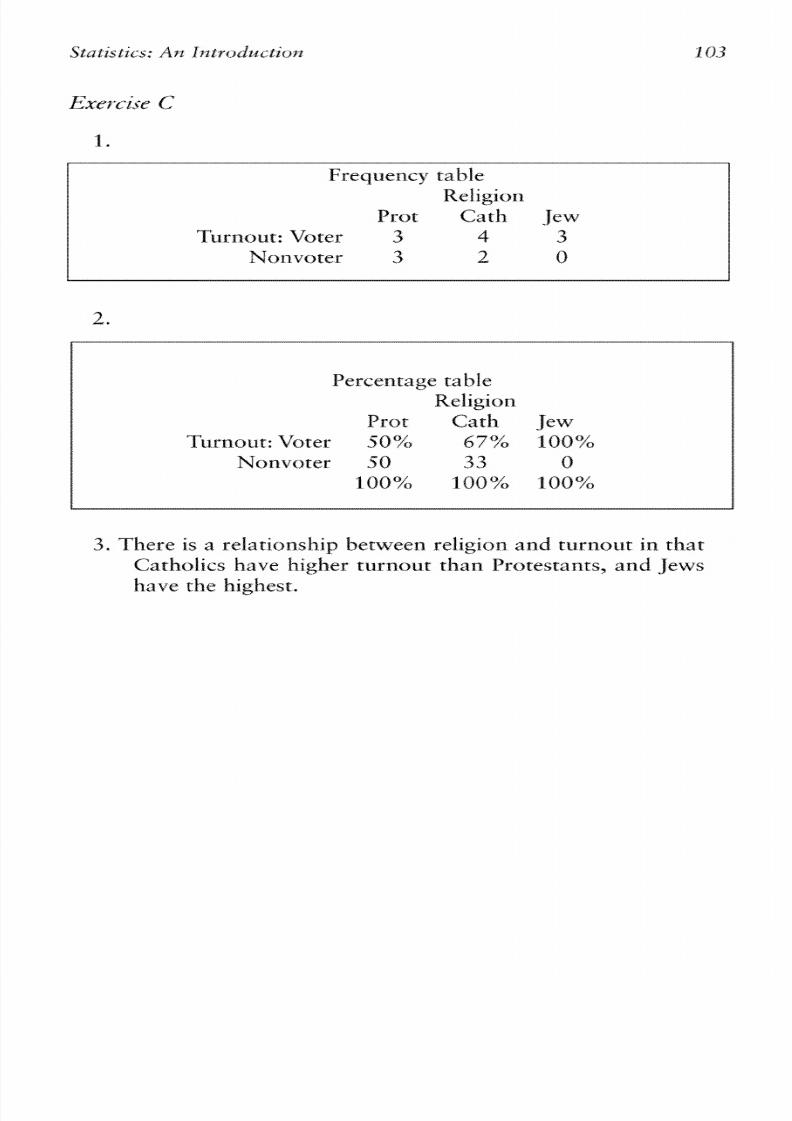
8/20/2019 Alan Monroe, Alan D. Monroe-Essentials of Political Research (2000)
http://slidepdf.com/reader/full/alan-monroe-alan-d-monroe-essentials-of-political-research-2000 118/214
Frequency sable
Reiigioil
Prot Cath Jew
lvum out: Voter
3
4
3
Nonvoter
3
2 0
Percentage ta hie
Reiigioil
Prot
Cath Jew
Xlmout:Voter
50%
67%
100%
Nonvrlter SO 33 Q
100%) 100%
180%~
3.
There
is a relationship between religion
a n d
turnow in
chat
Catholics have higher tur no ut th an 13ratestants, an d
Jews
have
the highest.

8/20/2019 Alan Monroe, Alan D. Monroe-Essentials of Political Research (2000)
http://slidepdf.com/reader/full/alan-monroe-alan-d-monroe-essentials-of-political-research-2000 119/214
This page intentionally left blank

8/20/2019 Alan Monroe, Alan D. Monroe-Essentials of Political Research (2000)
http://slidepdf.com/reader/full/alan-monroe-alan-d-monroe-essentials-of-political-research-2000 120/214
Graphic Display
of Data
Po p u l a r me d i a su c h a s n e w sp a p e r~ n dmagazines frequently use
graphics to report the distribrrtion of resufts in some form of pic-
ture-a cha rt o r graph instead of (o r in add ition to ) reporting the
relevant numbers. The purpose of these graphic displays is primar-
ily to convey impo rtan t characteristics trtore effectively than a ver-
bat description or table of num hw s w ould be able to do , The use of
graphics
bas
increased markedly
in
the past decade, primarily he-
cause
of
the ease
of
constructing and printiilg graphs and charts
with widely available computer programs.
This chapter has t w ~rgrposes. The first is to illustrate how to
construct several common types
of
graphics. while avoid ing inany
common mistakes. The second is to explain how to interpret
graphics you might ellcounter in your reading-and na t be mislied
when
others make the cofrtfrton mistakes,
Construction of graphics may seem simple to do with a coxn-
puter, but doing it correctly involves undersranding concepts cov-
ered earlier in this book, inclu di~ lg he distinction between inde-
pendent and dependent variables and tlie three levels of
measurement discussed in Chapter 6 Since many people who pr~t
graphics into their articles, reports, and papers are not familiar
with tliese concepts, the grapl-rics that result are frequently mean-
ingless
or
even misleading. Graphic displays of data can be very
useful, both for conveying infornation to the reader and for re-
8/20/2019 Alan Monroe, Alan D. Monroe-Essentials of Political Research (2000)
http://slidepdf.com/reader/full/alan-monroe-alan-d-monroe-essentials-of-political-research-2000 121/214
searchers to better understand their d ata , (T he scattergram de-
scribed in Chapter B is particularly useful for this latter function,)
But from the standpt~int
f
scientific
research,
two disclaimers are
in order. First, graph ics of the type preserited in this chap ter can al-
most never present information as complete as a numerical table
can-and generatly they present much Less, Second, reports of sci-
entific research such
as
those found in scho1arIy journals gerieraily
do
no t use these sixnple grapl-rics. Th is chap ter provides only a
fim-
ited in troduction to the topic.
( A
brief yet comprehensive trea tment
of the subject c m be fou11d in Wallgren et
ale 1996.)
Graphics for Univariate Distributions
The simplest use of graphics is to display the distribution of cases
o n a single variable such as the prop ortion of people w ho belong to
different religions, Typically what
is
being graphed is a nominal or
ordinal category variable
or
a variable that has been made into
one, such as by placing individt~alsYncornesnto different ranges.
Such variables can be visually displayed in several
ways,
such a s pie
charts an d bar charts.
Pie charts a re circles that are divided into segments representing dif-
ferent categories, the relative size
of:
the segment being proportional
to the frequelicy of the c ate go v. Figure
7.1
is an example
(all of
the
figures in this chapter were produced by Microsoft Excel). Often
different colors or shadings are used t o distinguish the categories.
Mtlaough pie charts are frequently found in newspapers, maga-
zines, and similar popular media, they are really not very useful,
M ost readers have trouble making a precise com parison of the size
of circular wedges. For this reason, it is com Inon to it-rciude the
exact nuxnbers o r percentages in tl-re pie chart-but tl-ris is exactly
the same information that would he presented in a simple numeri-
cal table. A nrtlllber of authorities
o n
graphic presentation advise
against using pie cha rts (e.g., Tufre
1983,
178).
A more useful method of displaying category fi-equencies is the bar
chart. Here the relative frequency of each category is represented by
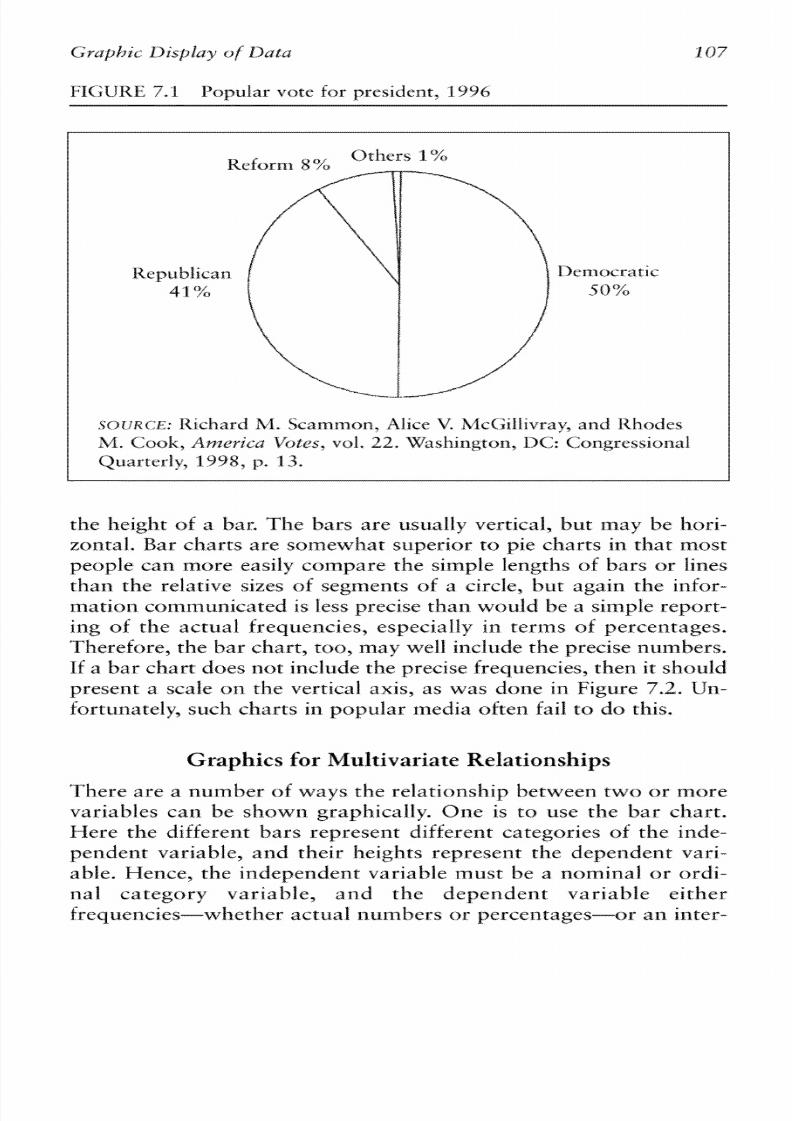
8/20/2019 Alan Monroe, Alan D. Monroe-Essentials of Political Research (2000)
http://slidepdf.com/reader/full/alan-monroe-alan-d-monroe-essentials-of-political-research-2000 122/214
FICiliRi-,7-1 130pularvote
for
president,
1996
SQURC;E: Rtchard Al . Scammt>n, Mice V. McCitiivray, and K hodes
M ook,
America
V i ~ t e s ,
ol.
22,
Wasl~ington,
13C::
Congressional
Quarterly, 1998,
p.
13,
the height: of a bar. The bars are usually vertical, but may be hori-
zontal.
Bar
charts are somew hat superior to pie charts
in
that most
people can xnore easily cornpare the simple lengtlzs of b ars a r lines
than the relative sizes of segments of a circle,
btlr
again the inior-
mation communicated is less precise than would be a
simple
report-
ing of
the
actual frequencies, especially in terrns of percentagcs.
Therefore , the bar c ha rt, to o, may we11 include the precise numbers.
If a
bar c ha rt does not include the precise frequencies, then it sl~ o u ld
present a scale on the vertical axis, as w as d on e in Figure
'7.2.
Un-
fortunately, such charts in popular media o ften fail t o d o this,
Graphics for Multivariate Relationships
Th ere are a nuxnber
af
ways the relationship between tw o or m are
variables can be shown graphically, One is to use the bar chart.
Here the different bars represent different categories of the indc-
pendent: variable, and their heights represent: the dependent vari-
able, Hence, tl-re independent variable
must
be a norninal or ordi-
nal category var iable , and the dependent var iable e i ther
frequencies-----whether ctua l num bers o r percetitages

8/20/2019 Alan Monroe, Alan D. Monroe-Essentials of Political Research (2000)
http://slidepdf.com/reader/full/alan-monroe-alan-d-monroe-essentials-of-political-research-2000 123/214
FIGURE
7.2
X30pular
vote
for
president, 1996
souacr,:
Ric-hard
M, Scalni~~on,
tice V. hfcGillivraj~,
nd
Rhodes
A M .
Cook,
Anzerzlla Votes, vol.
22.
Wasfiington,
DC: C:ongresstonat
val variable. Figure 7.3 is an example. As with the univariate bar
chart, showing the exact nrlrnerical value
of
the height
of
the bar,
or at least including a scale, is desirable but unfortunately is not
always done.
Bar charts can also be used to illustrate the relationship between
three variables. These charts use bars whose height represents the
frequency for interval value)
of
the dependent variable for each
cornbillation
of
categories of the independent and control vari-
ables.
(It
does not matter wl~ich ariable is tl-re independent and
which is the coiltrol variable,) Such charts could he constructed
from
the results
of
corttroiliq
usizg c o n t i r t p ~ c y
~bles,
hich is
discussed in Chapter
10,
This approach could be extended to any
number of
independent and/or control variables, but the results
would be very hard for the reader to interpret. Figure 7,4 is an
ex-
ample of a chart showing the effects of controlling.
Line Gruphs
Another method
of
illustratir-rg the relationship between an interval.
dependent: variable and an ordinal category independent variable
is
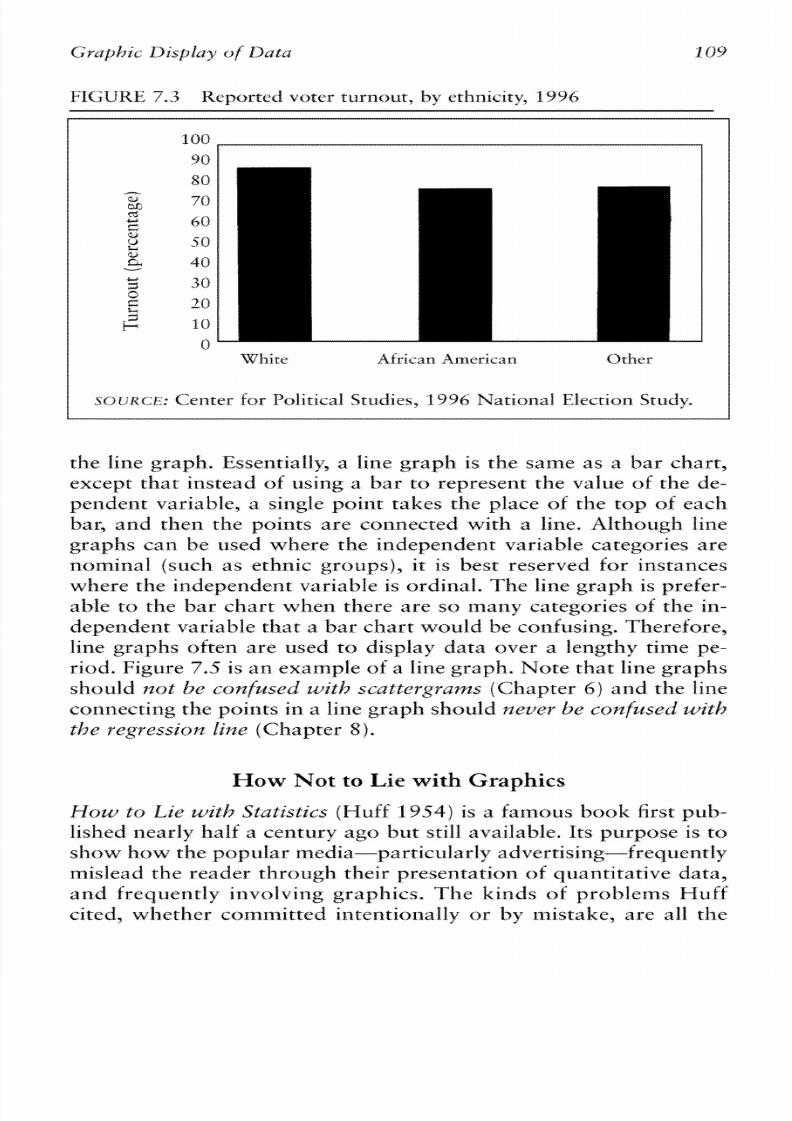
8/20/2019 Alan Monroe, Alan D. Monroe-Essentials of Political Research (2000)
http://slidepdf.com/reader/full/alan-monroe-alan-d-monroe-essentials-of-political-research-2000 124/214
FIGURE-,
7.3
Reportcci
voter turnou t , by ethnictry; 1996
White African Arncrican C?rher
l
S O U R C L :
Center
for Political
Studies, L996 National
ELection
Study.
l
the line graph , Essentially3 a line graph is the saiiBe as
a
bar chart,
except that instead
of
using a bar to represent the value
of
the de-
pendent variable, a single point takes the p lace af cl-re to p of each
bar, and then the points are connected
wi th
a line. Although line
graphs can be used where the independent variabk categories are
nominal (such as ethnic groups), it is best reserved for instances
where the independent variable is ordinal. The line graph is pre kr -
able to the bar chart when there are so many categories
of
the in-
dependent variable that a bar chart would be conftzsing, Therefore,
line graphs o h n are used to display data over a iengthy time pe-
riod, Figure 7 3 s an e x m p l e
of
a line graph.
Note
t ha t line g r a p h
sl-rauld ?;rot
e
cc~nfgsedwith scat~ergrcams Chapter 6 ) and the line
connecting the points in a line graph should never be
~07.tfgsed
wilFh
the
rqrsssion
line
(Chapter
8) .
How Not to Lie
with
Graphics
How to
Lie with
StatiStics w u l f 1954)is a famous hook first pub-
lished nearly half a cen tury ag o but still available, Its purpose is to
show
how
the pop ular media-par tic dart^.. advertising-frequentiy
rnislead the reader tl-rrough tlzeir presentation of quan titative
data,
and frequently involving graphics. The kinds
of
problems I-fulf
cited, whether committed intentionally or by mistake, are all the
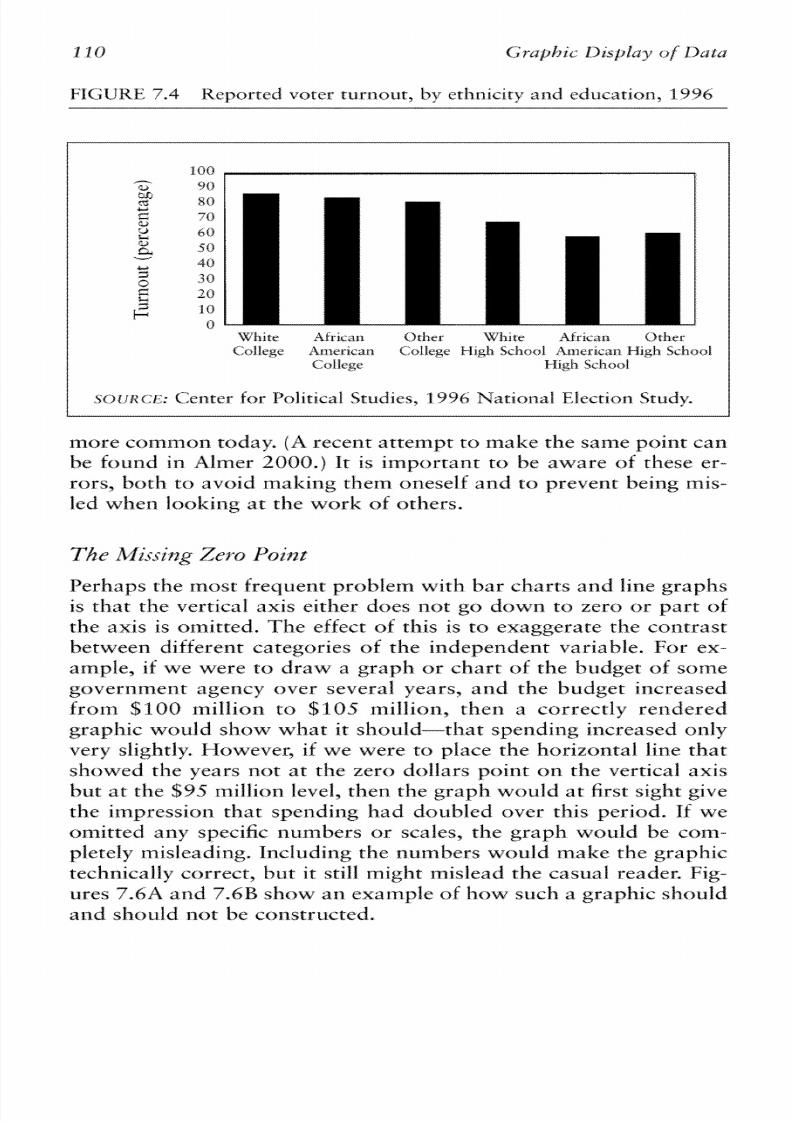
8/20/2019 Alan Monroe, Alan D. Monroe-Essentials of Political Research (2000)
http://slidepdf.com/reader/full/alan-monroe-alan-d-monroe-essentials-of-political-research-2000 125/214
FIGURE-,
7.4
Reportcci voter turnout, by ethnictry and cciucation,
1996
White
iZlrrcan
Clther Whre African
Other
College Amergcan College
High School
rimerrcan I-Ilgh
School
Coifege XIl&
School
I
sor1,tci.:
Center
for
Political Studies,
L996
National
ELection
Study.
I
more com m on today,
( A
receilt attempt to m ake the sam e point can
be found
in
Almer
2000,)
It is important to he aware of these er-
rors, both to avoid making them oneself
and
to prevent being mis-
fed when Looking at tl-re work of otl-rers.
The
Miislng
Zero
Point
Perhaps the m ost frequent problem with ba r cha rts an d line graphs
is that the vertical axis either does not go dawn to zero
or
part
of
the axis is omitted. The effect of this is to exaggerate the contrast
between different categories of the independent variable. For ex-
ample, if we were to dra w a graph o r chart of the budget of soiBe
government agency over several years, and the budget increased
from $100 mill ion to $105 mill ion, then a correctly rendered
graphic would sho w what it should-that spending increased
only
very slightly, However, if we were to place the horizontal line that
showed the years n at a t the zero doltars point on the vertical axis
but a t the $95
miliion
level, then the g rap h would a t first sight give
the impression that spending had doubled over this period. If we
omitted any specific numbers or scales, the graph would he com-
pletely misleading, Including the numbers would ~ ~ a k ehe graphic
technically correct, bu t it still might rnislead tl-re casual reader.
Fig-
ures
7,6A
and
7.6B
show a n exam ple of
how
such a g a p h ic should
and should not be constructed,

8/20/2019 Alan Monroe, Alan D. Monroe-Essentials of Political Research (2000)
http://slidepdf.com/reader/full/alan-monroe-alan-d-monroe-essentials-of-political-research-2000 126/214
Graphic Display of Data f f f
FIGURE-,7.5
Turnout of voting-age population in prcstdcntial elections,
1960-1
991;
60
50
Sri
G
40
30
Sri
20
3
l0
SCIEIRCE:
I%ul
K.
Abrtlmson,
J o l ~ n
H,
Altlrich, and
l3avid
W.
Rhode,
C h a ~ g erzd C:onthzdit~~~ zhe 2 996 and 2 998 EEections, Washington,
13C:
CC) Press,
1999, p.
69.
Sc;.ule~-nd Axes
Line graphs can
also
he misleading because
of
problems
with
how
the hr~ rizo nta l n d vertical axes are defined. Assigning the ixldeyen-
dent and dependent variables to the wrong axes can be
a
major
problem. When the independent variable is erroneously shown on
the vertical axis and the dependent variable is erroneously shown
an the horizontal axis, the relationship between the two variables
may appear completely the opposite
of
what it really is. Relation-
ships
also
may
he distorted
if
the
range of possible values for one
variable
is
s l ~ o w n
n
a m uch sl-rorter length than tha t used for the
othe r varia
hie,
13ictorialsare graphics similar to bar charts, except tha t rather th an
simple bars whose length represents the value
of
a variable, a pic-
ture
of
som e object is used, such
as
a sack
of
grain,
a
dollar sign, o r
a person, Pictorials are rlever used in scientific reporting, hut they

8/20/2019 Alan Monroe, Alan D. Monroe-Essentials of Political Research (2000)
http://slidepdf.com/reader/full/alan-monroe-alan-d-monroe-essentials-of-political-research-2000 127/214
FIGURE-,
7.6A
U.S.
per pupil
spending
o n
ed~rcation,
990-1
996-
correctly presented
S I I U R G E :
U,S,
Bureau of
the Census,
Statktical Abstract of the
Urzited
States,
1998.
Washington,
LX:,
1998,
p.
298,
are found in popular media and advertising,
They
are particrrlarty
likely to he misleading because the picture size is proportional to
the variable" value na t only in lzeight but also in widtlz, and som e-
times
in
depth, Thus if one category
of
the variable has a value
twice as high as another, its picture
would give
the impression that
the value was four (or even eight) tirxtes as great, And since these
pictorials are sometimes presented with no specific values
or
scales
attached, the reader would have n0 way of detecting the misrepre-
sentation.
The
Need
for
Standardization
The x~eed or standard ization was de ~n on stra ted n the discussion
of
operational definitions in Chapter
2.
Whenever we are present-
ing data on aggregates, suck as cities a r states, the measure is likely
to be meaningful only if it is presented in some way that is stan-
dardized, usuaily to population, such as percentages or per capita
figures. Since most geaphics present aggregate data, this is particu-
larly
important.
A bar
graph showing the total number
of
crimes
c o m h t t e d
in
different states might give the impression that
Cali-

8/20/2019 Alan Monroe, Alan D. Monroe-Essentials of Political Research (2000)
http://slidepdf.com/reader/full/alan-monroe-alan-d-monroe-essentials-of-political-research-2000 128/214
Graphic
Display of Data
FIGURE-,
7.6R U.S.
pcr
pupil spcrldtng on cciueadon, 1990-1 996-
incc~rrectfy resented
S O I I R C E : U.S, Rureacr of
rhc
Census,
S;tatbtz"clal
Abstract
ofthe
U~zE'ted
;tages,
f
998.
Washington,
DC, 1998, p.
298.
farnia and New York are far more dangerous places to live than
smaller states, whereas the same chart
based
on crime rates
f i x . ,
crimes per 100,000 population) would show trtuch less diflerence,
and small states would not always I-rave the Ir~west ates.
The same principle holds when our unit of analysis is time
(i.e.,
comparing different time periods), because population sizes
change. But when dealing with variables measured
in
dollars or any
o t he r
unit
u l
currency, we also need to control far inflation,
A
graphic showing the incomes of
my
U.S. population gri~upn dif-
ferent years will generally show a significant increase over time, but
that would be largely the result of decreases in the value of the
dol-
lar every year
for
m a n y
decades, Therefore, resyo~~siblerayf~ics
(or verbal presentations of the same information) always present
these figures in terms of consunt dollam,
that is, the amounts are
ad~usted
or
inflation.
Principles
for Good
Graphics
Aside from avoiding the errors noted above
( i t
is assumed that you
would not want to mislead anyone), what are the rules for using
graphic displays correctly and effectiveiyi
8/20/2019 Alan Monroe, Alan D. Monroe-Essentials of Political Research (2000)
http://slidepdf.com/reader/full/alan-monroe-alan-d-monroe-essentials-of-political-research-2000 129/214
The
purpose of a g a p h i c is to convey certain characteristics
of
data
to the reader more effective15 and this is best done by making the
graphic as sixnple as possible. Large num bers of categories in pie o r
bar c har ts are a p t t o be confusing. If
a
large number of categories
are rlecessary fc~ rull presentation
of
the data, then a table
i s
a bet-
ter choice tl-ran a chart or graph, Extensive verbal expianations in
the body of a graphic shc~uld e avoided, as should unnecessary
a r w o r k , h n c y borders, an d the like. If' you are printing a graphic
such as
a
pie cha rt or a segmented bar chart where categories m s t
be distinguished by their app eara nce and it is not possible to print
them in difleren t colors, then dif'ferent shad ings must he used. But
keep the shadings as simple as possible, avoiding the use of cross-
hatcfning.
Although unnecessary wordirlg within a grap hic sh o~ zld be
avoided, some use
of
words is essential to
a n y
char t o r graph .
Witlain the graphic, it is essential that the variables be clearly
Xa-
beled, including the uilits in which they are measured. Every
graphic should have a titfe
above
it specifying what the graph is,
again including the variables. Finaily, if the da ta are nu t generated
from
the research you are presenting but are from anothe r source,
that source should be ideritified, ~zsuallyon a
line
below the
graphic. The same rules, incidentally, also apply to any nuxnerical
tahles you present.
Describing
the Gruphi~.
n
the
Tewt
Too often graphics are tl-rrawn into a paper with little or no
dis-
cussion in the text, There s h o ~ ll d lway s be a description of the
table, including the conclusioil that the au tho r wishes the reader to
draw. 117 sam e circles i t is a maxim that every table, chart, o r grap h
that appears in a scientific report ought to have at least a page of
discussion. Although a page may be more tha ll is always necessary,
certainly a parag raph
i s
needed, If the re is nothing t o be said about
a graphic, then one would have to question wl-rether it is really
worth iilcluding.
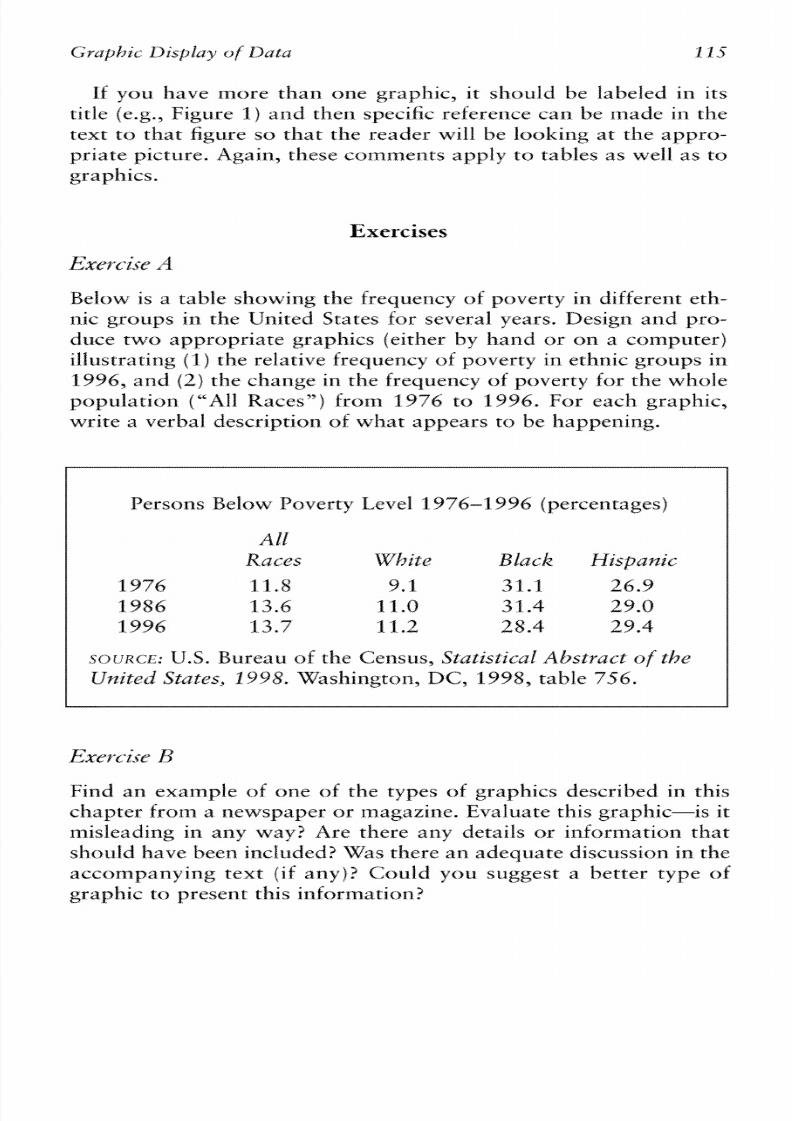
8/20/2019 Alan Monroe, Alan D. Monroe-Essentials of Political Research (2000)
http://slidepdf.com/reader/full/alan-monroe-alan-d-monroe-essentials-of-political-research-2000 130/214
Jf
you have more than one graphic, it should be fabeled in its
title (e.g., Figure 1)an d then specific reference can be made in the
text t o th at figure so that the reader w ill
be
Looking a t th e appro-
priate picture. Again, these comments apply t o tables as well as to
graphics,
Exercises
Exerc3i3-e
Belr~w s a table sl-rowing tile frequency of poverty in different e h -
nic groups in the United States for several years. Design and pro-
duce two appropriate graphics (either by hand or on a computer)
illustrating ( I
)
the relative frequency
of
poverty in ethnic
groups
in
1996,
and
(2)
ile change in the frequemy of poverty h r tile whole
population
("'A11
Races")
f rom 2976
t o
1996
For each graphic,
write a verbal description
of
what appears to he happening.
Persor~sBelow Poverty
Level 1976-1996
(percentages)
A
E
Races WI7ite Black Hispanic
l976
11.8
9.1
31.1
26.9
1986 13.6; 11.0 31.4 29.0
1996 13.7
11.2 28.4 29.4
sc3r~~cr;,:
.S. Bureau of the Census, Statistical Abstract
of
the
brrrited
S t a t e , 3 998,
Washington,
DC, 1998,
table
'7.56.
Find an exaxnple
of
one
of
the types of graphics described in this
ch ap ter from a newspaper o r magazine, Evaluate tl-ris graphic-is it
misleading
in
any way? Are there any details or inbrmation that
should have beer1 in c lu d e d W a s there an adeq uate discussion in the
accompanying text (if an y )? Could
y o u
suggest a better type of
graphic to present this information?
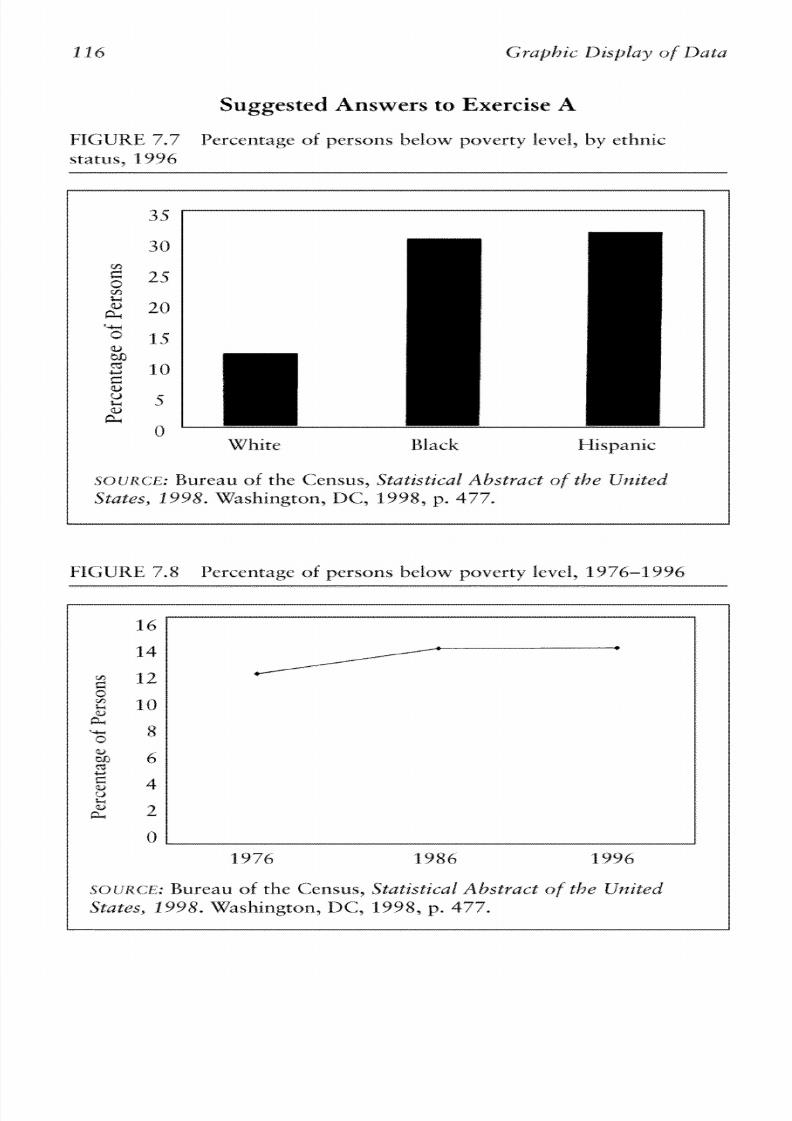
8/20/2019 Alan Monroe, Alan D. Monroe-Essentials of Political Research (2000)
http://slidepdf.com/reader/full/alan-monroe-alan-d-monroe-essentials-of-political-research-2000 131/214
Suggested Answers
to
Exercise
A
FIGURE-, 7.7 Percentage
of
persons beiiow poverty
Isvci,
by
ethnic
status,
1996
I
W
White Black
Hispanic
I
,sertjXce: Bureau
of the
Census, Stagistical Abstrac~
fthe Ufzzted
States, f 998 ,
Washington, DC',
1998,
p, 477.
FICiliRi-,
7-24
13ercenrage
of persons
be1tj-w
poverty
level,
1376-1396
S O L ~ R C E :
ureau
of the
Census,
S&tistical
Abslract
of
the
I_ilzited
States, 1998.
Washington,
DC:, 1998, p.
477.

8/20/2019 Alan Monroe, Alan D. Monroe-Essentials of Political Research (2000)
http://slidepdf.com/reader/full/alan-monroe-alan-d-monroe-essentials-of-political-research-2000 132/214
Nominal and
Ordinal Statistics
This chapter presents detailed explanations of several measures of
strength of assoc iation (c orr ela tion s) an d o ne test of significance
appropriate for contingency tables with nominal a nd o r d h a l vari-
ables. Students sometimes wonder whether it is practical to learn
h aw actually t o comp ute such measures; after all, computer pro-
gralrts are alm ost afways used for the task, There a re tw o reasons
why
i t
is useful to have some familiarity with m ethod s of compu-
tation.
One
is tha t you may occasionalty find yourself lookin g at a
simple frequency table fo r which it itlight be quicker sittlply to
compute
a
statistic
by
hand tha n t o enter the data into a computer,
The more important reason, however, is that knowledge c>f how a
statistic
is
defined and computed provides a deeper understanding
of its meaning, wlzich
is
valtrahle in understanding how to apply
an d interp ret it correctly.
Correlations
for Naminaf Variables
Lamkrdla 2)
s
a
correlationa l statistic tha t m easures the strength of
assocktion between two nominal
variables,
TXierefore, it may be
used for any contingency tabie, according to rule
1
for the use of
levels
of
measurement. T he range of possible values for lambda
is
from O to +I, hat is, h a m nu relationship t o
a
perfect relacionship.
Therefore, a value
of
lam bda t ha t results in a negative num ber or a
r~urllher reater tha n
1
is a resutt
of
an error in cs~ tlpu tatio n.

8/20/2019 Alan Monroe, Alan D. Monroe-Essentials of Political Research (2000)
http://slidepdf.com/reader/full/alan-monroe-alan-d-monroe-essentials-of-political-research-2000 133/214
TAamhdameasures
proportional redtaction of error;
that is, it
measures how much better one can predict the value of each case
on
the dependent variable if one knows the value of the indepen-
dent variable. The formula for l a ~ ~ b d as a simple one:
b-a
Lambda =-
b
where
b
is the nuxnber of errors one would make in predicting the
value of each case an the dependent variable if one did not
know
the value of the independent variables, and a is the nrlmber of er-
rors one would make when the value of the independent variable
is
known,
'This is a simple idea, but it can he a Little tricky at first. Consider
the c~ntingencyable below Since we will need the marginal row
totals, they are included with the table,
Prot Cath
Jew
(Tc~taif
VOTE
Clint-on 39
Suppose we had a group of
l56
people and
k~levv
nothing abr~ut
them except the overall distribution of their votes (the raw total4
from tl-re table above.
Ef
we had to guess haw any given individual
voted, it would be best to guess that he or she voted for Glinton,
We would be correct on the
76
who did vote for Clinton, but
wrong on the 6.5 who voted for Dole and the 15 wl-ro voted far
Perot; this would he a total of 80 errors, which is therefore the
value
of
b. But then
if
we take account
of
the indeperident variable,
religion, and look within each column of the table, we can xnake
another set of predictions using the same method as before. We
would predict that each Prr~testantvoted for Dole, as that is the
best- guess, but-
we
would be wrong on the 39 Protestants who
voted far Glinton and the 10 Protestants who voted for Perot. We
would predict that aII Catholics. voted for Clinton, but ws~uldmake
errors on tl-re
16
Catholic
Dole
voters and the
4
13erot-voters. Simi-
larly, we would predict that all Jews voted for Clinton, hut he
wrong
o n
the 2 who voted for Dole and the I who voted for Perot,
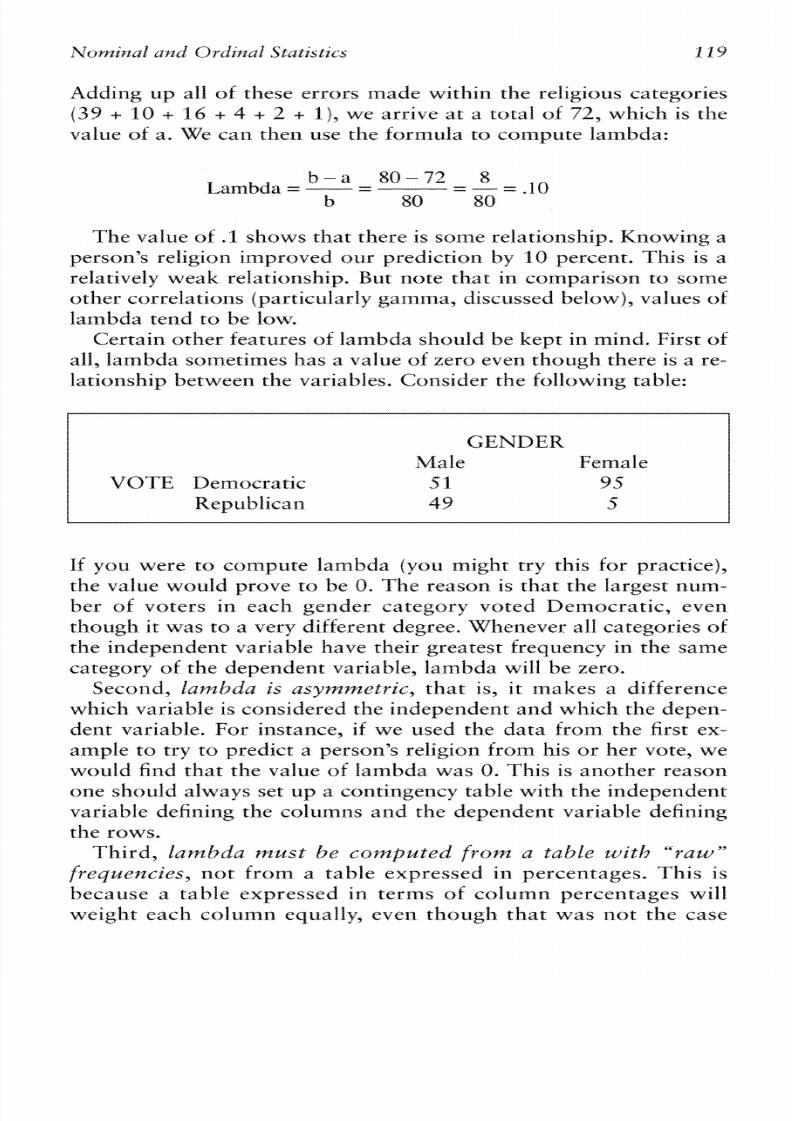
8/20/2019 Alan Monroe, Alan D. Monroe-Essentials of Political Research (2000)
http://slidepdf.com/reader/full/alan-monroe-alan-d-monroe-essentials-of-political-research-2000 134/214
Adding up a11 of these errors made within the religio~ls ategories
( 3 9 + 10 + 1 6
+
4 + 2 + l ) ,
we arrive at a total of 72, which is the
value of a.
We
can then use the formula to compute larnbda:
b-a 8 0 - 2 8
Lambda =-
= = . I Q
b 80 80
The value of .
1
sl~owshat there is some relationship, Knowing a
person" religion improved our predictiorr
by 10
percent,
This
is a
relatively weak relationship, Brtt note that in comparison to soirte
other correlations (particularly gatrtma, discussed below), values of
lambda tend to be low,
Certain other features of lambda should he kept in mind. First of
all,
iambda str~rtetimes as
a
value
of
zero evexi though there is
a
re-
lationship between the variables. Consider the following table:
GENDER
.iMale Female
VOTE
Democratic
51 9.5
Republican 49
5
If you were to compute lambda (you might try this for practice),
the value would prove to be
0,
The reason
is
that the largest num-
ber
of
voters in each gender category voted Democratic, even
though it was to a very different degree. Whenever all categories of
the independent variable have their greatest
fi-eyuency in the same
categov of the depedent variable, larrrhda will be zero.
Second, Eambcia is asy~~unetrtc,hat is, it makes a difference
which variable is considered the independent and which the depen-
dent variable. For instance,
i f
we used the data from the first ex-
ample to try to predict a person" religion from his or her vote, we
would find
that the value
of
IIambda was Q,
This
is ant>ther reason
one shouIct always set up a contingency ta hle with the independent
variable defining the columns and the dependem variable defining
the rows.
Third,
Eanzhda
must
he
confpzated fronf
a table
with
" r a z ~ ' '
Jreque~cies,not from a table expressed in percentages. This is
because a table expressed in terms of column percentages will
weight each column equally, even though that was not the case

8/20/2019 Alan Monroe, Alan D. Monroe-Essentials of Political Research (2000)
http://slidepdf.com/reader/full/alan-monroe-alan-d-monroe-essentials-of-political-research-2000 135/214
for the raw data, Therefore, using a percentage table
will
~zsuaflg
result in an incorrect answer,
Box 8.1
summarizes the critical informatioil about lambda and
provides another example of its computation, A dditional examples
can be found
in
the Exercises A and B a t the end of th e chapccr,
Goodman and
Krrrskalk
tau-h
(z,J
is similar to lambda. It uses a
method of prediction that will riot
fail
tct detect certain relation-
ships,
as
sametirnes occurs with lam bda, Phi is anotlzer statistic fur
measuring the stretlgth of association between two nr~minalvari-
ables. It
is
discussed in detail later in this chapter,
Correlations for Ordinat Variables
Suppose
we
have a table with only tw o rows and tw o columns, and
both variables are ordinal. (Actualt);; since bat11 variables would be
dichotr>mies, his could be
any
two-by-two table,)
One way
tc-,eval-
uate the strength of the relationship would be to csm pute a statis-
tic called Y ~ l e kQ, The formula
Eor
Yule%
Q
is:
where a,
h,
c, and d a re the frequencies in the h u r cells
of
the table
arranged as shown below,
VARIABLE
1 INCOME
High
Low
High Low
VARIABLE 2 High a b PQLZTICAL
High
8
4
INTEREST
Low
c
ci LOW
2 6
Thus, to m m pute Yule's
Q, one
would simply multiply together the
tw o diagonal pairs
of
cases
and
then divide the difference between
these products by t l~e i r um. Using the frequencies in the table on
the right, the computation would be:
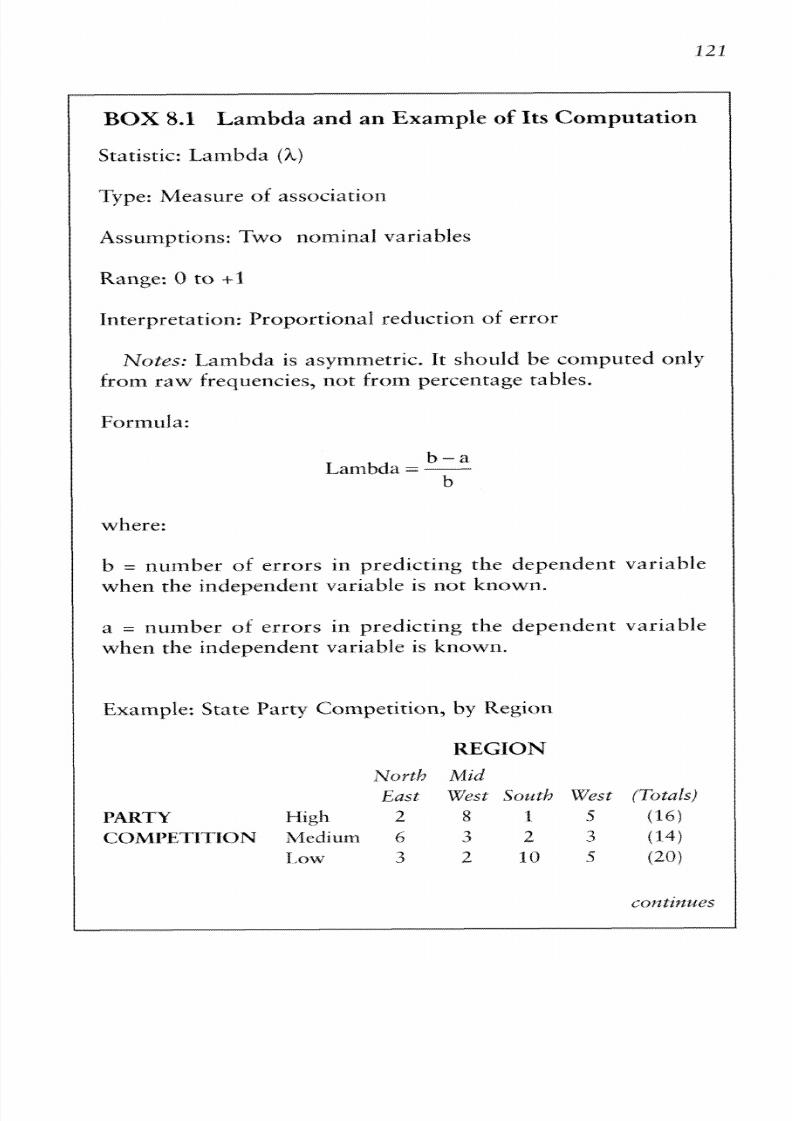
8/20/2019 Alan Monroe, Alan D. Monroe-Essentials of Political Research (2000)
http://slidepdf.com/reader/full/alan-monroe-alan-d-monroe-essentials-of-political-research-2000 136/214
BOX 8.1 Lambda and an
Example of
Its Computation
Statistic:
Zamhda ( h )
Type: Measure of association
Assumptions: Two nominal variables
Range: O
to + l
Interpre tation: 13roportional reduc tion of e rro r
Notes:
Lambda is
asymmetric.
Tt should
be computed only
from raw frequencies, nor from percentage tables.
b-a
Lambda =-
b7
where:
b =
number
of
errors in predicting the dependent variable
when the
independent variable
is
not
known.
a = number of errors in predicting the dependent variable
when the
indeprildent variable is k ~ l o w n ,
Example:
State
Party Competi tbn,
by
Region
REGION
NortJ?
&lid
East West SOU ~J?West (Totals)
PARTY High
2 8
1
5 (16)
GQMPETIDOPIIF Xlcdiurn 6
3
2 3
(14)
Law 3
2
10 S (20)
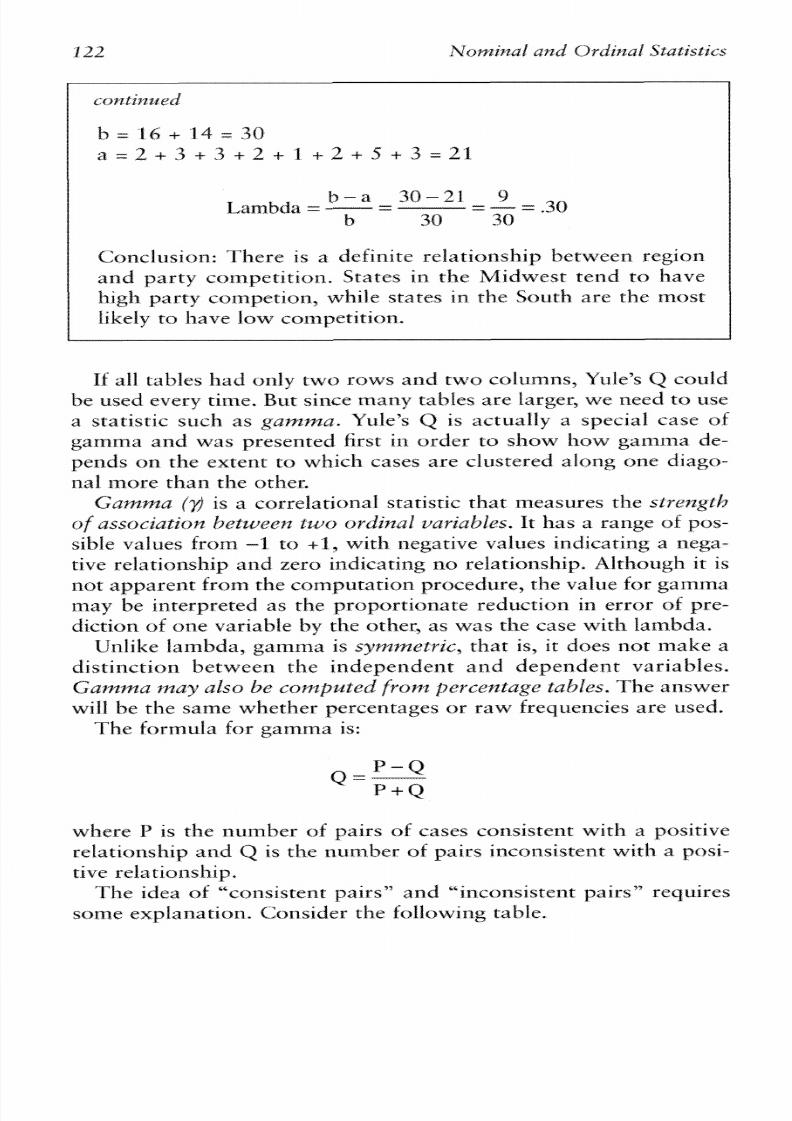
8/20/2019 Alan Monroe, Alan D. Monroe-Essentials of Political Research (2000)
http://slidepdf.com/reader/full/alan-monroe-alan-d-monroe-essentials-of-political-research-2000 137/214
Conclusion: There is a definite relationship between region
and
party competition. States
in
the Midwest tend to have
high
party competion, while states
in
the South are the most
likely to l-rave low com petition.
If all tables had on ly tw o row s a nd tw o columns, Yule's Q could
be used every time, Rut since marry tables are Larger, we need to use
a statistic such as
pmma.
Yule's Q is actually a special case of
gamma
and was presented first in order to show how
gamma
de-
pends on the extent to which cases are clustered along one diago-
rial more than the other.
G a m m a (y)
is a
correlational statistic that measures the
strength
of
association between
two
~rdiinal ariables. It has
a
range of pos-
sible values from -1 t<>
g ,
with riegative
values
indicating a nega-
tive relationslnip
Ltnd
zero indicating no relationship. Althawgh it is
not ap parent from the computation procedure, the value for gamma
may
be interpreted as the proportionate reduction in error of pre-
diction of one variable
by
the other, as was the case with
lambda.
Unlike tambda, gamma is symmefr ic , that is, it does not make a
distinction betweeri th e indeperident a n d Qeperident variables.
Gamma lney
also
b e cumpziteci
fiom
percentage t.rzlik.s,
Th e answer
will
be
the same whether percentages or raw frequencies are used.
The
formula for gamiBa
is;:
where
P
is the number of pairs of cases consistent with a positive
relationship and Q is the number
of
pairs inconsistezlt with a posi-
tive relationship.
The idea of "consistent pairs"
and
"inconsistetlt pairs" "requires
some explanation. Consider the following table.

8/20/2019 Alan Monroe, Alan D. Monroe-Essentials of Political Research (2000)
http://slidepdf.com/reader/full/alan-monroe-alan-d-monroe-essentials-of-political-research-2000 138/214
VARIABLE 1 INCOME
Hi Med Lout bIigi9 Med Low
VARIABLE 2 X~QLXTICAL
Nigh a b
c XNTEREST
H i h
C; 4 1
Medl'gnt J e
f Mecfigm 3
8
S
Edow
g h t
Edow 2 7 9
I f
there were a perfect positive relationship, every case that was
higher on the first variable than another would also he higber on
the second variable. Such comparisoils are therefore "c~~nsistei~t"
with a positive relationship. They would include a coinparison of
the higw high cases on each variable (cell
a)
with all of those in cells
below an d t o the right (i.e., cells e, f, h, an d i), Cells h, d, and e also
have cases that are lower o n both variables (i.e., helow an d t o the
right
on.
t l ~ eable). We are not realty interested in individual
com-
parisons, hut only in how many such comparisons could he made;
the n~zmber f such pairs can be calculated by multiplying the fre-
quencies in each
pair
of "cansistent" cells
and
adding up the total.
In the example for income and political interest, the calculation
would be
P
=
6(8 +
S
+
7 9)
+
4 ( 5 c
9)
c
3(7
+
9) c 8 ( 9 )= 350.
The number of ""inconsistent pairs" is the nuxnber
of
coxnpar-
isons
u l
cases that are higher on uile variable but lower on the
other, fn the exanlpfe above, cell c
is
iower olx variable 1 , but
higl-rer o n var iable 2 tllan ceits
Q,
e, h, and g, Celts
b
and f also
may be compared to cases that ar e inconsistent, tha t is, below a n d
to the left,
Again,
the total number of inconsistent pairs would be
c o m p u ~ e d y xnuttiptying the frequencies of atl
of
such pairs a nd
summing. In the income-pc.,iitical interest exam ple, the calcu lation
w o u l d b e Q
=
1(3
+
8
c 2
c
7)
+ 4 ( 3
2 f
c
S
( 2
c
7 )
c
8f2f
=
101.
13utting tl-rese num bers in to the form ula , w e have:
P-Q
350-101 249
Gamma =
= 4-53
P + Q -
350+101
-451
T he value of
.SS
indicates tha t there is a xnoderately stron g pos-
itive relationship between incom e and polit ical i~lte rest; ha t is,
people with higher incomes tend t o have m ore political interest.

8/20/2019 Alan Monroe, Alan D. Monroe-Essentials of Political Research (2000)
http://slidepdf.com/reader/full/alan-monroe-alan-d-monroe-essentials-of-political-research-2000 139/214
T h ~ l she c s ~ ~ y u t a t i o ~ ~
f
gamma is the saEBe as that
of
Yule's Q
except that there are more possiHe comparisons. No te tha t when-
ever
Q,
the num ber of inconsistent pairs, is greater than P, he num-
ber of consistent pairs, the value of gamma will be negative*
Garnm a, Like laxnbda, has som e drawbacks, One is that it ignores
instances where there are "ties," that is, where cases are the same
o n
one variable but dif kr en t
o n
the other. T he effect can be seen in
a tab le like this one:
INCOME
Hi&
L a w
POLITICAL
kiigh 5 5
INTEREST
Low O
1
The value
of
gamma for this table would
be
a "perfect'"
+l ,
ven
though the relatiollslzip might better he described as a weak one,
For this reason, a similar statistic, Kendal l"S .a~-6,
m a y
be used,
Kendail's tau-b is essentially the same as gamxna, but it ad justs the
value to take account
of
ties. The computed value
of
Kendall's tau-
b will usually he iess than but never greater than the value
of
gamma for the same table.
Box
8.2
s u m a r i z e s th e cr itic al i nf o rm a t io n a b o u t ga m m a
and provides another exafnple of i ts computation. Adcti t ional
examples can be found in Exercises
A
a n d
B
at the end of the
chapter.
Chi-Square:
A
Significance
Test
The most cornmonly used test
of
significance ior concillgency tables
is chi-square
jlC9).
Since it assumes th at the variables are
rzt>mi~znE,
t
is
a h y s appropriafe
as far as level
of
measwement is concerned,
How ever, like all significance tests, the results are meaningful
only
if tl-re data come from a random sample,
Unlike any of the other statistics we have presented, chi-sqtxare
has a range
of O to
N, where
W i s
the total number
of
cases in the
table. Th is would make ch i-square difficult t o interpret, except that
we rarely make use of the chi-square value directly. Rather, as we
will see below, another step is taken to determine the associated

8/20/2019 Alan Monroe, Alan D. Monroe-Essentials of Political Research (2000)
http://slidepdf.com/reader/full/alan-monroe-alan-d-monroe-essentials-of-political-research-2000 140/214
BOX 8.2
Information About Gamma and
an
Example
o f
Its
Computation
Statistic:
Gamma jy)
Type: M easure of association
Assumptions: Two ord inal variables
Range:
-1 to
+l
Interpretation: Proportional reduction of error
Formula:
where:
I$ =
number of pairs of cases consistent with a positive
relationship,
Q = number
of
pairs o f cases not consistent with a positive
relationship.
Exztmpfe:
Vocer
turnout, by age
AGE
60 01der 50-59
4 0 4 9
30-39
38-29
TURNOUT
Voter 12 13 I4
9
7
Nonvoter 9 6
7
I l
l 4
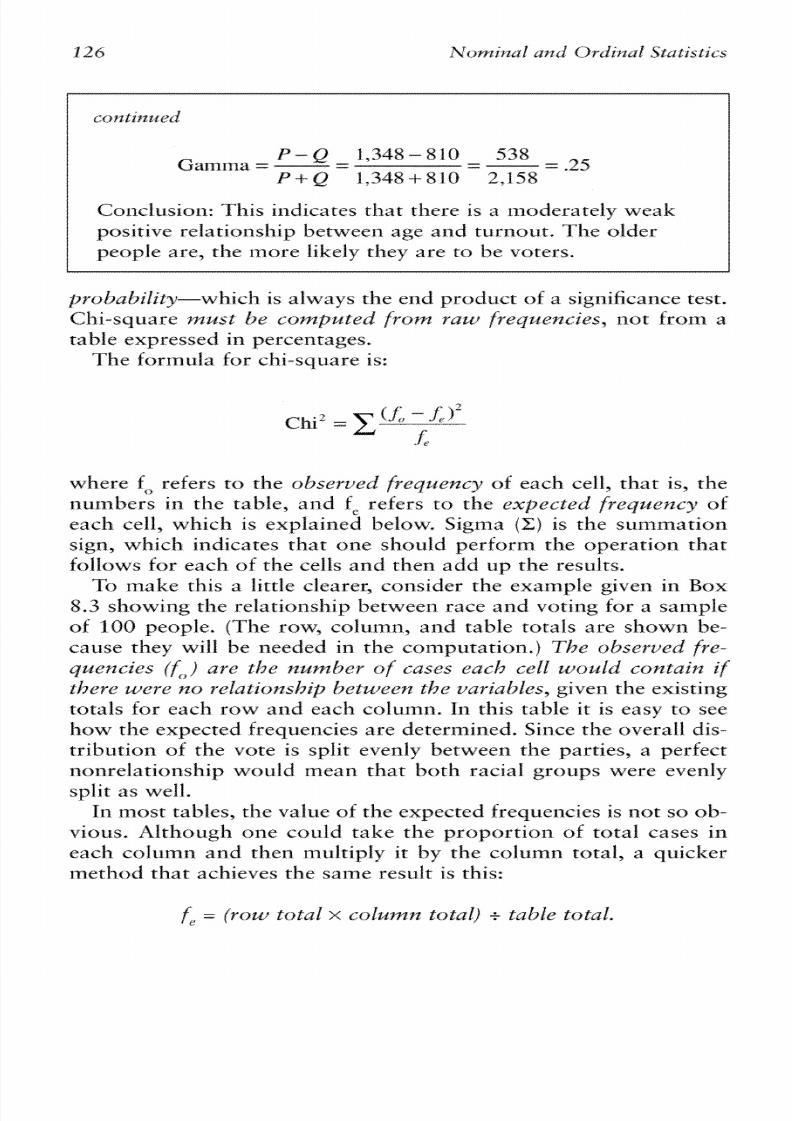
8/20/2019 Alan Monroe, Alan D. Monroe-Essentials of Political Research (2000)
http://slidepdf.com/reader/full/alan-monroe-alan-d-monroe-essentials-of-political-research-2000 141/214
Conclusion: This indicates that there is a rnoderately weak
positive relationship beween age
and
turnout.
The
older
people are, the more likely they are to be voters.
probabiliq-which is always the end product
of
a sigllificance test.
Chi-square
m u s t be
comgated from raw
f i ey~enczes ,
not from a
table expressed in percentages.
The formula for chi-square is:
where f refers to the observed
fieqtrency
of each cell, that is, the
numbers in the table, and
f e
refers to the
expected freqgency
of
each cell, which
is
explained below,
Sigma (C)
is the summation
sign, which indicates that one should perform the operation that
hllows for each of the cells and then add up the results,
To
make this a little clearer, consider the example given
in
Dt~x
8.3
showing the relationship
between
race and voting
for
a sample
of
100
people. (The row, coluxnn, and table totals are shown be-
cause they will he needed in
the computation,)
The observed f ~ e -
quencies
(6))re
the number of cases
each
cell would contain
if
there
were n o relatz'tznship be tw een
the
varkbles ,
given tl-re existing
totals for each row and each column. In this table it is easy to see
how the expected frequencies are determined, Since the overall dis-
tribution
of
the vote is split evenly between the parties, a perfect
nonrelationship would mean that both racial goups were evenly
split
as
welt.
In most tabtes, the value
of
tl-re expected frequencies is not so ob-
vitrus. Although one could take the proportion
of
torai cases in
each
c o h n and
then multiply
i t by
the column tcttal, a quicker
metl-rod tl-rat achieves the sane result is this:
fe = (row
total x colum n total) t able total.
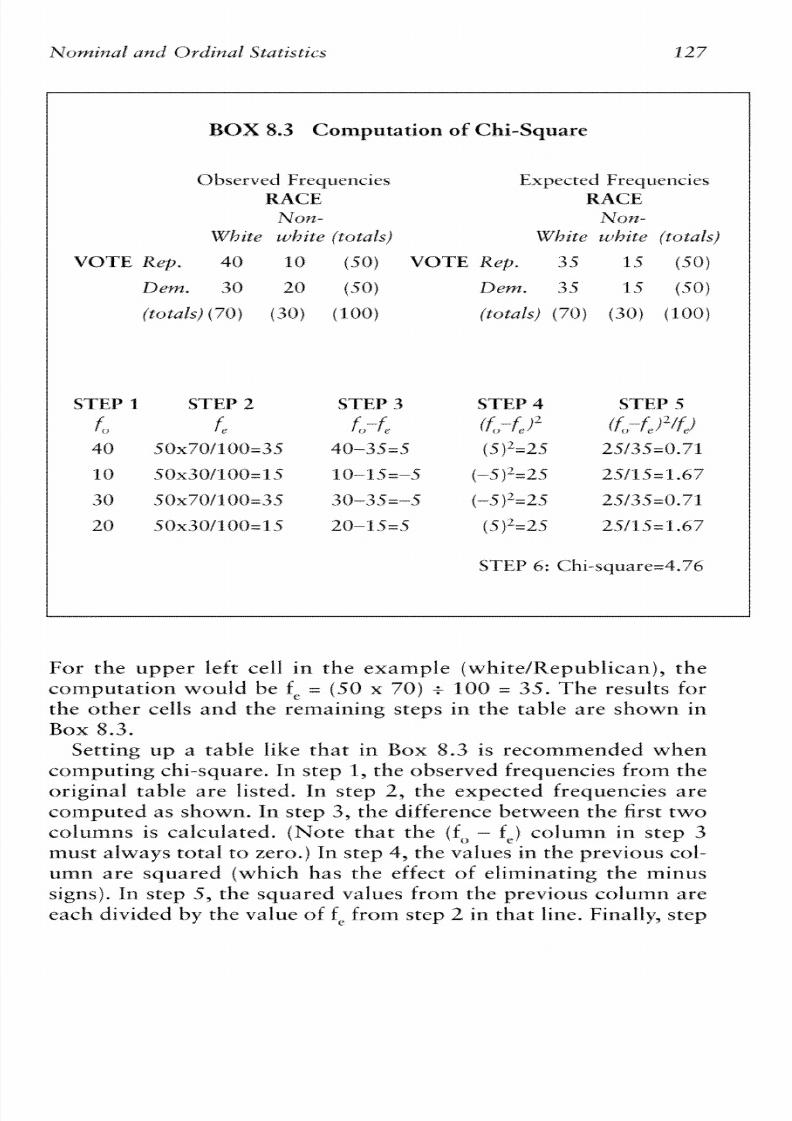
8/20/2019 Alan Monroe, Alan D. Monroe-Essentials of Political Research (2000)
http://slidepdf.com/reader/full/alan-monroe-alan-d-monroe-essentials-of-political-research-2000 142/214
BOX
8.3
Compura~on f
Clni-Square
Observed
Frequencies
Expected
Frequencies
RACE RACE
Norz- Non-
Wj3il.e white (total's)
iVhi~c:white ( t o ~ a l s )
VOTE Rep, 40 IQ) (58)
VOTE Kej>.
3.5 15 (58)
Dem.
30
20
(SO)
Dcnz,
35 1.5 (SO)
STEP 1 STEP 2 STEP 3 STEP
4
STEP 5
L fc
O-te
6-fp P 6 -fePfJ
40
50~701100=35
40-35=5
(5)"=25 2.5135=0,71
10 .50~30/100=1.5 10-IS=--S
(-5)"=2
S2S/lS=
1.67
30 5 0 ~ " 7 /
(10=35
30-35=-5
(-.5)2=2. i
25135=0.17;1
20 50~301100=15
20-I5=5
(5)"=25 2.5115=1,67
For the upper left cell
in
the ex am ple (wl-ritelRepubiican), the
com putation would be fe =
(50
x 70)i 200
= 35.
The results for
the
other mIls and
the
remaining steps in the table are shown in
Box
8.3,
Setting up a table like that in
Box 8.3
is recoxnmended when
com puting chi-square. In step 1, the observed frequencies from the
original table are
listed,
fn step
2,
the expected frequencies are
cornpured as s i~ ow n . n step 3, the difference between the
first
two
columns is calculated. ( N ot e tha t the (fc,- e) column in srep 3
must
always
total
to
zero.)
117
step
4,
the values
in
the previous
csl-
u r n a re squared N h ic h has the effect of eliminating the xninus
signs), In step
5,
the squared values from the previous colum n are
each divided by the value of fe from step 2
in
that line. Finally, srep

8/20/2019 Alan Monroe, Alan D. Monroe-Essentials of Political Research (2000)
http://slidepdf.com/reader/full/alan-monroe-alan-d-monroe-essentials-of-political-research-2000 143/214
6 entails tcrtaling the values in step
5,
which produces the value of
ch i-sq ut~ re. n this exaxnple, ch i-sq ut~ re s 4.76.
As
noted earlier, the value of chi-square does not mean much
in itself. In order ttr determine the p r o b ~ b i l i t y , t is necessary to
consult a prc~babl'lity
of
chi-square table, a version of which is
reproduced in Table 8 - 1 , Before looking up the value of chi-
squ are in the table, thou gh, o ne m ore calculation
is
needed: The
degrees of freedom
do
in the original table must be
computed.
This is do ne by m ultiplying the num ber of row s minus on e
by
the
x~umber f columns ininus one: df
=
(r
-
l f ( c - I f . In the above
exampfe, in which the table
has
twr) rows an d tw o columns, the
calculation is as follows: df
=
(2
-
1)( 2-
I ) =
1,
This means that we look to row I in the degrees of freedom
colum r~ n the left s ide of the tab le , F r t ~ ~ nhere, we look across
the table to see where our chi-square value of 4.67 would best
fit.
We
see th at it falls betw een
3.841,
which
is
in the
.OS
coltirnn,
and 5,412, in the .02 column. This means that the probabili ty ( p )
associated wit11 our chi-square value is between that for
3.841,
which is .OS, and that for 5.412, which is -02; hence
.Q$
> p z
.02.
Recalling the discussion of significance in Chapter
6,
we can
conclude that this reiarionshiy is significant because the protla-
bility
of
such a relat ionship occurring by chance in a random
s a ~ n p l es less than .05.
When using a probability of chi-square table, you may sorne-
times find th at the chi-square you
h a w
calculated is larger than
any value in the appropriate fine, This means that the probahil-
ity is
less than
the lowest probability found
in
the table. In Tabfe
8.1,
this would mean that
p <r ,001,
which is highly significant.
Similarly,
i f
the calculated value is less thart any value in the ap-
pr op ria te fine of tl-re tab le, the p rob ab ility is greater than the
highest proba bility sho w n and is therefore n ot significant.
Even
when there is no relationship in
a
table, it may not be
pclssi ble for observed frequencies t o be exactly e yua i t o expected
frequencies, because the observed frequencies cannot be frrac-
tionat values.
When
the number of cases is large, this problem
will make no practical difference. But- when the expected fre-
qu m cy for a cell
is
small, that is, less than five, some inflation of
chi-square is possible. For that reason,
an
alternative method,
such as
Fisher3 exact
test , or a correction of chi-square for con-
tinuity, can be used, IMany statistical com pu ter pro gram s prov ide
this when x~eeded,

8/20/2019 Alan Monroe, Alan D. Monroe-Essentials of Political Research (2000)
http://slidepdf.com/reader/full/alan-monroe-alan-d-monroe-essentials-of-political-research-2000 144/214
129
TABLE 8.1 Probability of Chi-Square
Degrees qf Probability I.eue1.c
Freedom .20 .I0 .05 .02 .0I .001
1 1.642 2.706 3.841 5.412 6.635 10.827
2 3.219 4.60.5 5.991
7.834 9.210 13.815
3 4.642 6.251
7.815 9.837 11.341 16.268
4 5.989 7.779 9.488 11.668 13.277 18.465
5 7.289 9.236 11.070 13.388 15.086 20.517
6 8.558 10.645 12.595 15.033 16.812 22.457
7 9.803 12.017 14.067
16.622 18.475 24.322
8 11.030 13.362
15.507 18.168 20.090 26.125
9 12.242 14.684 16.919 19.679 21.666 27.877
10 13.422 15.987 18.307 21.161 23.209 29.588
11 14.631 17.275 19.675 22.618 24.725 31.264
12 15.812 18.549 21.026 24.054 26.217 32.909
13 16.985 19.812 22.362 25.472 27.688 34.528
14 18.151 21.064 23.685 26.873 29.141 36.123
1.5 19.311 22.037 24.996 28.259
30.578 37.697
16 20.465 23.542 26.296 29.633 32.000 39.252
17 21.615
24.769 27.587
30.995 33.409 40.790
18 22.760 25.989 28.869 32.346 34.805 42.312
19 23.900 27.204 30.144 33.687 36.191 43.820
20 25.038 28.412 31.410 35.020 37.566 45.315
21 26.171 29.615 32.671 36.343
38.932 46.797
22 27.301 30.813 33.924 37.6.59
40.289 48.268
23 28.429 32.007 3.5.172 38.968 41.638 49.728
24 29.553 33.196 36.435 40.270 42.980 51.179
2.5 30.675 34.382 37.652 41.566 44.314 52.620
26 31.795 35.563 38.885 42.856 45.642 54.052
27 32.912 36.741
40.113 44.140 46.963 55.476
28 34.027 37.916 41.337 45.419 48.278 56.893
29 35.139 39.087 42.557 46.693 49.588 58.302
30 36.250
40.256
43.773 47.962 50.892 59.703
continires

8/20/2019 Alan Monroe, Alan D. Monroe-Essentials of Political Research (2000)
http://slidepdf.com/reader/full/alan-monroe-alan-d-monroe-essentials-of-political-research-2000 145/214
N O T E :
Larger tables including bigl~er robability levels and more de-
grecs of frccdarn
rnay
bc found
in
marly comprehensive statistics texts,
SOURCE: Ronald
A.
Fisher and Frank Yates, Statistical Fables for Rio-
iogical, Agricultural, and Medical Research, Sixth Edition
(Editl-
kurg1.t: <>Liver and
Uoyct,
1%63), p.47.
@l<.A,
Fisher and
F,
Yates,
Reprinted by pcrrnissiorl of karson Edueadon, X~tmited.
Box
8.4
summarizes inform at ion ab ou t chi-sqrrare and pro-
vides anotl-rer exam ple of its co m pu tatio n. Ad ditional exam ples
rnay he fu un d in Exercises
A
and
B
a t the end of the chapter,
AdditiarzaX Correlations for Nominal Variables
A s inentioned earlier,
phi (@l
s another cor re la t ion for no~ninal
da ta. Phi assuxnes tlzat both variab les are nom inal, so it can be used
with
any
contingency table. The range of possible values for phi is
O t o 1
for
tables up to
2
x 2 (see the com inent
in
col~t lec t io l~ith
Cramer's V below). The interpretarioa tor pl-ri is that its squared
value (p hi2) s equal t o the proportion
of
variance i~z ne vilrinble
e z p l a i ~ t ~ dy
the
otl?er,
a csncept that
is
explained
in
Chapter
13,
In-
deed, for a
2
x
2
table, phi
has
the same value as th e interval cor-
relation Pearson"
r
(if one treated each dich otom ous variable
as
in-
terval. an d assigned num bers t o the categories).
Plzi
i s
symmetric;
it
makes
no
difference which variable i s independent o r dependen t,
Phi can be com puted in a num ber of
ways,
but the following sim-
pie
formula
may he used i f chi-square has already been co~nyuted:
where
W
i s the total nrlrnber of cases
in
the table.
Recalling
that the
maximum possible value of cbi-quare i s N, note that phi2 is the
ra tio of the actua l value of chi-square to the value it would have if
there were a perfect relationship between the tw o variables.
N ote tha t the formula calculates phiL (th e squared value of phi).
On e can rake the square root t o obtain phi. However, p h i q s often
reported, since
it
is equal to the proportion
of
variance expia he d.

8/20/2019 Alan Monroe, Alan D. Monroe-Essentials of Political Research (2000)
http://slidepdf.com/reader/full/alan-monroe-alan-d-monroe-essentials-of-political-research-2000 146/214
BOX
8.4 Information About Chi-Square
and
an
Example of
Its
Computation
Statistic: Cbi-squxe
( x2 f
Type:
Significance test
Assumptians:
Two nominal
variables; random sarnpling
Range:
Q
to
N,
where
N
is the
total
numher of cases
Formula:
where:
fo
= observed (actu al) frequency
for
each cell
fe =
expected
frequency for
each
cell
Nore:
Ghi-square
must
he computed from raw frequencies,
not
f r t m
a table
expressed
in terms
of percentages.
Example:
Form
of city governm ent and crime rate
Form of City Government
Strong
C0~4nc1'1
Mayor Manager C017.ir17.irissi0~
(TotaEs)
CRIME
RATE High 7 3 9
(19)
Medizam
2
4 6 (12)
Low S 8 I (14)
(Totals)
(14) (15)
(16)
(45)
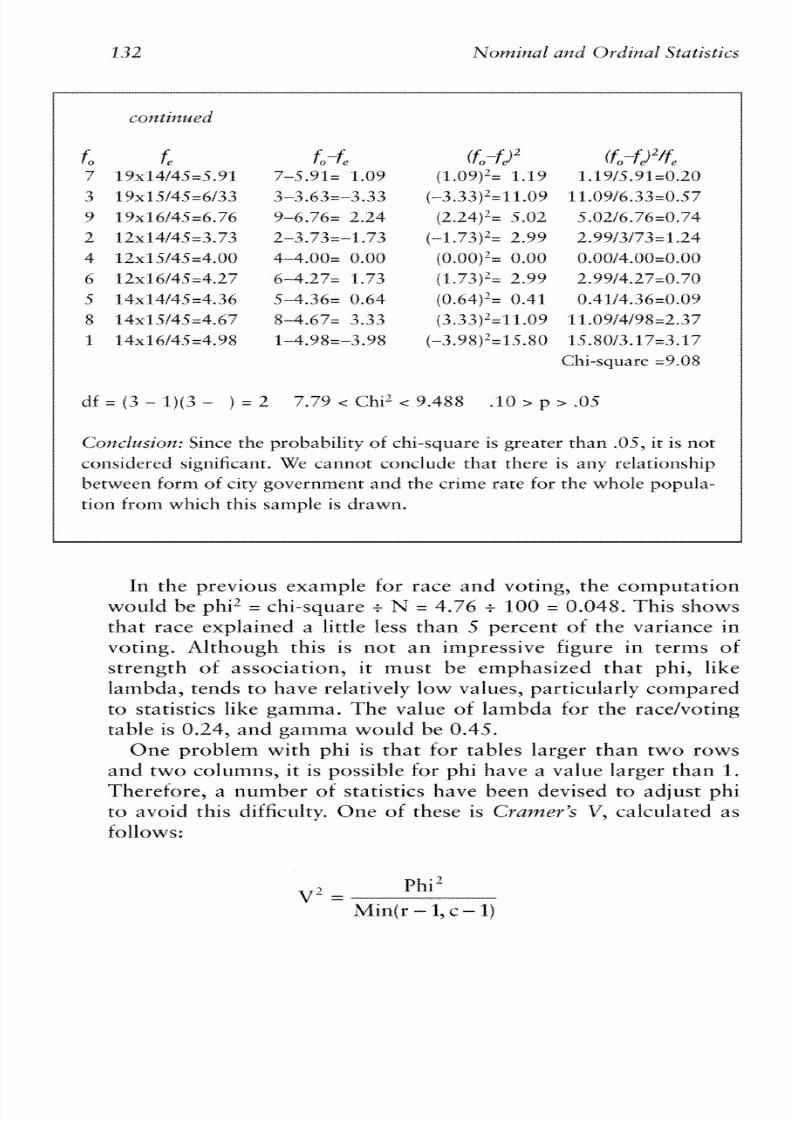
8/20/2019 Alan Monroe, Alan D. Monroe-Essentials of Political Research (2000)
http://slidepdf.com/reader/full/alan-monroe-alan-d-monroe-essentials-of-political-research-2000 147/214
7 19~14/4S=5.91 7-.5.91= 1.09
(l.09f2=1.19 l.19/5,91=0.20
3 19x15/45=1;/33 3-3.63~-3.33 (-3.33)'=ll.f113 1 t .f15316.33=0.57
9 1 9 ~6145~6.Z 9-6.76~ 2.24 f2,24)'= 5-02 5*02/6.76=0.74
2 16?~14/4.5=3.73 2-3.73~-1.73
(-1.73)'= 2.99 2,94)f3/73=1.24
4 12x15/45=4.00 44.00= 0.00
(O.OO)'= 0.00 0,00/4.00=0.00
6 12x 6/45=4.27
6--4,2"7
f -73
f
2.73)" 22.9 2.99/4.27=0.70
S 14~1414.5-4.36 S-4,36= 0.64 (0.64)" 0.41 0.41/4.36=0.09
8 14~15/45=4.6";74.6"7" 3.33 (3,33)'=ll.f153 1 t.f15314/98=2.37
f 14x16/45=4.915 f 4,915;;-3.915 f-3.98)'=15.80 15.80/3. 73. f 7
df
= (3 - l ) f S- ) = 2 7.79
<
Chi2
9.488
. l0 > p > .05
Conclz~siorz: ince the probability of chi-square is greater than .OS, it is not
considerect significant, Wc cannot conclude that thcrc
is
any relationsfiip
bctwecn form
of
city gavcrrlrncnt and t h c crime rare
for
thc urholc popula-
tion Eroi1-t
which
this sail-tple
is
drawn.
Jn the previous exampIe
for
race and voting, the computation
w w l d be phiL
=
chi-square
t
N
=
4.76
c
100
=
0,048.
'This shows
that race explained a little less
tl-ran
5
percent of the variance in
voting. Although this is not an impressive figure in terms
of
strength
of
association,
it-
must be emphasized that phi,
like
lambda,
tends to X-rave relatively low values, particuiarly compared
to statistics like gamma, The value of lambda br the racelvotirtg
table is
0.24,
and
gaiiBma
would be
0.45,
One problem with pl-ri is that far tables larger than two rows
and
two
columns, it is possible
for
phi have
a
value larger than
1,
Therefore, a number
of
statistics have
been
devised to adjust phi
to avoid this difficulty. One of these is
Criamer"sV,
calculated as
fc11Lows:

8/20/2019 Alan Monroe, Alan D. Monroe-Essentials of Political Research (2000)
http://slidepdf.com/reader/full/alan-monroe-alan-d-monroe-essentials-of-political-research-2000 148/214
where Min(r - l , c - I f means the number of rows minus one or
the number af c o l ~ l m n sminus one, whicl-rever is less, In the
racelvoting example (a
2 x 2
table), r
- ;
and
c -
1 are both equal
to 1, so V
=
phi, and this computation is unnecessary
Box 8.5 summarizes the information about Phi and ayplies it to
the example horn Box 8.4,
Interpreting Contingency
Tables
Using Statistics
As stated earlier, statistics are a tool far helping us interpret our
da ta . Bivariate statistics, such as those presellted in this chapter, tell
us something
about
relationships.
But
what different statistics teII
us can be confusing.
measures of
associat ion
or
corre la t ions (such as lambda,
gamma, and phi) tell us something about the strength of: a rela-
tionship. But w ha t is considered to be
a
""strong" assoc iation an d
w ha t is a "Mienk" association? There is no simple answ er t o th at
question. Although some au tho rs have suggested ranges, such as
defining a gamma value
af
-7 o r greater
a s
""very strong," d-rese
ranges are arbitrary. Furthermore, there
would
have t o be differ-
ent fists for every statistic, Although the statistics have varying
mathernatictll interprettltions, clre best approach for the novice is
to th ink
of
them as
relative
measures
of
strength.
This can
he
useful
if
one is comparing several relationships between similar
pairs of variables, such as the co rre lat ion between tl-re att itude
af
individuals
on
the ab or tion issue an d their votes
in
several presi-
dential elections, thu s facilitating a decision as to wh ic hr el at io n-
ship was the strongest. But it is important to rernernber to make
direct compari;aclns
only
of
he
same statistical
measure.
Com-
p a r in g a g amma v alu e w i th a la mb da v alu e, fo r e x a ~ ~ p l e ,s
highly likely to be misleading,
When using ordinal statistics, such as gamma, it is very impor-
tant to be aware that the order in which the categories q p e a d n
the rows and columns will determine wlletl-rer tl-re value is positive
or
negative, which shows the direction of the relationship.
All
of
the examples in this chap ter have the hhighest values
of ordinal
vari-
ables in the t a p row and the eft coluxnn, thus ensuring that
a
pas-
itive reiationship will produce a positive value h r gamma.
But
ta-
bles are
not
always set up th at wait., particutarly when produced by
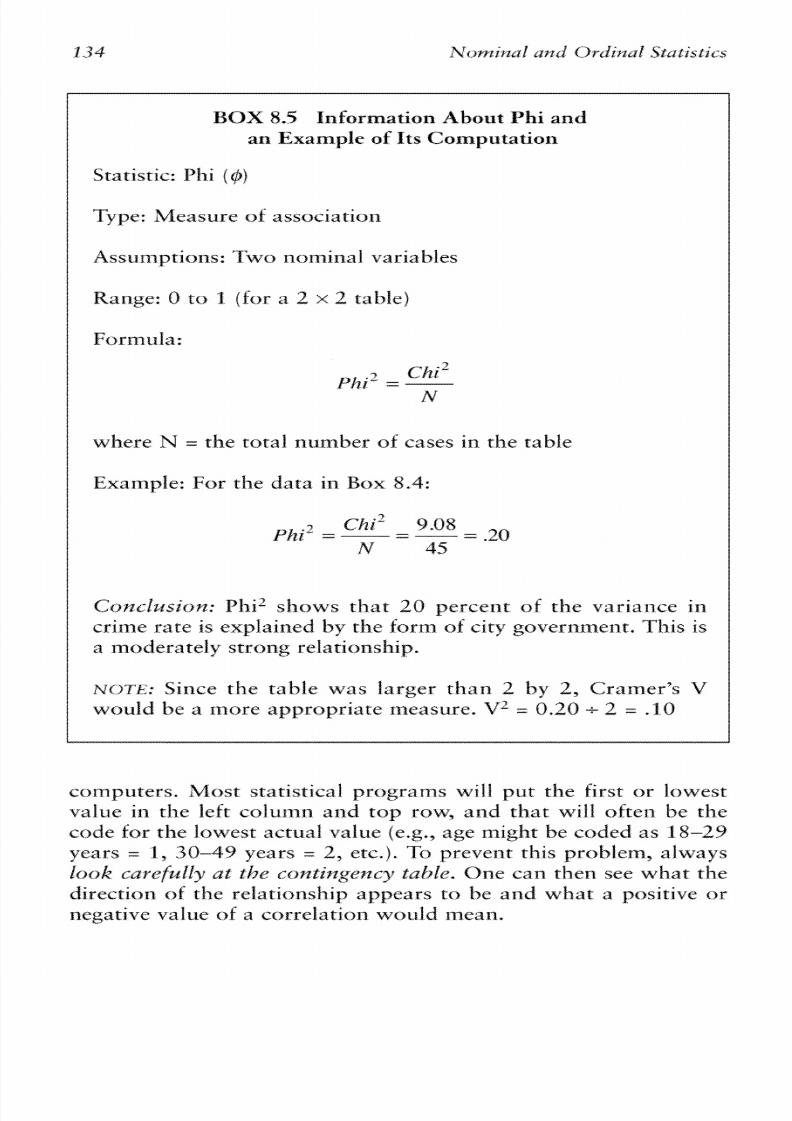
8/20/2019 Alan Monroe, Alan D. Monroe-Essentials of Political Research (2000)
http://slidepdf.com/reader/full/alan-monroe-alan-d-monroe-essentials-of-political-research-2000 149/214
BOX 8.5 Inhrmation About Phi and
an
Example
o f
Its
Computation
Statistic:
Phi
(@)
Type: Measure of association
Assumptions:
Two
nominal variables
Range:
Q
to
1
( fo r a
2
x
2
table)
where
N
=.
the total number of cases in the table
Example: For the data in
Box 8.4:
Conclzasiun:
PhiQshows that
20
percent of the variance in
crime rate
i s
exptained
by
the
form
of
c i t y
gaverrtnnent. This
i s
a moderalely strong relationship,
NOTE: Since the table was larger than
2
by
2,
Cramer's
V
would be a more appropriate measure.
V
0.20 +
2
= .10
coxnputers. Most statistical programs will put the first or lowest
value in the left column and top row, and that will often be the
code for the Lowest actual value (e.g., age might be coded as
18-29
years =
1 , 30-49
years =
2 ,
etc.).
To
prevent this problem, always
look cczrefully a t h e c o n t % ~ g e n c yEtlee
One c m then see what the
direction of the relationship appears to be and what a positive or
rlegative value
of
a correlatio~lwould rBean.

8/20/2019 Alan Monroe, Alan D. Monroe-Essentials of Political Research (2000)
http://slidepdf.com/reader/full/alan-monroe-alan-d-monroe-essentials-of-political-research-2000 150/214
Exercises
Exer~;.z;.e
Using the data
o n
educatiorz and ideology
in
the following table,
comple te itexns
1-1Q.
EDUCATION
H,S.
Some
Circzdc
C:ollege Grad H,S. School
IDEOLOGY
L i b c r ~ l
SO 60
20 10
Consemt ive 20
60 30
24)
I. Present the table in terms
of
percentages, using proper Eom,
2.
Is it appropriate t o com pute lambda for these da ta?
Why or
why
nu t ?
3.
If a pprop riate, compute lambda.
4. Is it appropriate to coiByute garr.lma for these dat a? Why
or
why no t ?
S. If appro priate, com pute gam m a,
6.
What assumptions
would
have to he made to use chi-square
as
a
test of significance for tl-rese da ta ?
7 .
Compute chi-square and determine its
probability.
Is this
sigtzificaxzt?
8.
Is
i t approp ria te to com pute phi for these d at a? Would
Cramer"
V
be
a
better measure?
9. if
appropriate, compute
phi.
10, On
the basis of
all af
these computations, dra w
a
conclusion
about the relationship.
Usirtg the data o n incsm e and vote
in
the following table, csmplete
items
1-3
0
from Exercise
A.
INCOME
Over $2.5,000-
Urzder
$50,00
50,000 $25,0011
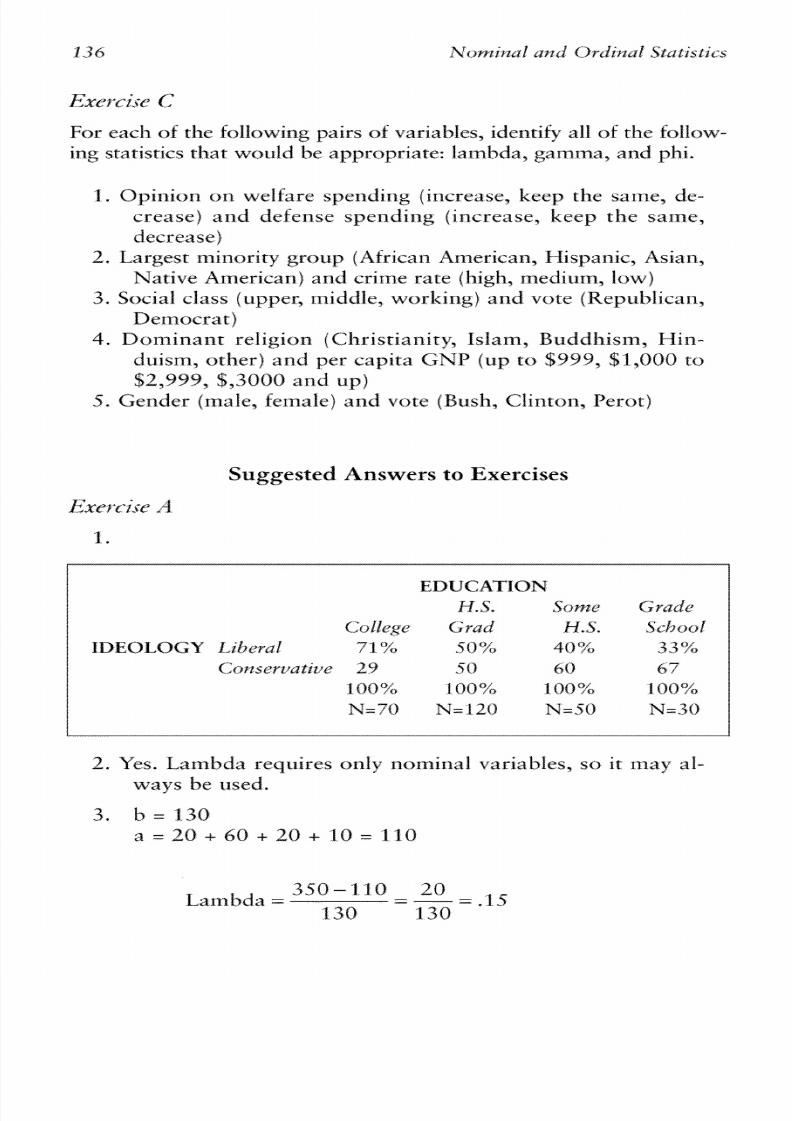
8/20/2019 Alan Monroe, Alan D. Monroe-Essentials of Political Research (2000)
http://slidepdf.com/reader/full/alan-monroe-alan-d-monroe-essentials-of-political-research-2000 151/214
For each
of
the following pairs
of
variables, identily all of the foifuw-
ing
statistics that would be appropriate: lambda, gamma, and phi.
I , Opinion on welfare spending (increase, keep the same, de-
crea se) an d defense spending (increase, keep the same,
decrease)
2 ,
Largest minority
group
(African American,
Hispanic,
Asian,
Native American) and
crime
rate (high, medirtm, low )
3 ,
Social
class (upper, middle, work ing) an d vote (Republican,
Democrat
)
4. Dominant religion (Christianity, Isiam, Buddhism, Win-
duism, oth er) an d per capita
GNP
(u p
to
$999,
$1,000 to
$2,999, $,3000 and u p )
S.
Gender (ma le, female) aild vote (Bush, Ciintr>n,Perotf
Suggested Answers to Exercises
EDUCAmQN
H.S, Some
Grade
CoElege
Grad H.S. School
IDEOLOGY Liberal 71% 50% 40% 33%
(Jonscrva$ive 29
50
60 67
100% 100% 100% 100%
N=70 N=120 N=50 N=30
2 , Yes.
Lambda requires oilly llorninal variables,
so it
may al-
ways be used,
Lambda
.=
350-110
20
----
=
-1.5
130 130
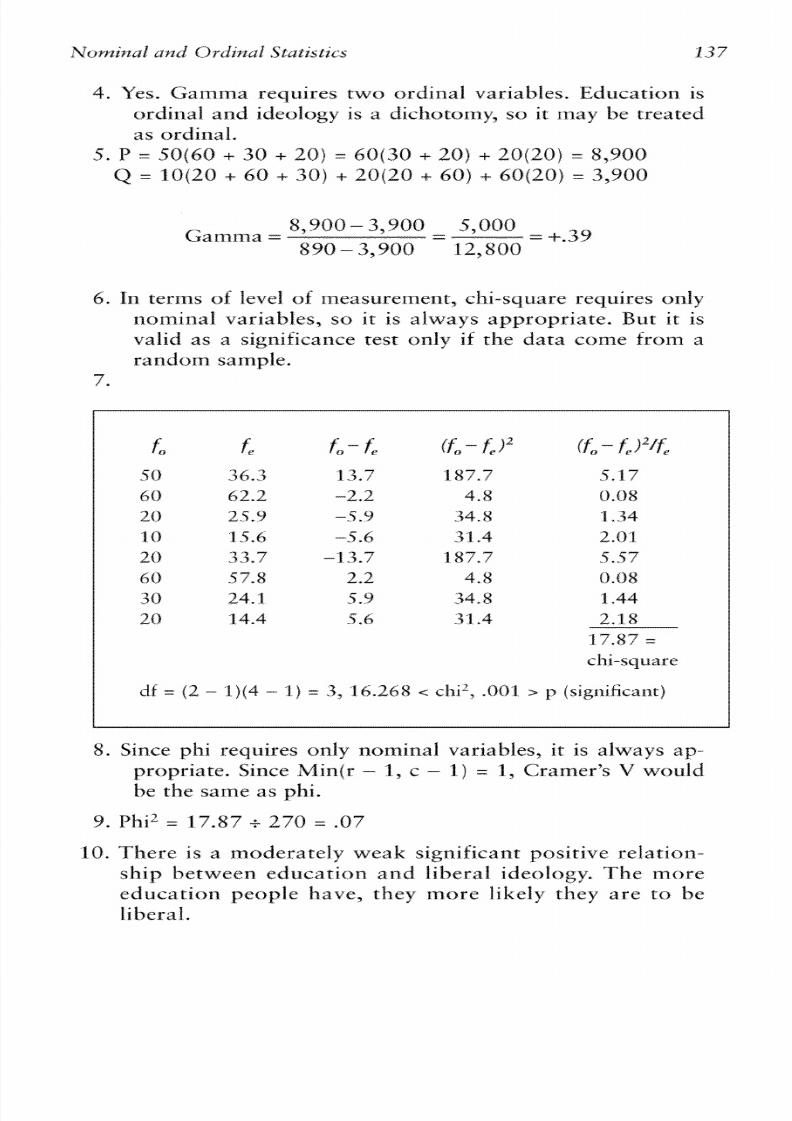
8/20/2019 Alan Monroe, Alan D. Monroe-Essentials of Political Research (2000)
http://slidepdf.com/reader/full/alan-monroe-alan-d-monroe-essentials-of-political-research-2000 152/214
4,
Yes. Gamma requires two ordinal variables, Education
is
ord inal and ideology is
a
dichotoxny, so it may
be
treated
as ordinal.
S.
P
=
50f60+ 30 C 20) = 40(30 C 20) + 20(2Q) 8,900
Q = 10(20 + 60 + 30)
C
20f20 + 60)
C
60f20)= 3,900
6.
In
terms
of
level
of
rReasurement, chi-square requi""son1y
nominal variables, so it is always appropriate, But- i t is
valid
a s
a significance test
only if
the data come from a
random sample.
'7.
L - f ,
g-f, i2
dF
=r
( 2
- ) f 4- 1)=
3, 16.2613
<
chi2,
.OO1
>
p
(significant)
8. Since phi requires only nominal variables, it is always ap-
propriate,
Since
Min(r
- 1, c - 1 )
=
1,
Cramer"
V would
be the same as phi.
10,
Tlzere is a
moderately
weak significant positive relation-
ship between education and l iberal ideology,
The
more
educat ion people
have,
they more
likely they
a re t o
be
liberal.

8/20/2019 Alan Monroe, Alan D. Monroe-Essentials of Political Research (2000)
http://slidepdf.com/reader/full/alan-monroe-alan-d-monroe-essentials-of-political-research-2000 153/214
Exet-6.i~
1.
Income
2. Yes, Lambda requires only nom inal variables, s o it may
a i -
ways
he used.
3,
h = 4 9 + 4 9 + 1 9 = 1 1 7
a = 11 c 9 c 1 7c 1 9 + 2 3 e 7 + 8 + 5 c 3 = 112
Lambda =
17-112.
S
=- =
.04
117 127
4, No.
Gam ma requires tw o o rdinal va riables, Altl-rough in-
come
is ordinal, vote is nominal
and
no t a dichotomy.
S. Not applicable,
Q,
In terms of level of measurexnent, ch i-sq ut~ re equires oniy
llominal variables, so it always appropr iate, But it is valid
as a significance
test
m l y
i f the data come from
a random
sample.

8/20/2019 Alan Monroe, Alan D. Monroe-Essentials of Political Research (2000)
http://slidepdf.com/reader/full/alan-monroe-alan-d-monroe-essentials-of-political-research-2000 154/214
Nominal and Ordinal Statistics
fo
f
&-C
fo
-
J2
fo J2/f,
22 15.9 6.1 37.21 2.34
19 19.9 -0.9 0.81 0.04
8 13.2 -5.2 27.04 2.05
11 15.9 -4.9
24.01 1.51
23 19.9 3.1 9.61 0.48
15 13.2
1.8 3.24 0.25
9 6.2
2.8 7.84 1.26
7 7.7 -0.7
0.49 0.06
3 5.1 -2.1
4.41 0.86
17 21.1
-4.1
16.81 0.80
25 26.4 -1.4 1.96
0.07
23 17.5 5.5 30.25 1.73
10.19 =
chi-square
df
=
(3
-
1)(4
- 1)=
6, 8.588 c chi-square c 10.645,
.20 c p c . l0 (not significant)
8. Since phi requires only nominal variables, it is always ap-
propriate. Since Min(r
-
1, c -
1)=
2, Cramer's V would
be
a better measure.
9.
Phi2
=
10.19 + 182 = .06
V
= .06
=
.03
10. There is a weak relationship that is not significant. For the
sample data, there is a tendency for people with higher in-
comes to be more likely to vote for Dole and Perot, and the
lower people's income, the m ore likely they are to vote for
Clinton o r to be nonvoters.

8/20/2019 Alan Monroe, Alan D. Monroe-Essentials of Political Research (2000)
http://slidepdf.com/reader/full/alan-monroe-alan-d-monroe-essentials-of-political-research-2000 155/214

8/20/2019 Alan Monroe, Alan D. Monroe-Essentials of Political Research (2000)
http://slidepdf.com/reader/full/alan-monroe-alan-d-monroe-essentials-of-political-research-2000 156/214
Interval Statistics
In this chapter we will fook at statistics that evaluate the relation-
ship between two interval varialzles. These statistics are derived
from a procedure called regresszon; they and their multivariate ex-
tensions fcr>vered n Chapter
10)
are by far the mc-1st commonly
used statistics in contemporary poliricaf scietice research.
The
Regression
Line
The idea of regressir~ils best illustrated with the use of scattergrams,
which were introduced in Chapter
6, The
examples
of
""perfect" re-
lationships shown there were instances
in
which
all of
the points rep-
resenting the cases fell along single strai&t lines.
If
all relationships
between variables
we= perfect
in
that way-that is, perfecrly corre-
lated-we wr~uldnot need many statistics. But in the imperfect
world of the social sciences, mast relationships are far from perfect,
and
even careful visual inspection
of a
scattergram will tell us only so
much about the
relationship between the variables plotted.
The key idea of regessian i s that there is a single, b6best-fitting,'a
Iir-re that describes the relationship betweet1 the variables better than
any other line would, Let us assume, for now, that this fine is a
scraight one. Regression statistics define this as the least-sqgnrrrs line,
that is, if
we he
171.easur.e the distance of each
case
from tha t line
and
sq~lare
ach ualzdc, the@ he total wzll
be
less thart w ha t th e mt al
wogM be f i ~ ran),o t t~ er e , Fortunately, we do not have to du this
with a rulier; there are formulas to determine the exact locatictil of
the Iine and
a
measure
of
how
good
a
fit
the line
is
to the points.

8/20/2019 Alan Monroe, Alan D. Monroe-Essentials of Political Research (2000)
http://slidepdf.com/reader/full/alan-monroe-alan-d-monroe-essentials-of-political-research-2000 157/214
Any straight line can be completeiy described by two facts: the
10
cation of a single point through which it passes and the slope
or
angle at which it rises
or
falls,
The
equaticrn fa r
a
straight line may
be written as Y = a
+
bX, where Y is the dependent variable, X is the
independent variable, a is the height of the line where it crosses the
y-axis, and h is the slope, Box 9.1 shows an example of a scatter-
gram with the feast-squares fine.
T e
quation
for
the line is
Y = 0.7
+
1.l)(;, his rneans that the line crosses the y-axis at a height
of 0.7
and
goes
up by
1.1
for every increase of 1 unit
in
X,
How did we determine the values of a an d b? There are formulas
for each, Th e value
of
b, the slope,
is
cafcnlated
as
follows:
where X and Y are values of the independent and dependent vari-
ahles an d N is the n u ~ ~ b e rf cases,
Sigma
(C)9 he stlmmation sign,
indicates tha t on e rnust add up the value
for
all cases, N ate th at
ZXV
is nof the same as
/GX)JZU).
GXY means tha t one must first multiply
the value
of
X by the value
of 3'
for each case and then add
up
these
producrs for all cases,
(EX)JI;Y)
means that one first adds up the
miginal values of X and
Y
and then multiplies the
products,
Sirni-
Iarly, Z X q s different from (XX)L.
To calculate b, a, and PearsonS r (discussed below), we need to
find the value
of
five sums: those
of
the original values of X (i.e.,
E X )
and
3'
(i.e.,
EY),
those
of
the squared values of each variable (i.e.,
ZXband
ET2),
and tlnat of the product
oi
X times Y (i.e.,
CXY). W
also use
N,
the number of cases, It is useful to set up a table like the
one belou., which uses the data for the scattergram in
Box
9,1 to i t -
lustrate the procedure.
STEP 1
X Y
1 2
2
3
3 3
4 6
5 6
Sums: L S20
STEP
2
STEP
3
X 2 Y2
I 4
4
9
9
9
16 36
25 36
55
94
STEP 4
XV
2
Q
9
24
30
71
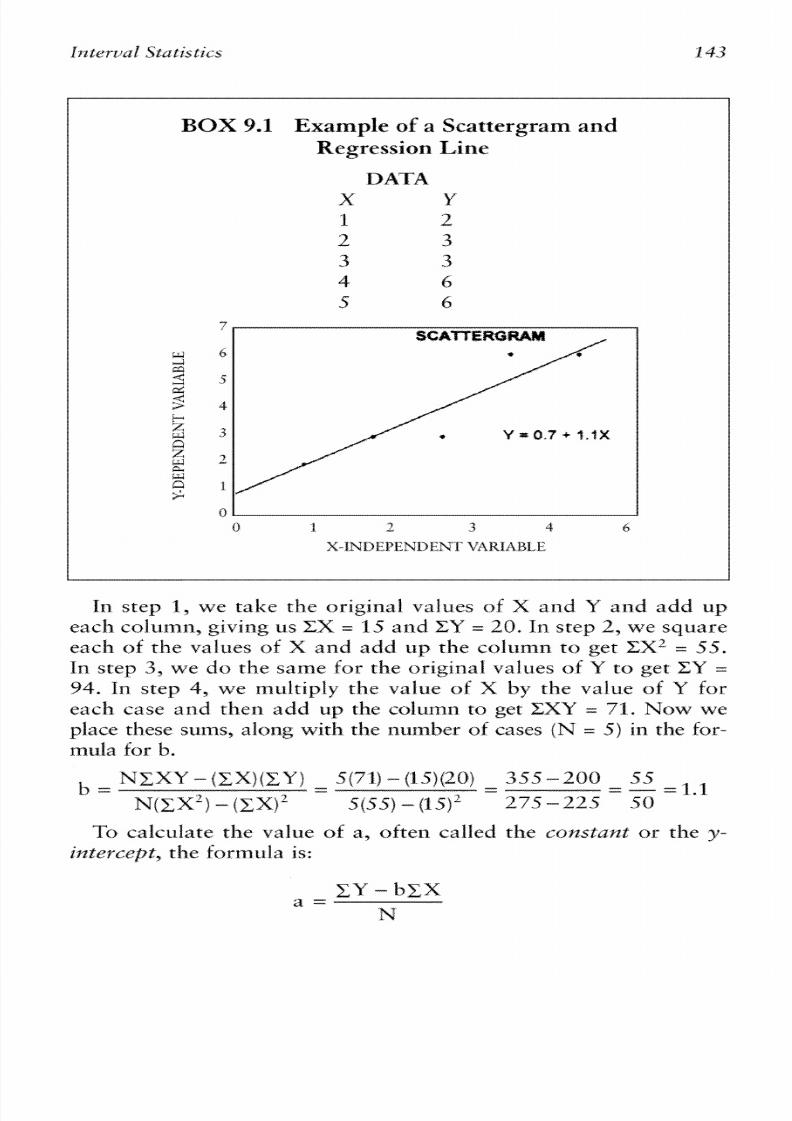
8/20/2019 Alan Monroe, Alan D. Monroe-Essentials of Political Research (2000)
http://slidepdf.com/reader/full/alan-monroe-alan-d-monroe-essentials-of-political-research-2000 158/214
BOX 9.1
Example
o f
a
Scattergram and
Regression
Line
In
step 1,
we
take the original values
of X
and
V
and add
up
each coluxnn, giving us
ZX =
1.5 and
ZV =
20,
In
step 2,
we
square
each of
the
values
of
X
and add
up the column to get
Z X L 5.5.
In
step 3, we do the same for the orig inal values
of
to get Cl =
94, In
step
4,
we
multiply the value of X by the value of: Y for
each case
and
then
add
up the
column
to
get
EXU = 73,
Now
we
place these sums,
along
with the
number
of
cases
( N
=
5)
in
the fur-
rnula
for b.
To calculate the value of a, often called the corzstanf or the y-
intercept, the formula
is:

8/20/2019 Alan Monroe, Alan D. Monroe-Essentials of Political Research (2000)
http://slidepdf.com/reader/full/alan-monroe-alan-d-monroe-essentials-of-political-research-2000 159/214
Thus, using the figures for this example, we have:
Another example of these computatic->ils s show il in
Box
9.2.
The sl t~ p e f the l ine,
b,
gives us a very important piece
of
in-
formation. T h e s lope is
a
direct measure of
the
effect of th e
ipzde-
pendent
variable
on
the dependent variable.
And whether it has a
plus or a m inus sign tells us wheth er the re lationship is positive o r
negative. However,
it
has the disadvantage
of
being
highly
Jetpen-
den t o n the un its in which tl-re variables a re measured. Age ca n be
measured is days and moilths as well as years; income in dollars,
thousands
of
dollars, other currencies, artd so
on, Making
a
dif-
ferent choice of units could drastically affect the value of b. For
that reason, it is comm on t o compute a standardized version
of
the
slope called
beta,
a measure that will be discussed in Chapter 10.
Although the slope of the line is important, it does not give us a
measure
of
strength
of
association in the way that other measwes
such as gamma and
phi
do. For that we use
a
statistic called tlse
Pearson product-moment correlatz'on, o r Pearson's r, (It is so
widely used that it is ofren reported simply as '"r,"and reh ren ces
only to a ""correlation" probabfy refer to it
as ts ei1.j
Pearson" r assumes tha t there ar e
t w o interval variables,
Its
range is from
-1
to
+ l ,
t is a measure
of
association, that is,
of
the
strelsgth of the relatiorzship. Essentially, it measures how closely the
case points cluster around the regression line. In this sense, it is a
measure of
hr>w
good a predictor one variable is
of
the other, As
was the case with
Phi"
rr
i s
isqgal t o the pmporciorz of vurinnce
in
one varlialale explained b y the other.
This idea
of
""explained variance" is a crucial one in statis tica l
theory.
If
we knew no thing ab ou t any othe r variables, then the best
predictor of the value of every case of Y, the dependent variable,
would
be
the mean value
of
Y, For example, in Box
9.1,
picture a
horizontal line across the scattergram at the height
of
the trtean,
which in this example
is 4
(computect by adding up the values of
V
and dividing
by Nj,
he total variance in
U
would be the sum
of
the
sq~ zare d eviations
of
the actual cases from this rrtean line. To the

8/20/2019 Alan Monroe, Alan D. Monroe-Essentials of Political Research (2000)
http://slidepdf.com/reader/full/alan-monroe-alan-d-monroe-essentials-of-political-research-2000 160/214
BOX 9.2 Example of Regression and
Com putations of
b
and a
% %
URBAN TURNOUT
X
Y
X2 Y2 XY
0 80 0 6,400
0
100 30 10,000 900 3,000
90 50
8,100 2,500 4,500
20 70 400 4,900 1,400
50 60
2,500
3,600 3,000
30 40
900 1,600 1,200
40 50
1,600
2,500 2,000
70
50
4,900 2,500
3,500
60 30 3,600 900 1,800
40
40 1,600 1,600 1,600
SUMS:
500 500 33,600 27,400 22,000
90
80
W
70
Y
=
67 5 .35X
9
r: 60
t
50
C
40 •
.
I
0
30
E
.
F:
20
10
0 ,
0 20 40 h0 80 100 120
Percent Urban
b =
N CXY -( CX )(CY - 10(22,000)- 500)(500)
-
N CX (CX)L 10(33,600) (SO0)'
-
220,000 - 250,000 - -30,000
-
-
35
336,000 - 250,000 86,000
X
Y
- bX
X
500
-
-.35)(500) 500
+
175 675 W
67.5
a =
- -
-
N 10 10 10
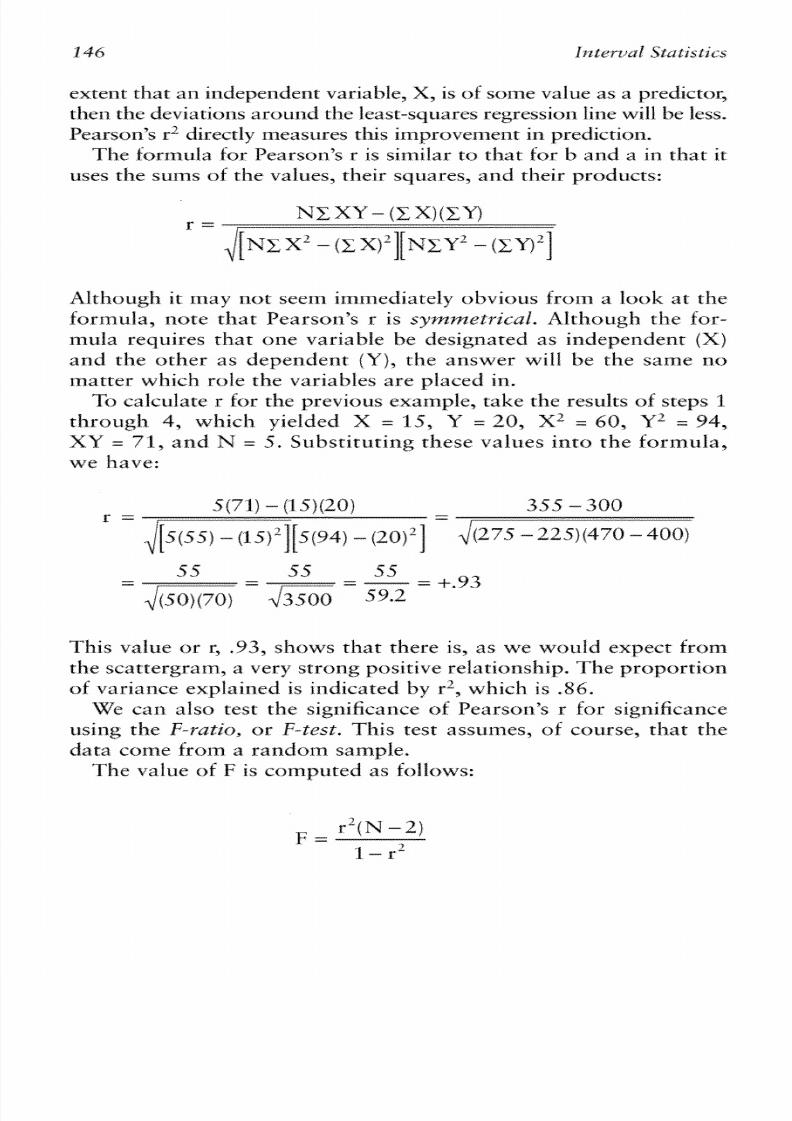
8/20/2019 Alan Monroe, Alan D. Monroe-Essentials of Political Research (2000)
http://slidepdf.com/reader/full/alan-monroe-alan-d-monroe-essentials-of-political-research-2000 161/214
extretlt that an independent variable,
X,
is
of
some value as a predictor,
tlzen the deviations arou nd tlze least-squares regression fine will he less,
Pearson's r2 directly m easures this improvem ent in prediction.
The formula for Pearson's s
i s
similar to that for b and a in that it
uses the sums of the values, tlzeir squares, an d tlzeir products:
Although
it
may not seem immediately obvious
from
a look a t the
lorm uia, note tha t Pearson" r is symmetrical. Although the lor-
muia requires that one variable be designated as
independent
X )
and the other as dependent (V) , the answer will he the same no
m atter wlzich role the variables a re placed
in,
To
calculate r for the previous example, take the results of steps 1
through 4, which yielded X =
IS,
V = 20,
X"
660,
V
94,
XU
=:
'71,
a n d N
=
5.
f
ubst i tu t ing these values in t o the form ula,
we have:
This value or r, -93, show s that there is, as we would expect from
the scattesgrarR?a very strong positive relationship, T he prop ortio n
of variance explained is indicated
by
r" which is
.SG.
We
ca n also test the significance of Pearson" r fa r significance
using the
F-mt.io,
o r
F.-test,
This test assumes,
of
course, that the
data come from a randoxn sample.
The value of F is computed as fcsltows:
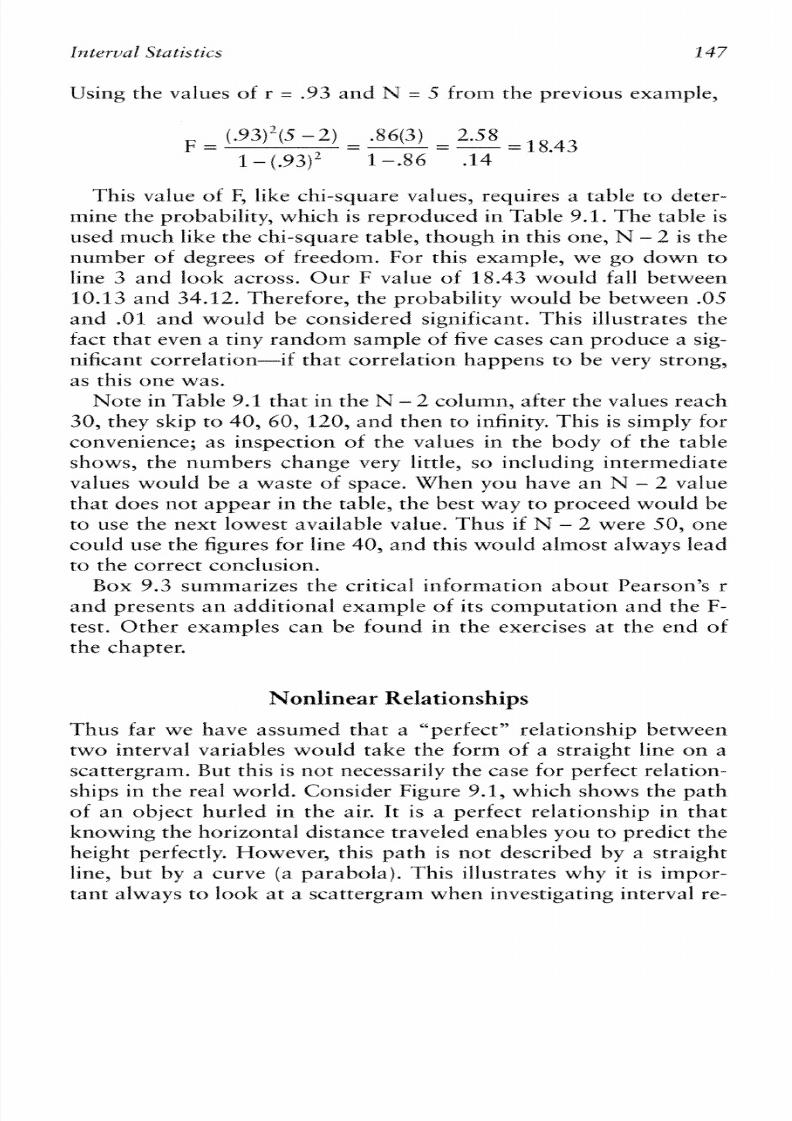
8/20/2019 Alan Monroe, Alan D. Monroe-Essentials of Political Research (2000)
http://slidepdf.com/reader/full/alan-monroe-alan-d-monroe-essentials-of-political-research-2000 162/214
Usirtg the values
of
r = 9 3 and N =
5
from the previous exarrtple,
This value of F, like chi-square values, requires a table t o deter-
mine the prohabilir):, which is reproduced in Table:
9.1.
Th e table is
used much like tl-re chi-square table, thougl-r in th is one, M
-
2 is the
number
of
degrees of freedom. For this example, we go down to
line 3 and look across. Our F value
of
18-43
wt> uld fall between
10.13
an d 34.12. Therefore, the probability would be between
.OS
and .01 and would be considered significant, This illustrates tl-re
fact tha t even a tiny r ando m sample of five cases ca n produce a sig-
rlificant correlation-if that corre lation happens t o be very strong,
as this o ne w as.
Note in Table
9.1
tha t in the N
-
2 colum n, after the values reach
30, they skip to 4O,f;O, 120, and then to ilafinir5i; This is silnyly ftrr
convenience; as inspection of th e values in the body of tl-re tab le
shows, the numbers change very little, so including ir-ztermediate
values would be a waste of space, Wheri you have an N
-
2 value
that does not appear in the table, the best
way
t o proceed would be
to use the next Lowest available value, Thus if N - 2 were
SO,
one
could use the figures for line 40, an d this would alrnost always lead
to the correct conclusion.
Box
9.3
summ arizes the critical infarm ation ab ou t Pearson" r
an d preserlts a n additional ex a~ rtp le f its com puta tion a1-d the F-
test, Other examples can be found in the exercises at the end of
the chapter.
Nonlinear Relationships
Thus far we have assumed tl-rat a ""perfect" relationsl-rip between
tw o interval variables w ould take the fo rm of a straigh t line a n a
sca ttergram , But this
is
no t necessarily the case far perftect relation-
ships in the real world, Consider
Figure
9.1, which show s the path
of m
object hurled
in
the air. It is a perfect relationship in that
know ing the horizon tal disrai-zce traveIed enables you to predict the
height perfectly However, this path is not described by a straight
fine,
but
by a curve
(a
parabola). This illustrates why it is impar-
tant always to look a t a scattergram w hen investigating interval re-
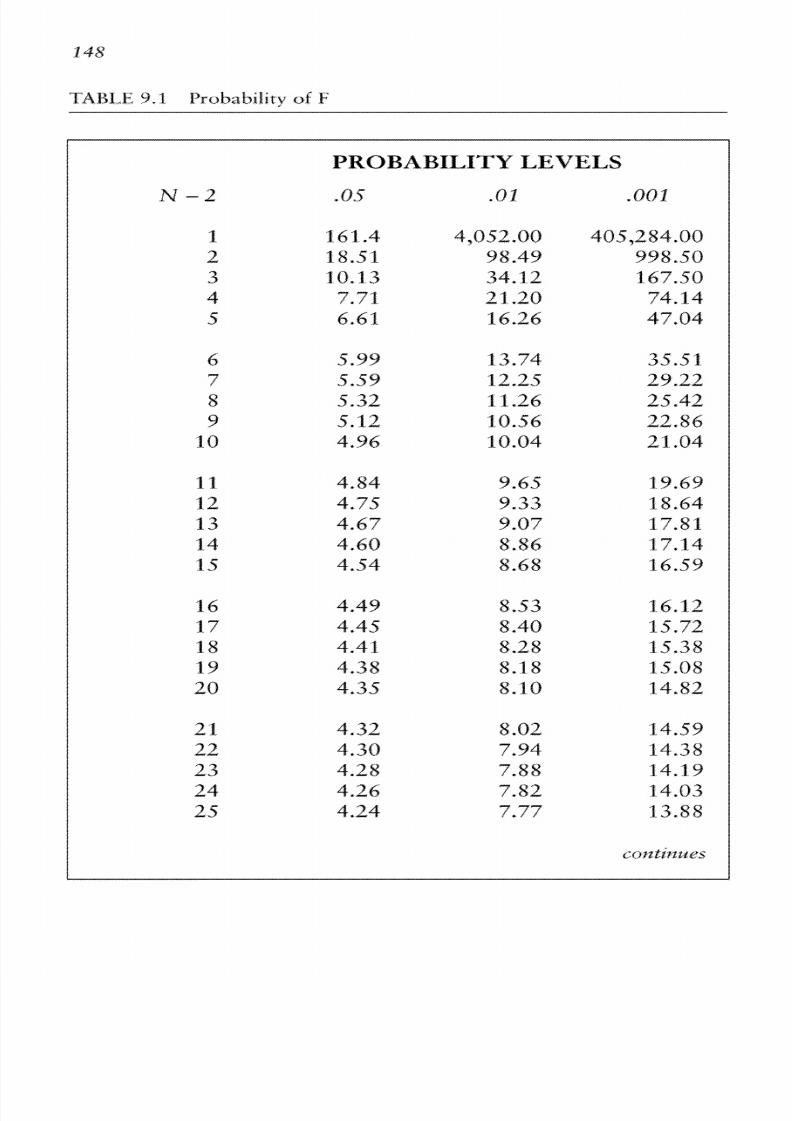
8/20/2019 Alan Monroe, Alan D. Monroe-Essentials of Political Research (2000)
http://slidepdf.com/reader/full/alan-monroe-alan-d-monroe-essentials-of-political-research-2000 163/214
148
TARLE
9.1 Probability of F
PROBABILITY LEVELS
N - 2
.05 .01
.001
1 161.4 4,052.00
405,284.00
2 18.51 98.49 998.50
3 10.13 34.12 167.50
4 7.71 21.20 74.14
5 6.61 16.26 47.04
6 5.99 13.74 35.51
7 5.59 12.25 29.22
8 5.32 11.26 25.42
9 5.12 10.56 22.86
10 4.96 10.04 21.04
11 4.84 9.65
19.69
12 4.75 9.33 18.64
13 4.67 9.07 17.81
14 4.60 8.86 17.14
15 4.54 8.68 16.59
16 4.49 8.53
16.12
17 4.45 8.40 15.72
18 4.41 8.28
15.38
19 4.38 8.1 8 15.08
20 4.35 8.10 14.82
21 4.32 8.02 14.59
22 4.30 7.94 14.38
23 4.28 7.88
14.19
24 4.26 7.82 14.03
25 4.24 7.77 13.88
corrtirfrres

8/20/2019 Alan Monroe, Alan D. Monroe-Essentials of Political Research (2000)
http://slidepdf.com/reader/full/alan-monroe-alan-d-monroe-essentials-of-political-research-2000 164/214
NOX'P.;:
his
table is destgncd for tesrir~g ignificance
whcrc
there
is
only
one
independent variahte. Table
10,1 may
be used
for rn~xftiple
nd
partial
correlations, Larger tables can be hund in many comprel~en-
sivc statistics texts,
SOURCE: Konald A, Fisher and Frank Vater;, Statistical
Tables for
Biu-
logzcal, Agricultural, l a d Medical Research, Sixth Editzon
(Edinburgh:
Clliver and Bayd,
19631, pp.53,
SS,
57,
O
R,
A.,
Fisher and
E
Yates.
Kcprintect
by
permissitjn
of
Pearson Education, l,irnited.
fatianshigs, In a n exam ple like this one, the linear correlation and
regression statistics described
in
the previous section
(h
and r )
would indicate that there was nt-> elationship between height and
distlance.
Viewing
the scattergram could prevent accepting that er-
roneous concIusiotl. A variety of techniques-all beyond the scope
of this hor>k+atl
he
used to analyze nonlinear or curviLinectr rela-
tionships. (T he simplest app roach for this exam ple would
be
to di-
vide the data at the m idpoint
of
the independent variable and ana-
lyze each hall separately with linear regression, which would then
yield a reasonahlp cor rect analysis.) But i f one rlever looked ar the
scaaergram, tlre need for this might never be apparent.

8/20/2019 Alan Monroe, Alan D. Monroe-Essentials of Political Research (2000)
http://slidepdf.com/reader/full/alan-monroe-alan-d-monroe-essentials-of-political-research-2000 165/214
BOX 9.3 Information About
Pearson's r, the F-Test,
and an
Example of ?'heir
Computation
Statistic: 13earsonkr
Type: Measure of association
Assumptions: Two interval variables
Range: -1 to
+ l
Interpretation: 13roportion of variance explained (r 2 )
Formula:
Exaxnple (Continued
from
Box
5 3 2 )
ZX=500 EY=500 CXL33,6;00 CYZ=27,400 EXY=22,000
N = I Q
F-test
Assumptions: Random sampling
Formula: F =
1 - r Z

8/20/2019 Alan Monroe, Alan D. Monroe-Essentials of Political Research (2000)
http://slidepdf.com/reader/full/alan-monroe-alan-d-monroe-essentials-of-political-research-2000 166/214
Example (from above)
532 .r
F .c: 11.26, so .05 p
>
.01 (significant)
Conclusian: There is a strong significant negative relationship
between
%
U r h n a nd Oio Turnout, The more urban an area,
the low er its level of tu rn ou t.
Relationships
Between
Interval and
Nominal
Variables
Th ere are m any instances wl-rere on e may w an t t o evalriate the
relationship between a nc.>minaIor ordina l var iable an d a n in ter-
val variable , q p ic a l l y th is occurs when we a re co ~n pa r ing w o
groups def ined
by
the noxnina l o r o rd ina l var iab le to see
whe the r
they are & &rent a n the in terval variable. VVe might ,
for examp le,
have a
sample of individuals and wish t o de te rmine
wl-rether the dif ference in income between males and females
w as large enoug h t o be considered signif icant. A num ber of sta-
tistical tests could be used tc_t do this, such as the
t-test
a n d dif-
fireace
of
merlgs,
A lt l~ough ignificance te sts a r e the ma in s a -
t istics used f a r the compa risons of groups, a m easure of strength
of association sim ilar t o Pearson" r rai led
eta
is useful. wh ere
there is a passibility that the relationship is curvilinear,
Exercises
Answers t o these exercises foll ow
It is
suggested that you attempt
to cc~m pletehe exercises hefclre lor>kingat the answers.

8/20/2019 Alan Monroe, Alan D. Monroe-Essentials of Political Research (2000)
http://slidepdf.com/reader/full/alan-monroe-alan-d-monroe-essentials-of-political-research-2000 167/214
Distance Tra veled
Using the data in the following table an the relationship between
years of education and nuxnber of times a person voted in the past
f ive
elections,
complete items 2-5.
k a r s of # of Years of # of Years of Jf of
Education Wtes Education Votes Education Votes
1 , Draw a scattergram. What sort of relationship does there
appear to be?
2. Carngute b and a and draw the regression line on
tl-re
scat-
tergram.
3. Compute
Pearson's r.
4.
Conduct
the
F-test and dererrnine the significance.
S. Draw a conc2usioil about the relationship,
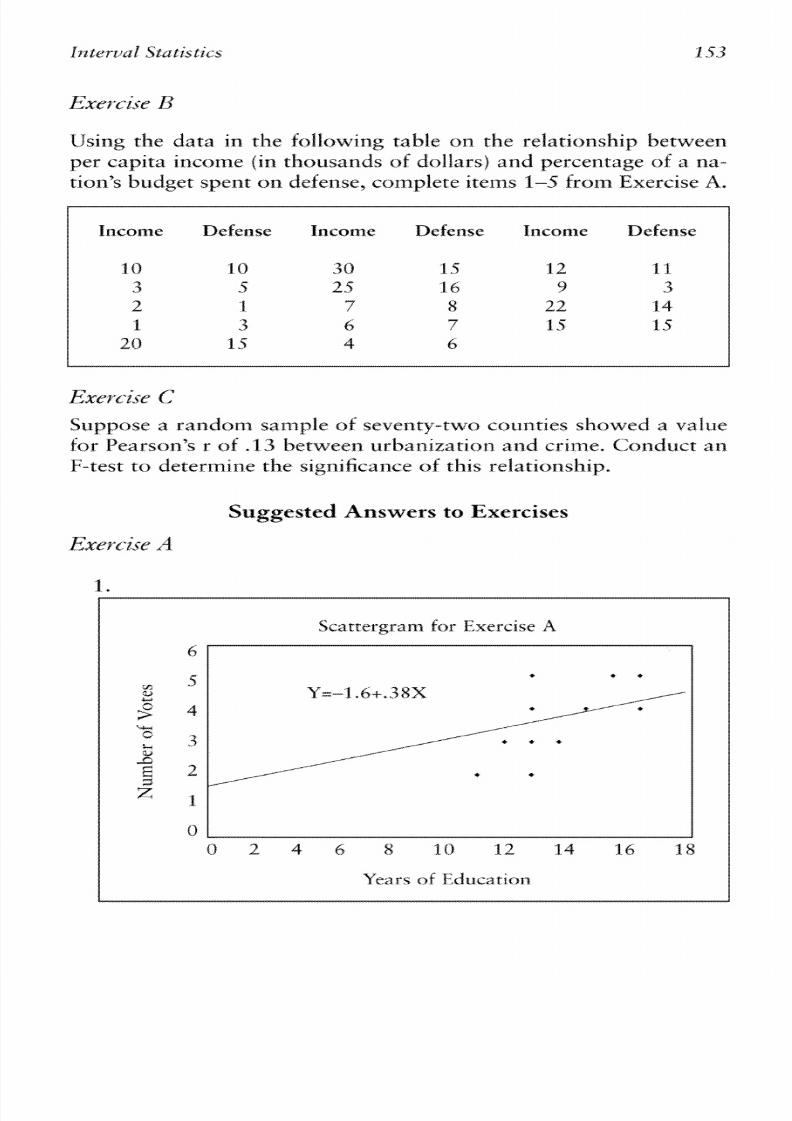
8/20/2019 Alan Monroe, Alan D. Monroe-Essentials of Political Research (2000)
http://slidepdf.com/reader/full/alan-monroe-alan-d-monroe-essentials-of-political-research-2000 168/214
Using tile data
in
the failowing table
o n
the
relationship between
per capita income (in thousands
of
dollars) and percentage
of
a na-
tion%budget spent a n defense, complete items 1-5 korn Exercise A.
Xncarnc Dcfe'ense Income Defmse Income Dcfensc
Suppose
a
random sample
of
seventy-two counties showed
a
value
fo r Pe a rs o r~ '~
of:
.l
3
between urb ar~iza tior~
nd
crime, Con duct
a n
F-test to determine the
significance
of this re'latiartship,
Suggested Answers to Exercises
Scattergram for Exercise
A

8/20/2019 Alan Monroe, Alan D. Monroe-Essentials of Political Research (2000)
http://slidepdf.com/reader/full/alan-monroe-alan-d-monroe-essentials-of-political-research-2000 169/214
lnte rva l Statistics
EDUCATION AND VOTES
X Y X-' Y2 X Y
8 4 64 16 32
9 1 81 1 9
10 0 100 0 0
16 5 256 25 80
15
5 225 25 75
12 3 144 9 36
13 3 169 9 39
12 2 144 4 24
12 4 144 16 48
14 4 196 16 56
16 4 256 16 64
10 2 100 4 20
11 3 121 9 33
12 5 144 25 6
0 144
12 -
0 0
182 45 2,288 175 576 (TOTALS)

8/20/2019 Alan Monroe, Alan D. Monroe-Essentials of Political Research (2000)
http://slidepdf.com/reader/full/alan-monroe-alan-d-monroe-essentials-of-political-research-2000 170/214
4.67 C F C 9.07, so .05 > p > .Q1 (significant )
5.
There
is
a strong
and
significant positive relatiorlship
be-
tween education and frequency
of
voting. The rnore edu-
cation people have,
the
more electioils they tend
to
vote
in.
If
the
data
were
horn,
a
random
sample,
we
could
con-
clude that tl-ris positive relationship occurs
in
tl-re popufa-
tion
from which
the sample was drawn,
Per Capita Income
($1,000~)

8/20/2019 Alan Monroe, Alan D. Monroe-Essentials of Political Research (2000)
http://slidepdf.com/reader/full/alan-monroe-alan-d-monroe-essentials-of-political-research-2000 171/214
156 Interval Statistics
INCOME AND DEFENSE
X Y X2 Y2 XY
10 10 100 100 100
3 5 9
25 15
2
1
4
1
2
1 3
1
9 3
20 15 400 225 300
30 15 900 225 300
25 16 625 256 400
7 8
49 64 56
6 7 36 49 42
4 6
16 36 24
12 11 144 121 132
9 3
8
1
9 27
22 14 484 196 308
15 15
225 225 225
166 129 3,074 1,541 1,934
N =
14
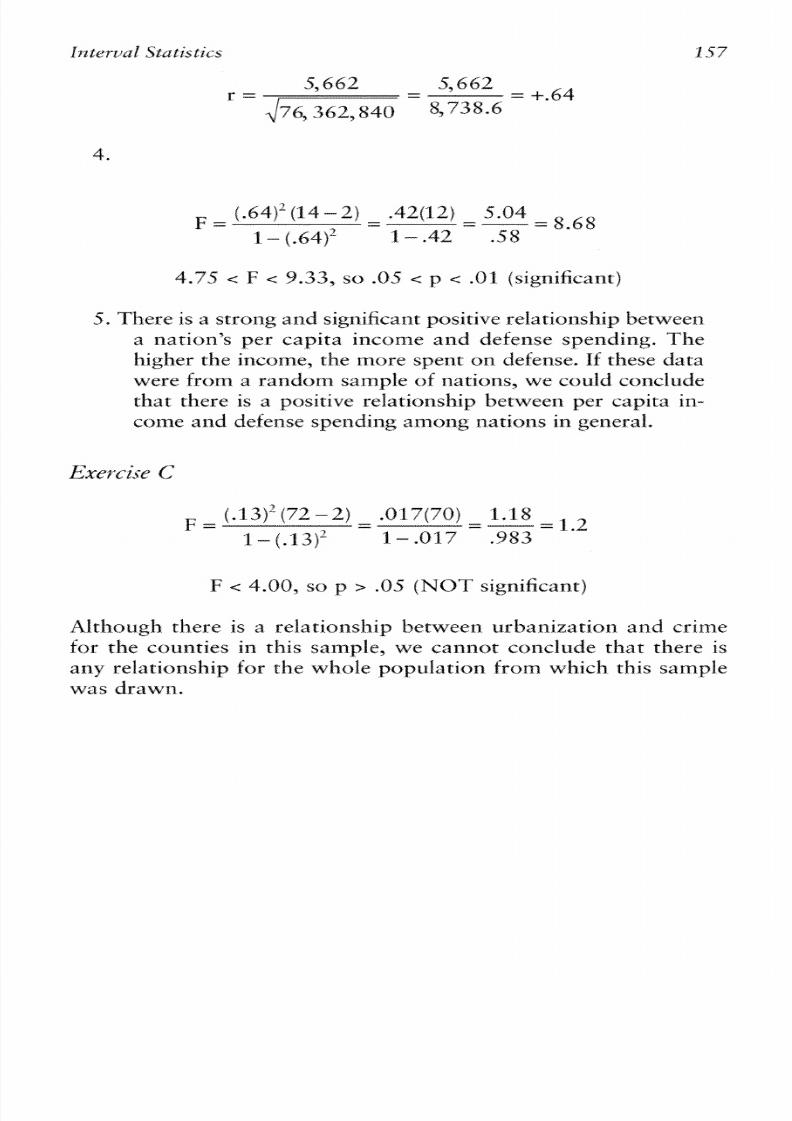
8/20/2019 Alan Monroe, Alan D. Monroe-Essentials of Political Research (2000)
http://slidepdf.com/reader/full/alan-monroe-alan-d-monroe-essentials-of-political-research-2000 172/214
5. There is a scrong and significant positive relationship between
a nation's per capita income an d defense spending. The
higher the inctlt~e,he more spent t ~ n efense. ff these data
were from a random srrxnple of nations, we could conclude
that there is a positive reIatisnship between per capita in-
come and defense spending aERong nations in general.
F
.=
4.00,
so
p
>
.05
(NOT significant)
Although tl-rere is
a
relationship between urbanization and crirne
for the counties in this sample, we cannclt conclude that there is
any relationship for the whole psptllaticzn from which this sample
was drawn.

8/20/2019 Alan Monroe, Alan D. Monroe-Essentials of Political Research (2000)
http://slidepdf.com/reader/full/alan-monroe-alan-d-monroe-essentials-of-political-research-2000 173/214
This page intentionally left blank

8/20/2019 Alan Monroe, Alan D. Monroe-Essentials of Political Research (2000)
http://slidepdf.com/reader/full/alan-monroe-alan-d-monroe-essentials-of-political-research-2000 174/214
tivariate Statistics
This chapter presents techniques for dealing with the analysis
of
the relatioilship between
three or more varidbfes.
Give11 the na ture
of
tine social an d political w orld , w e freq~z etltly ace situ atio ns
where there are several, o r even many, possible causes of som e pl-re-
nomenon. Just think how many different factors might go into an
individual's voting decisit>n, ranging from the party identification
adopted in chi ldhood, to a varie ty of a t t i t~~desnd opinions, to
news b road casts and cam paig n app eals immedia tely before the
e l e c t i o ~ ~ ,orting out potential independent variables is largely a
matcer of controlling-and, as
yaw
know from Chapter
3,
the use
of
control variables is essential in the correlationa l research
design,
Trr
this chapter you
will. learn
techniques for iartyositlg those con-
trols. We will begin with the method for nominal and ordinal cate-
gory variables and then turn to intervai techniques.
Controlling with
Contingency Tables
As you have already learned, relationships between categorized
nominal and ordinal variabtes are analyzed using contingency ta-
bles. Contingency tables also may be used t o control for third vari-
ables, This is fairly easily done:
For
each category
of
the control
variable, a table is constructed sl-rowing tlte relationsh ip between
the independent an d dependent variables, Each
of
these tables may
then he presented in terms of percentages
and
app ropriate statistics
may be calculated. Note that to evaluate the effect
of
the control
variable, it
is
Ilecessary t o com pare the contrt>l tables t o a table
without
a
control variabie,

8/20/2019 Alan Monroe, Alan D. Monroe-Essentials of Political Research (2000)
http://slidepdf.com/reader/full/alan-monroe-alan-d-monroe-essentials-of-political-research-2000 175/214
Box 10.1 illustrates this procedure for a simple case i r ~ hich all
variables are dichotoxnized. Suppose we wanted t o see wl-retl-rer he
relationship between religion and voting was affected by an indi-
vidual's inco~rteevel. First we would construct a table showing the
relatiansl-rip betw een the independent variab le (re ligio n) an d tlze
dependent variable (vt~tef,hen we wou ld construct the same table
for each category (high an d low ) of the control variable (incssrte).
Note th at the frequencies fa r each cornbination of the independent
and de p i ld en t variables (such as Protestant Republican) in the
control tables add up to the frequency in the original table. Each
tahlc could then be expressed
in
terms of percentages and appro-
priate statistics computed, For this exaxnple, larnbda, gamxna, and
phi are reported. (Assuming the da ta were from a ran dc ~m ample,
chi-square could have heerr used, but with the small nu~nber
f
cases it would not have been significmt,)
What does the example in
Box 10.1
shc-IW?For all of the cases,
there is a weak relatio~ish ip etweeri religion an d vote, Protestants
tend to vote Republican, and Catholics tend to vote Democratic,
Whe.tl we
look
at each of the control rabies, the same is true for
both higher- and i o w e ~ i n c o m e esyondet~ts,The statistics measur-
ing the stren gth of tl-re association vary slightly, bu t basically they
show the same relatioilship
as
in the original table, This outcome
demonstrates that the control variable (incom e) had little o r n o ef-
fect o n tl-re rela tionship between the independent variab le (religion)
an d the dependent variable (v ote ), In othe r w ords, the effect of
re-
ligious preference s n the vote w as
tot
due ICIa person's income*
What Can Happen When You Control
Several things can happen to a relationship between two variahles
when you control for a third variable, Box
10.2
illustrates this with
an exa~rtple
f
the relationship betweeii income and voting
as
we
control f ar h u r other characteristics of the individtials. The ""urig-
inal" ttahle
for
all
of
the cases (part
A )
shows that there is a mod-
eratefy strong, hut significant, re'lationship: People with higher in-
comes were xnore likely t o vote Repub lican,
Th e first possible outcome
of
controlling is tha t nothing happens,
that is, the relationship
is
unchanged. This
is
shown
in
part
B
of
BOX
10.2
wl-ren we coltcrol for gender. The tables far xnales and females
are exactly the same and therefore have the same strength of rela-
tionship, (The chi-square values are srrtaller because the contro l
ta-

8/20/2019 Alan Monroe, Alan D. Monroe-Essentials of Political Research (2000)
http://slidepdf.com/reader/full/alan-monroe-alan-d-monroe-essentials-of-political-research-2000 176/214
Mzaltivariate Statist ics f 61
BOX 10.1 Coneofling Using ContingencyTables
MCOME
RELXG'N VOTE
XNCOME
RELZG9N VOTE
XNCQME
RELZG9N VOTE
High 13rtlr. Rep. High Carh. Rep, High 13rtlr. Rep.
High Cat t~ , Dem. I,ow
Pror. Rep.
I,ow Cath, Dem.
I,ow
Prot. Rep. High
Cath, Tlern. I,ow
Prot. Rep.
1,ow Cath, L>ern. 1,ow 13rtlr. l9em.
High
Cath, L>ern.
High
Pror.
Dem.
I,ow
Carh,
Rep.
I,ow
Pror.
Dem.
B,
Frequencies
CQPITTROLLLPJG
FOR INCOm
ALL
CASES ( H 0CONTROLS)
HIGH INCOME LOW WCOME
RELIGION KELXGXQN KEL IGlQN
VOTE Prcit Cat/?
VOTE
Prot Cath VOTE Prot Ckth
Rep
5
2
Rep
2
1
Rep
3
1
IJrm 3 5 Dem 1
3
Ilent
2, 2,
C.
Percellrage Tables an d Statistics
CQPITTROLLLPJG
FOR INCOm
ALL
CASES ( H 0CONTROLS)
HIGH INCOME LOW WCOME
RELIGION KELXGXQN KEL IGlQN
VOTE
Prcit Cat/?
W T E
Prot
Ckth
W T E
Prcit
Cath
Rep 62%
29% Rep 67% 2.5%
Rep
60% 33%
IJrm
38
71
Ilent 33 75 Ilet~t 40 67
100% 100% 100% 100% 100% IOO<Y*
N
8
7
S 4
S
3
I,ambda ;:
.29
1-nmbda ;: .33
I,ambda
=
.25
Gamma
= +.61
Gamma
=
+.71 C;amrna
= +.50
Phi" -12
Phi2
= .l 7 Phi2 = .l 9
bles are based o n fewer cases.) In real-life examples the percentages
would rarely stay exactly the same,
but
the imp ortant thing is tbat
the
measures
of
strength are
not
much altered,
This is the
same
our-
come
as in
the
example
in Box IQ,
. When this happens, we can
conclude that the apparent relationship httiveen the illdependent
and dependent variables was
not
caused by
the
control variable,
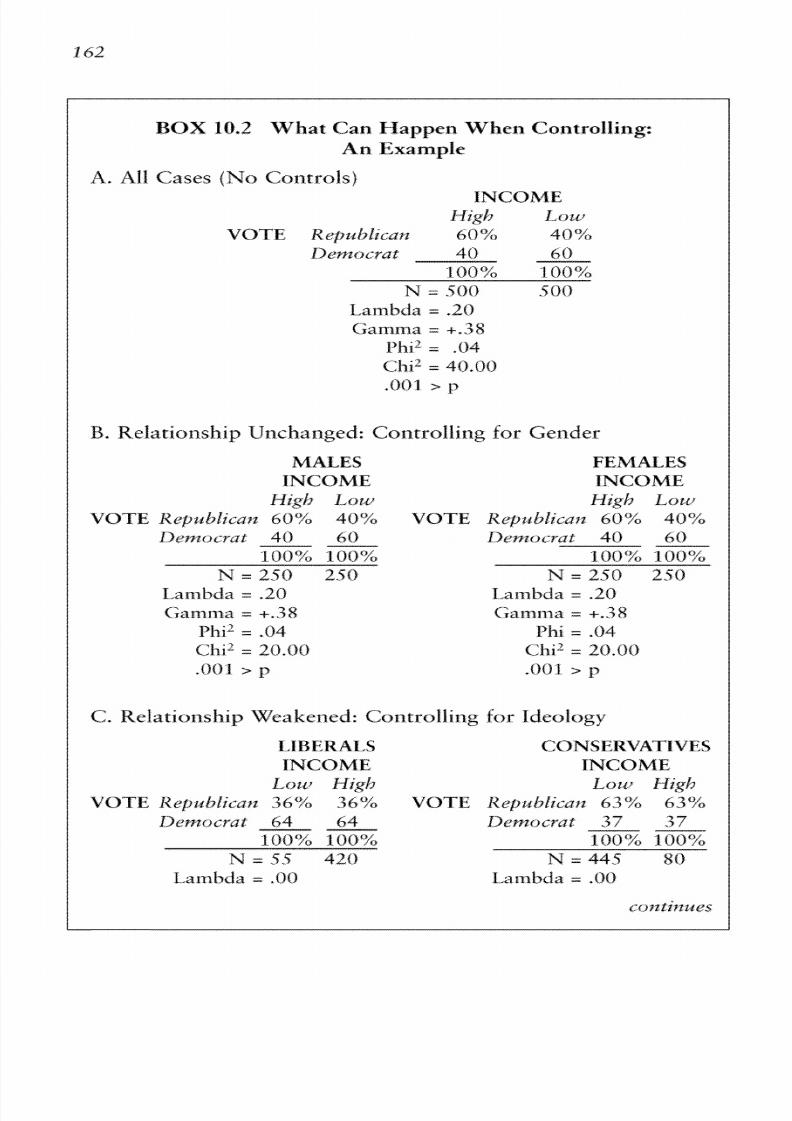
8/20/2019 Alan Monroe, Alan D. Monroe-Essentials of Political Research (2000)
http://slidepdf.com/reader/full/alan-monroe-alan-d-monroe-essentials-of-political-research-2000 177/214
BOX
I Q 2
W ha t Can Happen W hen Controlling:
An Example
A. All Cases ( N o Controls)
XNCQME
High L.ow
VOTE
Reptdblica~~ 60% 40%
B.
Relationship Unchanged: Controlling for G ender
MALES FEMALES
I N C O M E
INCOME
H2gi2 Low HigCs Lout
VOTE Repzdbliccan
6O% 40%
VOTE Repzdbliccan
60% 40%
L>enzc>crat 4 0 68 L>enzc>crat 4 0 68
1,ambda
=
.20
Gamma =
- 1 - 3 3
f 3 h i L .04
Chi2= 20.00
.001 > p
1,ambda
=
.20
Gamma =
- 1 - 3 3
1
=
.04
C h i b 20.00
.001 > p
C. Relationship W eakened: Controlling for Ideu lr~gy
LIBERALS
CONSERVATIVES
INCOME INCOME
Low N2gi1 Lout
High
VOTE Repzdbliccan 36%
36
VOTE Repzdbliccan
63% 63

8/20/2019 Alan Monroe, Alan D. Monroe-Essentials of Political Research (2000)
http://slidepdf.com/reader/full/alan-monroe-alan-d-monroe-essentials-of-political-research-2000 178/214
Mzaltivariate Statist ics f
63
Gamma
=
.&l
Phi2
=
.Cl0
Chi2 = .@l
p
>
.C30
Gamma
=
.Ol
Phi"
..00
CbiL=
.01
p
>
.C30
D.
Relat ions l~ ip trengthened: Czantrolling
for
Education
COLLEGE HIGH S C H O O L
INCOME INCOME
High
Low
High
1 . o ~
V O T E R e p u b l i c a n
58%
1 1
VOTE
Republican 86% 4 3 %
Democrat 42
89
Democrat
14 89
1,arnbda = . I 8
Garnma
=
+.g3
f3hi2
=
.07
Chi2 = 36.54
.@Q1
p
1,arnbda =
.OS
Garnma
=
+.78
f3hi2
=
.05
Chi2 = 24.55
.@Q1
p
E, Interaction: Controlling for Region
NON-SOUTH
SOUTH
INCOME INCOME
High
Low
High
Low
VOTE
Republzcan 75%
17%
VOTE Republzcan 33% 7 5 %
N
=
320 300
1,axnbda =
.l
8
1,arnbda = .SS
Garnma
=
+.g8
f3hi2
=
.03
Chi2
=
21 , l 6
.001
> p
D e n z o m ~
67
25
100% loo%,
N--180
170
1,axnbda = .08
1,arnbda = .48
Garnma
=
-.71
f3hi2
=
.17
Chi"
66.61
.@01
p
The second possibility
is
that the relationship is weakened, per-
haps to
the
point
s f
disappearing.
This
is shown in part
C,
where
we
control: for ideology.
A
glance at the percentage tables shows
that within
the
income categories there
was no
difference be-
tweerl the voting of high-
and Iow-income
individuals, a n d this is
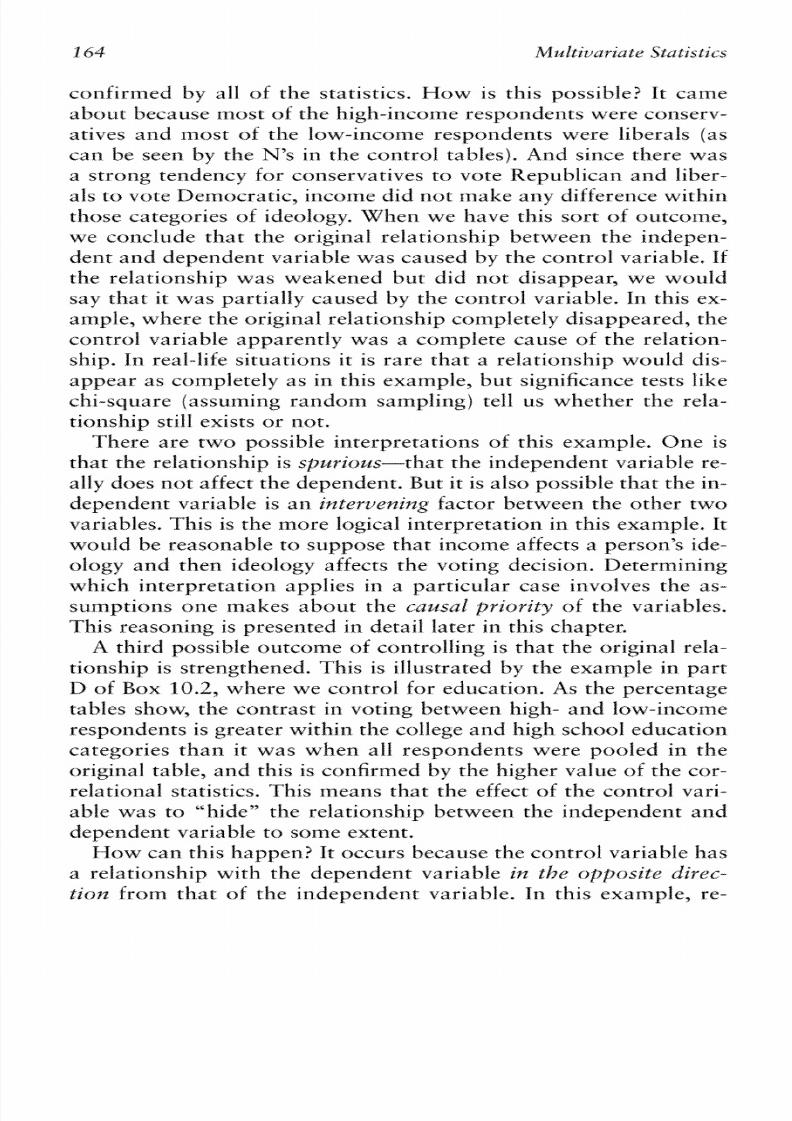
8/20/2019 Alan Monroe, Alan D. Monroe-Essentials of Political Research (2000)
http://slidepdf.com/reader/full/alan-monroe-alan-d-monroe-essentials-of-political-research-2000 179/214
confirmed by all
of
the statistics. H o w is this possible? ft c m e
about because most of the higl-r-incoxneresponden ts w ere conserv-
atives and most
of
the low-income respondents were liberals
(as
can be seen by the N's in the con trol tables), A n 3 since there w as
a strong tendency for conservatives to vote Republicail and liber-
als to vote Dem ocratic, income did n ot m ake any difference within
those categories
of
ideology
When
we have this sort of outcome,
we conclude tl-rat the original relationship between the indepen-
dent and dependent variable was caused by the control variable. If
the relationship was weakened but did not disappear, we would
say that it was partially caused by the corztrol variable, In this ex-
axnple, where the o riginal relationship completely disappeared, tl-re
control variable apparently was a complete cause of the relatir~n-
ship. fn real-lik situations it is rare that a relatitznship would dis-
appear as completely
as
in this example, but significance tests like
chi-square (assuming raildom sam pling ) tell us whether the rela-
tionship still exists or not.
There are two possible interpretations of this example. One is
that the rela tionship is sptlcrioas-that the indepelldent variahle re-
ally does not
affect
the dependent. But it is also possible tha t the in-
dependent variable is an intervenzng factor between the other two
variables. Th is is the more logical iilterpretatioil in this example, It
would be reasonable t o suppose tha t income affects a person's ide-
ology and then ideology affects the vocing decision. Determining
which interpretation applies in a particular case involves the as-
sumptions one makes about the
causal priority
of the variables.
This reasoning is presented in detail later in tl-ris chapter.
A
third possible outcome of controlling is that the origi~~alela-
tionship is strengthened. This is illustrated by the
example
in part
W of Box 10.2, where we control for education. As the percentage
tables show 3 the contrast in voting between high- and low-income
responderits is greater w ithin the college an d high school education
categories than it was when alt respondents were pooled in the
original table, a nd this is confirmed
by
the higher value of the cor-
relational statistics. This ineans that the effect of the control vari-
able was t o ""kde" h e relationship between tl-re independent and
dependent variable to some extetlt.
H w an this happen? I t occurs beca~zse he control variable has
a relatiansl-rip with the dependent variable
zn the
opposite
direc-
tion
from that
of
the independent variable.
In
this example, re-

8/20/2019 Alan Monroe, Alan D. Monroe-Essentials of Political Research (2000)
http://slidepdf.com/reader/full/alan-monroe-alan-d-monroe-essentials-of-political-research-2000 180/214
Mzaltivariate Statist ics f 65
spon dents with college experience actually tend to vote m ore for
Wexnocrats, But there is a stro ng positive relationsh ip between ed-
ucation and income; people who went to college tend to have
higher incsm es. Therefore , the effect of education was reduce
the apparent correlation between income and voting,
This
makes
a n imp ortant point: Even when there appe ars to be little or no re-
lationship between the indeperident and dependen t variables when
looking a t all the rases a t once, it may be valuable to control for
other factors,
The final possible ow co m e of con trolling is that the relationship
is dift'erent within the various categories of the control varialsle,
Part
E of Box
10.2
shows an example of this phenomenon, which
is called interaction. Whe.tl we coiltrol for region, we see that the
relationship between income a i d vote becomes stronger for non-
So uth responden ts, but actually reverses direction for respondents
who live
in
the South. Among these southerners, high income is
associated with Dem ocratic v o tk g and I OW income with Repukli-
can voting, Interyreting interactive resulrs is difficult,
but
it often
suggests that we need to look more closely at other factors that
might acc ount for the difference between th e categories
of
the
con-
trol variable. In this example of income, voting, and region, we
might need to look at variables such as the respondent's race and
religion, because the North and South have different distributions
on those characteristics. Althougl-r. he exaxnple in part E would
not he realistic today, it might have been found
in
earlier decades
when there w as a tendency
h r
Africa11 Am ericans (m os t of whom
were low-income southerners) to vote Republican, wilereas high-
income whites in the So m h typically suppr>rteda conservative
De-
mocra tic party, A dditional exam ples of csn trof ling with con tin-
gency tables are found in Exercises
A
and
B
at t ire end of the
chapter.
Given the range of effects third variables can have
o n
relation-
skips, i t is extremely important to control far addit ional vari-
ables, particulariy
in
the cc> rrela tiond design. A lthou gh contrt.>i-
ling techniques are riot an inherent part of the experimental and
quasi-experirrtental designs, they ca n a lso be app lied t o tl-te data
resulting from those methods,
Flow
does one know which vari-
ables should
he
selected as controlsflhere is no simple answer,
for the decision must be based on our tlreoretical understanding
of
the suhject under study as
well
as
on
past research findings,

8/20/2019 Alan Monroe, Alan D. Monroe-Essentials of Political Research (2000)
http://slidepdf.com/reader/full/alan-monroe-alan-d-monroe-essentials-of-political-research-2000 181/214
But it is important to remember one principle:
A control variable
can
affect
a relui~ionship ~ l yf
it
is
velrzted
to l>o~hhe
indepen-
dent
and
de pe nd e~zt ariablese
For example, if there is no differ-
ence between geographic regiolls and the relative proportion of
males and females (and therefore no correiation between region
and gen der), then there would he
n r>
purpose in using gender as
a
control variable when investigating the effect of region
on
any-
thin g else.
O ur exam ples here have looked only a t cc~n trolfing or one vari-
able at a time. But it is theoretically possible to control simultane-
ously
for
the effect
of
several varisltltes using contingency tables.
This is done by Looking at the independentldegendent relationship
within each possible com bina tion of the categories on two or more
control vclriables. Thus, the example in
Box 10.2
rllipht look like
this:
&$ale
/ \
Liberal C:ot~servative
L i
bertll C:ot~servative
/ ' / \
/
\ / --\
College H.S. College H.S. C p l l ~ g e H.S. Cyllege H.S.
\ I \ \ . \ '
/ \ / \
l \
1 ,
N-S S(>,
i
\ N-S SO. '
N-S
SO. \
N-S So. / I
N-S
SO,
N-S
SO.
N-S
So,
N-S S(>,
The result would be sixteen tables, each relatir-rg income and
voting for one of the com binations of' categories, such as inale
conservatives with a college education living in the South. Al-
though this could easily he d o ~ l e , specially by a co m puter, the
drawback is that each
of
the resuiting tables would be based on
relatively few cases, especially if som e con tro l variables l-rad highly
unequa l category frequencies. ~V oreove r, he control variables in
the exatrtples we have looked a t t h ~ saT have been dichotc~mies,
but it is comxnon
for
con trol variables t o l-rave three o r m ore cat-
egories, Therefore, unless one bas an extremely large data set,
contrcllling simultaneously
for
several variahles requires another
app roac h. The interval tecl-rniques described in th e nex t sec tion
provide such
a n
alternative.

8/20/2019 Alan Monroe, Alan D. Monroe-Essentials of Political Research (2000)
http://slidepdf.com/reader/full/alan-monroe-alan-d-monroe-essentials-of-political-research-2000 182/214
Mzaltivariate Statist ics f 67
Controlling with Interval Variables:
Partial Correlations
Th e procedure presented in Chapter 9 for regression and calcula-
tion of the Pearson correlation for interval variables can be ex-
tended in several ways to look a t the relationships between three
or
m ore variahles. Th e simplest: technique, an d th e on e most
sim-
ilar to th e results of controlling with contingency tables, is
partldl
correlation,
The partial c o r re la t io ~ ~easures the relationship betweer1 an in-
dependent variable and a dependent variable when one or rBore
ocl-rer variables are controlfed. The pa rtia i correla tion coefficient is
simply an extension of Pearson" r. It requires that the variables
(th ree o r more) he interval, Jt has the safBe range of -1 to 1 and
the same interpretation, tl-rat is, the squared value is equal to the
proportion of variance explained,
S~lbscripts re used tct distinguish the different correlations in-
volved. A l t h o u d ~ ormally 13earsonScorrela tion is referred to simply
as r, it must now be designated with subscripts, for example, r,,,
meaning that it is the correlation hemeen variable Y an d variable X,
Any convenient symbols, wl-retl-rer fetters or num bers, may be used
for this pwrpose. It is customary to list the dependent variable first,
Mulrivariate analyses often use a
correhtion
rutatrh. This is a
rectangular listing of a set of variables, so tha t th e cell at which the
row an d colum n for tw o variables intersect reports the correlation
coeff ic ie~~ttrr those variables. An example appears belowVV
ELIFSCAnON LWCQME
LIBERALISM
VOTE
E I
I;
V
E~ciz~ccati:~'u~z(E)
1-00
.81
.43 -.23
Irzccznzc?(1)
.81 1.00 -.S4
-.72
1,ibercalkm (J,) .43 -.
54
1.00
.4
1
Vote
((V) - 2 3 -,72
.4
1
1.00
re,
= .81, rle= -43, r\re = -.23,
=
-.54> r\rf = -.72,
rvl= 41
N ote tha t tl-re values a lr ~ n ghe diagonal a re all 1.00. This is be-
cause they each represent the correlation of a variable with itself.
Each of the other numbers appears twice because the correlation of

8/20/2019 Alan Monroe, Alan D. Monroe-Essentials of Political Research (2000)
http://slidepdf.com/reader/full/alan-monroe-alan-d-monroe-essentials-of-political-research-2000 183/214
variable X with variable
Y
is the sam e as the correlation of variable
Y with variable X . Therefore, it is common to see correlation ma-
trices presented as only
one
diagonal half, The line under the ma-
trix shows the use
of
subscripts to report the saiirte inhrmation.
The correlation between education (E) an d income
X )
is written as
re,, an d the m atrix shows it t o be ,81.
The
correlation betweell lib-
eralism and educatioli is r,
= .4J,
Wit11 this natation system, it is relatively easy to compute a
pa rtia l co rre lat ion Erom the "'simple" "arson correlaticrns
be-
tween variables. Here we will look only at the formula for the
first-order
p~artiikl,
that is,
the
corvel~t ion
etween
the
independerlt
ai"ld d e p e n d e ~ t
ariables
with
o ~ l y
ne
C O F ~ ~ ; Y Z I
iarlble,
Tlie for-
mula is:
where the subscript
y
denotes the d epe nde nt variables,
x
the in-
depeildeilt variable, and z the cc.,iltrol variable. As partial corre-
la t ions can have any number of control variables, a period is
used t o separate them from the independent a nd d epend ent vari-
ables (e.g., r,.,,,).
The iolfowrng example ilibrstrates the computation of partial
r, Suppose we took a randoxn sample of I00 counties in eke
United States an d fou nd that the dep endent variable, crime rate
(C) ,
and the indeperident variable, per capita income
( J j ,
had a
correla t ion,
r,,, of
.20, seemingly ind ica t ing tha t a reas wi th
higher-income residents
had
som ewh at higher crime rates. HC W -
ever, we wish t o control for percentage ur ba n (U). To
d o
this, we
need t o employ the correlat ions of both c r i ~ n e nd incorne with
percentage urban, Suppose these were r,, =
.6O
and c,, =
.80.
To
cofrtpute the part ial , we need to substi tute these three simple
corre lations into the formula above, as follows:
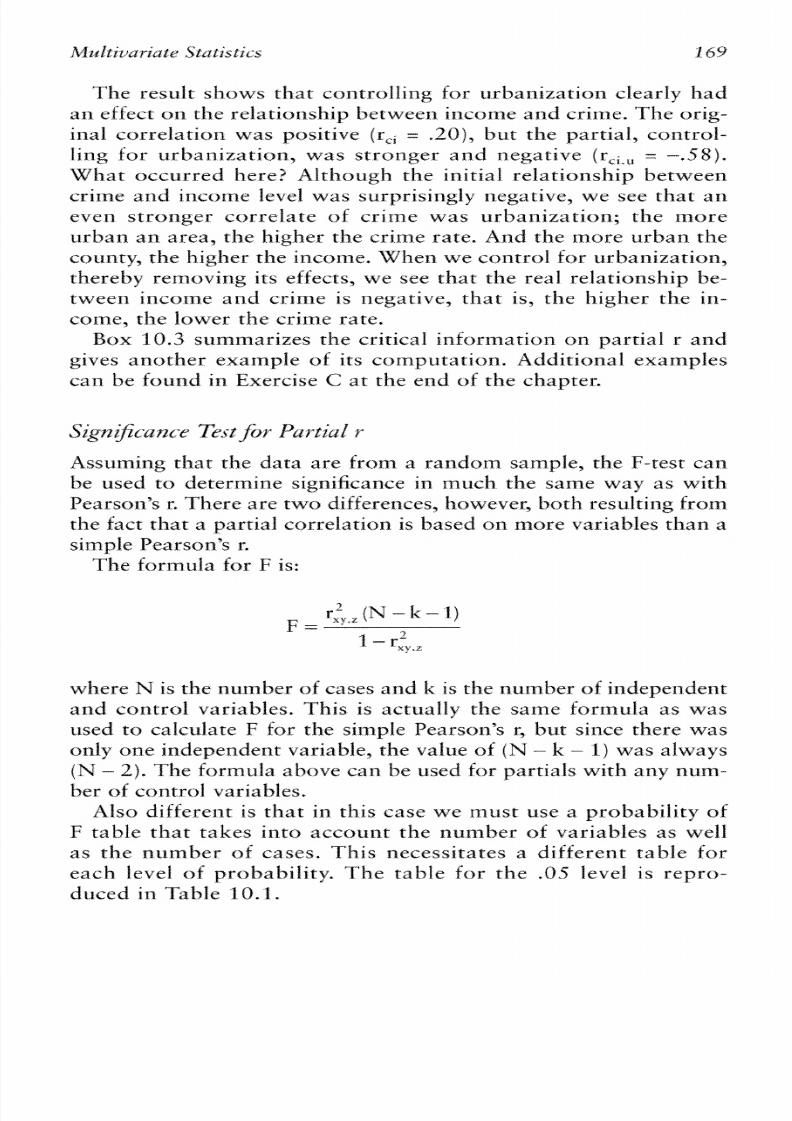
8/20/2019 Alan Monroe, Alan D. Monroe-Essentials of Political Research (2000)
http://slidepdf.com/reader/full/alan-monroe-alan-d-monroe-essentials-of-political-research-2000 184/214
Mzaltivariate Statist ics f 6 9
The result show s that co ~itro ll ing or urbanization clearly had
an effect o n the relationship between incom e an d crime. T he orig-
inal correlation was positive jr,, = .20), but the partial, contrt.>i-
ling
for u rbanimt ion , was s t ronger and negat ive jr,,.,
=
--.58).
What occurred here? Altkougli the init ial relationship between
crirrte a nd i l ~ c ~ m eevel was surprisingly negative, we see that an
even st ronger correla te of cr ime was urbaniza t ion ; the more
urban a n area, the higher the crime rate, And the rnore urba n the
county, the higher the income. W hen w e contro l for urbanization,
thereby removing its effects, we see that the real relationship be-
tweeri i n c o ~ ~ end crime is negative, that
is,
the higher the
in-
come, the lower the crixne rate.
Box
10 .3 summ arizes the cri tical infarm ation o n partial r a nd
gives another example of its c o r n p u t a t i o ~ ,Additional exarllgles
can be h u n d in Exercise C a t the e nd of the chapter.
Sign$cance
Test f i r Partial u
Assuming that the da ta are from a random sample, the F-test can
be used to determine significmice in much the same way as with
13earsonk e Th ere a re t w o differences, however, both resulting from
the fact tha t a partial c orrelarian is based o n m ore variables t ha n a
simple
Pearson's re
T he forrnula for
X;
is:
where N is the nuxnber of cases an d k is the num ber of independent
and control variables. This is actualfy the same formula as was
used to calculate
F
for the simple Pearson's r, b ut since there w as
only one independent variable, the value of ( N - k
-
) was always
fN
-
2).The formula above can
be
used Eor pa rtia ls with any num -
ber of control variables,
Also dilferent is cllac in this case we must use a probability of
F
table that takes in to account the number of variables as well
as the number of cases. This necessitates
a
different table for
each level of probability. The table for the .OS level is repro-
duced in
Table
10.1.

8/20/2019 Alan Monroe, Alan D. Monroe-Essentials of Political Research (2000)
http://slidepdf.com/reader/full/alan-monroe-alan-d-monroe-essentials-of-political-research-2000 185/214
BOX 20.3 XnformL-ionAbout P a d a l and
Muldple Correlations,
the
F-Test,
and
Examples of Computations
Statistic: Partial r
Type: Measure of association
Assumption: Three or more interval variables
Range:
-1
to
1
Interpretation: Proportion
of
variance explained (r,,.,L)
Formula:
Exaxnple: Given tl-re following correlation matrix af 13earson's
r's, calculate the partial correlatiw between a respondent's re-
ported Frequency af Voting
(V)
wi th Incoxne X), controlling
for
Years of Education (E), i.e., r,,,. Data are from a random
sample of 500,
rGTatrix af Pearsun" r
1
E
V
Income (If
1.00
.80
.50
Education
(E) .80
1.00 .Q0
Frequency of voting
(V) .SO .QO 2.00
Conclusion: Although there was an initial fairly strong positive
correlation between income and voting frequency, it almost
wrupletely disappeared when educa tior~was
controtled for,
This
suggests chat the tendency
Eor
respondents with higher education

8/20/2019 Alan Monroe, Alan D. Monroe-Essentials of Political Research (2000)
http://slidepdf.com/reader/full/alan-monroe-alan-d-monroe-essentials-of-political-research-2000 186/214
t o vote m ore frequently is almost entirely due to their higher
level
al
edmcatian.
Statistic: F-test for partial
R
Assumption: Random sampliq
Interpretation: T he probability
of
F
is the probability that the
partial correlation observed in the sample da ta could occur by
chance if there were no relationship
in
the population from
which the sample was drawn.
r;l>rmula:
Example: Using the partial correlation computed above, r,,, =
.04, N = S00, and k
=
2 Ithere are tw o independen t variables).
We substitute the vaiues into the formula for F:
Using Table 10.1,
we
locate the
F
value for
N
-
k
-
1
= 1 2 0
(the next-lowest t o 497) and the column under the heading
k
= 2. The vaiue &ere is
3.07,
which is much larger tlzan the E
for this example. Therefore, the probab ility
is
greater than
-05
an d this partial co rrela tion is no t significant.
Statistic:
multiple
R
Type: Measure
of
association
Assumption: Three o r m ore interval variables
Range: 0 t o 4 1
Interpretation: Pn~portion
f
variance explained (RL)
Formula:

8/20/2019 Alan Monroe, Alan D. Monroe-Essentials of Political Research (2000)
http://slidepdf.com/reader/full/alan-monroe-alan-d-monroe-essentials-of-political-research-2000 187/214
Example: Using the correlation matrix in the first part of this
table,
we can calculate the multiple correlation of the inde-
pendent: variable, voting frequency
(V)
with two independent
variables, income
( I )
and education
(E).
Th e Pearsank r cor-
relations needed are
rvi
= .50, rve =
.&Q,
nd r,, = .W.
Conclusion: Income and edtlcation together explain
36
per-
cent
of
the variance in kequency of voting. This
is
virtualIy
n o
improvement over the explanatory value
of
education
alone.
Statistic: F-test for multiple R
Assumption: R ando m sam pling
Interpretation: Th e probability of
F is
the probabilbty that the
par tial correla tion observed
in
the sample data could occur
by
chance if there were no relationship in the population from
which the sample was dra wn .
where
N =
sam ple size,
and
k
=
number of independent vari-
ables,
Example: To test the multiple R previously computed for vot-
ing frequency, income, and education, we substitute the rele-
vant values: ,
rv:,, = .36,N =
500, and
k = 2 .

8/20/2019 Alan Monroe, Alan D. Monroe-Essentials of Political Research (2000)
http://slidepdf.com/reader/full/alan-monroe-alan-d-monroe-essentials-of-political-research-2000 188/214
We then go to Table 10.1. We look
down
to the line to N -
k
-
1
=
1 2 0 (the next-lowest value t o
4337")
an d to the coiuxnn
beaded
k
=
2.
The value there is 3.07, Since our F is much larger,
we can
conclude that the probability
of
chance occurrence i s less
than
.OS,
herefore,
R2
is significant.
1
Tc? find the significance
for
the partial we
just
computed, we
in-
sert the values into the form ul;~ or
F:
N = 100,
r
=
-,SS,
and k =
2.
This resuks in the following:
We now lr ~ o k n Table 10.1. We go down to the fine opposite
60
(the closest on e tc-, the value of
97
far
N -
k
- 1)
and look at the
second column, because
k,
the e~ um ber f independent an d corztrol
variables is
2 ,
We see that an
F
value of onfy 3.1 5 would be re-
quired to assure that the probability of chance occurrence of this
relationship m u I d
be
less than
.M,
Since ou r F i s much iarger, we
are sure that the retationship is significant at the
.05
level, Other
examples of the F-test for the partial correlation can
he
fc~un d n
Box 10.3 an d in the Exercises a t the end of the clzapter.
The Multiple
Correlation
Depeildent variables in social research conznzr~nly ave several dis-
tinct but related causes. Consider, for exam ple, a n individua19s vote
for a presidential candida te, This decision c m be partially predicted
or explained by each
of
a considerable number of factors, including
the person" party identification, illcome, race, religion, idealog): and
attitudes
rovvard
a numher of specific issues.
But
these factors are
themselves interrelated; for example, a Republicail identifier will
tend to have a higher inct>meand
a
more conservative ideology*
Sim-
ply adding up the explanatory value of these separate independent

8/20/2019 Alan Monroe, Alan D. Monroe-Essentials of Political Research (2000)
http://slidepdf.com/reader/full/alan-monroe-alan-d-monroe-essentials-of-political-research-2000 189/214
TABLE 10.1 Probability of F for Partial and Multiple Correlations
0.5 Probability Level)
k =
Number
of
independent and control variables
N -k-l k = l k = 2 k = 3
k = 4
k = 5 k = 6
1 161.4 199.5 215.7 224.6 230.2 234.0
2 18.51 19.00 19.16 19.25 19.30 19.33
3 10.13 9.55 9.28 9.12 9.01 8.94
4 7.71 6.94 6.59 6.39 6.26 6.16
5 6.61 5.79 5.41 5.19 5.05 4.95
6
5.99 5.14 4.76
4.53 4.39
4.28
7 5.59 4.74 4.35
4.12 3.97 3.87
8 5.32 4.46 4.07 3.84 3.69 3.58
9 5.12 4.26 3.86 3.63 3.48 3.37
10 4.96 4.10 3.71 3.48 3.33 3.22
11 4.84 3.98 3.59 3.36 3.20 3.09
12 4.75 3.88 3.49 3.26 3.11
3.00
13 4.67 3.80
3.41
3.18 3.02 2.92
14 4.60 3.74 3.34
3.11 2.96 2.85
15 4.54 3.68 3.29
3.06 2.90
2.79
16 4.49 3.63 3.24
3.01 2.85
2.74
17 4.45 3.59 3.20 2.96 2.81 2.70
18 4.41 3.55 3.16
2.93 2.77 2.66
19 4.38 3.52 3.13 2.90 2.74 2.63
20 4.35 3.49 3.10 2.87 2.71 2.60
21 4.32 3.47 3.07 2.84 2.68 2.57
22 4.30 3.44 3.05 2.82 2.66 2.55
23 4.28
3.42 3.03 2.80 2.64 2.53
24 4.26 3.40 3.01 2.78 2.62 2.51
25 4.24 3.38 2.99 2.76 2.60 2.49
26 4.22 3.37 2.89 2.74 2.59 2.47
27 4.21 3.35 2.96 2.73 2.57 2.46
28 4.20
3.34 2.95
2.71 2.56 2.44
29 4.18 3.33 2.93
2.70 2.54
2.43
30 4.17 3.32 2.92 2.69 2.53 2.42
continues

8/20/2019 Alan Monroe, Alan D. Monroe-Essentials of Political Research (2000)
http://slidepdf.com/reader/full/alan-monroe-alan-d-monroe-essentials-of-political-research-2000 190/214
Mzaltivariate Statist ics f
75
N W E :
I,argcr tables
showing
additional stgrlificancc
Ievcls
may
bc
fo~rndn
many coil-tprefiensive statistics
texts.
s o u ~ c ; ~ :orlald
A.
Fisher and Frank
Yares,
Stat is t ica l
Tables f i r
BioEogilraE, Agvicz--tlturaE,nd Medical
Research,
SZXgh EEdiL-ion
(Edinburg1.t: Ofiver
and
Boyd,
19631,
pp
53, 5.5, 57 ,
O . A.
Fisl-ter and
E rates.
Reprinted
by
perlltission of Pearson
Education,
Limited.
variables would be misleading, for their contributi<~nso the
vote, in effect, '"overlap" tto some degree, The multiple correla-
tion coefficient is designed to measure the total contribution
of
several independent variables to the explanation of a single de-
pellde~ltvariable while taking into accrlunt any ""overlap" in
their cox~triution.
The rnuleiple correlation cuefticient is symbolized by a capital
R,
and the subscripts begin with the depelldent variable, followed
by
the independent variables. Thus R,.,, measures the total effect of
the independent variables, x and z, an y, the dependent variable.
The details
of
multiple
R
are similar to those Pearson3 r and the
partial r in that
all
tlavicjreks
w s t
be
i~tcrrval
nd that
the
sqtrilred
w l ~ e
f R
is
the eqgal tu propurgion of'uarIILdl~ce
xpkkined, How-
eve4 multiple
R
differs from the others
in
that it can
oniy be posi-
tive hat is, it
does
not show direction (because sofBe
of
the inde-
pendent variables may have
a
positive relationship to the
dependent variable and others a llegative relationship), Therefore,
the range
of
possible values for
R
is
O
to
,
As
with tl-re partial correlation, rnultipie
R
can easily be calcu-
lated from the simple Pearson's r vvalues, Normally the square of
multiple R is computed, which tells is the proportion
of
variance

8/20/2019 Alan Monroe, Alan D. Monroe-Essentials of Political Research (2000)
http://slidepdf.com/reader/full/alan-monroe-alan-d-monroe-essentials-of-political-research-2000 191/214
explained; thus, For multiple R h i t h two independent variables,
the forxnula is:
R itself can be caiculated
by
taking the square root of the result,
but Rqis rnore meaningful a d ence is tlne figure usually repmted.
We
can illustrate this computation with the previous example for
crime rate (C) , percent urban ( U) and per capita incc>me 1). The
Pearson correlations were r,,
=
-20,
r,,,
=
.GO,
and
r,,,
=
.80,
Suppose
we wish to coxnpute the multiple correlation of two independent
variables (income and percentage urban) with the depelldellt vari-
able (crime rate). Substituting the letter identifying the variables for
the example in tlze forxnula and then substituting the corresponding
values, we have:
This shows that incsme and urbanization together explain 77 er-
cent of the variance in crime rate.
Multiple correlations with
more
independent variables may be
computed ~zsingmore csmplicated fc3rmulas involving partial cor-
relations,
Significance Test for R
Assuming that the data are from a r a rzdo~~ample, the significance
of
R2
may
be
Jererrnined by the F-test in rrlucln the same way
as
for
the partial correlation, The formula is:
where
P;;
is the sample size and k
is
the number
of
independent
variables. For the preceding example, in which
R" -77,N
=
1 OO,
and
k
= 2, we substitute these values
and
obtain:

8/20/2019 Alan Monroe, Alan D. Monroe-Essentials of Political Research (2000)
http://slidepdf.com/reader/full/alan-monroe-alan-d-monroe-essentials-of-political-research-2000 192/214
Mzaltivariate Statist ics
(Note that the value of -77previously computed for R2 was already
the squared value.)
litrning
n o w
to the probability figures in Table
10.1,
we go down
column
t
to where
N
-
k
-
I
is
60
(the table's next lowest value
from 9 ;; d hen over to column
3
(headed
k
=
2").We
see that
in order to be statistically significant,
F
would have to equal 3. f S
or more, Since our
F
is much larger, we can be confidex~t hat the
probability of having obtained an Rhaalue of .77 by chance is less
than .05, and therefore the relationship is significant. Additional
examples
of
the F-test h r R b r e found in
Box
10.3 and in Exercise
C
at the end of the chapter,
Beta
Weights
The process
of
deterrlnini~~ghe "ibest-fitting" rregression line and
the equation that defines it can
be
extended to any number
of in-
dependent variabtes, The equtltion takes the form:
where
Y
is the dependent variable,
X, ,
X,,
and so
o n
are the inde-
pendelit variables, and
b,,
bL, and
so
on are the corresponding val-
ues of the siape
fnr
each independent variable. The computations
for these multiple regression statistics are beyond
the scope
of
this
book, and in fact they are almost always done
o n
a corrtputer*
However, it is ixnportant to be aware of them as they are widely
used in contemporary political science
re sear cl^.
Mthough the
b
values for the slopes are quite meaningful, they
can be difficult. to interpret directly because they are dependent on
the
units in which each
of
the variables is measured. For that rea-
son, the results
of
multiple regression analyses are commonly re-
ported in terms of
s a ~ d a r d i x e d
e g r g s s i ~ ~oefficients or beta (@)
weights.
Betas are standardized
in
two ways, First, they show the
effect of each independent variable
o n
the dependent variable, con-
trolling far all of the other independem variables, In this respect,
they are like partial corretations. Second, they
use
the standard
8/20/2019 Alan Monroe, Alan D. Monroe-Essentials of Political Research (2000)
http://slidepdf.com/reader/full/alan-monroe-alan-d-monroe-essentials-of-political-research-2000 193/214
deviations
of
the variables to remove the effects of the particular
units in which tl-re variables are measured. Tl-rus if the beta for the
first independent variable is twice as high as that far the second in-
dependent variable, we can sap that the first variable had twice as
rnuch impact an the dependent variable as did the second. F-tests
are used with hetas to determine the significance
of
each indepen-
dent variable. The muIrip)e R% a measure
of
the expianaeory
value of the whole equation.
Causal
Interprets
ion
The chapter thus far has presented techniques far analyzing the
relationship of three or more variables, particularly procedures
for
Ictoking
at the relationship between two variabks wl~ile on-
trolling for a third, This concluding section will focus on some
principles that are vital Eor interpreting what the results
of
these
techniques mean,
Interpreting the results of multivariate a~lalysiss a process lead-
ing to conclusions about
patterns of causalion,
A quick review of
the three ""criteria for i nk r r ing causality'9hat were in traduced
in
Chapter 3 will be useful here. The first is cowiariatitsn, or correia-
tic~n.You should now have a much clearer idea of what this
meaxls, The various ineasures
of
association, from Xambda to inuf-
tiple
R,
are all measures
af
covariation, The second criterion is
time order
or, more precisely, causal priority.
Ti,
interpret the re-
sults of inultivariate
analysis
correctly, we must be very clear
about our assumptions about tl-re order in which we believe the
variahfes occur. Finally, before we can draw any causal inferences,
we
must make sure that relationships between variables are
vtot
spurious.
This is the purpose of the controlling tecl-rniques dis-
cussed
earlier in this chapter.
Although the process of causal modeling in its complete form is
rnathernatically sophisticated and beyond the scope
af
this book,
its essentials can he simplified and used to analyze a small number
of variables with the techniques covered earlier. The key point is
8/20/2019 Alan Monroe, Alan D. Monroe-Essentials of Political Research (2000)
http://slidepdf.com/reader/full/alan-monroe-alan-d-monroe-essentials-of-political-research-2000 194/214
Mzaltivariate Statist ics f 7 9
that we must he prepared to a s s w e that arty cagsial relationship
between two vnrliahles can
be
in
only one
dzrection, It is quite pos-
sible for causatioil to he
reciprocal,
that is, for X to ir-rfluence U
while Y influerices X, For example, a person's ideology undoubt-
edly influences his or her party identification, but party loyalty may
also affect ideological views, There are a number of techniques for
analyzing two-way ca~zsation, ut they require r ~ u c hRore sat ist i-
cal background tl-ran can be provided here. Therefore, we must as-
sume that causatioil is unidirectional and that we know what the
directio~is. When our data are derived from, a true experiment or
a quasi-experimentai. design, there is littfe do ub t &out which vari-
able "caxne first" "cause we know when the variables occurred.
I-.I~wever,with a co rrelatiollal design (which is where we typically
use causal modeling), this causal order is less clear.
i n
that case the
assum ption of causal order must be based on the kind of reasoning
presented in Chapter
2
in the discussion of the variables-cheoreti-
cal role and the difference between independent and dependent
variables. We must also make tl-re assum ption tl-rat tl-rere are no ad -
ditional variables that could he affecting the relationships. But
whatever the basis for the assum ptions, we m ust specifv the causal
priority
before assessing
the applicability of any causal models.
Figure 10.1 illustrates the need for causal modeling in even the
simplest case, where there a re only three variabfes, Vlre first specifj.
the causal priority X, Y,
Z .
This means tha t if there i s causation be-
tween the three variables, then
X
causes
l
and Z , and
I
causes Z,
No
reverse causation is permitted-that
is, Y
can not cause
X,
and
Z
cann ot cause either of the otl-rer two.
We would undermke causal modeli%
for
this set of variables he-
cause we have data that indicate some relationship between them;
some or all of tile possible intercorreiations are no t zero, The exam pie
in Figure 1 0.1 assumes tha t we have interval d ata so that Pearsuil's
r and partial r can
be
com puted, But the same reasoning ca n be ap-
plied to noxninal an d o rdinat da ta, as will be discussed later.
As Figure-.
18.1 show s, there a re four passible causal models that
might underlie a pattern of observed intercsrrelation between only
three variables. We can use Pearsank r and partial correlations to
determine whether each m odel fits any given set of d ata. M odel 1
is the simplest case, where there are two independent variables,
X
and Y, tha t are no t a t all related. We would conclude that this is the
case only if there were
n o
simple Bearson correlation between
X
and Y, that
is,
r,, =
0,
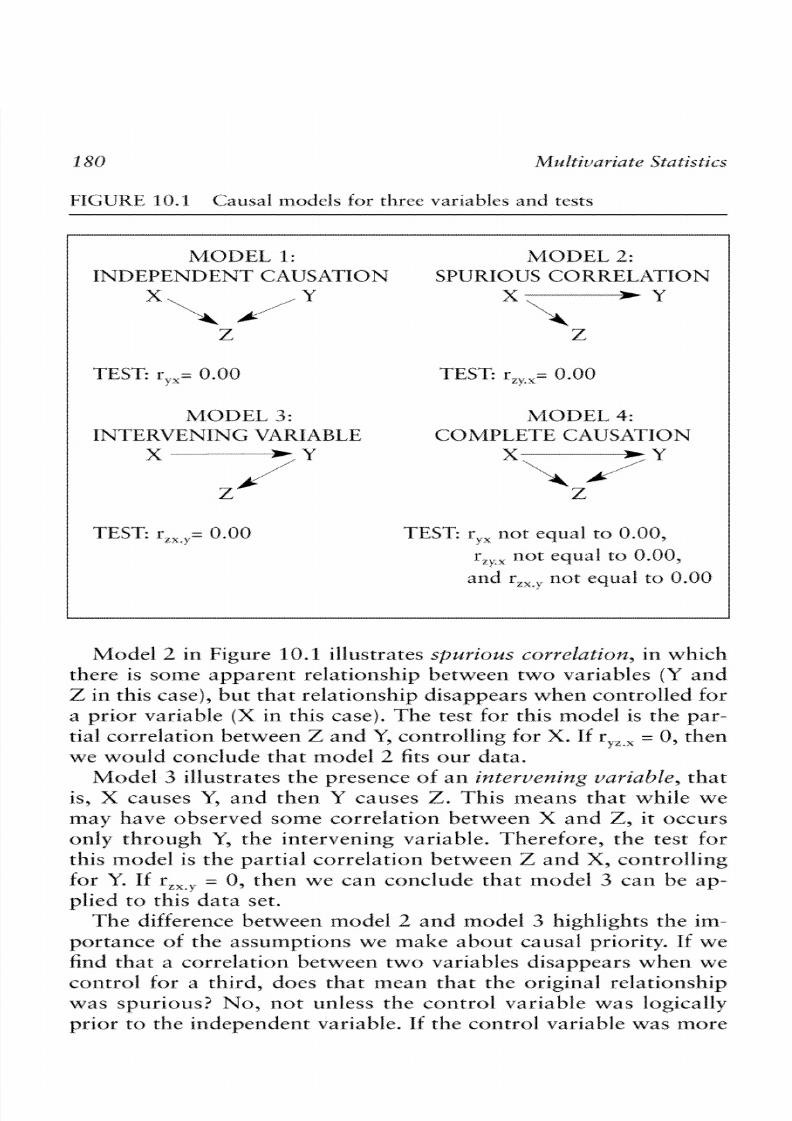
8/20/2019 Alan Monroe, Alan D. Monroe-Essentials of Political Research (2000)
http://slidepdf.com/reader/full/alan-monroe-alan-d-monroe-essentials-of-political-research-2000 195/214
FIGURE-,10.1 Causal models
for
three vartablcs and tests
1VOL)EL
1:
IGIIODEL
2:
INDEPENDENT
CAUSAA%'XON SPURIOUS COR RELA TION
X
Y
X V Y
X ,'
z Z
TEST:
r,,= 0.00
TEST:
r,,,=
0.00
iMODEL
3: MODEL
4:
INTERVENING VARIABLE COMPLETE
CAUSATION
TEST: r,,,,=
0.00
XV
\
/ l
Z
TEST: ry, not equal t o
0.00,
r,,,
not
equal
t o 0.00,
and rzxVyot equal to 0.00
Model 2 in Figure
1Q.1
llttstrates spurious correlation, in wllich
there is some apparent relationship between two variables (Y and
Z
in
this case), but that relationship disappears when controlled for
a prior variable (X
in
this case).
The
test
f o r
this model
i s
the par-
tial correlation between
Z
and
%
controlling for
X,
X r,,.,
= 0,
then
we would
conclude that model
2
fits our data.
Model 3 iliustrates the presence of an irttervening
uariubl'e,
that
is, X causes Y, and then
V
causes
Z ,
This means that wl-rile we
may
have observed some correllatioil between X and Z ,
i t
occurs
only through
V,
the intervening variable. Therefore, the test
for
this model
i s
tlze partial correlation between
Z
and
X,
controlling
for
Y.
If
r,,, =
0,
then we can conclude that model 3 can be
ap-
plied to this data set.
The difference between model 2 and rnodei 3 highlights the im-
portance of the assumptions we
make
about causai priorify. If we
find that
a
correlation between two variables disappears when we
control for a third, does that mean that the originaX relationship
was spurious
No,
not unless the control variable was logically
prior to the independent variable, If the control variable vvas more
8/20/2019 Alan Monroe, Alan D. Monroe-Essentials of Political Research (2000)
http://slidepdf.com/reader/full/alan-monroe-alan-d-monroe-essentials-of-political-research-2000 196/214
Mzaltivariate Statist ics f 81
likely a result of the independetit variable, then the mtrdel 3 inter-
pretation of an intervening factor is correct.
If,
on tl-re other I-rand,
we have assumed that the control variable is causally prior to the
other two, then their relationship would be spurious.
If none of the test correla tions (r,,, r,,-,,nd r are equal to
zero, then model 4 applies. This means that, given ou r assum ptions
and available information, we can1i~)timplify the model and m s t
assume that all of the correlations
do
imply causal linkages. It is
also possible that more than
one
of these test statistics will be equal
to zero, This simply means that some or atl of these variables are
not even related, s o there is no need k > r causal in terpre tation.
However, one should not draw such a conclusion until the appro-
priate partials have been computed, because it is possible for the
value of Pearson's r between two
variables
t o be zero while the par-
tial is significamly positive or negative.
Although examples such as these-in whictl correla tions tu rn out
to be exactly zero-can occur with real data , usually they d o not ,
How clr~seo zero must a correlation be? If the data are from a ran-
dom sample, then the F-test may be used for Pearson" r a d he
partial correlations.
If
the probability is greater than
.OS,
then the
correlation can be assumed t o be zero for the popu lation, But one
may be working with nonsample data, where any correlat ion,
however small, is, in a statistical sense, significant, or with data
from a such large sarnple that even rninute correlations indicating
no practical relatirrnship are still significant at tile
.05
level. In
such instances, one may look a t aIX of he tests a nd see that because
one of the test statistics is extremely weak, the corresponding
model is, indeed , the '"best fitting."
Box
10.4 illustrates the process
of
causal modeling with an exam -
ple using data o n nations. The dependent variable is military spend-
ing (measured as a percentage
of:
national budget). The causal prior-
ity
of
the other two variables is not obvious, as both wealth
(measured as per capita.
GNP)
and democracy (measured on a ten-
point scale) would have a lengthy history,
To
keep the example
simple, we will assurr.le that wealth causes democracy, Hence the
causal priority is wealth, dexnocracy, military spending. As Box
10.4
shows, model 1, indepelldent causation, clearly does not
apply,
be-
cause wealth an d d e n lo c ra q are strongly correlated. Model 2, spu-
rious correlation, a lso does not apply$because the partial r between
military spending and w ealth, controiling fc ~r emocracy
(rgnW,&)r
s
quite strong. But when we test model 3, Intervening Variable, we
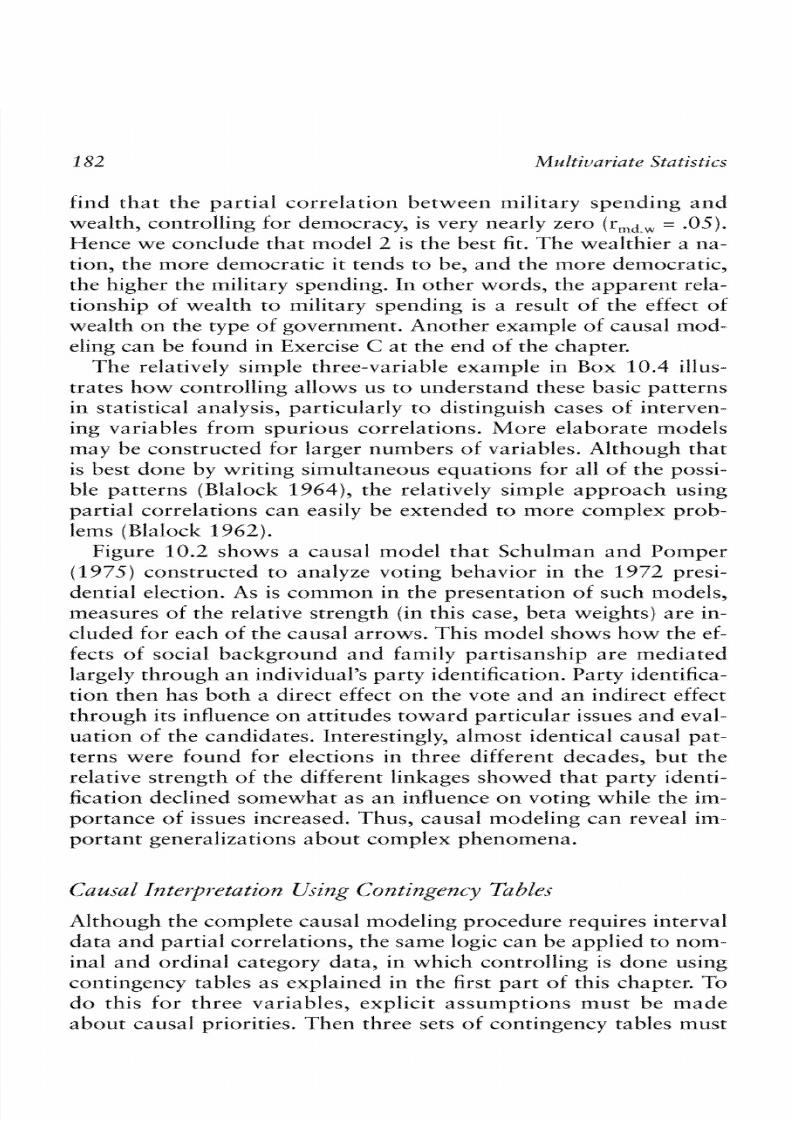
8/20/2019 Alan Monroe, Alan D. Monroe-Essentials of Political Research (2000)
http://slidepdf.com/reader/full/alan-monroe-alan-d-monroe-essentials-of-political-research-2000 197/214
find that the partiat correlation between military spending and
wealtl-r, c o n tr o l l ix fa r dernocritcy, is very nearly zero (r m d S w.05f.
Elence we conc lude that model 2 is the best fit, The w ealthier a na-
tion, the more democratic it tends to be, and the more democratic,
the higher tl-re military spending. In othe r w ords, tl-re ap parent rela-
tionship of wealth to military spending is a result of the effect of
wealth on the type of g u v e m e n t . Another example
of
causal trtod-
eling can be fotjnd in Exercise
C
at the end of tlze chapter,
The relatively simple three-variahle example in Box
10.4
illus-
trates ho w controlling allows us to understand these basic patterns
in statistical anatgsis, particularly to distinguish cases of interven-
ing variables from spurious correlations. More elaborate models
may he constructed for larger numbers of variables. Although that
is best done
by
writing simultaneous equation s for
all of
the possi-
ble patterns (BXalock 1964), tl-re relatively simple approach using
partial correlations can easily be extended to more complex prob-
lems (Blalock 1962) .
Figure
10.2
shows a causal model that fchutman and 130mper
(197.5)constructed tc-, analyze votillg belravior in the 1972 presi-
dential election. As is ccjmmon in the presentation of such models,
measures of the relative stretlge1-r
(in
this case, beta weights) are in-
cluded for each of the causal arrows. This mc~del hows
how
the ef-
fects s f social hackground and family partisallship are mediated
largely throu gh an individual's pa rty identification. Party identifica-
tion then has both a direct effect cm the vote and an indirect effect
through
i t s
influence
o n
attitude s tow ard particnlar issues
and
eval-
u t~ tion f the candidates. Interestingly, almost identical causal pa t-
terns were found far elections in three different decades, but the
relative streng th
of
the different linkages showed that party idetiti-
fication declined somewh at as an influe we o n v o ti w w hile the
im-
portance of issues increased. Thus, causal modcling can reveal im-
portant generalizations ab ou t complex phenom ena.
Causul Interpretution Using
Contingmcy
?b
ble~
Although the com plete cartsal modeling procedu re requires interval
da ta a nd partial correlatioils, the sam e logic can be applied
to
nom-
inal and ordinal category data, in which controlIing is dcrr-re usirlg
contingency tables
as
explained in the first part
of
this chapter,
To
d o this for three variables, explici t ass ~tm ptivn smust be made
ab ou t causal priorities.
Then
three sets of contingency tables m s t

8/20/2019 Alan Monroe, Alan D. Monroe-Essentials of Political Research (2000)
http://slidepdf.com/reader/full/alan-monroe-alan-d-monroe-essentials-of-political-research-2000 198/214
l
BOX 10.4 An Example
o f
Causal Modeling
Correlation Matrix (X)earsank
sr)
Relevant
Partiais:
W
D
M
r,,,,, =
-78
Wealth
( W )
1.00 -85 ,S1 rmw>,c = -.Q5
Democracy
(D)
.85 L 80 .62
M ilitary spending (1M) -5 1
-62
1.00
W
=
l
86
Nations
Assumed causal priority: Wealth, democracy, military
spending
I Model 1: Independent Causation
Test:
Does
rdw= O No, rd, = . g5
Conclusion: Model 1 does not
apply-
1V odel2: Spurious Correla tion
Test: Does
rm dS wO No,
r m d e w -78.
Conclusion: LWodel
2
does
not
apply.
W
*D f i s t : Does
r
=
01 rtnd+,= -.OS,
J
wllicb is very close t o zero,
iZ/1
Gonclusictn: LMc~del3 may apply.
1Vodei
4:
Complete Causation
W *D
Test: Are r d w9n,d,r,
and
rmsd a11 not
'I
equal to =so? Since rrrrdew .OS,
M
Mc~del
4
does not
apply
very well.

8/20/2019 Alan Monroe, Alan D. Monroe-Essentials of Political Research (2000)
http://slidepdf.com/reader/full/alan-monroe-alan-d-monroe-essentials-of-political-research-2000 199/214
~vtzliszzled
Conclusion: Model 3 is the best fitting causal model:
3
&M
be constructed:
(1)
ables cross-tabulating each pair of variables
without controls; ( 2 ) ables cross-tabulating the second indepen-
dent ('"middle") variab ie with the depe lldeat variahle while con-
trolling for the first independent variable; and (3) ables cross-
tabulating the first independent variable witl-r the dependent
variable while controlling for the second independent (""middle"')
variable, Appropriate statistical measures of association and (if
randorn sarnple data are used) significance levels are then corn-
puted. When all of this has
been
done, it may be possible to distin-
guish
the four possible causal models previously presenwd,
The results of this procedure may be m ore ambiguous than those
obtained In causal modelinfi for interval variables,
The
problem is
that there may be substantial
ilzteracticm,
that is, the relationship
may be of different strengrhs within different categories of a con-
trol variable,
On
the other hand, this can be ail advailtage of the
contingency table method, since partial correlations do nut reveal
whether interaction is present.. T he contingency table ap proa ch
also may be extetlded tc-,a larger number of variables, which would
require controlling for tw o or m ore variables a t once, As noted ear-
lier, simultaneously controlling for several variables produces nu-
merous tables, many with inadequate numbers of cases.
Box
10.5
presents the contingency tables rlecessary to m dert ake
this version of causal analysis. The example deals with the question
of racial differences in voting participation a nd the extent t o which
these differences can be attributed to education, We assume that
the causal priority is race, education, turnout, That ttlmout could
only be a
consequence
of the other two is
O ~ V I Q L I S ,
It also makes
sense to assume that race more lilcely influences education (i.e.,
mem bers of m inority groups tend t o have less edu cation ) for a
va-
riety
of
reasoils, w hereas the nt>tioil that educatioil could influence
race and ethnicity does not make sense.
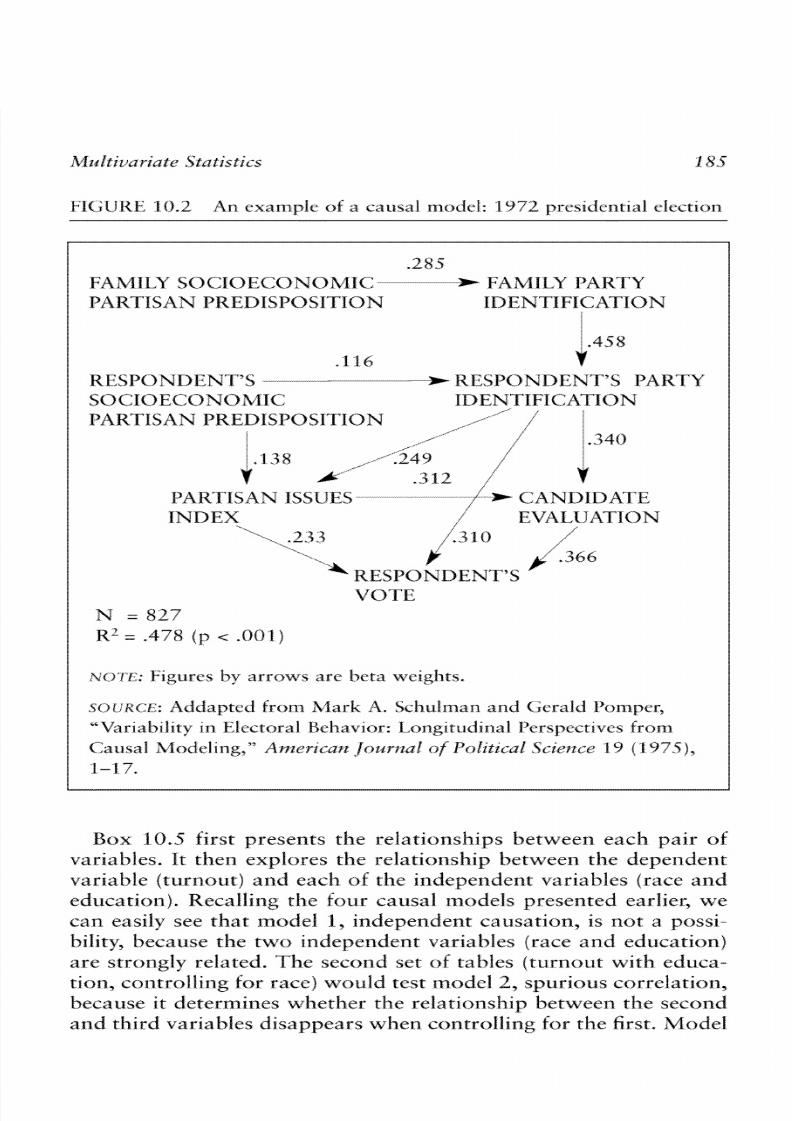
8/20/2019 Alan Monroe, Alan D. Monroe-Essentials of Political Research (2000)
http://slidepdf.com/reader/full/alan-monroe-alan-d-monroe-essentials-of-political-research-2000 200/214
Mzaltivariate Statist ics f 85
F 0 . 2
An example
t>f a
causal
model:
1972
presidential election
,285
FAiZilILY
SOCIOECONOMIC
PARTXSAN PREDIf POSITION IDENTIFICATION
RESPONDEN RESPONDENT" PARTY
SOCIOECONO IDENTIFICATION
PARTISAN
PREDISPOSITXC3N
i
' /
I
.l38 -i .249
/
Y A/ . 3 l Z /
X3ARTISAN
ISSUES
/+-CANDIDATE
INDEX
,
/ EVALUATION
\-:
,/*S l
0
*
ESPONDENT'S
VOTE
N
= 827
RL=
,4713
(p
< .OO f )
N OT E : Figures
by
arrows are beta weights,
SOURCE:
Addagtcd
f rom
hlark
A.
Scbutman
and
Gerald brnpe r ,
"hriabitity
in
Electoral Behavior: Longitudinal Perspectives from
Causal &lodeling,"
Amerzcan jozar~talof Politic~al
~ie$?ce9
( f 975),
1-1 7.
Box
10.5
first presents the relationsl-rips betw een each
pair
of
variables.
It
tl-ren exp lores the rela tionship between tl-re dependen t
variable burnout) and each
of
the independen t varirtbles (race an d
education), Recatlirlg the four causal models presented earfier, we
can easily see tha t rnodel 1, independent causation,
is
not
a
possi-
bility, because the tw o independent variables (race an d education)
are strongly related. T he second set
of
tables jtrtrnout with educa-
tion, controlling foe race) wou ld test rnodel
2 ,
spurious correlation,
because it determines whether the relationship between the second
and third variables disappears when corztroiling
kjr
the first. Modet
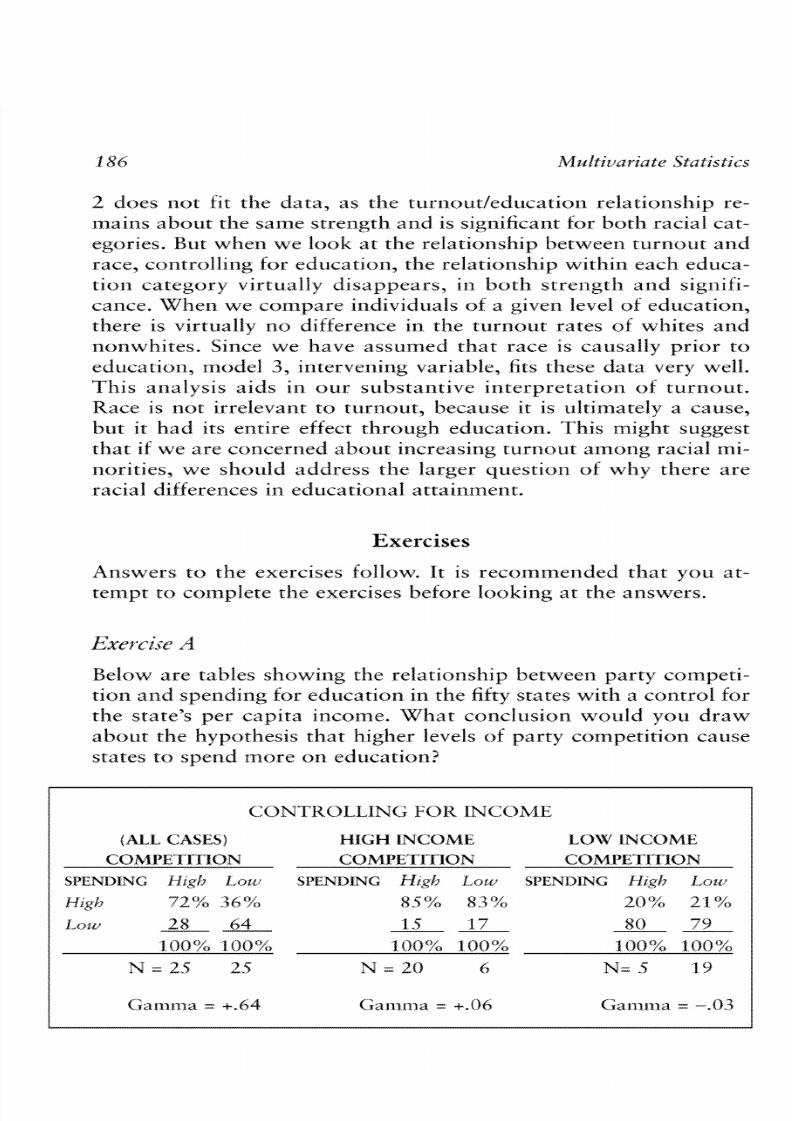
8/20/2019 Alan Monroe, Alan D. Monroe-Essentials of Political Research (2000)
http://slidepdf.com/reader/full/alan-monroe-alan-d-monroe-essentials-of-political-research-2000 201/214
2,
does not fit the data, as the turnoutleducation relationship re-
mains abou t the same strength and is significant for both racial cat-
egories. But when we look at the relationship between turnout and
race, controlling for education, the relationship within each educa-
tion category virtually disappears,
in
both strengeh and signifi-
cance. W hen we com pare individuals
of
a given level
of
education,
there is virtually no difference
in
the turnout rates of whites and
nonw hites . Since we l-rave assumed th a t race
i s
causally prior to
education, model 3, intervening variable, fits these data very well,
This analysis aids in our substartt ive interpretation of: turnout ,
Race is not irrelevant to turxlout, because it is ultimately a cause,
but it had i t s entire effect tl-rrougk edu cation, T his might suggest
that
if
we are concerned a bou t increasing tu m ou t am ong racial
mi-
norities, we shsulct address the larger question of why there are
racial differences in educational attainment,
Exercises
Answers t o the exercises follow.
T t
is recom~nerided hat you at-
tempt t o complete the exercises before looking a t the answers.
Below are tables showing the relationship between party competi-
tion and spending Eor education in the
fifty
states with a con trol for
the state" per cap ita income. Wl-rat conc lusion wou ld you draw
about the hypotl-resis th at higher Levels of par ty com pe tition calrse
states to spend m ore o n education?
C:QNTRCILLING FOR ZNGCjM1t-i
(ALL
CASES)
HIGH
INCOME:
LOW
INCOME
COM PETITION COM PETITION COMPETITION
SLrEmMC
E-IlgI?
Lozv SL3EmIIPJG Hzgh Low S P E m I N G E-ItgI?
Low
H ~gi ? 72%
36% 85% 83%
20%
21%
1-ow
8
64
15 17
80 79
00% 100% 100% lot>% 100% 2110%
N
= 25
25 N
= 20
4
N = 5 19

8/20/2019 Alan Monroe, Alan D. Monroe-Essentials of Political Research (2000)
http://slidepdf.com/reader/full/alan-monroe-alan-d-monroe-essentials-of-political-research-2000 202/214
BOX
10.5 Using Contingency
Tables
for
Causal
Xnterprearion
Assuxnccl causal priority: Race, education, tu rn ou t
A. Tables
with
N o Controls
RACE
W R N O U T WC~ite
Non-whzte
\Toter
73%
50%
Non-voter 30 50
100% 100%
M = 1OIlO 4110
Garnlna
=
.40
Chi" 49.51 ( p c Wl)
Phi2
=
.C14
RACE
E u U c ~ T i Q r \ l
White Non-whzte
(JolEege
6 0 %
25'%
High
School
40 75
100% 100%
N
= 1,000 400
Gamma =
.63
Ghi"
140.00 (p< .001)
Phi" .1C)
EDUCATION
T U R N O U T College High School
Voter 7
2 0 29%
Ciamrma = .72
N ~ P z - v o
er
29 7
1 C:l-iiL = 257.14
(p
< ,001)
100% 1C)O% Phi" . l8
iJ =
700 700
B,
Turnout by Education,
C:antrolling
for
Race
WHITES
EDUCATION
High
T U R N O U T Collegre
School
Voter
72% 30%
70
on-voter
213
100% 100%
N = 600 400
NON-WHTES
EDUCATION
High
TURNOUT
g Schorjl
WO
ter 7Q1' 30%
Non-voter 70
100%
100%
is;i
=
100 300
Ciarnma = .71 Ciarnma = .68
ChtZ= 168.3.5 (p
<
.001)
Cht" 50.00 ( p < .001)
Phi2 = .17
Phi2
= .12

8/20/2019 Alan Monroe, Alan D. Monroe-Essentials of Political Research (2000)
http://slidepdf.com/reader/full/alan-monroe-alan-d-monroe-essentials-of-political-research-2000 203/214
6".
Tumour:
by
Raec,
Controllir~gor Education
COLLEGE HIGH SCHOOL
RACE
RACE
TUKNQm
W/?l'te Non-white TURNBUT
White
Non-whit@
Vc~ter
72% 70%
Voter 30%
30%
Nc11.t-voter
28 SO
P$ol.t-voter '7'0
70
100%
100% IOt7% 10OC%
N = 6 0 0
100
N = 400 300
The
best-fitting model
would look
like t l~is:
Below are tables showing the relatioilship between
a
responderrt's
approval rating
of
the president and his
or
her vote in the next elec-
tion with
a
control
far
the respondent"
party
identification. What
conclusion
would
you draw ab ou t the hypothesis tha t
people
who
approve
of
the president's pe rh rm an ce
in
office are
more likely
to
vote for
the
calldidate
af
the president" pa rty ?
(As
y o u
migl-rc
guess, the president in this example
was a
Democrat .) Data
are
from a survey using random sampling,
(ALL <:ASES)
C:ONTRCILLING FOR
PARTY
IDENTIFICTION
DEMOCRATS
APPROVm A P P R O V a
VOTE Approve
I>isappruve VOTE
Approve Disappfiwe
Demo, 80% 20% 90% 50%
R e j 1 ~ 6 ,
20
88
I
0
5 )
100% 100%
100%
100%

8/20/2019 Alan Monroe, Alan D. Monroe-Essentials of Political Research (2000)
http://slidepdf.com/reader/full/alan-monroe-alan-d-monroe-essentials-of-political-research-2000 204/214
Mzaltivariate
Statist ics
f 8 9
cot~tmussl
N
=
500
500
N
=
200
100
1,arnbda =
.Q0
I,alnbda =
.Q9
Ciarnma
= +.88
(iarnma
=
c.80
Chi
= 680.00 (p
< .a01
Cht =
61.43
(p
< .a01
Phib
68
Phi
L
20
REPIJBHCANS INDEPENDENTS
APPROVAL
APPROVAL
VOTE
Approve
Disapprove Approve t)&ap prave
L3emo. 6 0 %
10%
VOTE
80% 15%
1,ambcfa = .25
1,ambda =
.63
Gamma = +.86
Gamma =
+.86
Czkih 3.22 (p
.: .ifQlf
Czl-rih
69.42
(p : .Q01
1%
G .28
1% G .42
Below
is
a matrix of Pearson's r data on a r a r z d o ~ ~ample of f i fty
nations that were a11 a t some time in the past under the csntrsl
of
a colonial power, The variables a re the number of years since inde-
pende~lce,ew no m ic developmellt (m easure d as per capita
GDP),
and
political instability Measured
as
the re la tive n u r ~ b e r
f
"irreg-
tilar executive transfers" fiat have occurred
in
the nation, Using
the co rrelations
in
the matrix;
1. Calct~iatehe partial correlation between instability and de-
velopment, controlling for years since independence
(r,,l,, .
Use the F-test t o determ ine significance,
2. Calculate the partial correlation between instability and
years
since independence, cantrolling fur development
( r tYd) .Use the F-test to determine significance.

8/20/2019 Alan Monroe, Alan D. Monroe-Essentials of Political Research (2000)
http://slidepdf.com/reader/full/alan-monroe-alan-d-monroe-essentials-of-political-research-2000 205/214
3. Calculate the m ultiple correlation w ith instability as the de-
pendent variable wit11 development and years since inde-
pelldence as the independent variables. Use the F-test to
determ ine significance,
4.
Assuming tl-re causal priority years since independence, de-
velopm ent, instability3 determ ine the hest-fitting causal
model for these variables,
YEARS DEVELOPMENT
INSTABILITY
V
I>
I
Ueam
yl)
1.00 ,34
-.
52
Suggested Answers to Exercises
When we loc>kat all the states, there appears to be a fairly strong
posit ive relat ionship between party cs~~peti t ionnd spending on
educacian, that is, states with high competition are
more
likely to
be s ta tes wi th high v e n d in g than s ta tes wi th low compet it ion.
However, when we control for states>er c q i t a income, the rela-
tionsl-rip alm ost com pletely disappears. This indicates that the reia-
tionship between cc~ m petition nd spending was due to the effect of
income a nd tha t these two variables d o x~o t ffect each other.
When we
look
a t
all
respondents, w e see tha t the re is a stro ng an d
significant relationship between approval and the vote, that
is,
those w ho a pp ro w d of presidential performance voted Democra-
tic, and those who disapproved voted Republican, When we con-
trol for the respondent" par ty identification, the relationsh ip re-
mains stro ng and significant within each gro up
of
party identifiers.
Therefore, we c m co l~c lnd e ha t presidetitial approval does affect
voting in the next election, N ote th at (as you ca n tell h orn the N's
in the control tables) party is related tc, bo th variaMes, Democra tic
identifiers are more likely to approve
of
presider~tiaiperformance

8/20/2019 Alan Monroe, Alan D. Monroe-Essentials of Political Research (2000)
http://slidepdf.com/reader/full/alan-monroe-alan-d-monroe-essentials-of-political-research-2000 206/214
Mzaltivariate Statist ics f 91
a n d are more likely to vote
for the Democratic
candidate, But the
effect of
approval
is clear even
within
the party identification cat-
F 3.
3.21, so p c OS. This partial is
significant.
F
;> 3-2 , so p .r .OS,
This
partial is significant.

8/20/2019 Alan Monroe, Alan D. Monroe-Essentials of Political Research (2000)
http://slidepdf.com/reader/full/alan-monroe-alan-d-monroe-essentials-of-political-research-2000 207/214
Mode1 1 Made1
2 Made
3 Model 4
T h e test for m d e l
2 ,
independent causation, is whether the
simple Pearson co rrelation between years since ixldepe~iderlce nd
development
is zero. As
the in atrix show s, rd,
= -34
(and a n F-test
shows that this is significant at the .Q5 evel),
Therefore,
model
1
does no t apply.
The test
for
model
2,
spurious correlation, is wketl-rer th e par-
tial correlation between instability and development, controlling
for years since independence,
is
zero.
As.
the calculations in ques-
t ion
1
above
show,
r,&,
= -.71
a n d
i t is
significant. Therefore,
model
2
does n ot apply,
8/20/2019 Alan Monroe, Alan D. Monroe-Essentials of Political Research (2000)
http://slidepdf.com/reader/full/alan-monroe-alan-d-monroe-essentials-of-political-research-2000 208/214
Mzaltivariate Statist ics f
93
Th e test for model 3, intervening variable, is whether the partial
correlation between instability and years since independence, con-
trolling
for
development, is zero. As the calculations
in
question
2
above show, r,,:, = -.42 and it is significant. Therefore, model 3
does not apply.
Since the data fail to meet any of the tests for the first three
mtrdels, we conclude tha t
model il,
complete ca~zsation,
s
the most
applicable. Bottl years since independence an d econaxnic dev elr~p-
ment
(which
are themselves interrelated) have
a
direct effect on
political instability,

8/20/2019 Alan Monroe, Alan D. Monroe-Essentials of Political Research (2000)
http://slidepdf.com/reader/full/alan-monroe-alan-d-monroe-essentials-of-political-research-2000 209/214
This page intentionally left blank
8/20/2019 Alan Monroe, Alan D. Monroe-Essentials of Political Research (2000)
http://slidepdf.com/reader/full/alan-monroe-alan-d-monroe-essentials-of-political-research-2000 210/214
References
Alxner, Ennis C. 2000, Statistical Tricks and Traps, Los Angeles:
Pyrczak Pu blishing.
Ansolahehere, Stephen, et al, 19 94 . "h o es Attack A dvertising
De-
mobilize the EIectorate?" American Political Science Review 88:
829-838.
Bereison, Bernard. 19";;". Con ten t Analysis in Cr>mm uilicatioil Re-
search, Mew York: Hafner.
Bfaiock, Huberr:
M.
1962, ""Four-Variable Causal Models and Par-
tial Correlations," American Journal of' Sociology 68: 182-194,
510-512,
--
S 1964. Causal Inferences in Nonexperixnentd Research.
Chapel I-fill:University
of
North Carolina Press.
Cutright, Phillips, 1963. ""Measuring the Impact
of
Local Party
Ac-
tivity a n th e G eneral Election Vote,"
Pubtic
Opinion QtiarterIy
2 ;7 372-3861,
Edwards, Ceorge C.
2983.
The Public Presidency New York: Sr.
Martin's.
Graber, Doris A. 1988. Processing the News, 2d ed, New Yark:
1,oxigman.
Huff,
Darrell. 1954.
How
to Lie wi th Statistics. New York:
W
W.
Norton,
Katz,
Daniel, a n d Sarr.luel J , Eldersveld, ()T he Im pact
of
Party Ac-
tivity a n the Electorate," h b f l c O pinion Quarterly
25:
1-24.
Kramer, Geratd
H.
1970, "The Impact
u l
Party Activity on the
Electorate," PPulzlic Opirtio~iQuarterly 34:
560-572.
M onroe, Alan D.
1977.
'TJrbt~ nism nd Voter Turnout: A Mote o n
Some Unexpected Findings,"
Americican Journal of Political Sci-
erice
21: 71-81.
--
.
1 9 9 8 , ""Public O p in io n a nd Pu blic Policy,
1
980-1 9939'a
Pul-tlic O p in ir ~ nQuarterly, 62: 6-28.

8/20/2019 Alan Monroe, Alan D. Monroe-Essentials of Political Research (2000)
http://slidepdf.com/reader/full/alan-monroe-alan-d-monroe-essentials-of-political-research-2000 211/214
Mueller, Jo hn E.
1973. War,
Prestde~ztj,
nd PubEic
Opinio~z. ew
York: WiXey.
North, Robert C,, et
al.,
1963. Content Analysis: A Elandlsr>ok
with Applications for the Study
of
international Crisis .
Evanston, IL: Northwestern University 13ress.
Page, Benjamin I., and Robert Shapiro.
1983.
"Effects
of
Public
Opin ion
o n
Policy," American Political Science Review
77:
1071-1089.
Patterson, Thomas
E.
1980. The mass IVedia Election, New York:
Praeger.
Pomper, Gerald
M,,
with Susan S. Lederman.
1980.
Electiolls
in
America, 2d ed. Mew York: Longman,
Robinson, Michael J., and ~Margaret
A.
Sheehan. 1983. Over the
Wire and
trrr TV. N e w York: RrrsselI Sage,
Schufman, Mark A., a d Gerald M. Pomper, 1975, "kr iab i l i ty in
Electoral Behavior: Longitudinal Perspectives from Causal Mod-
elirtg," Arnerican Journal
of
Political Science 2 l : 1 1 8.
Scott, Gregory
M.,
and
Stephen
M.
Garrison.
1998.
Th e Student
Politicat Science Writer" ~ V a nua l , d ed, Upper Saddte River, NJ:
Prentice Hall,
nlf te , Edward R. 1983.
The
Visual Display of Q~~ancicativenlor-
mation. Cheshire, CT: Graphics Press.
Wallgren,
Anders,
et
al. 1996.
Graph ing Statistics and Data:
Crest-
ing Better Charts. Thousand Oaks, CA: Sage Publications.
Wolfinger, Raymond
E.,
and Steven J. Rosenstone.
1980.
W h o
Wjtes? New haver^: Yale University Press.

8/20/2019 Alan Monroe, Alan D. Monroe-Essentials of Political Research (2000)
http://slidepdf.com/reader/full/alan-monroe-alan-d-monroe-essentials-of-political-research-2000 212/214
Index
Abramson, Paul R.,
1
1 1
Aldrich, John H., 1
1
1
Almer, Ennis
C.
1
1 0
Analytical sentences, 4
Ansolabehere, Stephen, 44
Balachandran,
IV.,
56
Balachax~dran, ,, 56
Bar chart, 106-108
Bar one, LVichael, 65
Bereison, Bernard, 5 8
Beta weight, 177-1 78
Bibby3John E, 5.5
Btaiock Hube rt M,, 182
Burnhaxn, W alrer D,, 56
Captive population, 72
Causaiiry,
31-32.
178
Causal modeling, 178-190
Case study,
43
Chi-square, 101,124-3 32
Cluster sample, 70
Congressional data sources,
54-56
Co nten t Analysis, 5
8-64
Contingency
tables, 92-93,
159-166,182-186
Controll variable, 21-22,
4 0 4 3 , 159-1166,167-173
Cook, Rl-rodes M,, 107, 10 8
Coplin, William
D,,
5 4
Cramer"
V,
101, 132-134
Cutright, Philiips, 46
Data,
47
Demographic data sources,
52-54
Dichotomy,
87
Difference
of
means test, 101,
151
Ecological fallacy322, 24, 49
Edwards, George
C.,
5 7
Eldersveld, Samuel
J., 46
Electicjn return sources, 56-57
Empirical sentences, 2, 3-8
Eta, 101, 1 5 1
Exit poll, 71
Explanation, 3
Experimental design, 32-37
Factorial design, 3 7
Fisher, Rona'id
A.,
149, 175
F-test, 101, 146-149, 169-17.5,
1
76-3
7 7
Gamma, 122-124
Garrison, Cregory
M.,
5 1
Carwood, Alfred
N.,
56
Generaliizations,
2,
3
Goldstein,
Joshua, 55
Craber, Doris A., 64
Graphics, principles
for,
i
3.--1.55
8/20/2019 Alan Monroe, Alan D. Monroe-Essentials of Political Research (2000)
http://slidepdf.com/reader/full/alan-monroe-alan-d-monroe-essentials-of-political-research-2000 213/214
Index
Graph ics, problems with,
109-1 l 2
Elastings, Elizabeth H an n, 5 7
Hastings, Phillip K.,
57
Hovey, Harold A. S6
Elovery, Kendra A., 56
Huff, Darrell, 109
Hypothesis, 12, 17-20
Interaction, 184
Inrternational data sources,
52-33
Internet sources, 48, S1, 52,
53,
56, 58
Intersubjective t e s th il it 5 2
Interval variable, 85
Intervening variable,
1
8 0
Interviewing, 71-72
Janda, Kenneth, 54
Jodice, David
A,,
5 4
Katz, Daniel, 46
Kendall's Tau
B,
101, 124
Kendall's T a u C, 181
Kramer, Cerald
H.,
46
Lambda, 101, 117-120,
121-122
Level of measurement,
83-89
Line graph, 108-189
Local data sources, 56
McGilfivray, AIice
V,
187,
1 0 8
~Vackie,Tbomas X, 5 4
Mackinson, Larry, 5 5
Mait survey, 72
~Vean ,
90
Median, 90.-9 2
IVode, 91
Mt~nroe ,
AIan D.,
42, 57
M organ , K atkleen
O,,
5 3 , 5 6
IVueller, John E,, 57'
Multiple R, 173-1 77
M ultivariate statistics,
98-1
Q 1
Natural experiment,
See
Q t~asi-expe riinentat esign
Niemi, Ricbard G., 5 4
Nominai variabie, 83-.-84
Noniinear relationship,
147-149,151
Normative sentence,
2, 3-8
North, Robert
C,, S9
O' Lear)i Michael K., 5 4
Opera tiona l definition,
1
8-1
9,
23-28
Ordinal variable, 84-85
Ornstein, Norman J,,
S5
Page, Benjamin I,, 57
Partial correlation,
1
67-1 n3,
179-1 82
Patterson, Thornas
E.,
59,
64
Pearsun's
r,
101,
1
44-147
Personal interview, 71
Phi, 101, 130-232
Pie chart, 106
Pomper, Gerald IV., 59,
60"-6
,
64, 1
82
Prediction,
3
Quasi-experime~ita design,
37-40
Ragsdaie,
Lyn,
56,
6 4
Ra ndom digit Qialing, 70
Ran dom sample, 68-70
Range,
9 1-92
8/20/2019 Alan Monroe, Alan D. Monroe-Essentials of Political Research (2000)
http://slidepdf.com/reader/full/alan-monroe-alan-d-monroe-essentials-of-political-research-2000 214/214
Recording unit, 60-6 1
Regression, 14
1-145
Research desigil, 12,
31-43
Research problem. See
Research question
Research question,
8-1
l
Rhode, %>avid
W., 111
Rubinson, ~Vichael
, ,
5 9
Rose, Richard, S4
Rosenstone, Sreven
J.,
22
Standardization, 26, 49,
112-113
ft-anley, Haro ld W*,S4
Statistic, 90
State data sources,
56
f tirvey data sources, 57-58
Survey items, 73-78
Survey research, 67-78
Tau
B,
1 0 1
Taylor, Charles
L.,
S4
Theoretical role
of
variables,