Alamos corporate presentation april 9 2015 final
30
April 2015 Corporate Presentation
-
Upload
alamosgoldinc -
Category
Business
-
view
281 -
download
0
Transcript of Alamos corporate presentation april 9 2015 final
April 2015 Corporate Presentation
Cautionary Notes
No stock exchange, securities commission or other regulatory authority has approved or disapproved the information contained herein.
Certain statements in this presentation are “forward-looking statements”, including within the meaning of the United States Securities Exchange Act of 1934, as amended. All statements other than statements of historical fact included in this presentation, including without limitation statements regarding forecast gold production, gold grades, recoveries, waste-to-ore ratios, total cash costs, potential mineralization and reserves, exploration results, and future plans and objectives of Alamos, are forward-looking statements based on forecasts of future operational or financial results, estimates of amounts not yet determinable and assumptions of management that involve various risks and uncertainties. Any statements that express or involve discussions with respect to predictions, expectations, beliefs, plans, projections, objectives, assumptions or future events or performance (often, but not always, using words or phrases such as “expects” or “does not expect”, “is expected”, “anticipates” or “does not anticipate”, “plans”, “estimates” or “intends”, or stating that certain actions, events or results “may”, “could”, “would”, “might” or “will” be taken, occur or be achieved) are not statements of historical fact and may be “forward-looking statements.” Alamos cautions that forward-looking information involves known and unknown risks, uncertainties and other factors that may cause Alamos's actual results, performance or achievements to be materially different from those expressed or implied by such information, including, but not limited to, gold and silver price volatility; fluctuations in foreign exchange rates and interest rates; the impact of any hedging activities; discrepancies between actual and estimated production, between actual and estimated reserves and resources or between actual and estimated metallurgical recoveries; costs of production; capital expenditure requirements; the costs and timing of construction and development of new deposits; and the success of exploration and permitting activities. In addition, the factors described or referred to in the section entitled “Risk Factors” in Alamos' Annual Information Form for the year ended December 31, 2014, which is available on the SEDAR website at www.sedar.com, should be reviewed in conjunction with the information found in this presentation. Although Alamos has attempted to identify important factors that could cause actual results, performance or achievements to differ materially from those contained in forward-looking information, there can be other factors that cause results, performance or achievements not to be as anticipated, estimated or intended. There can be no assurance that such information will prove to be accurate or that management’s expectations or estimates of future developments, circumstances or results will materialize. Accordingly, readers should not place undue reliance on forward-looking information.
Note to U.S. Investors
Alamos prepares its disclosure in accordance with the requirements of securities laws in effect in Canada, which differ from the requirements of U.S. securities laws. Terms relating to mineral resources in this presentation are defined in accordance with National Instrument 43-101 – Standards of Disclosure for Mineral Projects under the guidelines set out in the Canadian Institute of Mining, Metallurgy, and Petroleum Standards on Mineral Resources and Mineral Reserves. The United States Securities and Exchange Commission (the “SEC”) permits mining companies, in their filings with the SEC, to disclose only those mineral deposits that a company can economically and legally extract or produce. Alamos may use certain terms, such as “measured mineral resources”, “indicated mineral resources”, “inferred mineral resources” and “probable mineral reserves” that the SEC does not recognize (these terms may be used in this presentation and are included in the public filings of Alamos, which have been filed with the SEC and the securities commissions or similar authorities in Canada).
Cautionary non-GAAP Measures and Additional GAAP Measures
Note that for purposes of this section, GAAP refers to IFRS. The Company believes that investors use certain non-GAAP and additional GAAP measures as indicators to assess gold mining companies. They are intended to provide additional information and should not be considered in isolation or as a substitute for measures of performance prepared with GAAP.
Additional GAAP measures that are presented on the face of the Company’s consolidated statements of comprehensive income include “Mine operating costs”, “Earnings from mine operations” and “Earnings from operations”. These measures are intended to provide an indication of the Company’s mine and operating performance. “Cash flow from operating activities before changes in non-cash working capital” is a non-GAAP performance measure that could provide an indication of the Company’s ability to generate cash flows from operations, and is calculated by adding back the change in non-cash working capital to “Cash provided by (used in) operating activities” as presented on the Company’s consolidated statements of cash flows. “Mining cost per tonne of ore” and “Cost per tonne of ore” are non-GAAP performance measures that could provide an indication of the mining and processing efficiency and effectiveness of the mine. These measures are calculated by dividing the relevant mining and processing costs and total costs by the tonnes of ore processed in the period. “Cost per tonne of ore” is usually affected by operating efficiencies and waste-to-ore ratios in the period. “Cash operating costs per ounce”, “total cash costs per ounce” and “all-in sustaining costs per ounce” as used in this analysis are non-GAAP terms typically used by gold mining companies to assess the level of gross margin available to the Company by subtracting these costs from the unit price realized during the period. These non-GAAP terms are also used to assess the ability of a mining company to generate cash flow from operations. There may be some variation in the method of computation of these metrics as determined by the Company compared with other mining companies. In this context, “cash operating costs per ounce” reflects the cash operating costs allocated from in-process and dore inventory associated with ounces of gold sold in the period. “Cash operating costs per ounce” may vary from one period to another due to operating efficiencies, waste-to-ore ratios, grade of ore processed and gold recovery rates in the period. “Total cash costs per ounce” includes “cash operating costs per ounce” plus applicable royalties. Cash operating costs per ounce and total cash costs per ounce are exclusive of exploration costs. “All-in sustaining costs per ounce” include total cash costs, exploration, corporate and administrative, share based compensation and sustaining capital costs. Non-GAAP and additional GAAP measures do not have a standardized meaning prescribed under IFRS and therefore may not be comparable to similar measures presented by other companies.
All figures in US$ unless otherwise indicated.
2
Cautionary Notes
3
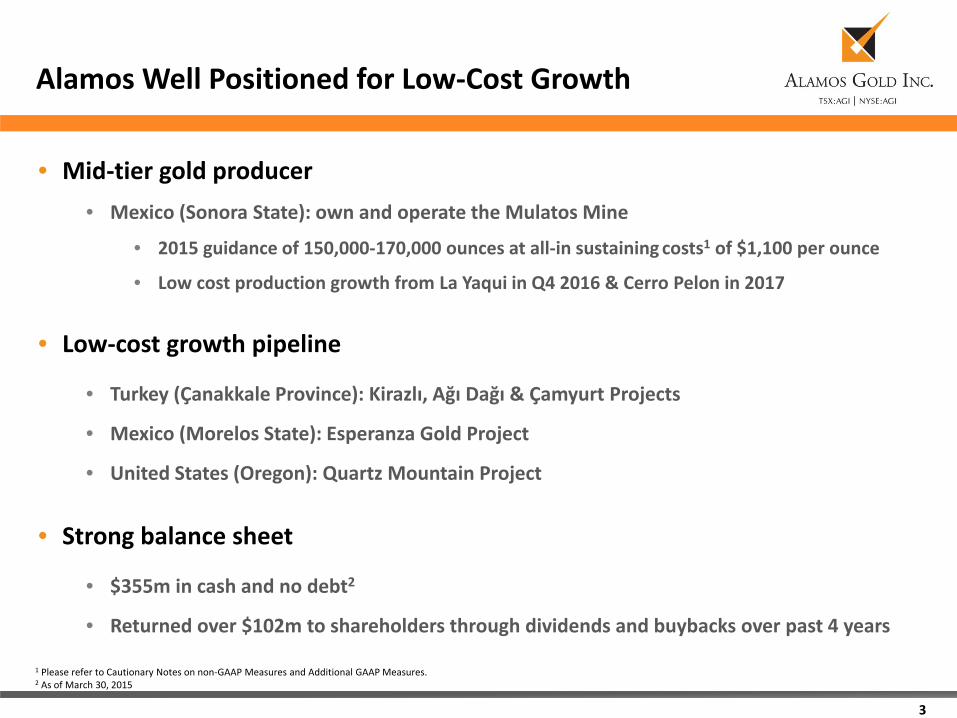
Alamos Well Positioned for Low‐Cost Growth
• Mid‐tier gold producer• Mexico (Sonora State): own and operate the Mulatos Mine
• 2015 guidance of 150,000‐170,000 ounces at all‐in sustaining costs1 of $1,100 per ounce
• Low cost production growth from La Yaqui in Q4 2016 & Cerro Pelon in 2017
• Low‐cost growth pipeline
• Turkey (Çanakkale Province): Kirazlı, Ağı Dağı & Çamyurt Projects
• Mexico (Morelos State): Esperanza Gold Project
• United States (Oregon): Quartz Mountain Project
• Strong balance sheet
• $355m in cash and no debt2
• Returned over $102m to shareholders through dividends and buybacks over past 4 years
1 Please refer to Cautionary Notes on non‐GAAP Measures and Additional GAAP Measures.2 As of March 30, 2015
4
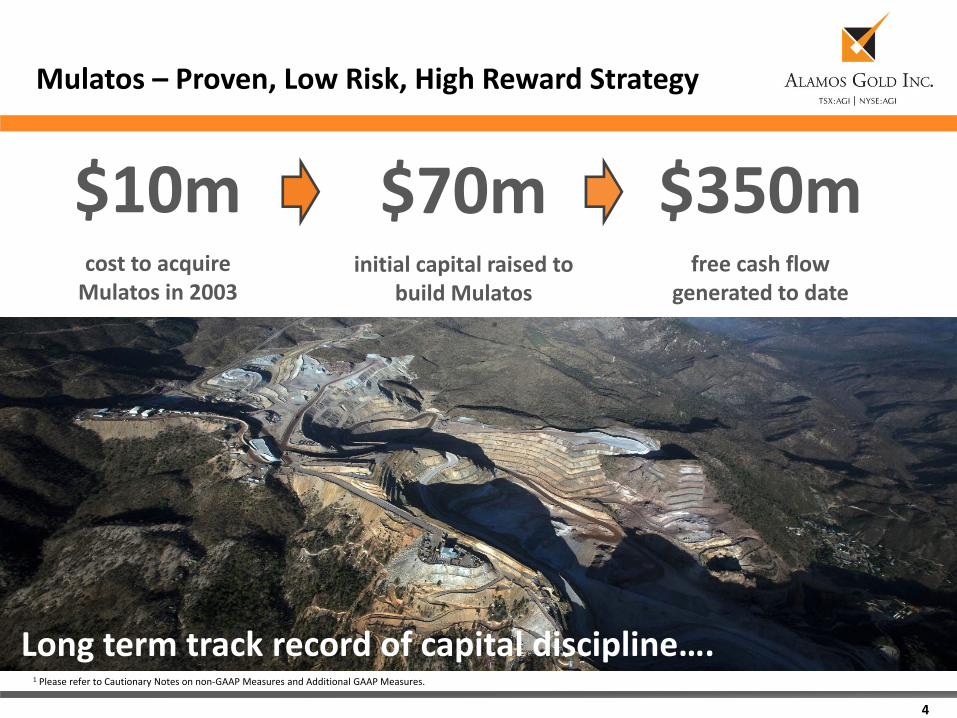
Mulatos – Proven, Low Risk, High Reward Strategy
$10mcost to acquire Mulatos in 2003
$350mfree cash flow
generated to date
$70minitial capital raised to
build Mulatos
Long term track record of capital discipline….1 Please refer to Cautionary Notes on non‐GAAP Measures and Additional GAAP Measures.
5
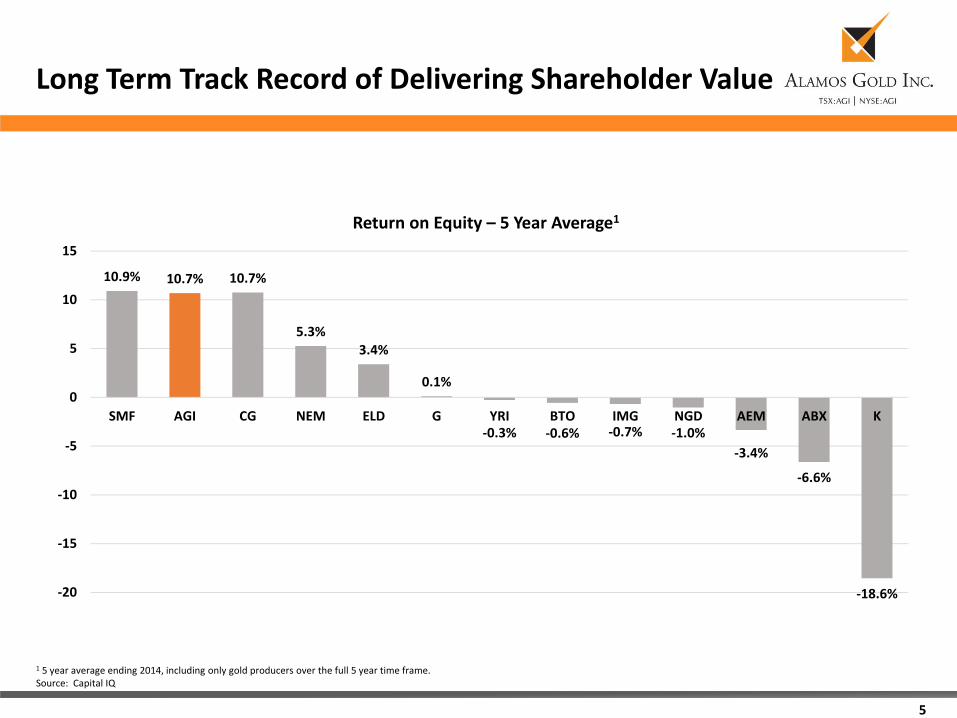
Long Term Track Record of Delivering Shareholder Value
1 5 year average ending 2014, including only gold producers over the full 5 year time frame.Source: Capital IQ
10.9% 10.7% 10.7%
5.3%3.4%
0.1%
‐0.3% ‐0.6% ‐0.7% ‐1.0%‐3.4%
‐6.6%
‐18.6%‐20
‐15
‐10
‐5
0
5
10
15
SMF AGI CG NEM ELD G YRI BTO IMG NGD AEM ABX K
Return on Equity – 5 Year Average1
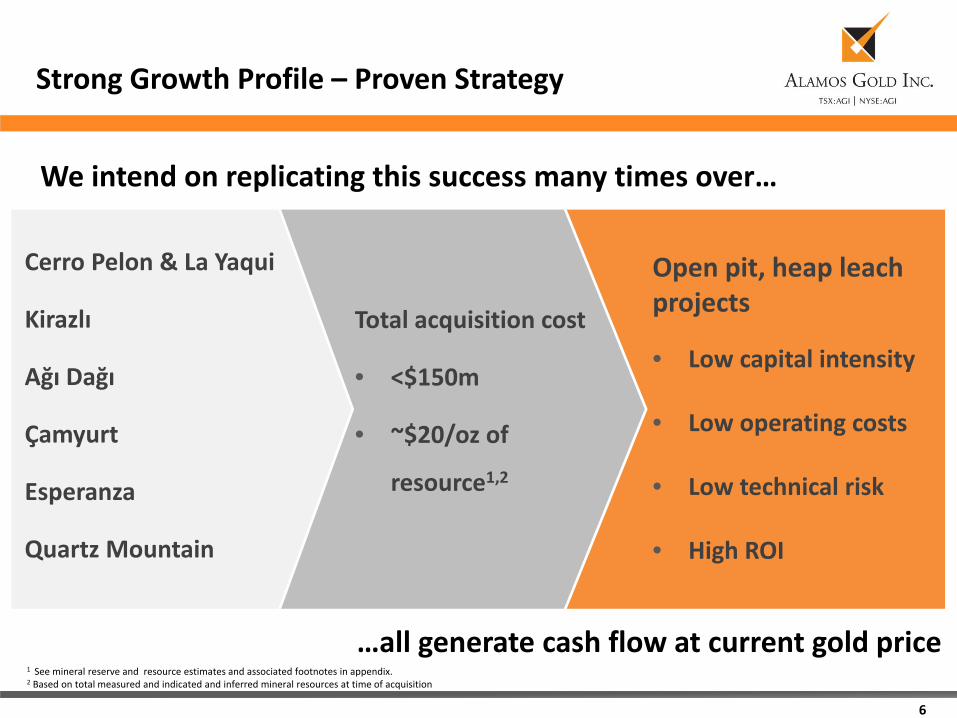
We intend on replicating this success many times over…
6
Strong Growth Profile – Proven Strategy
Open pit, heap leach projects
• Low capital intensity
• Low operating costs
• Low technical risk
• High ROI
Cerro Pelon & La Yaqui
Kirazlı
Ağı Dağı
Çamyurt
Esperanza
Quartz Mountain
Total acquisition cost
• <$150m
• ~$20/oz of
resource1,2
…all generate cash flow at current gold price1 See mineral reserve and resource estimates and associated footnotes in appendix.2 Based on total measured and indicated and inferred mineral resources at time of acquisition
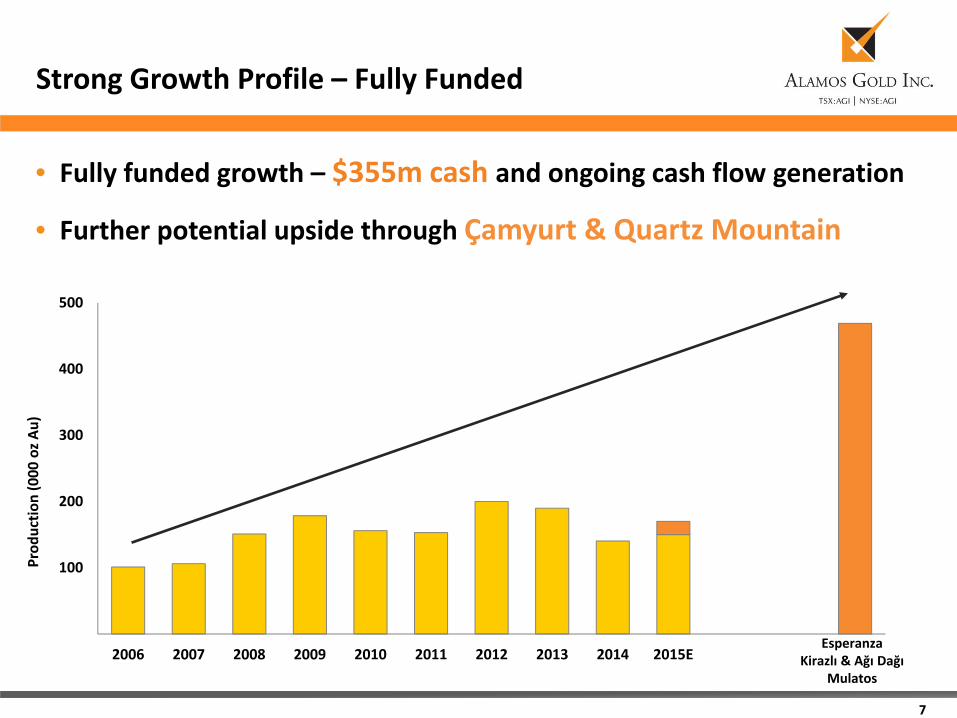
• Fully funded growth – $355m cash and ongoing cash flow generation
• Further potential upside through Çamyurt & Quartz Mountain
7
Strong Growth Profile – Fully Funded
EsperanzaKirazlı & Ağı Dağı
Mulatos
0
100
200
300
400
500
2006 2007 2008 2009 2010 2011 2012 2013 2014 2015E
Prod
uctio
n (000
oz A
u)
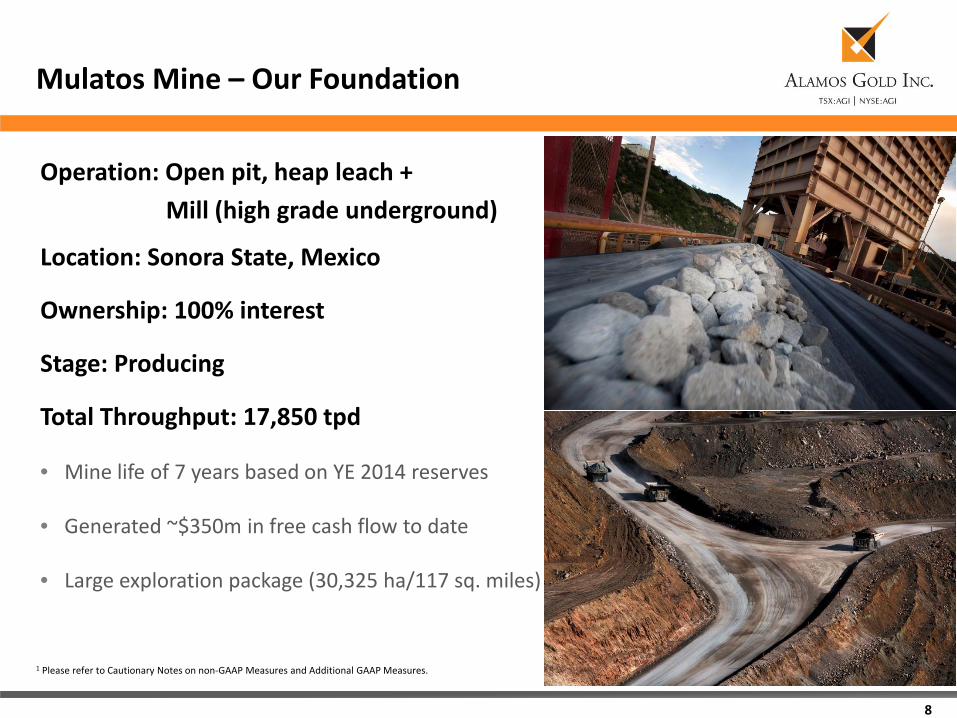
Operation: Open pit, heap leach +Mill (high grade underground)
Location: Sonora State, Mexico
Ownership: 100% interest
Stage: Producing
Total Throughput: 17,850 tpd
• Mine life of 7 years based on YE 2014 reserves
• Generated ~$350m in free cash flow to date
• Large exploration package (30,325 ha/117 sq. miles)
8
Mulatos Mine – Our Foundation
1 Please refer to Cautionary Notes on non‐GAAP Measures and Additional GAAP Measures.
9
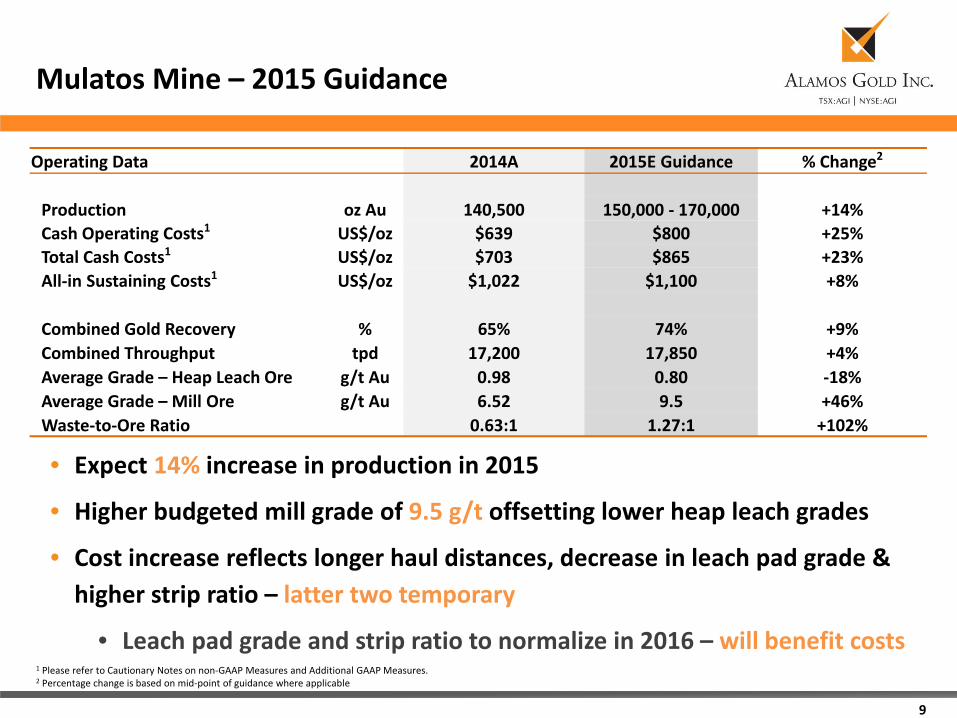
Mulatos Mine – 2015 Guidance
• Expect 14% increase in production in 2015
• Higher budgeted mill grade of 9.5 g/t offsetting lower heap leach grades
• Cost increase reflects longer haul distances, decrease in leach pad grade & higher strip ratio – latter two temporary
• Leach pad grade and strip ratio to normalize in 2016 – will benefit costs
Operating Data 2014A 2015E Guidance % Change2
Production oz Au 140,500 150,000 ‐ 170,000 +14%Cash Operating Costs1 US$/oz $639 $800 +25%Total Cash Costs1 US$/oz $703 $865 +23%All‐in Sustaining Costs1 US$/oz $1,022 $1,100 +8%
Combined Gold Recovery % 65% 74% +9%Combined Throughput tpd 17,200 17,850 +4%Average Grade – Heap Leach Ore g/t Au 0.98 0.80 ‐18%Average Grade – Mill Ore g/t Au 6.52 9.5 +46%Waste‐to‐Ore Ratio 0.63:1 1.27:1 +102%
1 Please refer to Cautionary Notes on non‐GAAP Measures and Additional GAAP Measures.2 Percentage change is based on mid‐point of guidance where applicable
10
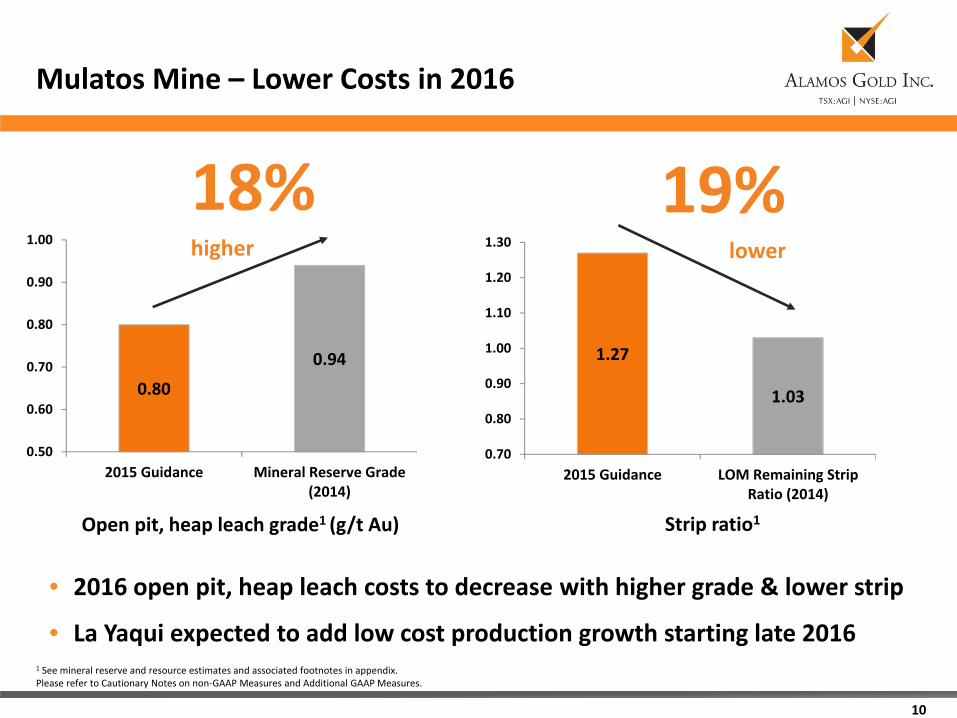
Mulatos Mine – Lower Costs in 2016
• 2016 open pit, heap leach costs to decrease with higher grade & lower strip
• La Yaqui expected to add low cost production growth starting late 20161 See mineral reserve and resource estimates and associated footnotes in appendix.Please refer to Cautionary Notes on non‐GAAP Measures and Additional GAAP Measures.
0.80
0.94
0.50
0.60
0.70
0.80
0.90
1.00
2015 Guidance Mineral Reserve Grade(2014)
18% higher
Open pit, heap leach grade1 (g/t Au)
1.27
1.03
0.70
0.80
0.90
1.00
1.10
1.20
1.30
2015 Guidance LOM Remaining StripRatio (2014)
Strip ratio1
19% lower
11
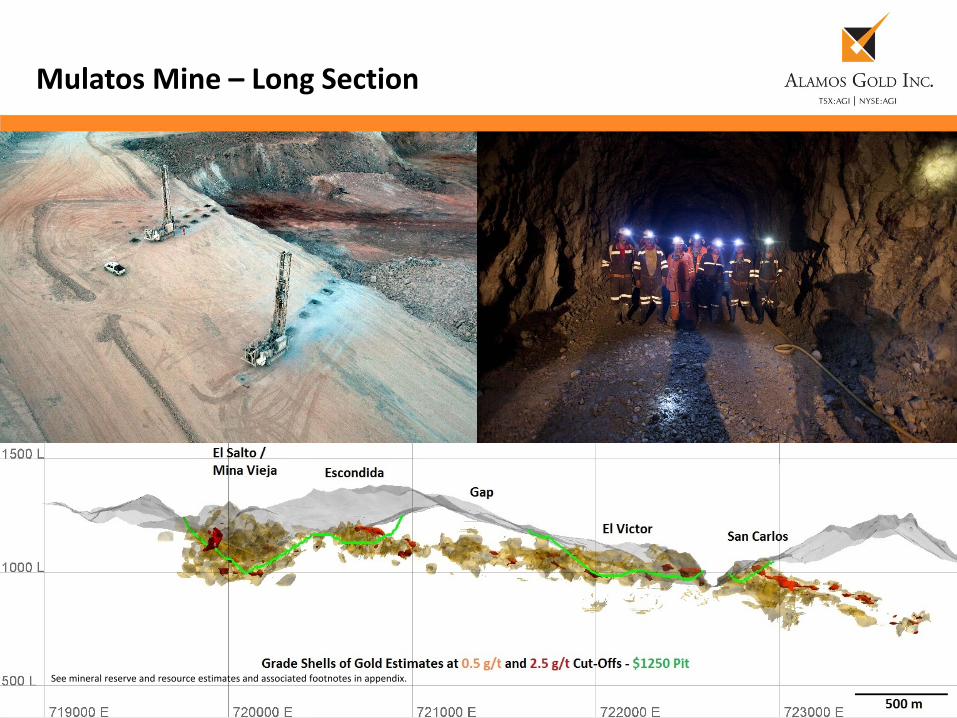
Mulatos Mine – Long Section
See mineral reserve and resource estimates and associated footnotes in appendix.
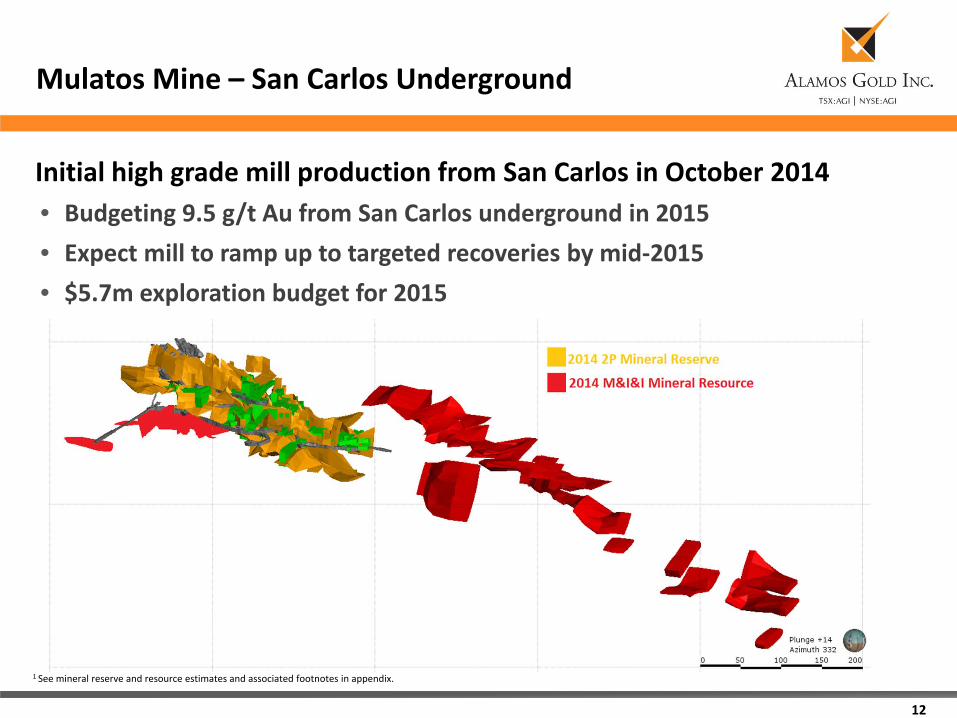
• Budgeting 9.5 g/t Au from San Carlos underground in 2015• Expect mill to ramp up to targeted recoveries by mid‐2015• $5.7m exploration budget for 2015
12
Mulatos Mine – San Carlos Underground
1 See mineral reserve and resource estimates and associated footnotes in appendix.
Initial high grade mill production from San Carlos in October 2014
13
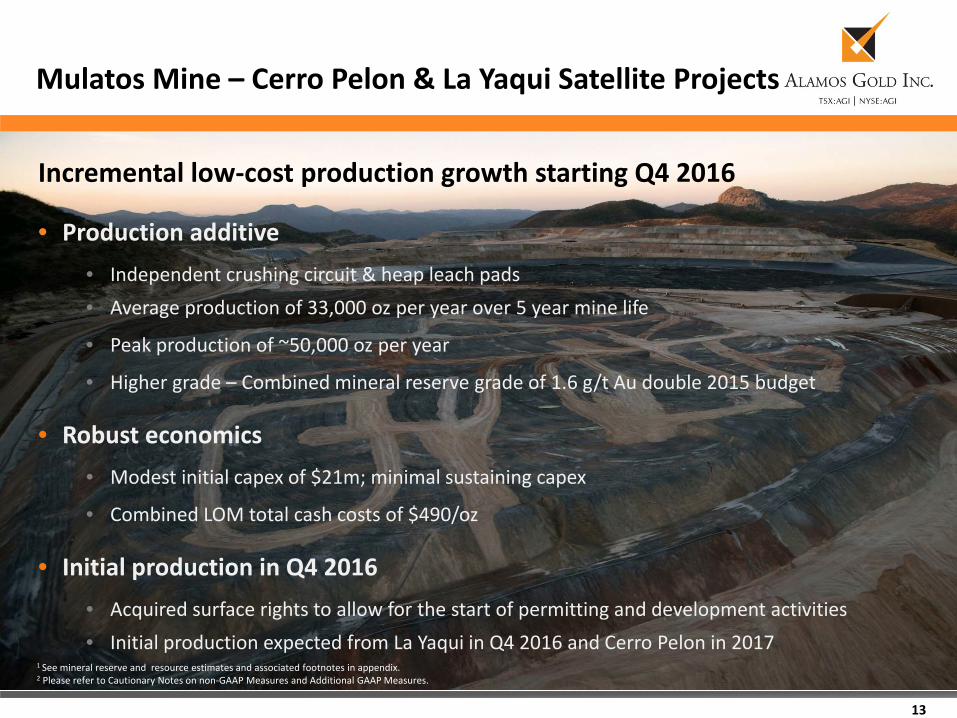
Mulatos Mine – Cerro Pelon & La Yaqui Satellite Projects
Incremental low‐cost production growth starting Q4 2016
• Production additive• Independent crushing circuit & heap leach pads• Average production of 33,000 oz per year over 5 year mine life
• Peak production of ~50,000 oz per year
• Higher grade – Combined mineral reserve grade of 1.6 g/t Au double 2015 budget
• Robust economics• Modest initial capex of $21m; minimal sustaining capex
• Combined LOM total cash costs of $490/oz
• Initial production in Q4 2016• Acquired surface rights to allow for the start of permitting and development activities• Initial production expected from La Yaqui in Q4 2016 and Cerro Pelon in 2017
1 See mineral reserve and resource estimates and associated footnotes in appendix.2 Please refer to Cautionary Notes on non‐GAAP Measures and Additional GAAP Measures.
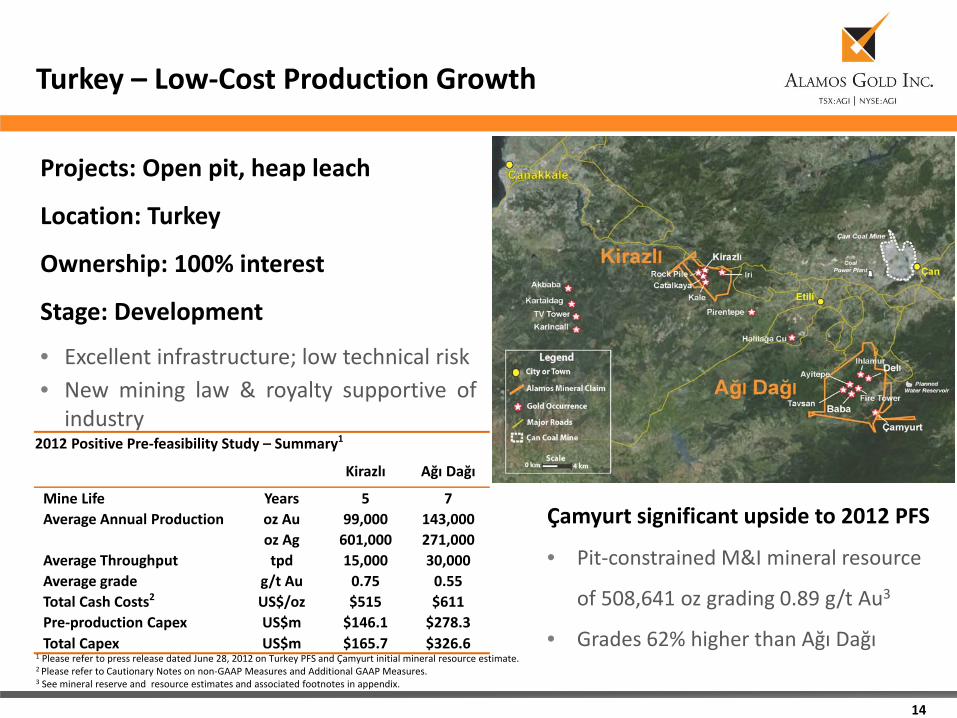
Projects: Open pit, heap leach
Location: Turkey
Ownership: 100% interest
Stage: Development
• Excellent infrastructure; low technical risk• New mining law & royalty supportive ofindustry
14
Turkey – Low‐Cost Production Growth
1 Please refer to press release dated June 28, 2012 on Turkey PFS and Çamyurt initial mineral resource estimate. 2 Please refer to Cautionary Notes on non‐GAAP Measures and Additional GAAP Measures.3 See mineral reserve and resource estimates and associated footnotes in appendix.
Çamyurt significant upside to 2012 PFS
• Pit‐constrained M&I mineral resource
of 508,641 oz grading 0.89 g/t Au3
• Grades 62% higher than Ağı Dağı
2012 Positive Pre‐feasibility Study – Summary1
Kirazlı Ağı Dağı
Mine Life Years 5 7Average Annual Production oz Au 99,000 143,000
oz Ag 601,000 271,000Average Throughput tpd 15,000 30,000Average grade g/t Au 0.75 0.55Total Cash Costs2 US$/oz $515 $611 Pre‐production Capex US$m $146.1 $278.3 Total Capex US$m $165.7 $326.6
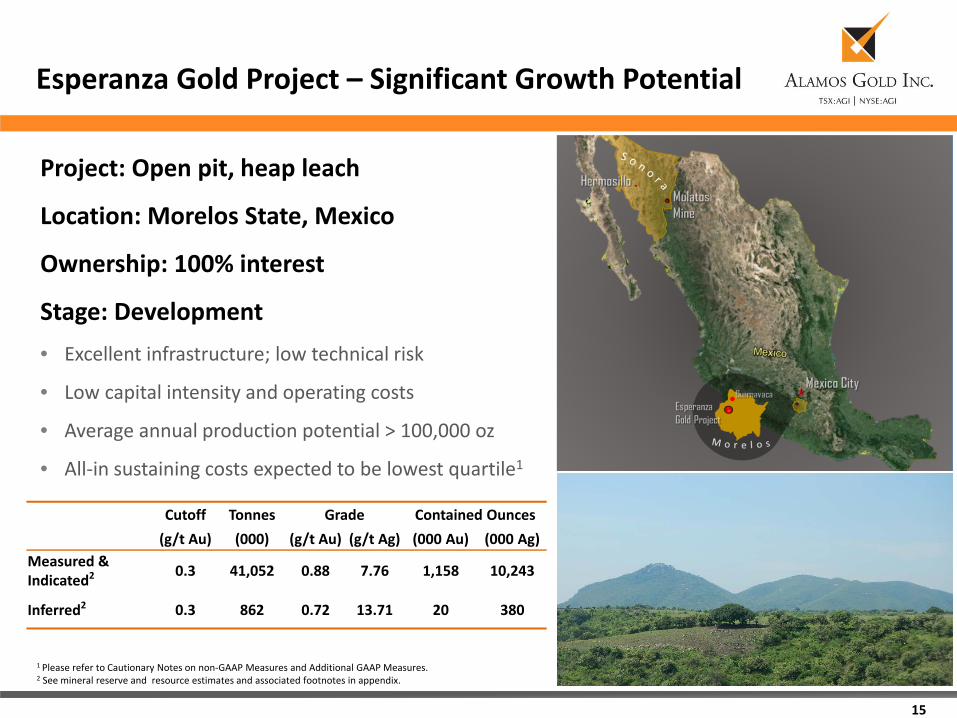
Project: Open pit, heap leach
Location: Morelos State, Mexico
Ownership: 100% interest
Stage: Development• Excellent infrastructure; low technical risk
• Low capital intensity and operating costs
• Average annual production potential > 100,000 oz
• All‐in sustaining costs expected to be lowest quartile1
15
Esperanza Gold Project – Significant Growth Potential
Cutoff Tonnes Grade Contained Ounces(g/t Au) (000) (g/t Au) (g/t Ag) (000 Au) (000 Ag)
Measured & Indicated2 0.3 41,052 0.88 7.76 1,158 10,243
Inferred2 0.3 862 0.72 13.71 20 380
1 Please refer to Cautionary Notes on non‐GAAP Measures and Additional GAAP Measures.2 See mineral reserve and resource estimates and associated footnotes in appendix.
Quartz Butte
Crone Hill
16
Quartz Mountain Property – Compelling Opportunity
1 See mineral reserve and resource estimates and associated footnotes in appendix.2 Historic column recovery tests for gold at Quartz Mountain varied between 74% and 88% for the felsic rock hosted mineralization; see Orsa Ventures press release dated February 12, 2013
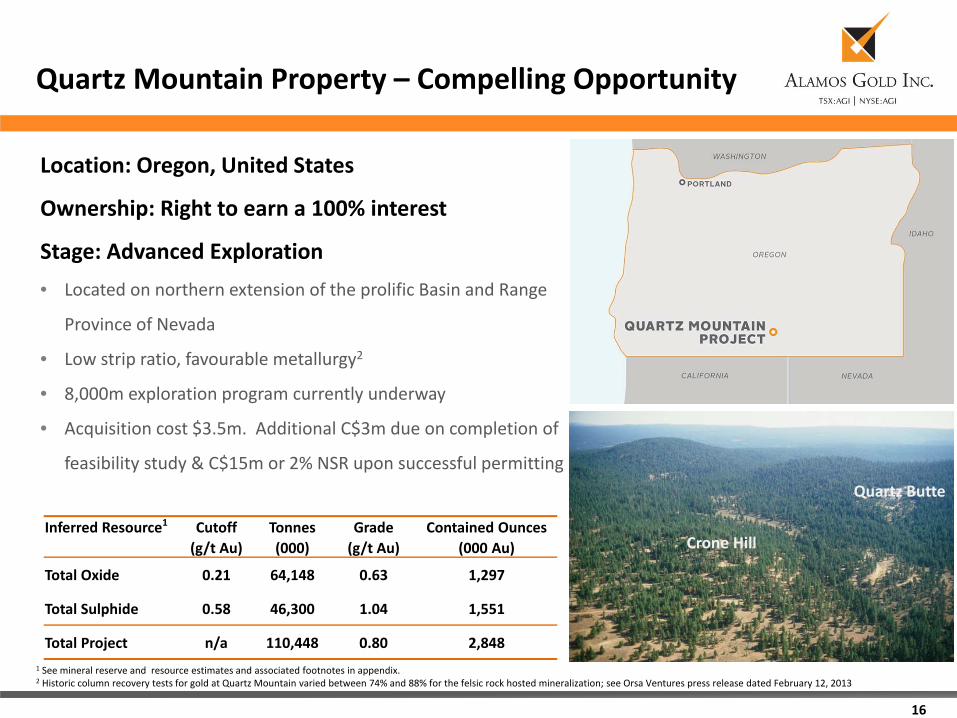
Location: Oregon, United States
Ownership: Right to earn a 100% interest
Stage: Advanced Exploration• Located on northern extension of the prolific Basin and Range
Province of Nevada
• Low strip ratio, favourable metallurgy2
• 8,000m exploration program currently underway
• Acquisition cost $3.5m. Additional C$3m due on completion of
feasibility study & C$15m or 2% NSR upon successful permitting
Inferred Resource1 Cutoff Tonnes Grade Contained Ounces(g/t Au) (000) (g/t Au) (000 Au)
Total Oxide 0.21 64,148 0.63 1,297
Total Sulphide 0.58 46,300 1.04 1,551
Total Project n/a 110,448 0.80 2,848
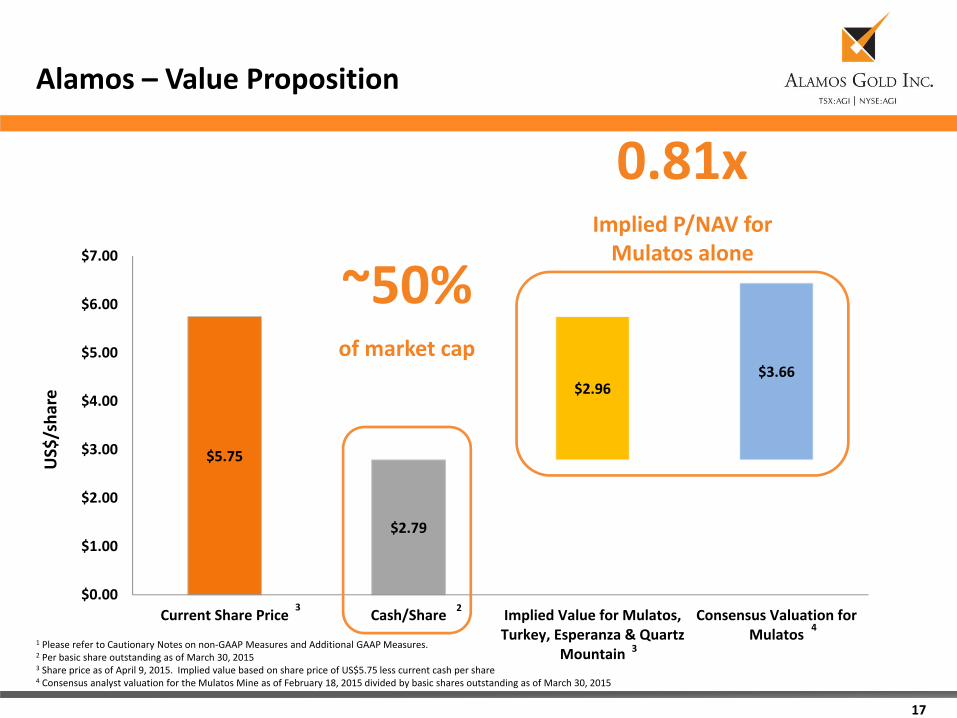
$5.75
$2.79
$2.96$3.66
$0.00
$1.00
$2.00
$3.00
$4.00
$5.00
$6.00
$7.00
Current Share Price Cash/Share Implied Value for Mulatos,Turkey, Esperanza & Quartz
Mountain
Consensus Valuation forMulatos
US$/sha
re
2
3
4
17
Alamos – Value Proposition
1 Please refer to Cautionary Notes on non‐GAAP Measures and Additional GAAP Measures.2 Per basic share outstanding as of March 30, 20153 Share price as of April 9, 2015. Implied value based on share price of US$5.75 less current cash per share4 Consensus analyst valuation for the Mulatos Mine as of February 18, 2015 divided by basic shares outstanding as of March 30, 2015
3
~50% of market cap
0.81x Implied P/NAV for Mulatos alone
18
Alamos – Investment Case
• Mid‐tier gold producer with strong, low‐cost growth profile
• Robust balance sheet – fully funded development pipeline
• Long term track record of delivering shareholder value
• Catalysts
Q2 2014: Acquired surface rights at La Yaqui & Cerro Pelon
Q3 2014: Initial drill permit granted at Quartz Mountain
Q3 2014: Transitioned to underground mining at San Carlos
• H1 2015: Turkey update
• H1 2015: Esperanza EIA submission
19
Appendices
20
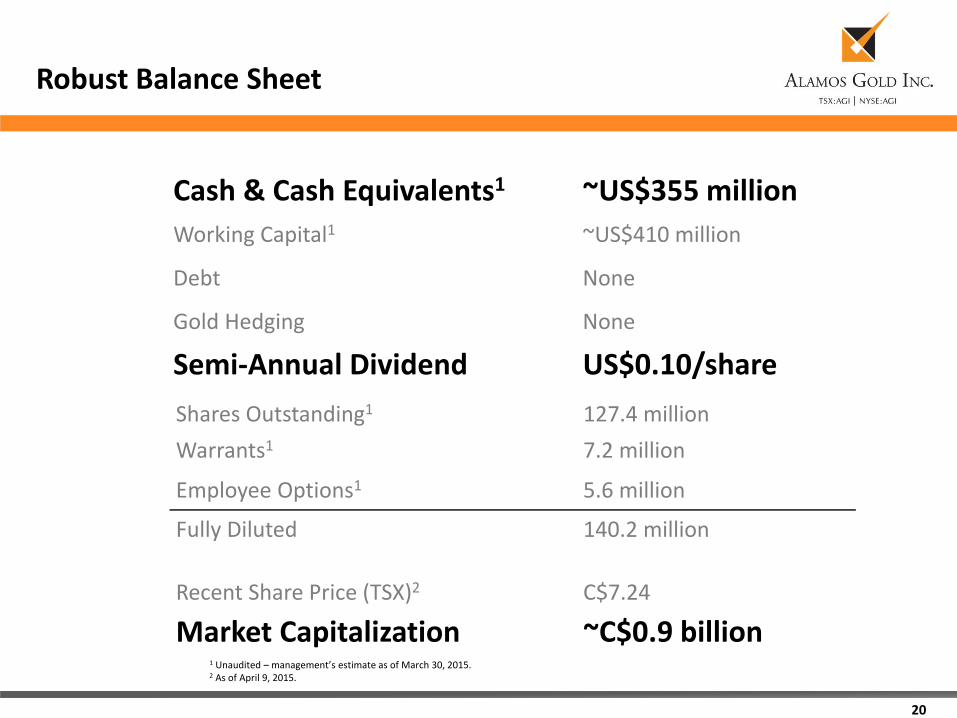
Cash & Cash Equivalents1 ~US$355 millionWorking Capital1 ~US$410 million
Debt None
Gold Hedging None
Semi‐Annual Dividend US$0.10/share
1 Unaudited – management’s estimate as of March 30, 2015.2 As of April 9, 2015.
Shares Outstanding1 127.4 millionWarrants1 7.2 million
Employee Options1 5.6 million
Fully Diluted 140.2 million
Recent Share Price (TSX)2 C$7.24
Market Capitalization ~C$0.9 billion
Robust Balance Sheet

Executive and Management Team
John A. McCluskey President and Chief Executive Officer
Jamie Porter Chief Financial Officer
Manley Guarducci Vice President and Chief Operating Officer
Charles Tarnocai Vice President, Corporate Development
Greg Fisher Vice President, Finance
Christine Barwell Vice President, Human Resources
Andrew Cormier Vice President, Development and Construction
21
Board of Directors and Executive and Management Team
Board of Directors
Paul J. Murphy Chairman
John A. McCluskey Director
David Gower Director
Ken Stowe Director
Anthony Garson Director
David Fleck Director
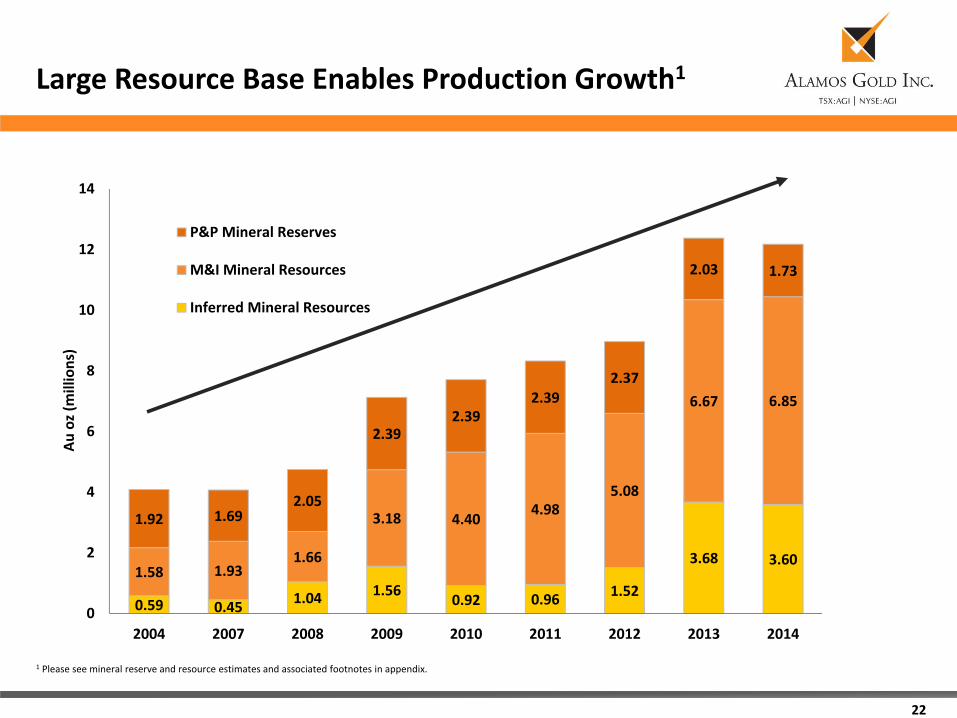
0.59 0.45 1.04 1.56 0.92 0.96 1.52
3.68 3.601.58 1.93
1.66
3.18 4.40 4.985.08
6.67 6.85
1.92 1.692.05
2.392.39
2.392.37
2.03 1.73
0
2
4
6
8
10
12
14
2004 2007 2008 2009 2010 2011 2012 2013 2014
Au oz (millions)
P&P Mineral Reserves
M&I Mineral Resources
Inferred Mineral Resources
22
Large Resource Base Enables Production Growth1
1 Please see mineral reserve and resource estimates and associated footnotes in appendix.
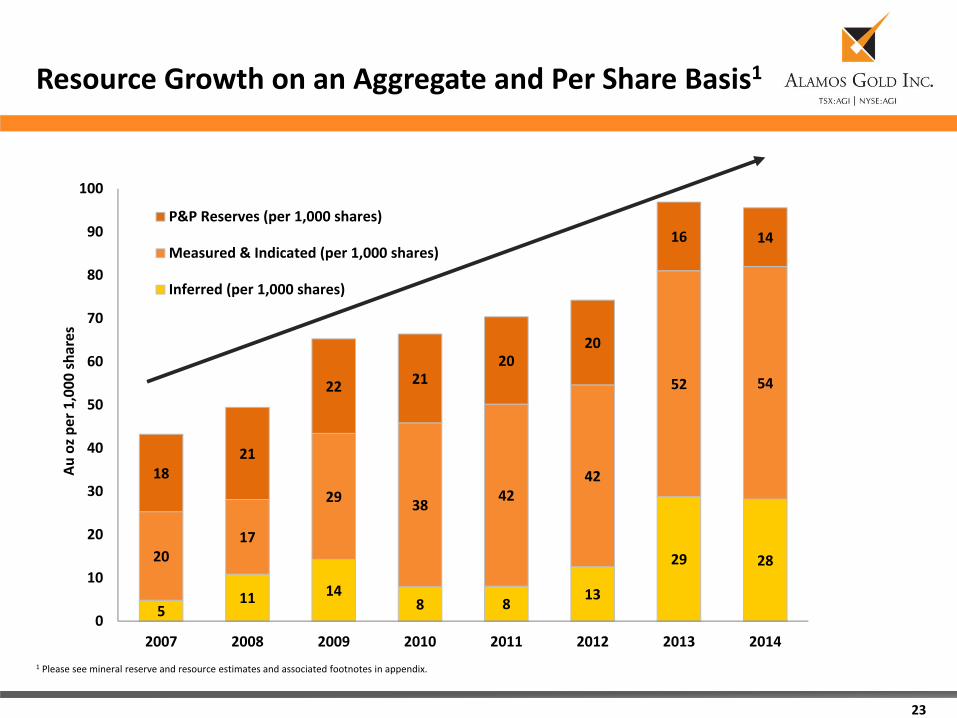
511 14
8 8 13
29 282017
29 38 4242
52 54
1821
22 2120
20
16 14
0
10
20
30
40
50
60
70
80
90
100
2007 2008 2009 2010 2011 2012 2013 2014
Au oz p
er 1,000
sha
res
P&P Reserves (per 1,000 shares)
Measured & Indicated (per 1,000 shares)
Inferred (per 1,000 shares)
23
Resource Growth on an Aggregate and Per Share Basis1
1 Please see mineral reserve and resource estimates and associated footnotes in appendix.
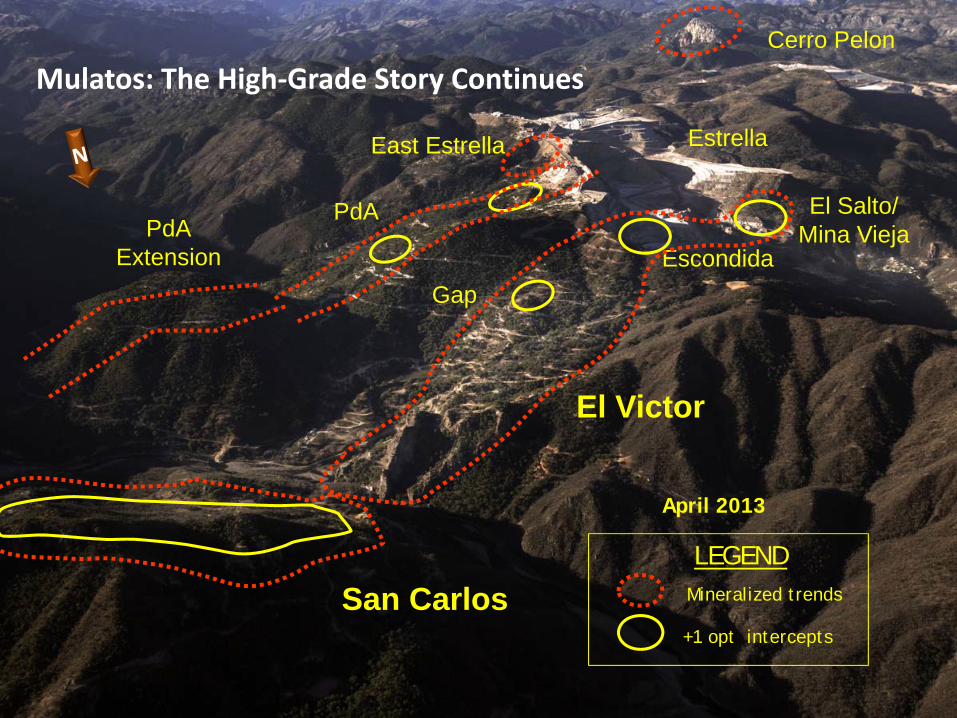
Escondida
+1 opt intercepts
Mineralized trends
LEGEND
PdAExtension
East Estrella
Cerro Pelon
Estrella
El Salto/Mina Vieja
El Victor
Gap
PdA
San Carlos
April 2013
Mulatos: The High‐Grade Story Continues
25
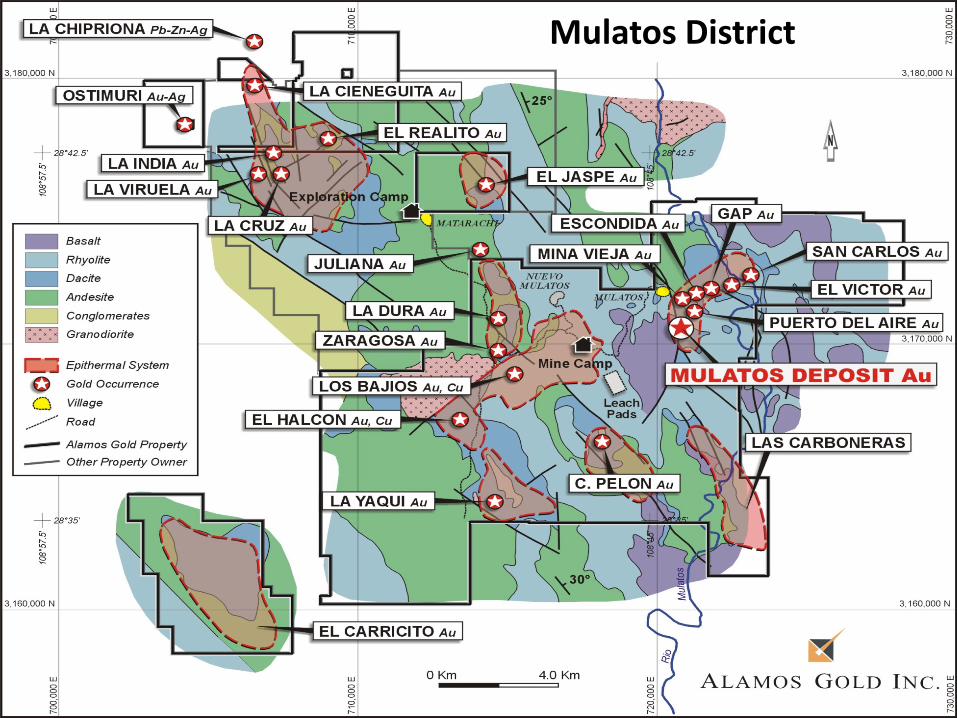
Mulatos Alteration Map
Mulatos District
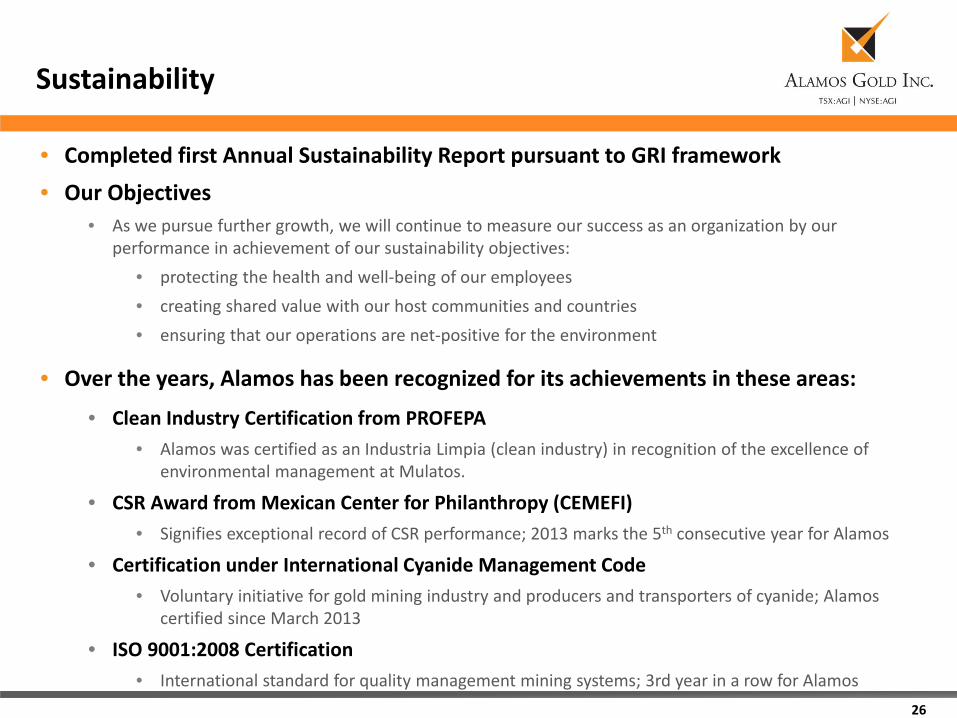
• Completed first Annual Sustainability Report pursuant to GRI framework• Our Objectives
• As we pursue further growth, we will continue to measure our success as an organization by our performance in achievement of our sustainability objectives:
• protecting the health and well‐being of our employees • creating shared value with our host communities and countries• ensuring that our operations are net‐positive for the environment
• Over the years, Alamos has been recognized for its achievements in these areas:
• Clean Industry Certification from PROFEPA• Alamos was certified as an Industria Limpia (clean industry) in recognition of the excellence of
environmental management at Mulatos.
• CSR Award from Mexican Center for Philanthropy (CEMEFI)• Signifies exceptional record of CSR performance; 2013 marks the 5th consecutive year for Alamos
• Certification under International Cyanide Management Code• Voluntary initiative for gold mining industry and producers and transporters of cyanide; Alamos
certified since March 2013
• ISO 9001:2008 Certification • International standard for quality management mining systems; 3rd year in a row for Alamos
26
Sustainability
27
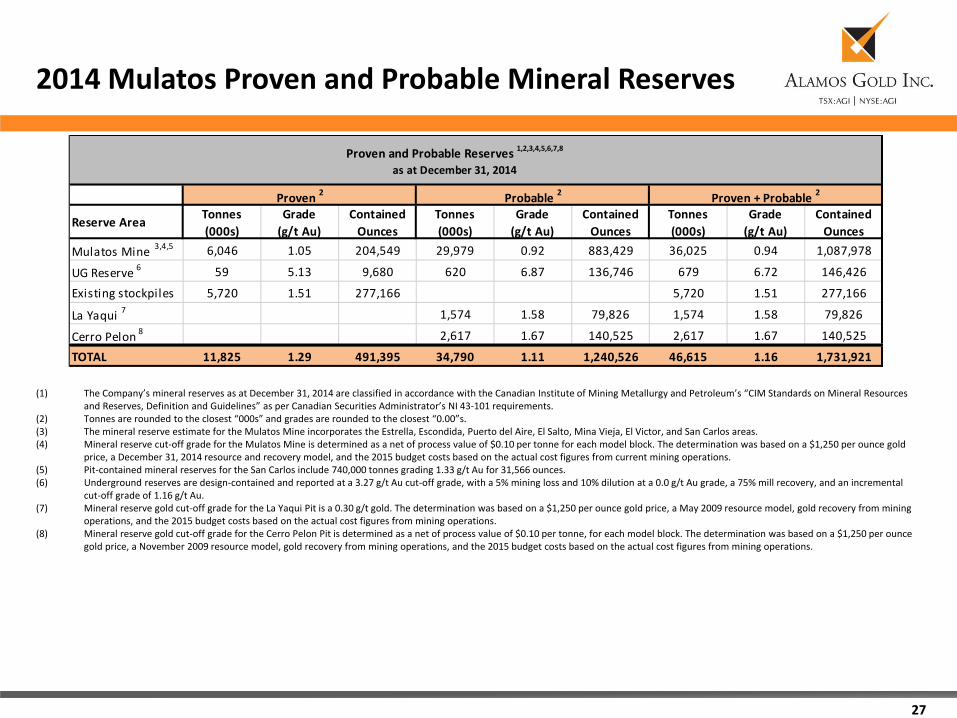
2014 Mulatos Proven and Probable Mineral Reserves
(1) The Company’s mineral reserves as at December 31, 2014 are classified in accordance with the Canadian Institute of Mining Metallurgy and Petroleum’s “CIM Standards on Mineral Resources and Reserves, Definition and Guidelines” as per Canadian Securities Administrator’s NI 43‐101 requirements.
(2) Tonnes are rounded to the closest “000s” and grades are rounded to the closest “0.00”s. (3) The mineral reserve estimate for the Mulatos Mine incorporates the Estrella, Escondida, Puerto del Aire, El Salto, Mina Vieja, El Victor, and San Carlos areas. (4) Mineral reserve cut‐off grade for the Mulatos Mine is determined as a net of process value of $0.10 per tonne for each model block. The determination was based on a $1,250 per ounce gold
price, a December 31, 2014 resource and recovery model, and the 2015 budget costs based on the actual cost figures from current mining operations. (5) Pit‐contained mineral reserves for the San Carlos include 740,000 tonnes grading 1.33 g/t Au for 31,566 ounces.(6) Underground reserves are design‐contained and reported at a 3.27 g/t Au cut‐off grade, with a 5% mining loss and 10% dilution at a 0.0 g/t Au grade, a 75% mill recovery, and an incremental
cut‐off grade of 1.16 g/t Au.(7) Mineral reserve gold cut‐off grade for the La Yaqui Pit is a 0.30 g/t gold. The determination was based on a $1,250 per ounce gold price, a May 2009 resource model, gold recovery from mining
operations, and the 2015 budget costs based on the actual cost figures from mining operations. (8) Mineral reserve gold cut‐off grade for the Cerro Pelon Pit is determined as a net of process value of $0.10 per tonne, for each model block. The determination was based on a $1,250 per ounce
gold price, a November 2009 resource model, gold recovery from mining operations, and the 2015 budget costs based on the actual cost figures from mining operations.
Mulatos Mine 3,4,5 6,046 1.05 204,549 29,979 0.92 883,429 36,025 0.94 1,087,978
UG Reserve 6 59 5.13 9,680 620 6.87 136,746 679 6.72 146,426
Existing stockpiles 5,720 1.51 277,166 5,720 1.51 277,166
La Yaqui 7 1,574 1.58 79,826 1,574 1.58 79,826
Cerro Pelon 8 2,617 1.67 140,525 2,617 1.67 140,525
TOTAL 11,825 1.29 491,395 34,790 1.11 1,240,526 46,615 1.16 1,731,921
Contained Ounces
Reserve Area Tonnes (000s)
Grade (g/t Au)
Contained Ounces
Tonnes (000s)
Grade (g/t Au)
Contained Ounces
Tonnes (000s)
Grade (g/t Au)
Proven and Probable Reserves 1,2,3,4,5,6,7,8
as at December 31, 2014
Proven 2 Probable 2 Proven + Probable 2
28
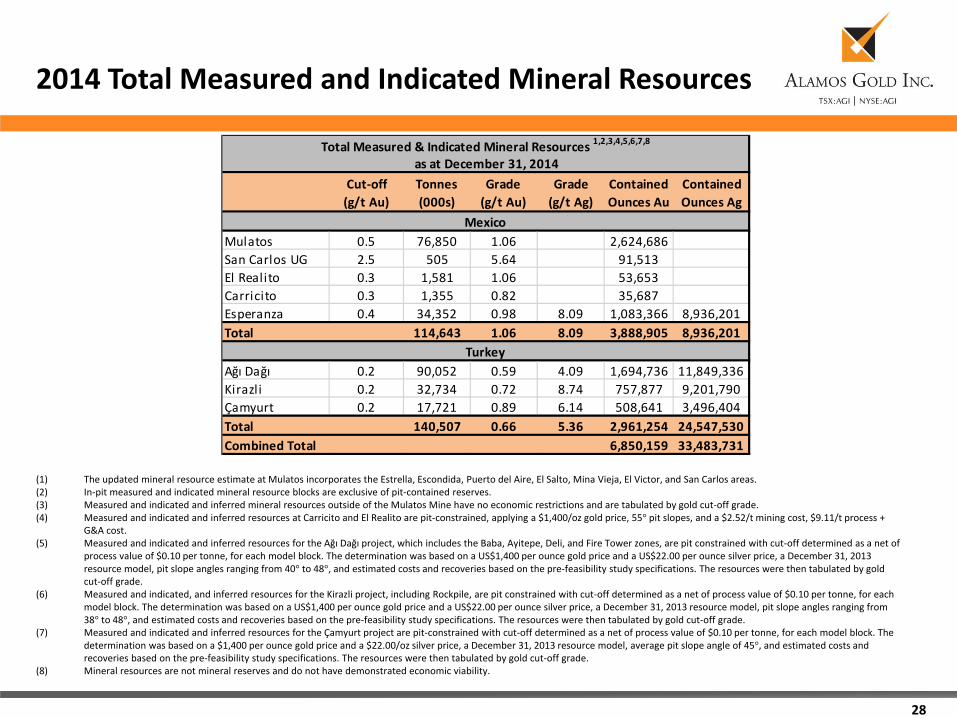
2014 Total Measured and Indicated Mineral Resources
(1) The updated mineral resource estimate at Mulatos incorporates the Estrella, Escondida, Puerto del Aire, El Salto, Mina Vieja, El Victor, and San Carlos areas. (2) In‐pit measured and indicated mineral resource blocks are exclusive of pit‐contained reserves. (3) Measured and indicated and inferred mineral resources outside of the Mulatos Mine have no economic restrictions and are tabulated by gold cut‐off grade. (4) Measured and indicated and inferred resources at Carricito and El Realito are pit‐constrained, applying a $1,400/oz gold price, 55° pit slopes, and a $2.52/t mining cost, $9.11/t process +
G&A cost.(5) Measured and indicated and inferred resources for the Ağı Dağı project, which includes the Baba, Ayitepe, Deli, and Fire Tower zones, are pit constrained with cut‐off determined as a net of
process value of $0.10 per tonne, for each model block. The determination was based on a US$1,400 per ounce gold price and a US$22.00 per ounce silver price, a December 31, 2013 resource model, pit slope angles ranging from 40° to 48°, and estimated costs and recoveries based on the pre‐feasibility study specifications. The resources were then tabulated by gold cut‐off grade.
(6) Measured and indicated, and inferred resources for the Kirazli project, including Rockpile, are pit constrained with cut‐off determined as a net of process value of $0.10 per tonne, for each model block. The determination was based on a US$1,400 per ounce gold price and a US$22.00 per ounce silver price, a December 31, 2013 resource model, pit slope angles ranging from 38° to 48°, and estimated costs and recoveries based on the pre‐feasibility study specifications. The resources were then tabulated by gold cut‐off grade.
(7) Measured and indicated and inferred resources for the Çamyurt project are pit‐constrained with cut‐off determined as a net of process value of $0.10 per tonne, for each model block. The determination was based on a $1,400 per ounce gold price and a $22.00/oz silver price, a December 31, 2013 resource model, average pit slope angle of 45°, and estimated costs and recoveries based on the pre‐feasibility study specifications. The resources were then tabulated by gold cut‐off grade.
(8) Mineral resources are not mineral reserves and do not have demonstrated economic viability.
Mulatos 0.5 76,850 1.06 2,624,686San Carlos UG 2.5 505 5.64 91,513El Realito 0.3 1,581 1.06 53,653Carricito 0.3 1,355 0.82 35,687Esperanza 0.4 34,352 0.98 8.09 1,083,366 8,936,201Total 114,643 1.06 8.09 3,888,905 8,936,201
Ağı Dağı 0.2 90,052 0.59 4.09 1,694,736 11,849,336Kirazli 0.2 32,734 0.72 8.74 757,877 9,201,790Çamyurt 0.2 17,721 0.89 6.14 508,641 3,496,404Total 140,507 0.66 5.36 2,961,254 24,547,530Combined Total 6,850,159 33,483,731
Mexico
Turkey
Total Measured & Indicated Mineral Resources 1,2,3,4,5,6,7,8
as at December 31, 2014Cut‐off (g/t Au)
Tonnes (000s)
Grade (g/t Au)
Grade (g/t Ag)
Contained Ounces Au
Contained Ounces Ag
(1) The updated mineral resource estimate at Mulatos incorporates the Estrella, Escondida, Puerto del Aire, El Salto, Mina Vieja, El Victor, and San Carlos areas. (2) In‐pit measured and indicated mineral resource blocks are exclusive of pit‐contained reserves. (3) Measured and indicated and inferred mineral resources outside of the Mulatos Mine have no economic restrictions and are tabulated by gold cut‐off grade. (4) Measured and indicated and inferred resources at Carricito and El Realito are pit‐constrained, applying a $1,400/oz gold price, 55° pit slopes, and a $2.52/t mining cost, $9.11/t process + G&A cost.(5) Measured and indicated and inferred resources for the Ağı Dağı project, which includes the Baba, Ayitepe, Deli, and Fire Tower zones, are pit constrained with cut‐off determined as a net of process
value of $0.10 per tonne, for each model block. The determination was based on a US$1,400 per ounce gold price and a US$22.00 per ounce silver price, a December 31, 2013 resource model, pit slope angles ranging from 40° to 48°, and estimated costs and recoveries based on the pre‐feasibility study specifications. The resources were then tabulated by gold cut‐off grade.
(6) Measured and indicated, and inferred resources for the Kirazli project, including Rockpile, are pit constrained with cut‐off determined as a net of process value of $0.10 per tonne, for each model block. The determination was based on a US$1,400 per ounce gold price and a US$22.00 per ounce silver price, a December 31, 2013 resource model, pit slope angles ranging from 38° to 48°, and estimated costs and recoveries based on the pre‐feasibility study specifications. The resources were then tabulated by gold cut‐off grade.
(7) Measured and indicated and inferred resources for the Çamyurt project are pit‐constrained with cut‐off determined as a net of process value of $0.10 per tonne, for each model block. The determination was based on a $1,400 per ounce gold price and a $22.00/oz silver price, a December 31, 2013 resource model, average pit slope angle of 45°, and estimated costs and recoveries based on the pre‐feasibility study specifications. The resources were then tabulated by gold cut‐off grade.
(8) Mineral resources are not mineral reserves and do not have demonstrated economic viability.
29
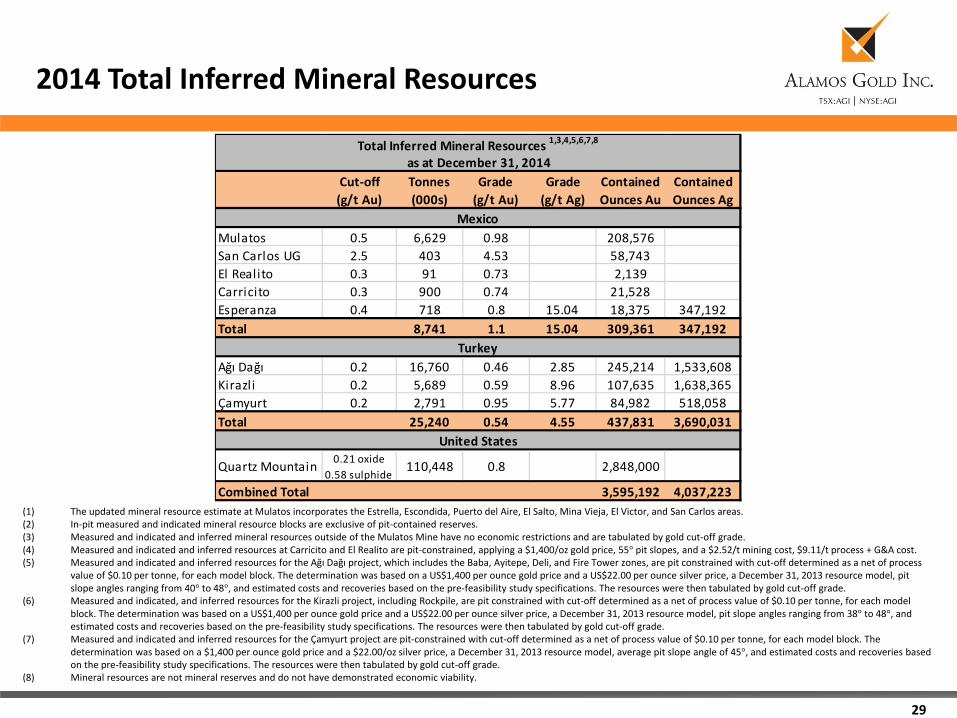
2014 Total Inferred Mineral Resources
Mulatos 0.5 6,629 0.98 208,576San Carlos UG 2.5 403 4.53 58,743El Realito 0.3 91 0.73 2,139Carricito 0.3 900 0.74 21,528Esperanza 0.4 718 0.8 15.04 18,375 347,192Total 8,741 1.1 15.04 309,361 347,192
Ağı Dağı 0.2 16,760 0.46 2.85 245,214 1,533,608Kirazli 0.2 5,689 0.59 8.96 107,635 1,638,365Çamyurt 0.2 2,791 0.95 5.77 84,982 518,058Total 25,240 0.54 4.55 437,831 3,690,031
Quartz Mountain 0.21 oxide 0.58 sulphide
110,448 0.8 2,848,000
3,595,192 4,037,223
Contained Ounces Ag
Mexico
Turkey
United States
Combined Total
Total Inferred Mineral Resources 1,3,4,5,6,7,8
as at December 31, 2014Cut‐off (g/t Au)
Tonnes (000s)
Grade (g/t Au)
Grade (g/t Ag)
Contained Ounces Au