Alamos corp presentation March 2017
41
March 2017 Corporate Presentation
-
Upload
alamosgoldinc -
Category
Investor Relations
-
view
152 -
download
1
Transcript of Alamos corp presentation March 2017
March 2017 Corporate Presentation
2
Cautionary Notes
No stock exchange, securities commission or other regulatory authority has approved or disapproved the information contained herein.
Certain statements in this presentation are “forward-looking statements”, including within the meaning of the United States Securities Exchange Act of 1934, as amended. All statements other than statements of historical
fact included in this presentation, including without limitation statements regarding forecast gold production, gold grades, recoveries, waste-to-ore ratios, total cash costs, potential mineralization and reserves, exploration
results, and future plans and objectives of Alamos, are forward-looking statements based on forecasts of future operational or financial results, estimates of amounts not yet determinable and assumptions of management
that involve various risks and uncertainties. Any statements that express or involve discussions with respect to predictions, expectations, beliefs, plans, projections, objectives, assumptions or future events or performance
(often, but not always, using words or phrases such as “expects” or “does not expect”, “is expected”, “anticipates” or “does not anticipate”, “plans”, “estimates” or “intends”, or stating that certain actions, events or results
“may”, “could”, “would”, “might” or “will” be taken, occur or be achieved) are not statements of historical fact and may be “forward-looking statements.” Alamos cautions that forward-looking information involves known and
unknown risks, uncertainties and other factors that may cause Alamos' actual results, performance or achievements to be materially different from those expressed or implied by such information, including, but not limited
to, gold and silver price volatility; fluctuations in foreign exchange rates and interest rates; the impact of any hedging activities; discrepancies between actual and estimated production, between actual and estimated
reserves and resources or between actual and estimated metallurgical recoveries; costs of production; capital expenditure requirements; the costs and timing of construction and development of new deposits; and the
success of exploration and permitting activities. In addition, the factors described or referred to in the section entitled “Risk Factors” in both Alamos Gold Inc.’s Annual Information Form for the year ended December 31,
2015 along with subsequent public filings available on the SEDAR website at www.sedar.com, should be reviewed in conjunction with the information found in this presentation. Although Alamos has attempted to identify
important factors that could cause actual results, performance or achievements to differ materially from those contained in forward-looking information, there can be other factors that cause results, performance or
achievements not to be as anticipated, estimated or intended. There can be no assurance that such information will prove to be accurate or that management’s expectations or estimates of future developments,
circumstances or results will materialize. Accordingly, readers should not place undue reliance on forward-looking information.
Note to U.S. Investors
Alamos prepares its disclosure in accordance with the requirements of securities laws in effect in Canada, which differ from the requirements of U.S. securities laws. Terms relating to mineral resources in this presentation
are defined in accordance with National Instrument 43-101 – Standards of Disclosure for Mineral Projects under the guidelines set out in the Canadian Institute of Mining, Metallurgy, and Petroleum Standards on Mineral
Resources and Mineral Reserves. The United States Securities and Exchange Commission (the “SEC”) permits mining companies, in their filings with the SEC, to disclose only those mineral deposits that a company can
economically and legally extract or produce. Alamos may use certain terms, such as “measured mineral resources”, “indicated mineral resources”, “inferred mineral resources” and “probable mineral reserves” that the SEC
does not recognize (these terms may be used in this presentation and are included in the public filings of Alamos, which have been filed with the SEC and the securities commissions or similar authorities in Canada).
Cautionary non-GAAP Measures and Additional GAAP Measures
Note that for purposes of this section, GAAP refers to IFRS. The Company believes that investors use certain non-GAAP and additional GAAP measures as indicators to assess gold mining companies. They are intended to
provide additional information and should not be considered in isolation or as a substitute for measures of performance prepared with GAAP.
“Cash flow from operating activities before changes in non-cash working capital” is a non-GAAP performance measure that could provide an indication of the Company’s ability to generate cash flows from operations, and is
calculated by adding back the change in non-cash working capital to “Cash provided by (used in) operating activities” as presented on the Company’s consolidated statements of cash flows. “Free cash flow” is a non-GAAP
performance measure that is calculated as cash flows from operations net of cash flows invested in mineral property, plant and equipment and exploration and evaluation assets as presented on the Company’s consolidated
statements of cash flows and that would provide an indication of the Company’s ability to generate cash flows from its mineral projects. “Mine site free cash flow” is a non-GAAP measure which includes cash flow from
operating activities at, less capital expenditures at each mine site. Return on Equity is defined as Earnings from Continuing Operations divided by the average Total Equity for the current and previous year. “Mining cost per
tonne of ore” and “Cost per tonne of ore” are non-GAAP performance measures that could provide an indication of the mining and processing efficiency and effectiveness of the mine. These measures are calculated by
dividing the relevant mining and processing costs and total costs by the tonnes of ore processed in the period. “Cost per tonne of ore” is usually affected by operating efficiencies and waste-to-ore ratios in the period. “Total
cash costs per ounce”, “all-in sustaining costs per ounce”, and “mine-site all-in sustaining costs” as used in this analysis are non-GAAP terms typically used by gold mining companies to assess the level of gross margin
available to the Company by subtracting these costs from the unit price realized during the period. These non-GAAP terms are also used to assess the ability of a mining company to generate cash flow from operations.
There may be some variation in the method of computation of these metrics as determined by the Company compared with other mining companies. In this context, “total cash costs” reflects mining and processing costs
allocated from in-process and dore inventory associated and associated royalties with ounces of gold sold in the period. Total cash costs per ounce are exclusive of exploration costs. “All-in sustaining costs per ounce”
include total cash costs, exploration, corporate and administrative, share based compensation and sustaining capital costs. “Mine-site all-in sustaining costs” include total cash costs, exploration, and sustaining capital costs
for the mine-site, but exclude an allocation of corporate and administrative and share based compensation.
Additional GAAP measures that are presented on the face of the Company’s consolidated statements of comprehensive income and are not meant to be a substitute for other subtotals or totals presented in accordance
with IFRS, but rather should be evaluated in conjunction with such IFRS measures. This includes “Earnings from operations”, which is intended to provide an indication of the Company’s operating performance, and
represents the amount of earnings before net finance income/expense, foreign exchange gain/loss, other income/loss, and income tax expense. Non-GAAP and additional GAAP measures do not have a standardized
meaning prescribed under IFRS and therefore may not be comparable to similar measures presented by other companies. A reconciliation of historical non-GAAP and additional GAAP measures are available at
www.alamosgold.com.
Technical Information
Except as otherwise noted herein, Chris Bostwick, FAusIMM, Alamos Gold’s Vice President, Technical Services, has reviewed and approved the scientific and technical information contained in this presentation. Chris
Bostwick is a Qualified Person within the meaning of Canadian Securities Administrator’s National Instrument 43-101. For more information, please refer to the Alamos Gold Inc. 2015 Annual Information Form and the
technical reports referenced therein and in this presentation, available on SEDAR (www.sedar.com).
All figures in US$ unless otherwise indicated.
Cautionary Notes

3
1 Based on 2017 Guidance2 Please refer to Cautionary Notes on non-GAAP Measures and Additional GAAP Measures.3 Includes cash as of December 31, 2016 and $240 million net proceeds from equity offering completed February 9, 2017.
Strong Platform for Delivering Long Term Value
Diversified gold production
400,000 – 430,000 oz from three North American mines1
Expanding margins
$940/oz AISC, an expected 7% decrease from 20161,2
Peer leading growth
Portfolio of 6 low-cost development projects
Strong balance sheet
$492m pro-forma cash3 to support internal growth & debt retirement
Track record of delivering
shareholder value
4
2014A 2015A 2016A 2017E
Gold Production (000 oz)
TorontoHead Office
Diversified North American Gold Production
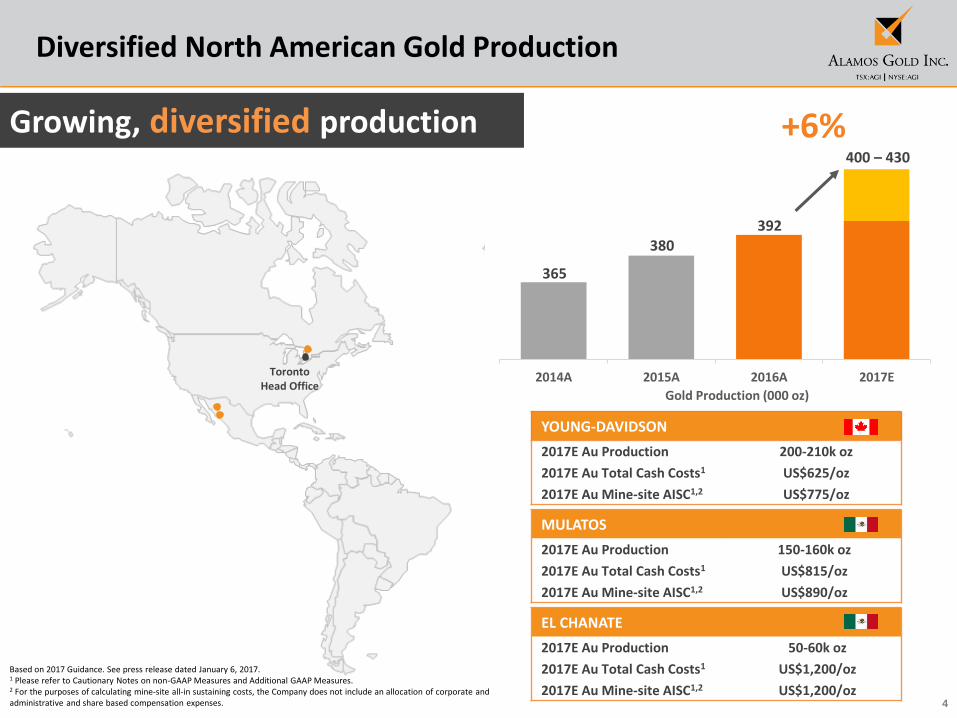
Based on 2017 Guidance. See press release dated January 6, 2017.1 Please refer to Cautionary Notes on non-GAAP Measures and Additional GAAP Measures.2 For the purposes of calculating mine-site all-in sustaining costs, the Company does not include an allocation of corporate and administrative and share based compensation expenses.
Growing, diversified production
380392
400 – 430
+6%
MULATOS
2017E Au Production 150-160k oz
2017E Au Total Cash Costs1 US$815/oz
2017E Au Mine-site AISC1,2 US$890/oz
EL CHANATE
2017E Au Production 50-60k oz
2017E Au Total Cash Costs1 US$1,200/oz
2017E Au Mine-site AISC1,2 US$1,200/oz
YOUNG-DAVIDSON
2017E Au Production 200-210k oz
2017E Au Total Cash Costs1 US$625/oz
2017E Au Mine-site AISC1,2 US$775/oz
365
5
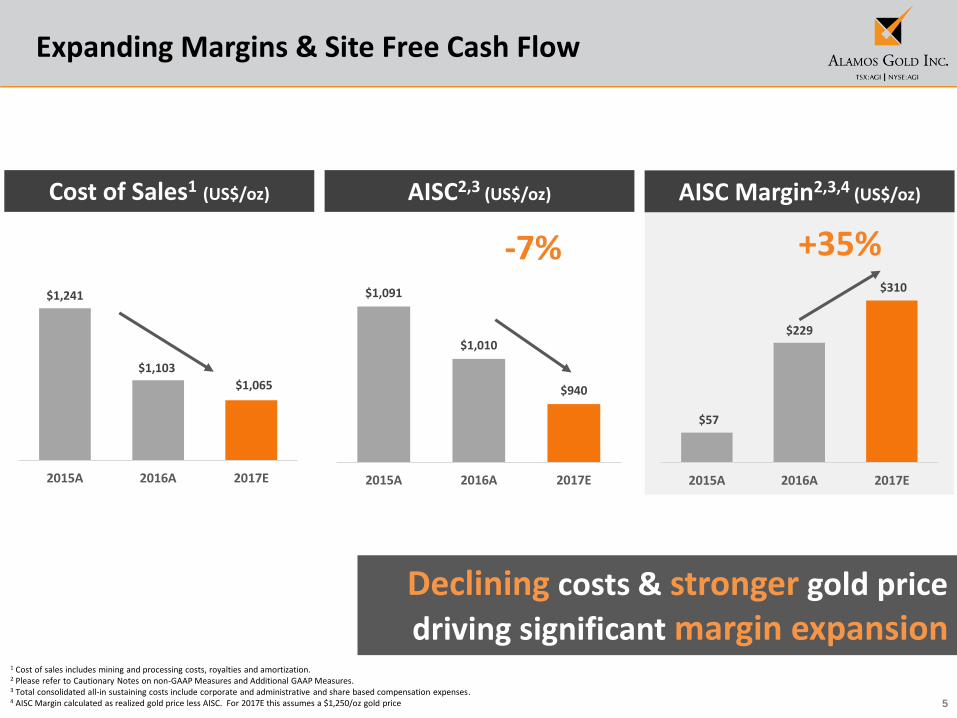
$57
$229
$310
2015A 2016A 2017E
$1,091
$1,010
$940
2015A 2016A 2017E
$1,241
$1,103
$1,065
2015A 2016A 2017E
Expanding Margins & Site Free Cash Flow
1 Cost of sales includes mining and processing costs, royalties and amortization.2 Please refer to Cautionary Notes on non-GAAP Measures and Additional GAAP Measures.3 Total consolidated all-in sustaining costs include corporate and administrative and share based compensation expenses.4 AISC Margin calculated as realized gold price less AISC. For 2017E this assumes a $1,250/oz gold price
AISC2,3 (US$/oz)
-7%
Cost of Sales1 (US$/oz)
+35%
AISC Margin2,3,4 (US$/oz)
Declining costs & stronger gold price
driving significant margin expansion

6
Leading development pipelineGrowth at existing
operations
ESPERANZA
Peer Leading Low-Cost Growth Profile
Controlled, disciplined, multi-stage growth
Advanced exploration
AĞI DAĞI
KIRAZLI
ÇAMYURT
QUARTZ MOUNTAIN
LYNN LAKE
MULATOS DISTRICT
Producing Assets
Development/Exploration Assets
YOUNG-DAVIDSONRAMP-UP
MULATOS: LA YAQUI & CERRO PELON

7
Strong Balance Sheet
1 Unaudited management estimate as of December 31, 2016 2 Pro-forma cash includes cash as of December 31, 2016 plus $240 million net proceeds of equity financing completed February 9, 20173 Available liquidity includes pro-forma cash and undrawn $150m credit facility4As of March 2, 2017
Balance Sheet
Pro-forma Cash1,2 US$492 million
Available Liquidity3 US$642 million
Total Debt1 US$315 million
Capital Structure
Shares Outstanding 298.7 million
Warrants 11.8 million
Employee Options 9.0 million
Fully Diluted 322.2 million
Recent Share Price (TSX)4 C$9.20
Market Capitalization ~C$2.7 billion
2
$492m Pro-forma cash following equity financing
$24m Annual interest savings; $70m over remaining term
$252$315
$240
Pro-forma Cash Debt
as of December 31, 2016
$315m High yield notes to be retired in April 2017
$492m
$315m
1,2
8
793%
12%
252%
-50%
450%
950%
1450%
1950%
2003 2004 2005 2006 2007 2008 2009 2010 2011 2012 2013 2014 2015 2016
Alamos Gold Inc. (TSX:AGI) - Share Price
S&P/TSX Global Gold Index
Gold (US$/oz)
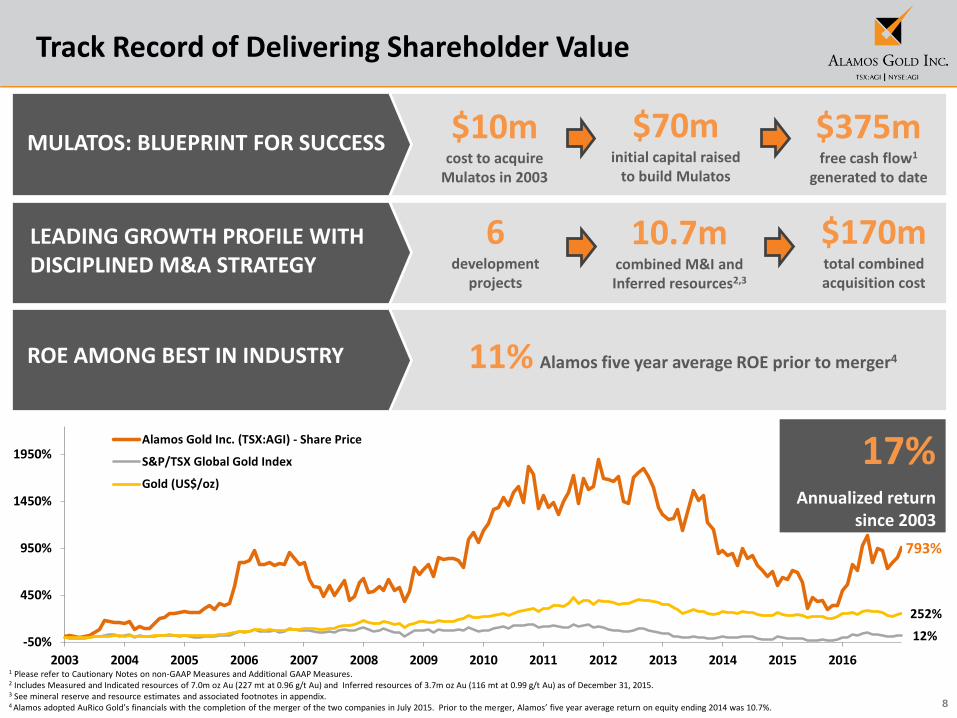
Track Record of Delivering Shareholder Value
17%Annualized return
since 2003
MULATOS: BLUEPRINT FOR SUCCESS
LEADING GROWTH PROFILE WITH DISCIPLINED M&A STRATEGY
ROE AMONG BEST IN INDUSTRY 11% Alamos five year average ROE prior to merger4
$10mcost to acquire
Mulatos in 2003
$375mfree cash flow1
generated to date
$70minitial capital raised
to build Mulatos
6development
projects
$170mtotal combined acquisition cost
10.7mcombined M&I and Inferred resources2,3
1 Please refer to Cautionary Notes on non-GAAP Measures and Additional GAAP Measures.2 Includes Measured and Indicated resources of 7.0m oz Au (227 mt at 0.96 g/t Au) and Inferred resources of 3.7m oz Au (116 mt at 0.99 g/t Au) as of December 31, 2015.3 See mineral reserve and resource estimates and associated footnotes in appendix.4 Alamos adopted AuRico Gold’s financials with the completion of the merger of the two companies in July 2015. Prior to the merger, Alamos’ five year average return on equity ending 2014 was 10.7%.
9
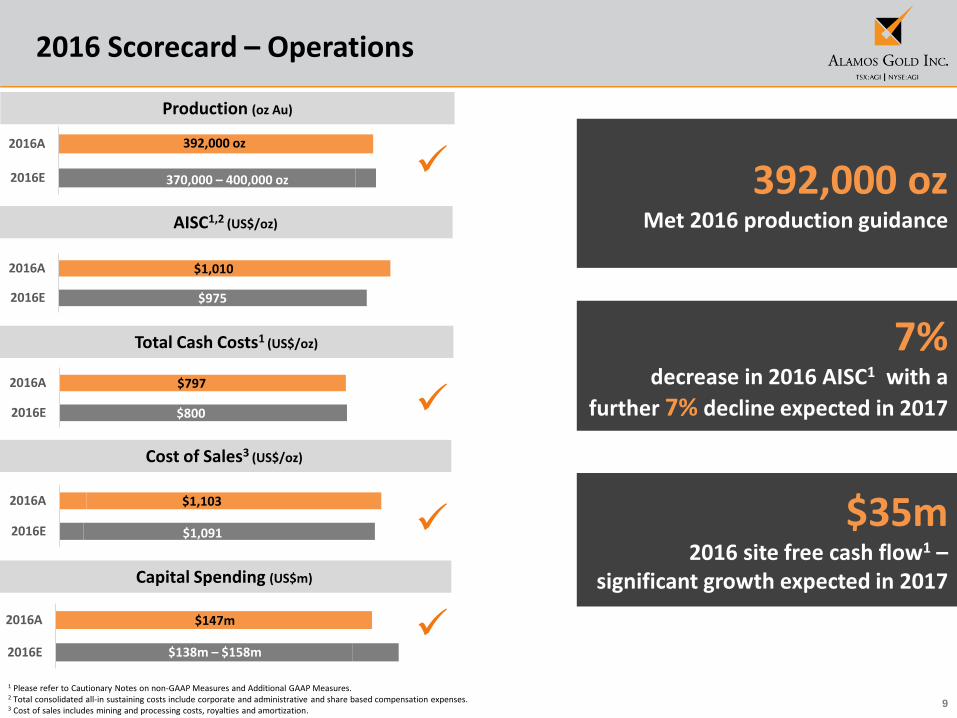
2016 Scorecard – Operations
1 Please refer to Cautionary Notes on non-GAAP Measures and Additional GAAP Measures. 2 Total consolidated all-in sustaining costs include corporate and administrative and share based compensation expenses. 3 Cost of sales includes mining and processing costs, royalties and amortization.
7%decrease in 2016 AISC1 with a
further 7% decline expected in 2017
Production (oz Au)
Capital Spending (US$m)
AISC1,2 (US$/oz)
$35m 2016 site free cash flow1 –
significant growth expected in 2017
392,000 ozMet 2016 production guidance
Cost of Sales3 (US$/oz)
Total Cash Costs1 (US$/oz)
2016E
2016A
$975
$1,010
2016E
2016A
$800
$797
2016E
2016A
$1,091
$1,103
2016E
2016A
2016E
2016A
370,000 – 400,000 oz
392,000 oz
$147m
$138m – $158m
10
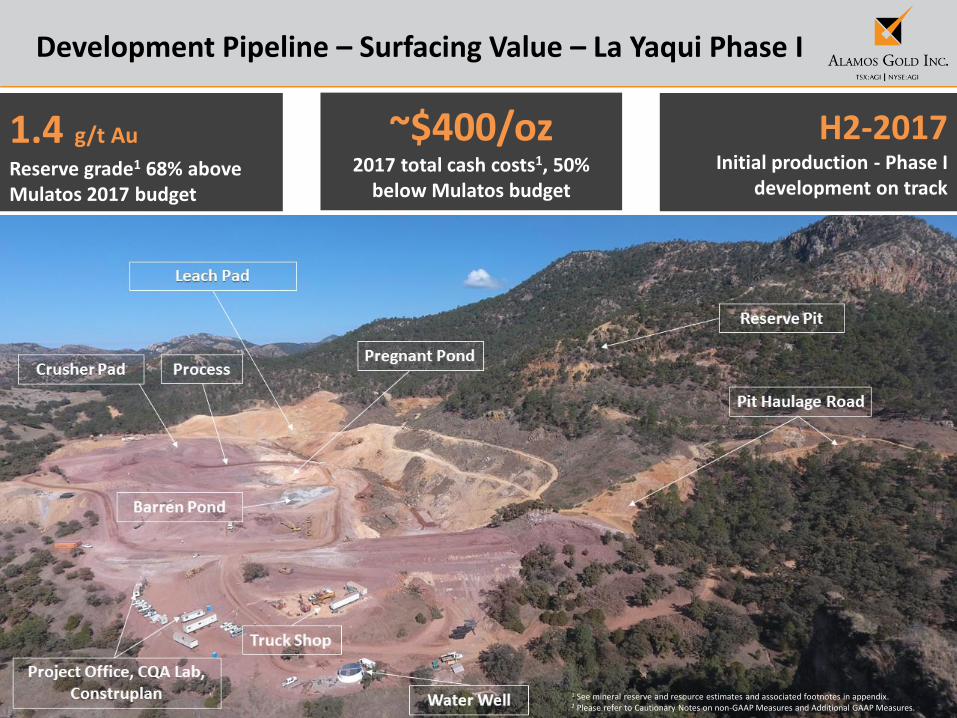
Development Pipeline – Surfacing Value – La Yaqui Phase I
1.4 g/t Au
Reserve grade1 68% above Mulatos 2017 budget
H2-2017 Initial production - Phase I
development on track
~$400/oz2017 total cash costs1, 50%
below Mulatos budget
1 See mineral reserve and resource estimates and associated footnotes in appendix.2 Please refer to Cautionary Notes on non-GAAP Measures and Additional GAAP Measures.
11
80 89
608
68
232
8
0
100
200
300
400
500
600
700
800
2014 2015 2016
Ou
nce
s A
u (
00
0)
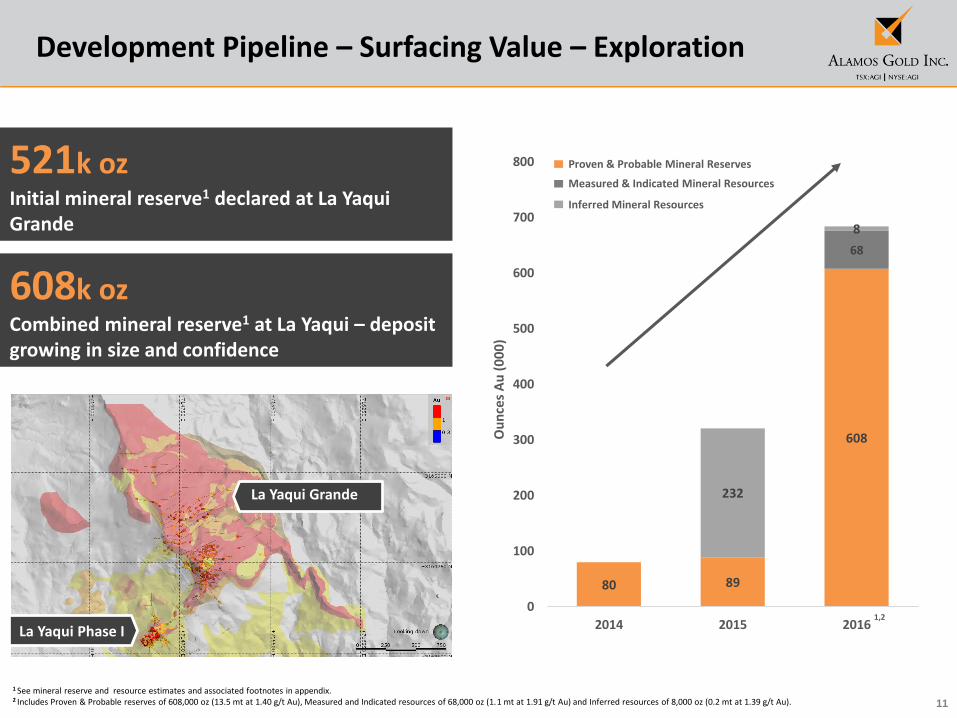
Development Pipeline – Surfacing Value – Exploration
1 See mineral reserve and resource estimates and associated footnotes in appendix.2 Includes Proven & Probable reserves of 608,000 oz (13.5 mt at 1.40 g/t Au), Measured and Indicated resources of 68,000 oz (1.1 mt at 1.91 g/t Au) and Inferred resources of 8,000 oz (0.2 mt at 1.39 g/t Au).
La Yaqui Grande
La Yaqui Phase I
Proven & Probable Mineral Reserves
Inferred Mineral Resources
Measured & Indicated Mineral Resources521k ozInitial mineral reserve1 declared at La Yaqui Grande
608k ozCombined mineral reserve1 at La Yaqui – deposit growing in size and confidence
1,2
12
14.2
18.5
0
5
10
15
20
2015 2016
5.9
7.7
0
2
4
6
8
10
2015 2016
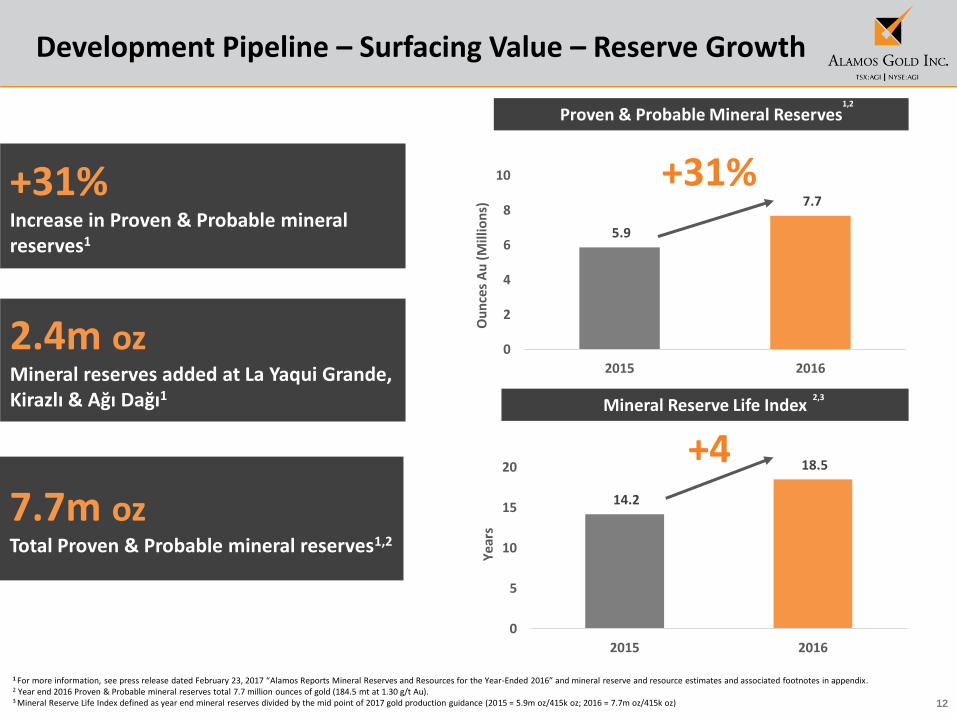
Development Pipeline – Surfacing Value – Reserve Growth
+31%
1 For more information, see press release dated February 23, 2017 “Alamos Reports Mineral Reserves and Resources for the Year-Ended 2016” and mineral reserve and resource estimates and associated footnotes in appendix.2 Year end 2016 Proven & Probable mineral reserves total 7.7 million ounces of gold (184.5 mt at 1.30 g/t Au).3 Mineral Reserve Life Index defined as year end mineral reserves divided by the mid point of 2017 gold production guidance (2015 = 5.9m oz/415k oz; 2016 = 7.7m oz/415k oz)
+31%Increase in Proven & Probable mineral reserves1
7.7m ozTotal Proven & Probable mineral reserves1,2
2.4m ozMineral reserves added at La Yaqui Grande, Kirazlı & Ağı Dağı1
+4O
un
ces
Au
(M
illio
ns)
Ye
ars
Proven & Probable Mineral Reserves
Mineral Reserve Life Index2,3
1,2
13
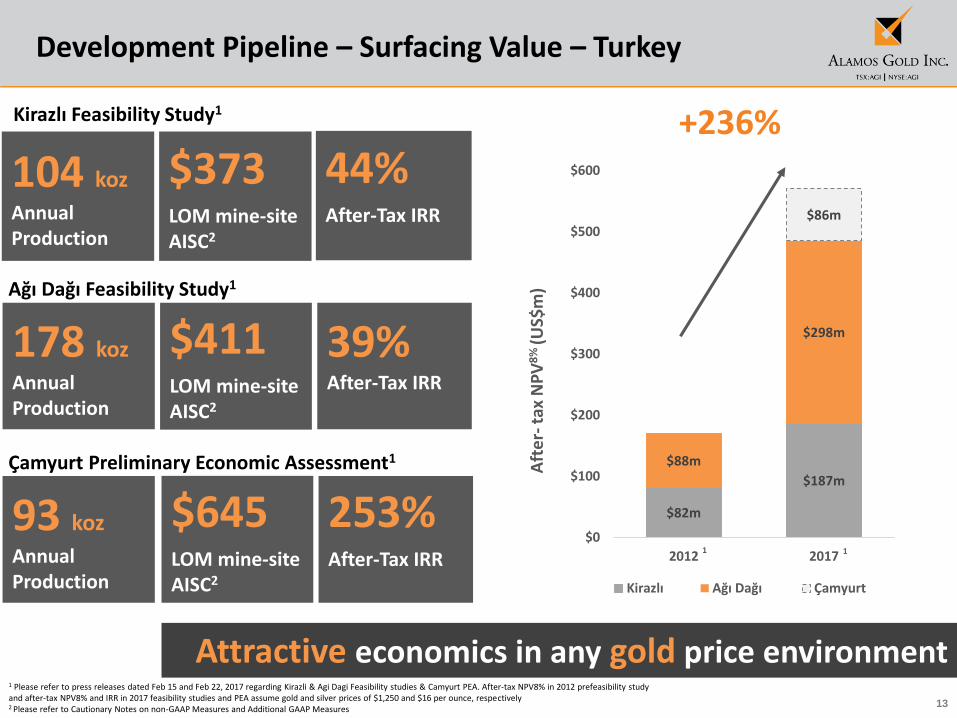
Development Pipeline – Surfacing Value – Turkey
Aft
er-
tax
NP
V8
% (U
S$m
)
$82m
$187m
$88m
$298m
$86m
$0
$100
$200
$300
$400
$500
$600
2012 2017
Kirazlı Ağı Dağı Çamyurt
+236%
104 koz
Annual Production
$373LOM mine-site AISC2
44%After-Tax IRR
Kirazlı Feasibility Study1
178 koz
Annual Production
$411LOM mine-site AISC2
39%After-Tax IRR
Ağı Dağı Feasibility Study1
93 koz
Annual Production
$645LOM mine-site AISC2
253%After-Tax IRR
Çamyurt Preliminary Economic Assessment1
Attractive economics in any gold price environment1 Please refer to press releases dated Feb 15 and Feb 22, 2017 regarding Kirazli & Agi Dagi Feasibility studies & Camyurt PEA. After-tax NPV8% in 2012 prefeasibility study and after-tax NPV8% and IRR in 2017 feasibility studies and PEA assume gold and silver prices of $1,250 and $16 per ounce, respectively 2 Please refer to Cautionary Notes on non-GAAP Measures and Additional GAAP Measures
11

14
$1,091
$1,010$940
2015A 2016A 2017E2015A 2016A 2017E
$1,241
$1,103$1,065
2015A 2016A 2017E 2015A 2016A 2017E
2017 Guidance – Growing Production, Declining Costs
Gold Production (000 oz) AISC1,2 (US$/oz)
-7%
Total Capital Spending (US$m)
$147m$140-157m
Cost of Sales3 (US$/oz)
1 Please refer to Cautionary Notes on non-GAAP Measures and Additional GAAP Measures. 2 Total consolidated all-in sustaining costs include corporate and administrative and share based compensation expenses. 3 Cost of sales includes mining and processing costs, royalties and amortization.4 Total capital spending for Alamos has been included for the periods prior to July 2, 2015 for comparative purposes only.
392
400 – 430
+6%
380
$190m4
15
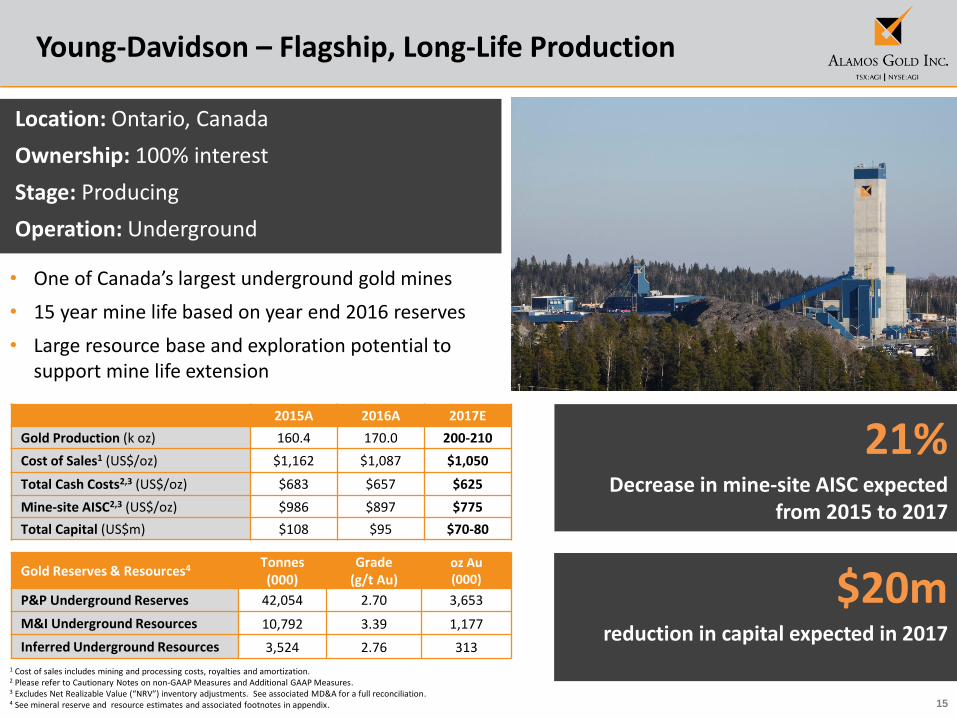
Young-Davidson – Flagship, Long-Life Production
Location: Ontario, Canada
Ownership: 100% interest
Stage: Producing
Operation: Underground
• One of Canada’s largest underground gold mines
• 15 year mine life based on year end 2016 reserves
• Large resource base and exploration potential to support mine life extension
Gold Reserves & Resources4 Tonnes (000)
Grade (g/t Au)
oz Au (000)
P&P Underground Reserves 42,054 2.70 3,653
M&I Underground Resources 10,792 3.39 1,177
Inferred Underground Resources 3,524 2.76 313
$20mreduction in capital expected in 2017
21%Decrease in mine-site AISC expected
from 2015 to 2017
1 Cost of sales includes mining and processing costs, royalties and amortization.2 Please refer to Cautionary Notes on non-GAAP Measures and Additional GAAP Measures.3 Excludes Net Realizable Value (“NRV”) inventory adjustments. See associated MD&A for a full reconciliation.4 See mineral reserve and resource estimates and associated footnotes in appendix.
2015A 2016A 2017E
Gold Production (k oz) 160.4 170.0 200-210
Cost of Sales1 (US$/oz) $1,162 $1,087 $1,050
Total Cash Costs2,3 (US$/oz) $683 $657 $625
Mine-site AISC2,3 (US$/oz) $986 $897 $775
Total Capital (US$m) $108 $95 $70-80

16
Growing production; declining costs; declining capital intensity
6,675 tpdaverage underground mining rate
in Q4 2016
Young-Davidson – Ramp up of Underground Mining
Owner developmenttransition completed in April 2016
>7,000 tpdachieved 2016 year-end
underground mining rate target
Please refer to Cautionary Notes on non-GAAP Measures and Additional GAAP Measures.
0
1,000
2,000
3,000
4,000
5,000
6,000
7,000
8,000
Q1
/13
Q2
/13
Q3
/13
Q4
/13
Q1
/14
Q2
/14
Q3
/14
Q4
/14
Q1
/15
Q2
/15
Q3
/15
Q4
/15
Q1
/16
Q2
/16
Q3
/16
Q4
/16
Mill TPD Underground TPD
6,500 - 7,500 tpdunderground mining rate
expected in 2017
17
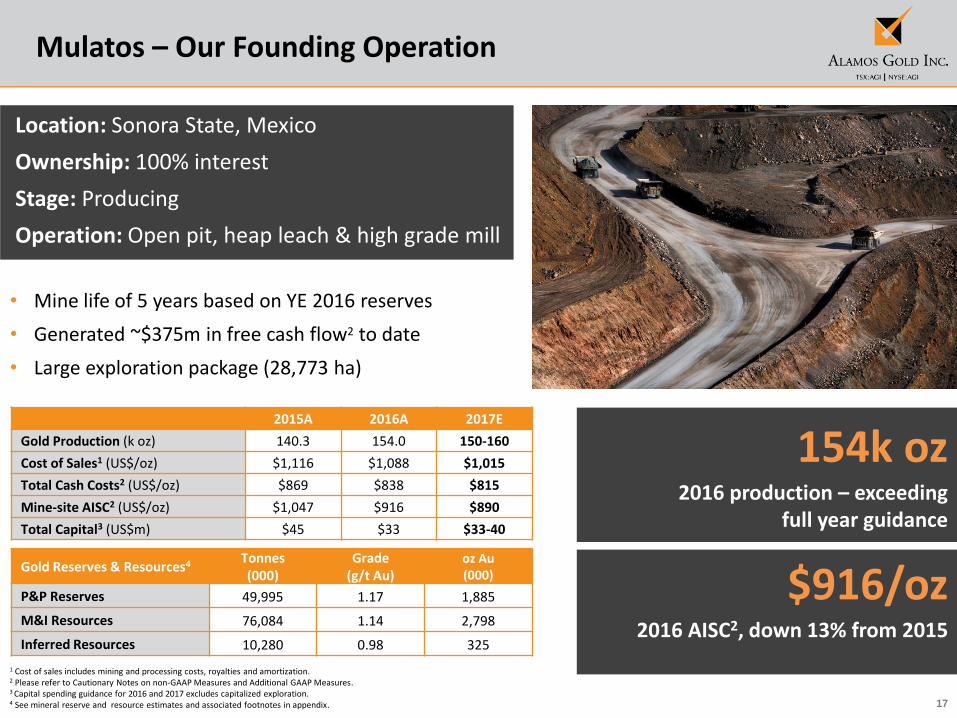
Mulatos – Our Founding Operation
Location: Sonora State, Mexico
Ownership: 100% interest
Stage: Producing
Operation: Open pit, heap leach & high grade mill
• Mine life of 5 years based on YE 2016 reserves
• Generated ~$375m in free cash flow2 to date
• Large exploration package (28,773 ha)
Gold Reserves & Resources4 Tonnes (000)
Grade (g/t Au)
oz Au(000)
P&P Reserves 49,995 1.17 1,885
M&I Resources 76,084 1.14 2,798
Inferred Resources 10,280 0.98 325
$916/oz2016 AISC2, down 13% from 2015
154k oz2016 production – exceeding
full year guidance
1 Cost of sales includes mining and processing costs, royalties and amortization.2 Please refer to Cautionary Notes on non-GAAP Measures and Additional GAAP Measures.3 Capital spending guidance for 2016 and 2017 excludes capitalized exploration.4 See mineral reserve and resource estimates and associated footnotes in appendix.
2015A 2016A 2017E
Gold Production (k oz) 140.3 154.0 150-160
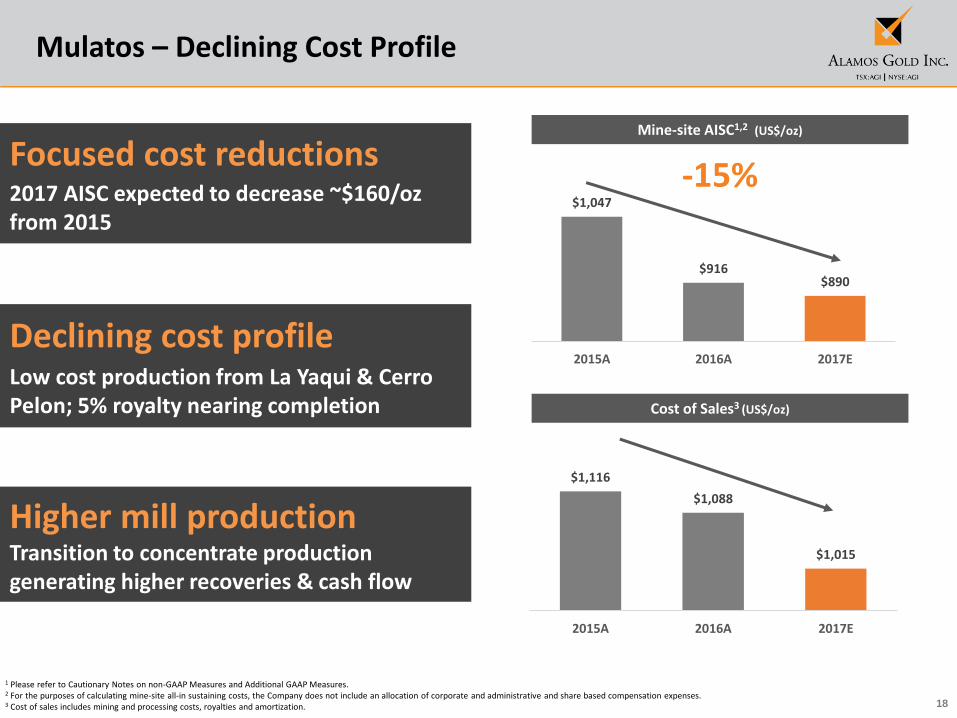
Cost of Sales1 (US$/oz) $1,116 $1,088 $1,015
Total Cash Costs2 (US$/oz) $869 $838 $815
Mine-site AISC2 (US$/oz) $1,047 $916 $890
Total Capital3 (US$m) $45 $33 $33-40
18
$1,047
$916$890
2015A 2016A 2017E
Focused cost reductions2017 AISC expected to decrease ~$160/oz from 2015
Higher mill productionTransition to concentrate production generating higher recoveries & cash flow
Declining cost profileLow cost production from La Yaqui & Cerro Pelon; 5% royalty nearing completion
1 Please refer to Cautionary Notes on non-GAAP Measures and Additional GAAP Measures. 2 For the purposes of calculating mine-site all-in sustaining costs, the Company does not include an allocation of corporate and administrative and share based compensation expenses.3 Cost of sales includes mining and processing costs, royalties and amortization.
Mine-site AISC1,2 (US$/oz)
Cost of Sales3 (US$/oz)
-15%
$1,116
$1,088
$1,015
2015A 2016A 2017E
Mulatos – Declining Cost Profile
19
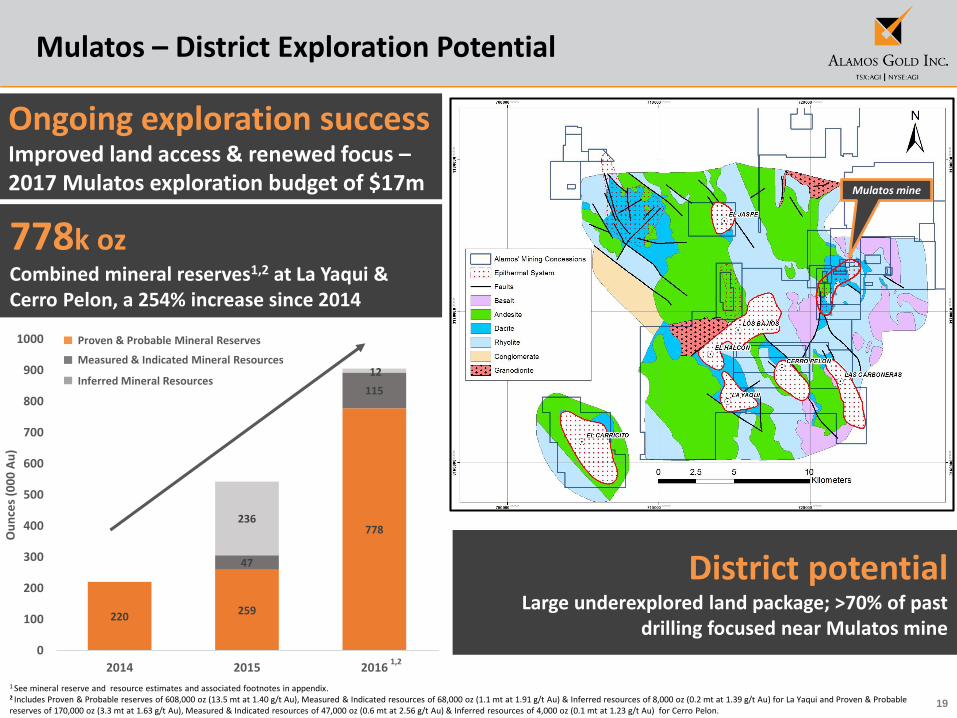
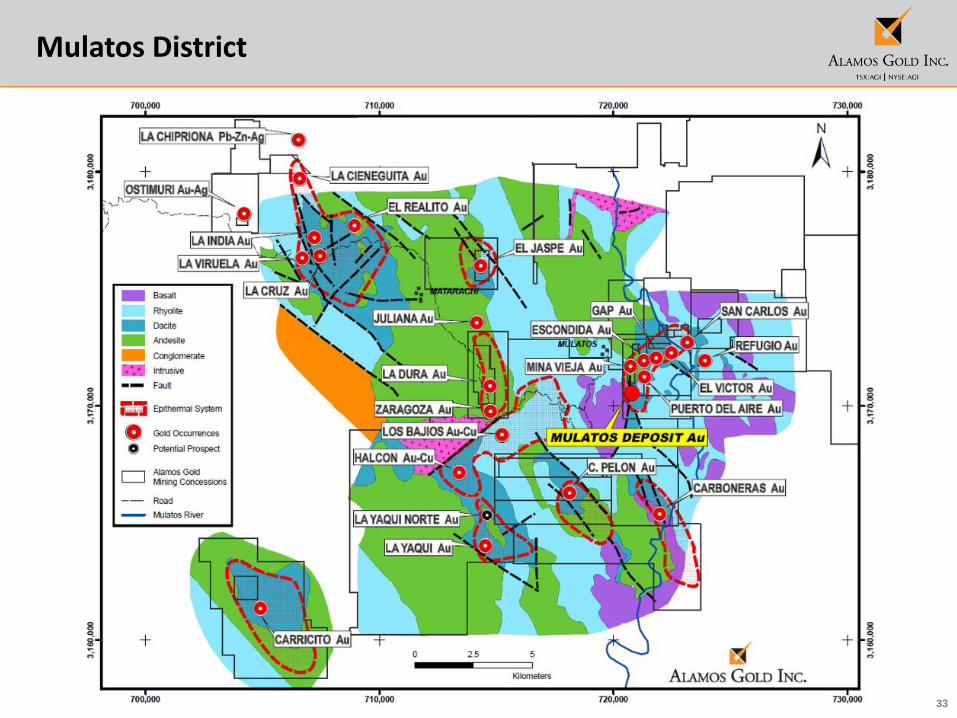
Mulatos – District Exploration Potential
1 See mineral reserve and resource estimates and associated footnotes in appendix.2 Includes Proven & Probable reserves of 608,000 oz (13.5 mt at 1.40 g/t Au), Measured & Indicated resources of 68,000 oz (1.1 mt at 1.91 g/t Au) & Inferred resources of 8,000 oz (0.2 mt at 1.39 g/t Au) for La Yaqui and Proven & Probable reserves of 170,000 oz (3.3 mt at 1.63 g/t Au), Measured & Indicated resources of 47,000 oz (0.6 mt at 2.56 g/t Au) & Inferred resources of 4,000 oz (0.1 mt at 1.23 g/t Au) for Cerro Pelon.
778k oz Combined mineral reserves1,2 at La Yaqui & Cerro Pelon, a 254% increase since 2014
District potentialLarge underexplored land package; >70% of past
drilling focused near Mulatos mine
Mulatos District
Mulatos mine
220259
778
47
115
236
12
0
100
200
300
400
500
600
700
800
900
1000
2014 2015 2016
Ou
nce
s (0
00
Au
)
Proven & Probable Mineral Reserves
Inferred Mineral Resources
Measured & Indicated Mineral Resources
1,2
Ongoing exploration success Improved land access & renewed focus –2017 Mulatos exploration budget of $17m

20
El Chanate – Consistent Gold Producer
Location: Sonora State, Mexico
Ownership: 100% interest
Stage: Producing
Operation: Open pit, heap leach
• Positive free cash flow generation in 2016
• Significant free cash flow at end of mine life – low cost production through residual leaching
1 Cost of sales includes mining and processing costs, royalties and amortization.2 Please refer to Cautionary Notes on non-GAAP Measures and Additional GAAP Measures.3 Excludes Net Realizable Value (“NRV”) inventory adjustments. See associated MD&A for a full reconciliation.4 See mineral reserve and resource estimates and associated footnotes in appendix.5 ~75% of El Chanate’s 2017 expected production has been hedged through gold collars ensuring minimum gold price of $1,225/oz and participation up to $1,450/oz
Gold Reserves & Resources4 Tonnes (000)
Grade (g/t Au)
oz Au(000)
P&P Reserves – Open Pit 10,812 0.56 193
P&P Reserves – Leach Pad Inventory - - 100
M&I Resources 4,415 0.66 93
~75%2017 production hedged ensuring minimum gold price of $1,225/oz5
$5m Site free cash flow2 generated in 2016
2015A 2016A 2017E
Gold Production (k oz) 79.3 68.0 50-60
Cost of Sales1 (US$/oz) $1,504 $1,177 $1,265
Total Cash Costs2,3 (US$/oz) $808 $1,052 $1,200
Mine-site AISC2,3 (US$/oz) $978 $1,069 $1,200
Total Capital (US$m) $14 $1 $2
21
Development: Kirazlı, Ağı Dağı & Çamyurt
1 Please refer to press releases dated Feb 15 and Feb 22, 2017 regarding Kirazli & Agi Dagi feasibility studies & Camyurtpreliminary economic assessment2 Please refer to Cautionary Notes on non-GAAP Measures and Additional GAAP Measures3 See mineral reserve and resource estimates and associated footnotes in appendix
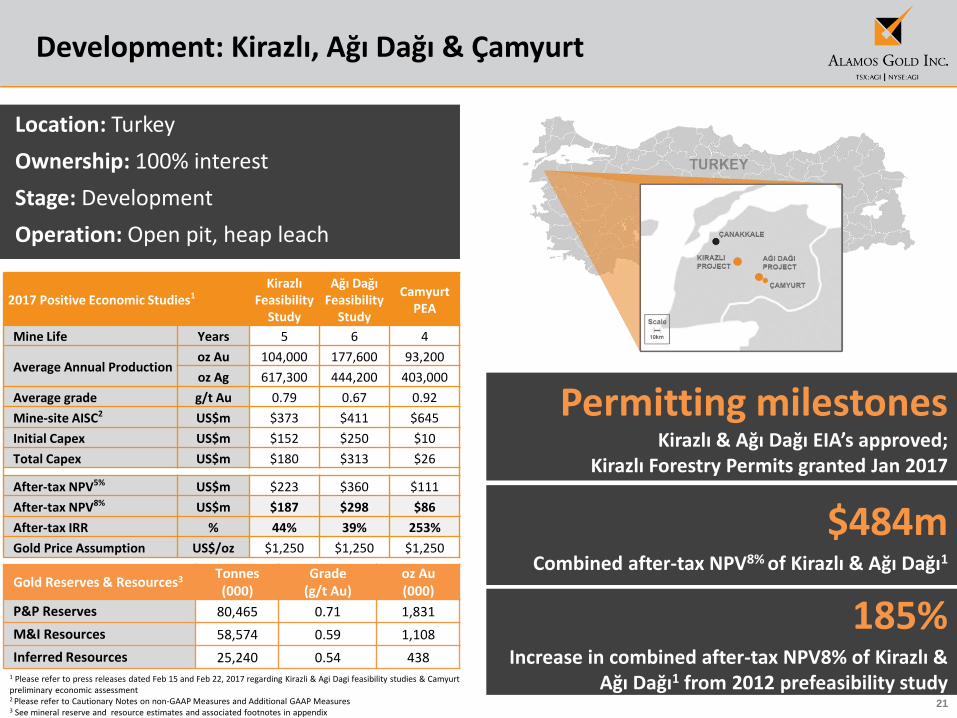
Location: Turkey
Ownership: 100% interest
Stage: Development
Operation: Open pit, heap leach
Permitting milestonesKirazlı & Ağı Dağı EIA’s approved;
Kirazlı Forestry Permits granted Jan 2017
185%Increase in combined after-tax NPV8% of Kirazlı &
Ağı Dağı1 from 2012 prefeasibility study
Gold Reserves & Resources3 Tonnes (000)
Grade (g/t Au)
oz Au(000)
P&P Reserves 80,465 0.71 1,831
M&I Resources 58,574 0.59 1,108
Inferred Resources 25,240 0.54 438
$484mCombined after-tax NPV8% of Kirazlı & Ağı Dağı1
2017 Positive Economic Studies1Kirazlı
Feasibility Study
Ağı Dağı Feasibility
Study
CamyurtPEA
Mine Life Years 5 6 4
Average Annual Productionoz Au 104,000 177,600 93,200
oz Ag 617,300 444,200 403,000
Average grade g/t Au 0.79 0.67 0.92
Mine-site AISC2 US$m $373 $411 $645
Initial Capex US$m $152 $250 $10
Total Capex US$m $180 $313 $26
After-tax NPV5% US$m $223 $360 $111
After-tax NPV8% US$m $187 $298 $86
After-tax IRR % 44% 39% 253%
Gold Price Assumption US$/oz $1,250 $1,250 $1,250
22
Development: Lynn Lake Project – High Grade, Open Pit
1 For more information regarding the Lynn Lake District, please refer to the press release issued by Carlisle Goldfields dated February 27, 2014 titled Carlisle Announces Optimized PEA of the Farley and MacLellan deposits at Lynn Lake returns Post-Tax IRR of 26.3% at US$1,100 gold price available on SEDAR.2 See mineral reserve and resource estimates and associated footnotes in appendix.3 Please refer to Cautionary Notes on non-GAAP Measures and Additional GAAP Measures.
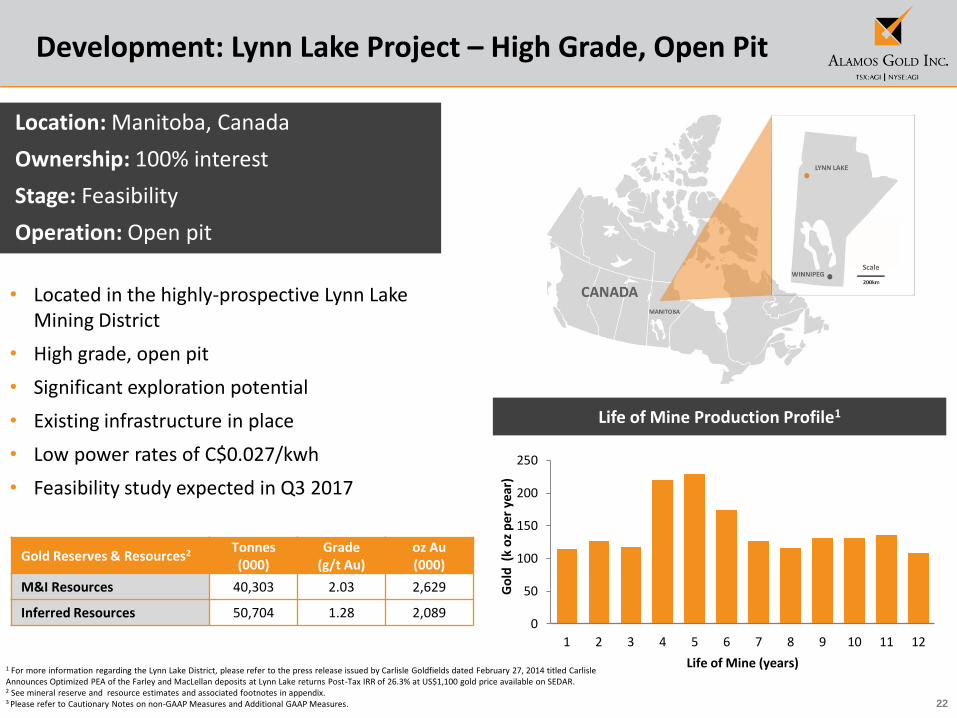
Location: Manitoba, Canada
Ownership: 100% interest
Stage: Feasibility
Operation: Open pit
• Located in the highly-prospective Lynn Lake Mining District
• High grade, open pit
• Significant exploration potential
• Existing infrastructure in place
• Low power rates of C$0.027/kwh
• Feasibility study expected in Q3 2017
Life of Mine Production Profile1
0
50
100
150
200
250
1 2 3 4 5 6 7 8 9 10 11 12
Go
ld (
k o
z p
er y
ear
)
Life of Mine (years)
Gold Reserves & Resources2 Tonnes (000)
Grade (g/t Au)
oz Au (000)
M&I Resources 40,303 2.03 2,629
Inferred Resources 50,704 1.28 2,089

23
Development: Esperanza & Quartz Mountain
1 Please refer to Cautionary Notes on non-GAAP Measures and Additional GAAP Measures2 Historic column recovery tests for gold at Quartz Mountain varied between 74% and 88% for the felsic rock hosted mineralization; see Orsa Ventures press release dated February 12, 20133 See mineral reserve and resource estimates and associated footnotes in appendix.4 Additional C$3m due on completion of feasibility study & C$15m or 2% NSR upon successful permitting
Location: Morelos State, Mexico
Ownership: 100% interest
Stage: Development
Operation: Open pit, heap leach
• Excellent infrastructure; low technical risk
• Low capital intensity and operating costs
• Average annual production potential > 100,000 oz
• All-in sustaining costs expected to be lowest quartile1
Location: Oregon, United States
Ownership: Right to earn a 100% interest4
Stage: Advanced Exploration
• Located on northern extension of prolific Basin & Range
Province of Nevada
• Low strip ratio, favourable metallurgy2
• Acquisition cost $3.5m
Tonnes Grade Contained Ounces
(000) (g/t Au) (g/t Ag) (000 Au) (000 Ag)
Measured & Indicated3 34,352 0.98 8.09 1,083 8,936
Inferred 718 0.80 15.04 18 347
Quartz Butte
Crone Hill
Tonnes Grade Contained Ounces
(000) (g/t Au) (000 Au)
Measured & Indicated3 12,156 0.87 339
Inferred 39,205 0.91 1,147
Project: Esperanza
Project: Quartz Mountain
24
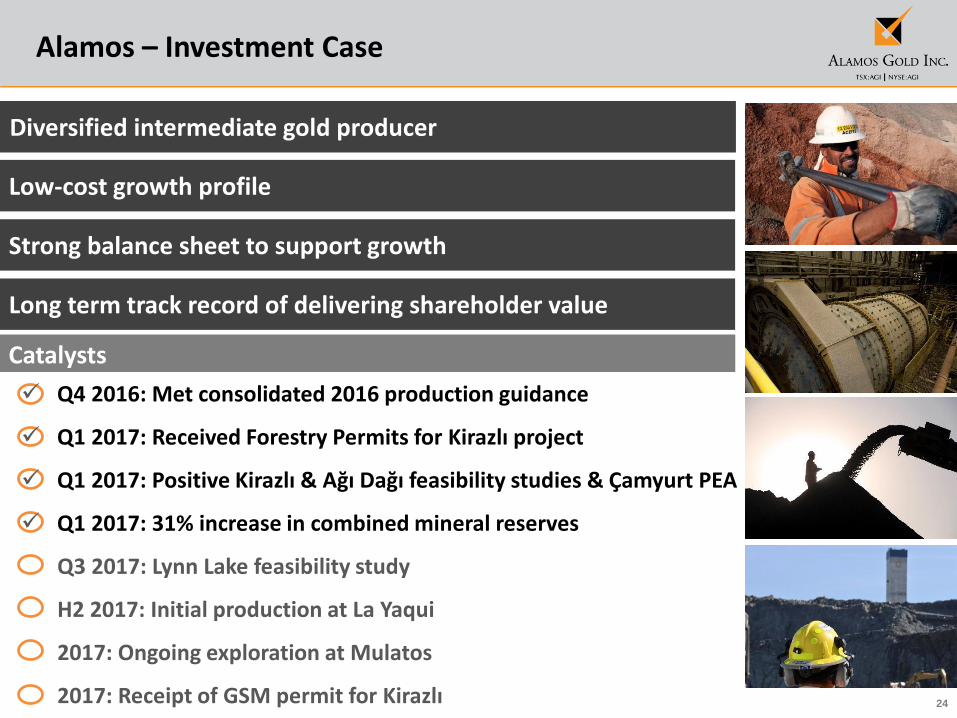
Q4 2016: Met consolidated 2016 production guidance
Q1 2017: Received Forestry Permits for Kirazlı project
Q1 2017: Positive Kirazlı & Ağı Dağı feasibility studies & Çamyurt PEA
Q1 2017: 31% increase in combined mineral reserves
Q3 2017: Lynn Lake feasibility study
H2 2017: Initial production at La Yaqui
2017: Ongoing exploration at Mulatos
2017: Receipt of GSM permit for Kirazlı
Alamos – Investment Case
Diversified intermediate gold producer
Low-cost growth profile
Strong balance sheet to support growth
Long term track record of delivering shareholder value
Catalysts
25
Appendices
26
Board of Directors and Executive and Management Team
Paul J. Murphy Chairman
John A. McCluskey Director
Mark J. Daniel Director
Patrick D. Downey Director
David Fleck Director
David Gower Director
Claire M. C. Kennedy Director
Ronald E. Smith Director
Kenneth Stowe Director
John A. McCluskey President and Chief Executive Officer
Jamie Porter Chief Financial Officer
Peter MacPhail Chief Operating Officer
Christine Barwell Vice President, Human Resources
Chris Bostwick Vice President, Technical Services
Luis Chavez Senior Vice President, Mexico
Andrew Cormier Vice President, Development & Construction
Nils Engelstad Vice President, General Counsel
Greg Fisher Vice President, Finance
Aoife McGrath Vice President, Exploration
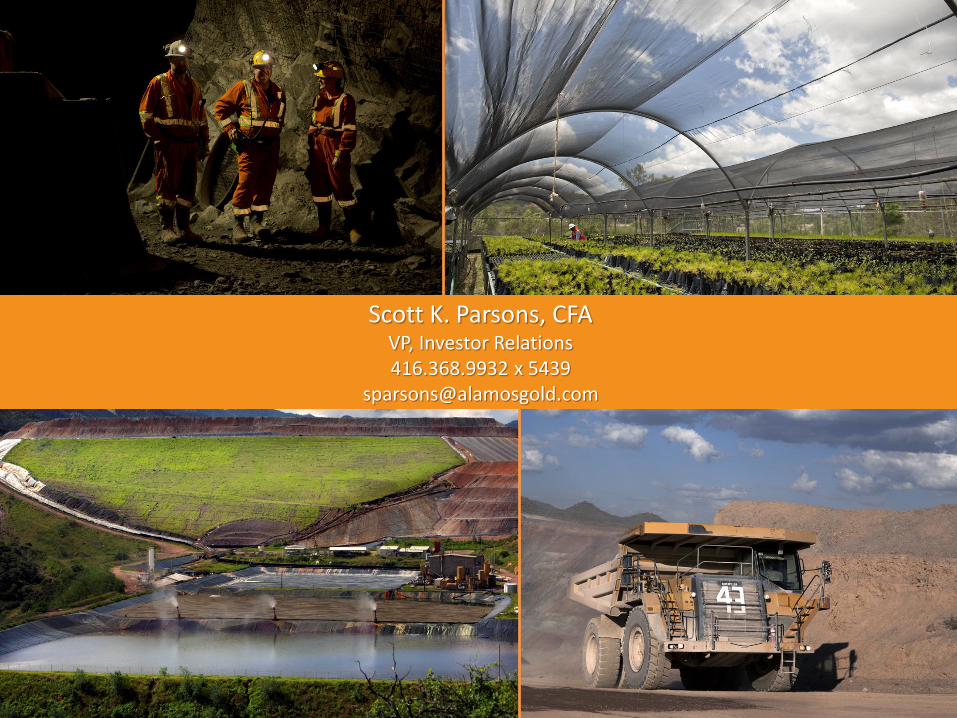
Scott Parsons Vice President, Investor Relations
Colin Webster Vice President, Sustainability & External Affairs
Board of Directors Executive and Management Team
27
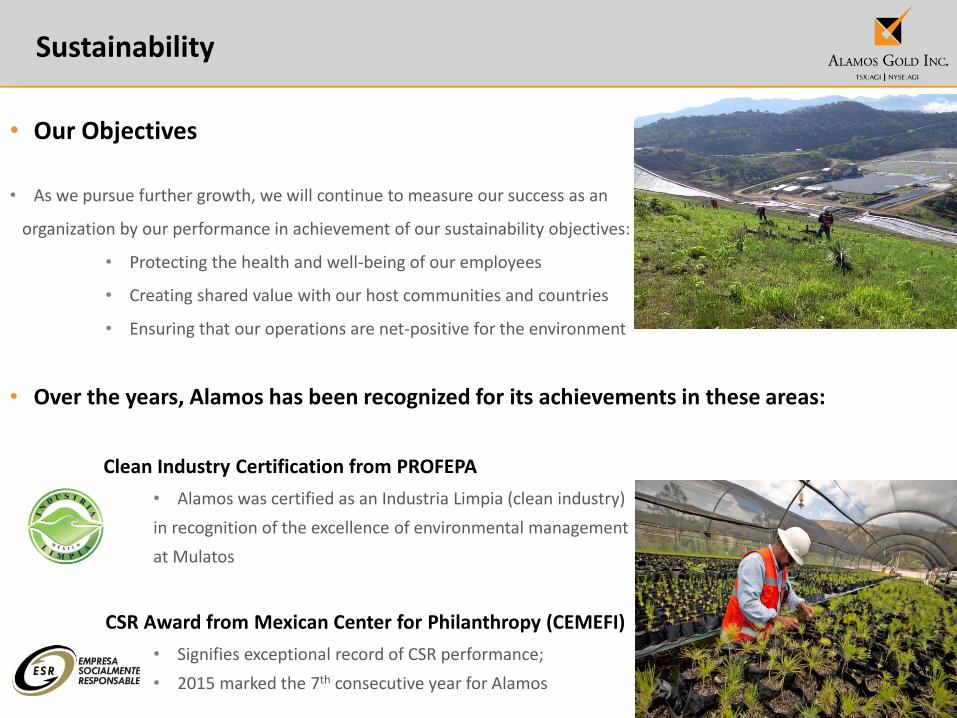
Sustainability
• Our Objectives
• As we pursue further growth, we will continue to measure our success as an
organization by our performance in achievement of our sustainability objectives:
• Protecting the health and well-being of our employees
• Creating shared value with our host communities and countries
• Ensuring that our operations are net-positive for the environment
• Over the years, Alamos has been recognized for its achievements in these areas:
Clean Industry Certification from PROFEPA
• Alamos was certified as an Industria Limpia (clean industry)
in recognition of the excellence of environmental management
at Mulatos
CSR Award from Mexican Center for Philanthropy (CEMEFI)
• Signifies exceptional record of CSR performance;
• 2015 marked the 7th consecutive year for Alamos
28
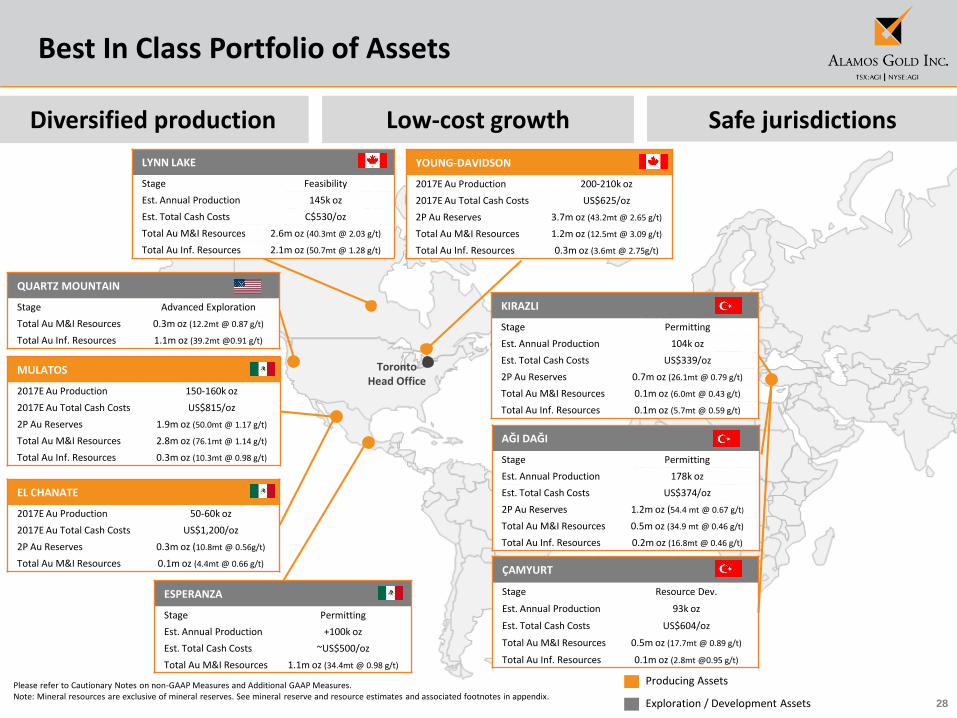
Best In Class Portfolio of Assets
MULATOS
2017E Au Production 150-160k oz
2017E Au Total Cash Costs US$815/oz
2P Au Reserves 1.9m oz (50.0mt @ 1.17 g/t)
Total Au M&I Resources 2.8m oz (76.1mt @ 1.14 g/t)
Total Au Inf. Resources 0.3m oz (10.3mt @ 0.98 g/t)
EL CHANATE
2017E Au Production 50-60k oz
2017E Au Total Cash Costs US$1,200/oz
2P Au Reserves 0.3m oz (10.8mt @ 0.56g/t)
Total Au M&I Resources 0.1m oz (4.4mt @ 0.66 g/t)
QUARTZ MOUNTAIN
Stage Advanced Exploration
Total Au M&I Resources 0.3m oz (12.2mt @ 0.87 g/t)
Total Au Inf. Resources 1.1m oz (39.2mt @0.91 g/t)
YOUNG-DAVIDSON
2017E Au Production 200-210k oz
2017E Au Total Cash Costs US$625/oz
2P Au Reserves 3.7m oz (43.2mt @ 2.65 g/t)
Total Au M&I Resources 1.2m oz (12.5mt @ 3.09 g/t)
Total Au Inf. Resources 0.3m oz (3.6mt @ 2.75g/t)
AĞI DAĞI
Stage Permitting
Est. Annual Production 178k oz
Est. Total Cash Costs US$374/oz
2P Au Reserves 1.2m oz (54.4 mt @ 0.67 g/t)
Total Au M&I Resources 0.5m oz (34.9 mt @ 0.46 g/t)
Total Au Inf. Resources 0.2m oz (16.8mt @ 0.46 g/t)
Producing Assets
Exploration / Development Assets
TorontoHead Office
ESPERANZA
Stage Permitting
Est. Annual Production +100k oz
Est. Total Cash Costs ~US$500/oz
Total Au M&I Resources 1.1m oz (34.4mt @ 0.98 g/t)
KIRAZLI
Stage Permitting
Est. Annual Production 104k oz
Est. Total Cash Costs US$339/oz
2P Au Reserves 0.7m oz (26.1mt @ 0.79 g/t)
Total Au M&I Resources 0.1m oz (6.0mt @ 0.43 g/t)
Total Au Inf. Resources 0.1m oz (5.7mt @ 0.59 g/t)
ÇAMYURT
Stage Resource Dev.
Est. Annual Production 93k oz
Est. Total Cash Costs US$604/oz
Total Au M&I Resources 0.5m oz (17.7mt @ 0.89 g/t)
Total Au Inf. Resources 0.1m oz (2.8mt @0.95 g/t)
LYNN LAKE
Stage Feasibility
Est. Annual Production 145k oz
Est. Total Cash Costs C$530/oz
Total Au M&I Resources 2.6m oz (40.3mt @ 2.03 g/t)
Total Au Inf. Resources 2.1m oz (50.7mt @ 1.28 g/t)
Diversified production Low-cost growth Safe jurisdictions
Please refer to Cautionary Notes on non-GAAP Measures and Additional GAAP Measures.Note: Mineral resources are exclusive of mineral reserves. See mineral reserve and resource estimates and associated footnotes in appendix.

29
1 Please refer to Cautionary Notes on non-GAAP Measures and Additional GAAP Measures. 2 Excludes capitalized exploration.3 For the purposes of calculating mine-site all-in sustaining costs at individual mine sites, the Company does not include an allocation of corporate and administrative and share based compensation expenses to the mine sites.4 Cost of sales includes mining and processing costs, royalties, and amortization expense
2017 Guidance
2017 Guidance 2016 Actuals
Young-Davidson Mulatos El Chanate Total Total
Gold production (000’s ounces) 200-210 150-160 50-60 400-430 392
Cost of Sales (in millions) (4) $215 $157 $70 $442 $429
Cost of Sales ($/oz) (4) $1,050 $1,015 $1,265 $1,065 $1,103
Total cash costs ($/oz) (1) $625 $815 $1,200 $765 $797
All-in sustaining costs ($/oz) (1) $940 $1,010
Mine-site all-in sustaining costs ($/oz) (1),(3) $775 $890 $1,200 -
Capital expenditures (in millions)
Sustaining capital(1) $30-35 $8-10 $2 $40-47 $49
Growth capital(1) $40-45 $25-30 (2) - $65-75 $97
Total – Operating Mines(1) $70-80 $33-40 $2 $105-122 $128
Total – Development Projects $35 $18
Total Consolidated Budget $140-157 $147
Corporate & Administrative (in millions) $16 $16

30
Young-Davidson – Increasing Grade & Productivity
1 Cost of sales includes mining and processing costs, royalties and amortization.2 Please refer to Cautionary Notes on non-GAAP Measures and Additional GAAP Measures.3 Excludes Net Realizable Value (“NRV”) inventory adjustments. See associated MD&A for a full reconciliation.4 Excludes hydro rebate not attributable to Q4/15
Underground ramp up driving production higher and unit costs lower
Q1/13 Q2/13 Q3/13 Q4/13 Q1/14 Q2/14 Q3/14 Q4/14 Q1/15 Q2/15 Q3/15 Q4/15 Q1/16 Q2/16 Q3/16 Q4/16
Gold ounces produced 28,281 29,252 30,099 33,106 35,104 40,166 40,538 40,945 38,098 39,365 38,201 44,694 39,065 42,644 43,629 44,662
Cost of sales1 (US$/oz) Pre-commercial production $1,677 $1,625 $1,370 $1,211 $1,216 $1,298 $1,165 $986 $1,058 $1,182 $1,032 $1,077
Total cash costs per oz. (2,3) $694 $716 $666 $850 $1,009 $871 $723 $719 $745 $697 $681 $617 $616 $738 $607 $667
Mine-site AISC per oz.(2,3) $1,059 $1,254 $1,357 $1,270 $1,315 $1,144 $959 $912 $987 $1,008 $979 $980 $846 $965 $849 $926
Underground mine
Tonnes mined per day 1,130 1,611 1,417 2,590 2,611 3,595 3,753 4,140 4,130 5,149 5,081 5,911 5,776 6,123 5,467 6,675
Grades (g/t) 2.7 2.5 2.8 3.1 2.8 3.3 3.1 3.0 3.0 2.6 2.6 2.6 2.6 2.4 2.8 2.4
Development metres 1,941 2,445 2,620 2,986 3,772 3,545 3,269 3,438 3,409 3,789 3,619 3,769 3,490 3,168 2,677 3,044
Unit UG mining costs (US$)Pre-commercial production
$46 $45 $41 $39 $39 $33 $32 $294 $31 $34 $34 $32
Unit UG mining costs (CAD$) $51 $49 $45 $44 $48 $41 $41 $384 $42 $44 $45 $42
Mill processing facility
Tonnes processed per day 6,466 7,017 6,747 6,969 7,163 8,230 7,670 7,757 7,186 7,677 7,680 7,630 7,342 7,006 6,833 7,552
Grades (inc. OP stockpile) 1.8 1.7 1.7 2.0 1.8 2.2 1.9 2.0 2.0 2.0 1.9 2.2 2.1 2.1 2.4 2.2
Recoveries (%) 86% 85% 89% 88% 87% 88% 90% 88% 86% 88% 92% 91% 90% 92% 93% 90%
$0
$5
$10
$15
$20
$25
$30
$35
$40
$45
$50
1,000
2,000
3,000
4,000
5,000
6,000
7,000
Q1/14 Q2/14 Q3/14 Q4/14 Q1/15 Q2/15 Q3/15 Q4/15 Q1/16 Q2/16 Q3/16 Q4/16
Un
it U
G m
inin
g co
sts
(US$
/t)
Un
de
rgro
un
d T
PD
Underground tonnes mined per day Unit UG mining costs (US$/t)
31
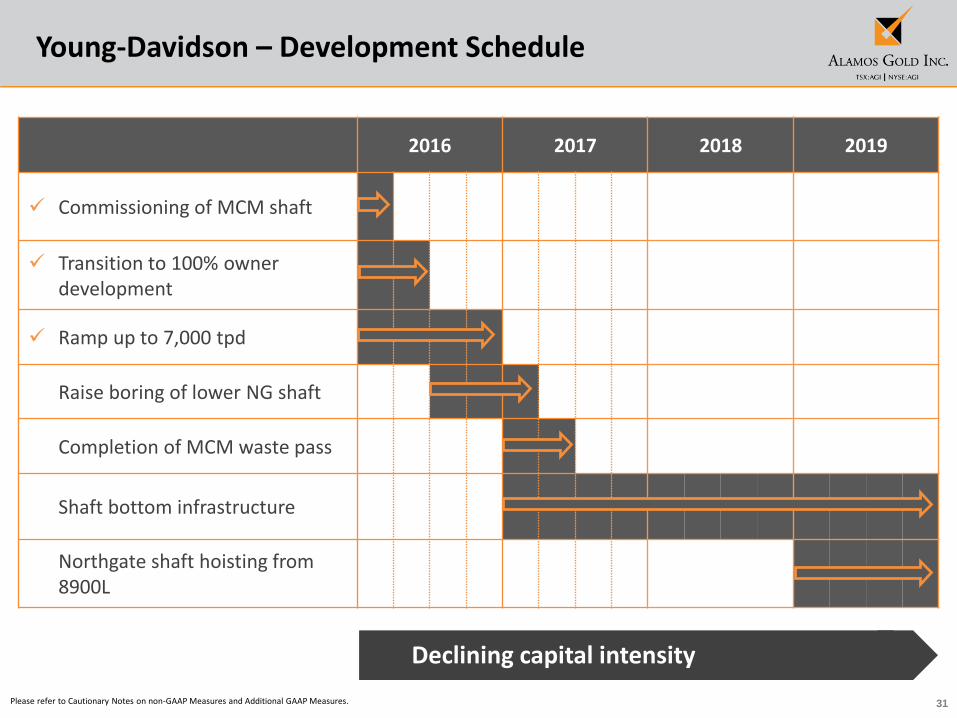
Young-Davidson – Development Schedule
Please refer to Cautionary Notes on non-GAAP Measures and Additional GAAP Measures.
Declining capital intensity
2016 2017 2018 2019
Commissioning of MCM shaft
Transition to 100% owner development
Ramp up to 7,000 tpd
• Raise boring of lower NG shaft
• Completion of MCM waste pass
• Shaft bottom infrastructure
• Northgate shaft hoisting from 8900L

32
Young-Davidson – Long Section
Productivity improvements & declining costs
Developing the underground to support ramp up of underground mining
Milled grade higher
Declining capital intensity
Higher underground mining rates driving:
Production growth
33
Mulatos District

34
35
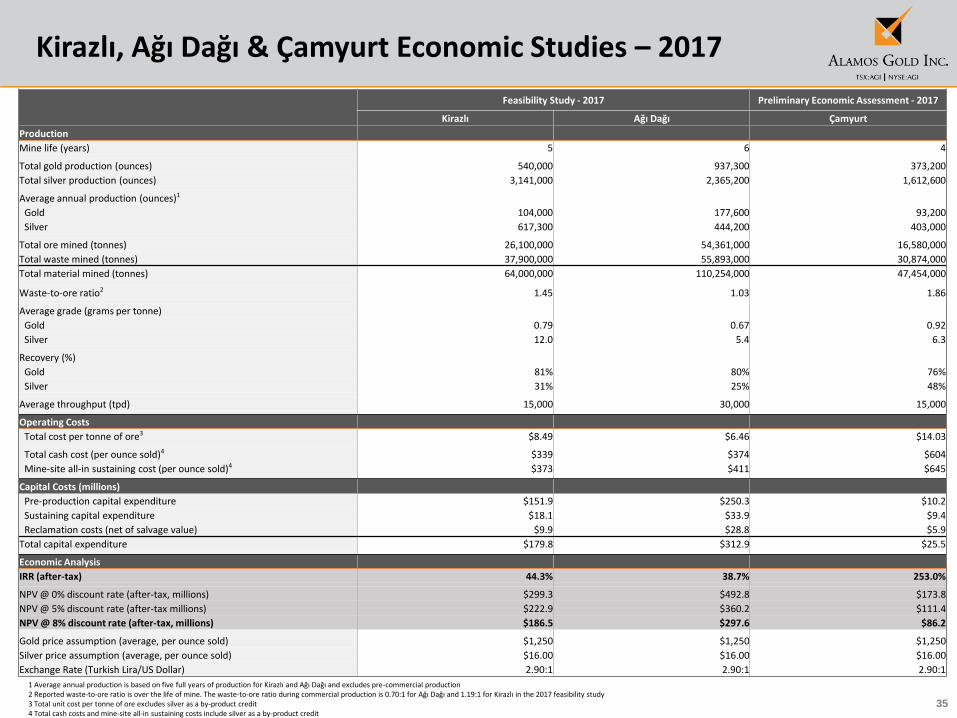
Kirazlı, Ağı Dağı & Çamyurt Economic Studies – 2017
Feasibility Study - 2017 Preliminary Economic Assessment - 2017
Kirazlı Ağı Dağı Çamyurt
Production
Mine life (years) 5 6 4
Total gold production (ounces) 540,000 937,300 373,200
Total silver production (ounces) 3,141,000 2,365,200 1,612,600
Average annual production (ounces)1
Gold 104,000 177,600 93,200
Silver 617,300 444,200 403,000
Total ore mined (tonnes) 26,100,000 54,361,000 16,580,000
Total waste mined (tonnes) 37,900,000 55,893,000 30,874,000
Total material mined (tonnes) 64,000,000 110,254,000 47,454,000
Waste-to-ore ratio2 1.45 1.03 1.86
Average grade (grams per tonne)
Gold 0.79 0.67 0.92
Silver 12.0 5.4 6.3
Recovery (%)
Gold 81% 80% 76%
Silver 31% 25% 48%
Average throughput (tpd) 15,000 30,000 15,000
Operating Costs
Total cost per tonne of ore3 $8.49 $6.46 $14.03
Total cash cost (per ounce sold)4 $339 $374 $604
Mine-site all-in sustaining cost (per ounce sold)4 $373 $411 $645
Capital Costs (millions)
Pre-production capital expenditure $151.9 $250.3 $10.2
Sustaining capital expenditure $18.1 $33.9 $9.4
Reclamation costs (net of salvage value) $9.9 $28.8 $5.9
Total capital expenditure $179.8 $312.9 $25.5
Economic Analysis
IRR (after-tax) 44.3% 38.7% 253.0%
NPV @ 0% discount rate (after-tax, millions) $299.3 $492.8 $173.8
NPV @ 5% discount rate (after-tax millions) $222.9 $360.2 $111.4
NPV @ 8% discount rate (after-tax, millions) $186.5 $297.6 $86.2
Gold price assumption (average, per ounce sold) $1,250 $1,250 $1,250
Silver price assumption (average, per ounce sold) $16.00 $16.00 $16.00
Exchange Rate (Turkish Lira/US Dollar) 2.90:1 2.90:1 2.90:1
1 Average annual production is based on five full years of production for Kirazlı and Ağı Dağı and excludes pre-commercial production2 Reported waste-to-ore ratio is over the life of mine. The waste-to-ore ratio during commercial production is 0.70:1 for Ağı Dağı and 1.19:1 for Kirazlı in the 2017 feasibility study3 Total unit cost per tonne of ore excludes silver as a by-product credit 4 Total cash costs and mine-site all-in sustaining costs include silver as a by-product credit
36
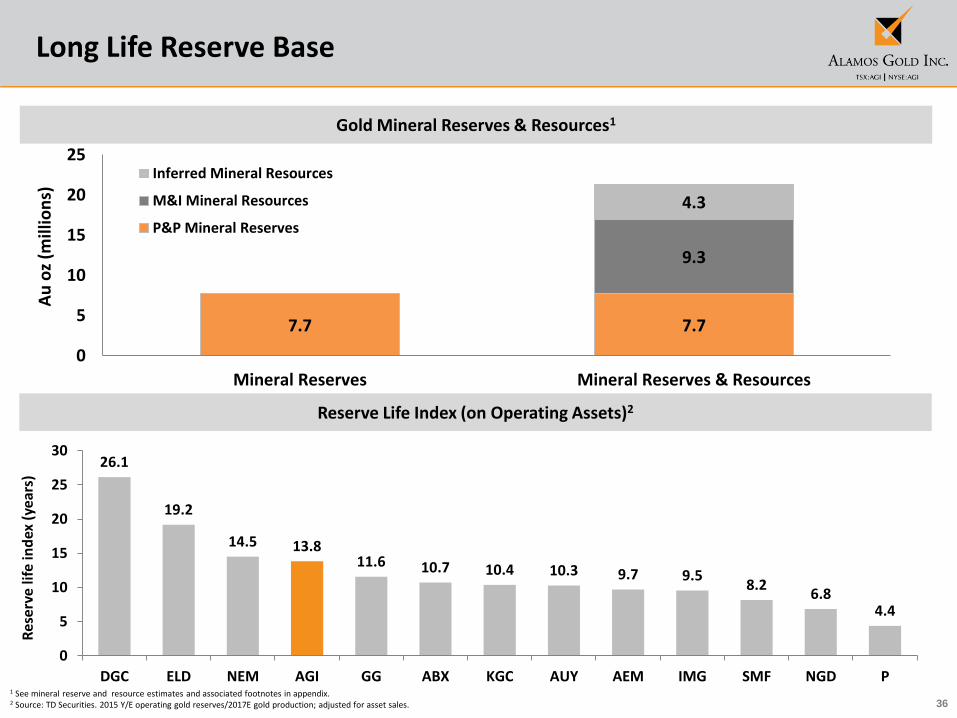
Long Life Reserve Base
Reserve Life Index (on Operating Assets)2
Gold Mineral Reserves & Resources1
1 See mineral reserve and resource estimates and associated footnotes in appendix.2 Source: TD Securities. 2015 Y/E operating gold reserves/2017E gold production; adjusted for asset sales.
26.1
19.2
14.5 13.811.6 10.7 10.4 10.3 9.7 9.5
8.26.8
4.4
0
5
10
15
20
25
30
DGC ELD NEM AGI GG ABX KGC AUY AEM IMG SMF NGD P
Res
erv
e lif
e in
dex
(ye
ars)
7.7 7.7
9.3
4.3
0
5
10
15
20
25
Mineral Reserves Mineral Reserves & Resources
Au
oz
(mill
ion
s)
Inferred Mineral Resources
M&I Mineral Resources
P&P Mineral Reserves

37
2016 Proven and Probable Mineral Reserves
PROVEN AND PROBABLE GOLD RESERVES (as at December 31, 2016)
Proven Reserves Probable Reserves Total Proven and Probable
Tonnes Grade Ounces Tonnes Grade Ounces Tonnes Grade Ounces
(000's) (g/t Au) (000's) (000's) (g/t Au) (000's) (000's) (g/t Au) (000's)
Young-Davidson - Surface 1,165 0.91 34 - - - 1,165 0.91 34
Young-Davidson - Underground 14,851 2.80 1,336 27,203 2.65 2,317 42,054 2.70 3,653
Total Young-Davidson 16,016 2.66 1,370 27,203 2.65 2,317 43,220 2.65 3,687
Mulatos Main Pits 4,173 1.02 137 21,847 0.87 613 26,020 0.90 750
San Carlos Underground 72 13.06 30 34 8.64 9 106 11.65 40
Stockpiles 7,129 1.38 317 - - - 7,129 1.38 317
La Yaqui 470 1.48 22 1,469 1.37 65 1,939 1.40 87
La Yaqui Grande - - - 11,548 1.40 521 11,548 1.40 521
Cerro Pelon 960 1.70 53 2,293 1.59 117 3,253 1.63 170
Total Mulatos 12,804 1.36 559 37,191 1.11 1,325 49,995 1.17 1,885
El Chanate - Open Pit 7,008 0.51 114 3,804 0.65 79 10,812 0.56 193
El Chanate - Leach Pad Inv. - - 100 - - - - - 100
Total El Chanate 7,008 0.95 214 3,804 0.65 79 10,812 0.84 293
Agi Dagi 1,450 0.76 36 52,911 0.66 1,130 54,361 0.67 1,166
Kirazli 700 1.25 28 25,404 0.78 637 26,104 0.79 665
Total Turkey 2,150 0.93 64 78,315 0.70 1,767 80,465 0.71 1,831
Alamos - Total 37,979 1.81 2,208 146,513 1.17 5,488 184,492 1.30 7,696
PROVEN AND PROBABLE SILVER MINERAL RESERVES (as at December 31, 2016)
Proven Reserves Probable Reserves Total Proven and Probable
Tonnes Grade Ounces Tonnes Grade Ounces Tonnes Grade Ounces
(000's) (g/t Ag) (000's) (000's) (g/t Ag) (000's) (000's) (g/t Ag) (000's)
La Yaqui 470 7.40 112 1,469 7.19 340 1,939 7.25 452
La Yaqui Grande - - - 11,548 19.94 7,403 11,548 19.94 7,403
Ağı Dağı 1,450 6.22 290 52,911 5.39 9,169 54,361 5.41 9,459
Kirazli 700 15.90 358 25,404 11.90 9,720 26,104 12.01 10,078
Alamos - Total 2,620 9.02 760 91,332 9.07 26,632 93,952 9.07 27,392
38
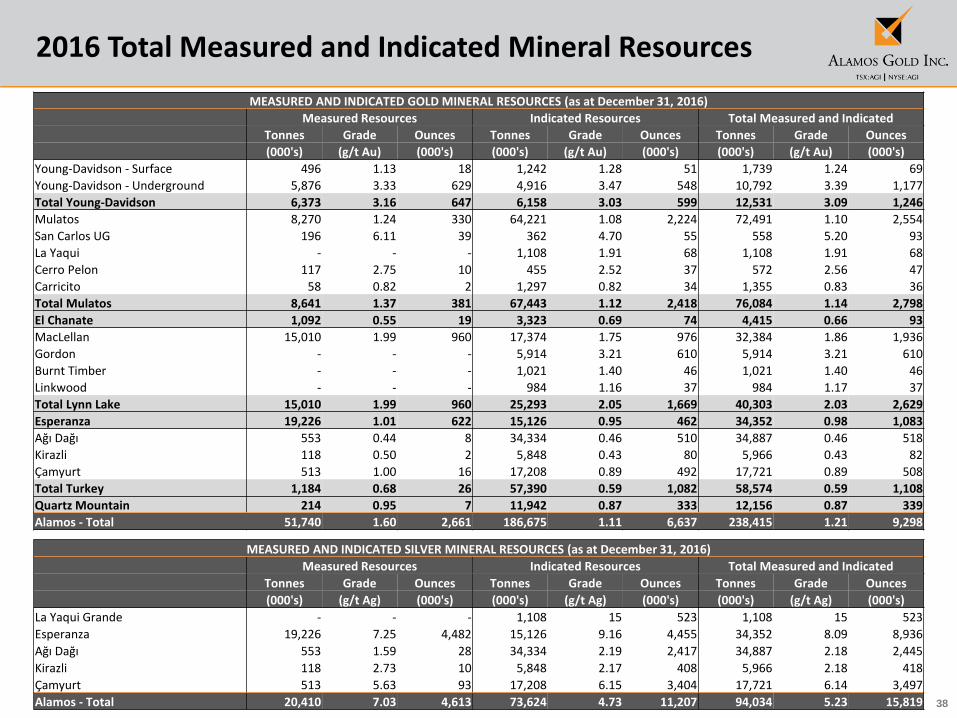
2016 Total Measured and Indicated Mineral Resources
MEASURED AND INDICATED GOLD MINERAL RESOURCES (as at December 31, 2016)
Measured Resources Indicated Resources Total Measured and Indicated
Tonnes Grade Ounces Tonnes Grade Ounces Tonnes Grade Ounces
(000's) (g/t Au) (000's) (000's) (g/t Au) (000's) (000's) (g/t Au) (000's)
Young-Davidson - Surface 496 1.13 18 1,242 1.28 51 1,739 1.24 69
Young-Davidson - Underground 5,876 3.33 629 4,916 3.47 548 10,792 3.39 1,177
Total Young-Davidson 6,373 3.16 647 6,158 3.03 599 12,531 3.09 1,246
Mulatos 8,270 1.24 330 64,221 1.08 2,224 72,491 1.10 2,554
San Carlos UG 196 6.11 39 362 4.70 55 558 5.20 93
La Yaqui - - - 1,108 1.91 68 1,108 1.91 68
Cerro Pelon 117 2.75 10 455 2.52 37 572 2.56 47
Carricito 58 0.82 2 1,297 0.82 34 1,355 0.83 36
Total Mulatos 8,641 1.37 381 67,443 1.12 2,418 76,084 1.14 2,798
El Chanate 1,092 0.55 19 3,323 0.69 74 4,415 0.66 93
MacLellan 15,010 1.99 960 17,374 1.75 976 32,384 1.86 1,936
Gordon - - - 5,914 3.21 610 5,914 3.21 610
Burnt Timber - - - 1,021 1.40 46 1,021 1.40 46
Linkwood - - - 984 1.16 37 984 1.17 37
Total Lynn Lake 15,010 1.99 960 25,293 2.05 1,669 40,303 2.03 2,629
Esperanza 19,226 1.01 622 15,126 0.95 462 34,352 0.98 1,083
Ağı Dağı 553 0.44 8 34,334 0.46 510 34,887 0.46 518
Kirazli 118 0.50 2 5,848 0.43 80 5,966 0.43 82
Çamyurt 513 1.00 16 17,208 0.89 492 17,721 0.89 508
Total Turkey 1,184 0.68 26 57,390 0.59 1,082 58,574 0.59 1,108
Quartz Mountain 214 0.95 7 11,942 0.87 333 12,156 0.87 339
Alamos - Total 51,740 1.60 2,661 186,675 1.11 6,637 238,415 1.21 9,298
MEASURED AND INDICATED SILVER MINERAL RESOURCES (as at December 31, 2016)
Measured Resources Indicated Resources Total Measured and Indicated
Tonnes Grade Ounces Tonnes Grade Ounces Tonnes Grade Ounces
(000's) (g/t Ag) (000's) (000's) (g/t Ag) (000's) (000's) (g/t Ag) (000's)
La Yaqui Grande - - - 1,108 15 523 1,108 15 523
Esperanza 19,226 7.25 4,482 15,126 9.16 4,455 34,352 8.09 8,936
Ağı Dağı 553 1.59 28 34,334 2.19 2,417 34,887 2.18 2,445
Kirazli 118 2.73 10 5,848 2.17 408 5,966 2.18 418
Çamyurt 513 5.63 93 17,208 6.15 3,404 17,721 6.14 3,497
Alamos - Total 20,410 7.03 4,613 73,624 4.73 11,207 94,034 5.23 15,819

39
2016 Total Inferred Mineral Resources
INFERRED GOLD MINERAL RESOURCES (as at December 31, 2016)
Tonnes Grade Ounces
(000's) (g/t Au) (000's)
Young-Davidson - Surface 31 0.99 1
Young-Davidson - Underground 3,524 2.76 313
Total Young-Davidson 3,555 2.75 314
Mulatos 8,935 0.92 265
San Carlos UG 162 4.93 26
La Yaqui 174 1.39 8
Cerro Pelon 109 1.23 4
Carricito 900 0.74 22
Total Mulatos 10,280 0.98 325
El Chanate 112 0.71 3
MacLellan 1,898 2.01 123
Gordon 4,364 2.87 403
Burnt Timber 23,438 1.04 781
Linkwood 21,004 1.16 783
Total Lynn Lake 50,704 1.28 2,089
Esperanza 718 0.80 18
Ağı Dağı 16,760 0.46 245
Kirazli 5,689 0.59 108
Çamyurt 2,791 0.95 85
Total Turkey 25,240 0.54 438
Quartz Mountain 39,205 0.91 1,147
Alamos - Total 129,815 1.04 4,334
INFERRED SILVER MINERAL RESOURCES (as at December 31, 2016)
Tonnes Grade Ounces
(000's) (g/t Ag) (000's)
La Yaqui Grande 174 5.55 31
Esperanza 718 15.04 347
Ağı Dağı 16,760 2.85 1,534
Kirazli 5,689 8.96 1,638
Çamyurt 2,791 5.77 518
Alamos - Total 26,132 4.84 4,068
40
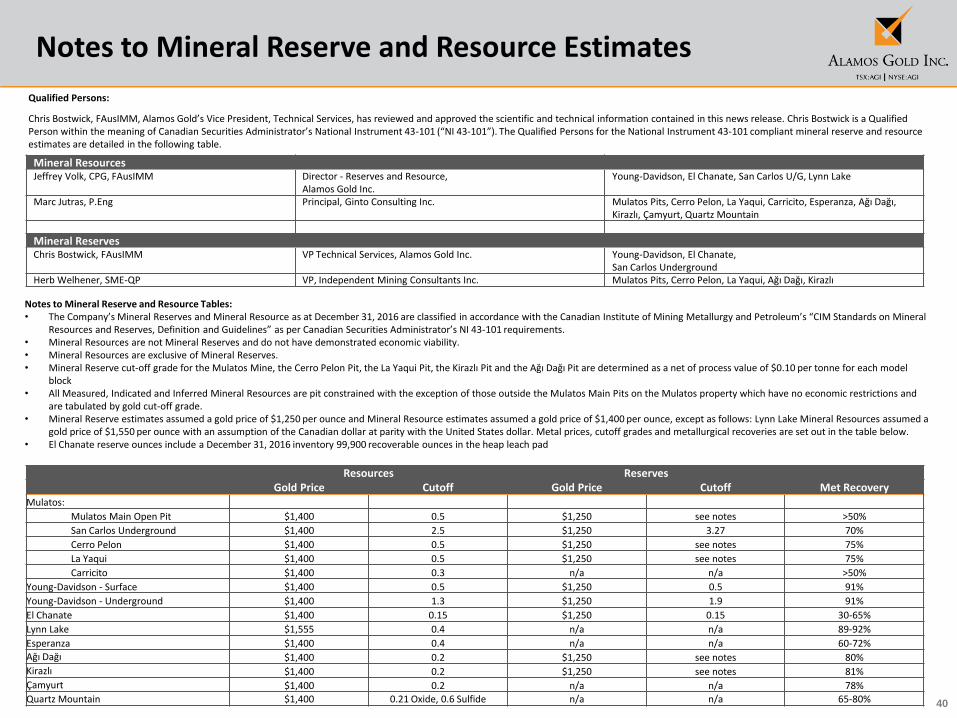
Notes to Mineral Reserve and Resource Estimates
Notes to Mineral Reserve and Resource Tables:• The Company’s Mineral Reserves and Mineral Resource as at December 31, 2016 are classified in accordance with the Canadian Institute of Mining Metallurgy and Petroleum’s “CIM Standards on Mineral
Resources and Reserves, Definition and Guidelines” as per Canadian Securities Administrator’s NI 43-101 requirements. • Mineral Resources are not Mineral Reserves and do not have demonstrated economic viability.• Mineral Resources are exclusive of Mineral Reserves.• Mineral Reserve cut-off grade for the Mulatos Mine, the Cerro Pelon Pit, the La Yaqui Pit, the Kirazlı Pit and the Ağı Dağı Pit are determined as a net of process value of $0.10 per tonne for each model
block• All Measured, Indicated and Inferred Mineral Resources are pit constrained with the exception of those outside the Mulatos Main Pits on the Mulatos property which have no economic restrictions and
are tabulated by gold cut-off grade.• Mineral Reserve estimates assumed a gold price of $1,250 per ounce and Mineral Resource estimates assumed a gold price of $1,400 per ounce, except as follows: Lynn Lake Mineral Resources assumed a
gold price of $1,550 per ounce with an assumption of the Canadian dollar at parity with the United States dollar. Metal prices, cutoff grades and metallurgical recoveries are set out in the table below.• El Chanate reserve ounces include a December 31, 2016 inventory 99,900 recoverable ounces in the heap leach pad
Qualified Persons:
Chris Bostwick, FAusIMM, Alamos Gold’s Vice President, Technical Services, has reviewed and approved the scientific and technical information contained in this news release. Chris Bostwick is a Qualified Person within the meaning of Canadian Securities Administrator’s National Instrument 43-101 (“NI 43-101”). The Qualified Persons for the National Instrument 43-101 compliant mineral reserve and resource estimates are detailed in the following table.
Mineral ResourcesJeffrey Volk, CPG, FAusIMM Director - Reserves and Resource,
Alamos Gold Inc.Young-Davidson, El Chanate, San Carlos U/G, Lynn Lake
Marc Jutras, P.Eng Principal, Ginto Consulting Inc. Mulatos Pits, Cerro Pelon, La Yaqui, Carricito, Esperanza, Ağı Dağı,Kirazlı, Çamyurt, Quartz Mountain
Mineral ReservesChris Bostwick, FAusIMM VP Technical Services, Alamos Gold Inc. Young-Davidson, El Chanate,
San Carlos UndergroundHerb Welhener, SME-QP VP, Independent Mining Consultants Inc. Mulatos Pits, Cerro Pelon, La Yaqui, Ağı Dağı, Kirazlı
Resources ReservesGold Price Cutoff Gold Price Cutoff Met Recovery
Mulatos:
Mulatos Main Open Pit $1,400 0.5 $1,250 see notes >50%
San Carlos Underground $1,400 2.5 $1,250 3.27 70%
Cerro Pelon $1,400 0.5 $1,250 see notes 75%
La Yaqui $1,400 0.5 $1,250 see notes 75%
Carricito $1,400 0.3 n/a n/a >50%
Young-Davidson - Surface $1,400 0.5 $1,250 0.5 91%
Young-Davidson - Underground $1,400 1.3 $1,250 1.9 91%
El Chanate $1,400 0.15 $1,250 0.15 30-65%
Lynn Lake $1,555 0.4 n/a n/a 89-92%
Esperanza $1,400 0.4 n/a n/a 60-72%
Ağı Dağı $1,400 0.2 $1,250 see notes 80%
Kirazlı $1,400 0.2 $1,250 see notes 81%
Çamyurt $1,400 0.2 n/a n/a 78%
Quartz Mountain $1,400 0.21 Oxide, 0.6 Sulfide n/a n/a 65-80%