Alabama State Department of Education & A+ College Ready Program A College Readiness and AP...
24
Alabama State Department of Education & A+ College Ready Program A College Readiness and AP Initiative Parent Meeting
-
Upload
lester-barker -
Category
Documents
-
view
222 -
download
0
Transcript of Alabama State Department of Education & A+ College Ready Program A College Readiness and AP...

Alabama State Department of Education &A+ College Ready Program
A College Readiness and AP Initiative
Parent Meeting
Goals of the ALSDE/A+ College Ready College Readiness and AP Program
1. Increase the number of students enrolled in math, science, English and Social Studies Advanced Placement courses
2. Increase the number of students enrolled in rigorous preparatory courses to increase the pipeline of students prepared for AP.
3. Increase the number of students making qualifying scores in math, science, and English advanced placement courses
4. Increase the number of students successfully pursuing college degrees
2

Statewide Impact
From 2008 – 2014:•Alabama ranks #1 among all 50 states in % increase in students earning qualifying scores on Math, Science & English (MSE) Exams
•Alabama ranks #1 among all 50 states in % increase in minority students earning qualifying scores on Math, Science & English (MSE) Exams
•Over 60,000 students in ALSDE/A+ College Ready schools earned 20,000 qualifying scores in MSE potentially saving Alabama families in excess of $36 Million in college tuition costs** Based on avg cost of $1806 for 3 hours of credit at UA and Auburn
3

Percent Increases in AP Math, Science, & English Qualifying Scores 2008-2014 – All Students
1 Year Success Cohort VI
(21 schools)
2 Year Success Cohort V
(12 schools)
3 Year Success Cohort IV
(21 schools)
4 Year Success Cohort III
(20 schools)
5 Year Success Cohort II
(11 schools)
6 Year Success Cohort I
(12 schools)
0
50
100
150
200
250
512
2131
4149
820
41
59
94
136
81
194
114
186
233
111
US AL ALSDE/A+ College Ready Schools Source: NMSI & College Board4
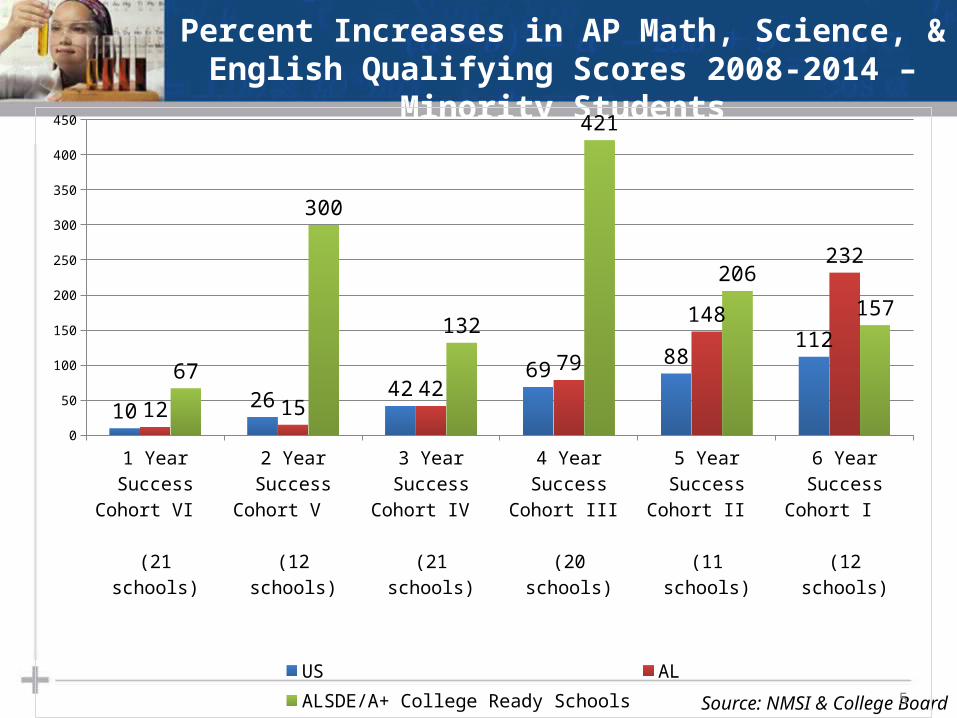
Percent Increases in AP Math, Science, & English Qualifying Scores 2008-2014 – Minority Students
Source: NMSI & College Board5
1 Year Success Cohort VI
(21 schools)
2 Year Success Cohort V
(12 schools)
3 Year Success Cohort IV
(21 schools)
4 Year Success Cohort III
(20 schools)
5 Year Success Cohort II
(11 schools)
6 Year Success Cohort I
(12 schools)
0
50
100
150
200
250
300
350
400
450
1026
4269
88112
12 1542
79
148
232
67
300
132
421
206
157
US AL ALSDE/A+ College Ready Schools
Source: NMSI & College Board
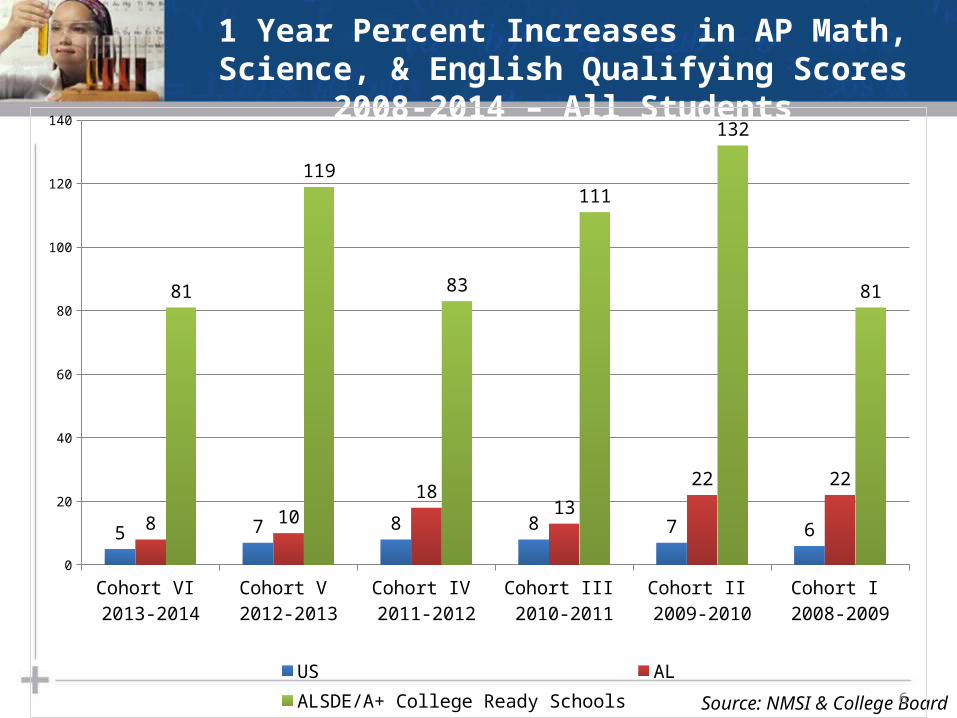
1 Year Percent Increases in AP Math, Science, & English Qualifying Scores 2008-2014 – All Students
6
Cohort VI 2013-2014
Cohort V 2012-2013
Cohort IV 2011-2012
Cohort III 2010-2011
Cohort II 2009-2010
Cohort I 2008-2009
0
20
40
60
80
100
120
140
5 7 8 8 7 68 10
1813
22 22
81
119
83
111
132
81
US AL ALSDE/A+ College Ready Schools
Source: NMSI & College Board
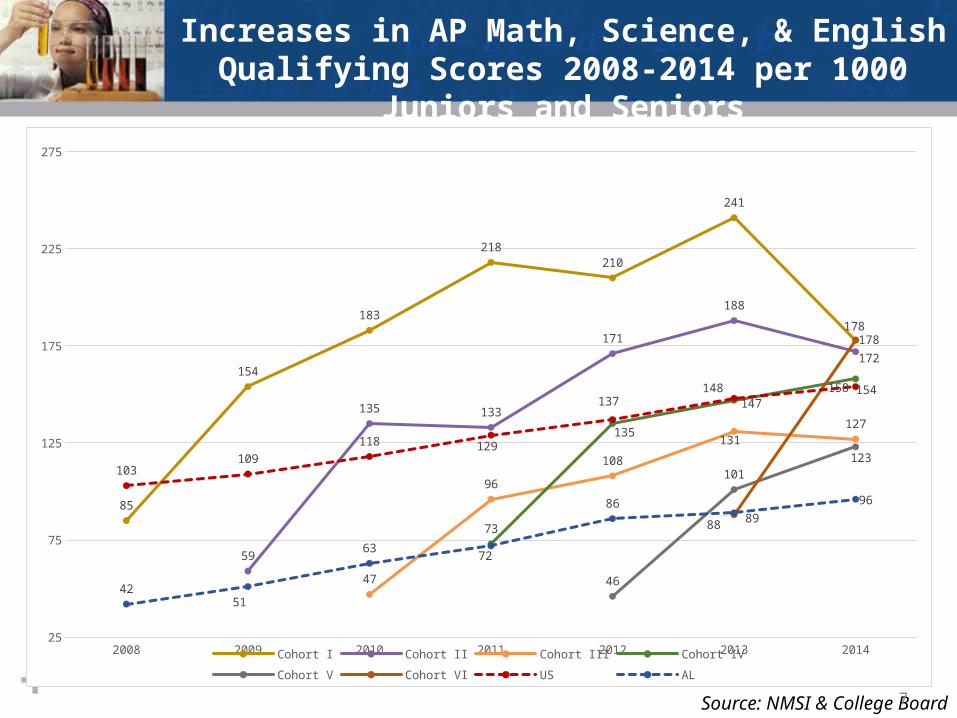
Increases in AP Math, Science, & English Qualifying Scores 2008-2014 per 1000 Juniors and Seniors
7
2008 2009 2010 2011 2012 2013 201425
75
125
175
225
275
85
154
183
218210
241
178
59
135 133
171
188
172
47
96
108
131127
73
135
147158
46
101
123
88
178
103109
118 129
137148 154
4251
63 72
8689
96
Cohort I Cohort II Cohort III Cohort IVCohort V Cohort VI US AL

How do high school students, teachers and parents benefit from the ALSDE/A+ College Ready College Readiness and AP
Program?
8
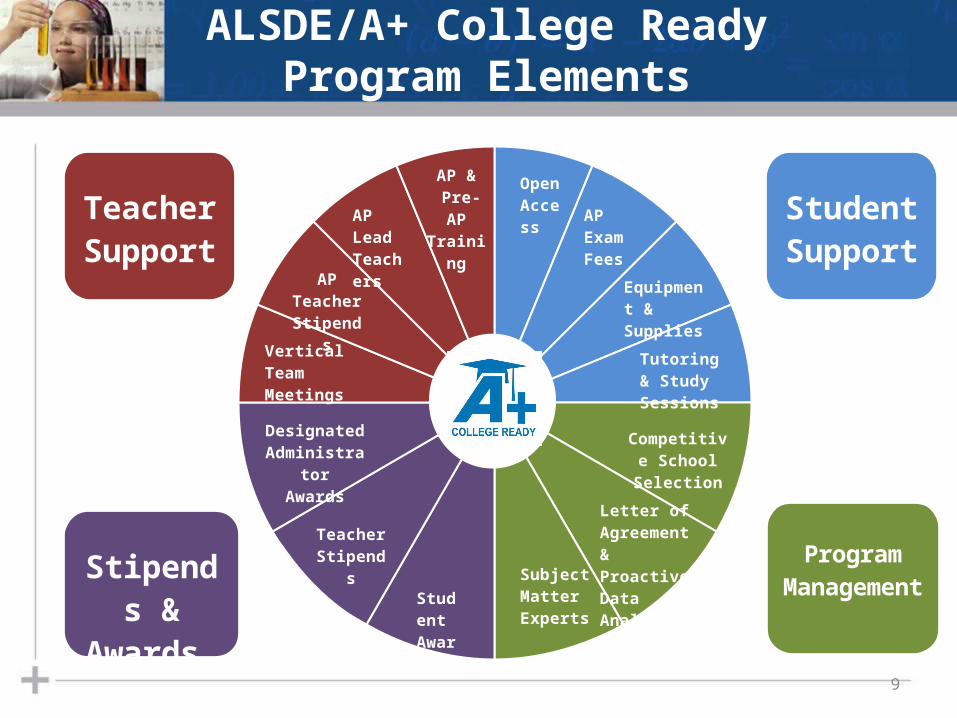
ALSDE/A+ College ReadyProgram Elements
9
OpenAc-cess AP
Exam Fees
Equipment & Supplies
AP & Pre-AP TrainingAP
Lead Teach-ers
AP Teacher Stipends
Designated Administrator
Awards
Teacher Stipends
Stu-dent Awards
Teacher Support
Student Support
Stipends & Awards
ProgramManagement
Vertical Team Meet-ings
Tutoring & Study Ses-sions
Competitive School Selec-
tion
Letter of Agreement & Proactive Data Analy-sisSubject
Matter Experts
WHY ARE RIGOROUS COURSES IN GRADES 6-10 IMPORTANT?
10
Build a Pipeline
• Laying the Foundation- Infused Courses Implemented in Grades 6-10 will build a pipeline of students who are better prepared for the rigor of College and Advanced Placement Courses
11
• “A recent College Board® study showed that students who scored 3 or higher on four popular AP exams earned higher first year GPAs, were more likely to continue on to a second year of college, and were more likely to attend selective institutions, on average, than students with comparable SAT ® scores and high school GPAs who did not take AP. Even students who scored a 1 or 2 on an AP Exam showed higher retention rates into their second year of college than non-AP students, and they were more likely to attend selective institutions.”
12
Why take Advanced Placement courses ?
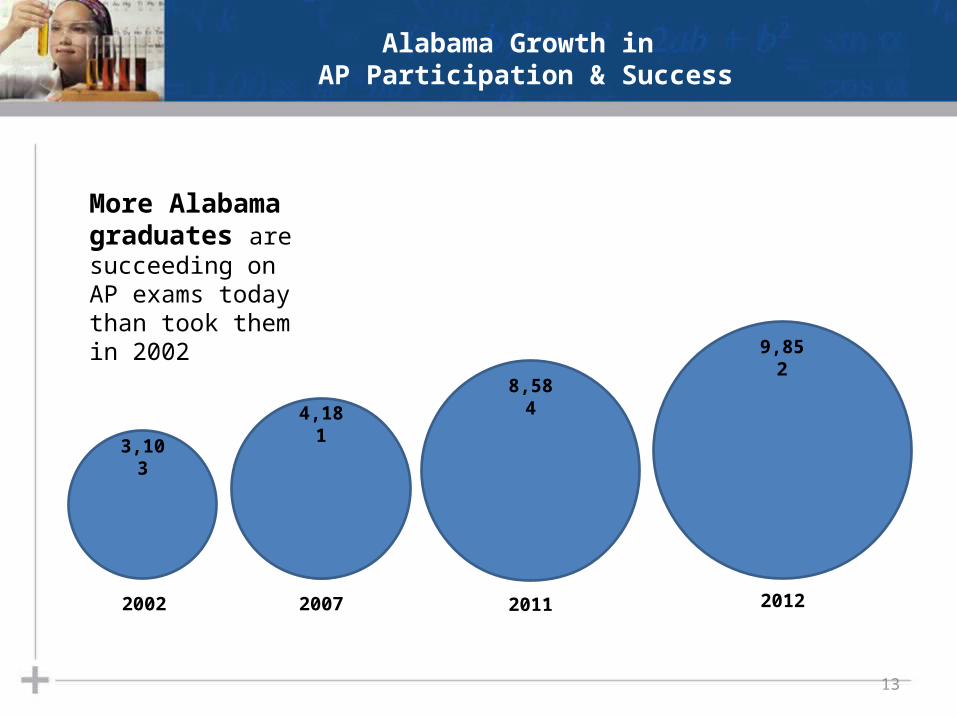
Alabama Growth in AP Participation & Success
13
1,710 2,398 3,8724,258
3,103
4,1818,584
9,852
More Alabama graduates are succeeding on AP exams today than took them in 2002
2002 2007 2011 2012
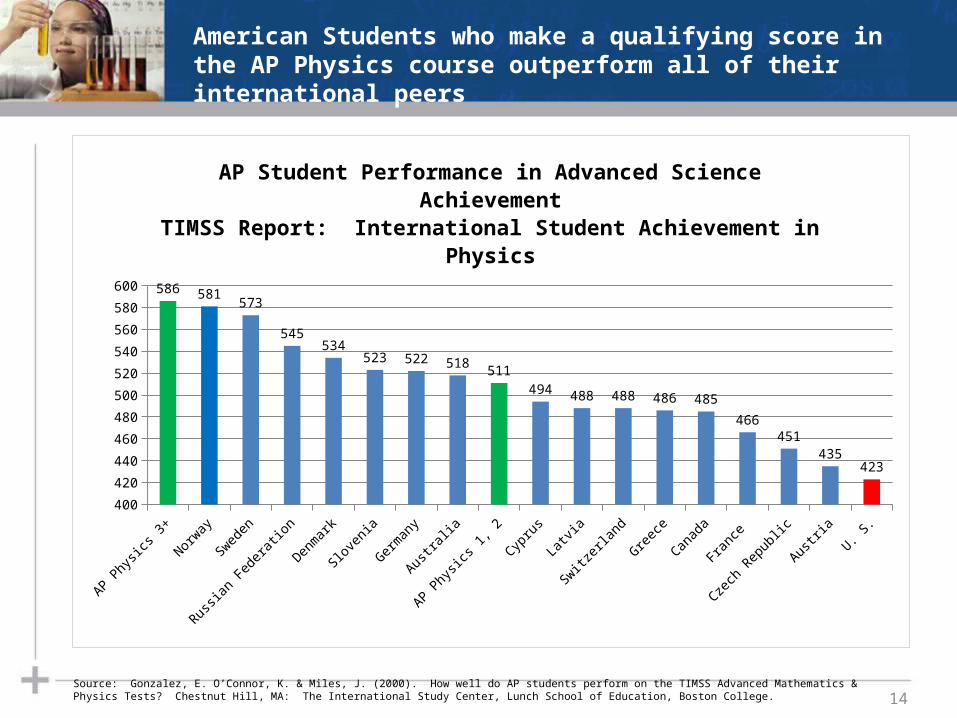
14Source: Gonzalez, E. O’Connor, K. & Miles, J. (2000). How well do AP students perform on the TIMSS Advanced Mathematics & Physics Tests? Chestnut Hill, MA: The International Study Center, Lunch School of Education, Boston College.
AP Physics
3+
Norway
Swed
en
Russian
Federa
tion
Denmark
Slove
nia
German
y
Australi
a
AP Physics
1, 2
Cypru
sLat
via
Switz
erlan
d
Greece
Canad
a
France
Czech Rep
ublic
Austria
U. S.
400
420
440
460
480
500
520
540
560
580
600586
581573
545534
523 522 518511
494488 488 486 485
466
451
435423
AP Student Performance in Advanced Science AchievementTIMSS Report: International Student Achievement in Physics
American Students who make a qualifying score in the AP Physics course outperform all of their international peers

15
AP Calculus 3
+
AP Calculus 1
, 2Fra
nce
Russian
Federa
tion
Switz
erlan
d
Australi
a
Denmark
Cypru
s
Lithuan
ia
Greece
Swed
en
Canad
a
Slove
niaIta
ly
Czech Rep
ublic
German
yU. S
.
Austria
400
420
440
460
480
500
520
540
560
580
600586
565557
542533
525 522 518 516 513 512 509
475 474469 465
442436
AP Student Performance in MathTIMSS Report: International Student Achievement in Mathematics
Source: Gonzalez, E. O’Connor, K. & Miles, J. (2000). How well do AP students perform on the TIMSS Advanced Mathematics & Physics Tests? Chestnut Hill, MA: The International Study Center, Lunch School of Education, Boston College.
American Students who take an AP Calculus course outperform all of their international peers
16
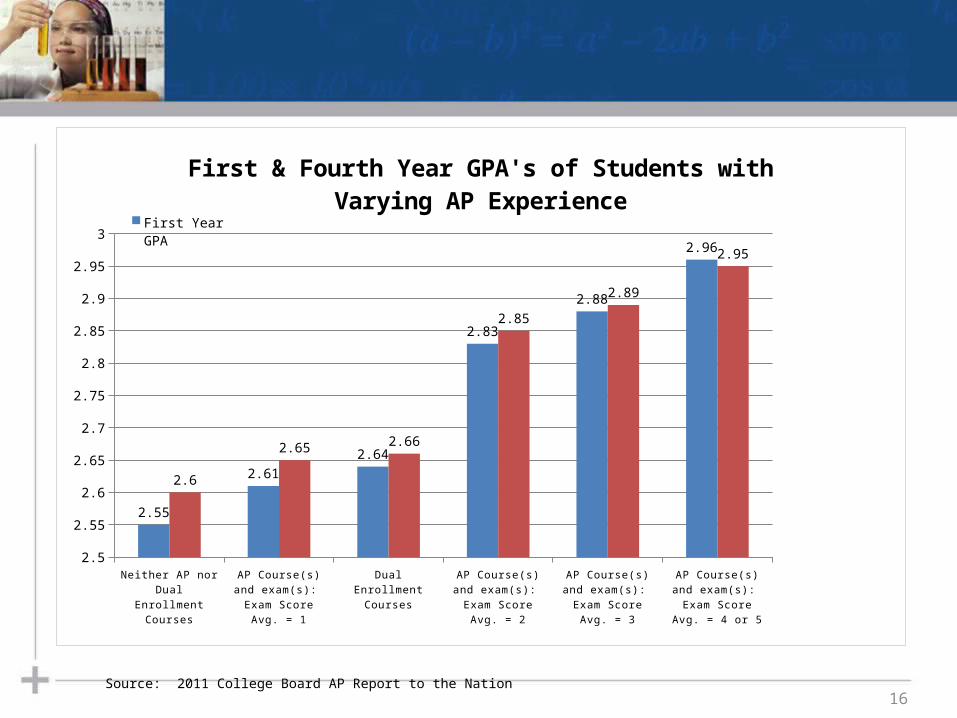
Neither AP nor Dual Enrollment Courses
AP Course(s) and exam(s): Exam Score
Avg. = 1
Dual Enrollment Courses
AP Course(s) and exam(s): Exam Score
Avg. = 2
AP Course(s) and exam(s): Exam Score
Avg. = 3
AP Course(s) and exam(s): Exam Score
Avg. = 4 or 5
2.5
2.55
2.6
2.65
2.7
2.75
2.8
2.85
2.9
2.95
3
2.55
2.61
2.64
2.83
2.88
2.96
2.6
2.65 2.66
2.85
2.89
2.95
First & Fourth Year GPA's of Students with Varying AP Experience
First Year GPA
Fourth-Year GPA
Source: 2011 College Board AP Report to the Nation

AP AND THE COST OF COLLEGE
17
• AP students are more likely to graduate from college in 4 years, which only 26.5% of U. S. public college students achieve.
• The average cost of a 4 year public institution in Alabama is $18,000 for every year, in state.
• If a student earns a qualifying score in an AP course and receives college credit, the family saves $1,771 which is the average cost of a 3 hour course at Alabama & Auburn
• AP helps students qualify for precious college scholarship dollars. 31% of colleges use AP as a criterion when determining scholarship recipients.
• Colleges use AP to place students in appropriate level courses.
18

WHAT CAN PARENTS AND STUDENTS EXPECT FROM AN AP COURSE?
19
What can I expect?
• Rigor, rigor, rigor—your student should be challenged and held to high academic expectations
• Support, support, support from trained teachers who are supported by A+ College Ready
• Students and teachers will be expected to work hard
20
What can I expect?
• Early in the year grades may dip but will improve as students adjust to increased rigor and expectations
• The results for the students, the teachers, and the school will be worth the hard work
21

WHAT IS THE MESSAGE FOR COLLEGE BOUND STUDENTS?
For Students
• Get prepared for advanced placement courses by registering for rigorous preparatory courses.
• Enroll in AP courses where you have aptitude & interest. Plan to work hard!
• Colleges are depending less upon GPA and more upon standardized measures such as ACT, SAT, and Advanced Placement tests for acceptance and for scholarships.
• Students need to be in the most rigorous high school courses based on their abilities.
• Competing in a global marketplace begins now.
23

Contact Information:
• Mary Boehm, President• [email protected], 205.257.5350
• Teri Thompson, Chief Program Director• [email protected], 334-354-4528
24