Mathematics & Statistics Auburn University, Alabama, USA ...

2010 Alabama Course of Study: Mathematics i

For information regarding the
Alabama Course of Study: Mathematics
and other curriculum materials,
contact the Curriculum and Instruction Section,
Alabama Department of Education,
3345 Gordon Persons Building,
50 North Ripley Street, Montgomery, Alabama 36104;
or by mail to P.O. Box 302101, Montgomery, Alabama 36130-2101;
or by telephone at (334) 242-8059.
Joseph B. Morton, State Superintendent of Education
Alabama Department of Education
It is the official policy of the Alabama Department of Education that no person in Alabama shall, on the grounds of
race, color, disability, sex, religion, national origin, or age, be excluded from participation in, be denied the benefits
of, or be subjected to discrimination under any program, activity, or employment.

Alabama Course of Study
Mathematics
Joseph B. Morton
State Superintendent of Education
ALABAMA DEPARTMENT OF EDUCATION

2010 Alabama Course of Study: Mathematics iv
STATE SUPERINTENDENT
OF EDUCATION’S MESSAGE
Dear Educator:
The demands of our society and the workplace
provide evidence of the need for all Alabama
students to achieve the goal of building a strong
mathematics foundation. Alabama educators
must focus on the teaching of mathematics in
ways that ensure students possess adequate
preparation to meet future needs and function as
problem solvers, decision makers, and lifelong
learners. To address this goal, the content of the
2010 Alabama Course of Study: Mathematics
sets high standards for all students by
incorporating Common Core State Standards for
Mathematics and by addressing mathematical
issues affecting our state.
The 2010 Alabama Course of Study:
Mathematics, developed by educators and
business and community leaders, provides a
foundation upon which quality mathematics
programs across the state can be developed.
The implementation of the content of this
document through appropriate instruction will
enable all Alabama students to obtain the
mathematical foundations necessary to be
college- and career-ready.
Joseph B. Morton
State Superintendent of Education
MEMBERS
of the
ALABAMA STATE BOARD
OF EDUCATION
Governor Bob Riley President of the State Board of Education
District
I Randy McKinney
Vice President
II Betty Peters
III Stephanie W. Bell
IV Dr. Ethel H. Hall Vice President Emerita
V Ella B. Bell
VI David F. Byers, Jr.
VII Gary Warren
VIII Dr. Mary Jane Caylor President Pro Tem
State Superintendent
Joseph B. Morton Secretary and Executive Officer

2010 Alabama Course of Study: Mathematics v
Alabama Course of Study: Mathematics
Table of Contents
PREFACE .................................................................................................................................................. vii
ACKNOWLEDGMENTS ........................................................................................................................ viii
GENERAL INTRODUCTION ....................................................................................................................1
CONCEPTUAL FRAMEWORK ................................................................................................................3
POSITION STATEMENTS ........................................................................................................................4
STANDARDS FOR MATHEMATICAL PRACTICE .............................................................................6
DIRECTIONS FOR INTERPRETING THE MINIMUM REQUIRED CONTENT ........................... 10
GRADES K-8 MINIMUM REQUIRED CONTENT
Grade K ........................................................................................................................................... 12
Grade 1 ............................................................................................................................................ 16
Grade 2 ............................................................................................................................................ 21
Grade 3 ............................................................................................................................................ 26
Grade 4 ............................................................................................................................................ 32
Grade 5 ............................................................................................................................................ 39
Grade 6 ............................................................................................................................................ 46
Grade 7 ............................................................................................................................................ 53
Grade 8 ............................................................................................................................................ 60
STANDARDS FOR HIGH SCHOOL MATHMATICS .......................................................................... 66
CONCEPTUAL CATEGORIES FOR HIGH SCHOOL MATHEMATICS
Number and Quantity ...................................................................................................................... 67
Algebra ............................................................................................................................................ 69
Functions ......................................................................................................................................... 72
Modeling ......................................................................................................................................... 74
Geometry ......................................................................................................................................... 76
Statistics and Probability ................................................................................................................. 79

2010 Alabama Course of Study: Mathematics vi
GRADES 9–12 MINIMUM REQUIRED CONTENT
Algebra I .......................................................................................................................................... 81
Geometry ......................................................................................................................................... 89
Algebraic Connections .................................................................................................................... 95
Algebra II ........................................................................................................................................ 97
Algebra II with Trigonometry ....................................................................................................... 103
Discrete Mathematics .................................................................................................................... 109
Mathematical Investigations .......................................................................................................... 111
Precalculus .................................................................................................................................... 114
Analytical Mathematics ................................................................................................................. 120
APPENDIX A. Table 1: Common Addition and Subtraction Situations ............................................ 123
Table 2: Common Multiplication and Division Situations ......................................... 124
Table 3: Properties of Operations ............................................................................... 125
Table 4: Properties of Equality ................................................................................... 125
Table 5: Properties of Inequality ................................................................................ 125
APPENDIX B. Possible Course Progression in Grades 9-12 .............................................................. 126
Possible Course Pathways .......................................................................................... 127
APPENDIX C. Literacy Standards For Grades 6-12
History/Social Studies, Science, and Technical Subjects ............................................ 128
APPENDIX D. Alabama High School Graduation Requirements ....................................................... 135
APPENDIX E. Guidelines and Suggestions for
Local Time Requirements and Homework ................................................................. 137
BIBLIOGRAPHY ..................................................................................................................................... 139
GLOSSARY .............................................................................................................................................. 140

2010 Alabama Course of Study: Mathematics vii
PREFACE
The 2010 Alabama Course of Study: Mathematics provides the framework for the Grades K-12
mathematics program in Alabama’s public schools. Content standards in this document are minimum and
required (Code of Alabama, 1975, §16-35-4). They are fundamental and specific, but not exhaustive. In
developing local curriculum, school systems may include additional content standards to reflect local
philosophies and add implementation guidelines, resources, and activities; which, by design, are not
contained in this document.
The 2010 Alabama Mathematics Common Core State Standards Task Force made extensive use of the
2010 Common Core State Standards for Mathematics document. In addition, the Task Force reviewed
the 2009 Alabama Course of Study: Mathematics for additional content not specified by the Common
Core State Standards, used each member’s academic and experiential knowledge, and discussed issues
among themselves and with colleagues. Finally, Task Force members compiled what they believe to be
the best possible mathematics curriculum for Alabama’s K-12 students.

2010 Alabama Course of Study: Mathematics viii
ACKNOWLEDGMENTS
This document was developed by the 2010 Alabama Mathematics Common Core State Standards Task
Force composed of 2003 and 2009 Mathematics State Course of Study Committee members and
representatives appointed by the Alabama State Board of Education. These members were comprised of
early childhood, intermediate school, middle school, high school, and college educators and selected
business and industry leaders. The Task Force developed the document during the summer of 2010 and
submitted the document to the Alabama State Board of Education for adoption at the November 2010
meeting.
2010 Alabama Mathematics Common Core State Standards Task Force
Herbert Clark, Jr., Teacher, John T. Whatley K-8 School, Birmingham City Board of Education
Kenneth E. Easterday, Ed.D., Professor (retired), Auburn University
Melanie Elliott, Teacher, Thompson Middle School, Shelby County Board of Education
Milton J. Ganier, Teacher, Jefferson Davis High School, Montgomery County Board of Education
Kim Harris, Teacher, Eufaula High School, Eufaula City Board of Education
Andrea von Herrmann, Teacher, Adamsville Elementary School, Jefferson County Board of Education
Julie Herron, Ph.D., Assistant Professor, The University of Alabama
Hal Horton, Ed.D., Principal, Highland Park Elementary School, Muscle Shoals City Board of
Education
LaMecha O. James, Educational Specialist, Montgomery County Board of Education
Jack Kale, Jr., Engineering Instructor, Farley Nuclear Plant, Dothan
Beverly K. Kimes, Director of Mathematics, Birmingham City Board of Education
Michelle Regina McKinney, Teacher, Zora Ellis Junior High School, Talladega City Board of Education
Vanita Pharrams, Teacher, Lakewood Elementary School, Phenix City Board of Education
Joseph. E. Phillips, Teacher, Austin High School, Decatur City Board of Education
Catherine K. Watson, Teacher, T. R. Miller High School, Brewton City Board of Education
Judy Welch, Teacher, Wetumpka Elementary School, Elmore County Board of Education
State Department of Education personnel who managed the development process were:
Thomas R. Bice, Ed.D., Deputy State Superintendent for Instructional Services;
Cynthia C. Brown, Director, Curriculum and Instruction; and
Susan B. Davis, Ed.D., Administrator, State Courses of Study Committees and Mathematics Content
Specialist, Curriculum and Instruction.

2010 Alabama Course of Study: Mathematics ix
The State Department of Education process specialists who assisted the Task Force in developing the
document were:
DaLee Chambers, Ph.D., Education Specialist, Special Education Services;
Martin Dukes, Education Specialist, Curriculum and Instruction;
Diane Duncan, Education Specialist, Alabama Math, Science, and Technology Initiative;
Cindy Freeman, Education Specialist, Alabama Math, Science, and Technology Initiative;
Ginger Montgomery, Education Specialist, Curriculum and Instruction;
Judith R. Pugh, Education Specialist, Assessment and Accountability;
Christine Spear, Education Administrator, Curriculum and Instruction; and
Janice Webb, Education Specialist, Curriculum and Instruction.
Natasha D. Sims, Administrative Assistant, Curriculum and Instruction; and
Jacqueline L. Perdue, former Administrative Assistant, Curriculum and Instruction, assisted with the
preparation of the document.
Charles Creel, Graphic Arts Specialist, Communication Section, assisted in the development of the
graphic design.
Susan J. Blankenship, Education Specialist (retired), Alabama Department of Education, edited and
proofread the document.
2010 Alabama Course of Study: Mathematics 1
ALABAMA COURSE OF STUDY: MATHEMATICS
GENERAL INTRODUCTION
The 2010 Alabama Course of Study: Mathematics defines the knowledge and skills students should know
and be able to do upon graduation from high school. Mastery of the standards enables students to succeed
in entry-level, credit-bearing academic college courses and in workforce training programs. High school
courses addressed in this document include the Common Core State Standards for Mathematics as well as
additional mathematics content. This additional content is noted in the high school mathematics courses
by a map symbol of the state of Alabama ( ), which follows the content standards. All standards
contained in this document are:
Aligned with college and work expectations;
Written in a clear, understandable, and consistent format;
Designed to include rigorous content and application of knowledge through high-order skills;
Formulated upon strengths and lessons of current state standards;
Informed by high-performing mathematics curricula in other countries to ensure all students are prepared to succeed in our global economy and society; and
Grounded on sound evidence-based research.
What students can learn at any particular grade level depends upon prior learning. Ideally, each standard
in this document might have been phrased in the form, ―Students who already know ... should next come
to learn ....‖ However, as research indicates, this approach is unrealistic because all students do not learn
in exactly the same way or at exactly the same time in their development. Grade placements for specific
topics have been made on the basis of state and international comparisons and on the collective
experience and professional judgment of educators, researchers, and mathematicians. Learning
opportunities will continue to vary across schools and school systems, and educators should make every
effort to meet the needs of individual students based on their current understanding.
Mastery of the standards enables students to build a solid foundation of knowledge, skills, and
understanding in mathematics. To ensure student success, effective implementation of the 2010 Alabama
Course of Study: Mathematics requires local education agencies to utilize the minimum required content
of this document to develop local curriculum guides.
2010 Alabama Course of Study: Mathematics 2

2010 Alabama Course of Study: Mathematics 3
ALABAMA’S K-12 MATHEMATICS CURRICULUM
CONCEPTUAL FRAMEWORK
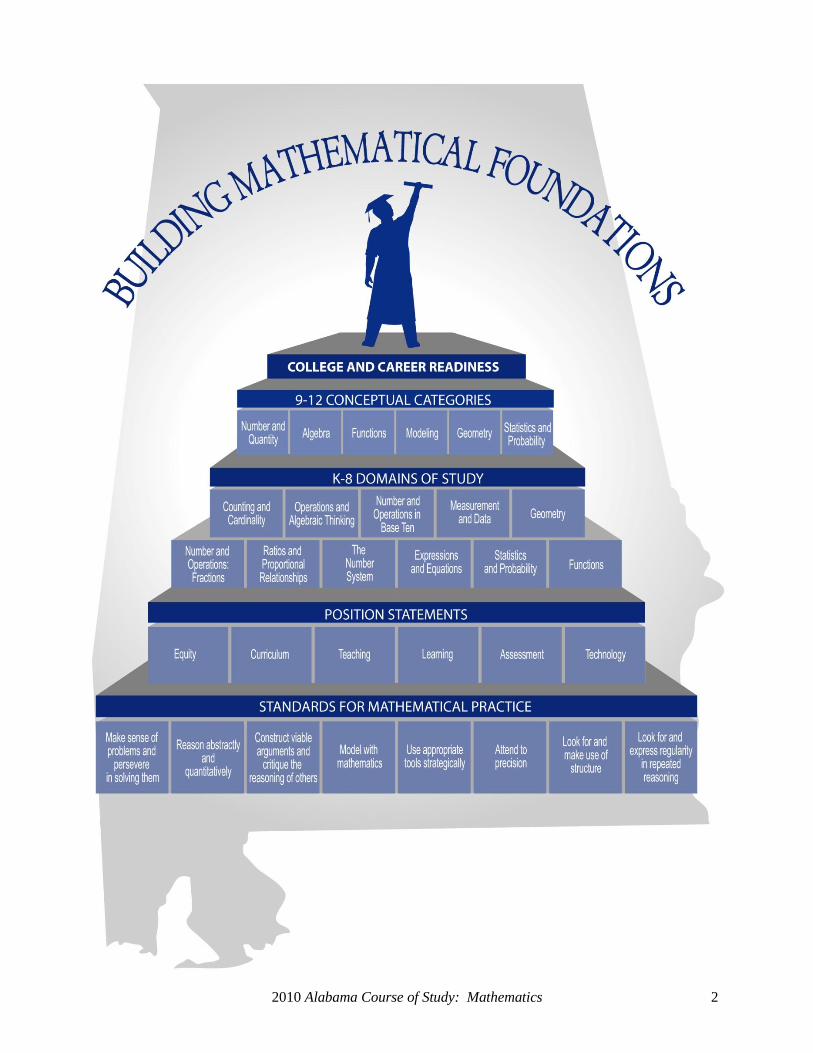
The goal of Alabama’s K-12 mathematics curriculum, ―Building Mathematical Foundations,‖ arches
across the top of the graphic on the previous page. Student achievement of this goal enhances future
opportunities and options for the workplace and for everyday life by enabling all students to be college
and career ready. Mathematics content contained in this document is both rigorous and aligned
throughout the grades, thus providing students with the necessary steps to acquire the knowledge and
skills for developing a strong foundation in mathematics.
The organization of this course of study is based upon the eight Standards for Mathematical Practice
adopted from the Common Core State Standards (CCSS) and the six Principles for School Mathematics
found in the National Council of Teachers of Mathematics’ (NCTM) document, Principles and Standards
for School Mathematics (PSSM). The eight CCSS standards―Make sense of problems and persevere in
solving them, Reason abstractly and quantitatively, Construct viable arguments and critique the reasoning
of others, Model with mathematics, Use appropriate tools strategically, Attend to precision, Look for and
make use of structure, and Look for and express regularity in repeated reasoning―are depicted on the
graphic as the foundational blocks of the mathematics program leading to goal achievement. These
standards describe varieties of expertise that mathematics educators at all levels should seek to develop in
their students. The six NCTM principles―Equity, Curriculum, Teaching, Learning, Assessment, and
Technology―build upon the foundation, forming the second level of blocks. They reflect basic tenets
fundamental to the design of a quality mathematics program that allows all students the opportunity to
reach their mathematical potential. Each of the six principles is further addressed in the Position
Statements section found on pages 4-5.
The blocks continue to build upon one another and on the third and fourth levels appear the K-8 Domains
of Study, which include content describing what students should know and be able to do for each grade
or course. The K-8 domains or strands around which groups of related standards are organized are
Counting and Cardinality, Operations and Algebraic Thinking, Number and Operations in Base Ten,
Measurement and Data, Geometry, Number and Operations: Fractions, Ratios and Proportional
Relationships, The Number System, Expressions and Equations, Statistics and Probability, and Functions.
The fifth layer of blocks addresses the 9-12 Conceptual Categories. The 9-12 conceptual categories or
strands, also providing organization for groups of related standards, are Number and Quantity, Algebra,
Functions, Modeling, Geometry, and Statistics and Probability.
The high school graduate standing on the highest block, College and Career Readiness, represents
achievement of the goal of developing a strong foundation in mathematics. All students who successfully
complete Alabama’s K-12 mathematics program are well-equipped for postsecondary mathematics
courses as well as prepared for future careers and life situations involving mathematics.

2010 Alabama Course of Study: Mathematics 4
POSITION STATEMENTS
Equity
All Alabama students, with no exception, must have the opportunity to learn relevant and challenging
mathematics. In planning for instruction, teachers must set high expectations for students and be mindful
of the individual needs, interests, and abilities of all students as they structure their classrooms, plan
lessons, design learning activities, and provide reasonable accommodations with the goal of meeting the
needs of every student. To this end, content contained within this document is designed to support
differentiated instruction that enables and motivates optimum student achievement in the learning of
meaningful mathematics.
Curriculum
The 2010 Alabama Course of Study: Mathematics is intended to serve as a framework for the
development of the mathematics curriculum in local school systems. In addition, teachers also should
incorporate into the mathematics curriculum the Literacy Standards found in Appendix C of this
document. These standards are designed to supplement students’ learning of the mathematical standards
by helping them meet the challenges of reading, writing, speaking, listening, and language in the field of
mathematics. All content contained in this document is coherent, rigorous, well-articulated across the
grades, and focuses on enabling students to make connections between important mathematical ideas. It
is essential for educators to select and develop resources that ensure students are capable of making these
connections as well as recognizing and applying mathematics concepts in contexts outside the area of
mathematics. The mathematics curriculum also must provide students with opportunities to participate in
mathematical investigations that lead from knowledge of facts and skills to acquisition of conceptual
understanding and problem-solving techniques that enable them to understand how mathematical ideas
interconnect and build on one another to produce a coherent whole.
Teaching
The quality and effectiveness of mathematics education in Alabama is influenced by choices made by
local school systems and teachers. Effective mathematics teachers develop and maintain their
mathematical and pedagogical knowledge, collaborate with colleagues, and seek high-quality professional
development opportunities. Effective mathematics teachers use the required content found in this
document to plan lessons that engage all students in learning. In elementary grades, effective
mathematics teachers recognize the importance of students developing an early interest in and enjoyment
of mathematics. In the middle grades and high school, effective mathematics teachers plan relevant
classroom activities such as projects and problem-solving situations that require active participation by all
students and help them make important connections between mathematics and their personal lives. In
addition, effective mathematics teachers consistently reflect on lesson content, lesson activities, and
lesson assessments to make necessary adjustments for enhancing student mastery of content.
2010 Alabama Course of Study: Mathematics 5
Learning
Students learn mathematics best when they understand what they are learning. To build upon prior
knowledge and experiences, they must be actively engaged in the learning process with meaningful,
worthwhile tasks. This engagement affords students opportunities to become confident in their learning
and to develop a genuine interest in pursuing ways to solve increasingly difficult problems. Learning
mathematics through the use of multiple representations, including algebraic, numerical, graphical, and
verbal methods, increases students’ abilities to make mathematical connections and become effective
communicators of mathematics.
Assessment
Assessment provides teachers and students with information to guide and improve instruction and
learning. Effective assessment is planned concurrently with instructional goals. Teachers must plan to
use formative assessments during the instructional process and summative assessments at the conclusion
of a unit of instruction. Formative assessment is considered a hallmark of effective mathematics
instruction and involves the ongoing monitoring of student learning to inform instruction. Information
gained from formative assessment is useful to teachers in providing differentiated instruction and to
students in the provision of frequent feedback. Varied types of formative assessment should be an
integral component of instructional practice in Alabama’s mathematics classrooms. Assessment includes,
but is not limited to, open-ended problems, constructed-response tasks, selected-response tasks,
performance assessments, observations, discussions, journals, and portfolios.
Technology
Technology is an essential component in the teaching and learning of mathematics. Teachers must take
advantage of opportunities to heighten student understanding by planning lessons using available
technology and making sound instructional decisions about meaningful projects and tasks in which
learning is enhanced through the appropriate use of technology. Technology, when used effectively,
increases students’ understanding of fundamental mathematics concepts, helps them develop an
appreciation of mathematics, and inspires them to pursue the study of mathematics for a lifetime.
2010 Alabama Course of Study: Mathematics 6
STANDARDS FOR MATHEMATICAL PRACTICE
The Standards for Mathematical Practice describe varieties of expertise that mathematics educators at all
levels should seek to develop in their students. These practices are based on important ―processes and
proficiencies‖ that have longstanding importance in mathematics education. The first of these are the
National Council of Teachers of Mathematics’ (NCTM) process standards of problem solving, reasoning
and proof, communication, representation, and connections. The second are the strands of mathematical
proficiency specified in the National Research Council’s report, Adding It Up: Helping Children Learn
Mathematics. These proficiencies include adaptive reasoning, strategic competence, conceptual
understanding (comprehension of mathematical concepts, operations, and relations), procedural fluency
(skill in carrying out procedures flexibly, accurately, efficiently, and appropriately), and productive
disposition (habitual inclination to see mathematics as sensible, useful, and worthwhile, coupled with a
belief in diligence and one’s own efficacy). The eight Standards for Mathematical Practice are listed
below along with a description of behaviors and performances of mathematically proficient students.
Mathematically proficient students:
1. Make sense of problems and persevere in solving them.
These students start by explaining to themselves the meaning of a problem and looking for entry points to
its solution. They analyze givens, constraints, relationships, and goals. They make conjectures about the
form and meaning of the solution and plan a solution pathway rather than simply jumping into a solution
attempt. These students consider analogous problems and try special cases and simpler forms of the
original problem in order to gain insight into its solution. They monitor and evaluate their progress and
change course if necessary. Older students might, depending on the context of the problem, transform
algebraic expressions or change the viewing window on their graphing calculator to obtain the
information they need. Mathematically proficient students can explain correspondences between
equations, verbal descriptions, tables, and graphs or draw diagrams of important features and
relationships, graph data, and search for regularity or trends. Younger students might rely on using
concrete objects or pictures to help conceptualize and solve a problem. Mathematically proficient
students check their answers to problems using a different method, and they continually ask themselves,
―Does this make sense?‖ They can understand the approaches of others to solve complex problems and
identify correspondences between different approaches.
2. Reason abstractly and quantitatively.
Mathematically proficient students make sense of quantities and their relationships in problem situations.
They bring two complementary abilities to bear on problems involving quantitative relationships. One is
the ability to decontextualize, to abstract a given situation and represent it symbolically and manipulate
the representing symbols as if they have a life of their own, without necessarily attending to their
referents. The second is the ability to contextualize, to pause as needed during the manipulation process
in order to probe into the referents for the symbols involved. Quantitative reasoning entails habits of
creating a coherent representation of the problem at hand; considering the units involved; attending to the
meaning of quantities, not just how to compute them; and knowing and flexibly using different properties
of operations and objects.
2010 Alabama Course of Study: Mathematics 7
3. Construct viable arguments and critique the reasoning of others.
These students understand and use stated assumptions, definitions, and previously established results in
constructing arguments. They make conjectures and build a logical progression of statements to explore
the truth of their conjectures. They are able to analyze situations by breaking them into cases, and can
recognize and use counterexamples. These students justify their conclusions, communicate them to
others, and respond to the arguments of others. They reason inductively about data, making plausible
arguments that take into account the context from which the data arose. Mathematically proficient
students are also able to compare the effectiveness of two plausible arguments; distinguish correct logic
or reasoning from that which is flawed; and, if there is a flaw in an argument, explain what it is.
Elementary students can construct arguments using concrete referents such as objects, drawings,
diagrams, and actions. Such arguments can make sense and be correct, even though they are not
generalized or made formal until the middle or upper grades. Later, students learn to determine domains
to which an argument applies. Students at all grades can listen to or read the arguments of others, decide
whether they make sense, and ask useful questions to clarify or improve the arguments.
4. Model with mathematics.
These students can apply the mathematics they know to solve problems arising in everyday life, society,
and the workplace. In early grades, this might be as simple as writing an addition equation to describe a
situation. In middle grades, students might apply proportional reasoning to plan a school event or analyze
a problem in the community. By high school, students might use geometry to solve a design problem or
use a function to describe how one quantity of interest depends on another. Mathematically proficient
students who can apply what they know are comfortable making assumptions and approximations to
simplify a complicated situation, realizing that these may need revision later. They are able to identify
important quantities in a practical situation and map their relationships using such tools as diagrams, two-
way tables, graphs, flowcharts, and formulas and can analyze those relationships mathematically to draw
conclusions. They routinely interpret their mathematical results in the context of the situation and reflect
on whether the results make sense, possibly improving the model if it has not served its purpose.
5. Use appropriate tools strategically.
Mathematically proficient students consider available tools when solving a mathematical problem. These
tools might include pencil and paper, concrete models, a ruler, a protractor, a calculator, a spreadsheet, a
computer algebra system, a statistical package, or dynamic geometry software. Proficient students are
sufficiently familiar with tools appropriate for their grade or course to make sound decisions about when
each of these tools might be helpful, recognizing both the insight to be gained and their limitations. For
example, mathematically proficient high school students analyze graphs of functions and solutions
generated using a graphing calculator. They detect possible errors by strategically using estimation and
other mathematical knowledge. When making mathematical models, they know that technology can
enable them to visualize the results of varying assumptions, explore consequences, and compare
predictions with data. Mathematically proficient students at various grade levels are able to identify
relevant external mathematical resources, such as digital content located on a Web site, and use these to
pose or solve problems. They are able to use technological tools to explore and deepen their
understanding of concepts.
2010 Alabama Course of Study: Mathematics 8
6. Attend to precision.
These students try to communicate precisely to others. They try to use clear definitions in discussion with
others and in their own reasoning. They state the meaning of the symbols they choose, including using
the equal sign consistently and appropriately. Mathematically proficient students are careful about
specifying units of measure and labeling axes to clarify the correspondence with quantities in a problem.
They calculate accurately and efficiently, and express numerical answers with a degree of precision
appropriate for the problem context. In the elementary grades, students give carefully formulated
explanations to each other. By the time they reach high school they have learned to examine claims and
make explicit use of definitions.
7. Look for and make use of structure.
Mathematically proficient students look closely to discern a pattern or structure. Young students, for
example, might notice that three and seven more is the same amount as seven and three more, or they may
sort a collection of shapes according to how many sides the shapes have. Later, students will see 7 × 8
equals the well-remembered 7 × 5 + 7 × 3, in preparation for learning about the distributive property. In
the expression x2 + 9x + 14, older students can see the 14 as 2 × 7 and the 9 as 2 + 7. They recognize the
significance of an existing line in a geometric figure and can use the strategy of drawing an auxiliary line
for solving problems. These students also can pause and reflect for an overview and shift perspective.
They can observe the complexities of mathematics, such as some algebraic expressions as single objects
or as being composed of several objects. For example, they can see 5 – 3(x – y)2 as 5 minus a positive
number times a square and use that to realize that its value cannot be more than 5 for any real numbers x
and y.
8. Look for and express regularity in repeated reasoning.
They notice if calculations are repeated, and look both for general methods and for shortcuts. Upper
elementary students might notice when dividing 25 by 11 that they are repeating the same calculations
over and over again and conclude they have a repeating decimal. By paying attention to the calculation of
slope as they repeatedly check whether points are on the line through (1, 2) with slope 3, middle school
students might abstract the equation (y – 2)/(x – 1) = 3. Noticing the regularity in the way terms cancel
when expanding (x – 1)(x + 1), (x – 1)(x2 + x + 1), and (x – 1)(x
3 + x
2 + x + 1) might lead them to the
general formula for the sum of a geometric series. As students work to solve a problem, mathematically
proficient students maintain oversight of the process, while attending to the details and continually
evaluate the reasonableness of their intermediate results.
Connecting the Standards for Mathematical Practice to the Standards for Mathematical Content
The eight Standards for Mathematical Practice described on the previous pages indicate ways in which
developing student practitioners of the discipline of mathematics increasingly must engage with the
subject matter as they grow in mathematical maturity and expertise throughout the elementary, middle,
and high school years. It is important that curriculum, assessment, and professional development
designers be aware of the need to connect the mathematical practices to the mathematical content
standards.

2010 Alabama Course of Study: Mathematics 9
The Common Core State Standards for Mathematics, also referred to as the Standards for Mathematical
Content, are a balanced combination of procedure and understanding. Expectations that begin with the
word ―understand‖ are often especially good opportunities to connect mathematical practices to
mathematical content. Students who lack understanding of a topic may rely on procedures too heavily.
Without a flexible base from which to work, they may be less likely to consider analogous problems,
represent problems coherently, justify conclusions, apply the mathematics to practical situations, use
technology mindfully to work with the mathematics, explain the mathematics accurately to other students,
pause for an overview, or deviate from a known procedure to find a shortcut. Thus, a lack of
understanding effectively prevents a student from engaging in the mathematical practices.
In this respect, those content standards which set an expectation of understanding are potential ―points of
intersection‖ between the Standards for Mathematical Practice and the Standards for Mathematical
Content. These points of intersection are intended to be weighted toward central and generative concepts
in the school mathematics curriculum that most merit the necessary time, resources, innovative energies,
and focus to qualitatively improve the curriculum, instruction, assessment, professional development, and
student achievement in mathematics.
2010 Alabama Course of Study: Mathematics 10
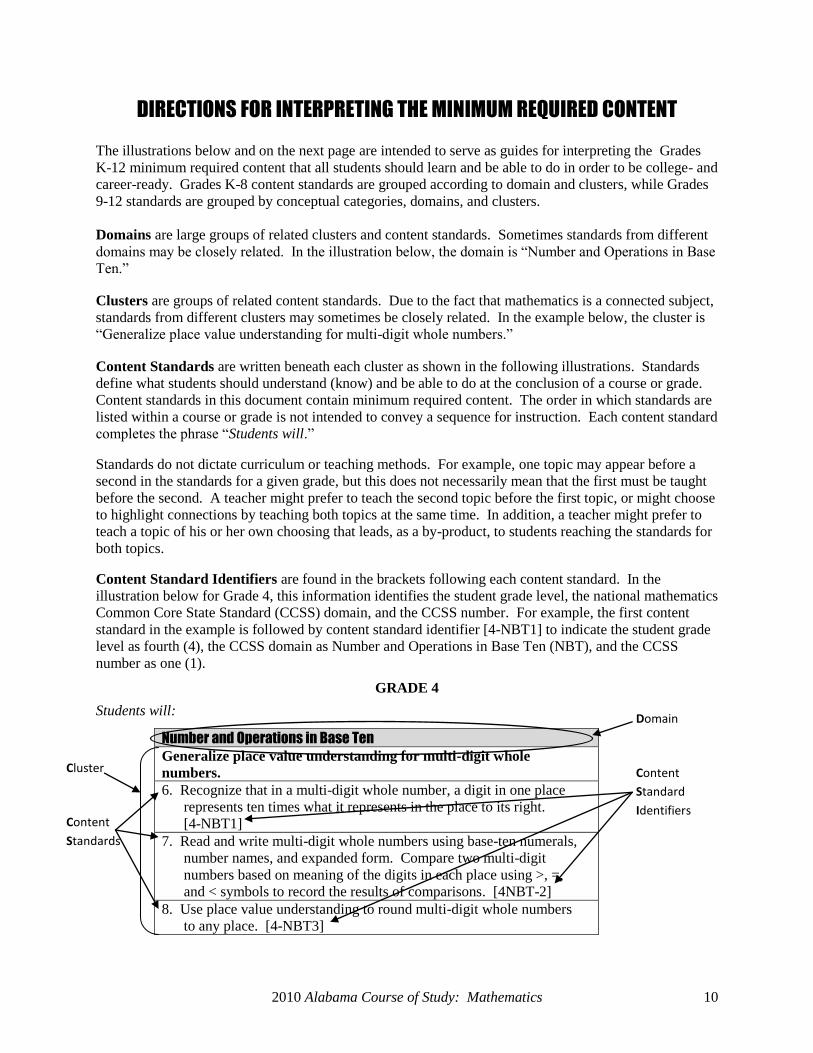
DIRECTIONS FOR INTERPRETING THE MINIMUM REQUIRED CONTENT
The illustrations below and on the next page are intended to serve as guides for interpreting the Grades
K-12 minimum required content that all students should learn and be able to do in order to be college- and
career-ready. Grades K-8 content standards are grouped according to domain and clusters, while Grades
9-12 standards are grouped by conceptual categories, domains, and clusters.
Domains are large groups of related clusters and content standards. Sometimes standards from different
domains may be closely related. In the illustration below, the domain is ―Number and Operations in Base
Ten.‖
Clusters are groups of related content standards. Due to the fact that mathematics is a connected subject,
standards from different clusters may sometimes be closely related. In the example below, the cluster is
―Generalize place value understanding for multi-digit whole numbers.‖
Content Standards are written beneath each cluster as shown in the following illustrations. Standards
define what students should understand (know) and be able to do at the conclusion of a course or grade.
Content standards in this document contain minimum required content. The order in which standards are
listed within a course or grade is not intended to convey a sequence for instruction. Each content standard
completes the phrase ―Students will.‖
Standards do not dictate curriculum or teaching methods. For example, one topic may appear before a
second in the standards for a given grade, but this does not necessarily mean that the first must be taught
before the second. A teacher might prefer to teach the second topic before the first topic, or might choose
to highlight connections by teaching both topics at the same time. In addition, a teacher might prefer to
teach a topic of his or her own choosing that leads, as a by-product, to students reaching the standards for
both topics.
Content Standard Identifiers are found in the brackets following each content standard. In the
illustration below for Grade 4, this information identifies the student grade level, the national mathematics
Common Core State Standard (CCSS) domain, and the CCSS number. For example, the first content
standard in the example is followed by content standard identifier [4-NBT1] to indicate the student grade
level as fourth (4), the CCSS domain as Number and Operations in Base Ten (NBT), and the CCSS
number as one (1).
GRADE 4
Students will:
Number and Operations in Base Ten
Generalize place value understanding for multi-digit whole
numbers.
6. Recognize that in a multi-digit whole number, a digit in one place
represents ten times what it represents in the place to its right.
[4-NBT1]
7. Read and write multi-digit whole numbers using base-ten numerals,
number names, and expanded form. Compare two multi-digit
numbers based on meaning of the digits in each place using >, =,
and < symbols to record the results of comparisons. [4NBT-2]
8. Use place value understanding to round multi-digit whole numbers
to any place. [4-NBT3]
Content
Standards
Content
Standard
Identifiers
Domain
Cluster

2010 Alabama Course of Study: Mathematics 11
For high school courses, as in the illustration below, the bracketed information identifies the conceptual
category by which the standard is grouped, the CCSS domain, and the CCSS number. Conceptual
categories are described in the high school mathematics section of this document on pages 67-80. In the
illustration below for Algebra II With Trigonometry, the second content standard is followed by content
standard identifier [F-TF2] to indicate the CCSS conceptual category as Functions (F), the domain as
Trigonometric Functions (TF), and the CCSS number as two (2). Required content added from the 2009
Alabama Course of Study: Mathematics is noted at the end of a standard by a state of Alabama symbol
( ), as shown in the third content standard of the example.
ALGEBRA II WITH TRIGONOMETRY
Students will:
FUNCTIONS
Trigonometric Functions
Extend the domain of trigonometric functions using the unit circle.
32. Understand radian measure of an angle as the length of the arc on
the unit circle subtended by the angle. [F-TF1]
33. Explain how the unit circle in the coordinate plane enables the
extension of trigonometric functions to all real numbers, interpreted
as radian measures of angles traversed counterclockwise around the
unit circle. [F-TF2]
34. Define the six trigonometric functions using ratios of the sides of
a right triangle, coordinates on the unit circle, and the reciprocal of
other functions.
Conceptual
Category
Content
Standard
Identifiers
Cluster
Domain
Cluster
Content
Standards

2010 Alabama Course of Study: Mathematics 12
GRADE K OVERVIEW
Grade K content is organized into five domains of focused study as outlined below in the column to the
left. The Grade K domains listed in bold print on the shaded bars are Counting and Cardinality,
Operations and Algebraic Thinking, Number and Operations in Base Ten, Measurement and Data, and
Geometry. Immediately following the domain and enclosed in brackets is an abbreviation denoting the
domain. Identified below each domain are the clusters that serve to group related content standards. All
Grade K content standards, grouped by domain and cluster, are located on the pages that follow.
The Standards for Mathematical Practice are listed below in the column to the right. These mathematical
practice standards should be incorporated into classroom instruction of the content standards.
Content Standard Domains and Clusters Standards for Mathematical Practice
Counting and Cardinality [CC]
• Know number names and the count
sequence.
• Count to tell the number of objects.
• Compare numbers.
Operations and Algebraic Thinking [OA]
• Understand addition as putting together and
adding to, and understand subtraction as
taking apart and taking from.
Number and Operations in Base Ten [NBT]
• Work with numbers 11–19 to gain
foundations for place value.
Measurement and Data [MD]
• Describe and compare measurable attributes.
• Classify objects and count the number of
objects in categories.
Geometry [G]
• Identify and describe shapes.
• Analyze, compare, create, and compose
shapes.
1. Make sense of problems and persevere
in solving them.
2. Reason abstractly and quantitatively.
3. Construct viable arguments and
critique the reasoning of others.
4. Model with mathematics.
5. Use appropriate tools strategically.
6. Attend to precision.
7. Look for and make use of structure.
8. Look for and express regularity in
repeated reasoning.

2010 Alabama Course of Study: Mathematics 13
GRADE K
In kindergarten, instructional time should focus on two critical areas. These areas are (1) representing,
relating, and operating on whole numbers, initially with sets of objects; and (2) describing shapes and
space. More learning time in kindergarten should be focused on number rather than other topics.
Important information regarding these two critical areas of instruction follows:
(1) Students use numbers, including written numerals, to represent quantities and to solve quantitative
problems such as counting objects in a set; counting out a given number of objects; comparing sets
or numerals; and modeling simple joining and separating situations with sets of objects, or
eventually with equations such as 5 + 2 = 7 and 7 – 2 = 5. (Kindergarten students should see
addition and subtraction equations, and although not required, student writing of equations in
kindergarten is encouraged.) Students choose, combine, and apply effective strategies for
answering quantitative questions, including quickly recognizing the cardinalities of small sets of
objects, counting and producing sets of given sizes, counting the number of objects in combined
sets, or counting the number of objects that remain in a set after some are taken away.
(2) Students describe their physical world using both vocabulary and geometric ideas, including
shape, orientation, and spatial relations. They identify, name, and describe basic two-dimensional
shapes such as squares, triangles, circles, rectangles, and hexagons presented in a variety of ways,
including using different sizes and orientations. Students also identify three-dimensional shapes
such as cubes, cones, cylinders, and spheres. They use basic shapes and spatial reasoning to model
objects in their environment and to construct more complex shapes.
Students will:
Counting and Cardinality
Know number names and the count sequence.
1. Count to 100 by ones and by tens. [K-CC1]
2. Count forward beginning from a given number within the known sequence (instead of having to
begin at 1). [K-CC2]
3. Write numbers from 0 to 20. Represent a number of objects with a written numeral 0-20 (with 0
representing a count of no objects). [K-CC3]
Count to tell the number of objects.
4. Understand the relationship between numbers and quantities; connect counting to cardinality.
[K-CC4]
a. When counting objects, say the number names in the standard order, pairing each object
with one and only one number name and each number name with one and only one object.
[K-CC4a]
b. Understand that the last number name said tells the number of objects counted. The
number of objects is the same regardless of their arrangement or the order in which they
were counted. [K-CC4b]

K
2010 Alabama Course of Study: Mathematics 14
c. Understand that each successive number name refers to a quantity that is one larger.
[K-CC4c]
5. Count to answer ―how many?‖ questions about as many as 20 things arranged in a line, a
rectangular array, or a circle, or as many as 10 things in a scattered configuration; given a number
from 1-20, count out that many objects. [K-CC5]
Compare numbers.
6. Identify whether the number of objects in one group is greater than, less than, or equal to the
number of objects in another group, e.g., by using matching and counting strategies. (Include
groups with up to ten objects.) [K-CC6]
7. Compare two numbers between 1 and 10 presented as written numerals. [K-CC7]
Operations and Algebraic Thinking
Understand addition as putting together and adding to, and understand subtraction as taking apart
and taking from.
8. Represent addition and subtraction with objects, fingers, mental images, drawings, sounds (e.g.,
claps), acting out situations, verbal explanations, expressions, or equations. (Drawings need not
show details, but should show the mathematics in the problem. This applies wherever drawings
are mentioned in the Standards.) [K-OA1]
9. Solve addition and subtraction word problems, and add and subtract within 10, e.g., by using
objects or drawings to represent the problem. [K-OA2]
10. Decompose numbers less than or equal to 10 into pairs in more than one way, e.g., by using
objects or drawings, and record each decomposition by a drawing or equation (e.g., 5 = 2 + 3 and
5 = 4 + 1). [K-OA3]
11. For any number from 1 to 9, find the number that makes 10 when added to the given number, e.g.,
by using objects or drawings, and record the answer with a drawing or equation. [K-OA4]
12. Fluently add and subtract within 5. [K-OA5]
Number and Operations in Base Ten
Work with numbers 11–19 to gain foundations for place value.
13. Compose and decompose numbers from 11 to 19 into ten ones and some further ones, e.g., by
using objects or drawings, and record each composition or decomposition by a drawing or
equation (e.g., 18 = 10 + 8); understand that these numbers are composed of ten ones and one, two,
three, four, five, six, seven, eight, or nine ones. [K-NBT1]
K
2010 Alabama Course of Study: Mathematics 15
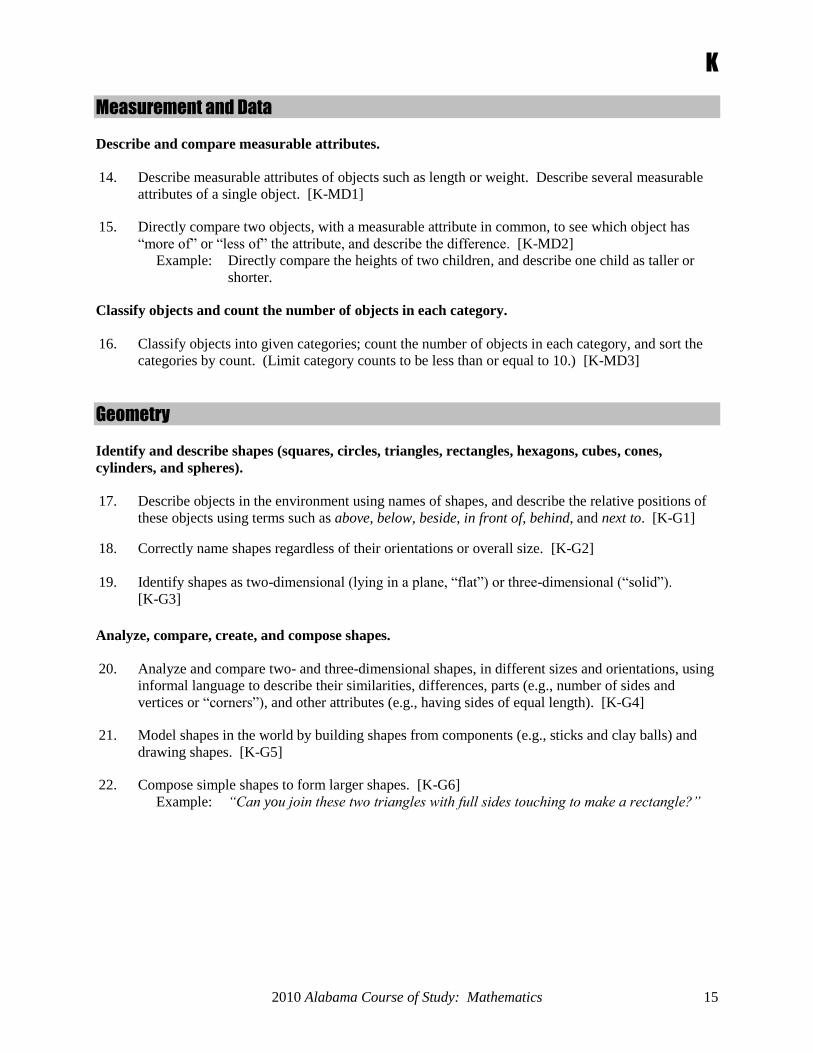
Measurement and Data
Describe and compare measurable attributes.
14. Describe measurable attributes of objects such as length or weight. Describe several measurable
attributes of a single object. [K-MD1]
15. Directly compare two objects, with a measurable attribute in common, to see which object has
―more of‖ or ―less of‖ the attribute, and describe the difference. [K-MD2]
Example: Directly compare the heights of two children, and describe one child as taller or
shorter.
Classify objects and count the number of objects in each category.
16. Classify objects into given categories; count the number of objects in each category, and sort the
categories by count. (Limit category counts to be less than or equal to 10.) [K-MD3]
Geometry
Identify and describe shapes (squares, circles, triangles, rectangles, hexagons, cubes, cones,
cylinders, and spheres).
17. Describe objects in the environment using names of shapes, and describe the relative positions of
these objects using terms such as above, below, beside, in front of, behind, and next to. [K-G1]
18. Correctly name shapes regardless of their orientations or overall size. [K-G2]
19. Identify shapes as two-dimensional (lying in a plane, ―flat‖) or three-dimensional (―solid‖).
[K-G3]
Analyze, compare, create, and compose shapes.
20. Analyze and compare two- and three-dimensional shapes, in different sizes and orientations, using
informal language to describe their similarities, differences, parts (e.g., number of sides and
vertices or ―corners‖), and other attributes (e.g., having sides of equal length). [K-G4]
21. Model shapes in the world by building shapes from components (e.g., sticks and clay balls) and
drawing shapes. [K-G5]
22. Compose simple shapes to form larger shapes. [K-G6]
Example: “Can you join these two triangles with full sides touching to make a rectangle?”

2010 Alabama Course of Study: Mathematics 16
GRADE 1 OVERVEW
Grade 1 content is organized into four domains of focused study as outlined below in the column to the
left. The Grade 1 domains listed in bold print on the shaded bars are Operations and Algebraic Thinking,
Number and Operations in Base Ten, Measurement and Data, and Geometry. Immediately following the
domain and enclosed in brackets is an abbreviation denoting the domain. Identified below each domain
are the clusters that serve to group related content standards. All Grade 1 content standards, grouped by
domain and cluster, are located on the pages that follow.
The Standards for Mathematical Practice are listed below in the column to the right. These mathematical
practice standards should be incorporated into classroom instruction of the content standards.
Content Standard Domains and Clusters Standards for Mathematical Practice
Operations and Algebraic Thinking [OA]
• Represent and solve problems involving
addition and subtraction.
• Understand and apply properties of
operations and the relationship between
addition and subtraction.
• Add and subtract within 20.
• Work with addition and subtraction
equations.
Number and Operations in Base Ten [NBT]
• Extend the counting sequence.
• Understand place value.
• Use place value understanding and properties
of operations to add and subtract.
Measurement and Data [MD]
• Measure lengths indirectly and by iterating
length units.
• Tell and write time.
• Represent and interpret data.
Geometry [G]
• Reason with shapes and their attributes.
1. Make sense of problems and persevere
in solving them.
2. Reason abstractly and quantitatively.
3. Construct viable arguments and
critique the reasoning of others.
4. Model with mathematics.
5. Use appropriate tools strategically.
6. Attend to precision.
7. Look for and make use of structure.
8. Look for and express regularity in
repeated reasoning.
2010 Alabama Course of Study: Mathematics 17
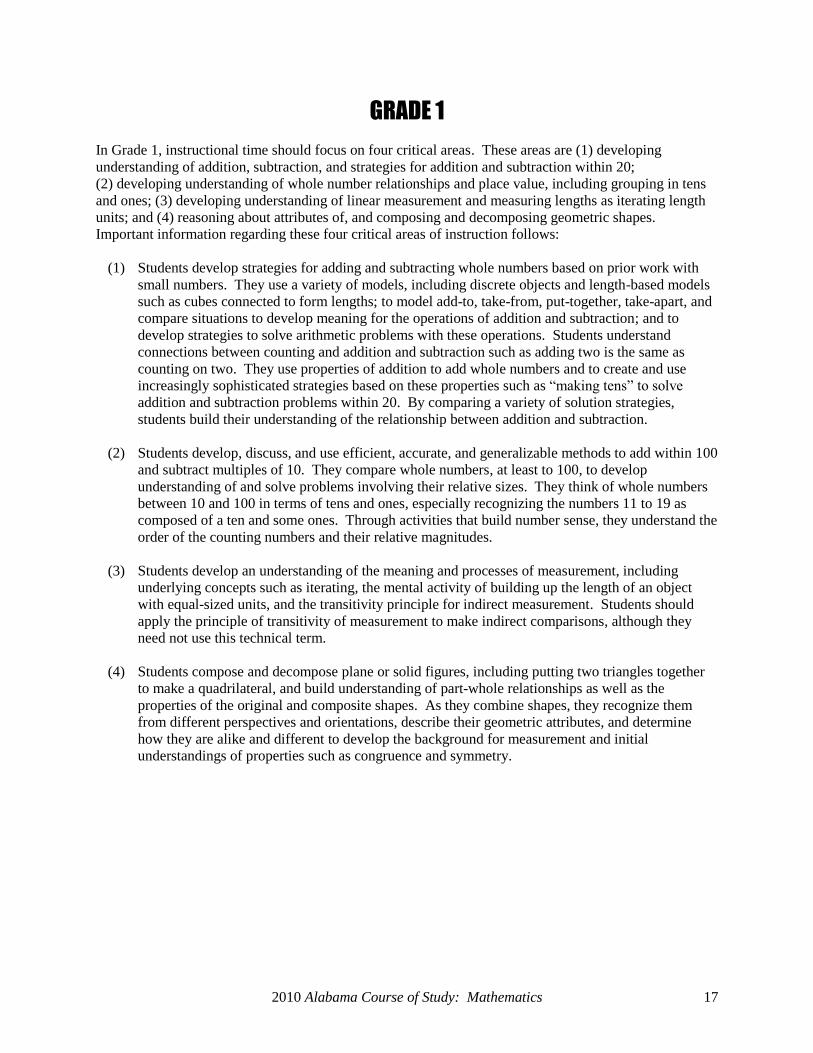
GRADE 1
In Grade 1, instructional time should focus on four critical areas. These areas are (1) developing
understanding of addition, subtraction, and strategies for addition and subtraction within 20;
(2) developing understanding of whole number relationships and place value, including grouping in tens
and ones; (3) developing understanding of linear measurement and measuring lengths as iterating length
units; and (4) reasoning about attributes of, and composing and decomposing geometric shapes.
Important information regarding these four critical areas of instruction follows:
(1) Students develop strategies for adding and subtracting whole numbers based on prior work with
small numbers. They use a variety of models, including discrete objects and length-based models
such as cubes connected to form lengths; to model add-to, take-from, put-together, take-apart, and
compare situations to develop meaning for the operations of addition and subtraction; and to
develop strategies to solve arithmetic problems with these operations. Students understand
connections between counting and addition and subtraction such as adding two is the same as
counting on two. They use properties of addition to add whole numbers and to create and use
increasingly sophisticated strategies based on these properties such as ―making tens‖ to solve
addition and subtraction problems within 20. By comparing a variety of solution strategies,
students build their understanding of the relationship between addition and subtraction.
(2) Students develop, discuss, and use efficient, accurate, and generalizable methods to add within 100
and subtract multiples of 10. They compare whole numbers, at least to 100, to develop
understanding of and solve problems involving their relative sizes. They think of whole numbers
between 10 and 100 in terms of tens and ones, especially recognizing the numbers 11 to 19 as
composed of a ten and some ones. Through activities that build number sense, they understand the
order of the counting numbers and their relative magnitudes.
(3) Students develop an understanding of the meaning and processes of measurement, including
underlying concepts such as iterating, the mental activity of building up the length of an object
with equal-sized units, and the transitivity principle for indirect measurement. Students should
apply the principle of transitivity of measurement to make indirect comparisons, although they
need not use this technical term.
(4) Students compose and decompose plane or solid figures, including putting two triangles together
to make a quadrilateral, and build understanding of part-whole relationships as well as the
properties of the original and composite shapes. As they combine shapes, they recognize them
from different perspectives and orientations, describe their geometric attributes, and determine
how they are alike and different to develop the background for measurement and initial
understandings of properties such as congruence and symmetry.
1st
2010 Alabama Course of Study: Mathematics 18
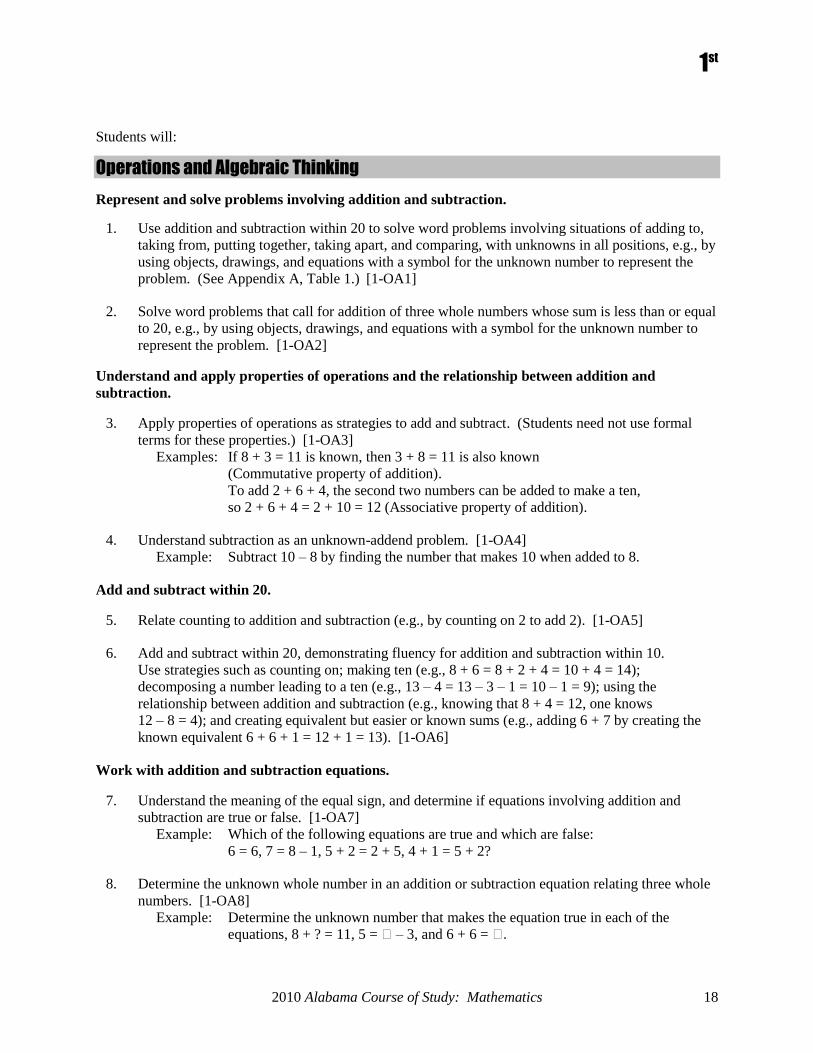
Students will:
Operations and Algebraic Thinking
Represent and solve problems involving addition and subtraction.
1. Use addition and subtraction within 20 to solve word problems involving situations of adding to,
taking from, putting together, taking apart, and comparing, with unknowns in all positions, e.g., by
using objects, drawings, and equations with a symbol for the unknown number to represent the
problem. (See Appendix A, Table 1.) [1-OA1]
2. Solve word problems that call for addition of three whole numbers whose sum is less than or equal
to 20, e.g., by using objects, drawings, and equations with a symbol for the unknown number to
represent the problem. [1-OA2]
Understand and apply properties of operations and the relationship between addition and
subtraction.
3. Apply properties of operations as strategies to add and subtract. (Students need not use formal
terms for these properties.) [1-OA3]
Examples: If 8 + 3 = 11 is known, then 3 + 8 = 11 is also known
(Commutative property of addition).
To add 2 + 6 + 4, the second two numbers can be added to make a ten,
so 2 + 6 + 4 = 2 + 10 = 12 (Associative property of addition).
4. Understand subtraction as an unknown-addend problem. [1-OA4]
Example: Subtract 10 – 8 by finding the number that makes 10 when added to 8.
Add and subtract within 20.
5. Relate counting to addition and subtraction (e.g., by counting on 2 to add 2). [1-OA5]
6. Add and subtract within 20, demonstrating fluency for addition and subtraction within 10.
Use strategies such as counting on; making ten (e.g., 8 + 6 = 8 + 2 + 4 = 10 + 4 = 14);
decomposing a number leading to a ten (e.g., 13 – 4 = 13 – 3 – 1 = 10 – 1 = 9); using the
relationship between addition and subtraction (e.g., knowing that 8 + 4 = 12, one knows
12 – 8 = 4); and creating equivalent but easier or known sums (e.g., adding 6 + 7 by creating the
known equivalent 6 + 6 + 1 = 12 + 1 = 13). [1-OA6]
Work with addition and subtraction equations.
7. Understand the meaning of the equal sign, and determine if equations involving addition and
subtraction are true or false. [1-OA7]
Example: Which of the following equations are true and which are false:
6 = 6, 7 = 8 – 1, 5 + 2 = 2 + 5, 4 + 1 = 5 + 2?
8. Determine the unknown whole number in an addition or subtraction equation relating three whole
numbers. [1-OA8]
Example: Determine the unknown number that makes the equation true in each of the
equations, 8 + ? = 11, 5 = � – 3, and 6 + 6 = �.
1st
2010 Alabama Course of Study: Mathematics 19
Number and Operations in Base Ten
Extend the counting sequence.
9. Count to 120, starting at any number less than 120. In this range, read and write numerals and
represent a number of objects with a written numeral. [1-NBT1]
Understand place value.
10. Understand that the two digits of a two-digit number represent amounts of tens and ones.
Understand the following as special cases: [1-NBT2]
a. 10 can be thought of as a bundle of ten ones, called a ―ten.‖ [1-NBT2a]
b. The numbers from 11 to 19 are composed of a ten and one, two, three, four, five, six,
seven, eight, or nine ones. [1-NBT2b]
c. The numbers 10, 20, 30, 40, 50, 60, 70, 80, 90 refer to one, two, three, four, five, six, seven,
eight, or nine tens (and 0 ones). [1-NBT2c]
11. Compare two two-digit numbers based on meanings of the tens and ones digits, recording the
results of comparisons with the symbols >, =, and <. [1-NBT3]
Use place value understanding and properties of operations to add and subtract.
12. Add within 100, including adding a two-digit number and a one-digit number and adding a two-
digit number and a multiple of 10, using concrete models or drawings and strategies based on
place value, properties of operations, and/or the relationship between addition and subtraction;
relate the strategy to a written method, and explain the reasoning used. Understand that in adding
two-digit numbers, one adds tens and tens, ones and ones; and sometimes it is necessary to
compose a ten. [1-NBT4]
13. Given a two-digit number, mentally find 10 more or 10 less than the number without having to
count; explain the reasoning used. [1-NBT5]
14. Subtract multiples of 10 in the range 10-90 from multiples of 10 in the range 10-90 (positive or
zero differences), using concrete models or drawings and strategies based on place value,
properties of operations, and/or the relationship between addition and subtraction; relate the
strategy to a written method, and explain the reasoning used. [1-NBT6]
Measurement and Data
Measure lengths indirectly and by iterating length units.
15. Order three objects by length; compare the lengths of two objects indirectly by using a third
object. [1-MD1]
16. Express the length of an object as a whole number of length units by laying multiple copies of a
shorter object (the length unit) end to end; understand that the length measurement of an object is
the number of same-size length units that span it with no gaps or overlaps. Limit to contexts
where the object being measured is spanned by a whole number of length units with no gaps or
overlaps. [1-MD2]

1st
2010 Alabama Course of Study: Mathematics 20
Tell and write time.
17. Tell and write time in hours and half-hours using analog and digital clocks. [1-MD3]
Represent and interpret data.
18. Organize, represent, and interpret data with up to three categories; ask and answer questions about
the total number of data points, how many in each category, and how many more or less are in one
category than in another. [1-MD4]
Geometry
Reason with shapes and their attributes.
19. Distinguish between defining attributes (e.g., triangles are closed and three-sided) versus non-
defining attributes (e.g., color, orientation, overall size); build and draw shapes to possess defining
attributes. [1-G1]
20. Compose two-dimensional shapes (rectangles, squares, trapezoids, triangles, half-circles, and
quarter-circles) or three-dimensional shapes (cubes, right rectangular prisms, right circular cones,
and right circular cylinders) to create a composite shape, and compose new shapes from the
composite shape. (Students do not need to learn formal names such as ―right rectangular prism.‖)
[1-G2]
21. Partition circles and rectangles into two and four equal shares; describe the shares using the words
halves, fourths, and quarters; and use the phrases half of, fourth of, and quarter of. Describe the
whole as two of, or four of the shares. Understand for these examples that decomposing into more
equal shares creates smaller shares. [1-G3]

2010 Alabama Course of Study: Mathematics 21
GRADE 2 OVERVIEW
Grade 2 content is organized into four domains of focused study as outlined below in the column to the
left. The Grade 2 domains listed in bold print on the shaded bars are Operations and Algebraic Thinking,
Number and Operations in Base Ten, Measurement and Data, and Geometry. Immediately following the
domain and enclosed in brackets is an abbreviation denoting the domain. Identified below each domain
are the clusters that serve to group related content standards. All Grade 2 content standards, grouped by
domain and cluster, are located on the pages that follow.
The Standards for Mathematical Practice are listed below in the column to the right. These mathematical
practice standards should be incorporated into classroom instruction of the content standards.
Content Standard Domains and Clusters Standards for Mathematical Practice
Operations and Algebraic Thinking [OA]
• Represent and solve problems involving
addition and subtraction.
• Add and subtract within 20.
• Work with equal groups of objects to gain
foundations for multiplication.
Number and Operations in Base Ten [NBT]
• Understand place value.
• Use place value understanding and properties
of operations to add and subtract.
Measurement and Data [MD]
• Measure and estimate lengths in standard
units.
• Relate addition and subtraction to length.
• Work with time and money.
• Represent and interpret data.
Geometry [G]
• Reason with shapes and their attributes.
1. Make sense of problems and persevere
in solving them.
2. Reason abstractly and quantitatively.
3. Construct viable arguments and
critique the reasoning of others.
4. Model with mathematics.
5. Use appropriate tools strategically.
6. Attend to precision.
7. Look for and make use of structure.
8. Look for and express regularity in
repeated reasoning.

2010 Alabama Course of Study: Mathematics 22
GRADE 2
In Grade 2, instructional time should focus on four critical areas. These areas are (1) extending
understanding of base-ten notation; (2) building fluency with addition and subtraction; (3) using standard
units of measure; and (4) describing and analyzing shapes. Important information regarding these four
critical areas of instruction follows:
(1) Students extend their understanding of the base-ten system. This includes ideas of counting in
fives, tens, and multiples of hundreds, tens, and ones —as well as number relationships involving
these units, including comparing. Students understand multi-digit numbers, up to 1000, written in
base-ten notation, recognizing that the digits in each place represent amounts of thousands,
hundreds, tens, or ones such as 853 is 8 hundreds + 5 tens + 3 ones.
(2) Students use their understanding of addition to develop fluency with addition and subtraction
within 100. They solve problems within 1000 by applying their understanding of models for
addition and subtraction. Students develop, discuss, and use efficient, accurate, and generalizable
methods to compute sums and differences of whole numbers in base-ten notation, using their
understanding of place value and the properties of operations. They select and accurately apply
methods that are appropriate for the context and the numbers involved to mentally calculate sums
and differences for numbers with only tens or only hundreds.
(3) Students recognize the need for standard units of measure, including centimeter and inch, and they
use rulers and other measurement tools with the understanding that linear measure involves an
iteration of units. They recognize that the smaller the unit, the more iterations they need to cover a
given length.
(4) Students describe and analyze shapes by examining their sides and angles. They investigate,
describe, and reason about decomposing and combining shapes to make other shapes. Through
building, drawing, and analyzing two- and three-dimensional shapes, students develop a
foundation for understanding area, volume, congruence, similarity, and symmetry in later grades.
Students will:
Operations and Algebraic Thinking
Represent and solve problems involving addition and subtraction.
1. Use addition and subtraction within 100 to solve one- and two-step word problems involving
situations of adding to, taking from, putting together, taking apart, and comparing with unknowns
in all positions, e.g., by using drawings and equations with a symbol for the unknown number to
represent the problem. (See Appendix A, Table 1.) [2-OA1]
Add and subtract within 20.
2. Fluently add and subtract within 20 using mental strategies. (See standard 6, Grade 1, for a list of
mental strategies.) By end of Grade 2, know from memory all sums of two one-digit numbers.
[2-OA2]
2nd
2010 Alabama Course of Study: Mathematics 23
Work with equal groups of objects to gain foundations for multiplication.
3. Determine whether a group of objects (up to 20) has an odd or even number of members, e.g., by
pairing objects or counting them by 2s; write an equation to express an even number as a sum of
two equal addends. [2-OA3]
4. Use addition to find the total number of objects arranged in rectangular arrays with up to 5 rows
and up to 5 columns; write an equation to express the total as a sum of equal addends. [2-OA4]
Number and Operations in Base Ten
Understand place value.
5. Understand that the three digits of a three-digit number represent amounts of hundreds, tens, and
ones; e.g., 706 equals 7 hundreds, 0 tens, and 6 ones. Understand the following as special cases:
[2-NBT1]
a. 100 can be thought of as a bundle of ten tens, called a ―hundred.‖ [2-NBT1a]
b. The numbers 100, 200, 300, 400, 500, 600, 700, 800, 900 refer to one, two, three, four,
five, six, seven, eight, or nine hundreds (and 0 tens and 0 ones). [2-NBT1b]
6. Count within 1000; skip-count by 5s, 10s, and 100s. [2-NBT2]
7. Read and write numbers to 1000 using base-ten numerals, number names, and expanded form.
[2-NBT3]
8. Compare two three-digit numbers based on meanings of the hundreds, tens, and ones digits using
>, =, and < symbols to record the results of comparisons. [2-NBT4]
Use place value understanding and properties of operations to add and subtract.
9. Fluently add and subtract within 100 using strategies based on place value, properties of
operations, and/or the relationship between addition and subtraction. [2-NBT5]
10. Add up to four two-digit numbers using strategies based on place value and properties of
operations. [2-NBT6]
11. Add and subtract within 1000 using concrete models or drawings and strategies based on place
value, properties of operations, and/or the relationship between addition and subtraction; relate
the strategy to a written method. Understand that in adding or subtracting three-digit numbers,
one adds or subtracts hundreds and hundreds, tens and tens, ones and ones; and sometimes it is
necessary to compose or decompose tens or hundreds. [2-NBT7]
12. Mentally add 10 or 100 to a given number 100 – 900, and mentally subtract 10 or 100 from a
given number 100 – 900. [2-NBT8]
13. Explain why addition and subtraction strategies work, using place value and the properties of
operations. (Explanations may be supported by drawings or objects.) [2-NBT9]

2nd
2010 Alabama Course of Study: Mathematics 24
Measurement and Data
Measure and estimate lengths in standard units.
14. Measure the length of an object by selecting and using appropriate tools such as rulers,
yardsticks, meter sticks, and measuring tapes. [2-MD1]
15. Measure the length of an object twice, using length units of different lengths for the two
measurements; describe how the two measurements relate to the size of the unit chosen. [2-MD2]
16. Estimate lengths using units of inches, feet, centimeters, and meters. [2-MD3]
17. Measure to determine how much longer one object is than another, expressing the length
difference in terms of a standard length unit. [2-MD4]
Relate addition and subtraction to length.
18. Use addition and subtraction within 100 to solve word problems involving lengths that are given
in the same units, e.g., by using drawings (such as drawings of rulers) and equations with a
symbol for the unknown number to represent the problem. [2-MD5]
19. Represent whole numbers as lengths from 0 on a number line diagram with equally spaced points
corresponding to the numbers 0, 1, 2…, and represent whole-number sums and differences within
100 on a number diagram. [2-MD6]
Work with time and money.
20. Tell and write time from analog and digital clocks to the nearest five minutes, using a.m. and p.m.
[2-MD7]
21. Solve word problems involving dollar bills, quarters, dimes, nickels, and pennies, using $ and ¢
symbols appropriately. [2-MD8]
Example: If you have 2 dimes and 3 pennies, how many cents do you have?
Represent and interpret data.
22. Generate measurement data by measuring lengths of several objects to the nearest whole unit or
by making repeated measurements of the same object. Show the measurements by making a line
plot where the horizontal scale is marked off in whole-number units. [2-MD9]
23. Draw a picture graph and a bar graph (with single-unit scale) to represent a data set with up to
four categories. Solve simple put-together, take-apart, and compare problems using information
presented in a bar graph. (See Appendix A, Table 1.) [2-MD10]
2nd
2010 Alabama Course of Study: Mathematics 25
Geometry
Reason with shapes and their attributes.
24. Recognize and draw shapes having specified attributes such as a given number of angles or a
given number of equal faces. (Sizes are compared directly or visually, not compared by
measuring.) Identify triangles, quadrilaterals, pentagons, hexagons, and cubes. [2-G1]
25. Partition a rectangle into rows and columns of same-size squares, and count to find the total
number of them. [2-G2]
26. Partition circles and rectangles into two, three, or four equal shares; describe the shares using the
words halves, thirds, half of, a third of, etc.; and describe the whole as two halves, three thirds, or
four fourths. Recognize that equal shares of identical wholes need not have the same shape.
[2-G3]

2010 Alabama Course of Study: Mathematics 26
GRADE 3 OVERVIEW
Grade 3 content is organized into five domains of focused study as outlined below in the column to the
left. The Grade 3 domains listed in bold print on the shaded bars are Operations and Algebraic Thinking,
Number and Operations in Base Ten, Number and Operations – Fractions, Measurement and Data, and
Geometry. Immediately following the domain and enclosed in brackets is an abbreviation denoting the
domain. Identified below each domain are the clusters that serve to group related content standards. All
Grade 3 content standards, grouped by domain and cluster, are located on the pages that follow.
The Standards for Mathematical Practice are listed below in the column to the right. These mathematical
practice standards should be incorporated into classroom instruction of the content standards.
Content Standard Domains and Clusters Standards for Mathematical Practice
Operations and Algebraic Thinking [OA]
• Represent and solve problems involving
multiplication and division.
• Understand properties of multiplication and the
relationship between multiplication and
division.
• Multiply and divide within 100.
• Solve problems involving the four operations,
and identify and explain patterns in arithmetic.
Number and Operations in Base Ten [NBT]
• Use place value understanding and properties
of operations to perform multi-digit arithmetic.
Number and Operations – Fractions [NF]
• Develop understanding of fractions as
numbers.
Measurement and Data [MD]
• Solve problems involving measurement and
estimation of intervals of time, liquid volumes,
and masses of objects.
• Represent and interpret data.
• Geometric measurement: understand concepts
of area and relate area to multiplication and to
addition.
• Geometric measurement: recognize perimeter
as an attribute of plane figures and distinguish
between linear and area measures.
Geometry [G]
• Reason with shapes and their attributes.
1. Make sense of problems and persevere
in solving them.
2. Reason abstractly and quantitatively.
3. Construct viable arguments and
critique the reasoning of others.
4. Model with mathematics.
5. Use appropriate tools strategically.
6. Attend to precision.
7. Look for and make use of structure.
8. Look for and express regularity in
repeated reasoning.

2010 Alabama Course of Study: Mathematics 27
GRADE 3
In Grade 3, instructional time should focus on four critical areas. These areas are (1) developing
understanding of multiplication and division and strategies for multiplication and division within 100;
(2) developing understanding of fractions, especially unit fractions (fractions with numerator 1);
(3) developing understanding of the structure of rectangular arrays and of area; and (4) describing and
analyzing two-dimensional shapes. Important information regarding these four critical areas of
instruction follows:
(1) Students develop an understanding of the meanings of multiplication and division of whole
numbers through activities and problems involving equal-sized groups, arrays, and area models.
Multiplication is finding an unknown product, and division is finding an unknown factor in these
situations. For equal-sized group situations, division can require finding the unknown number of
groups or the unknown group size. Students use properties of operations to calculate products of
whole numbers, using increasingly sophisticated strategies based on these properties to solve
multiplication and division problems involving single-digit factors. By comparing a variety of
solution strategies, students learn the relationship between multiplication and division.
(2) Students develop an understanding of fractions, beginning with unit fractions. They view fractions
in general as being built out of unit fractions, and they use fractions along with visual fraction
models to represent parts of a whole. Students understand that the size of a fractional part is
relative to the size of the whole. For example, 1
2
of the paint in a small bucket could be less paint
than 1
3
of the paint in a larger bucket, but 1
3
of a ribbon is longer than 1
5
of the same ribbon
because when the ribbon is divided into 3 equal parts, the parts are longer than when the ribbon is
divided into 5 equal parts. Students are able to use fractions to represent numbers equal to, less
than, and greater than one. They solve problems that involve comparing fractions by using visual
fraction models and strategies based on noticing equal numerators or denominators.
(3) Students recognize area as an attribute of two-dimensional regions. They measure the area of a
shape by finding the total number of same-size units of area required to cover the shape without
gaps or overlaps, keeping in mind that a square with sides of unit length is the standard unit for
measuring area. Students understand that rectangular arrays can be decomposed into identical
rows or into identical columns. By decomposing rectangles into rectangular arrays of squares,
students connect area to multiplication and justify using multiplication to determine the area of a
rectangle.
(4) Students describe, analyze, and compare properties of two-dimensional shapes. They compare and
classify shapes by their sides and angles and connect these with definitions of shapes. Students
also relate their fraction work to geometry by expressing the area of part of a shape as a unit
fraction of the whole.

3rd
2010 Alabama Course of Study: Mathematics 28
Students will:
Operations and Algebraic Thinking
Represent and solve problems involving multiplication and division.
1. Interpret products of whole numbers, e.g., interpret 5 × 7 as the total number of objects in 5 groups
of 7 objects each. [3-OA1]
Example: Describe a context in which a total number of objects can be expressed as 5 × 7.
2. Interpret whole-number quotients of whole numbers, e.g., interpret 56 ÷ 8 as the number of objects
in each share when 56 objects are partitioned equally into 8 shares, or as a number of shares when
56 objects are partitioned into equal shares of 8 objects each. [3-OA2]
Example: Describe a context in which a number of shares or a number of groups can be
expressed as 56 ÷ 8.
3. Use multiplication and division within 100 to solve word problems in situations involving equal
groups, arrays, and measurement quantities, e.g., by using drawings and equations with a symbol
for the unknown number to represent the problem. (See Appendix A, Table 2.) [3-OA3]
4. Determine the unknown whole number in a multiplication or division equation relating three
whole numbers. [3-OA4]
Example: Determine the unknown number that makes the equation true in each of the
equations, 8 × ? = 48, 5 = � ÷ 3, and 6 × 6 = ?.
Understand properties of multiplication and the relationship between multiplication and division.
5. Apply properties of operations as strategies to multiply and divide. (Students need not use formal
terms for these properties.) [3-OA5]
Examples: If 6 × 4 = 24 is known, then 4 × 6 = 24 is also known. (Commutative property of
multiplication)
3 × 5 × 2 can be found by 3 × 5 = 15, then 15 × 2 = 30, or by 5 × 2 = 10, then
3 × 10 = 30. (Associative property of multiplication)
Knowing that 8 × 5 = 40 and 8 × 2 = 16, one can find 8 × 7 as 8 × (5 + 2) =
(8 × 5) + (8 × 2) = 40 + 16 = 56. (Distributive property)
6. Understand division as an unknown-factor problem. [3-OA6]
Example: Find 32 ÷ 8 by finding the number that makes 32 when multiplied by 8.
Multiply and divide within 100.
7. Fluently multiply and divide within 100, using strategies such as the relationship between
multiplication and division (e.g., knowing that 8 × 5 = 40, one knows 40 ÷ 5 = 8) or properties of
operations. By the end of Grade 3, know from memory all products of two one-digit numbers.
[3-OA7]
3rd
2010 Alabama Course of Study: Mathematics 29
Solve problems involving the four operations, and identify and explain patterns in arithmetic.
8. Solve two-step word problems using the four operations. Represent these problems using
equations with a letter standing for the unknown quantity. Assess the reasonableness of answers
using mental computation and estimation strategies including rounding. (This standard is limited
to problems posed with whole numbers and having whole-number answers; students should know
how to perform operations in the conventional order when there are no parentheses to specify a
particular order (Order of Operations).) [3-OA8]
9. Identify arithmetic patterns (including patterns in the addition table or multiplication table), and
explain them using properties of operations. [3-OA9]
Example: Observe that 4 times a number is always even, and explain why 4 times a number
can be decomposed into two equal addends.
Number and Operations in Base Ten
Use place value understanding and properties of operations to perform multi-digit arithmetic.
(A range of algorithms may be used.)
10. Use place value understanding to round whole numbers to the nearest 10 or 100. [3-NBT1]
11. Fluently add and subtract within 1000 using strategies and algorithms based on place value,
properties of operations, and/or the relationship between addition and subtraction. [3-NBT2]
12. Multiply one-digit whole numbers by multiples of 10 in the range 10 - 90 (e.g., 9 × 80, 5 × 60)
using strategies based on place value and properties of operations. [3-NBT3]
Number and Operations – Fractions (Grade 3 expectations in this domain are limited to fractions with denominators 2, 3, 4, 6, and 8.)
Develop understanding of fractions as numbers.
13. Understand a fraction 1
b
as the quantity formed by 1 part when a whole is partitioned into b equal
parts; understand a fraction a
b as the quantity formed by a parts and size
1
b
. [3-NF1]
14. Understand a fraction as a number on the number line; represent fractions on a number line
diagram. [3-NF2]
a. Represent a fraction 1
b
on a number line diagram by defining the interval from 0 to 1 as
the whole and partitioning it into b equal parts. Recognize that each part has size 1
b
and
that the endpoint of the part based at 0 locates the number 1
b
on the number line.
[3-NF2a]

3rd
2010 Alabama Course of Study: Mathematics 30
b. Represent a fraction a
b
on a number line diagram by marking off a lengths 1
b from 0.
Recognize that the resulting interval has size a
b and that its endpoint locates the number
a
b on the number line. [3-NF2b]
15. Explain equivalence of fractions in special cases, and compare fractions by reasoning about their
size. [3-NF3]
a. Understand two fractions as equivalent (equal) if they are the same size or the same point
on a number line. [3-NF3a]
b. Recognize and generate simple equivalent fractions, e.g., 1
2
= 2
4
, 4
6
= 2
3
. Explain why the
fractions are equivalent, e.g., by using a visual fraction model. [3-NF3b]
c. Express whole numbers as fractions, and recognize fractions that are equivalent to whole
numbers. [3-NF3c]
Examples: Express 3 in the form 3 = 3
1
; recognize that 6
1
= 6; locate 4
4
and 1 at the
same point of a number line diagram.
d. Compare two fractions with the same numerator or the same denominator by reasoning
about their size. Recognize that comparisons are valid only when the two fractions refer to
the same whole. Record the results of comparisons with the symbols >, =, or <, and justify
the conclusions, e.g., by using a visual fraction model. [3-NF3d]
Measurement and Data
Solve problems involving measurement and estimation of intervals of time, liquid volumes, and
masses of objects.
16. Tell and write time to the nearest minute, and measure time intervals in minutes. Solve word
problems involving addition and subtraction of time intervals in minutes, e.g., by representing the
problem on a number line diagram. [3-MD1]
17. Measure and estimate liquid volumes and masses of objects using standard units of grams (g),
kilograms (kg), and liters (l). (Excludes compound units such as cm3 and finding the geometric
volume of a container.) Add, subtract, multiply, or divide to solve one-step word problems
involving masses or volumes that are given in the same units, e.g., by using drawings (such as a
beaker with a measurement scale) to represent the problem. (Excludes multiplicative comparison
problems (problems involving notions of ―times as much‖).) (See Appendix A, Table 2.)
[3-MD2]
Represent and interpret data.
18. Draw a scaled picture graph and a scaled bar graph to represent a data set with several categories.
Solve one- and two-step ―how many more‖ and ―how many less‖ problems using information
presented in scaled bar graphs. [3-MD3]
Example: Draw a bar graph in which each square in the bar graph might represent 5 pets.
19. Generate measurement data by measuring lengths using rulers marked with halves and fourths of
an inch. Show the data by making a line plot where the horizontal scale is marked off in
appropriate units – whole numbers, halves, or quarters. [3-MD4]

3rd
2010 Alabama Course of Study: Mathematics 31
Geometric measurement: understand concepts of area and relate area to multiplication and to
addition.
20. Recognize area as an attribute of plane figures, and understand concepts of area measurement.
[3-MD5]
a. A square with side length 1 unit called ―a unit square,‖ is said to have ―one square unit‖ of
area and can be used to measure area. [3-MD5a]
b. A plane figure which can be covered without gaps or overlaps by n unit squares is said to
have an area of n square units. [3-MD5b]
21. Measure areas by counting unit squares (square cm, square m, square in, square ft, and improvised
units). [3-MD6]
22. Relate area to the operations of multiplication and addition. [3-MD7]
a. Find the area of a rectangle with whole-number side lengths by tiling it, and show that the
area is the same as would be found by multiplying the side lengths. [3-MD7a]
b. Multiply side lengths to find areas of rectangles with whole-number side lengths in the
context of solving real-world and mathematical problems, and represent whole-number
products as rectangular areas in mathematical reasoning. [3-MD7b]
c. Use tiling to show in a concrete case that the area of a rectangle with whole-number side
lengths a and b + c is the sum of a × b and a × c. Use area models to represent the
distributive property in mathematical reasoning. [3-MD7c]
d. Recognize area as additive. Find areas of rectilinear figures by decomposing them into
nonoverlapping rectangles and adding the areas of the nonoverlapping parts, applying this
technique to solve real-world problems. [3-MD7d]
Geometric measurement: recognize perimeter as an attribute of plane figures and distinguish
between linear and area measures.
23. Solve real-world and mathematical problems involving perimeters of polygons, including finding
the perimeter given the side lengths, finding an unknown side length, and exhibiting rectangles
with the same perimeter and different areas or with the same area and different perimeters.
[3-MD8]
Geometry
Reason with shapes and their attributes.
24. Understand that shapes in different categories (e.g., rhombuses, rectangles, and others) may share
attributes (e.g., having four sides), and that the shared attributes can define a larger category (e.g.,
quadrilaterals). Recognize rhombuses, rectangles, and squares as examples of quadrilaterals, and
draw examples of quadrilaterals that do not belong to any of these subcategories. [3-G1]
25. Partition shapes into parts with equal areas. Express the area of each part as a unit fraction of the
whole. [3-G2]
Example: Partition a shape into 4 parts with equal area, and describe the area of each part as 1
4 of the area of the shape.

2010 Alabama Course of Study: Mathematics 32
GRADE 4 OVERVIEW
Grade 4 content is organized into five domains of focused study as outlined below in the column to the
left. The Grade 4 domains listed in bold print on the shaded bars are Operations and Algebraic Thinking,
Number and Operations in Base Ten, Number and Operations – Fractions, Measurement and Data, and
Geometry. Immediately following the domain and enclosed in brackets is an abbreviation denoting the
domain. Identified below each domain are the clusters that serve to group related content standards. All
Grade 4 content standards, grouped by domain and cluster, are located on the pages that follow.
The Standards for Mathematical Practice are listed below in the column to the right. These mathematical
practice standards should be incorporated into classroom instruction of the content standards.
Content Standard Domains and Clusters Standards for Mathematical Practice
Operations and Algebraic Thinking [OA]
• Use the four operations with whole numbers to
solve problems.
• Gain familiarity with factors and multiples.
• Generate and analyze patterns.
Number and Operations in Base Ten [NBT]
• Generalize place value understanding for multi-
digit whole numbers.
• Use place value understanding and properties
of operations to perform multi-digit arithmetic.
Number and Operations – Fractions [NF]
• Extend understanding of fraction equivalence and
ordering.
• Build fractions from unit fractions by applying
and extending previous understandings of
operations on whole numbers.
• Understand decimal notation for fractions, and
compare decimal fractions.
Measurement and Data [MD]
• Solve problems involving measurement and
conversion of measurements from a larger
unit to a smaller one.
• Represent and interpret data.
• Geometric measurement: understand concepts of
angle and measure angles.
Geometry [G]
• Draw and identify lines and angles, and classify
shapes by properties of their lines and angles.
1. Make sense of problems and persevere
in solving them.
2. Reason abstractly and quantitatively.
3. Construct viable arguments and
critique the reasoning of others.
4. Model with mathematics.
5. Use appropriate tools strategically.
6. Attend to precision.
7. Look for and make use of structure.
8. Look for and express regularity in
repeated reasoning.

2010 Alabama Course of Study: Mathematics 33
GRADE 4
In Grade 4, instructional time should focus on three critical areas. These areas are (1) developing
understanding and fluency with multi-digit multiplication and developing understanding of dividing to
find quotients involving multi-digit dividends; (2) developing an understanding of fraction equivalence,
addition and subtraction of fractions with like denominators, and multiplication of fractions by whole
numbers; and (3) understanding that geometric figures can be analyzed and classified based on their
properties such as having parallel sides, perpendicular sides, particular angle measures, and symmetry.
Important information regarding these three critical areas of instruction follows:
(1) Students generalize their understanding of place value to 1,000,000, understanding the relative
sizes of numbers in each place. They apply their understanding of models for multiplication such
as equal-sized groups, arrays, or area models; place value; and properties of operations, in
particular the distributive property; as they develop, discuss, and use efficient, accurate, and
generalizable methods to compute products of multi-digit whole numbers. Depending on the
numbers and the context, they select and accurately apply appropriate methods to estimate or
mentally calculate products. They develop fluency with efficient procedures for multiplying
whole numbers, understand and explain why the procedures work based on place value and
properties of operations, and use them to solve problems. Students apply their understanding of
models for division, place value, properties of operations, and the relationship of division to
multiplication as they develop, discuss, and use efficient, accurate, and generalizable procedures to
find quotients involving multi-digit dividends. They select and accurately apply appropriate
methods to estimate and mentally calculate quotients and interpret remainders based upon the
context.
(2) Students develop understanding of fraction equivalence and operations with fractions. They
recognize that two different fractions can be equal, such as 15
9
= 5
3
, and they develop methods for
generating and recognizing equivalent fractions. Students extend previous understandings
regarding building fractions from unit fractions, composing fractions from unit fractions,
decomposing fractions into unit fractions, and using the meaning of fractions and the meaning of
multiplication to multiply a fraction by a whole number.
(3) Students describe, analyze, compare, and classify two-dimensional shapes. Through building,
drawing, and analyzing two-dimensional shapes, students deepen their understanding of properties
of two-dimensional objects and the use of them to solve problems involving symmetry.

4th
2010 Alabama Course of Study: Mathematics 34
Students will:
Operations and Algebraic Thinking
Use the four operations with whole numbers to solve problems.
1. Interpret a multiplication equation as a comparison, e.g., interpret 35 = 5 × 7 as a statement that 35
is 5 times as many as 7 and 7 times as many as 5. Represent verbal statements of multiplicative
comparisons as multiplication equations. [4-OA1]
2. Multiply or divide to solve word problems involving multiplicative comparison, e.g., by using
drawings and equations with a symbol for the unknown number to represent the problem,
distinguishing multiplicative comparison from additive comparison. (See Appendix A, Table 2.)
[4-OA2]
3. Solve multistep word problems posed with whole numbers and having whole-number answers
using the four operations, including problems in which remainders must be interpreted. Represent
these problems using equations with a letter standing for the unknown quantity. Assess the
reasonableness of answers using mental computation and estimation strategies including rounding.
[4-OA3]
Gain familiarity with factors and multiples.
4. Find all factor pairs for a whole number in the range 1-100. Recognize that a whole number is a
multiple of each of its factors. Determine whether a given whole number in the range 1-100 is a
multiple of a given one-digit number. Determine whether a given whole number in the range 1-
100 is prime or composite. [4-OA4]
Generate and analyze patterns.
5. Generate a number or shape pattern that follows a given rule. Identify apparent features of the
pattern that were not explicit in the rule itself. [4-OA5]
Example: Given the rule ―Add 3‖ and the starting number 1, generate terms in the resulting
sequence, and observe that the terms appear to alternate between odd and even
numbers. Explain informally why the numbers will continue to alternate in this
way.
Number and Operations in Base Ten (Grade 4 expectations in this domain are limited to whole numbers less than or equal to 1,000,000.)
Generalize place value understanding for multi-digit whole numbers.
6. Recognize that in a multi-digit whole number, a digit in one place represents ten times what it
represents in the place to its right. [4-NBT1]
Example: Recognize that 700 ÷ 70 = 10 by applying concepts of place value and division.
7. Read and write multi-digit whole numbers using base-ten numerals, number names, and expanded
form. Compare two multi-digit numbers based on meanings of the digits in each place, using >, =,
and < symbols to record the results of comparisons. [4-NBT2]
8. Use place value understanding to round multi-digit whole numbers to any place. [4-NBT3]

4th
2010 Alabama Course of Study: Mathematics 35
Use place value understanding and properties of operations to perform multi-digit arithmetic.
9. Fluently add and subtract multi-digit whole numbers using the standard algorithm.
[4-NBT4]
10. Multiply a whole number of up to four digits by a one-digit whole number, and multiply two two-
digit numbers, using strategies based on place value and the properties of operations. Illustrate
and explain the calculation by using equations, rectangular arrays, and/or area models. [4-NBT5]
11. Find whole-number quotients and remainders with up to four-digit dividends and one-digit
divisors, using strategies based on place value, the properties of operations, and/or the relationship
between multiplication and division. Illustrate and explain the calculation by using equations,
rectangular arrays, and/or area models. [4-NBT6]
Number and Operations – Fractions (Grade 4 expectations in this domain are limited to fractions with denominations 2, 3, 4, 5, 6, 8, 10, 12, and 100.)
Extend understanding of fraction equivalence and ordering.
12. Explain why a fraction a
b
is equivalent to a fraction ( )
( )
nxa
nxb by using visual fraction models, with
attention to how the number and size of the parts differ even though the two fractions themselves
are the same size. Use this principle to recognize and generate equivalent fractions. [4-NF1]
13. Compare two fractions with different numerators and different denominators, e.g., by creating
common denominators or numerators or by comparing to a benchmark fraction such as 1
2
.
Recognize that comparisons are valid only when the two fractions refer to the same whole.
Record the results of comparisons with symbols >, =, or <, and justify the conclusions, e.g., by
using a visual fraction model. [4-NF2]
Build fractions from unit fractions by applying and extending previous understandings of
operations on whole numbers.
14. Understand a fraction a
b
with a > 1 as a sum of fractions 1
b
. [4-NF3]
a. Understand addition and subtraction of fractions as joining and separating parts referring to
the same whole. [4-NF3a]
b. Decompose a fraction into a sum of fractions with the same denominator in more than one
way, recording each decomposition by an equation. Justify decompositions, e.g., by using
a visual fraction model. [4-NF3b]
Examples: 3
8
= 1
8
+ 1
8
+ 1
8
; 3
8
= 1
8
+ 2
8
; 2 1
8
= 1 + 1 + 1
8
= 8
8
+ 8
8
+ 1
8
.
c. Add and subtract mixed numbers with like denominators, e.g., by replacing each mixed
number with an equivalent fraction, and/or by using properties of operations and the
relationship between addition and subtraction. [4-NF3c]
d. Solve word problems involving addition and subtraction of fractions referring to the same
whole and having like denominators, e.g., by using visual fraction models and equations to
represent the problem. [4-NF3d]

4th
2010 Alabama Course of Study: Mathematics 36
15. Apply and extend previous understandings of multiplication to multiply a fraction by a whole
number. [4-NF4]
a. Understand a fraction a
b
as a multiple of 1
b
. [4-NF4a]
Example: Use a visual fraction model to represent 5
4
as the product 5 × (1
4
),
recording the conclusion by the equation 5
4
= 5 × (1
4
).
b. Understand a multiple of a
b as a multiple of
1
b, and use this understanding to multiply a
fraction by a whole number. [4-NF4b]
Example: Use a visual fraction model to express 3 × (2
5
) as 6 × (1
5
), recognizing this
product as 6
5
. (In general, n × (a
b
) = ( )nxa
b
.)
c. Solve word problems involving multiplication of a fraction by a whole number, e.g., by
using visual fraction models and equations to represent the problem. [4-NF4c]
Example: If each person at a party will eat 3
8
of a pound of roast beef, and there will
be 5 people at the party, how many pounds of roast beef will be needed?
Between which two whole numbers does your answer lie?
Understand decimal notation for fractions, and compare decimal fractions.
16. Express a fraction with denominator 10 as an equivalent fraction with denominator 100, and use
this technique to add two fractions with respective denominators 10 and 100. (Students who can
generate equivalent fractions can develop strategies for adding fractions with unlike denominators
in general. But addition and subtraction with unlike denominators in general is not a requirement
at this grade.) [4-NF5]
Example: Express 3
10
as
30
100
, and add 3
10
+ 4
100
= 34
100
.
17. Use decimal notation for fractions with denominators 10 or 100. [4-NF6]
Example: Rewrite 0.62 as 62
100
; describe a length as 0.62 meters; locate 0.62 on a number line
diagram.
18. Compare two decimals to hundredths by reasoning about their size. Recognize that comparisons
are valid only when the two decimals refer to the same whole. Record the results of comparisons
with the symbols >, =, or <, and justify the conclusions, e.g., by using a visual model. [4-NF7]

4th
2010 Alabama Course of Study: Mathematics 37
Measurement and Data
Solve problems involving measurement and conversion of measurements from a larger unit to a
smaller unit.
19. Know relative sizes of measurement units within one system of units, including km, m, cm; kg, g;
lb, oz; l, ml; and hr, min, sec. Within a single system of measurement, express measurements in a
larger unit in terms of a smaller unit. Record measurement equivalents in a two-column table.
[4-MD1]
Examples: Know that 1 ft is 12 times as long as 1 in. Express the length of a 4 ft snake as 48
in. Generate a conversion table for feet and inches listing the number pairs (1, 12),
(2, 24), (3, 36), ....
20. Use the four operations to solve word problems involving distances, intervals of time, liquid
volumes, masses of objects, and money, including problems involving simple fractions or
decimals, and problems that require expressing measurements given in a larger unit in terms of a
smaller unit. Represent measurement quantities using diagrams such as number line diagrams that
feature a measurement scale. [4-MD2]
21. Apply the area and perimeter formulas for rectangles in real-world and mathematical problems.
[4-MD3]
Example: Find the width of a rectangular room given the area of the flooring and the length
by viewing the area formula as a multiplication equation with an unknown factor.
Represent and interpret data.
22. Make a line plot to display a data set of measurements in fractions of a unit (1
2
,1
4
,1
8
). Solve
problems involving addition and subtraction of fractions by using information presented in line
plots. [4-MD4]
Example: From a line plot find and interpret the difference in length between the longest and
shortest specimens in an insect collection.
Geometric measurement: understand concepts of angle and measure angles.
23. Recognize angles as geometric shapes that are formed wherever two rays share a common
endpoint, and understand concepts of angle measurement. [4-MD5]
a. An angle is measured with reference to a circle with its center at the common endpoint of
the rays by considering the fraction of the circular arc between the points where the two
rays intersect the circle. An angle that turns through 1
360
of a circle is called a ―one-degree
angle‖ and can be used to measure angles. [4-MD5a]
b. An angle that turns through n one-degree angles is said to have an angle measure of n
degrees. [4-MD5b]
24. Measure angles in whole-number degrees using a protractor. Sketch angles of specified measure.
[4-MD6]
25. Recognize angle measure as additive. When an angle is decomposed into nonoverlapping parts,
the angle measure of the whole is the sum of the angle measures of the parts. Solve addition and
subtraction problems to find unknown angles on a diagram in real-world or mathematical
problems, e.g., by using an equation with a symbol for the unknown angle measure. [4-MD7]

4th
2010 Alabama Course of Study: Mathematics 38
Geometry
Draw and identify lines and angles, and classify shapes by properties of their lines and angles.
26. Draw points, lines, line segments, rays, angles (right, acute, obtuse), and perpendicular and parallel
lines. Identify these in two-dimensional figures. [4-G1]
27. Classify two-dimensional figures based on the presence or absence of parallel or perpendicular
lines or the presence or absence of angles of a specified size. Recognize right triangles as a
category, and identify right triangles. [4-G2]
28. Recognize a line of symmetry for a two-dimensional figure as a line across the figure such that the
figure can be folded along the line into matching parts. Identify line-symmetric figures and draw
lines of symmetry. [4-G3]

2010 Alabama Course of Study: Mathematics 39
GRADE 5 OVERVIEW
Grade 5 content is organized into five domains of focused study as outlined below in the column to the
left. The Grade 5 domains listed in bold print on the shaded bars are Operations and Algebraic Thinking,
Number and Operations in Base Ten, Number and Operations – Fractions, Measurement and Data, and
Geometry. Immediately following the domain and enclosed in brackets is an abbreviation denoting the
domain. Identified below each domain are the clusters that serve to group related content standards. All
Grade 5 content standards, grouped by domain and cluster, are located on the pages that follow.
The Standards for Mathematical Practice are listed below in the column to the right. These mathematical
practice standards should be incorporated into classroom instruction of the content standards.
Content Standard Domains and Clusters Standards for Mathematical Practice
Operations and Algebraic Thinking [OA]
• Write and interpret numerical expressions.
• Analyze patterns and relationships.
Number and Operations in Base Ten [NBT]
• Understand the place value system.
• Perform operations with multi-digit whole
numbers and with decimals to hundredths.
Number and Operations – Fractions [NF]
• Use equivalent fractions as a strategy to add
and subtract fractions.
• Apply and extend previous understandings
of multiplication and division to multiply
and divide fractions.
Measurement and Data [MD]
• Convert like measurement units within a given
measurement system.
• Represent and interpret data.
• Geometric measurement: understand concepts
of volume and relate volume to multiplication
and to addition.
Geometry [G]
• Graph points on the coordinate plane to solve
real-world and mathematical problems.
• Classify two-dimensional figures into
categories based on their properties.
1. Make sense of problems and persevere
in solving them.
2. Reason abstractly and quantitatively.
3. Construct viable arguments and
critique the reasoning of others.
4. Model with mathematics.
5. Use appropriate tools strategically.
6. Attend to precision.
7. Look for and make use of structure.
8. Look for and express regularity in
repeated reasoning.
2010 Alabama Course of Study: Mathematics 40
GRADE 5
In Grade 5, instructional time should focus on three critical areas. These areas are (1) developing fluency
with addition and subtraction of fractions and developing understanding of the multiplication of fractions
and of division of fractions in limited cases, such as unit fractions divided by whole numbers and whole
numbers divided by unit fractions; (2) extending division to two-digit divisors, integrating decimal
fractions into the place value system, developing understanding of operations with decimals to
hundredths, and developing fluency with whole number and decimal operations; and (3) developing
understanding of volume. Important information regarding these three critical areas of instruction
follows:
(1) Students apply their understanding of fractions and fraction models to represent the addition and
subtraction of fractions with unlike denominators as equivalent calculations with like
denominators. They develop fluency in calculating sums and differences of fractions and make
reasonable estimates of them. Students also use the meaning of fractions, of multiplication and
division, and the relationship between multiplication and division to understand and explain why
the procedures for multiplying and dividing fractions make sense. However, this is limited to the
case of dividing unit fractions by whole numbers and whole numbers by unit fractions.
(2) Students develop understanding of why division procedures work based on the meaning of base-
ten numerals and properties of operations. They finalize fluency with multi-digit addition,
subtraction, multiplication, and division. Students apply their understandings of models for
decimals, decimal notation, and properties of operations to add and subtract decimals to
hundredths. They develop fluency in these computations and make reasonable estimates of their
results. Students use the relationship between decimals and fractions as well as the relationship
between finite decimals and whole numbers, as for example, a finite decimal multiplied by an
appropriate power of 10 is a whole number, to understand and explain why the procedures for
multiplying and dividing finite decimals make sense. They compute products and quotients of
decimals to hundredths efficiently and accurately.
(3) Students recognize volume as an attribute of three-dimensional space. They understand that
volume can be measured by finding the total number of same-size units of volume required to fill
the space without gaps or overlaps. They understand that a 1-unit by 1-unit by 1-unit cube is the
standard unit for measuring volume. Students select appropriate units, strategies, and tools for
solving problems that involve estimating and measuring volume. They decompose three-
dimensional shapes and find volumes of right rectangular prisms by viewing them as decomposed
into layers of arrays of cubes. They measure necessary attributes of shapes in order to determine
volumes to solve real-world and mathematical problems.

5th
2010 Alabama Course of Study: Mathematics 41
Students will:
Operations and Algebraic Thinking
Write and interpret numerical expressions.
1. Use parentheses, brackets, or braces in numerical expressions, and evaluate expressions with these
symbols. [5-OA1]
2. Write simple expressions that record calculations with numbers, and interpret numerical
expressions without evaluating them. [5-OA2]
Examples: Express the calculation ―add 8 and 7, then multiply by 2‖ as 2 × (8 + 7). Recognize
that 3 × (18,932 + 921) is three times as large as 18,932 + 921, without having to
calculate the indicated sum or product.
Analyze patterns and relationships.
3. Generate two numerical patterns using two given rules. Identify apparent relationships between
corresponding terms. Form ordered pairs consisting of corresponding terms from the two patterns,
and graph the ordered pairs on a coordinate plane. [5-OA3]
Example: Given the rule ―Add 3‖ and the starting number 0, and given the rule ―Add 6‖ and
the starting number 0, generate terms in the resulting sequences, and observe that
the terms in one sequence are twice the corresponding terms in the other sequence.
Explain informally why this is so.
Number and Operations in Base Ten
Understand the place value system.
4. Recognize that in a multi-digit number, a digit in one place represents 10 times as much as it represents in
the place to its right and 1
10 of what it represents in the place to its left. [5-NBT1]
5. Explain patterns in the number of zeros of the product when multiplying a number by powers of
10, and explain patterns in the placement of the decimal point when a decimal is multiplied or
divided by a power of 10. Use whole-number exponents to denote powers of 10. [5-NBT2]
6. Read, write, and compare decimals to thousandths. [5-NBT3]
a. Read and write decimals to thousandths using base-ten numerals, number names, and
expanded form, e.g., 347.392 = 3 × 100 + 4 × 10 + 7 × 1 + 3 × (1
10) + 9 × (
1
100) +
2 × (1
1000). [5-NBT3a]
b. Compare two decimals to thousandths based on meanings of the digits in each place, using
>, =, and < symbols to record the results of comparisons. [5-NBT3b]
7. Use place value understanding to round decimals to any place. [5-NBT4]
5th
2010 Alabama Course of Study: Mathematics 42
Perform operations with multi-digit whole numbers and with decimals to hundredths.
8. Fluently multiply multi-digit whole numbers using the standard algorithm. [5-NBT5]
9. Find whole-number quotients of whole numbers with up to four-digit dividends and two-digit
divisors, using strategies based on place value, the properties of operations, and/or the relationship
between multiplication and division. Illustrate and explain the calculation by using equations,
rectangular arrays, and/or area models. [5-NBT6]
10. Add, subtract, multiply, and divide decimals to hundredths, using concrete models or drawings and
strategies based on place value, properties of operations, and/or the relationship between addition
and subtraction; relate the strategy to a written method, and explain the reasoning used. [5-NBT7]
Number and Operations – Fractions
Use equivalent fractions as a strategy to add and subtract fractions.
11. Add and subtract fractions with unlike denominators (including mixed numbers) by replacing
given fractions with equivalent fractions in such a way as to produce an equivalent sum or
difference of fractions with like denominators. [5-NF1]
Example: 2
3
+ 5
4
= 8
12
+ 15
12
= 23
12
. (In general, a
b
+ c
d
= ( )ad bc
bd
.)
12. Solve word problems involving addition and subtraction of fractions referring to the same whole,
including cases of unlike denominators, e.g., by using visual fraction models or equations to
represent the problem. Use benchmark fractions and number sense of fractions to estimate
mentally, and assess the reasonableness of answers. [5-NF2]
Example: Recognize an incorrect result 2
5
+ 1
2
= 3
7
by observing that 3
7
< 1
2
.
Apply and extend previous understandings of multiplication and division to multiply and divide
fractions.
13. Interpret a fraction as division of the numerator by the denominator (a
b = a ÷ b). Solve word
problems involving division of whole numbers leading to answers in the form of fractions or
mixed numbers, e.g., by using visual fraction models or equations to represent the problem.
[5-NF3]
Examples: Interpret 3
4
as the result of dividing 3 by 4, noting that 3
4
multiplied by 4 equals 3,
and that when 3 wholes are shared equally among 4 people each person has a share
of size 3
4
. If 9 people want to share a 50-pound sack of rice equally by weight,
how many pounds of rice should each person get? Between which two whole
numbers does your answer lie?

5th
2010 Alabama Course of Study: Mathematics 43
14. Apply and extend previous understandings of multiplication to multiply a fraction or whole
number by a fraction. [5-NF4]
a. Interpret the product (a
b) × q as a parts of a partition of q into b equal parts; equivalently,
as the result of a sequence of operations a × q ÷ b. [5-NF4a]
Example: Use a visual fraction model to show (2
3
) × 4 = 8
3
, and create a story
context for this equation. Do the same with (2
3
) × (4
5
) = 8
15
. (In general,
(a
b) × (
c
d
) = ac
bd
.)
b. Find the area of a rectangle with fractional side lengths by tiling it with unit squares of the
appropriate unit fraction side lengths, and show that the area is the same as would be found
by multiplying the side lengths. Multiply fractional side lengths to find areas of rectangles,
and represent fraction products as rectangular areas. [5-NF4b]
15. Interpret multiplication as scaling (resizing), by: [5-NF5]
a. Comparing the size of a product to the size of one factor on the basis of the size of the other
factor, without performing the indicated multiplication. [5-NF5a]
b. Explaining why multiplying a given number by a fraction greater than 1 results in a product
greater than the given number (recognizing multiplication by whole numbers greater than 1
as a familiar case), explaining why multiplying a given number by a fraction less than 1
results in a product smaller than the given number, and relating the principle of fraction
equivalence a
b =
n a
n b to the effect of multiplying
a
b by 1. [5-NF5b]
16. Solve real-world problems involving multiplication of fractions and mixed numbers, e.g., by using
visual fraction models or equations to represent the problem. [5-NF6]
17. Apply and extend previous understandings of division to divide unit fractions by whole numbers
and whole numbers by unit fractions. (Students able to multiply fractions in general can develop
strategies to divide fractions in general by reasoning about the relationship between multiplication
and division. However, division of a fraction by a fraction is not a requirement at this grade.)
[5-NF7]
a. Interpret division of a unit fraction by a nonzero whole number, and compute such
quotients. [5-NF7a]
Example: Create a story context for (1
3
) ÷ 4, and use a visual fraction model to show
the quotient. Use the relationship between multiplication and division to
explain that (1
3
) ÷ 4 = 1
12
because (1
12
) × 4 = 1
3
.
b. Interpret division of a whole number by a unit fraction, and compute such quotients.
[5-NF7b]
Example: Create a story context for 4 ÷ (1
5
), and use a visual fraction model to show
the quotient. Use the relationship between multiplication and division to
explain that 4 ÷ (1
5
) = 20 because 20 × (1
5
) = 4.

5th
2010 Alabama Course of Study: Mathematics 44
c. Solve real-world problems involving division of unit fractions by nonzero whole numbers
and division of whole numbers by unit fractions, e.g., by using visual fraction models and
equations to represent the problem. [5-NF7c]
Examples: How much chocolate will each person get if 3 people share 1
2
lb of
chocolate equally? How many 1
3
-cup servings are in 2 cups of raisins?
Measurement and Data
Convert like measurement units within a given measurement system.
18. Convert among different-sized standard measurement units within a given measurement system
(e.g., convert 5 cm to 0.05 m), and use these conversions in solving multistep, real-world
problems. [5-MD1]
Represent and interpret data.
19. Make a line plot to display a data set of measurements in fractions of a unit (1
2,
1
4,
1
8).
Use operations on fractions for this grade to solve problems involving information presented in
line plots. [5-MD2]
Example: Given different measurements of liquid in identical beakers, find the amount of
liquid each beaker would contain if the total amount in all the beakers were
redistributed equally.
Geometric measurement: understand concepts of volume and relate volume to multiplication and
to addition.
20. Recognize volume as an attribute of solid figures, and understand concepts of volume
measurement. [5-MD3]
a. A cube with side length 1 unit, called a ―unit cube,‖ is said to have ―one cubic unit‖ of
volume, and can be used to measure volume. [5-MD3a]
b. A solid figure which can be packed without gaps or overlaps using n unit cubes is said to
have a volume of n cubic units. [5-MD3b]
21. Measure volumes by counting unit cubes, using cubic cm, cubic in, cubic ft, and improvised units.
[5-MD4]
22. Relate volume to the operations of multiplication and addition, and solve real-world and
mathematical problems involving volume. [5-MD5]
a. Find the volume of a right rectangular prism with whole-number side lengths by packing it
with unit cubes, and show that the volume is the same as would be found by multiplying
the edge lengths, equivalently by multiplying the height by the area of the base. Represent
threefold whole-number products as volumes, e.g., to represent the associative property of
multiplication. [5-MD5a]
b. Apply the formulas V = l × w × h and V = B × h for rectangular prisms to find volumes of
right rectangular prisms with whole-number edge lengths in the context of solving real-
world and mathematical problems. [5-MD5b]

5th
2010 Alabama Course of Study: Mathematics 45
c. Recognize volume as additive. Find volumes of solid figures composed of two
nonoverlapping right rectangular prisms by adding the volumes of the nonoverlapping
parts, applying this technique to solve real-world problems. [5-MD5c]
Geometry
Graph points on the coordinate plane to solve real-world and mathematical problems.
23. Use a pair of perpendicular number lines, called axes, to define a coordinate system with the
intersection of the lines (the origin) arranged to coincide with the 0 on each line and a given point
in the plane located by using an ordered pair of numbers, called its coordinates. Understand that
the first number indicates how far to travel from the origin in the direction of one axis, and the
second number indicates how far to travel in the direction of the second axis, with the convention
that the names of the two axes and the coordinates correspond (e.g., x-axis and x-coordinate, y-axis
and y-coordinate). [5-G1]
24. Represent real-world and mathematical problems by graphing points in the first quadrant of the
coordinate plane, and interpret coordinate values of points in the context of the situation. [5-G2]
Classify two-dimensional figures into categories based on their properties.
25. Understand that attributes belonging to a category of two-dimensional figures also belong to all
subcategories of that category. [5-G3]
Example: All rectangles have four right angles, and squares are rectangles, so all squares
have four right angles.
26. Classify two-dimensional figures in a hierarchy based on properties. [5-G4]

2010 Alabama Course of Study: Mathematics 46
GRADE 6 OVERVIEW
Grade 6 content is organized into five domains of focused study as outlined below in the column to the
left. The Grade 6 domains listed in bold print on the shaded bars are Ratios and Proportional
Relationships, The Number System, Expressions and Equations, Geometry, and Statistics and Probability.
Immediately following the domain and enclosed in brackets is an abbreviation denoting the domain.
Identified below each domain are the clusters that serve to group related content standards. All Grade 6
content standards, grouped by domain and cluster, are located on the pages that follow.
The Standards for Mathematical Practice are listed below in the column to the right. These mathematical
practice standards should be incorporated into classroom instruction of the content standards.
Content Standard Domains and Clusters Standards for Mathematical Practice
Ratios and Proportional Relationships [RP]
• Understand ratio concepts and use ratio
reasoning to solve problems.
The Number System [NS]
• Apply and extend previous understanding of
multiplication and division to divide fractions
by fractions.
• Compute fluently with multi-digit numbers
and find common factors and multiples.
• Apply and extend previous understanding of
numbers to the system of rational numbers.
Expressions and Equations [EE]
• Apply and extend previous understanding of
arithmetic to algebraic expressions.
• Reason about and solve one-variable
equations and inequalities.
• Represent and analyze quantitative
relationships between dependent and
independent variables.
Geometry [G]
• Solve real-world and mathematical problems
involving area, surface area, and volume.
Statistics and Probability [SP]
• Develop understanding of statistical
variability.
• Summarize and describe distributions.
1. Make sense of problems and persevere
in solving them.
2. Reason abstractly and quantitatively.
3. Construct viable arguments and
critique the reasoning of others.
4. Model with mathematics.
5. Use appropriate tools strategically.
6. Attend to precision.
7. Look for and make use of structure.
8. Look for and express regularity in
repeated reasoning.

2010 Alabama Course of Study: Mathematics 47
GRADE 6
In Grade 6, instructional time should focus on four critical areas. These areas are (1) connecting ratio and
rate to whole number multiplication and division and using concepts of ratio and rate to solve problems;
(2) completing understanding of division of fractions and extending the notion of number to the system of
rational numbers, which includes negative numbers; (3) writing, interpreting, and using expressions and
equations; and (4) developing understanding of statistical thinking. Important information regarding
these four critical areas of instruction follows:
(1) Students use reasoning about multiplication and division to solve ratio and rate problems about
quantities. By viewing equivalent ratios and rates as deriving from and extending pairs of rows or
columns in the multiplication table, and by analyzing simple drawings that indicate the relative
size of quantities, students connect their understanding of multiplication and division with ratios
and rates. Thus students expand the scope of problems for which they can use multiplication and
division to solve problems, and they connect ratios and fractions. They solve a wide variety of
problems involving ratios and rates.
(2) Students use the meaning of fractions, the meanings of multiplication and division, and the
relationship between multiplication and division to understand and explain why the procedures for
dividing fractions make sense. They use these operations to solve problems. Students extend their
previous understandings of number and the ordering of numbers to the full system of rational
numbers, which includes negative rational numbers, and in particular, negative integers. They
reason about the order and absolute value of rational numbers and about the location of points in
all four quadrants of the coordinate plane.
(3) Students understand the use of variables in mathematical expressions. They write expressions and
equations that correspond to given situations, evaluate expressions, and use expressions and
formulas to solve problems. Students understand that expressions in different forms can be
equivalent, and they use the properties of operations to rewrite expressions in equivalent forms.
They know that the solutions of an equation are the values of the variables that make the equation
true. Students use properties of operations and the idea of maintaining the equality of both sides of
an equation to solve simple one-step equations. They construct and analyze tables, such as tables
of quantities that are in equivalent ratios, and they use equations such as 3x = y to describe
relationships between quantities.
(4) Building on and reinforcing their understanding of number, students begin to develop their ability
to think statistically. Students recognize that a data distribution may not have a definite center and
that different ways to measure center yield different values. The median measures center in the
sense that it is roughly the middle value. The mean measures center in the sense that it is the value
that each data point would take on if the total of the data values were redistributed equally, and
also in the sense that it is a balance point. They recognize that a measure of variability, the
interquartile range or mean absolute deviation, can also be useful for summarizing data because
two very different sets of data can have the same mean and median yet be distinguished by their
variability. Students learn to describe and summarize numerical data sets, including identifying
clusters, peaks, gaps, and symmetry, with consideration to the context in which the data were
collected.
Students in Grade 6 also build on their elementary school work with area by reasoning about
relationships among shapes to determine area, surface area, and volume. They find areas of right
triangles, other triangles, and special quadrilaterals by decomposing these shapes, rearranging or
removing pieces, and relating the shapes to rectangles. Using these methods, students discuss,

6th
2010 Alabama Course of Study: Mathematics 48
develop, and justify formulas for areas of triangles and parallelograms. Students find areas of
polygons and surface areas of prisms and pyramids by decomposing them into pieces whose area
they can determine. They reason about right rectangular prisms with fractional side lengths to
extend formulas for the volume of a right rectangular prism to fractional side lengths. They
prepare for work on scale drawings and constructions in Grade 7 by drawing polygons in the
coordinate plane.
Students will:
Ratios and Proportional Relationships
Understand ratio concepts and use ratio reasoning to solve problems.
1. Understand the concept of a ratio, and use ratio language to describe a ratio relationship between
two quantities. [6-RP1]
Examples: ―The ratio of wings to beaks in the bird house at the zoo was 2:1 because for every
2 wings there was 1 beak.‖ ―For every vote candidate A received, candidate C
received nearly three votes.‖
2. Understand the concept of a unit rate a
b associated with a ratio a:b with b ≠ 0, and use rate
language in the context of a ratio relationship. [6-RP2]
Examples: ―This recipe has a ratio of 3 cups of flour to 4 cups of sugar, so there is 3
4 cup of
flour for each cup of sugar.‖ ―We paid $75 for 15 hamburgers, which is a rate of
$5 per hamburger.‖ (Expectations for unit rates in this grade are limited to non-
complex fractions.)
3. Use ratio and rate reasoning to solve real-world and mathematical problems, e.g., by reasoning
about tables of equivalent ratios, tape diagrams, double number line diagrams, or equations.
[6-RP3]
a. Make tables of equivalent ratios relating quantities with whole-number measurements, find
missing values in the tables, and plot the pairs of values on the coordinate plane. Use
tables to compare ratios. [6-RP3a]
b. Solve unit rate problems including those involving unit pricing and constant speed.
[6-RP3b]
Example: If it took 7 hours to mow 4 lawns, then at that rate, how many lawns could
be mowed in 35 hours? At what rate were lawns being mowed?
c. Find a percent of a quantity as a rate per 100 (e.g., 30% of a quantity means 30
100 times the
quantity); solve problems involving finding the whole, given a part and the percent.
[6-RP3c]
d. Use ratio reasoning to convert measurement units; manipulate and transform units
appropriately when multiplying or dividing quantities. [6-RP3d]

6th
2010 Alabama Course of Study: Mathematics 49
The Number System
Apply and extend previous understandings of multiplication and division to divide by fractions.
4. Interpret and compute quotients of fractions, and solve word problems involving division of
fractions, e.g., by using visual fraction models and equations to represent the problem.
[6-NS1]
Examples: Create a story context for (2
3
) ÷ (3
4), and use a visual fraction model to show the
quotient; use the relationship between multiplication and division to explain that
(2
3
) ÷ (3
4) =
8
9 because
3
4 of
8
9 is
2
3
. (In general, (a
b
) ÷ (c
d) =
ad
bc.) How much
chocolate will each person get if 3 people share 1
2 lb of chocolate equally? How
many 3
4-cup servings are in
2
3 of a cup of yogurt? How wide is a rectangular strip
of land with length 3
4 mi and area
1
2 square mi?
Compute fluently with multi-digit numbers and find common factors and multiples.
5. Fluently divide multi-digit numbers using the standard algorithm. [6-NS2]
6. Fluently add, subtract, multiply, and divide multi-digit decimals using the standard algorithm for
each operation. [6-NS3]
7. Find the greatest common factor of two whole numbers less than or equal to 100 and the least
common multiple of two whole numbers less than or equal to 12. Use the distributive property to
express a sum of two whole numbers 1-100 with a common factor as a multiple of a sum of two
whole numbers with no common factor. [6-NS4]
Example: Express 36 + 8 as 4(9 + 2).
Apply and extend previous understandings of numbers to the system of rational numbers.
8. Understand that positive and negative numbers are used together to describe quantities having
opposite directions or values (e.g., temperature above/below zero, elevation above/below sea level,
credits/debits, positive/negative electric charge); use positive and negative numbers to represent
quantities in real-world contexts explaining the meaning of 0 in each situation. [6-NS5]
9. Understand a rational number as a point on the number line. Extend number line diagrams and
coordinate axes familiar from previous grades to represent points on the line and in the plane with
negative number coordinates. [6-NS6]
a. Recognize opposite signs of numbers as indicating locations on opposite sides of 0 on the
number line; recognize that the opposite of the opposite of a number is the number itself,
e.g., – (–3) = 3, and that 0 is its own opposite. [6-NS6a]
b. Understand signs of numbers in ordered pairs as indicating locations in quadrants of the
coordinate plane; recognize that when two ordered pairs differ only by signs, the locations
of the points are related by reflections across one or both axes. [6-NS6b]

6th
2010 Alabama Course of Study: Mathematics 50
c. Find and position integers and other rational numbers on a horizontal or vertical number
line diagram; find and position pairs of integers and other rational numbers on a coordinate
plane. [6-NS6c]
10. Understand ordering and absolute value of rational numbers. [6-NS7]
a. Interpret statements of inequality as statements about the relative position of two numbers
on a number line diagram. [6-NS7a]
Example: Interpret –3 > –7 as a statement that –3 is located to the right of –7 on a
number line oriented from left to right.
b. Write, interpret, and explain statements of order for rational numbers in real-world
contexts. [6-NS7b]
Example: Write –3°C > –7°C to express the fact that –3°C is warmer than –7°C.
c. Understand the absolute value of a rational number as its distance from 0 on the number
line; interpret absolute value as magnitude for a positive or negative quantity in a real-
world situation. [6-NS7c]
Example: For an account balance of –30 dollars, write │–30│ = 30 to describe the
size of the debt in dollars.
d. Distinguish comparisons of absolute value from statements about order. [6-NS7d]
Example: Recognize that an account balance less than –30 dollars represents a debt
greater than 30 dollars.
11. Solve real-world and mathematical problems by graphing points in all four quadrants of the
coordinate plane. Include use of coordinates and absolute value to find distances between points
with the same first coordinate or the same second coordinate. [6-NS8]
Expressions and Equations
Apply and extend previous understandings of arithmetic to algebraic expressions.
12. Write and evaluate numerical expressions involving whole-number exponents. [6-EE1]
13. Write, read, and evaluate expressions in which letters stand for numbers. [6-EE2]
a. Write expressions that record operations with numbers and with letters standing for
numbers. [6-EE2a]
Example: Express the calculation, ―Subtract y from 5,‖ as 5 – y.
b. Identify parts of an expression using mathematical terms (sum, term, product, factor,
quotient, coefficient); view one or more parts of an expression as a single entity.
[6-EE2b]
Example: Describe the expression 2(8 + 7) as a product of two factors; view (8 + 7)
as both a single entity and a sum of two terms.
c. Evaluate expressions at specific values of their variables. Include expressions that arise
from formulas used in real-world problems. Perform arithmetic operations, including
those involving whole-number exponents, in the conventional order when there are no
parentheses to specify a particular order (Order of Operations). [6-EE2c]
Example: Use the formulas V = s3 and A = 6s
2 to find the volume and surface area of
a cube with sides of length s = 1
2.

6th
2010 Alabama Course of Study: Mathematics 51
14. Apply the properties of operations to generate equivalent expressions. [6-EE3]
Example: Apply the distributive property to the expression 3(2 + x) to produce the equivalent
expression 6 + 3x; apply the distributive property to the expression 24x + 18y to
produce the equivalent expression 6(4x + 3y); apply properties of operations to
y + y + y to produce the equivalent expression 3y.
15. Identify when two expressions are equivalent (i.e., when the two expressions name the same
number regardless of which value is substituted into them). [6-EE4]
Example: The expressions y + y + y and 3y are equivalent because they name the same
number regardless of which number y represents.
Reason about and solve one-variable equations and inequalities.
16. Understand solving an equation or inequality as a process of answering a question: which values
from a specified set, if any, make the equation or inequality true? Use substitution to determine
whether a given number in a specified set makes an equation or inequality true. [6-EE5]
17. Use variables to represent numbers, and write expressions when solving a real-world or
mathematical problem; understand that a variable can represent an unknown number or, depending
on the purpose at hand, any number in a specified set. [6-EE6]
18. Solve real-world and mathematical problems by writing and solving equations of the form
x + p = q and px = q for cases in which p, q, and x are all nonnegative rational numbers. [6-EE7]
19. Write an inequality of the form x > c or x < c to represent a constraint or condition in a real-world
or mathematical problem. Recognize that inequalities of the form x > c or x < c have infinitely
many solutions; represent solutions of such inequalities on number line diagrams. [6-EE8]
Represent and analyze quantitative relationships between dependent and independent variables.
20. Use variables to represent two quantities in a real-world problem that change in relationship to one
another; write an equation to express one quantity, thought of as the dependent variable, in terms
of the other quantity, thought of as the independent variable. Analyze the relationship between the
dependent and independent variables using graphs and tables, and relate these to the equation.
[6-EE9]
Example: In a problem involving motion at constant speed, list and graph ordered pairs of
distances and times, and write the equation d = 65t to represent the relationship
between distance and time.
Geometry
Solve real-world and mathematical problems involving area, surface area, and volume.
21. Find the area of right triangles, other triangles, special quadrilaterals, and polygons by composing
into rectangles or decomposing into triangles and other shapes; apply these techniques in the
context of solving real-world and mathematical problems. [6-G1]

6th
2010 Alabama Course of Study: Mathematics 52
22. Find the volume of a right rectangular prism with fractional edge lengths by packing it with unit
cubes of the appropriate unit fraction edge lengths, and show that the volume is the same as would
be found by multiplying the edge lengths of the prism. Apply the formulas V = lwh and V = Bh to
find volumes of right rectangular prisms with fractional edge lengths in the context of solving real-
world and mathematical problems. [6-G2]
23. Draw polygons in the coordinate plane given coordinates for the vertices; use coordinates to find
the length of a side joining points with the same first coordinate or the same second coordinate.
Apply these techniques in the context of solving real-world and mathematical problems. [6-G3]
24. Represent three-dimensional figures using nets made up of rectangles and triangles, and use the
nets to find the surface area of these figures. Apply these techniques in the context of solving real-
world and mathematical problems. [6-G4]
Statistics and Probability
Develop understanding of statistical variability.
25. Recognize a statistical question as one that anticipates variability in the data related to the question
and accounts for it in the answers. [6-SP1]
Example: ―How old am I?‖ is not a statistical question, but ―How old are the students in my
school?‖ is a statistical question because one anticipates variability in students’
ages.
26. Understand that a set of data collected to answer a statistical question has a distribution which can
be described by its center, spread, and overall shape. [6-SP2]
27. Recognize that a measure of center for a numerical data set summarizes all of its values with a
single number, while a measure of variation describes how its values vary with a single number.
[6-SP3]
Summarize and describe distributions.
28. Display numerical data in plots on a number line, including dot plots, histograms, and box plots.
[6-SP4]
29. Summarize numerical data sets in relation to their context, such as by: [6-SP5]
a. Reporting the number of observations. [6-SP5a]
b. Describing the nature of the attribute under investigation, including how it was measured
and its units of measurement. [6-SP5b]
c. Giving quantitative measures of center (median and/or mean) and variability (interquartile
range and/or mean absolute deviation) as well as describing any overall pattern and any
striking deviations from the overall pattern with reference to the context in which the data
were gathered. [6-SP5c]
d. Relating the choice of measures of center and variability to the shape of the data
distribution and the context in which the data were gathered. [6-SP5d]

2010 Alabama Course of Study: Mathematics 53
GRADE 7 OVERVIEW
Grade 7 content is organized into five domains of focused study as outlined below in the column to the
left. The Grade 7 domains listed in bold print on the shaded bars are Ratios and Proportional
Relationships, The Number System, Expressions and Equations, Geometry, and Statistics and Probability.
Immediately following the domain and enclosed in brackets is an abbreviation denoting the domain.
Identified below each domain are the clusters that serve to group related content standards. All Grade 7
content standards, grouped by domain and cluster, are located on the pages that follow.
The Standards for Mathematical Practice are listed below in the column to the right. These mathematical
practice standards should be incorporated into classroom instruction of the content standards.
Content Standard Domains and Clusters Standards for Mathematical Practice
Ratios and Proportional Relationships [RP]
• Analyze proportional relationships and use
them to solve real-world and mathematical
problems.
The Number System [NS]
• Apply and extend previous understandings of
operations with fractions to add, subtract,
multiply, and divide rational numbers.
Expressions and Equations [EE]
• Use properties of operations to generate
equivalent expressions.
• Solve real-life and mathematical problems
using numerical and algebraic expressions and
equations.
Geometry [G]
• Draw, construct, and describe geometrical
figures and describe the relationships between
them.
• Solve real-life and mathematical problems
involving angle measure, area, surface area,
and volume.
Statistics and Probability [SP]
• Use random sampling to draw inferences
about a population.
• Draw informal comparative inferences about
two populations.
• Investigate chance processes and develop, use,
and evaluate probability models.
1. Make sense of problems and persevere
in solving them.
2. Reason abstractly and quantitatively.
3. Construct viable arguments and
critique the reasoning of others.
4. Model with mathematics.
5. Use appropriate tools strategically.
6. Attend to precision.
7. Look for and make use of structure.
8. Look for and express regularity in
repeated reasoning.

2010 Alabama Course of Study: Mathematics 54
GRADE 7
In Grade 7, instructional time should focus on four critical areas. These areas are (1) developing
understanding of and applying proportional relationships; (2) developing understanding of operations
with rational numbers and working with expressions and linear equations; (3) solving problems involving
scale drawings and informal geometric constructions and working with two- and three-dimensional
shapes to solve problems involving area, surface area, and volume; and (4) drawing inferences about
populations based on samples. Important information regarding these four critical areas of instruction
follows:
(1) Students extend their understanding of ratios and develop understanding of proportionality to
solve single- and multi-step problems. They use their understanding of ratios and proportionality to
solve a wide variety of percent problems, including those involving discounts, interest, taxes, tips,
and percent increase or decrease. Students solve problems about scale drawings by relating
corresponding lengths between the objects or by using the fact that relationships of lengths within an
object are preserved in similar objects. Students graph proportional relationships and understand the
unit rate informally as a measure of the steepness of the related line, called the slope. They
distinguish proportional relationships from other relationships.
(2) Students develop a unified understanding of number, recognizing fractions, decimals that have a
finite or a repeating decimal representation, and percents as different representations of rational
numbers. They extend addition, subtraction, multiplication, and division to all rational numbers,
maintaining the properties of operations and the relationships between addition and subtraction and
multiplication and division. By applying these properties and by viewing negative numbers in terms
of everyday contexts, such as amounts owed or temperatures below zero, students explain and
interpret the rules for adding, subtracting, multiplying, and dividing with negative numbers.
Students use the arithmetic of rational numbers as they formulate expressions and equations in one
variable and use these equations to solve problems.
(3) Students continue their work with area from Grade 6, solving problems involving the area and
circumference of a circle and surface area of three-dimensional objects. In preparation for work on
congruence and similarity in Grade 8, they reason about relationships among two-dimensional
figures using scale drawings and informal geometric constructions, and they gain familiarity with the
relationships between angles formed by intersecting lines. Students work with three-dimensional
figures, relating them to two-dimensional figures by examining cross-sections. They solve real-
world and mathematical problems involving area, surface area, and volume of two- and three-
dimensional objects composed of triangles, quadrilaterals, polygons, cubes, and right prisms.
(4) Students build on their previous work with single data distributions to compare two data
distributions and address questions about differences between populations. They begin informal
work with random sampling to generate data sets and learn about the importance of representative
samples for drawing inferences.

7th
2010 Alabama Course of Study: Mathematics 55
Students will:
Ratios and Proportional Relationships
Analyze proportional relationships and use them to solve real-world and mathematical problems.
1. Compute unit rates associated with ratios of fractions, including ratios of lengths, areas, and other
quantities measured in like or different units. [7-RP1]
Example: If a person walks 1
2 mile in each
1
4 hour, compute the unit rate as the complex
fraction
1
2
1
4
miles per hour, equivalently 2 miles per hour.
2. Recognize and represent proportional relationships between quantities. [7-RP2]
a. Decide whether two quantities are in a proportional relationship, e.g., by testing for
equivalent ratios in a table or graphing on a coordinate plane and observing whether the
graph is a straight line through the origin. [7-RP2a]
b. Identify the constant of proportionality (unit rate) in tables, graphs, equations, diagrams,
and verbal descriptions of proportional relationships. [7-RP2b]
c. Represent proportional relationships by equations. [7-RP2c]
Example: If total cost t is proportional to the number n of items purchased at a
constant price p, the relationship between the total cost and the number of
items can be expressed as t = pn.
d. Explain what a point (x, y) on the graph of a proportional relationship means in terms of the
situation, with special attention to the points (0, 0) and (1, r) where r is the unit rate.
[7-RP2d]
3. Use proportional relationships to solve multistep ratio and percent problems. [7-RP3]
Examples: Sample problems may involve simple interest, tax, markups and markdowns,
gratuities and commissions, fees, percent increase and decrease, and percent error.
The Number System
Apply and extend previous understandings of operations with fractions to add, subtract, multiply,
and divide rational numbers.
4. Apply and extend previous understandings of addition and subtraction to add and subtract rational
numbers; represent addition and subtraction on a horizontal or vertical number line diagram.
[7-NS1]
a. Describe situations in which opposite quantities combine to make 0. [7-NS1a]
Example: A hydrogen atom has 0 charge because its two constituents are oppositely
charged.

7th
2010 Alabama Course of Study: Mathematics 56
b. Understand p + q as the number located a distance |q| from p, in the positive or negative
direction depending on whether q is positive or negative. Show that a number and its
opposite have a sum of 0 (are additive inverses). Interpret sums of rational numbers by
describing real-world contexts. [7-NS1b]
c. Understand subtraction of rational numbers as adding the additive inverse, p – q = p + (–q).
Show that the distance between two rational numbers on the number line is the absolute
value of their difference, and apply this principle in real-world contexts. [7-NS1c]
d. Apply properties of operations as strategies to add and subtract rational numbers. [7-NS1d]
5. Apply and extend previous understandings of multiplication and division and of fractions to
multiply and divide rational numbers. [7-NS2]
a. Understand that multiplication is extended from fractions to rational numbers by requiring
that operations continue to satisfy the properties of operations, particularly the distributive
property, leading to products such as (–1)(–1) = 1 and the rules for multiplying signed
numbers. Interpret products of rational numbers by describing real-world contexts.
[7-NS2a]
b. Understand that integers can be divided, provided that the divisor is not zero, and every
quotient of integers (with nonzero divisor) is a rational number. If p and q are integers,
then – (p
q
) = ( )p
q
= ( )
p
q
. Interpret quotients of rational numbers by describing real-world
contexts. [7-NS2b]
c. Apply properties of operations as strategies to multiply and divide rational numbers.
[7-NS2c]
d. Convert a rational number to a decimal using long division; know that the decimal form of
a rational number terminates in 0s or eventually repeats. [7-NS2d]
6. Solve real-world and mathematical problems involving the four operations with rational numbers.
(Computations with rational numbers extend the rules for manipulating fractions to complex
fractions.) [7-NS3]
Expressions and Equations
Use properties of operations to generate equivalent expressions.
7. Apply properties of operations as strategies to add, subtract, factor, and expand linear expressions
with rational coefficients. [7-EE1]
8. Understand that rewriting an expression in different forms in a problem context can shed light on
the problem, and how the quantities in it are related. [7-EE2]
Example: a + 0.05a = 1.05a means that ―increase by 5%‖ is the same as ―multiply by 1.05.‖

7th
2010 Alabama Course of Study: Mathematics 57
Solve real-life and mathematical problems using numerical and algebraic expressions and
equations.
9. Solve multistep real-life and mathematical problems posed with positive and negative rational
numbers in any form (whole numbers, fractions, and decimals), using tools strategically. Apply
properties of operations to calculate with numbers in any form, convert between forms as
appropriate, and assess the reasonableness of answers using mental computation and estimation
strategies. [7-EE3]
Examples: If a woman making $25 an hour gets a 10% raise, she will make an additional 1
10
of her salary an hour, or $2.50, for a new salary of $27.50. If you want to place a
towel bar 93
4 inches long in the center of a door that is 27
1
2 inches wide, you will
need to place the bar about 9 inches from each edge; this estimate can be used as a
check on the exact computation.
10. Use variables to represent quantities in a real-world or mathematical problem, and construct
simple equations and inequalities to solve problems by reasoning about the quantities. [7-EE4]
a. Solve word problems leading to equations of the form px + q = r and p(x + q) = r, where p,
q, and r are specific rational numbers. Solve equations of these forms fluently. Compare
an algebraic solution to an arithmetic solution, identifying the sequence of the operations
used in each approach. [7-EE4a]
Example: The perimeter of a rectangle is 54 cm. Its length is 6 cm. What is its
width?
b. Solve word problems leading to inequalities of the form px + q > r or px + q < r, where p,
q, and r are specific rational numbers. Graph the solution set of the inequality, and
interpret it in the context of the problem. [7-EE4b]
Example: As a salesperson, you are paid $50 per week plus $3 per sale. This week
you want your pay to be at least $100. Write an inequality for the number
of sales you need to make, and describe the solutions.
Geometry
Draw, construct, and describe geometrical figures and describe the relationships between them.
11. Solve problems involving scale drawings of geometric figures, including computing actual lengths
and areas from a scale drawing and reproducing a scale drawing at a different scale. [7-G1]
12. Draw (freehand, with ruler and protractor, and with technology) geometric shapes with given
conditions. Focus on constructing triangles from three measures of angles or sides, noticing when
the conditions determine a unique triangle, more than one triangle, or no triangle. [7-G2]
13. Describe the two-dimensional figures that result from slicing three-dimensional figures, as in plane
sections of right rectangular prisms and right rectangular pyramids. [7-G3]

7th
2010 Alabama Course of Study: Mathematics 58
Solve real-world and mathematical problems involving angle measure, area, surface area, and
volume.
14. Know the formulas for the area and circumference of a circle, and use them to solve problems;
give an informal derivation of the relationship between the circumference and area of a circle.
[7-G4]
15. Use facts about supplementary, complementary, vertical, and adjacent angles in a multistep problem
to write and solve simple equations for an unknown angle in a figure. [7-G5]
16. Solve real-world and mathematical problems involving area, volume, and surface area of two- and
three-dimensional objects composed of triangles, quadrilaterals, polygons, cubes, and right prisms.
[7-G6]
Statistics and Probability
Use random sampling to draw inferences about a population.
17. Understand that statistics can be used to gain information about a population by examining a
sample of the population; generalizations about a population from a sample are valid only if the
sample is representative of that population. Understand that random sampling tends to produce
representative samples and support valid inferences. [7-SP1]
18. Use data from a random sample to draw inferences about a population with an unknown
characteristic of interest. Generate multiple samples (or simulated samples) of the same size to
gauge the variation in estimates or predictions. [7-SP2]
Example: Estimate the mean word length in a book by randomly sampling words from the
book; predict the winner of a school election based on randomly sampled survey
data. Gauge how far off the estimate or prediction might be.
Draw informal comparative inferences about two populations.
19. Informally assess the degree of visual overlap of two numerical data distributions with similar
variabilities, measuring the difference between the centers by expressing it as a multiple of a
measure of variability. [7-SP3]
Example: The mean height of players on the basketball team is 10 cm greater than the mean
height of players on the soccer team, about twice the variability (mean absolute
deviation) on either team; on a dot plot, the separation between the two
distributions of heights is noticeable.
20. Use measures of center and measures of variability for numerical data from random samples to
draw informal comparative inferences about two populations. [7-SP4]
Example: Decide whether the words in a chapter of a seventh-grade science book are
generally longer than the words in a chapter of a fourth-grade science book.

7th
2010 Alabama Course of Study: Mathematics 59
Investigate chance processes and develop, use, and evaluate probability models.
21. Understand that the probability of a chance event is a number between 0 and 1 that expresses the
likelihood of the event occurring. Larger numbers indicate greater likelihood. A probability near
0 indicates an unlikely event, a probability around 1
2 indicates an event that is neither unlikely nor
likely, and a probability near 1 indicates a likely event. [7-SP5]
22. Approximate the probability of a chance event by collecting data on the chance process that
produces it and observing its long-run relative frequency, and predict the approximate relative
frequency given the probability. [7-SP6]
Example: When rolling a number cube 600 times, predict that a 3 or 6 would be rolled
roughly 200 times, but probably not exactly 200 times.
23. Develop a probability model and use it to find probabilities of events. Compare probabilities from
a model to observed frequencies; if the agreement is not good, explain possible sources of the
discrepancy. [7-SP7]
a. Develop a uniform probability model by assigning equal probability to all outcomes, and
use the model to determine probabilities of events. [7-SP7a]
Example: If a student is selected at random from a class, find the probability that Jane
will be selected and the probability that a girl will be selected.
b. Develop a probability model (which may not be uniform) by observing frequencies in data
generated from a chance process. [7-SP7b]
Example: Find the approximate probability that a spinning penny will land heads up
or that a tossed paper cup will land open-end down. Do the outcomes for
the spinning penny appear to be equally likely based on the observed
frequencies?
24. Find probabilities of compound events using organized lists, tables, tree diagrams, and simulation.
[7-SP8]
a. Understand that, just as with simple events, the probability of a compound event is the
fraction of outcomes in the sample space for which the compound event occurs. [7-SP8a]
b. Represent sample spaces for compound events using methods such as organized lists,
tables, and tree diagrams. For an event described in everyday language (e.g., ―rolling
double sixes‖), identify the outcomes in the sample space which compose the event.
[7-SP8b]
c. Design and use a simulation to generate frequencies for compound events. [7-SP8c]
Example: Use random digits as a simulation tool to approximate the answer to the
question: If 40% of donors have type A blood, what is the probability that
it will take at least 4 donors to find one with type A blood?

2010 Alabama Course of Study: Mathematics 60
GRADE 8 OVERVIEW
Grade 8 content is organized into five domains of focused study as outlined below in the column to the
left. The Grade 8 domains listed in bold print on the shaded bars are The Number System, Expressions
and Equations, Functions, Geometry, and Statistics and Probability. Immediately following the domain
and enclosed in brackets is an abbreviation denoting the domain. Identified below each domain are the
clusters that serve to group related content standards. All Grade 8 content standards, grouped by domain
and cluster, are located on the pages that follow.
The Standards for Mathematical Practice are listed below in the column to the right. These mathematical
practice standards should be incorporated into classroom instruction of the content standards.
Content Standard Domains and Clusters Standards for Mathematical Practice
The Number System [NS]
• Know that there are numbers that are not
rational, and approximate them by rational
numbers.
Expressions and Equations [EE]
• Work with radicals and integer exponents.
• Understand the connections among
proportional relationships, lines, and linear
equations.
• Analyze and solve linear equations and pairs
of simultaneous linear equations.
Functions [F]
• Define, evaluate, and compare functions.
• Use functions to model relationships between
quantities.
Geometry [G]
• Understand congruence and similarity using
physical models, transparencies, or geometry
software.
• Understand and apply the Pythagorean
Theorem.
• Solve real-world and mathematical problems
involving volume of cylinders, cones, and
spheres.
Statistics and Probability [SP]
• Investigate patterns of association in bivariate
data.
1. Make sense of problems and persevere
in solving them.
2. Reason abstractly and quantitatively.
3. Construct viable arguments and
critique the reasoning of others.
4. Model with mathematics.
5. Use appropriate tools strategically.
6. Attend to precision.
7. Look for and make use of structure.
8. Look for and express regularity in
repeated reasoning.

2010 Alabama Course of Study: Mathematics 61
GRADE 8
In Grade 8, instructional time should focus on three critical areas. These areas are (1) formulating and
reasoning about expressions and equations, including modeling an association in bivariate data with a
linear equation and solving linear equations and systems of linear equations; (2) grasping the concept of a
function and using functions to describe quantitative relationships; and (3) analyzing two- and three-
dimensional space and figures using distance, angle, similarity, and congruence and understanding and
applying the Pythagorean Theorem. Important information regarding these three critical areas of
instruction follows:
(1) Students use linear equations and systems of linear equations to represent, analyze, and solve a
variety of problems. Students recognize equations for proportions such as y
x = m or y = mx as
special linear equations such as y = mx + b, understanding that the constant of proportionality, m,
is the slope, and the graphs are lines through the origin. They understand that the slope, m, of a
line is a constant rate of change, so that if the input or x-coordinate changes by an amount A, the
output or y-coordinate changes by the amount m·A. Students also use a linear equation to describe
the association between two quantities in bivariate data such as arm span versus height for students
in a classroom. At this grade, fitting the model and assessing its fit to the data are done informally.
Interpreting the model in the context of the data requires students to express a relationship between
the two quantities in question and to interpret components of the relationship, such as slope and
y-intercept, in terms of the situation.
Students strategically choose and efficiently implement procedures to solve linear equations in one
variable, understanding that when they use the properties of equality and the concept of logical
equivalence, they maintain the solutions of the original equation. They solve systems of two linear
equations in two variables and relate the systems to pairs of lines in the plane; these intersect, are
parallel, or are the same line. Students use linear equations, systems of linear equations, linear
functions, and their understanding of slope of a line to analyze situations and solve problems.
(2) Students grasp the concept of a function as a rule that assigns to each input exactly one output.
They understand that functions describe situations where one quantity determines another.
Students can translate among representations and partial representations of functions, while noting
that tabular and graphical representations may be partial representations, and they can describe
how aspects of the function are reflected in the different representations.
(3) Students use ideas about distance and angles, including how they behave under translations,
rotations, reflections, and dilations and ideas about congruence and similarity to describe and
analyze two-dimensional figures and to solve problems. They show that the sum of the angles in a
triangle is the angle formed by a straight line, and that various configurations of lines give rise to
similar triangles because of the angles created when a transversal cuts parallel lines. Students
understand the statement of the Pythagorean Theorem and its converse, and can explain why the
Pythagorean Theorem holds, for example, by decomposing a square in two different ways. They
apply the Pythagorean Theorem to find distances between points on the coordinate plane, to find
lengths, and to analyze polygons. Students complete their work on volume by solving problems
involving cones, cylinders, and spheres.

8th
2010 Alabama Course of Study: Mathematics 62
Students will:
The Number System
Know that there are numbers that are not rational, and approximate them by rational numbers.
1. Know that numbers that are not rational are called irrational. Understand informally that every
number has a decimal expansion; for rational numbers show that the decimal expansion repeats
eventually, and convert a decimal expansion which repeats eventually into a rational number.
[8-NS1]
2. Use rational approximations of irrational numbers to compare the size of irrational numbers, locate
them approximately on a number line diagram, and estimate the value of expressions (e.g., 2).
[8-NS2]
Example: By truncating the decimal expansion of 2 , show that 2 is between 1 and 2,
then between 1.4 and 1.5, and explain how to continue on to get better
approximations.
Expressions and Equations
Work with radicals and integer exponents.
3. Know and apply the properties of integer exponents to generate equivalent numerical expressions.
[8-EE1]
Example: 32 × 3
-5 = 3
-3 =
3
1
3 =
1
27.
4. Use square root and cube root symbols to represent solutions to equations of the form x2 = p and
x3 = p, where p is a positive rational number. Evaluate square roots of small perfect squares and
cube roots of small perfect cubes. Know that 2 is irrational. [8-EE2]
5. Use numbers expressed in the form of a single digit times an integer power of 10 to estimate very
large or very small quantities, and to express how many times as much one is than the other.
[8-EE3]
Example: Estimate the population of the United States as 3 × 10⁸ and the population of the
world as 7 × 10⁹, and determine that the world population is more than 20 times
larger.
6. Perform operations with numbers expressed in scientific notation, including problems where both
decimal and scientific notation are used. Use scientific notation and choose units of appropriate
size for measurements of very large or very small quantities (e.g., use millimeters per year for
seafloor spreading). Interpret scientific notation that has been generated by technology. [8-EE4]

8th
2010 Alabama Course of Study: Mathematics 63
Understand the connections among proportional relationships, lines, and linear equations.
7. Graph proportional relationships, interpreting the unit rate as the slope of the graph. Compare two
different proportional relationships represented in different ways. [8-EE5]
Example: Compare a distance-time graph to a distance-time equation to determine which of
two moving objects has greater speed.
8. Use similar triangles to explain why the slope m is the same between any two distinct points on a
non-vertical line in the coordinate plane; derive the equation y = mx for a line through the origin
and the equation y = mx + b for a line intercepting the vertical axis at b. [8-EE6]
Analyze and solve linear equations and pairs of simultaneous linear equations.
9. Solve linear equations in one variable. [8-EE7]
a. Give examples of linear equations in one variable with one solution, infinitely many
solutions, or no solutions. Show which of these possibilities is the case by successively
transforming the given equation into simpler forms until an equivalent equation of the form
x = a, a = a, or a = b results (where a and b are different numbers). [8-EE7a]
b. Solve linear equations with rational number coefficients, including equations whose
solutions require expanding expressions, using the distributive property and collecting like
terms. [8-EE7b]
10. Analyze and solve pairs of simultaneous linear equations. [8-EE8]
a. Understand that solutions to a system of two linear equations in two variables correspond to
points of intersections of their graphs because points of intersection satisfy both equations
simultaneously. [8-EE8a]
b. Solve systems of two linear equations in two variables algebraically, and estimate solutions
by graphing the equations. Solve simple cases by inspection. [8-EE8b]
Example: 3x + 2y = 5 and 3x + 2y = 6 have no solution because 3x + 2y cannot
simultaneously be 5 and 6.
c. Solve real-world and mathematical problems leading to two linear equations in two
variables. [8-EE8c]
Example: Given coordinates for two pairs of points, determine whether the line
through the first pair of points intersects the line through the second pair.
Functions
Define, evaluate, and compare functions.
11. Understand that a function is a rule that assigns to each input exactly one output. The graph of a
function is the set of ordered pairs consisting of an input and the corresponding output. (Function
notation is not required in Grade 8.) [8-F1]
12. Compare properties of two functions, each represented in a different way (algebraically,
graphically, numerically in tables, or by verbal descriptions). [8-F2]
Example: Given a linear function represented by a table of values and linear function
represented by an algebraic expression, determine which function has the greater
rate of change.

8th
2010 Alabama Course of Study: Mathematics 64
13. Interpret the equation y = mx + b as defining a linear function whose graph is a straight line; give
examples of functions that are not linear. [8-F3]
Example: The function A = s2 giving the area of a square as a function of its side length is not
linear because its graph contains the points (1,1), (2,4), and (3,9), which are not on
a straight line.
Use functions to model relationships between quantities.
14. Construct a function to model a linear relationship between two quantities. Determine the rate of
change and initial value of the function from a description of a relationship or from two (x,y)
values, including reading these from a table or from a graph. Interpret the rate of change and
initial value of linear function in terms of the situation it models and in terms of its graph or a table
of values. [8-F4]
15. Describe qualitatively the functional relationship between two quantities by analyzing a graph
(e.g., where the function is increasing or decreasing, linear or nonlinear). Sketch a graph that
exhibits the qualitative features of a function that has been described verbally. [8-F5]
Geometry
Understand congruence and similarity using physical models, transparencies, or geometry
software.
16. Verify experimentally the properties of rotations, reflections, and translations: [8-G1]
a. Lines are taken to lines, and line segments are taken to line segments of the same length.
[8-G1a]
b. Angles are taken to angles of the same measure. [8-G1b]
c. Parallel lines are taken to parallel lines. [8-G1c]
17. Understand that a two-dimensional figure is congruent to another if the second can be obtained
from the first by a sequence of rotations, reflections, and translations; given two congruent figures,
describe a sequence that exhibits the congruence between them. [8-G2]
18. Describe the effect of dilations, translations, rotations, and reflections on two-dimensional figures
using coordinates. [8-G3]
19. Understand that a two-dimensional figure is similar to another if the second can be obtained from
the first by a sequence of rotations, reflections, translations, and dilations; given two similar two-
dimensional figures, describe a sequence that exhibits the similarity between them. [8-G4]
20. Use informal arguments to establish facts about the angle sum and exterior angle of triangles,
about the angles created when parallel lines are cut by a transversal, and the angle-angle criterion
for similarity of triangles. [8-G5]
Example: Arrange three copies of the same triangle so that the sum of the three angles
appears to form a line, and give argument in terms of transversals why this is so.

8th
2010 Alabama Course of Study: Mathematics 65
Understand and apply the Pythagorean Theorem.
21. Explain a proof of the Pythagorean Theorem and its converse. [8-G6]
22. Apply the Pythagorean Theorem to determine unknown side lengths in right triangles in real-world
and mathematical problems in two and three dimensions. [8-G7]
23. Apply the Pythagorean Theorem to find the distance between two points in a coordinate system.
[8-G8]
Solve real-world and mathematical problems involving volume of cylinders, cones, and spheres.
24. Know the formulas for the volumes of cones, cylinders, and spheres, and use them to solve real-
world and mathematical problems. [8-G9]
Statistics and Probability
Investigate patterns of association in bivariate data.
25. Construct and interpret scatter plots for bivariate measurement data to investigate patterns of
association between two quantities. Describe patterns such as clustering, outliers, positive or
negative association, linear association, and nonlinear association. [8-SP1]
26. Know that straight lines are widely used to model relationships between two quantitative variables.
For scatter plots that suggest a linear association, informally fit a straight line, and informally
assess the model fit by judging the closeness of the data points to the line. [8-SP2]
27. Use the equation of a linear model to solve problems in the context of bivariate measurement data,
interpreting the slope and intercept. [8-SP3]
Example: In a linear model for a biology experiment, interpret a slope of 1.5 cm/hr as
meaning that an additional hour of sunlight each day is associated with an
additional 1.5 cm in mature plant height.
28. Understand that patterns of association can also be seen in bivariate categorical data by displaying
frequencies and relative frequencies in a two-way table. Construct and interpret a two-way table
summarizing data on two categorical variables collected from the same subjects. Use relative
frequencies calculated for rows or columns to describe possible association between the two
variables. [8-SP4]
Example: Collect data from students in your class on whether or not they have a curfew on
school nights, and whether or not they have assigned chores at home. Is there
evidence that those who have a curfew also tend to have chores?
2010 Alabama Course of Study: Mathematics 66
STANDARDS FOR HIGH SCHOOL MATHEMATICS
Categories of Standards for High School Mathematics
The high school mathematics standards are grouped according to six conceptual categories. These
categories provide a coherent view of high school mathematics content. A student’s work with functions,
for example, crosses a number of traditional course boundaries, potentially up to and including
Precalculus. The conceptual categories, as listed below, are described in detail on the following pages.
• Number and Quantity
• Algebra
• Functions
• Modeling
• Geometry
• Statistics and Probability
Additional Standards for High School Mathematics
High school content standards specify the mathematics that all students should learn and be able to do in
order to be college and career ready. Additional mathematics content that students should learn in order
to take advanced courses such as calculus, advanced statistics, or discrete mathematics is indicated by a
plus symbol (+), as in this example:
Example: (+) Represent complex numbers on the complex plane in rectangular and
polar form, including real and imaginary numbers.
All standards without a plus symbol (+) are included in the mathematics curriculum for all college- and
career-ready students. Some standards with a plus symbol (+) also appear in courses intended for all
students.
Modeling Standards for High School Mathematics
The Standards for Mathematical Practice include a standard that requires the modeling of mathematics.
Detailed information regarding modeling is located on pages 74-75 of this document. Modeling is best
interpreted, not as a collection of isolated topics, but rather having relevance to other standards. Specific
modeling standards appear throughout the high school mathematics standards, and they are indicated by
an asterisk (*). The asterisk (*) may appear after a particular standard as shown in the example below, or
it may appear on the heading for a group of standards; in that case, it should be understood to apply to all
standards in that group.
Example: Choose and produce an equivalent form of an expression to reveal and explain
properties of the quantity represented by the expression.*

2010 Alabama Course of Study: Mathematics 67
CONCEPTUAL CATEGORY: NUMBER AND QUANTITY
Numbers and Number Systems
During the years from kindergarten to eighth grade, students must repeatedly extend their conception of
number. At first, ―number‖ means ―counting number,‖ as in 1, 2, 3…. Soon after that, 0 is used to
represent ―none,‖ and the whole numbers are formed by the counting numbers together with zero. The
next extension is fractions. At first, fractions are barely numbers and tied strongly to pictorial
representations. Yet by the time students understand division of fractions, they have a strong concept of
fractions as numbers and have connected them by means of their decimal representations with the base-
ten system used to represent the whole numbers. During middle school, fractions are augmented by
negative fractions to form the rational numbers. In Grade 8, students extend this system once more,
augmenting the rational numbers with the irrational numbers to form the real numbers. In high school,
students will be exposed to yet another extension of number, when the real numbers are augmented by the
imaginary numbers to form the complex numbers.
With each extension of number, the meanings of addition, subtraction, multiplication, and division are
extended. In each new number system—integers, rational numbers, real numbers, and complex
numbers—the four operations stay the same in two important ways. They have the commutative,
associative, and distributive properties; and their new meanings are consistent with their previous
meanings.
Extending the properties of whole-number exponents leads to new and productive notation. For example,
properties of whole-number exponents suggest that (51/3
)3 should be 5
(1/3)3 = 5
1 = 5 and that 5
1/3 should be
the cube root of 5.
Calculators, spreadsheets, and computer algebra systems (CAS) provide ways for students to become
better acquainted with these new number systems and their notation. They can be used to generate data
for numerical experiments; to help understand the workings of matrix, vector, and complex number
algebra; and to experiment with non-integer exponents.
Quantities
In real-world mathematics problems, the answers are usually not numbers, but quantities or numbers with
units involving measurement. In their work in measurement up through Grade 8, students primarily
measure commonly used attributes such as length, area, and volume. In high school, students encounter a
wider variety of units in modeling, including acceleration, currency conversions, and derived quantities
such as person-hours and heating degree days, social science rates such as per-capita income, and rates in
everyday life such as points scored per game or batting averages. They also encounter novel situations in
which they recognize a need or ascertain a problem, and then must both pose and find a solution for the
situation or problem encountered. For example, to find a good measure of overall highway safety,
students might propose measures to collect data regarding fatalities per year, fatalities per year per driver,
or fatalities per vehicle-mile traveled. Such a conceptual process is sometimes called quantification.
Quantification is important for science, as when surface area suddenly ―stands out‖ as an important
variable in evaporation. Quantification is also important for private companies and governmental
agencies, which must conceptualize relevant needs and create or choose suitable measures for them.

2010 Alabama Course of Study: Mathematics 68
NUMBER AND QUANTITY OVERVIEW
The Number and Quantity conceptual category focuses on the four domains listed below in the column to
the left. The Number and Quantity domains listed in bold print on the shaded bars are The Real Number
System, Quantities, The Complex Number System, and Vector and Matrix Quantities. Immediately
following the domain and enclosed in brackets is an abbreviation denoting the domain. Identified below
each domain are the clusters that serve to group related content standards.
The Standards for Mathematical Practice are listed below in the column to the right. These mathematical
practice standards should be incorporated into classroom instruction of the content standards.
Content Standard Domains and Clusters Standards for Mathematical Practice
The Real Number System [N-RN]
• Extend the properties of exponents to rational
exponents.
• Use properties of rational and irrational
numbers.
Quantities [N-Q]
• Reason quantitatively and use units to solve
problems.
The Complex Number System [N-CN]
• Perform arithmetic operations with complex
numbers.
• Represent complex numbers and their
operations on the complex plane.
• Use complex numbers in polynomial identities
and equations.
Vector and Matrix Quantities [N-VM]
• Represent and model with vector quantities.
• Perform operations on vectors.
• Perform operations on matrices and use
matrices in applications.
1. Make sense of problems and persevere
in solving them.
2. Reason abstractly and quantitatively.
3. Construct viable arguments and
critique the reasoning of others.
4. Model with mathematics.
5. Use appropriate tools strategically.
6. Attend to precision.
7. Look for and make use of structure.
8. Look for and express regularity in
repeated reasoning.

2010 Alabama Course of Study: Mathematics 69
CONCEPTUAL CATEGORY: ALGEBRA
Expressions
An expression is a record of a computation with numbers, symbols that represent numbers, arithmetic
operations, exponentiation, and at more advanced levels, the operation of evaluating a function.
Conventions about the use of parentheses and the order of operations assure that each expression is
unambiguous. Creating an expression that describes a computation involving a general quantity requires
the ability to express the computation in general terms, abstracting from specific instances.
Reading an expression with comprehension involves analysis of its underlying structure. This may
suggest a different but equivalent way of writing the expression that exhibits some different aspect of its
meaning. For example, p + 0.05p can be interpreted as the addition of a 5% tax to a price p. Rewriting
p + 0.05p as 1.05p shows that adding a tax is the same as multiplying the price by a constant factor.
Algebraic manipulations are governed by the properties of operations and exponents and the conventions
of algebraic notation. At times, an expression is the result of applying operations to simpler expressions.
For example, p + 0.05p is the sum of the simpler expressions p and 0.05p. Viewing an expression as the
result of operation on simpler expressions can sometimes clarify its underlying structure.
A spreadsheet or a computer algebra system (CAS) can be used to experiment with algebraic expressions.
These resources are valuable aids to help in performing complicated, algebraic manipulations and
understanding how algebraic manipulations behave.
Equations and Inequalities
An equation is a statement of equality between two expressions, often viewed as a question asking for
which values of the variables the expressions on either side are in fact equal. These values are the
solutions to the equation. An identity, in contrast, is true for all values of the variables; identities are
often developed by rewriting an expression in an equivalent form.
The solutions of an equation in one variable form a set of numbers; the solutions of an equation in two
variables form a set of ordered pairs of numbers, which can be plotted in the coordinate plane. Two or
more equations and/or inequalities form a system. A solution for such a system must satisfy every
equation and inequality in the system.
An equation can often be solved by successively deducing from it one or more simpler equations. For
example, one can add the same constant to both sides without changing the solutions, but squaring both
sides might lead to extraneous solutions. Strategic competence in solving includes looking ahead for
productive manipulations and anticipating the nature and number of solutions.
Some equations have no solutions in a given number system, but have a solution in a larger system. For
example, the solution of x + 1 = 0 is an integer, not a whole number; the solution of 2x + 1 = 0 is a
rational number, not an integer; the solutions of x2 – 2 = 0 are real numbers, not rational numbers; and the
solutions of x2 + 2 = 0 are complex numbers, not real numbers.

2010 Alabama Course of Study: Mathematics 70
The same solution techniques used to solve equations can be used to rearrange formulas. For example,
the formula for the area of a trapezoid, A = ((b1+b2)/2)h, can be solved for h using the same deductive
process.
Inequalities can be solved by reasoning about the properties of inequality. Many, but not all, of the
properties of equality continue to hold for inequalities and can be useful in solving them.
Connections to Functions and Modeling
Expressions can define functions, and equivalent expressions define the same function. Asking when two
functions have the same value for the same input leads to an equation; graphing the two functions allows
for finding approximate solutions of the equation. Converting a verbal description to an equation,
inequality, or system of these is an essential skill in modeling.

2010 Alabama Course of Study: Mathematics 71
ALGEBRA OVERVIEW
The Algebra conceptual category focuses on the four domains listed below in the column to the left. The
Algebra domains listed in bold print on the shaded bars are Seeing Structure in Expressions, Arithmetic
With Polynomials and Rational Expressions, Creating Equations, and Reasoning With Equations and
Inequalities. Immediately following the domain and enclosed in brackets is an abbreviation denoting the
domain. Identified below each domain are the clusters that serve to group related content standards.
The Standards for Mathematical Practice are listed below in the column to the right. These mathematical
practice standards should be incorporated into classroom instruction of the content standards.
Content Standard Domains and Clusters Standards for Mathematical Practice
Seeing Structure in Expressions [A-SSE]
• Interpret the structure of expressions.
• Write expressions in equivalent forms to
solve problems.
Arithmetic With Polynomials and Rational
Expressions [A-APR]
• Perform arithmetic operations on polynomials.
• Understand the relationship between zeros and
factors of polynomials.
• Use polynomial identities to solve problems.
• Rewrite rational expressions.
Creating Equations [A-CED]
• Create equations that describe numbers or
relationships.
Reasoning With Equations and Inequalities [A-REI]
• Understand solving equations as a process of
reasoning and explain the reasoning.
• Solve equations and inequalities in one
variable.
• Solve systems of equations.
• Represent and solve equations and inequalities
graphically.
1. Make sense of problems and persevere
in solving them.
2. Reason abstractly and quantitatively.
3. Construct viable arguments and
critique the reasoning of others.
4. Model with mathematics.
5. Use appropriate tools strategically.
6. Attend to precision.
7. Look for and make use of structure.
8. Look for and express regularity in
repeated reasoning.

2010 Alabama Course of Study: Mathematics 72
CONCEPTUAL CATEGORY: FUNCTIONS
Functions describe situations where one quantity determines another. For example, the return on $10,000
invested at an annualized percentage rate of 4.25% is a function of the length of time the money is
invested. Because we continually make theories about dependencies between quantities in nature and
society, functions are important tools in the construction of mathematical models.
In school mathematics, functions usually have numerical inputs and outputs and are often defined by an
algebraic expression. For example, the time in hours it takes for a car to drive 100 miles is a function of
the car’s speed in miles per hour, v; the rule T(v) = 100/v expresses this relationship algebraically and
defines a function whose name is T.
The set of inputs to a function is called its domain. We often infer the domain to be all inputs for which
the expression defining a function has a value, or for which the function makes sense in a given context.
A function can be described in various ways, for example by a graph indicating the trace of a
seismograph; by a verbal rule as in, ―I’ll give you a state, you give me the capital city;‖ by an algebraic
expression such as f(x) = a + bx; or by a recursive rule. The graph of a function is often a useful way of
visualizing the relationship of the function models, and manipulating a mathematical expression for a
function can throw light on the function’s properties.
Functions presented as expressions can model many important phenomena. Two important families of
functions characterized by laws of growth are linear functions, which grow at a constant rate, and
exponential functions, which grow at a constant percent rate. Linear functions with a constant term of
zero describe proportional relationships.
A graphing utility or a computer algebra system (CAS) can be used to experiment with properties of these
functions and their graphs. These technologies are valuable aids to help in the building of computational
models of functions, including recursively defined functions.
Connections to Expressions, Equations, Modeling, and Coordinates
Determining an output value for a particular input involves evaluating an expression; finding inputs that
yield a given output involves solving an equation. Questions about when two functions have the same
value for the same input lead to equations whose solutions can be visualized from the intersection of their
graphs. Because functions describe relationships between quantities, they are frequently used in
modeling. Sometimes functions are defined by a recursive process, which can be displayed effectively
using a spreadsheet or other technology.

2010 Alabama Course of Study: Mathematics 73
FUNCTIONS OVERVIEW
The Functions conceptual category focuses on the four domains listed below in the column to the left.
The Functions domains listed in bold print on the shaded bars are Interpreting Functions; Building
Functions; Linear, Quadratic, and Exponential Models; and Trigonometric Functions. Immediately
following the domain and enclosed in brackets is an abbreviation denoting the domain. Identified below
each domain are the clusters that serve to group related content standards.
The Standards for Mathematical Practice are listed below in the column to the right. These mathematical
practice standards should be incorporated into classroom instruction of the content standards.
Content Standard Domains and Clusters Standards for Mathematical Practice
Interpreting Functions [F-IF]
• Understand the concept of a function and
use function notation.
• Interpret functions that arise in applications in
terms of the context.
• Analyze functions using different
representations.
Building Functions [F-BF]
• Build a function that models a relationship
between two quantities.
• Build new functions from existing functions.
Linear, Quadratic, and Exponential Models [F-LE]
• Construct and compare linear, quadratic, and
exponential models and solve problems.
• Interpret expressions for functions in terms of
the situation they model.
Trigonometric Functions [F-TF]
• Extend the domain of trigonometric functions
using the unit circle.
• Model periodic phenomena with trigonometric
functions.
• Prove and apply trigonometric identities.
1. Make sense of problems and persevere
in solving them.
2. Reason abstractly and quantitatively.
3. Construct viable arguments and
critique the reasoning of others.
4. Model with mathematics.
5. Use appropriate tools strategically.
6. Attend to precision.
7. Look for and make use of structure.
8. Look for and express regularity in
repeated reasoning.
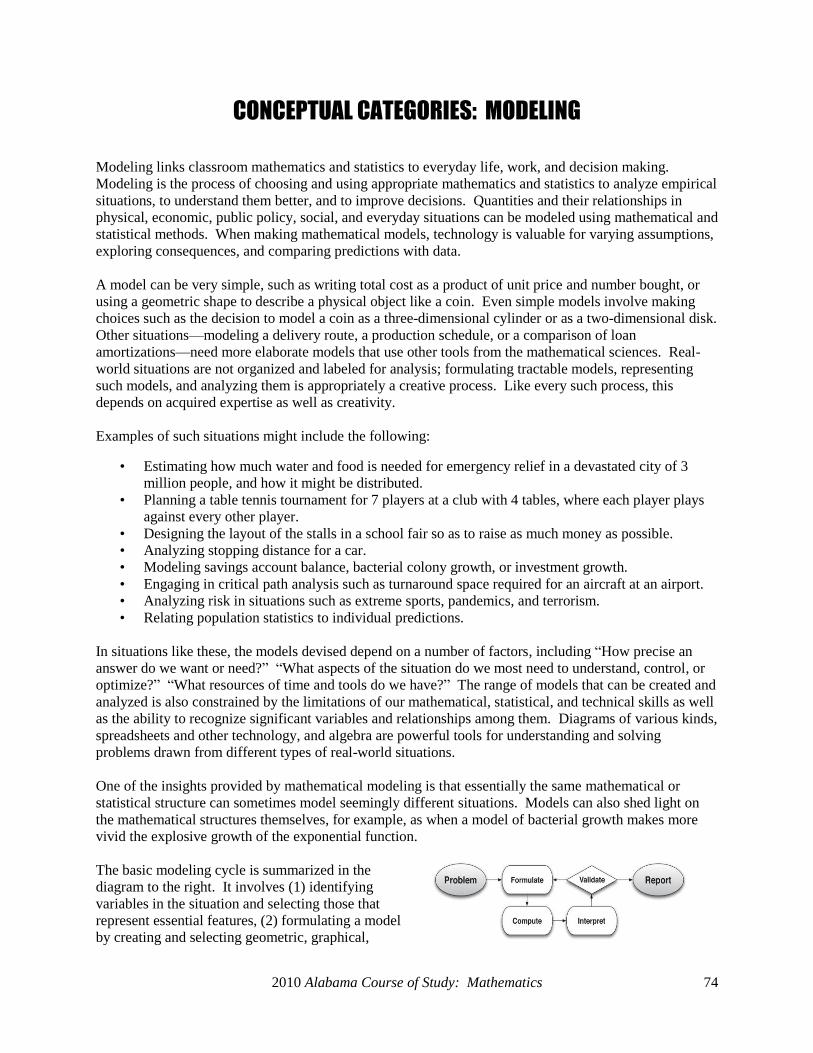
2010 Alabama Course of Study: Mathematics 74
CONCEPTUAL CATEGORIES: MODELING
Modeling links classroom mathematics and statistics to everyday life, work, and decision making.
Modeling is the process of choosing and using appropriate mathematics and statistics to analyze empirical
situations, to understand them better, and to improve decisions. Quantities and their relationships in
physical, economic, public policy, social, and everyday situations can be modeled using mathematical and
statistical methods. When making mathematical models, technology is valuable for varying assumptions,
exploring consequences, and comparing predictions with data.
A model can be very simple, such as writing total cost as a product of unit price and number bought, or
using a geometric shape to describe a physical object like a coin. Even simple models involve making
choices such as the decision to model a coin as a three-dimensional cylinder or as a two-dimensional disk.
Other situations—modeling a delivery route, a production schedule, or a comparison of loan
amortizations—need more elaborate models that use other tools from the mathematical sciences. Real-
world situations are not organized and labeled for analysis; formulating tractable models, representing
such models, and analyzing them is appropriately a creative process. Like every such process, this
depends on acquired expertise as well as creativity.
Examples of such situations might include the following:
• Estimating how much water and food is needed for emergency relief in a devastated city of 3
million people, and how it might be distributed.
• Planning a table tennis tournament for 7 players at a club with 4 tables, where each player plays
against every other player.
• Designing the layout of the stalls in a school fair so as to raise as much money as possible.
• Analyzing stopping distance for a car.
• Modeling savings account balance, bacterial colony growth, or investment growth.
• Engaging in critical path analysis such as turnaround space required for an aircraft at an airport.
• Analyzing risk in situations such as extreme sports, pandemics, and terrorism.
• Relating population statistics to individual predictions.
In situations like these, the models devised depend on a number of factors, including ―How precise an
answer do we want or need?‖ ―What aspects of the situation do we most need to understand, control, or
optimize?‖ ―What resources of time and tools do we have?‖ The range of models that can be created and
analyzed is also constrained by the limitations of our mathematical, statistical, and technical skills as well
as the ability to recognize significant variables and relationships among them. Diagrams of various kinds,
spreadsheets and other technology, and algebra are powerful tools for understanding and solving
problems drawn from different types of real-world situations.
One of the insights provided by mathematical modeling is that essentially the same mathematical or
statistical structure can sometimes model seemingly different situations. Models can also shed light on
the mathematical structures themselves, for example, as when a model of bacterial growth makes more
vivid the explosive growth of the exponential function.
The basic modeling cycle is summarized in the
diagram to the right. It involves (1) identifying
variables in the situation and selecting those that
represent essential features, (2) formulating a model
by creating and selecting geometric, graphical,

2010 Alabama Course of Study: Mathematics 75
tabular, algebraic, or statistical representations that describe relationships between the variables, (3)
analyzing and performing operations on these relationships to draw conclusions, (4) interpreting the
results of the mathematics in terms of the original situation, (5) validating the conclusions by comparing
them with the situation, and then either improving the model or, if it is acceptable, (6) reporting on the
conclusions and the reasoning behind them. Choices, assumptions, and approximations are present
throughout this cycle.
In descriptive modeling, a model simply describes the phenomena or summarizes them in a compact
form. Graphs of observations are a familiar descriptive model— for example, graphs of global
temperature and atmospheric CO2 over time.
Analytic modeling seeks to explain data on the basis of deeper theoretical ideas, albeit with parameters
that are empirically based; for example, exponential growth of bacterial colonies until cut-off
mechanisms, such as pollution or starvation intervene, follows from a constant reproduction rate.
Functions are an important tool for analyzing such problems.
A variety of powerful tools can be used to model purely mathematical phenomena (e.g., the behavior of
polynomials) as well as physical phenomena. Such tools include graphing utilities, spreadsheets,
computer algebra systems, and dynamic geometry software.
Modeling Standards. Modeling is best interpreted not as a collection of isolated topics but rather in
relation to other standards. Making mathematical models is a Standard for Mathematical Practice, and
specific modeling standards appear throughout the high school standards indicated by an asterisk (*).
2010 Alabama Course of Study: Mathematics 76
CONCEPTUAL CATEGORY: GEOMETRY
An understanding of the attributes and relationships of geometric objects can be applied in diverse
contexts. These include interpreting a schematic drawing, estimating the amount of wood needed to
frame a sloping roof, rendering computer graphics, or designing a sewing pattern for the most efficient
use of material.
Although there are many types of geometry, school mathematics is devoted primarily to plane Euclidean
geometry, studied both synthetically (without coordinates) and analytically (with coordinates). Euclidean
geometry is characterized most importantly by the Parallel Postulate that through a point not on a given
line there is exactly one parallel line. Spherical geometry, in contrast, has no parallel lines.
During high school, students begin to formalize their geometry experiences from elementary and middle
school, using more precise definitions and developing careful proofs. Later in college some students
develop Euclidean and other geometries carefully from a small set of axioms.
The concepts of congruence, similarity, and symmetry can be understood from the perspective of
geometric transformation. Fundamental are the rigid motions: translations, rotations, reflections, and
combinations of these, all of which are here assumed to preserve distance and angles, and therefore
shapes generally. Reflections and rotations each explain a particular type of symmetry, and the
symmetries of an object offer insight into its attributes—as when the reflective symmetry of an isosceles
triangle assures that its base angles are congruent.
In the approach taken here, two geometric figures are defined to be congruent if there is a sequence of
rigid motions that carries one onto the other. This is the principle of superposition. For triangles,
congruence means the equality of all corresponding pairs of sides and all corresponding pairs of angles.
During the middle grades, through experiences drawing triangles from given conditions, students notice
ways to specify enough measures in a triangle to ensure that all triangles drawn with those measures are
congruent. Once these triangle congruence criteria, angle-side-angle (ASA), side-angle-side (SAS), and
side-side-side (SSS), are established using rigid motions, they can be used to prove theorems about
triangles, quadrilaterals, and other geometric figures.
Similarity transformations (rigid motions followed by dilations) define similarity in the same way that
rigid motions define congruence, thereby formalizing the similarity ideas of ―same shape‖ and ―scale
factor‖ developed in the middle grades. These transformations lead to the criterion for triangle similarity
that two pairs of corresponding angles are congruent.
The definitions of sine, cosine, and tangent for acute angles are founded on right triangles and similarity,
and, with the Pythagorean Theorem, are fundamental in many real-world and theoretical situations. The
Pythagorean Theorem is generalized to nonright triangles by the Law of Cosines. Together, the Law of
Sines and the Law of Cosines embody the triangle congruence criteria for the cases where three pieces of
information suffice to completely solve a triangle. Furthermore, these laws yield two possible solutions
in the ambiguous case, illustrating that side-side-angle is not a congruence criterion.
Analytic geometry connects algebra and geometry, resulting in powerful methods of analysis and problem
solving. Just as the number line associates numbers with locations in one dimension, a pair of
perpendicular axes associates pairs of numbers with locations in two dimensions. Geometric
transformations of the graphs of equations correspond to algebraic changes in their equations.

2010 Alabama Course of Study: Mathematics 77
Dynamic geometry environments provide students with experimental and modeling tools. These tools
allow them to investigate geometric phenomena in much the same way as computer algebra systems
allow them to experiment with algebraic phenomena.
Connections to Equations
The correspondence between numerical coordinates and geometric points allows methods from algebra to
be applied to geometry and vice versa. The solution set of an equation becomes a geometric curve,
making visualization a tool for doing and understanding algebra. Geometric shapes can be described by
equations, making algebraic manipulation into a tool for geometric understanding, modeling, and proof.

2010 Alabama Course of Study: Mathematics 78
GEOMETRY OVERVIEW
The Geometry conceptual category focuses on the six domains listed below in the column to the left. The
Geometry domains listed in bold print on the shaded bars are Congruence; Similarity, Right Triangles,
and Trigonometry; Circles; Expressing Geometric Properties With Equations; Geometric Measurement
and Dimension; and Modeling With Geometry. Immediately following the domain and enclosed in
brackets is an abbreviation denoting the domain. Identified below each domain are the clusters that serve
to group related content standards.
The Standards for Mathematical Practice are listed below in the column to the right. These mathematical
practice standards should be incorporated into classroom instruction of the content standards.
Content Standard Domains and Clusters Standards for Mathematical Practice
Congruence [G-CO]
• Experiment with transformations in the plane.
• Understand congruence in terms of rigid motions.
• Prove geometric theorems.
• Make geometric constructions.
Similarity, Right Triangles, and Trigonometry
[G-SRT]
• Understand similarity in terms of similarity
transformations.
• Prove theorems involving similarity.
• Define trigonometric ratios and solve problems
involving right triangles.
• Apply trigonometry to general triangles.
Circles [G-C]
• Understand and apply theorems about circles.
• Find arc lengths and areas of sectors of circles.
Expressing Geometric Properties With Equations
[G-GPE]
• Translate between the geometric description and the
equation for a conic section.
• Use coordinates to prove simple geometric
theorems algebraically.
Geometric Measurement and Dimension [G-GPE]
• Explain volume formulas and use them to
solve problems.
• Visualize relationships between two-dimensional
and three-dimensional objects.
Modeling With Geometry [G-MG]
• Apply geometric concepts in modeling situations.
1. Make sense of problems and persevere
in solving them.
2. Reason abstractly and quantitatively.
3. Construct viable arguments and
critique the reasoning of others.
4. Model with mathematics.
5. Use appropriate tools strategically.
6. Attend to precision.
7. Look for and make use of structure.
8. Look for and express regularity in
repeated reasoning.

2010 Alabama Course of Study: Mathematics 79
CONCEPTUAL CATEGORY: STATISTICS AND PROBABILITY*
Decisions or predictions are often based on data—numbers in context. These decisions or predictions
would be easy if the data always sent a clear message, but the message is often obscured by variability.
Statistics provides tools for describing variability in data and for making informed decisions that take it
into account.
Data are gathered, displayed, summarized, examined, and interpreted to discover patterns and deviations
from patterns. Quantitative data can be described in terms of key characteristics: measures of shape,
center, and spread. The shape of a data distribution might be described as symmetric, skewed, flat, or
bell-shaped; and it might be summarized by a statistic measuring center such as mean or median and a
statistic measuring spread such as standard deviation or interquartile range. Different distributions can be
compared numerically using these statistics or compared visually using plots. Knowledge of center and
spread are not enough to describe a distribution. Which statistics to compare, which plots to use, and
what the results of a comparison might mean, depend on the question to be investigated and the real-life
actions to be taken.
Randomization has two important uses in drawing statistical conclusions. First, collecting data from a
random sample of a population makes it possible to draw valid conclusions about the whole population,
taking variability into account. Second, randomly assigning individuals to different treatments allows a
fair comparison of the effectiveness of those treatments. A statistically significant outcome is one that is
unlikely to be due to chance alone, and this can be evaluated only under the condition of randomness.
The conditions under which data are collected are important in drawing conclusions from the data. In
critically reviewing uses of statistics in public media and other reports, it is important to consider the
study design, how the data were gathered, and the analyses employed, as well as the data summaries and
the conclusions drawn.
Random processes can be described mathematically by using a probability model: a list or description of
the possible outcomes (the sample space), each of which is assigned a probability. In situations such as
flipping a coin, rolling a number cube, or drawing a card, it might be reasonable to assume various
outcomes are equally likely. In a probability model, sample points represent outcomes and combine to
make up events; probabilities of events can be computed by applying the Addition and Multiplication
Rules. Interpreting these probabilities relies on an understanding of independence and conditional
probability, which can be approached through the analysis of two-way tables.
Technology plays an important role in statistics and probability. The use of technology makes it possible
to generate plots, regression functions, and correlation coefficients, and to simulate many possible
outcomes in a short amount of time.
Connections to Functions and Modeling
Functions may be used to describe data. If the data suggest a linear relationship, the relationship can be
modeled with a regression line, and its strength and direction can be expressed through a correlation
coefficient.

2010 Alabama Course of Study: Mathematics 80
STATISTICS AND PROBABILITY OVERVIEW
The Statistics and Probability conceptual category focuses on the four domains listed below in the column
to the left. The Statistics and Probability domains listed in bold print on the shaded bars are Interpreting
Categorical and Quantitative Data, Making Inferences and Justifying Conclusions, Conditional
Probability and the Rules of Probability, and Using Probability to Make Decisions. Immediately
following the domain and enclosed in brackets is an abbreviation denoting the domain. Identified below
each domain are the clusters that serve to group related content standards.
The Standards for Mathematical Practice are listed below in the column to the right. These mathematical
practice standards should be incorporated into classroom instruction of the content standards.
Content Standard Domains and Clusters Standards for Mathematical Practice
Interpreting Categorical and Quantitative Data [S-ID]
• Summarize, represent, and interpret data on a
single count or measurement variable.
• Summarize, represent, and interpret data on two
categorical and quantitative variables.
• Interpret linear models.
Making Inferences and Justifying Conclusions [S-IC]
• Understand and evaluate random processes
underlying statistical experiments.
• Make inferences and justify conclusions from
sample surveys, experiments, and observational
studies.
Conditional Probability and the Rules of Probability
[S-CP]
• Understand independence and conditional
probability and use them to interpret data.
• Use the rules of probability to compute probabilities
of compound events in a uniform probability model.
Using Probability to Make Decisions [S-MD]
• Calculate expected values and use them to solve
problems.
• Use probability to evaluate outcomes of decisions.
1. Make sense of problems and persevere
in solving them.
2. Reason abstractly and quantitatively.
3. Construct viable arguments and
critique the reasoning of others.
4. Model with mathematics.
5. Use appropriate tools strategically.
6. Attend to precision.
7. Look for and make use of structure.
8. Look for and express regularity in
repeated reasoning.

2010 Alabama Course of Study: Mathematics 81
ALGEBRA I
The Algebra I course builds on foundational mathematics content learned by students in Grades K-8 by
expanding mathematics understanding to provide students with a strong mathematics education. Content
is designed to engage students in a variety of mathematical experiences that include the use of reasoning
and problem-solving skills, which may be applied to life situations beyond the classroom setting. This
course serves as the cornerstone for all high school mathematics courses; therefore, all subsequent
mathematics courses require student mastery of the Algebra I content standards.
Algebra I is one of the courses required for all students. School systems may offer Algebra I and
Algebra IA and Algebra IB. Content standards 3, 4, 5, 6, 7, 7a, 15, 16, 21, 22, 24, 25, 26, 29, 30, 30a, 37,
37b, 39, 40, 41, 42, 43, 44, 45, 46, 47, 48, 49, and 50 must be taught in the Algebra IA course. Content
standards 1, 2, 7b, 8, 9, 10, 11, 12, 13, 14, 17, 18, 19, 20, 23, 27, 28, 30b, 30c, 31, 32, 33, 34, 35, 36, 37a,
37c, and 38 must be taught in the Algebra IB course. Systems offering Algebra I in the eighth grade have
the responsibility of ensuring that all Algebra I course content standards and Grade 8 course content
standards be included in instruction.
Students will:
NUMBER AND QUANTITY
The Real Number System
Extend the properties of exponents to rational exponents.
1. Explain how the definition of the meaning of rational exponents follows from extending the
properties of integer exponents to those values, allowing for a notation for radicals in terms of
rational exponents. [N-RN1]
Example: We define 51/3
to be the cube root of 5 because we want (51/3
)3 = 5
(1/3)3 to hold, so
(51/3
)3 must equal 5.
2. Rewrite expressions involving radicals and rational exponents using the properties of exponents.
[N-RN2]
Use properties of rational and irrational numbers.
3. Explain why the sum or product of two rational numbers is rational; that the sum of a rational
number and an irrational number is irrational; and that the product of a nonzero rational number
and an irrational number is irrational. [N-RN3]

ALGEBRA I
2010 Alabama Course of Study: Mathematics 82
Quantities*
Reason quantitatively and use units to solve problems. (Foundation for work with expressions,
equations, and functions.)
4. Use units as a way to understand problems and to guide the solution of multistep problems; choose
and interpret units consistently in formulas; choose and interpret the scale and the origin in graphs
and data displays. [N-Q1]
5. Define appropriate quantities for the purpose of descriptive modeling. [N-Q2]
6. Choose a level of accuracy appropriate to limitations on measurement when reporting quantities.
[N-Q3]
ALGEBRA
Seeing Structure in Expressions
Interpret the structure of expressions. (Linear, exponential, quadratic.)
7. Interpret expressions that represent a quantity in terms of its context.* [A-SSE1]
a. Interpret parts of an expression such as terms, factors, and coefficients. [A-SSE1a]
b. Interpret complicated expressions by viewing one or more of their parts as a single entity.
[A-SSE1b]
Example: Interpret P(1+r)n as the product of P and a factor not depending on P.
8. Use the structure of an expression to identify ways to rewrite it. [A-SSE2]
Example: See x4 - y
4 as (x
2)
2 - (y
2)
2, thus recognizing it as a difference of squares that can be
factored as (x2 - y
2)(x
2 + y
2).
Write expressions in equivalent forms to solve problems. (Quadratic and exponential.)
9. Choose and produce an equivalent form of an expression to reveal and explain properties of the
quantity represented by the expression.* [A-SSE3]
a. Factor a quadratic expression to reveal the zeros of the function it defines. [A-SSE3a]
b. Complete the square in a quadratic expression to reveal the maximum or minimum value of
the function it defines. [A-SSE3b]
c. Determine a quadratic equation when given its graph or roots.
d. Use the properties of exponents to transform expressions for exponential functions.
[A-SSE3c]
Example: The expression 1.15t can be rewritten as (1.15
1/12)
12t ≈ 1.012
12t to reveal the
approximate equivalent monthly interest rate if the annual rate is 15%.
Arithmetic With Polynomials and Rational Expressions
Perform arithmetic operations on polynomials. (Linear and quadratic.)
10. Understand that polynomials form a system analogous to the integers; namely, they are closed
under the operations of addition, subtraction, and multiplication; add, subtract, and multiply
polynomials. [A-APR1]
ALGEBRA I
2010 Alabama Course of Study: Mathematics 83
Creating Equations*
Create equations that describe numbers or relationships. (Linear, quadratic, and exponential
(integer inputs only); for Standard 13, linear only.)
11. Create equations and inequalities in one variable, and use them to solve problems. Include
equations arising from linear and quadratic functions, and simple rational and exponential
functions. [A-CED1]
12. Create equations in two or more variables to represent relationships between quantities; graph
equations on coordinate axes with labels and scales. [A-CED2]
13. Represent constraints by equations or inequalities, and by systems of equations and/or inequalities
and interpret solutions as viable or non-viable options in a modeling context. [A-CED3]
Example: Represent inequalities describing nutritional and cost constraints on combinations
of different foods.
14. Rearrange formulas to highlight a quantity of interest, using the same reasoning as in solving
equations. [A-CED4]
Example: Rearrange Ohm’s law V = IR to highlight resistance R.
Reasoning With Equations and Inequalities
Understand solving equations as a process of reasoning and explain the reasoning. (Master linear;
learn as general principle.)
15. Explain each step in solving a simple equation as following from the equality of numbers asserted
at the previous step, starting from the assumption that the original equation has a solution.
Construct a viable argument to justify a solution method. [A-REI1]
Solve equations and inequalities in one variable. (Linear inequalities; literal that are linear in the
variables being solved for; quadratics with real solutions.)
16. Solve linear equations and inequalities in one variable, including equations with coefficients
represented by letters. [A-REI3]
17. Solve quadratic equations in one variable. [A-REI4]
a. Use the method of completing the square to transform any quadratic equation in x into an
equation of the form (x - p)2 = q that has the same solutions. Derive the quadratic formula
from this form. [A-REI4a]
b. Solve quadratic equations by inspection (e.g., for x2 = 49), taking square roots, completing
the square and the quadratic formula, and factoring as appropriate to the initial form of the
equation. Recognize when the quadratic formula gives complex solutions, and write them
as a ± bi for real numbers a and b. [A-REI4b]

ALGEBRA I
2010 Alabama Course of Study: Mathematics 84
Solve systems of equations. (Linear-linear and linear-quadratic.)
18. Prove that, given a system of two equations in two variables, replacing one equation by the sum of
that equation and a multiple of the other produces a system with the same solutions. [A-REI5]
19. Solve systems of linear equations exactly and approximately (e.g., with graphs), focusing on pairs
of linear equations in two variables. [A-REI6]
20. Solve a simple system consisting of a linear equation and a quadratic equation in two variables
algebraically and graphically. [A-REI7]
Example: Find the points of intersection between the line y = –3x and the circle x2 + y
2 = 3.
Represent and solve equations and inequalities graphically. (Linear and exponential; learn as
general principle.)
21. Understand that the graph of an equation in two variables is the set of all its solutions plotted in the
coordinate plane, often forming a curve (which could be a line). [A-REI10]
22. Explain why the x-coordinates of the points where the graphs of the equations y = f(x) and y = g(x)
intersect are the solutions of the equation f(x) = g(x); find the solutions approximately, e.g., using
technology to graph the functions, make tables of values, or find successive approximations.
Include cases where f(x) and/or g(x) are linear, polynomial, rational, absolute value, exponential,
and logarithmic functions.* [A-REI11]
23. Graph the solutions to a linear inequality in two variables as a half-plane (excluding the boundary in
the case of a strict inequality), and graph the solution set to a system of linear inequalities in two
variables as the intersection of the corresponding half-planes. [A-REI12]
FUNCTIONS
Interpreting Functions
Understand the concept of a function and use function notation. (Learn as general principle; focus
on linear and exponential and on arithmetic and geometric sequences.)
24. Understand that a function from one set (called the domain) to another set (called the range)
assigns to each element of the domain exactly one element of the range. If f is a function and x is
an element of its domain, then f(x) denotes the output of f corresponding to the input x. The graph
of f is the graph of the equation y = f(x). [F-IF1]
25. Use function notation, evaluate functions for inputs in their domains, and interpret statements that
use function notation in terms of a context. [F-IF2]
26. Recognize that sequences are functions, sometimes defined recursively, whose domain is a subset
of the integers. [F-IF3]
Example: The Fibonacci sequence is defined recursively by
f(0) = f(1) = 1, f(n+1) = f(n) + f(n-1) for n ≥1.

ALGEBRA I
2010 Alabama Course of Study: Mathematics 85
Interpret functions that arise in applications in terms of the context. (Linear, exponential, and
quadratic.)
27. For a function that models a relationship between two quantities, interpret key features of graphs
and tables in terms of the quantities, and sketch graphs showing key features given a verbal
description of the relationship. Key features include intercepts; intervals where the function is
increasing, decreasing, positive, or negative; relative maximums and minimums; symmetries; end
behavior; and periodicity.* [F-IF4]
28. Relate the domain of a function to its graph and, where applicable, to the quantitative relationship
it describes.* [F-IF5]
Example: If the function h(n) gives the number of person-hours it takes to assemble n engines
in a factory, then the positive integers would be an appropriate domain for the
function.
29. Calculate and interpret the average rate of change of a function (presented symbolically or as a
table) over a specified interval. Estimate the rate of change from a graph.* [F-IF6]
Analyze functions using different representations. (Linear, exponential, quadratic, absolute value,
step, piecewise-defined.)
30. Graph functions expressed symbolically and show key features of the graph, by hand in simple
cases and using technology for more complicated cases.* [F-IF7]
a. Graph linear and quadratic functions, and show intercepts, maxima, and minima. [F-IF7a]
b. Graph square root, cube root, and piecewise-defined functions, including step functions and
absolute value functions. [F-IF7b]
c. Graph exponential and logarithmic functions, showing intercepts and end behavior, and
trigonometric functions, showing period, midline, and amplitude. [F-IF7e]
31. Write a function defined by an expression in different but equivalent forms to reveal and explain
different properties of the function. [F-IF8]
a. Use the process of factoring and completing the square in a quadratic function to show
zeros, extreme values, and symmetry of the graph, and interpret these in terms of a context.
[F-IF8a]
b. Use the properties of exponents to interpret expressions for exponential functions. [F-IF8b]
Example: Identify percent rate of change in functions such as y = (1.02)t, y = (0.97)
t,
y = (1.01)12t
, and y = (1.2)t/10
, and classify them as representing exponential
growth and decay.
32. Compare properties of two functions each represented in a different way (algebraically,
graphically, numerically in tables, or by verbal descriptions). [F-IF9]
Example: Given a graph of one quadratic function and an algebraic expression for another,
say which has the larger maximum.

ALGEBRA I
2010 Alabama Course of Study: Mathematics 86
Building Functions
Build a function that models a relationship between two quantities. (For standards 33 and 34,
linear, exponential, and quadratic.)
33. Write a function that describes a relationship between two quantities.* [F-BF1]
a. Determine an explicit expression, a recursive process, or steps for calculation from a
context. [F-BF1a]
b. Combine standard function types using arithmetic operations. [F-BF1b]
Example: Build a function that models the temperature of a cooling body by adding a
constant function to a decaying exponential, and relate these functions to
the model.
34. Write arithmetic and geometric sequences both recursively and with an explicit formula, use them
to model situations, and translate between the two forms.* [F-BF2]
Build new functions from existing functions. (Linear, exponential, quadratic, and absolute value; for
standard 36a, linear only.)
35. Identify the effect on the graph of replacing f(x) by f(x) + k, k f(x), f(kx), and f(x + k) for specific
values of k (both positive and negative); find the value of k given the graphs. Experiment with
cases and illustrate an explanation of the effects on the graph using technology. Include
recognizing even and odd functions from their graphs and algebraic expressions for them.
[F-BF3]
36. Find inverse functions. [F-BF4]
a. Solve an equation of the form f(x) = c for a simple function f that has an inverse, and write
an expression for the inverse. [F-BF4a]
Example: f(x) =2x3 or f(x) = (x+1)/(x-1) for x ≠ 1.
Linear, Quadratic, and Exponential Models*
Construct and compare linear, quadratic, and exponential models and solve problems.
37. Distinguish between situations that can be modeled with linear functions and with exponential
functions. [F-LE1]
a. Prove that linear functions grow by equal differences over equal intervals, and that
exponential functions grow by equal factors over equal intervals. [F-LE1a]
b. Recognize situations in which one quantity changes at a constant rate per unit interval
relative to another. [F-LE1b]
c. Recognize situations in which a quantity grows or decays by a constant percent rate per
unit interval relative to another. [F-LE1c]
38. Construct linear and exponential functions, including arithmetic and geometric sequences, given a
graph, a description of a relationship, or two input-output pairs (include reading these from a
table). [F-LE2]
39. Observe, using graphs and tables, that a quantity increasing exponentially eventually exceeds a
quantity increasing linearly, quadratically, or (more generally) as a polynomial function. [F-LE3]

ALGEBRA I
2010 Alabama Course of Study: Mathematics 87
Interpret expressions for functions in terms of the situation they model. (Linear and exponential of
form f(x) = bx + k.)
40. Interpret the parameters in a linear or exponential function in terms of a context. [F-LE5]
STATISTICS AND PROBABILITY
Interpreting Categorical and Quantitative Data
Summarize, represent, and interpret data on a single count or measurement variable.
41. Represent data with plots on the real number line (dot plots, histograms, and box plots). [S-ID1]
42. Use statistics appropriate to the shape of the data distribution to compare center (median, mean)
and spread (interquartile range, standard deviation) of two or more different data sets. [S-ID2]
43. Interpret differences in shape, center, and spread in the context of the data sets, accounting for
possible effects of extreme data points (outliers). [S-ID3]
Summarize, represent, and interpret data on two categorical and quantitative variables. (Linear
focus, discuss general principle.)
44. Summarize categorical data for two categories in two-way frequency tables. Interpret relative
frequencies in the context of the data (including joint, marginal, and conditional relative
frequencies). Recognize possible associations and trends in the data. [S-ID5]
45. Represent data on two quantitative variables on a scatter plot, and describe how the variables are
related. [S-ID6]
a. Fit a function to the data; use functions fitted to data to solve problems in the context of the
data. Use given functions or choose a function suggested by the context. Emphasize linear,
quadratic, and exponential models. [S-ID6a]
b. Informally assess the fit of a function by plotting and analyzing residuals. [S-ID6b]
c. Fit a linear function for a scatter plot that suggests a linear association. [S-ID6c]
Interpret linear models.
46. Interpret the slope (rate of change) and the intercept (constant term) of a linear model in the
context of the data. [S-ID7]
47. Compute (using technology) and interpret the correlation coefficient of a linear fit. [S-ID8]
48. Distinguish between correlation and causation. [S-ID9]

ALGEBRA I
2010 Alabama Course of Study: Mathematics 88
Conditional Probability and the Rules of Probability
Understand independence and conditional probability and use them to interpret data.
(Link to data from simulations or experiments.)
49. Describe events as subsets of a sample space (the set of outcomes), using characteristics (or
categories) of the outcomes, or as unions, intersections, or complements of other events (―or,‖
―and,‖ ―not‖). [S-CP1]
50. Understand that two events A and B are independent if the probability of A and B occurring
together is the product of their probabilities, and use this characterization to determine if they are
independent. [S-CP2]
2010 Alabama Course of Study: Mathematics 89
GEOMETRY The Geometry course builds on Algebra I concepts and increases students’ knowledge of shapes and their
properties through geometry-based applications, many of which are observable in aspects of everyday
life. This knowledge helps develop visual and spatial sense and strong reasoning skills. The Geometry
course requires students to make conjectures and to use reasoning to validate or negate these conjectures.
The use of proofs and constructions is a valuable tool that enhances reasoning skills and enables students
to better understand more complex mathematical concepts. Technology should be used to enhance
students’ mathematical experience, not replace their reasoning abilities. Because of its importance, this
Euclidean geometry course is required of all students receiving an Alabama High School Diploma.
School systems may offer Geometry and Geometry A and Geometry B. Content standards 1, 3, 4, 5, 6, 7,
8, 9, 10, 11, 13, 14, 15, 16, 27, 31, 32, 33, 34, 35, 43, 44, 45, 46, 47, 48, 49, 50, and 51 must be taught in
the Geometry A course. Content standards 2, 12, 17, 18, 19, 20, 21, 22, 23, 24, 25, 26, 28, 29, 30, 36, 37,
38, 39, 40, 41, and 42 must be taught in the Geometry B course.
Students will:
GEOMETRY
Congruence
Experiment with transformations in the plane.
1. Know precise definitions of angle, circle, perpendicular line, parallel line, and line segment based
on the undefined notions of point, line, distance along a line, and distance around a circular arc.
[G-CO1]
2. Represent transformations in the plane using, e.g., transparencies and geometry software; describe
transformations as functions that take points in the plane as inputs and give other points as outputs.
Compare transformations that preserve distance and angle to those that do not (e.g., translation
versus horizontal stretch). [G-CO2]
3. Given a rectangle, parallelogram, trapezoid, or regular polygon, describe the rotations and
reflections that carry it onto itself. [G-CO3]
4. Develop definitions of rotations, reflections, and translations in terms of angles, circles,
perpendicular lines, parallel lines, and line segments. [G-CO4]
5. Given a geometric figure and a rotation, reflection, or translation, draw the transformed figure
using, e.g., graph paper, tracing paper, or geometry software. Specify a sequence of
transformations that will carry a given figure onto another. [G-CO5]

GEOMETRY
2010 Alabama Course of Study: Mathematics 90
Understand congruence in terms of rigid motions. (Build on rigid motions as a familiar starting
point for development of concept of geometric proof.)
6. Use geometric descriptions of rigid motions to transform figures and to predict the effect of a
given rigid motion on a given figure; given two figures, use the definition of congruence in terms
of rigid motions to decide if they are congruent. [G-CO6]
7. Use the definition of congruence in terms of rigid motions to show that two triangles are congruent
if and only if corresponding pairs of sides and corresponding pairs of angles are congruent.
[G-CO7]
8. Explain how the criteria for triangle congruence, angle-side-angle (ASA), side-angle-side (SAS),
and side-side-side (SSS), follow from the definition of congruence in terms of rigid motions.
[G-CO8]
Prove geometric theorems. (Focus on validity of underlying reasoning while using variety of ways of
writing proofs.)
9. Prove theorems about lines and angles. Theorems include vertical angles are congruent; when a
transversal crosses parallel lines, alternate interior angles are congruent and corresponding
angles are congruent; and points on a perpendicular bisector of a line segment are exactly those
equidistant from the segment’s endpoints. [G-CO9]
10. Prove theorems about triangles. Theorems include measures of interior angles of a triangle sum to
180º, base angles of isosceles triangles are congruent, the segment joining midpoints of two sides
of a triangle is parallel to the third side and half the length, and the medians of a triangle meet at
a point. [G-CO10]
11. Prove theorems about parallelograms. Theorems include opposite sides are congruent, opposite
angles are congruent; the diagonals of a parallelogram bisect each other; and conversely,
rectangles are parallelograms with congruent diagonals. [G-CO11]
Make geometric constructions. (Formalize and explain processes.)
12. Make formal geometric constructions with a variety of tools and methods such as compass and
straightedge, string, reflective devices, paper folding, and dynamic geometric software. Constructions
include copying a segment; copying an angle; bisecting a segment; bisecting an angle; constructing
perpendicular lines, including the perpendicular bisector of a line segment; and constructing a line
parallel to a given line through a point not on the line. [G-CO12]
13. Construct an equilateral triangle, a square, and a regular hexagon inscribed in a circle. [G-CO13]
Similarity, Right Triangles, and Trigonometry
Understand similarity in terms of similarity transformations.
14. Verify experimentally the properties of dilations given by a center and a scale factor. [G-SRT1]
a. A dilation takes a line not passing through the center of the dilation to a parallel line and
leaves a line passing through the center unchanged. [G-SRT1a]
b. The dilation of a line segment is longer or shorter in the ratio given by the scale factor.
[G-SRT1b]
GEOMETRY
2010 Alabama Course of Study: Mathematics 91
15. Given two figures, use the definition of similarity in terms of similarity transformations to decide
if they are similar; explain using similarity transformations the meaning of similarity for triangles
as the equality of all corresponding pairs of angles and the proportionality of all corresponding
pairs of sides. [G-SRT2]
16. Use the properties of similarity transformations to establish the angle-angle (AA) criterion for two
triangles to be similar. [G-SRT3]
Prove theorems involving similarity.
17. Prove theorems about triangles. Theorems include a line parallel to one side of a triangle divides
the other two proportionally, and conversely; and the Pythagorean Theorem proved using triangle
similarity. [G-SRT4]
18. Use congruence and similarity criteria for triangles to solve problems and to prove relationships in
geometric figures. [G-SRT5]
Define trigonometric ratios and solve problems involving right triangles.
19. Understand that by similarity, side ratios in right triangles are properties of the angles in the
triangle leading to definitions of trigonometric ratios for acute angles. [G-SRT6]
20. Explain and use the relationship between the sine and cosine of complementary angles. [G-SRT7]
21. Use trigonometric ratios and the Pythagorean Theorem to solve right triangles in applied
problems.* [G-SRT8]
Apply trigonometry to general triangles.
22. (+) Derive the formula A = (1
2)ab sin(C) for the area of a triangle by drawing an auxiliary line
from a vertex perpendicular to the opposite side. [G-SRT9]
23. (+) Prove the Law of Sines and the Law of Cosines and use them to solve problems. [G-SRT10]
24. (+) Understand and apply the Law of Sines and the Law of Cosines to find unknown
measurements in right and non-right triangles (e.g., surveying problems, resultant forces).
[G-SRT11]
Circles
Understand and apply theorems about circles.
25. Prove that all circles are similar. [G-C1]
26. Identify and describe relationships among inscribed angles, radii, and chords. Include the
relationship between central, inscribed, and circumscribed angles; inscribed angles on a diameter
are right angles; the radius of a circle is perpendicular to the tangent where the radius intersects
the circle. [G-C2]

GEOMETRY
2010 Alabama Course of Study: Mathematics 92
27. Construct the inscribed and circumscribed circles of a triangle, and prove properties of angles for a
quadrilateral inscribed in a circle. [G-C3]
28. (+) Construct a tangent line from a point outside a given circle to the circle. [G-C4]
Find arc lengths and areas of sectors of circles. (Radian introduced only as unit of measure.)
29. Derive, using similarity, the fact that the length of the arc intercepted by an angle is proportional to
the radius, and define the radian measure of the angle as the constant of proportionality; derive the
formula for the area of a sector. [G-C5]
Expressing Geometric Properties With Equations
Translate between the geometric description and the equation for a conic section.
30. Derive the equation of a circle of given center and radius using the Pythagorean Theorem;
complete the square to find the center and radius of a circle given by an equation. [G-GPE1]
Use coordinates to prove simple geometric theorems algebraically. (Include distance formula; relate
to Pythagorean Theorem.)
31. Use coordinates to prove simple geometric theorems algebraically. [G-GPE4]
Example: Prove or disprove that a figure defined by four given points in the coordinate plane
is a rectangle; prove or disprove that the point (1, 3 ) lies on the circle centered at
the origin and containing the point (0, 2).
32. Prove the slope criteria for parallel and perpendicular lines, and use them to solve geometric
problems (e.g., find the equation of a line parallel or perpendicular to a given line that passes
through a given point). [G-GPE5]
33. Find the point on a directed line segment between two given points that partitions the segment in a
given ratio. [G-GPE6]
34. Use coordinates to compute perimeters of polygons and areas of triangles and rectangles, e.g.,
using the distance formula.* [G-GPE7]
Use coordinates to prove simple geometric theorems algebraically.
35. Determine areas and perimeters of regular polygons, including inscribed or circumscribed
polygons, given the coordinates of vertices or other characteristics.
Geometric Measurement and Dimension
Explain volume formulas and use them to solve problems.
36. Give an informal argument for the formulas for the circumference of a circle; area of a circle; and
volume of a cylinder, pyramid, and cone. Use dissection arguments, Cavalieri’s principle, and
informal limit arguments. [G-GMD1]
GEOMETRY
2010 Alabama Course of Study: Mathematics 93
37. Use volume formulas for cylinders, pyramids, cones, and spheres to solve problems.* [G-GMD3]
38. Determine the relationship between surface areas of similar figures and volumes of similar figures.
Visualize relationships between two-dimensional and three-dimensional objects.
39. Identify the shapes of two-dimensional cross-sections of three-dimensional objects, and identify
three-dimensional objects generated by rotations of two-dimensional objects. [G-GMD4]
Modeling With Geometry
Apply geometric concepts in modeling situations.
40. Use geometric shapes, their measures, and their properties to describe objects (e.g., modeling a
tree trunk or a human torso as a cylinder).* [G-MG1]
41. Apply concepts of density based on area and volume in modeling situations (e.g., persons per
square mile, British Thermal Units (BTUs) per cubic foot).* [G-MG2]
42. Apply geometric methods to solve design problems (e.g., designing an object or structure to satisfy
physical constraints or minimize cost, working with typographic grid systems based on ratios).*
[G-MG3]
STATISTICS AND PROBABILITY
Conditional Probability and the Rules of Probability
Understand independence and conditional probability and use them to interpret data. (Link to data
from simulations or experiments.)
43. Understand the conditional probability of A given B as P(A and B)/P(B), and interpret
independence of A and B as saying that the conditional probability of A given B is the same as the
probability of A, and the conditional probability of B given A is the same as the probability of B.
[S-CP3]
44. Construct and interpret two-way frequency tables of data when two categories are associated with
each object being classified. Use the two-way table as a sample space to decide if events are
independent and to approximate conditional probabilities. [S-CP4]
Example: Collect data from a random sample of students in your school on their favorite
subject among mathematics, science, and English. Estimate the probability that a
randomly selected student from your school will favor science given that the
student is in tenth grade. Do the same for other subjects and compare the results.
45. Recognize and explain the concepts of conditional probability and independence in everyday
language and everyday situations. [S-CP5]
Example: Compare the chance of having lung cancer if you are a smoker with the chance of
being a smoker if you have lung cancer.

GEOMETRY
2010 Alabama Course of Study: Mathematics 94
Use the rules of probability to compute probabilities of compound events in a uniform probability
model.
46. Find the conditional probability of A given B as the fraction of B’s outcomes that also belong to A,
and interpret the answer in terms of the model. [S-CP6]
47. Apply the Addition Rule, P(A or B) = P(A) + P(B) - P(A and B), and interpret the answer in terms
of the model. [S-CP7]
48. (+) Apply the general Multiplication Rule in a uniform probability model, P(A and B) =
P(A)P(B|A) = P(B)P(A|B), and interpret the answer in terms of the model. [S-CP8]
49. (+) Use permutations and combinations to compute probabilities of compound events and solve
problems. [S-CP9]
Using Probability to Make Decisions
Use probability to evaluate outcomes of decisions. (Introductory; apply counting rules.)
50. (+) Use probabilities to make fair decisions (e.g., drawing by lots, using a random number
generator). [S-MD6]
51. (+) Analyze decisions and strategies using probability concepts (e.g., product testing, medical
testing, pulling a hockey goalie at the end of a game). [S-MD7]

2010 Alabama Course of Study: Mathematics 95
ALGEBRAIC CONNECTIONS
Algebraic Connections is a course designed for students who wish to increase their mathematical
knowledge and skills prior to enrollment in the Algebra II course or the Algebra II With Trigonometry
course. Algebraic Connections expands upon the concepts of Algebra I and Geometry, with an emphasis
on application-based problems. This course provides opportunities to incorporate the use of technology
through its emphasis on applying functions to make predictions and to calculate outcomes. The
prerequisites for Algebraic Connections are Algebra I and Geometry.
Students will:
ALGEBRA
Modeling
1. Create algebraic models for application-based problems by developing and solving equations and
inequalities, including those involving direct, inverse, and joint variation.
Example: The amount of sales tax on a new car is directly proportional to the purchase price
of the car. If the sales tax on a $20,500 car is $1,600, what is the purchase price of
a new car that has a sales tax of $3,200?
Answer: The purchase price of the new car is $41,000.
2. Solve application-based problems by developing and solving systems of linear equations and
inequalities.
3. Use formulas or equations of functions to calculate outcomes of exponential growth or decay.
Example: Solve problems involving compound interest, bacterial growth, carbon-14 dating,
and depreciation.
Graphing
4. Determine maximum and minimum values of a function using linear programming procedures.
Example: Observe the boundaries x > 0, y > 0, 2x - 3y + 15 > 0, and x < 9 to find the
maximum and minimum values of ( , )f x y = 3x + 5y.
5. Determine approximate rates of change of nonlinear relationships from graphical and numerical
data.
a. Create graphical representations from tables, equations, or classroom-generated data to
model consumer costs and to predict future outcomes.
6. Use the extreme value of a given quadratic function to solve applied problems.
Example: Determine the selling price needed to maximize profit.

ALGEBRAIC CONNECTIONS
2010 Alabama Course of Study: Mathematics 96
Finance
7. Use analytical, numerical, and graphical methods to make financial and economic decisions,
including those involving banking and investments, insurance, personal budgets, credit purchases,
recreation, and deceptive and fraudulent pricing and advertising. Examples: Determine the best choice of certificates of deposit, savings accounts, checking
accounts, or loans. Compare the costs of fixed- or variable-rate mortgage loans.
Compare costs associated with various credit cards. Determine the best cellular
telephone plan for a budget.
a. Create, manually or with technological tools, graphs and tables related to personal finance
and economics. Example: Use spreadsheets to create an amortization table for a mortgage loan or a
circle graph for a personal budget.
GEOMETRY
Modeling
8. Determine missing information in an application-based situation using properties of right triangles,
including trigonometric ratios and the Pythagorean Theorem. Example: Use a construction or landscape problem to apply trigonometric ratios and the
Pythagorean Theorem.
Symmetry
9. Analyze aesthetics of physical models for line symmetry, rotational symmetry, or the golden ratio. Example: Identify the symmetry found in nature, art, or architecture.
Measurement
10. Critique measurements in terms of precision, accuracy, and approximate error.
Example: Determine whether one candidate has a significant lead over another candidate
when given their current standings in a poll and the margin of error.
11. Use ratios of perimeters, areas, and volumes of similar figures to solve applied problems. Example: Use a blueprint or scale drawing of a house to determine the amount of carpet to be
purchased.
STATISTICS AND PROBABILITY
Graphing
12. Create a model of a set of data by estimating the equation of a curve of best fit from tables of
values or scatter plots. Examples: Create models of election results as a function of population change, inflation or
employment rate as a function of time, cholesterol density as a function of age or
weight of a person.
a. Predict probabilities given a frequency distribution.

2010 Alabama Course of Study: Mathematics 97
ALGEBRA II
Algebra II is a terminating course designed to extend students’ algebraic knowledge and skills beyond
Algebra I. Students are encouraged to solve problems using a variety of methods that promote the
development of improved communication skills and foster a deeper understanding of mathematics. To
help students appreciate the power of algebra, application-based problems are incorporated throughout the
course. The use of appropriate technology is also encouraged for numerical and graphical investigations.
In contrast to the Algebra II With Trigonometry course, Algebra II does not meet the graduation
requirements for the Alabama High School Diploma with Advanced Academic Endorsement due to the
fact that it does not contain trigonometry content. Algebra II With Trigonometry or Algebra II is required
to complete the graduation requirements for the Alabama High School Diploma. This course does not
provide sufficient background to prepare students to pursue higher-level mathematics courses. The
prerequisites for Algebra II are Algebra I and Geometry.
Students will:
NUMBER AND QUANTITY
The Complex Number System
Perform arithmetic operations with complex numbers.
1. Know there is a complex number i such that i2 = –1, and every complex number has the form
a + bi with a and b real. [N-CN1]
2. Use the relation i2 = –1 and the commutative, associative, and distributive properties to add,
subtract, and multiply complex numbers. [N-CN2]
Use complex numbers in polynomial identities and equations. (Polynomials with real coefficients.)
3. Solve quadratic equations with real coefficients that have complex solutions. [N-CN7]
4. (+) Extend polynomial identities to the complex numbers. [N-CN8]
Example: Rewrite x2 + 4 as (x + 2i)(x – 2i).
5. (+) Know the Fundamental Theorem of Algebra; show that it is true for quadratic polynomials.
[N-CN9]

ALGEBRA II
2010 Alabama Course of Study: Mathematics 98
ALGEBRA
Seeing Structure in Expressions
Interpret the structure of expressions. (Polynomial and rational.)
6. Interpret expressions that represent a quantity in terms of its context.* [A-SSE1]
a. Interpret parts of an expression such as terms, factors, and coefficients. [A-SSE1a]
b. Interpret complicated expressions by viewing one or more of their parts as a single entity.
[A-SSE1b]
Example: Interpret P(1+r)n as the product of P and a factor not depending on P.
7. Use the structure of an expression to identify ways to rewrite it. [A-SSE2]
Example: See x4 – y
4 as (x
2)
2 – (y
2)
2, thus recognizing it as a difference of squares that can be
factored as (x2 – y
2)(x
2 + y
2).
Write expressions in equivalent forms to solve problems.
8. Derive the formula for the sum of a finite geometric series (when the common ratio is not 1), and
use the formula to solve problems.* [A-SSE4]
Example: Calculate mortgage payments.
Arithmetic With Polynomials and Rational Expressions
Perform arithmetic operations on polynomials. (Beyond quadratic.)
9. Understand that polynomials form a system analogous to the integers; namely, they are closed
under the operations of addition, subtraction, and multiplication; add, subtract, and multiply
polynomials. [A-APR1]
Understand the relationship between zeros and factors of polynomials.
10. Know and apply the Remainder Theorem: For a polynomial p(x) and a number a, the remainder
on division by x – a is p(a), so p(a) = 0 if and only if (x – a) is a factor of p(x). [A-APR2]
11. Identify zeros of polynomials when suitable factorizations are available, and use the zeros to
construct a rough graph of the function defined by the polynomial. [A-APR3]
Use polynomial identities to solve problems.
12. Prove polynomial identities and use them to describe numerical relationships. [A-APR4]
Example: The polynomial identity (x2 + y
2)
2 = (x
2 – y
2)
2 + (2xy)
2 can be used to generate
Pythagorean triples.
13. (+) Know and apply the Binomial Theorem for the expansion of (x + y)n in powers of x and y for a
positive integer n, where x and y are any numbers, with coefficients determined, for example, by
Pascal’s Triangle. (The Binomial Theorem can be proved by mathematical induction or by a
combinatorial argument.) [A-APR5]

ALGEBRA II
2010 Alabama Course of Study: Mathematics 99
Rewrite rational expressions. (Linear and quadratic denominators.)
14. Rewrite simple rational expressions in different forms; write a(x)/b(x) in the form q(x) + r(x)/b(x),
where a(x), b(x), q(x), and r(x) are polynomials with the degree of r(x) less than the degree of b(x),
using inspection, long division, or for the more complicated examples, a computer algebra system.
[A-APR6]
15. (+) Understand that rational expressions form a system analogous to the rational numbers, closed
under addition, subtraction, multiplication, and division by a nonzero rational expression; add,
subtract, multiply, and divide rational expressions. [A-APR7]
Creating Equations*
Create equations that describe numbers or relationships. (Equations using all available types of
expressions, including simple root functions.)
16. Create equations and inequalities in one variable and use them to solve problems. Include
equations arising from linear and quadratic functions, and simple rational and exponential
functions. [A-CED1]
17. Create equations in two or more variables to represent relationships between quantities; graph
equations on coordinate axes with labels and scales. [A-CED2]
18. Represent constraints by equations or inequalities, and by systems of equations and/or inequalities,
and interpret solutions as viable or nonviable options in a modeling context. [A-CED3]
Example: Represent inequalities describing nutritional and cost constraints on combinations
of different foods.
19. Rearrange formulas to highlight a quantity of interest, using the same reasoning as in solving
equations. [A-CED4]
Example: Rearrange Ohm’s law V = IR to highlight resistance R.
Reasoning With Equations and Inequalities
Understand solving equations as a process of reasoning and explain the reasoning. (Simple rational
and radical.)
20. Solve simple rational and radical equations in one variable, and give examples showing how
extraneous solutions may arise. [A-REI2]
Represent and solve equations and inequalities graphically. (Combine polynomial, rational, radical,
absolute value, and exponential functions.)
21. Explain why the x-coordinates of the points where the graphs of the equations y = f(x) and y = g(x)
intersect are the solutions of the equation f(x) = g(x); find the solutions approximately, e.g., using
technology to graph the functions, make tables of values, or find successive approximations.
Include cases where f(x) and/or g(x) are linear, polynomial, rational, absolute value, exponential,
and logarithmic functions.* [A-REI11]

ALGEBRA II
2010 Alabama Course of Study: Mathematics 100
FUNCTIONS
Interpreting Functions
Interpret functions that arise in applications in terms of the context. (Emphasize selection of
appropriate models.)
22. For a function that models a relationship between two quantities, interpret key features of graphs
and tables in terms of the quantities, and sketch graphs showing key features given a verbal
description of the relationship. Key features include intercepts; intervals where the function is
increasing, decreasing, positive, or negative; relative maximums and minimums; symmetries; end
behavior; and periodicity.* [F-IF4]
23. Relate the domain of a function to its graph and, where applicable, to the quantitative relationship
it describes.* [F-IF5]
Example: If the function h(n) gives the number of person-hours it takes to assemble n engines
in a factory, then the positive integers would be an appropriate domain for the
function.
24. Calculate and interpret the average rate of change of a function (presented symbolically or as a
table) over a specified interval. Estimate the rate of change from a graph.* [F-IF6]
Analyze functions using different representations. (Focus on using key features to guide selection of
appropriate type of model function.)
25. Graph functions expressed symbolically, and show key features of the graph, by hand in simple
cases and using technology for more complicated cases.* [F-IF7]
a. Graph square root, cube root, and piecewise-defined functions, including step functions and
absolute value functions. [F-IF7b]
b. Graph polynomial functions, identifying zeros when suitable factorizations are available,
and showing end behavior. [F-IF7c]
c. Graph exponential and logarithmic functions, showing intercepts and end behavior, and
trigonometric functions, showing period, midline, and amplitude. [F-IF7e]
26. Write a function defined by an expression in different but equivalent forms to reveal and explain
different properties of the function. [F-IF8]
27. Compare properties of two functions each represented in a different way (algebraically,
graphically, numerically in tables, or by verbal descriptions). [F-IF9]
Example: Given a graph of one quadratic function and an algebraic expression for another,
say which has the larger maximum.
Building Functions
Build a function that models a relationship between two quantities. (Include all types of functions
studied.)
28. Combine standard function types using arithmetic operations. [F-BF1b]
Example: Build a function that models the temperature of a cooling body by adding a
constant function to a decaying exponential, and relate these functions to the
model.

ALGEBRA II
2010 Alabama Course of Study: Mathematics 101
Build new functions from existing functions. (Include simple radical, rational, and exponential
functions; emphasize common effect of each transformation across function types.)
29. Identify the effect on the graph of replacing f(x) by f(x) + k, k f(x), f(kx), and f(x + k) for specific
values of k (both positive and negative); find the value of k given the graphs. Experiment with
cases and illustrate an explanation of the effects on the graph using technology. Include
recognizing even and odd functions from their graphs and algebraic expressions for them.
[F-BF3]
30. Solve an equation of the form f(x) = c for a simple function f that has an inverse, and write an
expression for the inverse. [F-BF4a]
Example: f(x) = 2x3 or f(x) = (x+1)/(x-1) for x ≠ 1.
Linear, Quadratic, and Exponential Models*
Construct and compare linear, quadratic, and exponential models and solve problems. (Logarithms
as solutions for exponentials.)
31. For exponential models, express as a logarithm the solution to abct = d where a, c, and d are
numbers, and the base b is 2, 10, or e; evaluate the logarithm using technology. [F-LE4]
STATISTICS AND PROBABILITY
Interpreting Categorical and Quantitative Data
Summarize, represent, and interpret data on a single count or measurement variable.
32. Use the mean and standard deviation of a data set to fit it to a normal distribution and to estimate
population percentages. Recognize that there are data sets for which such a procedure is not
appropriate. Use calculators, spreadsheets, and tables to estimate areas under the normal curve.
[S-ID4]
Making Inferences and Justifying Conclusions
Understand and evaluate random processes underlying statistical experiments.
33. Understand statistics as a process for making inferences about population parameters based on a
random sample from that population. [S-IC1]
34. Decide if a specified model is consistent with results from a given data-generating process, e.g.,
using simulation. [S-IC2]
Example: A model says a spinning coin falls heads up with probability 0.5. Would a result of
5 tails in a row cause you to question the model?

ALGEBRA II
2010 Alabama Course of Study: Mathematics 102
Make inferences and justify conclusions from sample surveys, experiments, and observational
studies.
35. Recognize the purposes of and differences among sample surveys, experiments, and observational
studies; explain how randomization relates to each. [S-IC3]
36. Use data from a sample survey to estimate a population mean or proportion; develop a margin of
error through the use of simulation models for random sampling. [S-IC4]
37. Use data from a randomized experiment to compare two treatments; use simulations to decide if
differences between parameters are significant. [S-IC5]
38. Evaluate reports based on data. [S-IC6]
Using Probability to Make Decisions
Use probability to evaluate outcomes of decisions. (Include more complex situations.)
39. (+) Use probabilities to make fair decisions (e.g., drawing by lots, using a random number
generator). [S-MD6]
40. (+) Analyze decisions and strategies using probability concepts (e.g., product testing, medical
testing, pulling a hockey goalie at the end of a game). [S-MD7]

2010 Alabama Course of Study: Mathematics 103
ALGEBRA II WITH TRIGONOMETRY
Algebra II With Trigonometry is a course designed to extend students’ knowledge of Algebra I with
additional algebraic and trigonometric content. Mastery of the content standards for this course is
necessary for student success in higher-level mathematics. The use of appropriate technology is
encouraged for numerical and graphical investigations that enhance analytical comprehension.
Algebra II With Trigonometry is required for all students pursuing the Alabama High School Diploma
with Advanced Academic Endorsement. Prerequisites for this course are Algebra I and Geometry. If a
student chooses to take the Algebraic Connections course, it must be taken prior to the Algebra II With
Trigonometry course.
Students will:
NUMBER AND QUANTITY
The Complex Number System
Perform arithmetic operations with complex numbers.
1. Know there is a complex number i such that i2 = –1, and every complex number has the form
a + bi with a and b real. [N-CN1]
2. Use the relation i2 = –1 and the commutative, associative, and distributive properties to add,
subtract, and multiply complex numbers. [N-CN2]
Use complex numbers in polynomial identities and equations. (Polynomials with real coefficients.)
3. Solve quadratic equations with real coefficients that have complex solutions. [N-CN7]
4. (+) Extend polynomial identities to the complex numbers.
Example: Rewrite x2 + 4 as (x + 2i)(x – 2i). [N-CN8]
5. (+) Know the Fundamental Theorem of Algebra; show that it is true for quadratic polynomials.
[N-CN9]
ALGEBRA
Seeing Structure in Expressions
Interpret the structure of expressions. (Polynomial and rational.)
6. Interpret expressions that represent a quantity in terms of its context.* [A-SSE1]
a. Interpret parts of an expression such as terms, factors, and coefficients. [A-SSE1a]
b. Interpret complicated expressions by viewing one or more of their parts as a single entity.
[A-SSE1b]
Example: Interpret P(1+r)n as the product of P and a factor not depending on P.

ALGEBRA II WITH TRIGONOMETRY
2010 Alabama Course of Study: Mathematics 104
7. Use the structure of an expression to identify ways to rewrite it. [A-SSE2]
Example: See x4 – y
4 as (x
2)
2 – (y
2)
2, thus recognizing it as a difference of squares that can be
factored as (x2 – y
2)(x
2 + y
2).
Write expressions in equivalent forms to solve problems.
8. Derive the formula for the sum of a finite geometric series (when the common ratio is
not 1), and use the formula to solve problems.* [A-SSE4]
Example: Calculate mortgage payments.
Arithmetic With Polynomials and Rational Expressions
Perform arithmetic operations on polynomials. (Beyond quadratic.)
9. Understand that polynomials form a system analogous to the integers; namely, they are closed
under the operations of addition, subtraction, and multiplication; add, subtract, and multiply
polynomials. [A-APR1]
Understand the relationship between zeros and factors of polynomials.
10. Know and apply the Remainder Theorem: For a polynomial p(x) and a number a, the remainder
on division by x – a is p(a), so p(a) = 0 if and only if (x – a) is a factor of p(x). [A-APR2]
11. Identify zeros of polynomials when suitable factorizations are available, and use the zeros to
construct a rough graph of the function defined by the polynomial. [A-APR3]
Use polynomial identities to solve problems.
12. Prove polynomial identities and use them to describe numerical relationships. [A-APR4]
Example: The polynomial identity (x2 + y
2)
2 = (x
2 – y
2)
2 + (2xy)
2 can be used to generate
Pythagorean triples.
13. (+) Know and apply the Binomial Theorem for the expansion of (x + y)n in powers of x and y for a
positive integer n, where x and y are any numbers, with coefficients determined, for example, by
Pascal’s Triangle. (The Binomial Theorem can be proved by mathematical induction or by a
combinatorial argument.) [A-APR5]
Rewrite rational expressions. (Linear and quadratic denominators.)
14. Rewrite simple rational expressions in different forms; write a(x)/b(x) in the form q(x) + r(x)/b(x),
where a(x), b(x), q(x), and r(x) are polynomials with the degree of r(x) less than the degree of b(x),
using inspection, long division, or for the more complicated examples, a computer algebra system.
[A-APR6]
15. (+) Understand that rational expressions form a system analogous to the rational numbers, closed
under addition, subtraction, multiplication, and division by a nonzero rational expression; add,
subtract, multiply, and divide rational expressions. [A-APR7]

ALGEBRA II WITH TRIGONOMETRY
2010 Alabama Course of Study: Mathematics 105
Creating Equations*
Create equations that describe numbers or relationships. (Equations using all available types of
expressions, including simple root functions.)
16. Create equations and inequalities in one variable and use them to solve problems. Include
equations arising from linear and quadratic functions, and simple rational and exponential
functions. [A-CED1]
17. Create equations in two or more variables to represent relationships between quantities; graph
equations on coordinate axes with labels and scales. [A-CED2]
18. Represent constraints by equations or inequalities, and by systems of equations and/or inequalities,
and interpret solutions as viable or nonviable options in a modeling context. [A-CED3]
Example: Represent inequalities describing nutritional and cost constraints on combinations
of different foods.
19. Rearrange formulas to highlight a quantity of interest, using the same reasoning as in solving
equations. [A-CED4]
Example: Rearrange Ohm’s law V = IR to highlight resistance R.
Reasoning With Equations and Inequalities
Understand solving equations as a process of reasoning, and explain the reasoning. (Simple rational
and radical.)
20. Solve simple rational and radical equations in one variable, and give examples showing how
extraneous solutions may arise. [A-REI2]
Represent and solve equations and inequalities graphically. (Combine polynomial, rational, radical,
absolute value, and exponential functions.)
21. Explain why the x-coordinates of the points where the graphs of the equations y = f(x) and
y = g(x) intersect are the solutions of the equation f(x) = g(x); find the solutions approximately,
e.g., using technology to graph the functions, make tables of values, or find successive
approximations. Include cases where f(x) and/or g(x) are linear, polynomial, rational, absolute
value, exponential, and logarithmic functions.* [A-REI11]
FUNCTIONS
Interpreting Functions
Interpret functions that arise in applications in terms of the context. (Emphasize selection of
appropriate models.)
22. For a function that models a relationship between two quantities, interpret key features of graphs
and tables in terms of the quantities, and sketch graphs showing key features given a verbal
description of the relationship. Key features include intercepts; intervals where the function is
increasing, decreasing, positive, or negative; relative maximums and minimums; symmetries; end
behavior; and periodicity.* [F-IF4]

ALGEBRA II WITH TRIGONOMETRY
2010 Alabama Course of Study: Mathematics 106
23. Relate the domain of a function to its graph and, where applicable, to the quantitative relationship
it describes.* [F-IF5]
Example: If the function h(n) gives the number of person-hours it takes to assemble n engines
in a factory, then the positive integers would be an appropriate domain for the
function.
24. Calculate and interpret the average rate of change of a function (presented symbolically or as a
table) over a specified interval. Estimate the rate of change from a graph.* [F-IF6]
Analyze functions using different representations. (Focus on using key features to guide selection of
appropriate type of model function.)
25. Graph functions expressed symbolically and show key features of the graph, by hand in simple
cases and using technology for more complicated cases.* [F-IF7]
a. Graph square root, cube root, and piecewise-defined functions, including step functions and
absolute value functions. [F-IF7b]
b. Graph polynomial functions, identifying zeros when suitable factorizations are available,
and showing end behavior. [F-IF7c]
c. Graph exponential and logarithmic functions, showing intercepts and end behavior, and
trigonometric functions, showing period, midline, and amplitude. [F-IF7e]
26. Write a function defined by an expression in different but equivalent forms to reveal and explain
different properties of the function. [F-IF8]
27. Compare properties of two functions each represented in a different way (algebraically,
graphically, numerically in tables, or by verbal descriptions). [F-IF9]
Example: Given a graph of one quadratic function and an algebraic expression for another,
say which has the larger maximum.
Building Functions
Build a function that models a relationship between two quantities. (Include all types of functions
studied.)
28. Write a function that describes a relationship between two quantities.* [F-BF1]
a. Combine standard function types using arithmetic operations. [F-BF1b]
Example: Build a function that models the temperature of a cooling body by adding a
constant function to a decaying exponential, and relate these functions to
the model.
Build new functions from existing functions. (Include simple radical, rational, and exponential
functions; emphasize common effect of each transformation across function types.)
29. Identify the effect on the graph of replacing f(x) by f(x) + k, k f(x), f(kx), and f(x + k) for specific
values of k (both positive and negative); find the value of k given the graphs. Experiment with
cases and illustrate an explanation of the effects on the graph using technology. Include
recognizing even and odd functions from their graphs and algebraic expressions for them.
[F-BF3]
30. Solve an equation of the form f(x) = c for a simple function f that has an inverse, and write an
expression for the inverse. [F-BF4a]
Example: f(x) = 2x3 or f(x) = (x+1)/(x-1) for x ≠ 1.

ALGEBRA II WITH TRIGONOMETRY
2010 Alabama Course of Study: Mathematics 107
Linear, Quadratic, and Exponential Models*
Construct and compare linear, quadratic, and exponential models and solve problems. (Logarithms
as solutions for exponentials.)
31. For exponential models, express as a logarithm the solution to abct = d where a, c, and d are
numbers, and the base b is 2, 10, or e; evaluate the logarithm using technology. [F-LE4]
Trigonometric Functions
Extend the domain of trigonometric functions using the unit circle.
32. Understand radian measure of an angle as the length of the arc on the unit circle subtended by the
angle. [F-TF1]
33. Explain how the unit circle in the coordinate plane enables the extension of trigonometric
functions to all real numbers, interpreted as radian measures of angles traversed counterclockwise
around the unit circle. [F-TF2]
34. Define the six trigonometric functions using ratios of the sides of a right triangle, coordinates on
the unit circle, and the reciprocal of other functions.
Model periodic phenomena with trigonometric functions.
35. Choose trigonometric functions to model periodic phenomena with specified amplitude,
frequency, and midline.* [F-TF5]
Prove and apply trigonometric identities.
36. Prove the Pythagorean identity sin2(θ) + cos
2(θ) = 1, and use it to find sin(θ), cos(θ), or tan(θ)
given sin(θ), cos(θ), or tan(θ) and the quadrant of the angle. [F-TF8]
STATISTICS AND PROBABILITY
Interpreting Categorical and Quantitative Data
Summarize, represent, and interpret data on a single count or measurement variable.
37. Use the mean and standard deviation of a data set to fit it to a normal distribution and to estimate
population percentages. Recognize that there are data sets for which such a procedure is not
appropriate. Use calculators, spreadsheets, and tables to estimate areas under the normal curve.
[S-ID4]

ALGEBRA II WITH TRIGONOMETRY
2010 Alabama Course of Study: Mathematics 108
Making Inferences and Justifying Conclusions
Understand and evaluate random processes underlying statistical experiments.
38. Understand statistics as a process for making inferences about population parameters based on a
random sample from that population. [S-IC1]
39. Decide if a specified model is consistent with results from a given data-generating process, e.g.,
using simulation. [S-IC2]
Example: A model says a spinning coin falls heads up with probability 0.5. Would a result of
5 tails in a row cause you to question the model?
Make inferences and justify conclusions from sample surveys, experiments, and observational
studies.
40. Recognize the purposes of and differences among sample surveys, experiments, and observational
studies; explain how randomization relates to each. [S-IC3]
41. Use data from a sample survey to estimate a population mean or proportion; develop a margin of
error through the use of simulation models for random sampling. [S-IC4]
42. Use data from a randomized experiment to compare two treatments; use simulations to decide if
differences between parameters are significant. [S-IC5]
43. Evaluate reports based on data. [S-IC6]
Using Probability to Make Decisions
Use probability to evaluate outcomes of decisions. (Include more complex situations.)
44. (+) Use probabilities to make fair decisions (e.g., drawing by lots, using a random number
generator). [S-MD6]
45. (+) Analyze decisions and strategies using probability concepts (e.g., product testing, medical
testing, pulling a hockey goalie at the end of a game). [S-MD7]
2010 Alabama Course of Study: Mathematics 109
DISCRETE MATHEMATICS
Discrete Mathematics is a course designed for students who have successfully completed the Algebra II
With Trigonometry course and who choose not to continue mathematics study in the Precalculus or
Analytical Mathematics courses. This course may be offered as an elective for students who have
completed the four mathematics requirements for graduation.
Discrete Mathematics expands upon the topics of matrices, combinational reasoning, counting techniques,
algorithms, sequences, series, and their applications. Students are expected to work in both individual
and group settings to apply problem-solving strategies and to incorporate technological tools that extend
beyond traditional instructional practices. The prerequisites for this course are Algebra I, Geometry, and
Algebra II With Trigonometry.
Students will:
NUMBER AND QUANTITY
1. Analyze topics from elementary number theory, including perfect numbers and prime numbers, to
determine properties of integers.
2. Determine characteristics of sequences, including the Fibonacci sequence, the triangular numbers,
and pentagonal numbers. Example: Write a sequence of the first 10 triangular numbers and hypothesize a formula to
find the nth triangular number.
3. Use the recursive process and difference equations to create fractals, population growth models,
sequences, series, and compound interest models.
4. Convert between base ten and other bases.
ALGEBRA
5. Determine results of operations upon 3 × 3 and larger matrices, including matrix addition and
multiplication of a matrix by a matrix, vector, or scalar.
6. Analyze determinants and inverses of 2 × 2, 3 × 3, and larger matrices to determine the nature of
the solution set of the corresponding system of equations, including solving systems of equations
in three variables by echelon row reduction and matrix inverse.
7. Solve problems through investigation and application of existence and nonexistence of Euler
paths, Euler circuits, Hamilton paths, and Hamilton circuits. Example: Show why a 5 × 5 grid has no Hamilton circuit.
a. Develop optimal solutions of application-based problems using existing and student-
created algorithms.
DISCRETE MATHEMATICS
2010 Alabama Course of Study: Mathematics 110
8. Apply algorithms, including Kruskal’s and Prim’s, relating to minimum weight spanning trees,
networks, flows, and Steiner trees. a. Use shortest path techniques to find optimal shipping routes.
9. Determine a minimum project time using algorithms to schedule tasks in order, including critical
path analysis, the list-processing algorithm, and student-created algorithms.
GEOMETRY
10. Use vertex-coloring techniques and matching techniques to solve application-based problems. Example: Use graph-coloring techniques to color a map of the western states of the United
States so no adjacent states are the same color, including determining the minimum
number of colors needed and why no fewer colors may be used.
11. Solve application-based logic problems using Venn diagrams, truth tables, and matrices.
STATISTICS AND PROBABILITY
12. Use combinatorial reasoning and counting techniques to solve application-based problems. Example: Determine the probability of a safe opening on the first attempt given the
combination uses the digits 2, 4, 6, and 8 with the order unknown.
Answer: The probability of the safe opening on the first attempt is 1
24
.
13. Analyze election data to compare election methods and voting apportionment, including
determining strength within specific groups.

2010 Alabama Course of Study: Mathematics 111
MATHEMATICAL INVESTIGATIONS
Mathematical Investigations is a course designed for students who have successfully completed the
Algebra II With Trigonometry course and who choose not to continue mathematics study in the
Precalculus or Analytical Mathematics courses. This course may be offered as an elective for students
who have completed the four mathematics requirements for graduation.
Mathematical Investigations is intended to extend students’ knowledge of mathematical development.
Beginning with ancient numeration systems, students explore relationships between mathematics and
nature, music, art, and architecture as well as the contributions of well-known mathematicians. It extends
the scope of prerequisite courses, integrating topics with an emphasis on application-based problem
solving. The wide range of topics and applied problems may lend itself to organizing the content into
thematic units. The prerequisites for this course are Algebra I, Geometry, and Algebra II With
Trigonometry.
Students will:
NUMBER AND QUANTITY
1. Critique ancient numeration systems and applications, including astronomy and the development
and use of money and calendars.
a. Determine relationships among mathematical achievements of ancient peoples, including
the Sumerians, Babylonians, Egyptians, Mesopotamians, Chinese, Aztecs, and Incas. b. Explain origins of the Hindu-Arabic numeration system.
Example: Perform addition and subtraction in both the Hindu-Arabic and the Roman
numeration systems to compare place value and place holders.
2. Analyze mathematical relationships in music to interpret frequencies of musical notes and to
compare mathematical structures of various musical instruments. Examples: Compare frequencies of notes exactly one octave apart on the musical scale; using
frequencies and wave patterns of middle C, E above middle C, and G above middle
C to explain why the C major chord is harmonious.
a. Determine lengths of strings necessary to produce harmonic tones as in Pythagorean
tuning.
3. Use special numbers, including e, i, , and the golden ratio, to solve application-based problems.
a. Identify transcendental numbers.
Example: Calculate e to ten decimal places using a summation with 1
!n.
4. Explain the development and uses of sets of numbers, including complex, real, rational, irrational,
integer, whole, and natural numbers. a. Analyze contributions to the number system by well-known mathematicians, including
Archimedes, John Napier, René Descartes, Sir Isaac Newton, Johann Carl Friedrich Gauss,
and Julius Wilhelm Richard Dedekind. Example: Plot solutions to the polynomial equation, x
2 – 6x + 11 = 0, on the Gaussian
plane.

MATHEMATICAL INVESTIGATIONS
2010 Alabama Course of Study: Mathematics 112
ALGEBRA
5. Identify beginnings of algebraic symbolism and structure through the works of European
mathematicians.
a. Create a Fibonacci sequence when given two initial integers.
b. Investigate Tartaglia’s formula for solving cubic equations.
6. Explain the development and applications of logarithms, including contributions of John Napier,
Henry Briggs, and the Bernoulli family.
7. Justify the historical significance of the development of multiple perspectives in mathematics. Example: Relate the historical development of multiple perspectives to the works of Sir Isaac
Newton and Gottfried Wilhelm von Leibniz in the foundations of calculus.
a. Summarize the significance of René Descartes’ Cartesian coordinate system. b. Interpret the foundation of analytic geometry with regard to geometric curves and algebraic
relationships.
GEOMETRY
8. Solve problems from non-Euclidean geometry, including graph theory, networks, topology, and
fractals. Examples: Observe the figure to the right to determine if it is traversable,
and if it is, describe a path that will traverse it.
Verify that two objects are topologically equivalent.
Sketch four iterations of Sierpínski’s triangle.
9. Analyze works of visual art and architecture for mathematical relationships.
Examples: Use Leonardo da Vinci’s Vitruvian Man to explore the golden ratio.
Identify mathematical patterns in Maurits Cornelis Escher’s drawings, including
the use of tessellations in art, quilting, paintings, pottery, and architecture.
a. Summarize the historical development of perspective in art and architecture.
10. Determine the mathematical impact of the ancient Greeks, including Archimedes, Eratosthenes,
Euclid, Hypatia, Pythagoras, and the Pythagorean Society.
Example: Use Euclid’s proposition to inscribe a regular hexagon within a circle.
a. Construct multiple proofs of the Pythagorean Theorem. b. Solve problems involving figurate numbers, including triangular and pentagonal numbers.
Example: Write a sequence of the first 10 triangular numbers and hypothesize a
formula for finding the nth triangular number.
11. Describe the development of mathematical tools and their applications.
Examples: Use knotted ropes for counting; Napier’s bones for multiplication; a slide rule for
multiplying and calculating values of trigonometric, exponential, and logarithmic
functions; and a graphing calculator for analyzing functions graphically and
numerically.

MATHEMATICAL INVESTIGATIONS
2010 Alabama Course of Study: Mathematics 113
STATISTICS AND PROBABILITY
12. Summarize the history of probability, including the works of Blaise Pascal; Pierre de Fermat;
Abraham de Moivre; and Pierre-Simon, marquis de Laplace. Example: Discuss the impact of probability on gaming, economics, and insurance.

2010 Alabama Course of Study: Mathematics 114
PRECALCULUS
Precalculus is a course designed for students who have successfully completed the Algebra II With
Trigonometry course. This course is considered to be a prerequisite for success in calculus and college
mathematics. Algebraic, graphical, numerical, and verbal analyses are incorporated during investigations
of the Precalculus content standards. Parametric equations, polar relations, vector operations, conic
sections, and limits are introduced. Content for this course also includes an expanded study of
polynomial and rational functions, trigonometric functions, and logarithmic and exponential functions.
Application-based problem solving is an integral part of the course. Instruction should include
appropriate use of technology to facilitate continued development of students’ higher-order thinking
skills.
Students will:
NUMBER AND QUANTITY
The Complex Number System
Perform arithmetic operations with complex numbers.
1. (+) Find the conjugate of a complex number; use conjugates to find moduli and quotients of
complex numbers. [N-CN3]
Represent complex numbers and their operations on the complex plane.
2. (+) Represent complex numbers on the complex plane in rectangular and polar form (including
real and imaginary numbers), and explain why the rectangular and polar forms of a given complex
number represent the same number. [N-CN4]
3. (+) Represent addition, subtraction, multiplication, and conjugation of complex numbers
geometrically on the complex plane; use properties of this representation for computation.
[N-CN5]
Example: (–1 + 3 i)3 = 8 because (–1 + 3 i) has modulus 2 and argument 120°.
4. (+) Calculate the distance between numbers in the complex plane as the modulus of the difference,
and the midpoint of a segment as the average of the numbers at its endpoints. [N-CN6]
Limits
Understand limits of functions.
5. Determine numerically, algebraically, and graphically the limits of functions at specific values and
at infinity.
a. Apply limits in problems involving convergence and divergence.

PRECALCULUS
2010 Alabama Course of Study: Mathematics 115
Vector and Matrix Quantities
Represent and model with vector quantities.
6. (+) Recognize vector quantities as having both magnitude and direction. Represent vector
quantities by directed line segments, and use appropriate symbols for vectors and their magnitudes
(e.g., v, |v|, ||v||, v). [N-VM1]
7. (+) Find the components of a vector by subtracting the coordinates of an initial point from the
coordinates of a terminal point. [N-VM2]
8. (+) Solve problems involving velocity and other quantities that can be represented by vectors.
[N-VM3]
Perform operations on vectors.
9. (+) Add and subtract vectors. [N-VM4]
a. (+) Add vectors end-to-end, component-wise, and by the parallelogram rule. Understand
that the magnitude of a sum of two vectors is typically not the sum of the magnitudes.
[N-VM4a]
b. (+) Given two vectors in magnitude and direction form, determine the magnitude and
direction of their sum. [N-VM4b]
c. (+) Understand vector subtraction v – w as v + (–w), where –w is the additive inverse of w,
with the same magnitude as w and pointing in the opposite direction. Represent vector
subtraction graphically by connecting the tips in the appropriate order, and perform vector
subtraction component-wise. [N-VM4c]
10. (+) Multiply a vector by a scalar. [N-VM5]
a. (+) Represent scalar multiplication graphically by scaling vectors and possibly reversing
their direction; perform scalar multiplication component-wise, e.g., as c(vx, vy) = (cvx, cvy).
[N-VM5a]
b. (+) Compute the magnitude of a scalar multiple cv using ||cv|| = |c|v. Compute the direction
of cv knowing that when |c|v ≠ 0, the direction of cv is either along v (for c > 0) or against
v (for c < 0). [N-VM5b]
Perform operations on matrices and use matrices in applications.
11. (+) Use matrices to represent and manipulate data, e.g., to represent payoffs or incidence
relationships in a network. [N-VM6]
12. (+) Multiply matrices by scalars to produce new matrices, e.g., as when all of the payoffs in a
game are doubled. [N-VM7]
13. (+) Add, subtract, and multiply matrices of appropriate dimensions. [N-VM8]
14. (+) Understand that, unlike multiplication of numbers, matrix multiplication for square matrices is
not a commutative operation, but still satisfies the associative and distributive properties.
[N-VM9]
PRECALCULUS
2010 Alabama Course of Study: Mathematics 116
15. (+) Understand that the zero and identity matrices play a role in matrix addition and multiplication
similar to the role of 0 and 1 in the real numbers. The determinant of a square matrix is nonzero if
and only if the matrix has a multiplicative inverse. [N-VM10]
16. (+) Multiply a vector (regarded as a matrix with one column) by a matrix of suitable dimensions to
produce another vector. Work with matrices as transformations of vectors. [N-VM11]
17. Work with 2 × 2 matrices as transformations of the plane, and interpret the absolute value of the
determinant in terms of area. [N-VM12]
ALGEBRA
Reasoning With Equations and Inequalities
Solve systems of equations.
18. (+) Represent a system of linear equations as a single matrix equation in a vector variable.
[A-REI8]
19. (+) Find the inverse of a matrix if it exists and use it to solve systems of linear equations (using
technology for matrices of dimension 3 × 3 or greater). [A-REI9]
FUNCTIONS
Conic Sections
Understand the graphs and equations of conic sections.
20. Create graphs of conic sections, including parabolas, hyperbolas, ellipses, circles, and degenerate
conics, from second-degree equations.
Example: Graph x2 – 6x + y
2 – 12y + 41 = 0 or y
2 – 4x + 2y + 5 = 0.
a. Formulate equations of conic sections from their determining characteristics.
Example: Write the equation of an ellipse with center (5, -3), a horizontal major axis
of length 10, and a minor axis of length 4.
Answer: 2 2
( 5) ( 3)1.
25 4
x y
Interpreting Functions
Analyze functions using different representations. (Logarithmic and trigonometric functions.)
21. (+) Graph rational functions, identifying zeros and asymptotes when suitable factorizations are
available, and showing end behavior. [F-IF7d]

PRECALCULUS
2010 Alabama Course of Study: Mathematics 117
Building Functions
Build a function that models a relationship between two quantities.
22. (+) Compose functions. [F-BF1c]
Example: If T(y) is the temperature in the atmosphere as a function of height, and h(t) is the
height of a weather balloon as a function of time, then T(h(t)) is the temperature at
the location of the weather balloon as a function of time.
Build new functions from existing functions.
23. Determine the inverse of a function and a relation.
24. (+) Verify by composition that one function is the inverse of another. [F-BF4b]
25. (+) Read values of an inverse function from a graph or a table, given that the function has an
inverse. [F-BF4c]
26. (+) Produce an invertible function from a non-invertible function by restricting the domain.
[F-BF4d]
27. (+) Understand the inverse relationship between exponents and logarithms, and use this
relationship to solve problems involving logarithms and exponents. [F-BF5]
28. Compare effects of parameter changes on graphs of transcendental functions.
Example: Explain the relationship of the graph y = ex-2
to the graph y = ex.
Trigonometric Functions
Recognize attributes of trigonometric functions and solve problems involving trigonometry.
29. Determine the amplitude, period, phase shift, domain, and range of trigonometric functions and
their inverses.
30. Use the sum, difference, and half-angle identities to find the exact value of a trigonometric
function.
31. Utilize parametric equations by graphing and by converting to rectangular form.
a. Solve application-based problems involving parametric equations.
b. Solve applied problems that include sequences with recurrence relations.
Extend the domain of trigonometric functions using the unit circle.
32. (+) Use special triangles to determine geometrically the values of sine, cosine, and tangent for 3
,
4, and
6, and use the unit circle to express the values of sine, cosine, and tangent for π – x,
π + x, and 2π – x in terms of their values for x, where x is any real number. [F-TF3]
33. (+) Use the unit circle to explain symmetry (odd and even) and periodicity of trigonometric
functions. [F-TF4]
PRECALCULUS
2010 Alabama Course of Study: Mathematics 118
Model periodic phenomena with trigonometric functions.
34. (+) Understand that restricting a trigonometric function to a domain on which it is always
increasing or always decreasing allows its inverse to be constructed. [F-TF6]
35. (+) Use inverse functions to solve trigonometric equations that arise in modeling contexts;
evaluate the solutions using technology, and interpret them in terms of the context.* [F-TF7]
Prove and apply trigonometric identities.
36. (+) Prove the addition and subtraction formulas for sine, cosine, and tangent, and use them to solve
problems. [F-TF9]
GEOMETRY
Expressing Geometric Properties With Equations
Translate between the geometric description and the equation for a conic section.
37. (+) Derive the equations of a parabola given a focus and directrix. [G-GPE2]
38. (+) Derive the equations of ellipses and hyperbolas given the foci, using the fact that the sum or
difference of distances from the foci is constant. [G-GPE3]
Explain volume formulas and use them to solve problems.
39. (+) Give an informal argument using Cavalieri’s principle for the formulas for the volume of a
sphere and other solid figures. [G-GMD2]
STATISITCS AND PROBABILITY
Using Probability to Make Decisions
Calculate expected values and use them to solve problems.
40. (+) Define a random variable for a quantity of interest by assigning a numerical value to each
event in a sample space; graph the corresponding probability distribution using the same graphical
displays as for data distributions. [S-MD1]
41. (+) Calculate the expected value of a random variable; interpret it as the mean of the probability
distribution. [S-MD2]
42. (+) Develop a probability distribution for a random variable defined for a sample space in which
theoretical probabilities can be calculated; find the expected value. [S-MD3]
Example: Find the theoretical probability distribution for the number of correct answers
obtained by guessing on all five questions of a multiple-choice test where each
question has four choices, and find the expected grade under various grading
schemes.

PRECALCULUS
2010 Alabama Course of Study: Mathematics 119
43. (+) Develop a probability distribution for a random variable defined for a sample space in which
probabilities are assigned empirically; find the expected value. [S-MD4]
Example: Find a current data distribution on the number of television sets per household in
the United States, and calculate the expected number of sets per household. How
many television sets would you expect to find in 100 randomly selected
households?
Use probability to evaluate outcomes of decisions.
44. (+) Weigh the possible outcomes of a decision by assigning probabilities to payoff values and
finding expected values. [S-MD5]
a. Find the expected payoff for a game of chance. [S-MD5a]
Examples: Find the expected winnings from a state lottery ticket or a game at a fast-
food restaurant.
b. Evaluate and compare strategies on the basis of expected values. [S-MD5b]
Example: Compare a high-deductible versus a low-deductible automobile insurance
policy using various, but reasonable, chances of having a minor or a major
accident.
2010 Alabama Course of Study: Mathematics 120
ANALYTICAL MATHEMATICS
Analytical Mathematics is a course designed for students who have successfully completed the Algebra II
With Trigonometry course. It is considered to be parallel in rigor to Precalculus. This course provides a
structured introduction to important areas of emphasis in most postsecondary studies that pursue a
concentration in mathematics. Linear algebra, logic, vectors, and matrices are topics that are given more
in-depth coverage than in previous courses. Application-based problem solving is an integral part of this
course. To assist students with numerical and graphical analysis, the use of advanced technological tools
is highly recommended.
While this course may be taken either prior to or after Precalculus, it is recommended that students who
are interested in postsecondary studies in engineering successfully complete the Precalculus course as
well as, where available, an Advanced Placement or International Baccalaureate calculus course.
Students will:
NUMBER AND QUANTITY
Vector and Matrix Quantities
Represent and model with vector quantities.
1. (+) Recognize vector quantities as having both magnitude and direction. Represent vector
quantities by directed line segments, and use appropriate symbols for vectors and their magnitudes
(e.g., v, │v│, ││v││), including the use of eigen-values and eigen-vectors. [N-VM1]
2. (+) Solve problems involving velocity and other quantities that can be represented by vectors,
including navigation (e.g., airplane, aerospace, oceanic). [N-VM3]
3. (+) Add vectors end-to-end, component-wise, and by the parallelogram rule. Understand that the
magnitude of a sum of two vectors is typically not the sum of the magnitudes. Find the dot
product and the cross product of vectors. [N-VM4a]
4. (+) Given two vectors in magnitude and direction form, determine the magnitude and direction of
their sum, including vectors in complex vector spaces. [N-VM4b]
5. (+) Understand vector subtraction v – w as v + (–w), where (–w) is the additive inverse of w, with
the same magnitude as w and pointing in the opposite direction. Represent vector subtraction
graphically by connecting the tips in the appropriate order, and perform vector subtraction
component-wise, including vectors in complex vector spaces. [N-VM4c]
Perform operations on matrices and use matrices in applications.
6. (+) Use matrices to represent and manipulate data, e.g., to represent payoffs or incidence
relationships in a network, including linear programming. [N-VM6]
7. (+) Multiply matrices by scalars to produce new matrices, e.g., as when all of the payoffs in a
game are doubled, including rotation matrices. [N-VM7]

ANALYTICAL MATHEMATICS
2010 Alabama Course of Study: Mathematics 121
8. (+) Understand that the zero and identity matrices play a role in matrix addition and multiplication
similar to the role of 0 and 1 in the real numbers. The determinant of a square matrix is nonzero if
and only if the matrix has a multiplicative inverse. Solve matrix equations using augmented
matrices. [N-VM10]
9. (+) Multiply a vector (regarded as a matrix with one column) by a matrix of suitable dimensions to
produce another vector. Work with matrices as transformations of vectors, including matrices
larger than 2 × 2. [N-VM11]
10. (+) Work with 2 × 2 matrices as transformations of the plane, and interpret the absolute value of
the determinant in terms of area. Solve matrix application problems using reduced row echelon
form. [N-VM12]
Complex Numbers
Use complex numbers in polynomial identities and equations.
11. (+) Know the Fundamental Theorem of Algebra; show that it is true for quadratic polynomials.
Understand the importance of using complex numbers in graphing functions on the Cartesian or
complex plane. [N-CN9]
Limits
Understand limits of functions.
12. Calculate the limit of a sequence, of a function, and of an infinite series.
ALGEBRA
Seeing Structure in Expressions
13. Use the laws of Boolean Algebra to describe true/false circuits. Simplify Boolean expressions
using the relationships between conjunction, disjunction, and negation operations.
14. Use logic symbols to write truth tables.
Arithmetic With Polynomials and Rational Functions
15. Reduce the degree of either the numerator or denominator of a rational function by using partial
fraction decomposition or partial fraction expansion.

ANALYTICAL MATHEMATICS
2010 Alabama Course of Study: Mathematics 122
FUNCTIONS
Trigonometric Functions
Extend the domain of trigonometric functions using the unit circle.
16. (+) Use the unit circle to explain symmetry (odd and even) and periodicity of trigonometric
functions. [F-TF4].
Apply trigonometry to general triangles.
17. (+) Prove the Law of Sines and the Law of Cosines and use them to solve problems. Understand
Law of Sines = 2r, where r is the radius of the circumscribed circle of the triangle. Apply the Law
of Tangents. [G-SRT10]
18. Apply Euler’s and deMoivre’s formulas as links between complex numbers and trigonometry.

APPENDIX A
2010 Alabama Course of Study: Mathematics 123
TABLE 1*
COMMON ADDITION AND SUBTRACTION SITUATIONS
SITUATION Result Unknown Change Unknown Start Unknown
Add To
Two bunnies sat on the
grass. Three more bunnies
hopped there. How many
bunnies are on the grass
now?
2 + 3 = ?
Two bunnies were sitting
on the grass. Some more
bunnies hopped there.
Then there were five
bunnies. How many
bunnies hopped over to the
first two?
2 + ? = 5
Some bunnies were sitting on the
grass. Three more bunnies
hopped there. Then there were
five bunnies. How many bunnies
were on the grass before?
? + 3 = 5
Take From
Five apples were on the
table. I ate two apples.
How many apples are on
the table now?
5 – 2 = ?
Five apples were on the
table. I ate some apples.
Then there were three
apples. How many apples
did I eat?
5 – ? = 3
Some apples were on the table. I
ate two apples. Then there were
three apples. How many apples
were on the table before?
? – 2 = 3
SITUATION Total Unknown Addend Unknown
Both Addends Unknown (These take-apart situations can be used to
show all the decompositions of a given number.
The associated equations, which have the total
on the left of the equal sign, help children
understand that the = sign does not always
mean makes or results in, but always does
mean is the same number as.)
Put Together/
Take Apart (Either addend can be unknown, so
there are three variations of these
problem situations. Both Addends
Unknown is a productive
extension of this basic situation,
especially for small numbers less than
or equal to 10.)
Three red apples and two
green apples are on the
table. How many apples
are on the table?
3 + 2 = ?
Five apples are on the
table. Three are red and
the rest are green. How
many apples are green?
3 + ? = 5, 5 – 3 = ?
Grandma has five flowers. How
many can she put in her red vase
and how many in her blue vase?
5 = 0 + 5, 5 = 5 + 0
5 = 1 + 4, 5 = 4 + 1
5 = 2 + 3, 5 = 3 + 2
SITUATION Difference Unknown Bigger Unknown Smaller Unknown
Compare (For the Bigger Unknown or Smaller
Unknown situations, one version
directs the correct operation (the
version using more for the bigger
unknown and using less for the
smaller unknown). The other versions
are more difficult.)
(Version with ―How many
more?‖): Lucy has two
apples. Julie has five
apples. How many more
apples does Julie have than
Lucy?
(Version with ―How many
fewer?‖): Lucy has two
apples. Julie has five
apples. How many fewer
apples does Lucy have than
Julie?
2 + ? = 5, 5 – 2 = ?
(Version with ―more‖):
Julie has three more apples
than Lucy. Lucy has two
apples. How many apples
does Julie have?
(Version with ―fewer‖):
Lucy has 3 fewer apples
than Julie. Lucy has two
apples. How many apples
does Julie have?
2 + 3 = ?, 3 + 2 = ?
(Version with ―more‖): Julie has
three more apples than Lucy.
Julie has five apples. How many
apples does Lucy have?
(Version with ―fewer‖): Lucy
has 3 fewer apples than Julie.
Julie has five apples. How many
apples does Lucy have?
5 – 3 = ?, ? + 3 = 5
*Adapted from Mathematics Learning in Early Childhood: Paths Towards Excellence and Equity, National Research Council
2009, pp. 32-33.

APPENDIX A
2010 Alabama Course of Study: Mathematics 124
TABLE 2
COMMON MULTIPLICATION AND DIVISION SITUATIONS
(The first example in each cell is an example of discrete things. These are easier for students and should be given before the
measurement examples.)
SITUATION
Unknown Product
3 x 6 = ?
Group Size Unknown
(“How many in each group?” Division)
3 x ? = 18, and 18 ÷ 3 = ?
Number of Groups Unknown
(“How many groups?” Division)
? x 6 = 18, and 18 ÷ 6 = ?
Equal Groups
There are 3 bags with 6
plums in each bag. How many plums are there in all?
Measurement example: You need 3 lengths of string,
each 6 inches long. How
much string will you need altogether?
If 18 plums are shared equally into 3 bags,
then how many plums will be in each bag?
Measurement example: You have 18 inches of string, which you will
cut into 3 equal pieces. How long will each
piece of string be?
If 18 plums are to be packed 6 to a bag,
then how many bags are needed?
Measurement example: You have 18 inches of string, which
you will cut into pieces that are 6
inches long. How many pieces of string will you have?
Arrays (The language in the array
examples shows the easiest
form of array problems. A
harder form is to use the terms
rows and columns: The apples
in the grocery window are in 3
rows and 6 columns. How
many apples are in there?
Both forms are valuable.) Area
(Area involves arrays of
squares that have been pushed
together so that there are no
gaps or overlaps, so array
problems include these
especially important
measurement situations.)
There are 3 rows of apples
with 6 apples in each row.
How many apples are there?
Area example:
What is the area of a 3 cm
by 6 cm rectangle?
If 18 apples are arranged into 3 equal rows,
how many apples will be in each row?
Area example:
A rectangle has area 18 square centimeters. If
one side is 3 cm long, how long is a side next to it?
If 18 apples are arranged into equal
rows of 6 apples, how many rows will
there be?
Area example:
A rectangle has area 18 square
centimeters. If one side is 6 cm long, how long is a side next to it?
Compare
A blue hat costs $6. A red
hat costs 3 times as much as the blue hat. How much
does the red hat cost?
Measurement example:
A rubber band is 6 cm long. How long will the rubber
band be when it is stretched
to be 3 times as long?
A red hat costs $18 and that is 3 times as much
as a blue hat costs. How much does a blue hat cost?
Measurement example:
A rubber band is stretched to be 18 cm long and that is 3 times as long as it was at first.
How long was the rubber band at first?
A red hat costs $18 and a blue hat costs
$6. How many times as much does the red hat cost as the blue hat?
Measurement example:
A rubber band was 6 cm long at first. Now it is stretched to be 18 cm long.
How many times as long is the rubber
band now as it was at first?
General a × b = ? a × ? = p, and p ÷ a = ? ? × b = p, and p ÷ b = ?

APPENDIX A
2010 Alabama Course of Study: Mathematics 125
TABLE 3
PROPERTIES OF OPERATIONS Here a, b, and c stand for arbitrary numbers in a given number system. The properties of operations apply to
the rational number system, the real number system, and the complex number system.
Associative property of addition (a + b) + c = a + (b + c)
Commutative property of addition a + b = b + a
Additive identity property of 0 a + 0 = 0 + a = a
Existence of additive inverses For every a there exists –a so that a + (–a) = (–a) + a = 0.
Associative property of multiplication (a × b) × c = a × (b × c)
Commutative property of multiplication a × b = b × a
Multiplicative identity property of 1 a × 1 = 1 × a = a
Existence of multiplicative inverses For every a ≠ a so that a × 1/a = 1/a × a = 1.
Distributive property of multiplication over addition a × (b + c) = a × b + a × c
TABLE 4
PROPERTIES OF EQUALITY
Here a, b, and c stand for arbitrary numbers in the rational, real, or complex number systems.
Reflexive property of equality a = a
Symmetric property of equality If a = b, then b = a.
Transitive property of equality If a = b and b = c, then a = c.
Addition property of equality If a = b, then a + c = b + c.
Subtraction property of equality If a = b, then a – c = b – c.
Multiplication property of equality If a = b, then a × c = b × c.
Division property of equality If a = b and c ≠ 0, then a ÷ c = b ÷ c.
Substitution property of equality If a = b, then b may be substituted for a in any expression containing a.
TABLE 5
PROPERTIES OF INEQUALITY
Here a, b, and c stand for arbitrary numbers in the rational or real number systems.
Exactly one of the following is true: a < b, a = b, a > b.
If a > b and b > c then a > c.
If a > b, then b < a.
If a > b, then –a < –b.
If a > b, then a ± c > b ± c.
If a > b and c > 0, then a × c > b × c.
If a > b and c < 0, then a × c < b × c.
If a > b and c > 0, then a ÷ c > b ÷ c.
If a > b and c < 0, then a ÷ c < b ÷ c.

APPENDIX B
2010 Alabama Course of Study: Mathematics 126
POSSIBLE COURSE PROGRESSION IN GRADES 9-12
Algebra II or Algebra II With Trigonometry is required for all students pursuing the Alabama High School
Diploma or the Alabama High School Diploma with Advanced Academic Endorsement, respectively.
Analytical
Mathematics
Mathematical Investigations
Discrete Mathematics
Precalculus
Algebra II With Trigonometry
Geometry
(Geometry A and Geometry B)
Algebra I
(Algebra IA and Algebra IB)
Algebraic Connections
Algebra II (terminal course)

APPENDIX B
2010 Alabama Course of Study: Mathematics 127
POSSIBLE COURSE PATHWAYS
There are several pathways by which a student can meet the high school graduation requirements for
earning four credits in mathematics in Grades 9-12. Local school systems may determine which
pathways lead to completion of the requirements for a specific diploma, provided the minimum
requirements set forth by the Alabama State Board of Education are followed. Some pathways in Grades
9-12 are indicated below.
Pathways for Students Who Begin Algebra I in Grade 9
Algebra I Algebra I Algebra I
Geometry Geometry Geometry
Algebra II With Trigonometry Algebra II With Trigonometry Algebra II With Trigonometry
Precalculus Analytical Mathematics Discrete Mathematics
Algebra I Algebra I Algebra IA
Geometry Geometry Algebra IB
Algebra II With Trigonometry Algebraic Connections Geometry
Mathematical Investigations Algebra II With Trigonometry Algebra II With Trigonometry
Algebra I Algebra I Algebra IA
Geometry A Geometry Algebra IB
Geometry B Algebraic Connections Geometry
Algebra II With Trigonometry Algebra II Algebra II
Algebra I
Geometry A
Geometry B
Algebra II
Some Pathways for Students Who Complete Algebra I in Grade 8
Geometry Geometry Geometry
Algebra II With Trigonometry Algebra II With Trigonometry Algebra II With Trigonometry
Precalculus Analytical Mathematics Precalculus
Analytical Mathematics Precalculus Advanced Placement (AP)
Mathematics Course
Geometry Geometry Geometry
Algebraic Connections Algebra II With Trigonometry Algebra II With Trigonometry
Algebra II With Trigonometry Discrete Mathematics Mathematical Investigations
Analytical Mathematics Precalculus Precalculus
Geometry Geometry Geometry
Algebra II With Trigonometry Algebra II With Trigonometry Algebraic Connections
Mathematical Investigations Discrete Mathematics Algebra II With Trigonometry
Discrete Mathematics Mathematical Investigations Precalculus
Geometry Geometry Geometry
Algebraic Connections Algebraic Connections Algebraic Connections
Algebra II With Trigonometry Algebra II With Trigonometry Algebra II With Trigonometry
Analytical Mathematics Discrete Mathematics Mathematical Investigations

APPENDIX C
2010 Alabama Course of Study: Mathematics 128
LITERACY STANDARDS FOR GRADES 6-12:
HISTORY/SOCIAL STUDIES, SCIENCE, AND TECHNICAL SUBJECTS
College and Career Readiness Anchor Standards for Reading
The Grades 6-12 standards on the following pages define what students should understand and be able to
do by the end of each grade span. They correspond to the College and Career Readiness (CCR) anchor
standards below by number. The CCR and grade-specific standards are necessary complements—the
former providing broad standards, the latter providing additional specificity—that together define the
skills and understandings that all students must demonstrate.
Key Ideas and Details
1. Read closely to determine what the text says explicitly and to make logical inferences from it; cite
specific textual evidence when writing or speaking to support conclusions drawn from the text.
2. Determine central ideas or themes of a text and analyze their development; summarize the key
supporting details and ideas.
3. Analyze how and why individuals, events, or ideas develop and interact over the course of a text.
Craft and Structure
4. Interpret words and phrases as they are used in a text, including determining technical,
connotative, and figurative meanings, and analyze how specific word choices shape meaning or
tone.
5. Analyze the structure of texts, including how specific sentences, paragraphs, and larger portions
of the text (e.g., a section, chapter, scene, or stanza) relate to each other and the whole.
6. Assess how point of view or purpose shapes the content and style of a text.
Integration of Knowledge and Ideas
7. Integrate and evaluate content presented in diverse formats and media, including visually and
quantitatively, as well as in words.*
8. Delineate and evaluate the argument and specific claims in a text, including the validity of the
reasoning as well as the relevance and sufficiency of the evidence.
9. Analyze how two or more texts address similar themes or topics in order to build knowledge or to
compare the approaches the authors take.
Range of Reading and Level of Text Complexity
10. Read and comprehend complex literary and informational texts independently and proficiently.
*See College And Career Readiness Anchor Standards for Writing, ―Research to Build and Present Knowledge,‖ on page 131 for
additional standards relevant to gathering, assessing, and applying information from print and digital sources.

APPENDIX C
2010 Alabama Course of Study: Mathematics 129
Reading Standards for Literacy in History/Social Studies 6–12
The standards below begin at Grade 6; standards for K-5 reading in history/social studies, science, and
technical subjects are integrated into the K-5 Reading standards. The CCR anchor standards and high
school standards in literacy work in tandem to define college and career readiness expectations—the
former providing broad standards, the latter providing additional specificity.
Grades 6-8 Students: Grades 9-10 Students: Grades 11-12 Students: Key Ideas and Details 1. Cite specific textual evidence to support
analysis of primary and secondary
sources.
1. Cite specific textual evidence to
support analysis of primary and
secondary sources, attending to such
features as the date and origin of the
information.
1. Cite specific textual evidence to support
analysis of primary and secondary sources,
connecting insights gained from specific
details to an understanding of the text as a
whole.
2. Determine the central ideas or
information of a primary or secondary
source; provide an accurate summary of
the source distinct from prior
knowledge or opinions.
2. Determine the central ideas or
information of a primary or secondary
source; provide an accurate summary
of how key events or ideas develop
over the course of the text.
2. Determine the central ideas or information
of a primary or secondary source; provide
an accurate summary that makes clear the
relationships among the key details and
ideas.
3. Identify key steps in a text’s description
of a process related to history/social
studies (e.g., how a bill becomes law,
how interest rates are raised or lowered).
3. Analyze in detail a series of events
described in a text; determine whether
earlier events caused later ones or
simply preceded them.
3. Evaluate various explanations for actions
or events and determine which explanation
best accords with textual evidence,
acknowledging where the text leaves
matters uncertain.
Craft and Structure 4. Determine the meaning of words and
phrases as they are used in a text,
including vocabulary specific to
domains related to history/social
studies.
4. Determine the meaning of words and
phrases as they are used in a text,
including vocabulary describing
political, social, or economic aspects
of history/social studies.
4. Determine the meaning of words and
phrases as they are used in a text,
including analyzing how an author uses
and refines the meaning of a key term over
the course of a text (e.g., how Madison
defines faction in Federalist No. 10). 5. Describe how a text presents
information (e.g., sequentially,
comparatively, causally).
5. Analyze how a text uses structure to
emphasize key points or advance an
explanation or analysis.
5. Analyze in detail how a complex primary
source is structured, including how key
sentences, paragraphs, and larger portions
of the text contribute to the whole. 6. Identify aspects of a text that reveal an
author’s point of view or purpose (e.g.,
loaded language, inclusion or avoidance
of particular facts).
6. Compare the point of view of two or
more authors for how they treat the
same or similar topics, including which
details they include and emphasize in
their respective accounts.
6. Evaluate authors’ differing points of view
on the same historical event or issue by
assessing the authors’ claims, reasoning,
and evidence.
Integration of Knowledge and Ideas 7. Integrate visual information (e.g., in
charts, graphs, photographs, videos, or
maps) with other information in print
and digital texts.
7. Integrate visual information (e.g., in
charts).
7. Integrate and evaluate multiple sources of
information presented in diverse formats
and media (e.g., visually, quantitatively, as
well as in words) in order to address a
question or solve a problem.
8. Distinguish among fact, opinion, and
reasoned judgment in a text.
8. Assess the extent to which the
reasoning and evidence in a text
support the author’s claims.
8. Evaluate an author’s premises, claims, and
evidence by corroborating or challenging
them with other information.
9. Analyze the relationship between a
primary and secondary source on the
same topic.
9. Compare and contrast treatments of the
same topic in several primary and
secondary sources.
9. Integrate information from diverse
sources, both primary and secondary, into
a coherent understanding of an idea or
event, noting discrepancies among
sources.
Range of Reading and Level of Text Complexity 10. By the end of Grade 8, read and
comprehend history/social studies texts
in the Grades 6-8 text complexity band
independently and proficiently.
10. By the end of Grade 10, read and
comprehend history/social studies texts
in the Grades 9-10 text complexity
band independently and proficiently.
10. By the end of Grade 12, read and
comprehend history/social studies texts in
the Grades 11-CCR text complexity band
independently and proficiently.

APPENDIX C
2010 Alabama Course of Study: Mathematics 130
Reading Standards for Literacy in Science and Technical Subjects 6–12
Grades 6-8 Students: Grades 9-10 Students: Grades 11-12 Students: Key Ideas and Details 1. Cite specific textual evidence to support
analysis of science and technical texts.
1. Cite specific textual evidence to
support analysis of science and
technical texts, attending to the precise
details of explanations or descriptions.
1. Cite specific textual evidence to support
analysis of science and technical texts,
attending to important distinctions the
author makes and to any gaps or
inconsistencies in the account. 2. Determine the central ideas or
conclusions of a text; provide an
accurate summary of the text distinct
from prior knowledge or opinions.
2. Determine the central ideas or
conclusions of a text; trace the text’s
explanation or depiction of a complex
process, phenomenon, or concept;
provide an accurate summary of the
text.
2. Determine the central ideas or conclusions
of a text; summarize complex concepts,
processes, or information presented in a
text by paraphrasing them in simpler but
still accurate terms.
3. Follow precisely a multistep procedure
when carrying out experiments, taking
measurements, or performing technical
tasks.
3. Follow precisely a multistep procedure
when carrying out experiments, taking
measurements, or performing technical
tasks, attending to special cases or
exceptions defined in the text.
3. Follow precisely a multistep procedure
when carrying out experiments, taking
measurements, or performing technical
tasks; analyze the specific results based on
explanations in the text.
Craft and Structure 4. Determine the meaning of symbols, key
terms, and other domain-specific words
and phrases as they are used in a
specific scientific or technical context
relevant to Grades 6-8 texts and topics.
4. Determine the meaning of symbols,
key terms, and other domain-specific
words and phrases as they are used in a
specific scientific or technical context
relevant to Grades 9-10 texts and
topics.
4. Determine the meaning of symbols, key
terms, and other domain-specific words
and phrases as they are used in a specific
scientific or technical context relevant to
Grades 11-12 texts and topics.
5. Analyze the structure an author uses to
organize a text, including how the major
sections contribute to the whole and to
an understanding of the topic.
5. Analyze the structure of the
relationships among concepts in a text,
including relationships among key
terms (e.g., force, friction, reaction
force, energy).
5. Analyze how the text structures
information or ideas into categories or
hierarchies, demonstrating understanding
of the information or ideas.
6. Analyze the author’s purpose in
providing an explanation, describing a
procedure, or discussing an experiment
in a text.
6. Analyze the author’s purpose in
providing an explanation, describing a
procedure, or discussing an experiment
in a text, defining the question the
author seeks to address.
6. Analyze the author’s purpose in providing
an explanation, describing a procedure, or
discussing an experiment in a text,
identifying important issues that remain
unresolved.
Integration of Knowledge and Ideas 7. Integrate quantitative or technical
information expressed in words in a text
with a version of that information
expressed visually (e.g., in a flowchart,
diagram, model, graph, or table).
7. Translate quantitative or technical
information expressed in words in a
text into visual form (e.g., a table or
chart) and translate information
expressed visually or mathematically
(e.g., in an equation) into words.
7. Integrate and evaluate multiple sources of
information presented in diverse formats
and media (e.g., quantitative data, video,
multimedia) in order to address a question
or solve a problem.
8. Distinguish among facts, reasoned
judgment based on research findings,
and speculation in a text.
8. Assess the extent to which the
reasoning and evidence in a text
support the author’s claim or a
recommendation for solving a
scientific or technical problem.
8. Evaluate the hypotheses, data, analysis,
and conclusions in a science or technical
text, verifying the data when possible and
corroborating or challenging conclusions
with other sources of information. 9. Compare and contrast the information
gained from experiments, simulations,
video, or multimedia sources with that
gained from reading a text on the same
topic.
9. Compare and contrast findings
presented in a text to those from other
sources (including their own
experiments), noting when the findings
support or contradict previous
explanations or accounts.
9. Synthesize information from a range of
sources (e.g., texts, experiments,
simulations) into a coherent understanding
of a process, phenomenon, or concept,
resolving conflicting information when
possible.
Range of Reading and Level of Text Complexity 10. By the end of Grade 8, read and
comprehend science/technical texts in
the Grades 6-8 text complexity band
independently and proficiently.
10. By the end of Grade 10, read and
comprehend science/technical texts in
the Grades 9-10 text complexity band
independently and proficiently.
10. By the end of Grade 12, read and
comprehend science/technical texts in the
Grades 11-CCR text complexity band
independently and proficiently.
APPENDIX C
2010 Alabama Course of Study: Mathematics 131
College and Career Readiness Anchor Standards for Writing
The Grades 6-12 standards on the following pages define what students should understand and be able to
do by the end of each grade span. They correspond to the College and Career Readiness (CCR) anchor
standards below by number. The CCR and grade-specific standards are necessary complements—the
former providing broad standards, the latter providing additional specificity—that together define the
skills and understandings that all students must demonstrate.
Text Types and Purposes*
1. Write arguments to support claims in an analysis of substantive topics or texts using valid
reasoning and relevant and sufficient evidence.
2. Write informative/explanatory texts to examine and convey complex ideas and information
clearly and accurately through the effective selection, organization, and analysis of content.
3. Write narratives to develop real or imagined experiences or events using effective technique,
well-chosen details, and well-structured event sequences.
Production and Distribution of Writing
4. Produce clear and coherent writing in which the development, organization, and style are
appropriate to task, purpose, and audience.
5. Develop and strengthen writing as needed by planning, revising, editing, rewriting, or trying a
new approach.
6. Use technology, including the Internet, to produce and publish writing and to interact and
collaborate with others.
Research to Build and Present Knowledge
7. Conduct short as well as more sustained research projects based on focused questions,
demonstrating understanding of the subject under investigation.
8. Gather relevant information from multiple print and digital sources, assess the credibility and
accuracy of each source, and integrate the information while avoiding plagiarism.
9. Draw evidence from literary or informational texts to support analysis, reflection, and research.
Range of Writing
10. Write routinely over extended time frames (time for research, reflection, and revision) and shorter
time frames (a single sitting or a day or two) for a range of tasks, purposes, and audiences.
*These broad types of writing include many subgenres.

APPENDIX C
2010 Alabama Course of Study: Mathematics 132
Writing Standards for Literacy in History/Social Studies, Science, and Technical Subjects 6–12
The standards below begin at Grade 6; standards for K-5 writing in history/social studies, science, and technical
subjects are integrated into the K-5 Writing standards. The CCR anchor standards and high school standards in
literacy work in tandem to define college- and career-readiness expectations—the former providing broad standards,
the latter providing additional specificity.
Grades 6-8 Students: Grades 9-10 Students: Grades 11-12 Students:
Text Types and Purposes 1. Write arguments focused on discipline-
specific content.
a. Introduce claim(s) about a topic or
issue, acknowledge and distinguish the
claim(s) from alternate or opposing
claims, and organize the reasons and
evidence logically.
b. Support claim(s) with logical
reasoning and relevant, accurate data
and evidence that demonstrate an
understanding of the topic or text,
using credible sources.
c. Use words, phrases, and clauses to
create cohesion and clarify the
relationships among claim(s),
counterclaims, reasons, and evidence.
d. Establish and maintain a formal style.
e. Provide a concluding statement or
section that follows from and supports
the argument presented.
1. Write arguments focused on discipline-
specific content.
a. Introduce precise claim(s),
distinguish the claim(s) from
alternate or opposing claims, and
create an organization that establishes
clear relationships among the
claim(s), counterclaims, reasons, and
evidence.
b. Develop claim(s) and counterclaims
fairly, supplying data and evidence
for each while pointing out the
strengths and limitations of both
claim(s) and counterclaims in a
discipline-appropriate form and in a
manner that anticipates the
audience’s knowledge level and
concerns.
c. Use words, phrases, and clauses to
link the major sections of the text,
create cohesion, and clarify the
relationships between claim(s) and
reasons, between reasons and
evidence, and between claim(s) and
counterclaims.
d. Establish and maintain a formal style
and objective tone while attending to
the norms and conventions of the
discipline in which they are writing.
e. Provide a concluding statement or
section that follows from or supports
the argument presented.
1. Write arguments focused on discipline-
specific content.
a. Introduce precise, knowledgeable
claim(s), establish the significance of the
claim(s), distinguish the claim(s) from
alternate or opposing claims, and create
an organization that logically sequences
the claim(s), counterclaims, reasons, and
evidence.
b. Develop claim(s) and counterclaims
fairly and thoroughly, supplying the most
relevant data and evidence for each while
pointing out the strengths and limitations
of both claim(s) and counterclaims in a
discipline-appropriate form that
anticipates the audience’s knowledge
level, concerns, values, and possible
biases.
c. Use words, phrases, and clauses as well
as varied syntax to link the major sections
of the text, create cohesion, and clarify
the relationships between claim(s) and
reasons, between reasons and evidence,
and between claim(s) and counterclaims.
d. Establish and maintain a formal style and
objective tone while attending to the
norms and conventions of the discipline
in which they are writing.
e. Provide a concluding statement or section
that follows from or supports the
argument presented.

APPENDIX C
2010 Alabama Course of Study: Mathematics 133
Writing Standards for Literacy in History/Social Studies, Science, and Technical Subjects 6–12
(Continued)
Grades 6-8 Students: Grades 9-10 Students: Grades 11-12 Students: Text Types and Purposes (continued) 2. Write informative/explanatory texts,
including the narration of historical events,
scientific procedures/ experiments, or
technical processes. a. Introduce a topic clearly, previewing
what is to follow; organize ideas,
concepts, and information into broader
categories as appropriate to achieving
purpose; include formatting (e.g.,
headings), graphics (e.g., charts,
tables), and multimedia when useful to
aiding comprehension.
b. Develop the topic with relevant, well-
chosen facts, definitions, concrete
details, quotations, or other
information and examples.
c. Use appropriate and varied transitions
to create cohesion and clarify the
relationships among ideas and
concepts.
d. Use precise language and domain-
specific vocabulary to inform about or
explain the topic.
e. Establish and maintain a formal style
and objective tone.
f. Provide a concluding statement or
section that follows from and supports
the information or explanation
presented.
2. Write informative/explanatory texts,
including the narration of historical
events, scientific procedures/
experiments, or technical processes. a. Introduce a topic and organize ideas,
concepts, and information to make
important connections and
distinctions; include formatting (e.g.,
headings), graphics (e.g., figures,
tables), and multimedia when useful
to aiding comprehension.
b. Develop the topic with well-chosen,
relevant, and sufficient facts,
extended definitions, concrete details,
quotations, or other information and
examples appropriate to the
audience’s knowledge of the topic.
c. Use varied transitions and sentence
structures to link the major sections
of the text, create cohesion, and
clarify the relationships among ideas
and concepts.
d. Use precise language and domain-
specific vocabulary to manage the
complexity of the topic and convey a
style appropriate to the discipline and
context as well as to the expertise of
likely readers.
e. Establish and maintain a formal style
and objective tone while attending to
the norms and conventions of the
discipline in which they are writing.
f. Provide a concluding statement or
section that follows from and
supports the information or
explanation presented (e.g.,
articulating implications or the
significance of the topic).
2. Write informative/explanatory texts,
including the narration of historical events,
scientific procedures/ experiments, or
technical processes. a. Introduce a topic and organize complex
ideas, concepts, and information so that
each new element builds on that which
precedes it to create a unified whole;
include formatting (e.g., headings),
graphics (e.g., figures, tables), and
multimedia when useful to aiding
comprehension.
b. Develop the topic thoroughly by selecting
the most significant and relevant facts,
extended definitions, concrete details,
quotations, or other information and
examples appropriate to the audience’s
knowledge of the topic.
c. Use varied transitions and sentence
structures to link the major sections of the
text, create cohesion, and clarify the
relationships among complex ideas and
concepts.
d. Use precise language, domain-specific
vocabulary and techniques such as
metaphor, simile, and analogy to manage
the complexity of the topic; convey a
knowledgeable stance in a style that
responds to the discipline and context as
well as to the expertise of likely readers.
e. Provide a concluding statement or section
that follows from and supports the
information or explanation provided (e.g.,
articulating implications or the
significance of the topic).
3. (See note; not applicable as a separate
requirement)
3. (See note; not applicable as a separate
requirement)
3. (See note; not applicable as a separate
requirement)
Note: Students’ narrative skills continue to grow in these grades. The Standards require that students be able to
incorporate narrative elements effectively into arguments and informative/explanatory texts. In
history/social studies, students must be able to incorporate narrative accounts into their analyses of
individuals or events of historical import. In science and technical subjects, students must be able to write
precise enough descriptions of the step-by-step procedures they use in their investigations or technical work
so others can replicate them and (possibly) reach the same results.
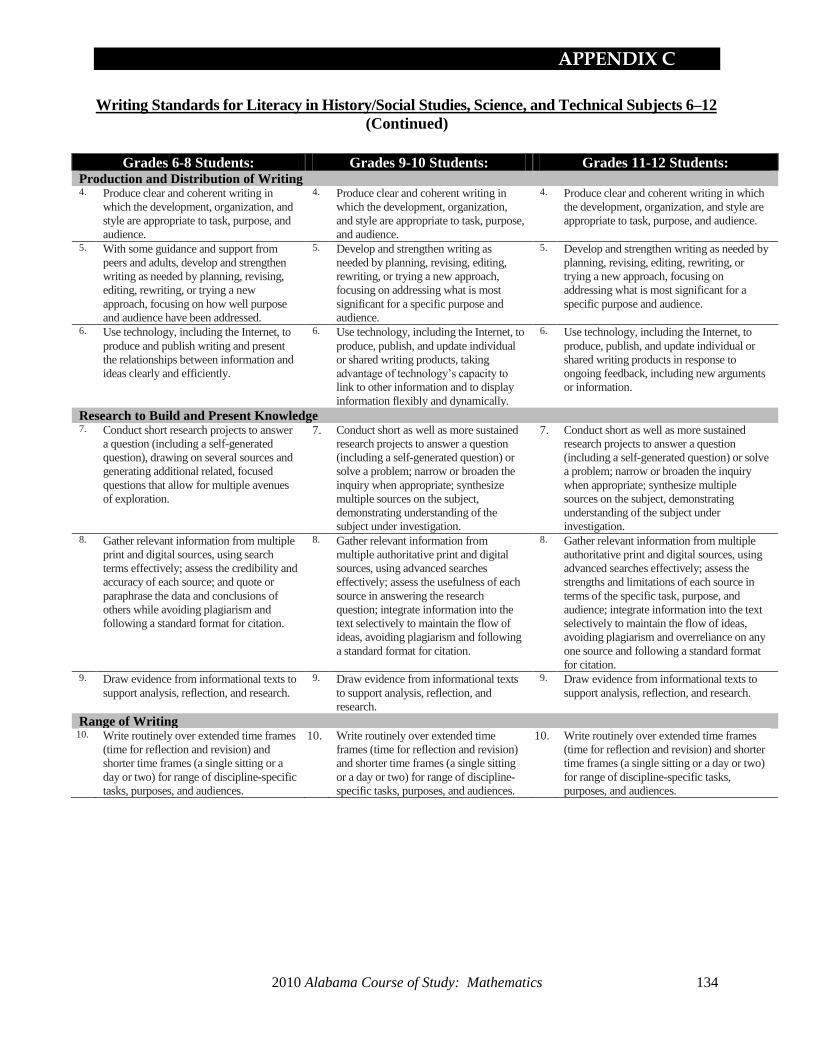
APPENDIX C
2010 Alabama Course of Study: Mathematics 134
Writing Standards for Literacy in History/Social Studies, Science, and Technical Subjects 6–12
(Continued)
Grades 6-8 Students: Grades 9-10 Students: Grades 11-12 Students: Production and Distribution of Writing 4. Produce clear and coherent writing in
which the development, organization, and
style are appropriate to task, purpose, and
audience.
4. Produce clear and coherent writing in
which the development, organization,
and style are appropriate to task, purpose,
and audience.
4. Produce clear and coherent writing in which
the development, organization, and style are
appropriate to task, purpose, and audience.
5. With some guidance and support from
peers and adults, develop and strengthen
writing as needed by planning, revising,
editing, rewriting, or trying a new
approach, focusing on how well purpose
and audience have been addressed.
5. Develop and strengthen writing as
needed by planning, revising, editing,
rewriting, or trying a new approach,
focusing on addressing what is most
significant for a specific purpose and
audience.
5. Develop and strengthen writing as needed by
planning, revising, editing, rewriting, or
trying a new approach, focusing on
addressing what is most significant for a
specific purpose and audience.
6. Use technology, including the Internet, to
produce and publish writing and present
the relationships between information and
ideas clearly and efficiently.
6. Use technology, including the Internet, to
produce, publish, and update individual
or shared writing products, taking
advantage of technology’s capacity to
link to other information and to display
information flexibly and dynamically.
6. Use technology, including the Internet, to
produce, publish, and update individual or
shared writing products in response to
ongoing feedback, including new arguments
or information.
Research to Build and Present Knowledge 7. Conduct short research projects to answer
a question (including a self-generated
question), drawing on several sources and
generating additional related, focused
questions that allow for multiple avenues
of exploration.
7. Conduct short as well as more sustained
research projects to answer a question
(including a self-generated question) or
solve a problem; narrow or broaden the
inquiry when appropriate; synthesize
multiple sources on the subject,
demonstrating understanding of the
subject under investigation.
7. Conduct short as well as more sustained
research projects to answer a question
(including a self-generated question) or solve
a problem; narrow or broaden the inquiry
when appropriate; synthesize multiple
sources on the subject, demonstrating
understanding of the subject under
investigation. 8. Gather relevant information from multiple
print and digital sources, using search
terms effectively; assess the credibility and
accuracy of each source; and quote or
paraphrase the data and conclusions of
others while avoiding plagiarism and
following a standard format for citation.
8. Gather relevant information from
multiple authoritative print and digital
sources, using advanced searches
effectively; assess the usefulness of each
source in answering the research
question; integrate information into the
text selectively to maintain the flow of
ideas, avoiding plagiarism and following
a standard format for citation.
8. Gather relevant information from multiple
authoritative print and digital sources, using
advanced searches effectively; assess the
strengths and limitations of each source in
terms of the specific task, purpose, and
audience; integrate information into the text
selectively to maintain the flow of ideas,
avoiding plagiarism and overreliance on any
one source and following a standard format
for citation. 9. Draw evidence from informational texts to
support analysis, reflection, and research.
9. Draw evidence from informational texts
to support analysis, reflection, and
research.
9. Draw evidence from informational texts to
support analysis, reflection, and research.
Range of Writing 10. Write routinely over extended time frames
(time for reflection and revision) and
shorter time frames (a single sitting or a
day or two) for range of discipline-specific
tasks, purposes, and audiences.
10. Write routinely over extended time
frames (time for reflection and revision)
and shorter time frames (a single sitting
or a day or two) for range of discipline-
specific tasks, purposes, and audiences.
10. Write routinely over extended time frames
(time for reflection and revision) and shorter
time frames (a single sitting or a day or two)
for range of discipline-specific tasks,
purposes, and audiences.

APPENDIX D
2010 Alabama Course of Study: Mathematics 135
ALABAMA HIGH SCHOOL GRADUATION REQUIREMENTS (Alabama Administrative Code 290-3-1-02(8)(a) (b) and (c))
1. COURSE REQUIREMENTS
The Alabama courses of study shall be followed in determining minimum required content in each discipline. Students
seeking the Alabama High School Diploma with Advanced Academic Endorsement shall complete advanced-level work in
the core curriculum. Students receiving the Alabama High School Diploma with Credit-Based Endorsement shall complete
the prescribed credits, including at least one Career and Technical Education course, for the Alabama High School Diploma
and pass three of the five sections of the Alabama High School Graduation Exam, including the Mathematics section,
Reading section, and one additional section.
COURSE REQUIREMENTS
Alabama
High School Diploma
Credits
Alabama High School
Diploma with Advanced
Academic Endorsement
Credits
Alabama High School
Diploma with Credit-
Based Endorsement
Credits
ENGLISH LANGUAGE ARTS 4 4 4
Four credits to include the equivalent of:
English 9
English 10
English 11
English 12
1
1
1
1
1
1
1
1
1
1
1
1
MATHEMATICS 4 4 4
Four credits to include the equivalent of:
Algebra I
Geometry
Algebra II with Trigonometry
Mathematics Elective(s)
1
1
2
1
1
1
1
1
1
2
SCIENCE 4 4 4
Four credits to include the equivalent of:
Biology
A physical science
Science Electives
1
1
2
1
1
2
1
1
2
SOCIAL STUDIES* 4 4 4
Four credits to include the equivalent of:
Grade 9 Social Studies
Grade 10 Social Studies
Grade 11 Social Studies
Grade 12 Social Studies
1
1
1
1
1
1
1
1
1
1
1
1
PHYSICAL EDUCATION 1 1 1
HEALTH EDUCATION 0.5 0.5 0.5
ARTS EDUCATION 0.5 0.5 0.5
COMPUTER APPLICATIONS** 0.5 0.5 0.5
FOREIGN LANGUAGE*** 2
ELECTIVES 5.5 3.5 5.5
Local education agencies (LEAs) shall offer foreign languages, fine arts, physical education, wellness education, career and
technical education, and driver education as electives.
TOTAL CREDITS 24 24 24
* All four required credits in Social Studies shall comply with the current Alabama Course of Study. ** May be waived if competencies outlined in the computer applications course are demonstrated to qualified staff in the local school system.
The designated one-half credit shall then be added to the elective credits, making a total of six elective credits for the Alabama High
School Diploma and the Alabama High School Diploma with Credit-Based Endorsement or four elective credits for the Alabama High School Diploma with Advanced Academic Endorsement.
*** Students earning the diploma with the advanced academic endorsement shall successfully complete two credits in the same foreign
language. Effective with the ninth-grade class of 2009-2010, the Alabama High School Diploma with Advanced Academic Endorsement becomes the first-
choice diploma for high school students.
2. ASSESSMENT REQUIREMENTS
Pass the required statewide assessment for graduation.

APPENDIX D
2010 Alabama Course of Study: Mathematics 136
ALABAMA HIGH SCHOOL GRADUATION REQUIREMENTS (CONTINUED) (Alabama Administrative Code 290-3-1-.02(8)(g)1.)
Course and assessment requirements specified below must be satisfied in order to earn the Alabama Occupational
Diploma (AOD).
1. COURSE REQUIREMENTS
Effective for students with disabilities as defined by the Individuals with Disabilities Education Act, students
must earn the course credits outlined in Alabama Administrative Code r. 290-3-1-.02(8)(g)1.
COURSE REQUIREMENTS Alabama Occupational
Diploma Credits
ENGLISH LANGUAGE ARTS 4 *Four credits to include the equivalent of:
English I
English II
English III
English IV
1
1
1
1
MATHEMATICS 4 *Four credits to include the equivalent of:
Math I
Math II
Math III
Math IV
1
1
1
1
SCIENCE 4 *Four credits to include the equivalent of:
Science I
Science II
Science III
Science IV
1
1
1
1
SOCIAL STUDIES 4 *Four credits to include the equivalent of:
Social Studies I
Social Studies II
Social Studies III
Social Studies IV
1
1
1
1
CAREER AND TECHNICAL EDUCATION 2
COORDINATED STUDIES OR TRANSITIONAL SERVICES 1
COOPERATIVE CAREER AND TECHNICAL EDUCATION 1
HEALTH EDUCATION 0.5
PHYSICAL EDUCATION 1
ARTS EDUCATION 0.5
ELECTIVES 2 Existing laws require local education agencies (LEAs) to offer arts education, physical
education, wellness education, career and technical education, and driver education as
electives.
TOTAL CREDITS 24
* All AOD credits shall comply with the current curriculum guides designated for AOD implementation.
LEAs may add additional credits or requirements.
2. ASSESSMENT REQUIREMENTS
Take the required statewide assessment for graduation at least once (during the spring of the eleventh-grade
year).

APPENDIX E
2010 Alabama Course of Study: Mathematics 137
GUIDELINES AND SUGGESTIONS FOR
LOCAL TIME REQUIREMENTS AND HOMEWORK
Total Instructional Time
The total instructional time of each school day in all schools and at all grade levels shall be not less than 6
hours or 360 minutes, exclusive of lunch periods, recess, or time used for changing classes (Code of
Alabama, 1975, §16-1-1).
Suggested Time Allotments for Grades 1 - 6
The allocations below are based on considerations of a balanced educational program for Grades 1-6.
Local school systems are encouraged to develop a general plan for scheduling that supports
interdisciplinary instruction. Remedial and/or enrichment activities should be a part of the time schedule
for the specific subject area.
Subject Area Grades 1-3 Grades 4-6
Language Arts 150 minutes daily 120 minutes daily
Mathematics 60 minutes daily 60 minutes daily
Science 30 minutes daily 45 minutes daily
Social Studies 30 minutes daily 45 minutes daily
Physical Education 30 minutes daily* 30 minutes daily*
Health 60 minutes weekly 60 minutes weekly
Technology Education 60 minutes weekly 60 minutes weekly
(Computer Applications)
Character Education 10 minutes daily** 10 minutes daily**
Arts Education
Dance
Music
Theatre
Visual Arts
Daily instruction with certified arts specialists in each of the arts disciplines is
the most desirable schedule. However, schools unable to provide daily arts
instruction in each discipline are encouraged to schedule in Grades 1 through
3 two 30- to 45-minute arts instruction sessions per week and in Grades 4
through 6 a minimum of 60 minutes of instruction per week. Interdisciplinary
instruction within the regular classroom setting is encouraged as an
alternative approach for scheduling time for arts instruction when certified
arts specialists are not available. * Established by the Alabama State Department of Education in accordance with Code of Alabama, 1975, §16-40-1
** Established by the Alabama State Department of Education in accordance with Code of Alabama, 1975, §16-6B-2(h)
Kindergarten
In accordance with Alabama Administrative Code r. 290-5-1-.01(5) Minimum Standards for Organizing
Kindergarten Programs in Alabama Schools, the daily time schedule of the kindergartens shall be the
same as the schedule of the elementary schools in the systems of which they are a part since kindergartens
in Alabama operate as full-day programs. There are no established time guidelines for individual subject
areas for the kindergarten classroom. The emphasis is on large blocks of time that allow children the
opportunity to explore all areas of the curriculum in an unhurried manner.
APPENDIX E
2010 Alabama Course of Study: Mathematics 138
It is suggested that the full-day kindergarten program be organized utilizing large blocks of time for large
groups, small groups, center time, lunch, outdoor activities, snacks, transitions, routines, and afternoon
review. Individual exploration, small-group interest activities, interaction with peers and teachers,
manipulation of concrete materials, and involvement in many other real-world experiences are needed to
provide a balance in the kindergarten classroom.
Grades 7-12
One credit may be granted in Grades 9-12 for required or elective courses consisting of a minimum of 140
instructional hours or in which students demonstrate mastery of Alabama course of study content
standards in one credit courses without specified instructional time (Alabama Administrative Code r. 290-
3-1-.02 (9)(a)).
In those schools where Grades 7 and 8 are housed with other elementary grades, the school may choose
the time requirements listed for Grades 4-6 or those listed for Grades 7-12.
Character Education
For all grades, not less than 10 minutes instruction per day shall focus upon the students’ development of
the following character traits: courage, patriotism, citizenship, honesty, fairness, respect for others,
kindness, cooperation, self-respect, self-control, courtesy, compassion, tolerance, diligence, generosity,
punctuality, cleanliness, cheerfulness, school pride, respect of the environment, patience, creativity,
sportsmanship, loyalty, and perseverance.
Homework
Homework is an important component of every student’s instructional program. Students, teachers, and
parents should have a clear understanding of the objectives to be accomplished through homework and
the role it plays in meeting curriculum requirements. Homework reflects practices that have been taught
in the classroom and provides reinforcement and remediation for students. It should be student-managed,
and the amount should be age-appropriate, encouraging learning through problem solving and practice.
At every grade level, homework should be meaning-centered and mirror classroom activities and
experiences. Independent and collaborative projects that foster creativity, problem-solving abilities, and
student responsibility are appropriate. Parental support and supervision reinforce the quality of practice
or product as well as skill development.
Each local board of education shall establish a policy on homework consistent with the Alabama State
Board of Education resolution adopted February 23, 1984 (Action Item #F-2).

2010 Alabama Course of Study: Mathematics 139
BIBLIOGRAPHY
Alabama Course of Study: Mathematics. Montgomery, Alabama: Alabama Department of Education,
2009.
Common Core State Standards for Mathematics. Washington, D. C.: National Governors Association
Center for Best Practices (NGA Center) and the Council of Chief State School Officers (CCSSO),
2010. Cross, Christopher T., Taniesha A. Woods and Heidi Schweingruber, Eds. Mathematics in Early
Childhood: Paths Towards Excellence and Equity. Washington, D. C.: Committee on Early
Childhood Mathematics, National Research Council (NCR), 2009.
Kilpatrick, Jeremy, Jane Swafford and Bradford Findell, Eds. Adding It Up: Helping Children Learn
Mathematics. Washington, D. C.: Mathematics Learning Study Committee, National Research
Council (NCR), 2001. Principles and Standards for School Mathematics. Reston, Virginia: National Council of Teachers of
Mathematics, 2000.
Wisconsin Department of Public Instruction. ―Glossary,‖ Wisconsin Common Core State Standards for
Mathematics, n. d.,<http://www.dpi.wi.gov/standards/math/glos.html>, (March 2, 2010).

2010 Alabama Course of Study: Mathematics 140
GLOSSARY
Addition and subtraction within 5, 10, 20, 100, or 1000. Addition or subtraction of two whole numbers
with whole number answers and with sum or minuend in the range 0-5, 0-10, 0-20, or 0-100, respectively.
Example: 8 + 2 = 10 is an addition within 10, 14 – 5 = 9 is a subtraction within 20, and 55 – 18 = 37 is a
subtraction within 100.
Additive inverses. Two numbers whose sum is 0 are additive inverses of one another.
Example: 3
4 and –
3
4 are additive inverses of one another because
3
4 + (–
3
4) = (–
3
4) +
3
4 = 0.
Associative property of addition. See Appendix A, Table 3.
Associative property of multiplication. See Appendix A, Table 3.
Bivariate data. Pairs of linked numerical observations. Example: a list of heights and weights for each
player on a football team.
Box plot. A method of visually displaying a distribution of data values by using the median, quartiles,
and extremes of the data set. A box shows the middle 50% of the data.
Commutative property. See Appendix A, Table 3.
Complex fraction. A fraction A/B where A and/or B are fractions (B nonzero).
Computation algorithm. A set of predefined steps applicable to a class of problems that gives the
correct result in every case when the steps are carried out correctly. See also: computation strategy.
Computation strategy. Purposeful manipulations that may be chosen for specific problems, may not
have a fixed order, and may be aimed at converting one problem into another. See also: computation
algorithm.
Congruent. Two plane or solid figures are congruent if one can be obtained from the other by rigid
motion (a sequence of rotations, reflections, and translations).
Counting on. A strategy for finding the number of objects in a group without having to count every
member of the group. For example, if a stack of books is known to have 8 books and 3 more books are
added to the top, it is not necessary to count the stack all over again. One can find the total by counting
on—pointing to the top book and saying ―eight,‖ following this with ―nine, ten, eleven. There are eleven
books now.‖
Dilation. A transformation that moves each point along the ray through the point emanating from a fixed
center, and multiplies distances from the center by a common scale factor.
Dot plot. See: line plot.
Expanded form. A multi-digit number is expressed in expanded form when it is written as a sum of
single-digit multiples of powers of ten. For example, 643 = 600 + 40 + 3.
Expected value. For a random variable, the weighted average of its possible values, with weights given
by their respective probabilities.

2010 Alabama Course of Study: Mathematics 141
First quartile. For a data set with median M, the first quartile is the median of the data values less than
M. Example: For the data set {1, 3, 6, 7, 10, 12, 14, 15, 22, 120}, the first quartile is 6. (Many different
methods for computing quartiles are in use. The method defined here is sometimes called the Moore and
McCabe method.) See also: median, third quartile, interquartile range.
Fraction. A number expressible in the form a
b where a is a whole number and b is a positive whole
number. (The word fraction in these standards always refers to a nonnegative number.) See also:
rational number.
Identity property of 0. See Appendix A, Table 3.
Independently combined probability models. Two probability models are said to be combined
independently if the probability of each ordered pair in the combined model equals the product of the
original probabilities of the two individual outcomes in the ordered pair.
Integer. A number expressible in the form a or –a for some whole number a.
Interquartile range. A measure of variation in a set of numerical data, the interquartile range is the
distance between the first and third quartiles of the data set. Example: For the data set {1, 3, 6, 7, 10, 12,
14, 15, 22, 120}, the interquartile range is 15 – 6 = 9. See also: first quartile, third quartile.
Line plot. A method of visually displaying a distribution of data values where each data value is shown
as a dot or mark above a number line; also known as a dot plot.
Mean absolute deviation. A measure of variation in a set of numerical data, computed by adding the
distances between each data value and the mean, then dividing by the number of data values. Example:
For the data set {2, 3, 6, 7, 10, 12, 14, 15, 22, 120}, the mean absolute deviation is 20.
Mean or arithmetic mean. A measure of center in a set of numerical data, computed by adding the
values in a list and then dividing by the number of values in the list. Example: For the data set {1, 3, 6,
7, 10, 12, 14, 15, 22, 120}, the mean is 21.
Median. A measure of center in a set of numerical data. The median of a list of values is the value
appearing at the center of a sorted version of the list—or the mean of the two central values, if the list
contains an even number of values. Example: For the data set {2, 3, 6, 7, 10, 12, 14, 15, 22, 90}, the
median is 11.
Midline. In the graph of a trigonometric function, the horizontal line halfway between its maximum and
minimum values.
Multiplication and division within 100. Multiplication or division of two whole numbers with whole
number answers, and with product or dividend in the range 0-100. Example: 72 ÷ 8 = 9.
Multiplicative inverses. Two numbers whose product is 1 are multiplicative inverses of one another.
Example: 3
4 and
4
3 are multiplicative inverses of one another because
3
4 ×
4
3 =
4
3 ×
3
4 = 1.
Number line diagram. A diagram of the number line used to represent numbers and support reasoning
about them. In a number line diagram for measurement quantities, the interval from 0 to 1 on the diagram
represents the unit of measure for the quantity.
2010 Alabama Course of Study: Mathematics 142
Percent rate of change. A rate of change expressed as a percent. Example: If a population grows from
50 to 55 in a year, it grows by 5
50 = 10% per year.
Probability. A number between 0 and 1 used to quantify likelihood for processes that have uncertain
outcomes such as tossing a coin, selecting a person at random from a group of people, tossing a ball at a
target, or testing for a medical condition.
Probability distribution. The set of possible values of a random variable with a probability assigned to
each.
Probability model. A probability model is used to assign probabilities to outcomes of a chance process
by examining the nature of the process. The set of all outcomes is called the sample space, and their
probabilities sum to 1. See also: uniform probability model.
Properties of equality. See Appendix A, Table 4.
Properties of inequality. See Appendix A, Table 5.
Properties of operations. See Appendix A, Table 3.
Random variable. An assignment of a numerical value to each outcome in a sample space.
Rational expression. A quotient of two polynomials with a nonzero denominator.
Rational number. A number expressible in the form a
b or –
a
b for some fraction
a
b. The rational
numbers include the integers.
Rectilinear figure. A polygon all angles of which are right angles.
Repeating decimal. The decimal form of a rational number. See also: terminating decimal.
Rigid motion. A transformation of points in space consisting of a sequence of one or more translations,
reflections, and/or rotations. Rigid motions are here assumed to preserve distances and angle measures.
Sample space. In a probability model for a random process, a list of the individual outcomes that are to
be considered.
Scatter plot. A graph in the coordinate plane representing a set of bivariate data. For example, the
heights and weights of a group of people could be displayed on a scatter plot.
Similarity transformation. A rigid motion followed by a dilation.
Tape diagram. A drawing that looks like a segment of tape, used to illustrate number relationships; also
known as a strip diagram, bar model, fraction strip, or length model.
Terminating decimal. A decimal is called terminating if its repeating digit is 0.
Third quartile. For a data set with median M, the third quartile is the median of the data values greater
than M. Example: For the data set {2, 3, 6, 7, 10, 12, 14, 15, 22, 120}, the third quartile is 15. See also:
median, first quartile, interquartile range.

2010 Alabama Course of Study: Mathematics 143
Transitivity principle for indirect measurement. If the length of object A is greater than the length of
object B, and the length of object B is greater than the length of object C, then the length of object A is
greater than the length of object C. This principle applies to measurement of other quantities as well.
Uniform probability model. A probability model which assigns equal probability to all outcomes. See
also: probability model.
Vector. A quantity with magnitude and direction in the plane or in space, defined by an ordered pair or
triple of real numbers.
Visual fraction model. A tape diagram, number line diagram, or area model.
Whole numbers. The numbers 0, 1, 2, 3, ….