AL Meezan Investment Management Limited Fund … Meezan Investment Management LimitedFund...
11
AL Meezan Investment Management Limited Stock Market Review KSE-100 declined by 5% during the month of Aug 2013 to close at the level of 22,161. Market fell owing to concerns due to rising oil prices, worsening geopolitical developments, weak corporate results and high leverage of market participants. Foreign net flows remained positive at US$28mn (vs. US$115mn outflow in July) despite the regional sell-off. However, volumes fell to a four month low of 20% MoM to a daily average of 200mn shares and value traded declined 20%MoM to US$85mn. Corporate results came in lower than expected for major corporations with the exception of results of companies in the electricity sector. Earnings of the listed Exploration (E&P) Companies missed analysts’ estimates, while results of certain Oil Marketing Companies and Banks also came in weaker than expected. Over the month outperforming sectors remained Electricity and Banks while underperforming sectors were Oil and Gas and Cements. Key triggers going forward will be 1) IMF loan approval for Pakistan in its Sep 4th board meeting 2)Pending Congress approval to US for Syrian attack, 3) Intact of cement cartel and 4) CPI inflation numbers for Aug and 5) upcoming monetary policy meeting on Sep 13, 2013. KSE-100 Index Performance Al Meezan Investments, the company in operation since 1995, has one of the longest track record of managing mutual funds in the private sector in Pakistan. Al Meezan Investments manages nine mutual funds; namely Al Meezan Mutual Fund, Meezan Balanced Fund, Meezan Islamic Fund, Meezan Islamic Income Fund, Meezan Tahaffuz Pension Fund, Meezan Cash Fund, Meezan Sovereign Fund, Meezan Capital Protected Fund (MCPF-II) and KSE Meezan Index Fund. The total funds under management of Al Meezan, the only full fledged Shariah compliant asset management company in Pakistan, have reached Rs. 48.1 billion as on August 31, 2013. With AM2 rating which denotes high management quality, the company clearly stays well ahead of all its competitors in the Islamic asset management market in Pakistan. August, 2013 Money Market Review The money market continued to stay liquid this month with the direction of SBP’s Rs. 725 billion worth of OMOs at a weighted average yield of 8.55% (Mop ups) evidencing the same. The KIBORs moved in a diverging direction though with the 3MK closing 5bps higher at 9.06% and the 6MK closing 7bps higher at 9.15%; the main reason for this increase were the market expectations regarding a probable hike in discount rate in the upcoming bi-monthly monetary policy statement (MPS). Activity in the Ijarah market remained volatile with every delay in the announcement of the MPS. Moreover, two T-bill auctions were conducted during the month whereby in total, Rs. 213 billion was accepted against a participation of Rs.221 billion with major acceptance in the 3 months T-bills (Rs. 197 billion in total at cut off yields of 8.99% and 8.96%); once again, participation remained higher in shorter tenors due to DR increase expectations. A PIB auction was also conducted whereby Rs. 30 billion was accepted against a participation of Rs. 35 billion with major acceptance in the 5 years category (Rs. 13.5 billion at a cut-off yield of 11.65%). On the forex front, the rupee continued to lose considerable value; in the interbank market it closed Rs. 2.72 weaker at Rs. 104.57/$ while in the open market, it closed Rs. 2.20 weaker at Rs. 104.80/$. 6 Month KIBOR Disclaimer This publication is for informational purpose only and nothing herein should be construed as a solicitation, recommendation or an offer to buy or sell any fund. All investments in mutual funds are subject to market risk. The NAV based prices of units and any dividends/returns thereon are dependent on force and factors affecting the capital markets. These may go up or down based on market conditions. Past performance is not necessarily indicative of future results. (This report has been prepared in line with MUFAP’s recommended Format) 21,200 22,000 22,800 23,600 24,400 0 200 400 600 800 1-Aug 7-Aug 15-Aug 20-Aug 23-Aug 28-Aug Vol (mn) (LHS) Index (RHS) 30- Aug 8.80 8.90 9.00 9.10 9.20 9.30 9.40 1-Aug 6-Aug 13-Aug 19-Aug 22-Aug 27-Aug 30-Aug
Transcript of AL Meezan Investment Management Limited Fund … Meezan Investment Management LimitedFund...

0
\
Fund Managers’ Report AL Meezan Investment Management Limited
Stock Market Review
KSE-100 declined by 5% during the month of Aug 2013 to close at
the level of 22,161. Market fell owing to concerns due to rising oil
prices, worsening geopolitical developments, weak corporate
results and high leverage of market participants. Foreign net flows
remained positive at US$28mn (vs. US$115mn outflow in July)
despite the regional sell-off. However, volumes fell to a four month
low of 20% MoM to a daily average of 200mn shares and value
traded declined 20%MoM to US$85mn.
Corporate results came in lower than expected for major
corporations with the exception of results of companies in the
electricity sector. Earnings of the listed Exploration (E&P)
Companies missed analysts’ estimates, while results of certain Oil
Marketing Companies and Banks also came in weaker than
expected. Over the month outperforming sectors remained
Electricity and Banks while underperforming sectors were Oil and
Gas and Cements.
Key triggers going forward will be 1) IMF loan approval for Pakistan
in its Sep 4th board meeting 2)Pending Congress approval to US for
Syrian attack, 3) Intact of cement cartel and 4) CPI inflation
numbers for Aug and 5) upcoming monetary policy meeting on Sep
13, 2013.
KSE-100 Index Performance
Al Meezan Investments, the company in operation since 1995, has one of the longest track record of managing mutual funds in the private sector
in Pakistan. Al Meezan Investments manages nine mutual funds; namely Al Meezan Mutual Fund, Meezan Balanced Fund, Meezan Islamic Fund,
Meezan Islamic Income Fund, Meezan Tahaffuz Pension Fund, Meezan Cash Fund, Meezan Sovereign Fund, Meezan Capital Protected Fund
(MCPF-II) and KSE Meezan Index Fund.
The total funds under management of Al Meezan, the only full fledged Shariah compliant asset management company in Pakistan, have reached
Rs. 48.1 billion as on August 31, 2013. With AM2 rating which denotes high management quality, the company clearly stays well ahead of all its
competitors in the Islamic asset management market in Pakistan.
August, 2013
Money Market Review
The money market continued to stay liquid this month with the
direction of SBP’s Rs. 725 billion worth of OMOs at a weighted
average yield of 8.55% (Mop ups) evidencing the same. The KIBORs
moved in a diverging direction though with the 3MK closing 5bps
higher at 9.06% and the 6MK closing 7bps higher at 9.15%; the main
reason for this increase were the market expectations regarding a
probable hike in discount rate in the upcoming bi-monthly monetary
policy statement (MPS).
Activity in the Ijarah market remained volatile with every delay in the
announcement of the MPS. Moreover, two T-bill auctions were
conducted during the month whereby in total, Rs. 213 billion was
accepted against a participation of Rs.221 billion with major
acceptance in the 3 months T-bills (Rs. 197 billion in total at cut off
yields of 8.99% and 8.96%); once again, participation remained
higher in shorter tenors due to DR increase expectations. A PIB
auction was also conducted whereby Rs. 30 billion was accepted
against a participation of Rs. 35 billion with major acceptance in the 5
years category (Rs. 13.5 billion at a cut-off yield of 11.65%).
On the forex front, the rupee continued to lose considerable value; in
the interbank market it closed Rs. 2.72 weaker at Rs. 104.57/$ while
in the open market, it closed Rs. 2.20 weaker at Rs. 104.80/$.
6 Month KIBOR
Disclaimer
This publication is for informational purpose only and nothing herein should be construed as a solicitation, recommendation or an offer to buy or sell any fund. All investments in
mutual funds are subject to market risk. The NAV based prices of units and any dividends/returns thereon are dependent on force and factors affecting the capital markets. These may go up or down based on market conditions. Past performance is not necessarily indicative of future results.
(This report has been prepared in line with MUFAP’s recommended Format)
21,200
22,000
22,800
23,600
24,400
0
200
400
600
800
1-A
ug
7-A
ug
15-A
ug
20-A
ug
23-A
ug
28-A
ug
Vol (mn) (LHS) Index (RHS)
30-
Aug
8.80
8.90
9.00
9.10
9.20
9.30
9.40
1-A
ug
6-A
ug
13-A
ug
19-A
ug
22-A
ug
27-A
ug
30-A
ug
MEEZAN ISLAMIC FUND (MIF) August, 2013
Fund Review:
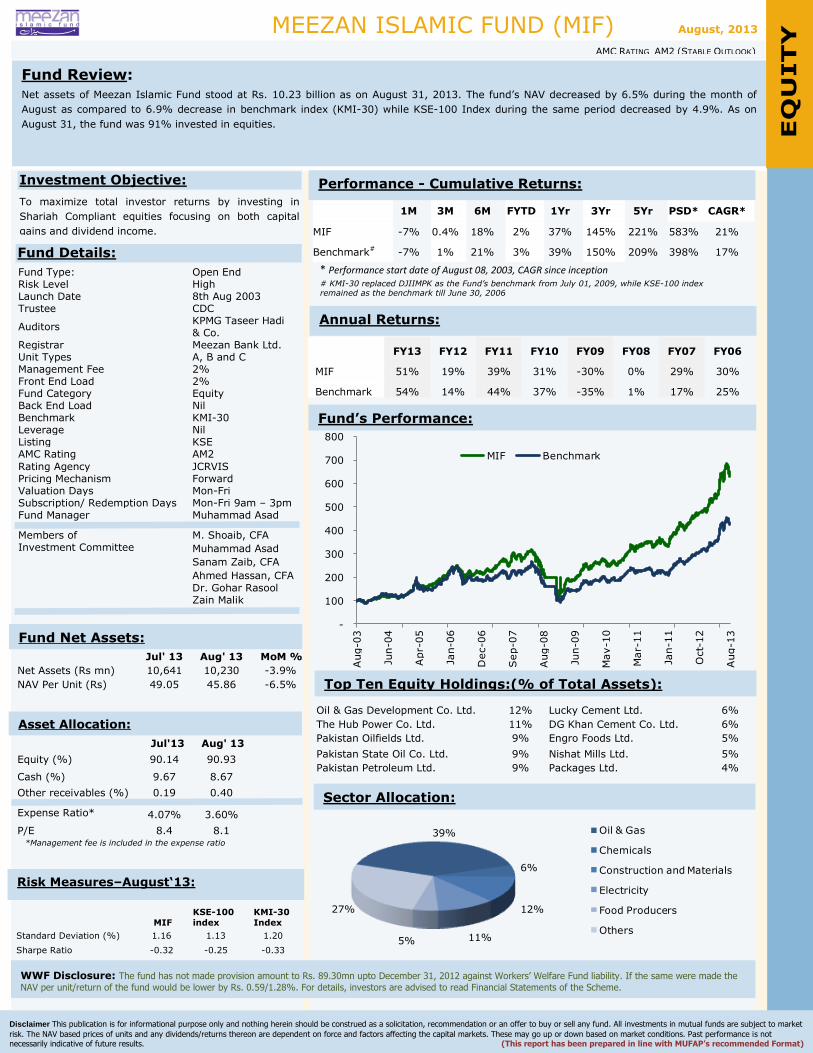
Net assets of Meezan Islamic Fund stood at Rs. 10.23 billion as on August 31, 2013. The fund’s NAV decreased by 6.5% during the month of
August as compared to 6.9% decrease in benchmark index (KMI-30) while KSE-100 Index during the same period decreased by 4.9%. As on
August 31, the fund was 91% invested in equities.
Funds Details
Disclaimer This publication is for informational purpose only and nothing herein should be construed as a solicitation, recommendation or an offer to buy or sell any fund. All investments in mutual funds are subject to market
risk. The NAV based prices of units and any dividends/returns thereon are dependent on force and factors affecting the capital markets. These may go up or down based on market conditions. Past performance is not necessarily indicative of future results. (This report has been prepared in line with MUFAP’s recommended Format)
AMC RATING AM2 (STABLE OUTLOOK)
1M 3M 6M FYTD 1Yr 3Yr 5Yr PSD* CAGR*
MIF -7% 0.4% 18% 2% 37% 145% 221% 583% 21%
Benchmark# -7% 1% 21% 3% 39% 150% 209% 398% 17%
* Performance start date of August 08, 2003, CAGR since inception # KMI-30 replaced DJIIMPK as the Fund’s benchmark from July 01, 2009, while KSE-100 index remained as the benchmark till June 30, 2006
FY13 FY12 FY11 FY10 FY09 FY08 FY07 FY06
MIF 51% 19% 39% 31% -30% 0% 29% 30%
Benchmark 54% 14% 44% 37% -35% 1% 17% 25%
Oil & Gas Development Co. Ltd. 12% Lucky Cement Ltd. 6%
The Hub Power Co. Ltd. 11% DG Khan Cement Co. Ltd. 6%
Pakistan Oilfields Ltd. 9% Engro Foods Ltd. 5%
Pakistan State Oil Co. Ltd. 9% Nishat Mills Ltd. 5%
Pakistan Petroleum Ltd. 9% Packages Ltd. 4%
Fund Type: Open End Risk Level High Launch Date 8th Aug 2003 Trustee CDC
Auditors KPMG Taseer Hadi & Co.
Registrar Meezan Bank Ltd. Unit Types A, B and C Management Fee 2% Front End Load 2% Fund Category Equity Back End Load Nil Benchmark KMI-30 Leverage Nil Listing KSE AMC Rating AM2
Rating Agency JCRVIS Pricing Mechanism Forward Valuation Days Mon-Fri Subscription/ Redemption Days Mon-Fri 9am – 3pm Fund Manager Muhammad Asad
Members of Investment Committee
M. Shoaib, CFA
Muhammad Asad
Sanam Zaib, CFA
Ahmed Hassan, CFA
Dr. Gohar Rasool Zain Malik
Investment Objective:
To maximize total investor returns by investing in
Shariah Compliant equities focusing on both capital
gains and dividend income.
Fund Details:
Jul' 13 Aug' 13 MoM %
Net Assets (Rs mn) 10,641 10,230 -3.9%
NAV Per Unit (Rs) 49.05 45.86 -6.5%
Jul'13 Aug' 13
Equity (%) 90.14 90.93
Cash (%) 9.67 8.67
Other receivables (%) 0.19 0.40
Expense Ratio* 4.07% 3.60%
P/E 8.4 8.1 *Management fee is included in the expense ratio
adf
MIF
KSE-100
index
KMI-30
Index
Standard Deviation (%) 1.16 1.13 1.20
Sharpe Ratio -0.32 -0.25 -0.33
Fund Net Assets:
Top Ten Equity Holdings:(% of Total Assets):
Annual Returns:
Performance - Cumulative Returns:
Fund’s Performance:
Sector Allocation:
EQ
UITY
qu
ity
Risk Measures–August‘13:
Asset Allocation:
WWF Disclosure: The fund has not made provision amount to Rs. 89.30mn upto December 31, 2012 against Workers’ Welfare Fund liability. If the same were made the
NAV per unit/return of the fund would be lower by Rs. 0.59/1.28%. For details, investors are advised to read Financial Statements of the Scheme.
-
100
200
300
400
500
600
700
800
Aug-0
3
Jun-0
4
Apr-
05
Jan-0
6
Dec-0
6
Sep-0
7
Aug-0
8
Jun-0
9
May-1
0
Mar-
11
Jan-1
1
Oct-
12
Aug-1
3
MIF Benchmark
39%
6%
12%
11%5%
27%
Oil & Gas
Chemicals
Construction and Materials
Electricity
Food Producers
Others

AL Meezan Mutual FUND (AMMF) August, 2013
Fund Review:
The net assets of Al Meezan Mutual Fund (AMMF) as at August 31, 2013 stood at Rs. 2.20 billion. The fund’s NAV decreased by 6.4% during the
month of August as compared to 6.9% decrease in benchmark index (KMI-30) while KSE-100 Index during the same period decreased by 4.9%.
As on August 31, the fund was 91% invested in equities.
Funds Details
Disclaimer This publication is for informational purpose only and nothing herein should be construed as a solicitation, recommendation or an offer to buy or sell any fund. All investments in mutual funds are subject to market
risk. The NAV based prices of units and any dividends/returns thereon are dependent on force and factors affecting the capital markets. These may go up or down based on market conditions. Past performance is not necessarily indicative of future results. (This report has been prepared in line with MUFAP’s recommended Format)
AMC RATING AM2 (STABLE OUTLOOK)
1M 3M 6M FYTD 1Yr 3Yr 5Yr PSD* CAGR*
AMMF -6% 0.4% 19% 2% 37% 144% 179% 1,516% 18%
Benchmark# -7% 1% 21% 3% 39% 168% 232% 1,194% 16%
* Performance start date of July 13, 1995, CAGR since inception # KMI-30 replaced DJIIMPK as the Fund’s benchmark from July 01, 2009, while KSE-100 index remained as the benchmark till June 30, 2006.
FY13 FY12 FY11 FY10 FY09 FY08 FY07 FY06
AMMF 51% 19% 38% 31% -32% 0% 27% 28%
Benchmark 54% 14% 44% 37% -35% 1% 17% 25%
Oil & Gas Development Co. Ltd. 12% DG Khan Cement Co. Ltd. 6%
The Hub Power Co. Ltd. 10% Lucky Cement Ltd. 6%
Pakistan Oilfields Ltd. 9% Packages Ltd. 5%
Pakistan Petroleum Ltd. 9% Engro Food Ltd. 5%
Pakistan State Oil Co. Ltd. 8% Fauji Fertilizer Co. Ltd. 4%
Fund Type: Open End Risk Level High Launch Date 13th Jul 1995 Trustee CDC
Auditors KPMG Taseer Hadi & Co.
Registrar Meezan Bank Ltd. Unit Types A, B,C and D Management Fee 2% Front End Load 2% Fund Category Equity Back End Load Contingent Load Benchmark KMI-30 Leverage Nil Listing ISE AMC Rating AM2
Rating Agency JCRVIS Pricing Mechanism Forward Valuation Days Mon-Fri Subscription/ Redemption Days Mon-Fri 9am – 3pm Fund Manager Dr. Gohar Rasool
Members of Investment Committee
M. Shoaib, CFA
Muhammad Asad
Sanam Zaib, CFA
Ahmed Hassan, CFA
Dr. Gohar Rasool Zain Malik
Investment Objective:
The objective of Al Meezan Mutual Fund is to optimize
the total investment returns, both capital gains and
dividend income, through prudent investment
management.
Fund Details:
Jul' 13 Aug' 13 MoM %
Net Assets (Rs mn) 2,300 2,190 -4.8%
NAV Per Unit (Rs) 13.79 12.90 -6.4%
Jul' 13 Aug' 13
Equity (%) 90.06 90.92
Cash (%) 9.48 8.53
Other receivables (%) 0.46 0.55
Expense Ratio* 4.33 3.30
*Management fee is included in the expense ratio
Fund Net Assets:
Top Ten Equity Holdings:(% of Total Assets):
Annual Returns:
Performance - Cumulative Returns:
Investment Growth from FY 1996 - to Date
Sector Allocation:
EQ
UITY
qu
ity
Asset Allocation:
AMMF
KSE-100
index
KMI-30
Index
Standard Deviation (%) 1.16 1.13 1.20
Sharpe Ratio -0.32 -0.25 -0.33
Risk Measures – August‘13:
WWF Disclosure: The fund has not made provision amount to Rs. 24.53mn upto December 31, 2012 against Workers’ Welfare Fund liability. If the same were made the
NAV per unit/return of the fund would be lower by Rs. 0.18/1.40% . For details, investors are advised to read Financial Statements of the Scheme.
100,000
122,800
1,172,192
487,122
968,549
1,616,270
-
200,000
400,000
600,000
800,000
1,000,000
1,200,000
1,400,000
1,600,000
1,800,000
June 9
6
June 0
2
June 0
8
Sep 1
1
Mar
12
Sep 1
2
Mar
13
Conversion from close end
Aug
13
39%
6%
12%
11%6%
27%
Oil & Gas
Chemicals
Construction and Materials
Electricity
General Industrials
Others

MEEZAN ISLAMIC INCOME FUND (MIIF) August, 2013
Fund Review
Net assets of Meezan Islamic Income Fund (MIIF) stood at Rs. 2.9 billion as on August 31, 2013. MIIF has provided an annualized return of
5.29% for the month of August as compared to its benchmark which has provided an annualized return of 5.09% during the same period.
Funds Details
Disclaimer This publication is for informational purpose only and nothing herein should be construed as a solicitation, recommendation or an offer to buy or sell any fund. All investments in mutual funds are subject to market
risk. The NAV based prices of units and any dividends/returns thereon are dependent on force and factors affecting the capital markets. These may go up or down based on market conditions. Past performance is not necessarily indicative of future results. (This report has been prepared in line with MUFAP’s recommended Format)
AMC RATING AM2 (STABLE OUTLOOK)
1M 3M 6M FYTD 1Yr 3Yr 5Yr PSD*
MIIF 5.29% 9.22% 10.88% 7.21% 14.39% 12.35% 12.46% 13.32%
Benchmark 5.09% 5.08% 5.04% 5.09% 5.47% 5.78% 5.85% 5.83%
* Performance start date of Jan 15, 2007
FY13 FY12 FY11 FY10 FY09 FY08 FY07 FY06
MIIF 14.45% 7.79% 11.77% 7.31% 10.14% 9.28% 10.07%* -
Benchmark 5.54% 6.02% 5.88% 5.80% 6.12% 5.75% 5.00% -
* 163 days of operations
GoP Ijarah Sukuk XIV 12.15% GoP Ijarah Sukuk XII 3.38%
KAPCO (Commercial Paper) 7.60% Maple Leaf Sukuk –I 3.10%
GoP Ijarah Sukuk XIII 7.59% Eden Housing Ltd. 2.22%
Engro Fertilizer Ltd. 5.90% GoP Ijarah Sukuk VIII 2.03%
GoP Ijarah Sukuk IX 5.74% Eden Builders Limited 0.30%
Jul’13 Aug’13
Sukuks 13% 12%
Government backed / Guaranteed Securities 33% 31%
Cash 43% 48%
Commercial Paper 8% 8%
Others Including receivables 3% 1%
s
Fund Type: Open End Risk Level Minimal Launch Date 15-Jan-07 Trustee CDC
Auditors KPMG Taseer Hadi & Co.
Registrar Meezan Bank Ltd. Unit Types A, B and C Management Fee 1.5% Front End Load 0.5% Fund Category Income Leverage Nil Listing KSE AMC Rating AM2 Rating Agency JCRVIS Fund Stability Rating A(f) Pricing Mechanism Forward Weighted average time to maturity
0.99 Years
Back End Load Contingent load for Type C investors
Benchmark Average bank deposit rate of three Islamic banks
Valuation Days Mon-Fri Subscription/ Redemption Days Mon-Fri 9am – 3pm Fund Manager Zain Malik
Members of Investment Committee
M. Shoaib, CFA
Muhammad Asad
Sanam Zaib, CFA
Ahmed Hassan, CFA
Dr. Gohar Rasool Zain Malik
Investment Objective: To provide investors with a high and stable rate of
current income consistent with long term preservation
of capital in a Shariah compliant way. A secondary
objective is to take advantage of opportunities to
realize capital appreciation.
Fund Details:
Jul' 13 Aug' 13 MoM %
Net Assets (Rs mn) 2,689 2,917 8.48%
NAV Per Unit (Rs) 50.59 50.82 0.45%
Top Ten Portfolio Holdings:(% of Total Assets):
Annual Returns:
Performance - Annualized Returns:
Monthly Performance:
Asset Allocation:
Details of Non Performing Investments:
Fund Net Assets:
Credit Quality of Portfolio:
IN
CO
ME
WWF Disclosure: The Scheme has maintained provisions against Workers’ Welfare Fund’s liability to the tune of
Rs.29.71mn. If the same were not made the NAV per Unit/return of the Scheme would be higher by Rs.0.61/1.19%.
For details investors are advised to read Financial Statements of the Scheme.
AAA 35.1%
AA+ 19.8%
AA 4.6%
A 26.9%
A- 5.9%
Below BBB 5.3%
Unrated 0.2%
0%
5%
10%
15%
20%
25%
Jan-13
Feb-13
Mar-
13
Apr-
13
May-13
Jun-13
Jul-
13
Aug-13
MIIF Benchmark
35%
20%
4.6%
27%
6% 5%0.2%
0%
20%
40%
AAA
AA+
AA
A A-
Belo
w B
BB
Unra
ted
Credit Quality

MEEZAN CASH FUND (MCF) August, 2013
Fund Review
Net assets of Meezan Cash Fund (MCF) stood at Rs. 6.4 billion as at August 31, 2013. MCF has provided an annualized return of 7.21% for the
month of August as compared to its benchmark which has provided an annualized return of 6.41% during the same period.
Funds Details
Disclaimer This publication is for informational purpose only and nothing herein should be construed as a solicitation, recommendation or an offer to buy or sell any fund. All investments in mutual funds are subject to market
risk. The NAV based prices of units and any dividends/returns thereon are dependent on force and factors affecting the capital markets. These may go up or down based on market conditions. Past performance is not necessarily indicative of future results. (This report has been prepared in line with MUFAP’s recommended Format)
AMC RATING AM2 (STABLE OUTLOOK)
1M 3M 6M FYTD 1Yr 3Yr 5Yr PSD*
MCF 7.21% 7.30% 7.48% 7.23% 8.24% 11.03% - 11.75%
Benchmark 6.41% 6.49% 6.56% 6.43% 6.84% 7.72% - 7.66%
* Performance start date of June 15, 2009
FY13 FY12 FY11 FY10 FY09 FY08 FY07 FY06
MCF 8.78% 10.49% 10.95% 10.09% 8.03%≠ - - -
Benchmark 6.91% 8.13% 8.24% 7.50% 7.60% - - -
≠15 days of operations
Fund Type: Open End Risk Level Minimal Launch Date 15-Jun-09 Trustee CDC
Auditors KPMG Taseer Hadi & Co.
Registrar Meezan Bank Ltd. Unit Types A, B and C Management Fee 1% Front End Load Nil Back End Load* 0.1% if redemption
within 3 days Fund Category Money Market Leverage Nil Listing ISE AMC Rating AM2 Rating Agency JCRVIS Fund Stability Rating AA (f) Pricing Mechanism Forward Weighted average time to maturity
44 Days
Benchmark Average return on 6-month Islamic bank deposits
Valuation Days Mon-Fri Subscription/ Redemption Days Mon-Fri 9am – 3pm Fund Manager Zain Malik
Members of Investment Committee
M. Shoaib, CFA
Muhammad Asad
Sanam Zaib, CFA
Ahmed Hassan, CFA
Dr. Gohar Rasool Zain Malik
Investment Objective: To seek maximum possible preservation of capital and
a reasonable rate of return via investing primarily in
liquid Shariah compliant money market and debt
securities.
Fund Details:
Jul' 13 Aug' 13 MoM %
Net Assets (Rs mn) 6,579 6,439 -2.12%
NAV Per Unit (Rs) * 50.10 50.10 0.61%
*Ex-Dividend NAV
AAA 62%
AA+ 7%
AA 29%
Rating Exposure:
Portfolio: Salient Features
Annual Returns:
Performance – Annualized Returns:
Monthly Performance:
Asset Allocation:
Fund Net Assets:
Key Benefits
Maximum Preservation of Principal Investment
High Liquidity (Redemption within two working days)
*No Sales Load (No Entry or Exit charges)
Tax Credit as per tax laws
Investment Policy and Strategy
Investments in High Grade & Liquid avenues:
Instrument/Issuer Rating : Minimum ‘AA’
Maximum Maturity of Instruments : Six Months
Average Time to Maturity of Portfolio : Three Months
Benchmark Average return on 6-month Islamic bank deposits
Portfolio Composition:
Jul’13 Aug’13
Placements with Banks and DFIs 15% 15%
Commercial Paper 3% 3%
Government Guaranteed 41% 42%
Cash 39% 37%
Other Including receivables 2% 3%
M
ON
EY
MA
RK
ET
WWF Disclosure: The Scheme has maintained provisions against Workers’ Welfare Fund’s liability to the tune of
Rs.47.62mn. If the same were not made the NAV per Unit/return of the Scheme would be higher by Rs.0.37/0.73%.
For details investors are advised to read Financial Statements of the Scheme.
0%
2%
4%
6%
8%
10%
Jan-13
Feb-13
Mar-
13
Apr-
13
May-13
Jun-13
Jul-
13
Aug-13
MCF Benchmark
15%
37%
42%
3%3%
Placements with Banks and DFIs
Cash
Government Guaranteed
Commercial Paper
Other Including receivables
MEEZAN SOVEREIGN FUND (MSF) August, 2013
Fund Review
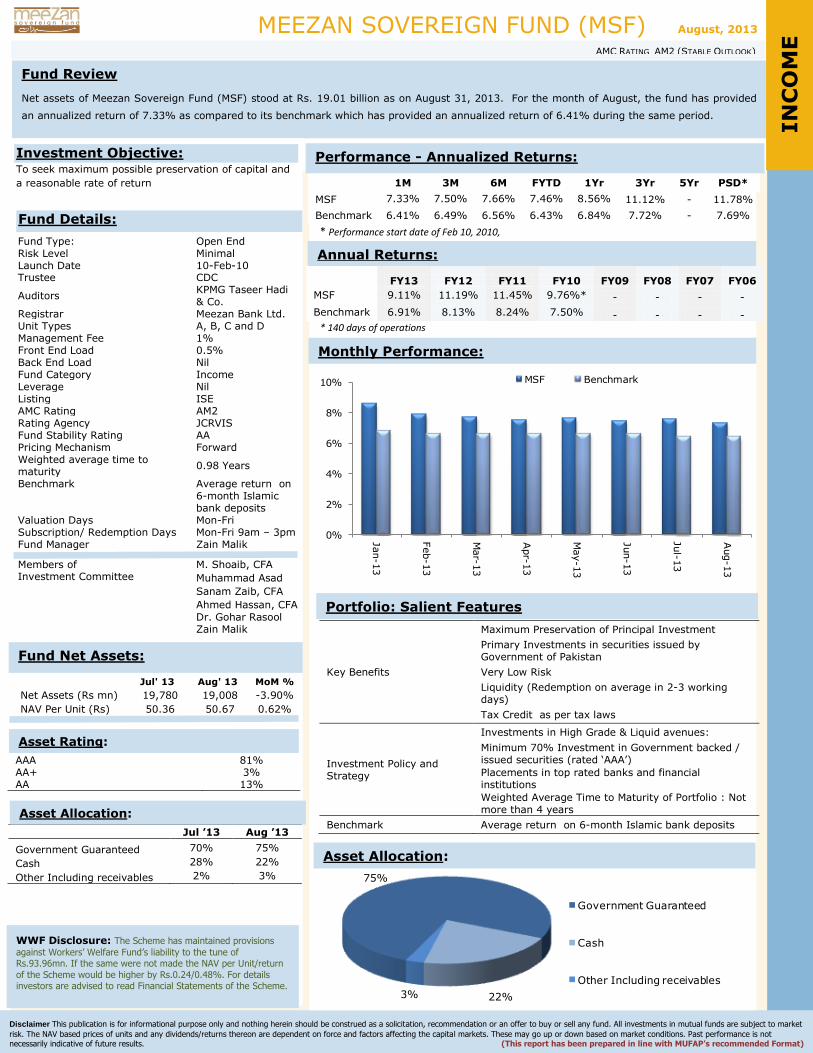
Net assets of Meezan Sovereign Fund (MSF) stood at Rs. 19.01 billion as on August 31, 2013. For the month of August, the fund has provided
an annualized return of 7.33% as compared to its benchmark which has provided an annualized return of 6.41% during the same period.
Funds Details
Disclaimer This publication is for informational purpose only and nothing herein should be construed as a solicitation, recommendation or an offer to buy or sell any fund. All investments in mutual funds are subject to market
risk. The NAV based prices of units and any dividends/returns thereon are dependent on force and factors affecting the capital markets. These may go up or down based on market conditions. Past performance is not necessarily indicative of future results. (This report has been prepared in line with MUFAP’s recommended Format)
AMC RATING AM2 (STABLE OUTLOOK)
1M 3M 6M FYTD 1Yr 3Yr 5Yr PSD*
MSF 7.33% 7.50% 7.66% 7.46% 8.56% 11.12% - 11.78%
Benchmark 6.41% 6.49% 6.56% 6.43% 6.84% 7.72% - 7.69%
* Performance start date of Feb 10, 2010,
FY13 FY12 FY11 FY10 FY09 FY08 FY07 FY06
MSF 9.11% 11.19% 11.45% 9.76%* - - - -
Benchmark 6.91% 8.13% 8.24% 7.50% - - - -
* 140 days of operations
Fund Type: Open End Risk Level Minimal Launch Date 10-Feb-10 Trustee CDC
Auditors KPMG Taseer Hadi & Co.
Registrar Meezan Bank Ltd. Unit Types A, B, C and D Management Fee 1% Front End Load 0.5% Back End Load Nil Fund Category Income Leverage Nil Listing ISE AMC Rating AM2 Rating Agency JCRVIS Fund Stability Rating AA Pricing Mechanism Forward Weighted average time to maturity
0.98 Years
Benchmark Average return on 6-month Islamic bank deposits
Valuation Days Mon-Fri Subscription/ Redemption Days Mon-Fri 9am – 3pm Fund Manager Zain Malik
Members of Investment Committee
M. Shoaib, CFA
Muhammad Asad
Sanam Zaib, CFA
Ahmed Hassan, CFA
Dr. Gohar Rasool Zain Malik
Investment Objective: To seek maximum possible preservation of capital and
a reasonable rate of return
Fund Details:
Jul' 13 Aug' 13 MoM %
Net Assets (Rs mn) 19,780 19,008 -3.90%
NAV Per Unit (Rs) 50.36 50.67 0.62%
AAA 81% AA+ 3% AA 13%
Jul ’13 Aug ’13
Government Guaranteed 70% 75%
Cash 28% 22%
Other Including receivables 2% 3%
Asset Rating:
Portfolio: Salient Features
Annual Returns:
Performance - Annualized Returns:
Monthly Performance:
Asset Allocation:
Fund Net Assets:
Key Benefits
Maximum Preservation of Principal Investment
Primary Investments in securities issued by Government of Pakistan
Very Low Risk
Liquidity (Redemption on average in 2-3 working days)
Tax Credit as per tax laws
Investment Policy and Strategy
Investments in High Grade & Liquid avenues:
Minimum 70% Investment in Government backed / issued securities (rated ‘AAA’)
Placements in top rated banks and financial institutions
Weighted Average Time to Maturity of Portfolio : Not more than 4 years
Benchmark Average return on 6-month Islamic bank deposits
Asset Allocation:
IN
CO
ME
WWF Disclosure: The Scheme has maintained provisions
against Workers’ Welfare Fund’s liability to the tune of Rs.93.96mn. If the same were not made the NAV per Unit/return
of the Scheme would be higher by Rs.0.24/0.48%. For details investors are advised to read Financial Statements of the Scheme.
0%
2%
4%
6%
8%
10%
Jan-13
Feb-13
Mar-
13
Apr-
13
May-13
Jun-13
Jul-
13
Aug-13
MSF Benchmark
75%
22%3%
Government Guaranteed
Cash
Other Including receivables
MEEZAN CAPITAL PROTECTED FUND (MCPF-II) August, 2013
Fund Review:
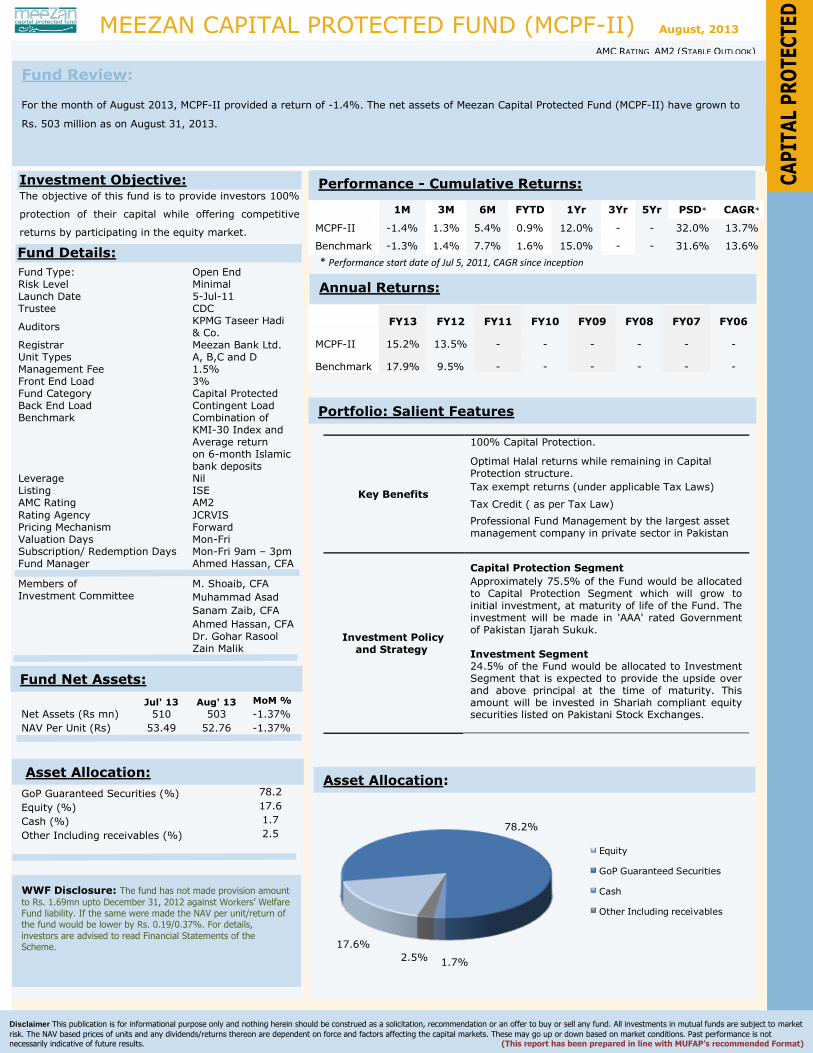
For the month of August 2013, MCPF-II provided a return of -1.4%. The net assets of Meezan Capital Protected Fund (MCPF-II) have grown to
Rs. 503 million as on August 31, 2013.
Funds Details
Disclaimer This publication is for informational purpose only and nothing herein should be construed as a solicitation, recommendation or an offer to buy or sell any fund. All investments in mutual funds are subject to market
risk. The NAV based prices of units and any dividends/returns thereon are dependent on force and factors affecting the capital markets. These may go up or down based on market conditions. Past performance is not necessarily indicative of future results. (This report has been prepared in line with MUFAP’s recommended Format)
AMC RATING AM2 (STABLE OUTLOOK)
1M 3M 6M FYTD 1Yr 3Yr 5Yr PSD* CAGR*
MCPF-II -1.4% 1.3% 5.4% 0.9% 12.0% - - 32.0% 13.7%
Benchmark -1.3% 1.4% 7.7% 1.6% 15.0% - - 31.6% 13.6%
* Performance start date of Jul 5, 2011, CAGR since inception
FY13 FY12 FY11 FY10 FY09 FY08 FY07 FY06
MCPF-II 15.2% 13.5% - - - - - -
Benchmark 17.9% 9.5% - - - - - -
Fund Type: Open End Risk Level Minimal Launch Date 5-Jul-11 Trustee CDC
Auditors KPMG Taseer Hadi & Co.
Registrar Meezan Bank Ltd. Unit Types A, B,C and D Management Fee 1.5% Front End Load 3% Fund Category Capital Protected Back End Load Contingent Load Benchmark Combination of
KMI-30 Index and Average return on 6-month Islamic bank deposits
Leverage Nil Listing ISE AMC Rating AM2
Rating Agency JCRVIS Pricing Mechanism Forward Valuation Days Mon-Fri Subscription/ Redemption Days Mon-Fri 9am – 3pm Fund Manager Ahmed Hassan, CFA
Members of Investment Committee
M. Shoaib, CFA
Muhammad Asad
Sanam Zaib, CFA
Ahmed Hassan, CFA
Dr. Gohar Rasool Zain Malik
Investment Objective: The objective of this fund is to provide investors 100%
protection of their capital while offering competitive
returns by participating in the equity market.
Fund Details:
Jul' 13 Aug' 13 MoM %
Jul' 11
Net Assets (Rs mn) 510 503 -1.37% 306
NAV Per Unit (Rs) 53.49 52.76 -1.37% 50.28
GoP Guaranteed Securities (%)
78.2
Equity (%)
17.6
Cash (%)
1.7
Other Including receivables (%)
2.5
Annual Returns:
Performance - Cumulative Returns:
Portfolio: Salient Features
Asset Allocation:
Key Benefits
100% Capital Protection.
Optimal Halal returns while remaining in Capital Protection structure.
Tax exempt returns (under applicable Tax Laws)
Tax Credit ( as per Tax Law)
Professional Fund Management by the largest asset management company in private sector in Pakistan
Investment Policy and Strategy
Capital Protection Segment
Approximately 75.5% of the Fund would be allocated to Capital Protection Segment which will grow to initial investment, at maturity of life of the Fund. The investment will be made in 'AAA' rated Government of Pakistan Ijarah Sukuk. Investment Segment 24.5% of the Fund would be allocated to Investment Segment that is expected to provide the upside over and above principal at the time of maturity. This amount will be invested in Shariah compliant equity securities listed on Pakistani Stock Exchanges.
Fund Net Assets:
Asset Allocation: C
AP
ITA
L P
RO
TEC
TED
WWF Disclosure: The fund has not made provision amount
to Rs. 1.69mn upto December 31, 2012 against Workers’ Welfare Fund liability. If the same were made the NAV per unit/return of the fund would be lower by Rs. 0.19/0.37%. For details,
investors are advised to read Financial Statements of the Scheme. 17.6%
78.2%
1.7%2.5%
Equity
GoP Guaranteed Securities
Cash
Other Including receivables
MEEZAN TAHAFFUZ PENSION FUND (MTPF) August, 2013
Fund Review:
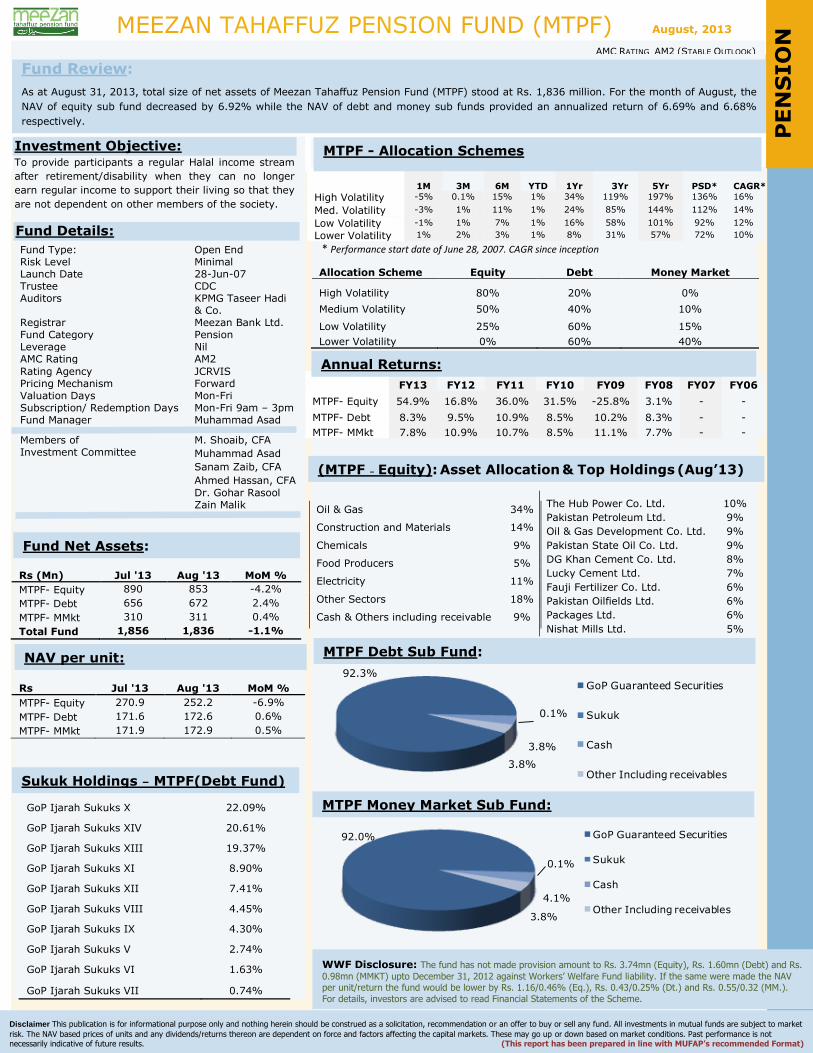
As at August 31, 2013, total size of net assets of Meezan Tahaffuz Pension Fund (MTPF) stood at Rs. 1,836 million. For the month of August, the
NAV of equity sub fund decreased by 6.92% while the NAV of debt and money sub funds provided an annualized return of 6.69% and 6.68%
respectively.
Funds Details
Disclaimer This publication is for informational purpose only and nothing herein should be construed as a solicitation, recommendation or an offer to buy or sell any fund. All investments in mutual funds are subject to market
risk. The NAV based prices of units and any dividends/returns thereon are dependent on force and factors affecting the capital markets. These may go up or down based on market conditions. Past performance is not necessarily indicative of future results. (This report has been prepared in line with MUFAP’s recommended Format)
AMC RATING AM2 (STABLE OUTLOOK)
1M 3M 6M YTD 1Yr 3Yr 5Yr PSD* CAGR*
High Volatility -5% 0.1% 15% 1% 34% 119% 197% 136% 16%
Med. Volatility -3% 1% 11% 1% 24% 85% 144% 112% 14%
Low Volatility -1% 1% 7% 1% 16% 58% 101% 92% 12%
Lower Volatility 1% 2% 3% 1% 8% 31% 57% 72% 10%
* Performance start date of June 28, 2007. CAGR since inception
Allocation Scheme Equity Debt Money Market
High Volatility 80% 20% 0%
Medium Volatility 50% 40% 10%
Low Volatility 25% 60% 15%
Lower Volatility 0% 60% 40%
FY13 FY12 FY11 FY10 FY09 FY08 FY07 FY06
MTPF- Equity 54.9% 16.8% 36.0% 31.5% -25.8% 3.1% - -
MTPF- Debt 8.3% 9.5% 10.9% 8.5% 10.2% 8.3% - -
MTPF- MMkt 7.8% 10.9% 10.7% 8.5% 11.1% 7.7% - -
Fund Type: Open End Risk Level Minimal Launch Date 28-Jun-07 Trustee CDC Auditors KPMG Taseer Hadi
& Co. Registrar Meezan Bank Ltd. Fund Category Pension Leverage Nil AMC Rating AM2
Rating Agency JCRVIS Pricing Mechanism Forward Valuation Days Mon-Fri Subscription/ Redemption Days Mon-Fri 9am – 3pm Fund Manager Muhammad Asad
Members of Investment Committee
M. Shoaib, CFA
Muhammad Asad
Sanam Zaib, CFA
Ahmed Hassan, CFA
Dr. Gohar Rasool Zain Malik
Rs (Mn) Jul '13 Aug '13 MoM %
MTPF- Equity 890 853 -4.2%
MTPF- Debt 656 672 2.4%
MTPF- MMkt 310 311 0.4%
Total Fund 1,856 1,836 -1.1%
Rs Jul '13 Aug '13 MoM %
MTPF- Equity 270.9 252.2 -6.9%
MTPF- Debt 171.6 172.6 0.6%
MTPF- MMkt 171.9 172.9 0.5%
Investment Objective: To provide participants a regular Halal income stream
after retirement/disability when they can no longer
earn regular income to support their living so that they
are not dependent on other members of the society.
Fund Details:
NAV per unit:
Annual Returns:
(MTPF – Equity): Asset Allocation & Top Holdings (Aug’13)
MTPF Debt Sub Fund:
Sukuk Holdings – MTPF(Debt Fund)
GoP Ijarah Sukuks X 22.09%
GoP Ijarah Sukuks XIV 20.61%
GoP Ijarah Sukuks XIII 19.37%
GoP Ijarah Sukuks XI 8.90%
GoP Ijarah Sukuks XII 7.41%
GoP Ijarah Sukuks VIII 4.45%
GoP Ijarah Sukuks IX 4.30%
GoP Ijarah Sukuks V 2.74%
GoP Ijarah Sukuks VI 1.63%
GoP Ijarah Sukuks VII 0.74%
MTPF Money Market Sub Fund:
P
EN
SIO
N
Fund Net Assets:
MTPF - Allocation Schemes
WWF Disclosure: The fund has not made provision amount to Rs. 3.74mn (Equity), Rs. 1.60mn (Debt) and Rs.
0.98mn (MMKT) upto December 31, 2012 against Workers’ Welfare Fund liability. If the same were made the NAV per unit/return the fund would be lower by Rs. 1.16/0.46% (Eq.), Rs. 0.43/0.25% (Dt.) and Rs. 0.55/0.32 (MM.).
For details, investors are advised to read Financial Statements of the Scheme.
The Hub Power Co. Ltd. 10%
Pakistan Petroleum Ltd. 9%
Oil & Gas Development Co. Ltd. 9%
Pakistan State Oil Co. Ltd. 9%
DG Khan Cement Co. Ltd. 8%
Lucky Cement Ltd. 7%
Fauji Fertilizer Co. Ltd. 6%
Pakistan Oilfields Ltd. 6%
Packages Ltd. 6%
Nishat Mills Ltd. 5%
Oil & Gas 34%
Construction and Materials 14%
Chemicals 9%
Food Producers 5%
Electricity 11%
Other Sectors 18%
Cash & Others including receivable 9%
92.3%
0.1%
3.8%
3.8%
GoP Guaranteed Securities
Sukuk
Cash
Other Including receivables
92.0%
0.1%
4.1%
3.8%
GoP Guaranteed Securities
Sukuk
Cash
Other Including receivables

KSE-MEEZAN INDEX FUND (KMIF) August, 2013
AMC RATING AM2 (STABLE OUTLOOK)
Fund Review:
The fund was launched on May 23, 2012. As at August 31, the net assets of KSE-Meezan Index Fund (KMIF) stood at Rs. 925 million. For the
month of August 2013, KMIF provided a return of -6.9%.
Disclaimer This publication is for informational purpose only and nothing herein should be construed as a solicitation, recommendation or an offer to buy or sell any fund. All investments in mutual funds are subject to market
risk. The NAV based prices of units and any dividends/returns thereon are dependent on force and factors affecting the capital markets. These may go up or down based on market conditions. Past performance is not necessarily indicative of future results. (This report has been prepared in line with MUFAP’s recommended Format)
1M 3M 6M FYTD 1Yr 3Yr 5Yr PSD*
KMIF -6.9% 0.2% 18.8% 3.0% 35.0% - - 50.5%
Benchmark -6.9% 0.8% 21.0% 3.4% 39.3% - - 56.7%
* Performance start date of May 23, 2012.
FY13 FY12 FY11 FY10 FY09 FY08 FY07 FY06
KMIF 49.6% -2.4%* - - - - - -
Benchmark 54.4% -1.9% - - - - - -
* 38 days of operations.
Pakistan Petroleum Ltd. 13% Lucky Cement Ltd. 6%
Oil & Gas Development Co. Ltd. 12% Pakistan State Oil Co. Ltd. 5%
The Hub Power Co. Ltd. 11% DG Khan Cement Co. Ltd. 4%
Pakistan Oilfields Ltd. 10% Karachi Electric Supply Corp. Ltd. 3%
Fauji Fertilizer Co. Ltd. 10% Nishat Mills Ltd. 3%
Fund Type: Open End Risk Level High Launch Date 23-May-12 Trustee CDC
Auditors KPMG Taseer Hadi & Co.
Registrar Meezan Bank Ltd. Unit Types A and B Management Fee 1% Front End Load 2% Fund Category Index Tracker Scheme Back End Load Nil Leverage Nil Listing ISE AMC Rating AM2
Rating Agency JCRVIS Pricing Mechanism Forward Benchmark KMI-30 Index Valuation Days Mon-Fri Subscription/ Redemption Days Mon-Fri 9am – 1pm Fund Manager Dr. Gohar Rasool
Members of Investment Committee
M. Shoaib, CFA
Muhammad Asad
Sanam Zaib, CFA
Ahmed Hassan, CFA
Dr. Gohar Rasool Zain Malik
Investment Objective: KSE Meezan Index Fund (KMIF) is a Shariah Compliant
Index Fund that aims to provide investors an
opportunity to track closely the performance of the
KSE-Meezan Index 30 (KMI 30) by investing in
companies of the Index in proportion to their
weightages.
Performance - Cumulative Returns:
Annual Returns:
Fund Net Assets:
Asset Allocation:
Fund Details:
WWF Disclosure: The fund has not made provision amount
to Rs. 1.03mn upto December 31, 2012 against Workers’ Welfare
Fund liability. If the same were made the NAV per unit/return of the fund would be lower by Rs. 0.08/0.14%. For details, investors
are advised to read Financial Statements of the Scheme.
Jul' 13 Aug' 13 MoM %
Jul' 11
Net Assets (Rs mn) 999 925 -7.34% 306
NAV Per Unit (Rs)* 63.71 59.30 -6.92% 50.28
*Ex-Dividend NAV
IN
DEX
TR
AC
KER
Fund’s Performance:
Top Ten Equity Holdings:(% of Total Assets):
90
100
110
120
130
140
150
160
170
180M
ay-12
Jun-12
Jul-
12
Aug-12
Sep-12
Oct-
12
Nov-12
Dec-12
Jan-13
Feb-13
Mar-
13
Apr-
13
May-13
Jun-13
Jul-
13
Aug-13
KMIF Benchmark
44%
13%
12%14%3%
14%
Oil & Gas
Chemicals
Construction and Materials
Electricity
Personal Goods
Others

Meezan Financial Planning Fund of Funds (MFPFOF) August, 2013
Fund Review:
As at August 31, 2013, total size of net assets of Meezan Financial Planning Fund of Fund (MFPFOF) stood at Rs.748 million. For the month of
August, the NAV of Aggressive plan decreased by 4.8% while the NAV of moderate and Conservative plan provided an return of -3.0% and -
1.3% respectively.
Funds Details
Disclaimer This publication is for informational purpose only and nothing herein should be construed as a solicitation, recommendation or an offer to buy or sell any fund. All investments in mutual funds are subject to market
risk. The NAV based prices of units and any dividends/returns thereon are dependent on force and factors affecting the capital markets. These may go up or down based on market conditions. Past performance is not necessarily indicative of future results. (This report has been prepared in line with MUFAP’s recommended Format)
AMC RATING AM2 (STABLE OUTLOOK)
1M 3M 6M YTD 1Yr
3Yr 5Yr PSD*
Aggressive -4.8% 0.5% - 1.6% - - - 10.8%
Benchmark -4.3% 1.1% - 2.4% - - - 10.6%
Moderate -3.0% 0.9% - 1.4% - - - 8.0%
Benchmark -2.8% 1.3% - 1.8% - - - 8.0%
Conservative -1.3% 1.1% - 1.2% - - - 5.0%
Benchmark -1.0% 1.5% - 1.1% - - - 4.8%
* Performance start date of April 12, 2013.
FY13 FY12 FY11 FY10 FY09 FY08 FY07 FY06
Aggressive 9.0%* - - - - - - -
Benchmark 7.9% - - - - - - -
Moderate 6.5%* - - - - - - -
Benchmark 6.2% - - - - - - -
Conservative 3.8%* - - - - - - -
Benchmark 3.6% - - - - - - -
* 80 days of operations.
Fund Type: Open End Risk Level Plan specific Launch Date 11-April-13 Trustee CDC
Auditors KPMG Taseer Hadi & Co.
Registrar Meezan Bank Ltd. Unit Types A and B Management Fee Same as underlying Funds
and 1% on Cash
Front End Load Aggressive Plan 2.0%
Moderate Plan 1.5%
Conservative Plan 1.0%
Fund Category Fund of Funds Back End Load Nil Leverage Nil Listing - AMC Rating AM2
Rating Agency JCRVIS
Pricing Mechanism Forward
Benchmark
Aggressive Allocation Plan 65% KMI-30 & 35% 6M dep. rate*
Moderate Allocation Plan 50% KMI-30 & 50% 6M dep. rate*
Conservative Allocation Plan 20% KMI-30 & 80% 6M dep. rate*
Valuation Days Mon-Fri Subscription/ Redemption Days
Mon-Fri 9am – 1pm
Members of Investment Committee
M. Shoaib, CFA
Muhammad Asad
Sanam Zaib, CFA
Ahmed Hassan, CFA
Dr. Gohar Rasool Zain Malik
* Average return on 6-month Islamic bank deposits
Rs (Mn) Jul '13 Aug '13 MoM %
Aggressive 279 270 -3.3%
Moderate 160 157 -1.5%
Conservative 308 321 4.1%
Rs Jul '13 Aug '13 MoM%
Aggressive 56.3 53.6 -4.8%
Moderate 53.9 52.3 -3.0%
Conservative 52.5 51.9 -1.3%
Investment Objective: To generate returns on Investment as per respective
allocation plans by investing in Shariah Compliant
Fixed Income and Equity Mutual Funds in line with the
risk tolerance of the Investor.
Fund Details:
NAV per unit:
Annual Returns:
Portfolio: Salient Features
Fund Net Assets:
MFPFOF - Allocation Plan:
FU
ND
OF F
UN
DS
Investment Objective
The Aggressive Allocation Plan This Allocation Plan is suitable for Investors having a relatively higher risk tolerance and/or wish to save for long term. It shall invest at least 65% of its net assets in Shariah Compliant Equity Funds, while the remaining portion is allocated to Shariah Compliant Fixed Income Funds. The Moderate Allocation Plan. This Allocation Plan is suitable for Investors having a relatively moderate risk tolerance and/or wish to save for medium to long term. It shall invest at least 45% of its net assets in Shariah Compliant Equity Funds, while the remaining portion is allocated to Shariah Compliant Fixed Income Funds. The Conservative Allocation Plan This Allocation Plan is suitable for Investors having a relatively low risk tolerance and/or wish to save for short to medium term. It shall invest at least 20% of its net assets in Shariah Compliant Equity Funds, while the remaining portion is allocated to Shariah Compliant Fixed Income Funds.
Asset Allocation Plans (Based on specific Risk profiles)
Minimum percentage allocation invested in Collective Investment Scheme(s)
MIF (Equity) MSF (Income)
Aggressive Allocation Plan 65% 25% Moderate Allocation Plan 45% 45% Conservative Allocation Plan 20% 70%
(i) The above percentages may vary on account of market factors and
investments in Cash / Near cash instruments as permitted for the Fund of
Funds Category, as per SECP directive from time to time.
(ii) The above mentioned allocations shall be rebalanced at a frequency
described in Offering document. (iii) The Management Company may invest between 0% to 10% (both
percentages being inclusive) of the Allocation Plan in Cash/ near Cash
instruments permitted for the fund of funds category
WWF Disclosure: The Scheme has maintained provisions against Workers’ Welfare Fund’s liability
to the tune of Rs. 0.50mn (Aggressive), Rs. 0.23mn (moderate) and Rs.0.27mn (Conservative). If the same were not made the NAV per unit/return of the Scheme would be higher by Rs. 0.11/0.18%
(Aggressive), Rs. 0.08/0.15% (Moderate) and Rs. 0.05/0.09 (Conservative). For details, investors are advised to read Financial Statements of the Scheme.

Fund Review:
Net assets of Meezan Balanced Fund (MBF) as at August 31, 2013 stood at Rs. 1.59 billion. The fund’s NAV decreased by 3.8% during the month.
Funds Details
Disclaimer This publication is for informational purpose only and nothing herein should be construed as a solicitation, recommendation or an offer to buy or sell any fund. All investments in mutual funds are subject to market
risk. The NAV based prices of units and any dividends/returns thereon are dependent on force and factors affecting the capital markets. These may go up or down based on market conditions. Past performance is not necessarily indicative of future results. (This report has been prepared in line with MUFAP’s recommended Format)
1M 3M 6M FYTD 1Yr 3Yr 5Yr PSD* CAGR*
MBF -4% 0.02% 11% 2% 24% 92% 155% 277% 16%
Benchmark -3% 1% 12% 2% 22% 78% 108% 151% 11%
* Performance start date of Dec 20, 2004, CAGR since inception
FY13 FY12 FY11 FY10 FY09 FY08 FY07 FY06
MBF 32% 17% 25% 23% -11% 1% 26% 23%
Benchmark 30% 8% 25% 21% -14% 3% 11% 15%
*
Equity
Sukuk
Oil & Gas Development Co. Ltd. 7% GoP Ijarah Sukuk -XII 10%
Hub Power Co. Ltd. 6% KAPCO (Commercial Paper) 5%
Pakistan Oilfields Ltd. 6% GoP Ijarah Sukuk -IX 5%
Pakistan Petroleum Ltd. 6% GoP Ijarah Sukuk -XI 3%
Pakistan State Oil Co. Ltd. 4% Engro Sukkuk 3%
Jul’13 Aug’13 Equity 50% 50%
GoP Guaranteed Securities 19% 20%
Sukuk 3% 3%
Commercial Paper 5% 5%
Cash and Other Including receivables 23% 22%
Fund Type: Open End Risk Level Minimal Launch Date 20-Dec-2004 Trustee CDC
Auditors KPMG Taseer Hadi & Co.
Registrar THK Associates Management Fee 2% Fund Category Balanced Leverage Nil Listing KSE AMC Rating AM2
Rating Agency JCRVIS Benchmark 50% KMI-30 Index
50% Average bank Deposit rate of three Islamic banks
Fund Manager Ahmed Hassan, CFA
Members of Investment Committee
M. Shoaib, CFA
Muhammad Asad
Sanam Zaib, CFA
Ahmed Hassan, CFA
Dr. Gohar Rasool Zain Malik
Investment Objective:
The objective of Meezan Balanced Fund is to generate
long term capital appreciation as well as current
income by creating a balanced portfolio that is invested
both in high quality equity securities and Islamic
Income Instruments such as TFCs, COIs, Certificates of
Musharika, Islamic Sukuk, Ready-future hedges, and
other Shariah compliant instruments.
Fund Details:
Annual Returns:
Performance - Cumulative Returns:
Top Ten Portfolio Holdings:(% of Total Assets):
Asset Allocation:
Funds Net Asset:
MEEZAN BALANCED FUND (MBF) August, 2013
PAKISTAN’S ONLY SHARIAH-COMPLIANT BALANCED FUND
AMC RATING AM2 (STABLE OUTLOOK)
Jul' 13 Aug' 13 MoM %
Net Assets (Rs mn) 1,652 1,593 -3.60%
NAV Per Unit (Rs) 13.82 13.30 -3.77%
B
ALA
NC
ED
Sector Allocation:
WWF Disclosure: The Scheme has maintained provisions
against Workers’ Welfare Fund’s liability to the tune of Rs.20.94mn. If the same were not made the NAV per Unit/return of the Scheme would be higher by Rs.0.17/1.31%.
For details investors are advised to read Financial Statements of the Scheme.
28%7% 23%
3%
7%
32%
Sukuk
Electricity
Oil & Gas
General Industrials
Construction and Materials
Cash & others