AkzoNobel Strategy Update 2013 Tcm9-78275
87
Leading market positions delivering leading performance Ton Büchner & Keith Nichols February 20, 2013
-
Upload
waqas-sherwani -
Category
Documents
-
view
8 -
download
1
description
ok
Transcript of AkzoNobel Strategy Update 2013 Tcm9-78275
Leading market positions delivering leading performance
Ton Büchner & Keith Nichols
February 20, 2013

2 Strategy Update 2013
1. Introduction
2. Market environment
3. Group strategic update
4. Business Areas
Coffee break
5. Financial implications
6. Summary and conclusion Questions
Agenda

1. Introduction
2. Market environment
3. Group strategic update
4. Business areas
5. Financial implications
6. Summary and conclusion
1. Introduction
3 Strategy Update 2013

Our proposition: Leading market
positions delivering leading performance
4
AkzoNobel has gone through a significant amount of
strategic change over the past five years
Today, the company has
• Excellent portfolio of businesses
• Good long term growth potential on the basis of end-user segment growth
• Strong positions in high growth markets (44% of revenue)
• Leadership positions in many markets
• Clear leader in sustainability
• Track record of delivering sustainable innovations and products
• Strong brands, both in consumer and industrial markets
Clear focus to deliver on our significant potential
• Improved returns and cash flow
• Leveraging scale
• Simplification and standardization
• Continued innovation
Strategy Update 2013

5 Strategy Update 2013
AkzoNobel strategy

8.9
14.0
0
4
8
12
16
2012 2015
Return on sales
(Operating income/revenue)
%
6
Return on investment
(Operating income/average
12 months invested capital)
%
Strategy Update 2013
Net debt/EBITDA
x
New and realistic 2015 financial targets focused on quality of earnings and value creation
Assumes sales growth (CAGR) for the period of 4%
*2012 excluding impairment (€2.1 billion) and after IAS19
5.9
9.0
0
4
8
12
2012 2015
1.4
2.0
0
1
2
3
2012 2015
* * <

AkzoNobel today
7 Strategy Update 2013
• Revenue €15.4 billion
• 50,610 employees
• 44% of revenue from high growth markets
• Major producer of Paints, Coatings and
Specialty Chemicals
• Leadership positions in many markets
*2012 excluding impairment (€2.1 billion) **New definition including incidentals and after IAS19
38%
15%
47%
Performance Coatings
Decorative Paints
Specialty Chemicals
48%
8%
44% 37%
27%
36%
Revenue by
Business Area
Operating income*
by Business Area
EBITDA** by
Business Area
5.4%
Growth
2012 vs. 2011
5.9%
Return on sales
(operating income/revenue)
10.4%
EBITDA/revenue

8 Strategy Update 2013
2012 showed challenging market
conditions in most end-user segments
and geographical end markets
Key developments in 2012:
• Divestment of Decorative Paints North America
announced
• Impairment of €2.1 billion on
continued operations
• Exceeded Performance Improvement
Program intermediate targets
2013 market conditions are not expected
to improve significantly
• Focus will be on:
– Organic growth
– Operating income
– Return on capital
– Operating cash flow
• Management remuneration has been
adapted accordingly
• Continue building on our end-user segments
and strong high growth market positions
• Key management changes
2013 market conditions not expected
to improve significantly

1. Introduction
2. Market environment
3. Group strategic update
4. Business Areas
5. Financial implications
6. Summary and conclusion
2. Market environment
9 Strategy Update 2013

10 Strategy Update 2013
~43% of revenues
New Build Projects
Maintenance, Renovation and Repair
Building Products and Components
~16% of revenues
Automotive OEM, Parts and Assembly
Automotive Repair
Marine and Air Transport
~16% of revenues
Consumer Durables
Consumer Packaged Goods
~25% of revenues
Natural Resource and Energy Industries
Process Industries

Total market maintenance
and repair
$ billion, output
New non-residential
construction
$ billion, output
Residential housing
completions
Thousand units
2011 12 13 14 15 16 2011 12 13 14 15 16 2011 12 13 14 15 16
11 Strategy Update 2013
In Buildings and Infrastructure, our main market is in renovation and repair
BRIC
CAGR 13.3%
EUR & US
CAGR 3.1%
2011 = 1,557
2011 = 1,075
BRIC
CAGR 12.3%
EUR & US
CAGR 4.2%
2011 = 410
2011 = 1,222
BRIC
CAGR 0.0%
EUR & US
CAGR 0.4%
2011 = 11,845
2011 = 3,943
Source: IHS / Construction IC Source: Euromonitor International Source: IHS / Construction IC

Buildings and Infrastructure trends and implications for strategy and actions
12 Strategy Update 2013
Recent trends
Impact on strategy and
actions going forward
• Invest further in our strong positions in the
high growth markets
• Restructure proactively in mature markets,
primarily Europe
• Build re-paint culture in high growth markets
• Continuously innovate to improve
sustainability for
– Product itself
– Application
– End-use
• Market contraction
• Limited recovery
• Mortgage markets restricted
• Fewer house purchases
• High growth market outlook positive
• Lower growth in the future
• Increased demand for improved
sustainability in housing
• Some government stimulus packages
for infrastructure

2011 12 13 14 15 16
Light vehicle production
and sales
Million units
Vehicle (car) miles driven
Billion car kilometers
13 Strategy Update 2013
In Transportation, our main markets are vehicle refinish and marine
Production 2011 = 77, CAGR 4.8%
Sales 2011 = 76, CAGR 4.9%
Freight rates
ClarkSea* index $ earnings/day
2011 12 13 14 15 16
2012 avg = $9,945
West Europe 2011 = 2,741
growth 2012 = -0.3%
China 2011 = 1,120
growth 2012 = 10.2%
US 2011 = 2,550
growth 2012 = -0.7%
2006 08 10 12 14 16
Source: Historical data (through 2012) IRF / Euromonitor
International; management estimates for forward
looking data
* Weighted average of tanker, bulk carrier, container-
ship and gas carrier earnings
Source: Historical data (through 2012) Clarkson
Research Services Limited; management estimates
for forward looking data
Source: IHS

Transportation trends and implications for strategy and actions
14 Strategy Update 2013
Recent trends
Impact on strategy and
actions going forward
• Adapt value proposition and distribution
models for high growth market success
• Restructure and reconfigure in contracting
segments and geographies
• Innovate to improve functionality,
sustainability and margins
• Strengthen business models to support
our customers on the maintenance aspects
• Continued growth
• Shift to Asia in automotive
manufacture and demand
• Increasing use of lighter/
different materials
• Vehicle car park increasing,
but repair rate decreasing
• Considerable reduction in new
ship building
• Reduced maintenance spend as
shipping rates fell
• Airplane miles continuing to increase
after recession

Consumer Goods trends and implications for strategy and actions
15 Strategy Update 2013
Recent trends
Impact on strategy and
actions going forward
• Ensure both production and design presence
in high growth countries
• Manage margins and/or restructure in
lower value segments
• Improve multi-level relationships
(e.g. OEM, ODM)
• Differentiate through color, design,
and customer process improvement
• Continued growth
• Geographic shift to Asia in demand,
production and design
• Significant drop in demand in mature
markets during the recession
• Recovery muted thus far
• Different types of demand
• „Vanishing middle‟ in mature markets
• Affordable products are the focus for
growth elsewhere

Industrial trends and implications for strategy and actions
16 Strategy Update 2013
Recent trends
Impact on strategy and
actions going forward
• Adapt our structure in mature markets
• Expand production and sales force in the
high-growth markets
• Increase focus and investment in more
differentiated products
• Innovate for additional functionality and
sustainability
• Manage margins as raw materials fluctuate
Cyclical sectors but AkzoNobel
segments are on different cycles
Recession impact muted due to
strong demand in high growth countries
Particularly strong growth in oil and gas
due to high prices and feedstock shifts
Government encouragement of
investment in (renewable) energy
Pulp and paper lower growth but
more stable

High growth markets are 44% of revenue and their importance will increase
17 Strategy Update 2013
Our goal: Greater than 50% of revenues from high growth markets
% of 2012 revenue, excluding Decorative Paints North America
38%
Mature Europe
26%
Asia Pacific 2%
Middle East
and Africa
11%
Latin America
15%
North America
8%
Emerging Europe 0%
3%
6%
9%
UK Eurozone USA Latin America
China Developing Asia
2013 2014 2015
*Source: EIU: GDP year on year growth in local currency at constant prices
Three year GDP growth*

Capital expenditure
2012, 100% = €826 million (5.4% of revenue)
Capital allocation policy is focused on high growth markets and efficiency
18 Strategy Update 2013
15%
25% 58%
2%
Performance Coatings Decorative Paints
Specialty Chemicals Other
• Capital expenditure will be around 4% of revenues
going forward
• 40-50% growth related
Business
Area
Investment
project
2012 2013 2014 2015
Performance
Coatings
China
expansion
Decorative
Paints
UK
megaplant
Decorative
Paints
China
expansion
Specialty
Chemicals
Ningbo
multisite
Specialty
Chemicals
Frankfurt
membrane
Specialty
Chemicals
Brazil
Eldorado
Specialty
Chemicals
Brazil
Suzano
Major projects underway and timing of spend

121 111 108
89 87 80 79 76
52
0
25
50
75
100
125
150
India Brazil China US Germany Sweden UK Netherlands France
Consumer confidence impacts three of our segments
19 Strategy Update 2013
Consumer confidence
Q4 2012
Source: Nielsen, Consumer confidence figures below 100 demonstrate some degree of pessimism
Recent trends

20 Strategy Update 2013
Purchase Managers’ Index (PMI) shows a clear change in trend in Q4 2011
Source: JP Morgan
PMI
40
45
50
55
60
Dec-09 Dec-10 Dec-11 Dec-12
Global Eurozone US China Brazil
• US, China, India
and Brazil indicate
expansion of
manufacturing
• Eurozone indicates
further contraction
• PMI is a good
indicator for our
Industrial segment
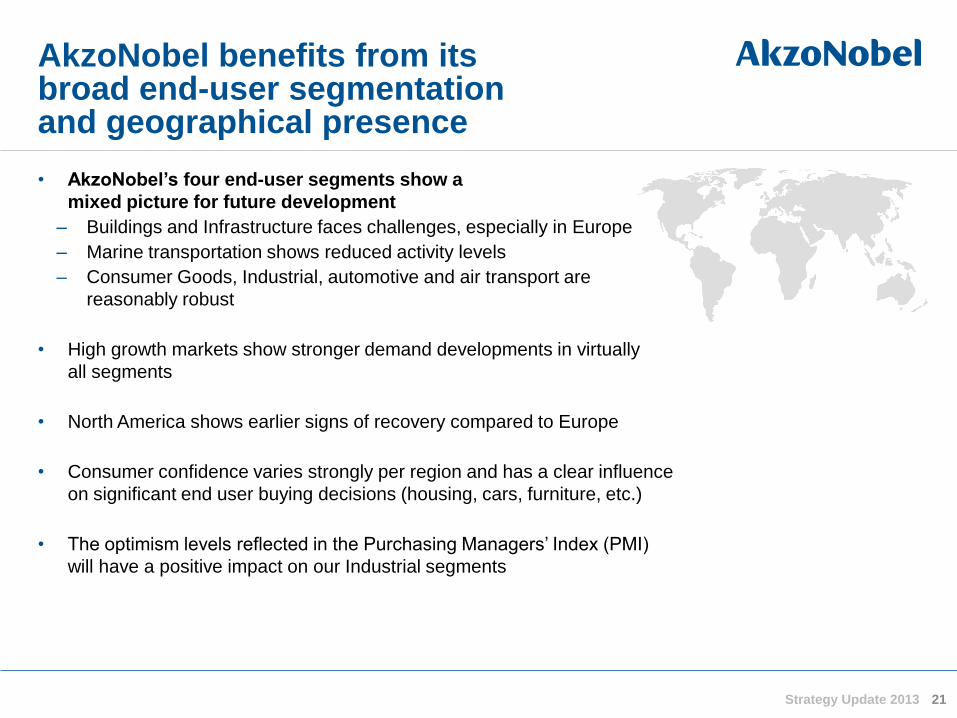
AkzoNobel benefits from its broad end-user segmentation and geographical presence
21 Strategy Update 2013
• AkzoNobel’s four end-user segments show a
mixed picture for future development
– Buildings and Infrastructure faces challenges, especially in Europe
– Marine transportation shows reduced activity levels
– Consumer Goods, Industrial, automotive and air transport are
reasonably robust
• High growth markets show stronger demand developments in virtually
all segments
• North America shows earlier signs of recovery compared to Europe
• Consumer confidence varies strongly per region and has a clear influence
on significant end user buying decisions (housing, cars, furniture, etc.)
• The optimism levels reflected in the Purchasing Managers‟ Index (PMI)
will have a positive impact on our Industrial segments

1. Introduction
2. Market environment
3. Group strategic update
4. Business Areas
5. Financial implications
6. Summary and conclusion
3. Group strategic update
22 Strategy Update 2013

The vision and new targets
23
Vision: Leading market positions delivering leading performance
To be a leader in:
• Operating efficiency and customer service
• Innovation
• Sustainability
New targets
• Return on sales (ROS, operating income/revenue)
• Return on investment (ROI, operating income/average 12 months invested capital)
• Carbon emissions across the value chain
• Eco-premium products
Strategy Update 2013

24 Strategy Update 2013
AkzoNobel strategy

25 Strategy Update 2013
We will drive five strategic focus areas
1. Care for the customer
3. Focus on cash and return on investment
4. Embedded safety and sustainability
5. Diverse and inclusive talent development
1. Care for the customer
2. Reduction of product
and process complexity
3. Cash and return
on investment
4. Embedded safety
and sustainability
5. Diverse and inclusive
talent development

26 Strategy Update 2013
Core processes Process owner
The company core processes will support our strategic focus areas
Integrated Supply Chain (HSE)
CEO/CFO
Integrated Supply Chain
(Operations)
RDI
Integrated Supply Chain
(Procurement)
HR
Behavior-based and process safety
Operational control cycle
Continuous improvement
Innovation
Procurement
Talent management

27 Strategy Update 2013
Actions
> Grow organically
> Innovate
> Standardize
> Simplify
> Continuously improve
> Deliver dependably

28 Strategy Update 2013
Strategy on a page
Strategic focus areas
• Care for the customer
• Reduction of product
and process complexity
• Cash and return on
investment
• Embedded safety
and sustainability
• Diverse and inclusive
talent development
Processes
• Behavior-based
and process safety
• Operational
control cycle
• Continuous
improvement
• Innovation
• Procurement
• Talent management
Actions
• Deliver dependably
• Grow organically
• Innovate
• Simplify
• Standardize
• Continuously
improve
End-user segmentation
• Buildings and
Infrastructure
• Transportation
• Consumer Goods
• Industrial

Our sustainability strategy: Creating more value with fewer resources
29 Strategy Update 2013 29
More customer value in our end-user segmentation
Resource scarcity across the value chain will create opportunities
Scope 3 upstream
Raw materials
Scope 1 and 2
Own operations,
including energy use
Scope 3 downstream
Customer operations End-user End of life
Scope 4 Energy/ resource benefits in use

30 Strategy Update 2013
• „Downstream eco-premium solutions’:
20% of our revenues by 2020
We will increase the revenue from solutions
that generate direct resource and energy benefits
for our customers, consumers and users
• Reduction of carbon emissions
25-30% reduction per ton by 2020 (2012 base)
We will reduce our carbon emissions through the value chain
• Resource efficiency
As of 2014 AkzoNobel will report on an innovative new index
measuring how we improve resource efficiency across the
full value chain - compared to the value we generate
Sustainability is business; Business is sustainability

31 Strategy Update 2013
End-user segment trends, combined with sustainability, direct our innovation spend
End-user segments
Sustainability
Sustainability = Business
Business = Sustainability
Direction of
innovation
spend (2.5% of 2012 revenue)
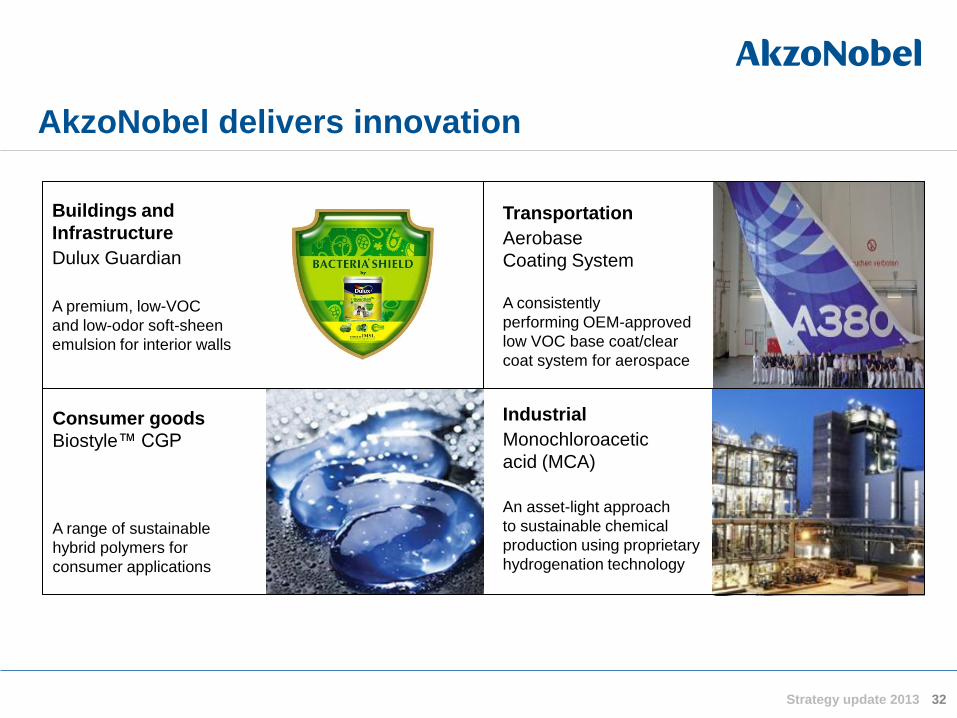
32 Strategy update 2013
AkzoNobel delivers innovation
Buildings and
Infrastructure
Dulux Guardian
A premium, low-VOC
and low-odor soft-sheen
emulsion for interior walls
Transportation
Aerobase
Coating System
A consistently
performing OEM-approved
low VOC base coat/clear
coat system for aerospace
Industrial
Monochloroacetic
acid (MCA)
An asset-light approach
to sustainable chemical
production using proprietary
hydrogenation technology
Consumer goods
Biostyle™ CGP
A range of sustainable
hybrid polymers for
consumer applications

33 Strategy Update 2013
2013 Plan
• Accelerate delivery of recurring €500 million
EBITDA gain in 2013, which was originally
intended in 2014
• Associated cost is estimated at €205 million
• Guidance of €500 million remains even though
North America Decorative Paints will be
divested
• Added measures included
Performance Improvement Program to deliver €500 million in 2013, one year earlier than planned
Operational
Excellence
Functional
Excellence
Business Unit
Adaptations
Key summary to date
• Gains of €250 million,
excluding Decorative Paints North America
• Costs of €292 million,
excluding Decorative Paints North America
• Pulled actions and associated costs forward
• Added measures (including European Decorative
Paints) with additional cost in 2012
Performance Improvement Program

34 Strategy Update 2013
• Product and margin management
• Consolidation of RD&I
• Logistic and warehouse optimization
Operational
Excellence
Functional
Excellence
Business Unit
Adaptations
• IT infrastructure simplification
• HR shared service model
• Finance shared service centers
• Organizational redesign of Marine and Protective
Coatings, Wood Finishes and Adhesives, and
• Pulp and Performance Chemicals
• Additional restructuring of Decorative Paints Europe
During 2013, we will embed
continuous improvement
in our businesses Embedding
Moving from project based to continuous improvement will be core in 2013
35 Strategy Update 2013
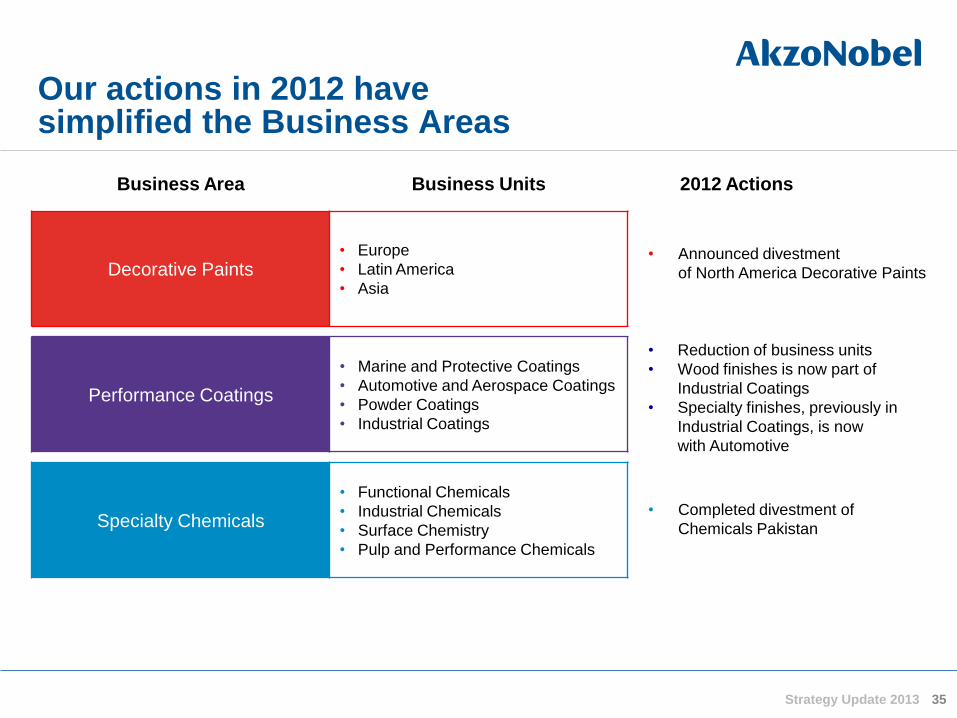
Our actions in 2012 have simplified the Business Areas
Business Area Business Units
Decorative Paints • Europe
• Latin America
• Asia
Performance Coatings
• Marine and Protective Coatings
• Automotive and Aerospace Coatings
• Powder Coatings
• Industrial Coatings
Specialty Chemicals
• Functional Chemicals
• Industrial Chemicals
• Surface Chemistry
• Pulp and Performance Chemicals
2012 Actions
• Completed divestment of
Chemicals Pakistan
• Reduction of business units
• Wood finishes is now part of
Industrial Coatings
• Specialty finishes, previously in
Industrial Coatings, is now
with Automotive
• Announced divestment
of North America Decorative Paints

36 Strategy Update 2013
AkzoNobel strategy
1. Introduction
2. Market environment
3. Group strategic update
4. Business Areas
5. Financial implications
6. Summary and conclusion
4. Business Areas
37 Strategy Update 2013

By end-user segment
2011, 100% = €75 billion
38 Strategy Update 2013
The global paints and coatings market is around €75 billion
By market sector
2011, 100% = €75 billion
Decorative
Paints
(43%)
Automotive
OEM
Protective
Vehicle
Refinish
Performance
Coatings
(57%)
General
Industrial
Powder
Wood
Marine Coil
Packaging
Aerospace Yacht
Source: Orr & Boss; management analysis
Buildings and
Infrastructure
Transportation
Consumer
Goods
Industrial

AkzoNobel has many leading market positions
39 Strategy Update 2013
No.1 Position Other key players
Decorative
Multiple regions
outside North
America
PPG, regional players
North America* Sherwin-Williams PPG, regional players
Protective Sherwin-Williams, Jotun
Powder Axalta, Jotun, regional players
Auto refinish Axalta PPG, AkzoNobel
Wood Sherwin-Williams, Valspar
Marine Jotun, Chugoku
Coil PPG, Beckers
* AkzoNobel not present with North America divestment to PPG

40 Strategy Update 2013
BA-level core processes and capabilities
• Branding
• Distributor, wholesaler, retail management
• Understanding and serving professional painters
• Consumer inspiration
• Quality management, including product portfolio management
Revenue by geographic region
Decorative Paints overview
€ million 2012*
Revenue 4,297
EBITDA 284
Operating income 94
Return on sales 2.2%
Return on investment 3.0%
# Employees 17,020
Revenue by end-user
sub-segment
*After the divestment of Decorative Paints North America, excluding impairment (€2.1 billion)
Decorative Paints key figures (new definition)
49%
25%
14%
8%4% Mature Europe
Asia Pacif ic
Latin America
Emerging Europe
Other regions84%
16% Maintenance,
renovation and repair
New build projects

62%14%
24%Europe
Latin America
Asia
End-user
sub-segment
Geographic region Forward
looking trends
New build
projects
Europe
North America
Asia
Latin America
Maintenance,
renovation and
repair
Europe
North America
Asia
Latin America
41 Strategy Update 2013
Decorative Paints sees limited overall market sector growth in the near future
Expected market growth for the
market sectors relevant to
AkzoNobel: 3-4%
Revenue by Business Unit

42 Strategy Update 2013
Europe
• European organization de-layered
• Better proximity to customers
• Implemented standard processes and merged
ERP system to one
• Implementing a single business entity
• Restructuring cost and benefits for 2013 included
in Performance Improvement Program
• Additional costs are expected in 2014; total
recurring operational benefits of €100 million
will be realized by end of 2014
High growth markets
• Additional investment in China
• Continuously expanding the franchise network
in China, India, and South East Asia
• Stronger focus on Eastern Europe,
Middle East and Africa
• Expansion of activities in Latin America
After the divestment of North America, our focus is on adapting Europe, and investing in high growth markets

Decorative Paints strategic direction
43 Strategy Update 2013
Noteworthy events 2012
• Launched “Let‟s Color” brand and
campaign globally
• Global campaigns to inspire customers
• Expanded store network in China and India
• Announcement divestment of Decorative
Paints North America
• Realigning and restructuring European
business
Actions going forward
• Expand manufacturing capacity in
China and India
• Expand market presence in
emerging Europe and the Middle East
• Complete the divestment of North America
• Launch new products for the
high growth markets
• Deliver on the realignment of the European
organization
Expected 2015 financial outcomes
• Organic revenue growth: 5%
• Return on sales: 7.5%
• Return on investment : 12%

27%
20%30%
11%
8%4%
Mature Europe
North America
Asia Pacific
Emerging EuropeLatin America
Other regions
36%
27%
23%
14%Transportation
Consumer Goods
Buildings and Infrastructure
Industrial
44 Strategy Update 2013
Performance Coatings overview
Performance Coatings
key figures (new definition)
Revenue by end-user segment Revenue by geographic region
€ million 2012
Revenue 5,702
EBITDA 673
Operating income 542
Return on sales 9.5%
Return on investment 21.7%
# Employees 21,310
BA-level core processes and capabilities
• Industrial key account management
• Technical support and service
• Design, color and color matching
• Continuous innovation in functionality and
ease-of-use
• Sustainable, safe solutions

End-user
segment
Performance Coatings
market sectors serving
the segment
Forward looking
trends
Transportation Automotive and air
Marine transport
Consumer
Goods
Powder and packaging
coatings, wood and
specialty plastic finishes
Buildings and
Infrastructure
Protective, coil and
powder coatings, wood
finishes
Industrial Protective and powder
coatings
45 Strategy Update 2013
Expected market growth for the
market sectors relevant to
AkzoNobel: 4%
Performance Coatings sees growth in several key market sectors
*AkzoNobel has a limited position in Automotive OEM coatings
28%
23%17%
32%
Marine and Protective Coatings
Automotive and Aerospace Coatings
Powder Coatings
Industrial Coatings
Revenue by Business Unit

Performance Coatings strategic direction
46 Strategy Update 2013
Noteworthy events 2012
• Schramm acquisition integration on track
• Opened a new manufacturing facility in Vietnam
• Multiple sport stadium contracts for
London Olympics and Brazil‟s future events
• McLaren partnership expanded
• Realigned organization to four Business Units
(from five)
• Reorganized Europe for multiple Business Units
(Wood, Marine, Automotive)
Actions going forward
• Complete manufacturing expansion for
automotive refinish in China
• Complete Schramm integration
• Product and margin management
• Continue product line rationalization
• Continue ERP consolidation
Expected 2015 financial outcomes
• Organic revenue growth: 5%
• Return on sales: 12%
• Return on investment: 25%

47 Strategy Update 2013
Specialty Chemicals overview
Specialty Chemicals key figures
(new definition)
Revenue by end-user segment
Revenue by geographic spread
€ million 2012
Revenue 5,543
EBITDA 830
Operating income 500
Return on sales 9.0%
Return on investment 13.6%
# Employees 10,750
18%
6%
18%58%
Buildings and
Infrastructure
Transportation
Consumer
Goods
Industrial
40%
21%
22%
10%4%3% Mature Europe
North America
Asia Pacific
Latin America
Emerging Europe
Other regions
BA-level core processes and capabilities
• Management of integrated value chains
• Continuous technological advancement
• Engineering and project management
• Process safety
• Product and margin management
• Managing capital intensive businesses and expansions
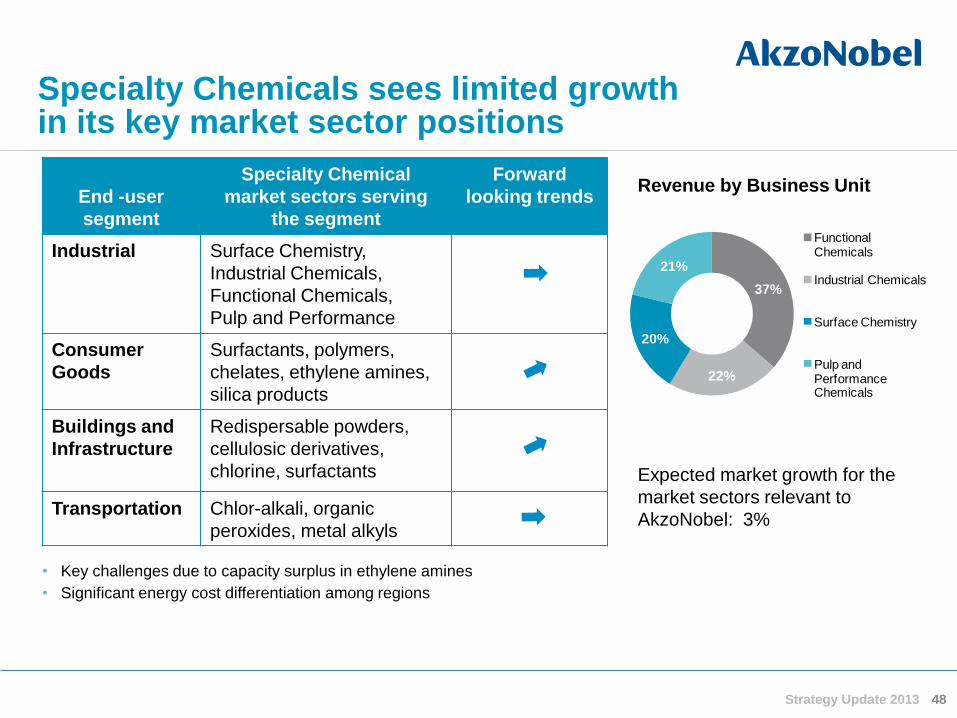
End -user
segment
Specialty Chemical
market sectors serving
the segment
Forward
looking trends
Industrial Surface Chemistry,
Industrial Chemicals,
Functional Chemicals,
Pulp and Performance
Consumer
Goods
Surfactants, polymers,
chelates, ethylene amines,
silica products
Buildings and
Infrastructure
Redispersable powders,
cellulosic derivatives,
chlorine, surfactants
Transportation Chlor-alkali, organic
peroxides, metal alkyls
48 Strategy Update 2013
Specialty Chemicals sees limited growth in its key market sector positions
Expected market growth for the
market sectors relevant to
AkzoNobel: 3%
Revenue by Business Unit
37%
22%
20%
21%
Functional Chemicals
Industrial Chemicals
Surface Chemistry
Pulp and Performance Chemicals
• Key challenges due to capacity surplus in ethylene amines
• Significant energy cost differentiation among regions

Specialty Chemicals strategic direction
49 Strategy Update 2013
Noteworthy events 2012
• Acquired Boxing Oleochemicals, China
• Further expansion in Ningbo, China multisite
• MCA expansion in Taixing, China
• Opened bleaching chemical Island in Brazil
and further investment in another site
• Demerger and sales of Chemicals Pakistan
Actions going forward
• Further integrate and grow Boxing
• Benefit from capacity expansions in Taixing,
Brazil and Germany
• Generate growth from new products
• Further rationalize and consolidate
ERP systems
Expected 2015 financial outcomes
• Organic revenue growth: 3%
• Return on sales: 12%
• Return on investment: 15%

2.2
9.5 9.0 7.5
12.0 12.0
0
4
8
12
16
Decorative Paints Performance Coatings Specialty Chemicals
3.0
21.7
13.6 12.0
25.0
15.0
0
8
16
24
32
Decorative Paints Performance Coatings Specialty Chemicals
5.0 5.0
3.0
0
4
8
Decorative Paints Performance Coatings Specialty Chemicals
Realistic expected 2015 outcomes
50 Strategy Update 2013
Return
on
sales
Return
on
investment
2012
2015
Assumption: Revenue growth
3 year CAGR
%
%
%
Expected Outcomes

1. Introduction
2. Market environment
3. Group strategic update
4. Business Areas
5. Financial implications
6. Summary and conclusion
5. Financial implications
51 Strategy Update 2013

Historical EBITDA profitability shows stable results in challenging economic times
52 Strategy Update 2013
EBITDA as reported* € billion
0.0
0.5
1.0
1.5
2.0
0
2
4
6
8
10
12
14
2012
1.9
2011
1.8
2010
2.0
2009
1.7
2008
1.8
EBITDA EBITDA margin
EBITDA margin %
*All years excluding National Starch

0
53 Strategy Update 2013
Cash flow sources and uses
€ million
2011 2012
Source Use Source Use
• We are not generating enough cash from
operations to adequately meet our needs
• Restructuring and pension top-ups consume a
significant proportion of cash
• We have been borrowing to pay dividends
• Need to generate more cash from better
performance
• Remuneration metrics have been adjusted to
include cash generation
AkzoNobel sources and uses of cash remains a key challenge we are addressing
Capital expenditures
Pensions
Operating working capital
EBITA
Dividends
Provision

Targets for 2015 are focused on increased cash generation and value creation
54 Strategy Update 2013
New targets Old targets Change driver
Increase return on sales (ROS,
operating income/ revenue)
to 9%
Grow to €20 billion revenues • Increased focus on delivery of
operating profit after incidentals
Achieve return on investment
(ROI) to 14%
Increase EBITDA each year,
maintaining 13-15% margin
• Ultimate driver of value creation
• Deliver returns above the cost
of capital
Net debt/EBITDA <2.0 times Reduce OWC/revenues by
0.5 p.a. towards a 12% level
• Fuller measure of cash
generation; not just one
component
Deadline: end 2015 Deadline: medium term • Shorter term
• Defined point in time
• Increased focus on delivery
and accountability

Incidentals are now included in EBITDA* as part of our ongoing business
55 Strategy Update 2013
• Incidentals are now included in EBITDA
unless genuinely one-off and not related to
normal business
• Restructuring charges are now considered an
ongoing business activity and are not reported
as incidentals
• Performance improvement program
restructuring charges are also now included in
EBITDA
*Restated for IAS19 adjustments which impact the other line
€ million 2010 2011 2012
Incidentals as reported (139) (126) (2,520)
Total restated incidentals
(32) 3 (2,170)
Restated IAS19 incidentals with no impact on EBITDA
0 0 6
Total incidental EBITDA adjustment: (107) (129) (344)
IAS19 EBITDA adjustment 13 12 40
EBITDA as reported
EBITDA %
2,009
14.8%
1,834
12.6%
1,901
12.4%
Restated EBITDA
Restated EBITDA %
1,915
14.1%
1,717
11.8%
1,597
10.4%

0.0
0.5
1.0
1.5
2010 2011 2012*
0%
5%
10%
15%
2010 2011 2012* 2015
Operating income is our new focus: our return on sales target is to deliver 9% in 2015
56 Strategy Update 2013
• Going forward, operating income, after
incidentals, and return on sales (ROS,
operating income/revenue) are key metrics
• This will focus management on delivery and
quality of profits
• Operating income and ROS have not
progressed over the last three years
• Our ROS target is 9%, an increase of 3.1%
percentage points, by 2015
• Absolute operating income is one of the targets
for management remuneration
56 *2012 excluding impairment (€2.1 billion)
Specialty Chemicals
Performance Coatings
Return on sales (ROS) development
Operating income/revenue
AkzoNobel
Decorative Paints
Operating income development
€ billion

Return on investment target is to deliver 14% in 2015
57 Strategy Update 2013
0%
10%
20%
30%
40%
2010 2011 2012* 2015
Return on investment (ROI) development
Operating income/Average 12 month invested capital
Specialty Chemicals Performance Coatings
AkzoNobel Decorative Paints
• Return on investment is another key target for
the group, reflecting our focus on delivering
value through returns in excess of our cost
of capital
• Invested capital defined as total assets
(excluding cash, investments in associates,
pension assets, assets held for sale) less tax
liabilities and other payables
• Return on investment target is 14%,
an increase of 5.1 percentage points, by 2015
• Return on investment is one of the targets for
management remuneration
*2012 excluding impairment (€2.1 billion)

0%
100%
58 Strategy Update 2013
Profit and loss breakdown*
% of total
Variable costs represent 54% of revenue
Decorative
Paints
Performance
Coatings
Specialty
Chemicals
AkzoNobel
Raw materials, energy and other variable costs
Fixed production costs
Selling, advertising, administration, R&D costs
EBIT margin
* Rounded percentages
• Decorative Paints is more driven by
personnel costs in the distribution network,
while Specialty Chemicals has more
production costs
• Operating expense growth is primarily
due to wage inflation
• The performance improvement program
benefits are equally split
between fixed and variable costs

Operating cash flow is a key internal target
59 Strategy Update 2013
1.1 0.9 1.0
0.0
0.5
1.0
1.5
2010 2011 2012*
*2012 excluding impairment (€2.1)
Operating cash flow development
€ billion
• Operating cash flow includes:
– EBITDA (new definition)
– Change in operating working capital
– Capital expenditure
– Incidental costs
• Management remuneration is linked to
delivery of operating cash flow targets

0.0
0.5
1.0
1.5
2010 2011 2012
2015 target is to maintain a net debt to EBITDA ratio of less than two times
60 Strategy Update 2013
Net debt/EBITDA
x
• Maintain investment grade rating of BBB+
• We have a strong liquidity position to support growth
• No immediate refinancing is needed
• Average cost of debt has reduced over the last
three years
* At the end of Q3 2012
Debt maturities
billion
Average cost of long term bonds
%
0
0.3
0.6
0.9
2013 2014 2015 2016 2018 2022
€ bonds $ bonds £ bonds
7.29 6.35 5.62
0
2
4
6
8
2010 2011 2012

IAS 19 pension accounting changes create positive impact on EBITDA and net income
61
• Due to changes in IAS 19, the amortization charges in EBITDA will cease and the charges in financing
expenses are significantly lower
• The changes in IAS 19 no longer permit „corridor accounting‟. The reported funded status deficit excluding
administration costs previously included in the defined benefit obligation (DBO) liability will become the
new balance sheet liability, with an associated deferred tax impact (not shown on this slide).
Strategy Update 2013
€ million 2011 IAS19
impact
2012 IAS19
impact
Statement of income
EBITDA 12 40
Incidentals – 6
Financing expenses 25 62
After-tax impact in statement of income 29 77
Balance sheet
Pension net liabilities/(asset) 331 1,486
Other post-retirement liabilities (28) (21)
Post-retirement liabilities/(asset) 303 1,465
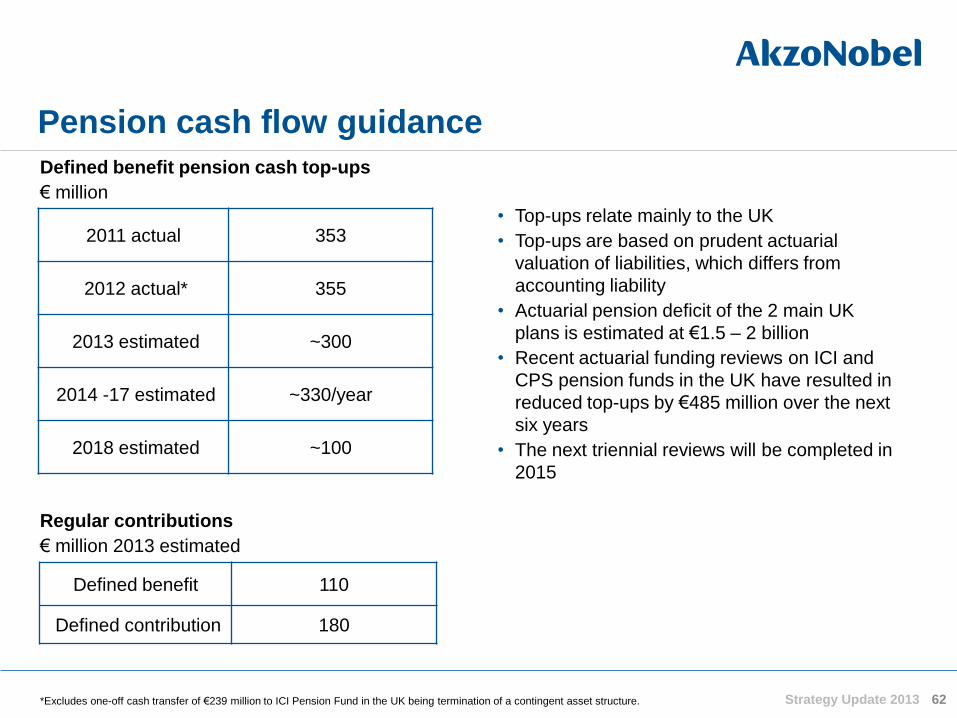
Pension cash flow guidance
62 Strategy Update 2013
Defined benefit pension cash top-ups
€ million
2011 actual 353
2012 actual* 355
2013 estimated ~300
2014 -17 estimated ~330/year
2018 estimated ~100
• Top-ups relate mainly to the UK
• Top-ups are based on prudent actuarial
valuation of liabilities, which differs from
accounting liability
• Actuarial pension deficit of the 2 main UK
plans is estimated at €1.5 – 2 billion
• Recent actuarial funding reviews on ICI and
CPS pension funds in the UK have resulted in
reduced top-ups by €485 million over the next
six years
• The next triennial reviews will be completed in
2015
Defined benefit 110
Defined contribution 180
Regular contributions
€ million 2013 estimated
*Excludes one-off cash transfer of €239 million to ICI Pension Fund in the UK being termination of a contingent asset structure.

€ million
2010
2011 2012*
2015
Target
Revenue 13,605 14,604 15,390
EBITDA 1,915 1,717 1,597
Depreciation,
amortization (590) (563) (625)
Restated
incidentals (32) 3 (64)
Operating
income 1,293 1,157 908
EBITDA
margin 14.1% 11.8% 10.4%
Return on
sales 9.5% 7.9% 5.9% 9.0%
Invested
capital** 11,467 11,537 10,238
Return on
investment 11.3% 10.0% 8.9% 14.0%
New focus to improve performance and drive value creation
63 Strategy Update 2013
• Benefits of new targets
– Clear focus on value creation
– Linked to remuneration
of senior management
*2012 excluding impairment (€2.1 billion) ** Average 12 month invested capital excluding full year impairment

1. Introduction
2. Market environment
3. Group strategic update
4. Business Areas
5. Financial implications
6. Summary and conclusion
6. Summary and conclusion
64 Strategy Update 2013

Dividends
65 Strategy Update 2013
• Our dividend policy is to pay a stable to rising
dividend each year
• An interim and final dividend will be paid in
cash unless shareholders elect to receive a
stock dividend
2012
0.33
1.12
2011
0.33
1.12
2010
0.32
1.08
2009
0.30
1.05
Interim dividend Final dividend

A smaller Executive Committee going forward*
66 Strategy Update 2013 *With effect from the Annual General Meeting on April 26, 2013 **Until June 2013
Spelling and *
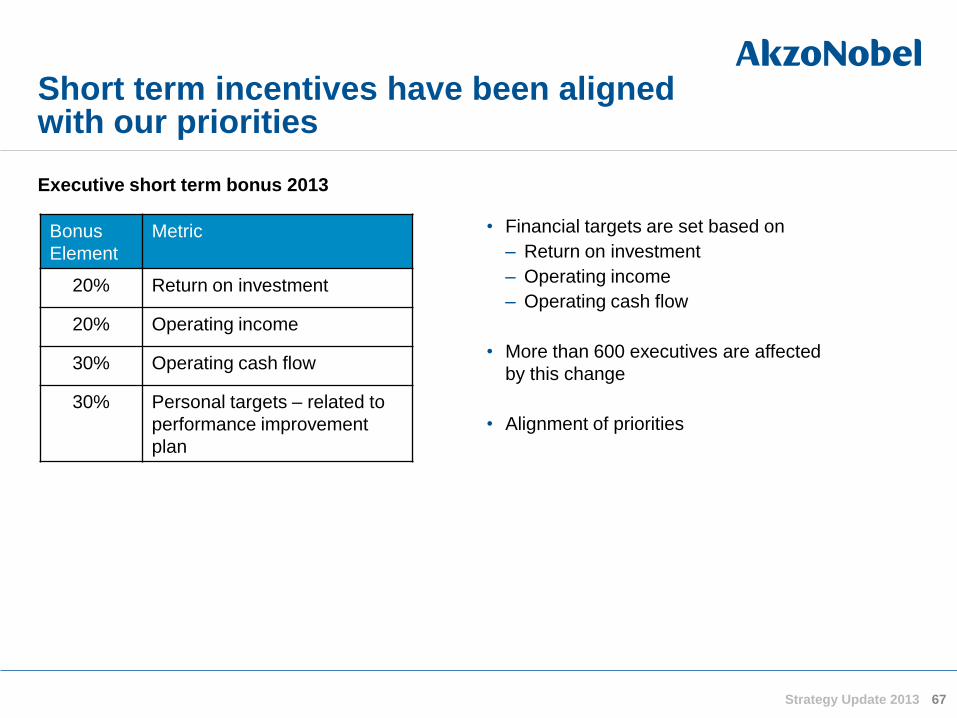
Short term incentives have been aligned with our priorities
67 Strategy Update 2013
• Financial targets are set based on
– Return on investment
– Operating income
– Operating cash flow
• More than 600 executives are affected
by this change
• Alignment of priorities
Executive short term bonus 2013
Bonus
Element
Metric
20% Return on investment
20% Operating income
30% Operating cash flow
30% Personal targets – related to
performance improvement
plan
8.9
14.0
0
4
8
12
16
2012 2015
Return on sales
(Operating income/revenue)
%
68
Return on investment
(Operating income/average
12 months invested capital)
%
Strategy Update 2013
Net debt/EBITDA
x
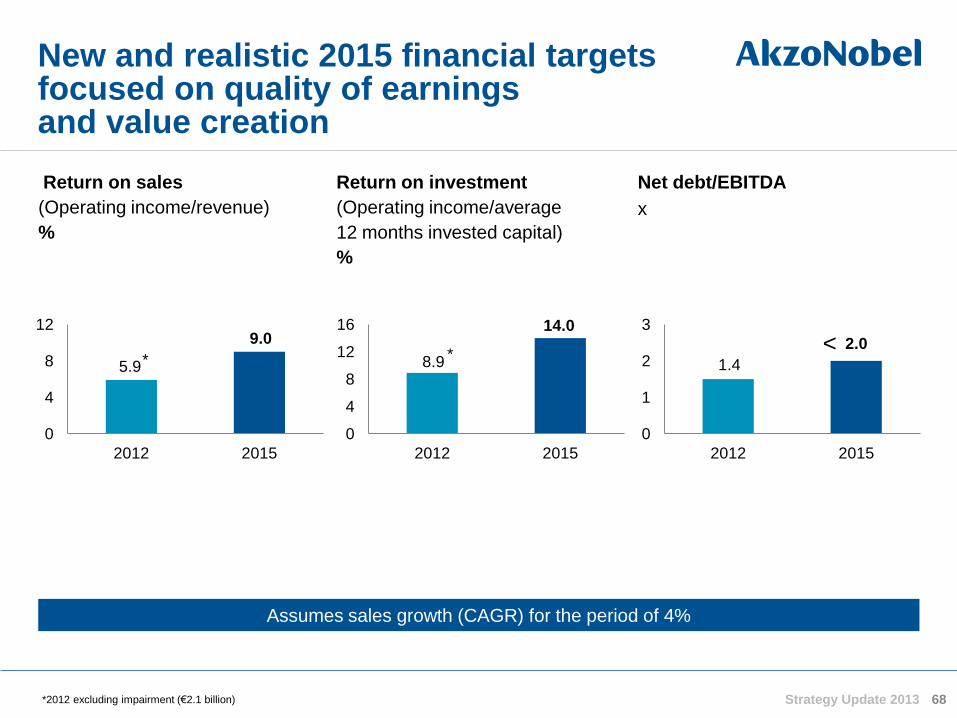
New and realistic 2015 financial targets focused on quality of earnings and value creation
Assumes sales growth (CAGR) for the period of 4%
*2012 excluding impairment (€2.1 billion)
5.9
9.0
0
4
8
12
2012 2015
1.4
2.0
0
1
2
3
2012 2015
* * <

Summary
69 Strategy Update 2013
• Clear end-user segment focus providing forward looking indicators
and direction for our market initiatives and innovation spend
• Challenging market conditions expected in the near future
• Operational strategy on the basis of:
– Well defined strategic focus areas
– Core processes
– Clear set of actions aimed at continuous efficiency improvements
• Clear sustainability strategy and sustainability targets
• Guidance and targets defined
• A number of new management team members
• Focus on operating income, return on investment and cash generation:
remuneration aligned

Leading market positions
delivering leading performance
70
Today, the company has
• Excellent portfolio of businesses
• Good long term growth potential on the basis of end-user segment growth
• Strong positions in high growth markets (44% of revenue)
• Leadership positions in many markets
• Clear leader in sustainability
• Track record of delivering sustainable innovations and products
• Strong brands, both in consumer and industrial markets
Clear focus to deliver on our significant potential
• Improved returns and cash flow
• Leveraging scale
• Simplification and standardization
• Continued innovation
Strategy Update 2013

Thank you for your attention

Safe Harbor Statement
72 Investor update Full-Year 2012 & Q4 results
This presentation contains statements which address such key issues as
AkzoNobel’s growth strategy, future financial results, market positions, product development, products in
the pipeline, and product approvals. Such statements should be carefully considered, and it should be
understood that many factors could cause forecasted and actual results to differ from these statements.
These factors include, but are not limited to, price fluctuations, currency fluctuations, developments in raw
material and personnel costs, pensions, physical and environmental risks, legal issues, and legislative,
fiscal, and other regulatory measures. Stated competitive positions are based on management estimates
supported by information provided by specialized external agencies. For a more comprehensive discussion
of the risk factors affecting our business please see our latest Annual Report, a copy of which can be found
on the company’s corporate website www.akzonobel.com.

Appendices
73 Strategy Update 2013

2011 12 13 14 15 16 2011 12 13 14 15 16
74 Strategy Update 2013
In Consumer Goods, our activities are spread evenly over consumer durables and consumer packaging
Consumer electronics
production
$ billion, value added
2011 = 100
Furniture production
$ billion, value added
2011 = 109
Food and beverage
production
$ billion, value added
2011 = 871
-1.2% +2.2%
+7.9% p.a.
CAGR 2.6%
CAGR 1.8%
2011 12 13 14 15 16
Source: Oxford Economics Source: Oxford Economics Source: Oxford Economics

0
100
2011 12 13 14 15 16 2011 12 13 14 15 16 2011 12 13 14 15 16
75 Strategy Update 2013
In Industrial, our activity is spread across the two sub-segments
Brent crude futures price
$, price per barrel
Annual average spot price
2011 = $111
Energy and utilities
construction
$ billion, output
2011 = 360
Chemical production
$ billion, output
2011 = 690
CAGR
9.4%
CAGR
3.8%
Source: Oxford Economics Source: Business Monitor International Source: Oxford Economics

Scope 3 upstream
Raw materials
Scope 1 and 2
Own operations
Scope 3 downstream
Customer operations End-user End of life
Scope 4
Energy/resource benefits in use
Sustainable
business
Cost savings Cost savings
Improve revenue
and margin
Improve revenue and margin
Resource
efficiency
Reduced material
and energy use
Reduced
energy used
Reduced material
and energy use in
customer processes,
application
Reduced material and energy use
in product use
Capable,
engaged
people
Engaged suppliers Engaged
employees
Engaged customers Engaged customers and users
By focusing on the full value chain, we will drive business, resource and engagement benefits
76 76 Strategy Update 2013

€ million
2010
2011 2012*
2015
Outcome
Revenue 3,933 4,201 4,297
EBITDA 541 389 284
Depreciation,
amortization (205) (152) (176)
Restated
incidentals 0 (2) (14)
Operating
income 336 235 94
EBITDA
margin 13.8% 9.3% 6.6%
Return on
sales 8.5% 5.6% 2.2% 7.5%
Invested
capital** 4,908 5,032 3,121
Return on
investment 6.8% 4.7% 3.0% 12.0%
Decorative Paints restated financials, key assumptions and expected outcomes
77 Strategy Update 2013
• Financials are restated for changes to
incidental treatment and exclusion of the
North American Decorative Paints business
• Expected outcomes
– Return on sales of 7.5% by 2015
– Return on investment of 12% by 2015
• Key assumption
– Revenue CAGR of 5% to 2015
*2012 excluding impairment (€2.1 billion) ** Average 12 month invested capital excluding full year impairment

€ million 2010
2011 2012
2015
Outcome
Revenue 4,786 5,170 5,702
EBITDA 610 572 673
Depreciation,
amortization (107) (116) (131)
Restated
incidentals (16) 2 0
Operating
income 487 458 542
EBITDA
margin 12.7% 11.1% 11.8%
Return on
sales 10.2% 8.9% 9.5% 12.0%
Invested
capital* 2,063 2,267 2,499
Return on
investment 23.6% 20.2% 21.7% 25.0%
Performance Coatings restated financials, key assumptions and expected outcomes
78 Strategy Update 2013
• Financials are restated for changes to
incidental treatment
• Expected outcomes
– Return on sales of 12% by 2015
– Return on investment of 25% by 2015
• Key assumption
– Revenue CAGR of 5% to 2015
*Average 12 month invested capital

€ million
2010
2011 2012
2015
Outcome
Revenue 4.943 5.335 5.543
EBITDA 915 909 830
Depreciation,
amortization (260) (281) (306)
Restated
incidentals (51) (6) (24)
Operating
income 604 622 500
EBITDA
margin 18.5% 17.0% 15.0%
Return on
sales 12.2% 11.7% 9.0% 12.0%
Invested
capital* 3,464 3,406 3,678
Return on
investment 17.4% 18.3% 13.6% 15.0%
Specialty Chemicals restated financials, key assumptions and expected outcomes
79 Strategy Update 2013
• Financials are restated for changes to
incidental treatment
• Expected outcomes
– Return on sales of 12% by 2015
– Return on investment 15% by 2015
• Key assumptions
– Revenue CAGR of 3% to 2015
* New definition **Average 12 month invested capital

Incidentals now included in EBITDA as part of ongoing business
80 Strategy Update 2013
€ million 2010 2011 2012
Restructuring costs (104) (129) (324)
Impairment Deco - - (2,106)
Results related to major legal,
anti-trust and environmental cases
Results of acquisitions and divestments 33 10 (45)
Other incidental results (19) 2 (9)
Total Incidentals as reported (139) (126) (2,520)
Restructuring costs - - -
Impairment Deco - - (2,106)
Results related to major legal,
anti-trust and environmental cases
Results of acquisitions and divestments 33 10 (30)
Other incidental results (16) 2 (14)
Total Restated Incidentals (incl IAS 19 impact) (32) 3 (2,170)
Total difference (107) (129) (350)
Of which IAS 19 impact on incidentals - - 6
Remaining difference due to definition change) (107) (129) (344)
EBITDA as reported 2,009 1,834 1,901
EBITDA adjustment due to new definitions (107) (129) (344)
EBITDA adjustment due to IAS 19 impact 13 12 40
Restated EBITDA (IAS 19 impact included) 1,915 1,717 1,597
(9)
(9)
(36)
(20)
(49)
(49)

Variable costs analysis
81 Strategy Update 2013
30%
3%
7%
5% 14%
3%
9%
16%
7%
6%
2012 (excluding Decorative North America)
* Other variable costs include variable selling costs (e.g. freight) and products for resale ** Other raw materials include cardolite, hylar etc.
*** Chemicals and intermediates include caustic soda, acetic acid, tallow, ethylene, ethylene oxide, sulfur, amines etc.
Energy & other variable costs*
Raw materials
Other raw materials**
Titanium
dioxide
Coatings‟ specialties
Resins
Pigments
Additives
Solvents
Packaging
Chemicals and
intermediates***

Debt duration 4.2 years and no refinancing currently planned
82 Strategy Update 2013
Debt maturities*
€ million (nominal amounts)
Strong liquidity position to support growth
• Undrawn revolving credit facility of €1.7 billion (2017) and €0.1 billion (2016)
• €1.5 and $3 billion commercial paper programs, backed by the revolving credit facility
• Net cash and cash equivalents €1.6 billion*
15
825
622
800 750
379
44
306
2012 2013 2014 2015 2016 2017 2018 2019 2020 2021 2022
€ bonds $ bonds £ bonds
* At the end of Q4 2012

Financial restatement summary for AkzoNobel Group
Strategy update 2013 83
FY2010 FY2011 Q1-12 Q2-12 Q3-12 Q4-12 FY2012 FY2010 FY2011 Q1-12 Q2-12 Q3-12 Q4-12 FY2012 FY2010 FY2011 Q1-12 Q2-12 Q3-12 Q4-12 FY2012
Revenues 13.605 14.604 3.707 4.044 3.966 3.673 15.390 - - - - - - - 13.605 14.604 3.707 4.044 3.966 3.673 15.390
EBITDA 2.009 1.834 438 577 523 363 1.901 -94 -117 -28 -23 -95 -158 -304 1.915 1.717 410 554 428 205 1.597
Depreciation -435 -419 -114 -115 -115 -119 -463 - - - - - - - -435 -419 -114 -115 -115 -119 -463
Amortisation -155 -144 -39 -40 -41 -42 -162 - - - - - - - -155 -144 -39 -40 -41 -42 -162
EBIT 1.419 1.271 285 422 367 202 1.276 -94 -117 -28 -23 -95 -158 -304 1.325 1.154 257 399 272 44 972
Incidentals -139 -126 -52 -44 -2.229 -195 -2.520 107 129 31 33 99 187 350 -32 3 -21 -11 -2.130 -8 -2.170
Operating Income 1.280 1.145 233 378 -1.862 7 -1.244 13 12 3 10 4 29 46 1.293 1.157 236 388 -1.858 36 -1.198
Operating Income excl. impaired goodwill 1.280 1.145 233 378 244 7 862 1.293 1.157 236 388 248 36 908
Total Finance Charges -327 -336 -65 -82 -66 -54 -267 -2 25 15 15 16 16 62 -329 -311 -50 -67 -50 -38 -205
Associates 25 24 4 5 5 -1 13 - - - - - - - 25 24 4 5 5 -1 13
Finance Charges & Associates -302 -312 -61 -77 -61 -55 -254 -2 25 15 15 16 16 62 -304 -287 -46 -62 -45 -39 -192
Profit Before Tax 978 833 172 301 -1.923 -48 -1.498 11 37 18 25 20 45 108 989 870 190 326 -1.903 -3 -1.390
Tax -174 -233 -61 -82 -58 29 -172 -2 -8 -5 -7 -6 -13 -31 -176 -241 -66 -89 -64 16 -203
Minorities -83 -64 -14 -22 -9 -18 -63 - - - - - - - -83 -64 -14 -22 -9 -18 -63
Discontinued Income 33 -59 -26 4 -392 -22 -436 25 - - - - - - 58 -59 -26 4 -392 -22 -436
Net Income 754 477 71 201 -2.382 -59 -2.169 34 29 13 18 14 32 77 788 506 84 219 -2.368 -27 -2.092
Adjusted Net Income 912 790 162 259 234 119 774 -66 -157 -10 -7 -57 -95 -169 846 633 152 252 177 24 605
EPS 3,23 2,04 0,30 0,85 -10,00 -0,25 -9,14 0,15 0,12 0,06 0,07 0,06 0,14 0,32 3,38 2,16 0,36 0,92 -9,94 -0,11 -8,82
Adjusted EPS 3,91 3,10 0,69 1,09 0,98 0,50 3,26 -0,28 -0,27 -0,04 -0,03 -0,24 -0,40 -0,71 3,63 2,83 0,65 1,06 0,74 0,10 2,55
EBITDA Margin% 14,8% 12,6% 11,8% 14,3% 13,2% 9,9% 12,4% 14,1% 11,8% 11,1% 13,7% 10,8% 5,6% 10,4%
EBIT Margin % 10,4% 8,7% 7,7% 10,4% 9,3% 5,5% 8,3% 9,7% 7,9% 6,9% 9,9% 6,9% 1,2% 6,3%
Return on Sales % 9,4% 7,8% 6,3% 9,3% -46,9% 0,2% -8,1% 9,5% 7,9% 6,4% 9,6% -46,8% 1,0% -7,8%
Return on Sales % (excl. impaired goodwill) 9,4% 7,8% 6,3% 9,3% 6,2% 0,2% 5,6% 9,5% 7,9% 6,4% 9,6% 6,3% 1,0% 5,9%
Moving Average ROI% 12,1% 10,5% 10,2% 9,9% 9,7% 10,0% 10,0% 11,3% 10,0% 9,4% 8,7% -9,2% -10,1% -10,1%
Moving Average ROI% (excl. impaired goodwill) 11,3% 10,0% 8,9%
Capex 492 658 135 166 195 330 826 - - - - - - - 492 658 135 166 195 330 826
Invested Capital average (12M) 11.721 12.088 12.447 12.882 13.107 12.781 12.781 -254 -551 -642 -763 -865 -964 -964 11.467 11.537 11.805 12.119 12.242 11.817 11.817
Invested Capital average (12M) (excl. impaired goodwill) 11.721 12.088 11.467 11.537 10.238
OWC 1.839 1.891 2.259 2.314 2.178 1.659 1.659 -147 -57 -62 -87 -76 -87 -87 1.692 1.834 2.197 2.227 2.102 1.572 1.572
OWC% 13,5% 13,2% 15,1% 14,1% 13,6% 11,2% 11,2% 12,4% 12,9% 14,8% 13,8% 13,3% 10,7% 10,7%
New FormatRestatements (Incidentals & IAS 19)As Reported (excluding NA Deco)

Financial restatement summary for Decorative Paints
Strategy update 2013 84
FY2010 FY2011 Q1-12 Q2-12 Q3-12 Q4-12 FY2012 FY2010 FY2011 Q1-12 Q2-12 Q3-12 Q4-12 FY2012 FY2010 FY2011 Q1-12 Q2-12 Q3-12 Q4-12 FY2012
Revenues 3.933 4.201 974 1.187 1.141 995 4.297 - - - - - - - 3.933 4.201 974 1.187 1.141 995 4.297
EBITDA 593 479 90 158 130 47 425 -52 -90 -22 -3 -33 -83 -141 541 389 68 155 97 -36 284
Depreciation -124 -91 -27 -26 -26 -27 -106 - - - - - - - -124 -91 -27 -26 -26 -27 -106
Amortisation -81 -61 -16 -17 -18 -19 -70 - - - - - - - -81 -61 -16 -17 -18 -19 -70
EBIT 388 327 47 115 86 1 249 -52 -90 -22 -3 -33 -83 -141 336 237 25 112 53 -82 108
Incidentals -52 -92 -22 -3 -2.144 -92 -2.261 52 90 22 3 33 83 141 - -2 - - -2.111 -9 -2.120
Operating Income 336 235 25 112 -2.058 -91 -2.012 - - - - - - - 336 235 25 112 -2.058 -91 -2.012
Operating Income excl. impaired goodwill 336 235 25 112 48 -91 94 336 235 25 112 48 -91 94
EBITDA Margin % 15,1% 11,4% 9,2% 13,3% 11,4% 4,7% 9,9% 13,8% 9,3% 7,0% 13,1% 8,5% -3,6% 6,6%
EBIT Margin % 9,9% 7,8% 4,8% 9,7% 7,5% 0,1% 5,8% 8,5% 5,6% 2,6% 9,4% 4,6% -8,2% 2,5%
Return on Sales % 8,5% 5,6% 2,6% 9,4% -180,4% -9,1% -46,8% 8,5% 5,6% 2,6% 9,4% -180,4% -9,1% -46,8%
Return on Sales % (excl. impaired goodwill) 8,5% 5,6% 2,6% 9,4% 4,2% -9,1% 2,2% 8,5% 5,6% 2,6% 9,4% 4,2% -9,1% 2,2%
Moving average ROI % 7,2% 5,9% 5,9% 5,2% 4,7% 4,8% 4,8% 6,8% 4,7% 4,4% 3,7% -37,4% -42,7% -42,8%
Moving Average ROI% (excl. impaired goodwill) 6,8% 4,7% 3,0%
Capex 127 155 29 41 44 92 206 - - - - - - - 127 155 29 41 44 92 206
Invested Capital average (12M) 5.407 5.500 5.614 5.738 5.658 5.151 5.151 -499 -468 -463 -463 -459 -450 -450 4.908 5.032 5.151 5.275 5.199 4.701 4.701
Invested Capital average (12M) (excl. impaired goodwill) 4.908 5.032 3.121
OWC 474 434 654 661 587 353 353 -71 - - - - - - 403 434 654 661 587 353 353
OWC % 12,7% 11,2% 16,8% 13,9% 12,9% 8,9% 8,9% 10,8% 11,2% 16,8% 13,9% 12,9% 8,9% 8,9%
Number of Employees 16.865 17.120 17.320 17.430 17.220 17.020 17.020 16.685 17.120 17.320 17.430 17.220 17.020 17.020
New FormatAs Reported (excluding NA Deco) Restatements (Incidentals & IAS 19)

Financial restatement summary for Performance Coatings
Strategy update 2013 85
FY2010 FY2011 Q1-12 Q2-12 Q3-12 Q4-12 FY2012 FY2010 FY2011 Q1-12 Q2-12 Q3-12 Q4-12 FY2012 FY2010 FY2011 Q1-12 Q2-12 Q3-12 Q4-12 FY2012
Revenues 4.786 5.170 1.369 1.472 1.467 1.394 5.702 - - - - - - - 4.786 5.170 1.369 1.472 1.467 1.394 5.702
EBITDA 647 611 164 213 202 190 769 -37 -39 -5 -9 -39 -43 -96 610 572 159 204 163 147 673
Depreciation -81 -86 -23 -25 -23 -24 -95 - - - - - - - -81 -86 -23 -25 -23 -24 -95
Amortisation -26 -30 -9 -8 -10 -9 -36 - - - - - - - -26 -30 -9 -8 -10 -9 -36
EBIT 540 495 132 180 169 157 638 -37 -39 -5 -9 -39 -43 -96 503 456 127 171 130 114 542
Incidentals -53 -37 -5 -9 -39 -43 -96 37 39 5 9 39 43 96 -16 2 - - - - -
Operating Income 487 458 127 171 130 114 542 - - - - - - - 487 458 127 171 130 114 542
EBITDA Margin % 13,5% 11,8% 12,0% 14,5% 13,8% 13,6% 13,5% 12,7% 11,1% 11,6% 13,9% 11,1% 10,5% 11,8%
EBIT Margin % 11,3% 9,6% 9,6% 12,2% 11,5% 11,3% 11,2% 10,5% 8,8% 9,3% 11,6% 8,9% 8,2% 9,5%
Return on Sales % 10,2% 8,9% 9,3% 11,6% 8,9% 8,2% 9,5% 10,2% 8,9% 9,3% 11,6% 8,9% 8,2% 9,5%
Moving average ROI % 26,3% 22,0% 22,0% 22,9% 23,9% 25,6% 25,6% 23,6% 20,2% 20,4% 20,5% 20,6% 21,7% 21,7%
Capex 87 116 18 25 23 57 123 - - - - - - - 87 116 18 25 23 57 123
Invested Capital average (12M) 2.054 2.253 2.326 2.397 2.471 2.488 2.488 9 14 10 9 9 11 11 2.063 2.267 2.336 2.406 2.480 2.499 2.499
OWC 714 772 852 871 857 742 742 -23 - - - - - - 691 772 852 871 857 742 742
OWC % 14,4% 14,6% 15,6% 14,8% 14,6% 13,3% 13,3% 14,0% 14,6% 15,6% 14,8% 14,6% 13,3% 13,3%
Number of Employees 21.020 21.960 21.910 21.920 21.650 21.310 21.310 21.020 21.960 21.910 21.910 21.640 21.310 21.310
As Reported Restatements (Incidentals & IAS 19) New Format

Financial restatement summary for Specialty Chemicals
Strategy update 2013 86
FY2010 FY2011 Q1-12 Q2-12 Q3-12 Q4-12 FY2012 FY2010 FY2011 Q1-12 Q2-12 Q3-12 Q4-12 FY2012 FY2010 FY2011 Q1-12 Q2-12 Q3-12 Q4-12 FY2012
Revenues 4.943 5.335 1.399 1.431 1.393 1.320 5.543 - - - - - - - 4.943 5.335 1.399 1.431 1.393 1.320 5.543
EBITDA 939 906 235 255 227 172 889 -24 3 - -20 -19 -20 -59 915 909 235 235 208 152 830
Depreciation -214 -228 -61 -63 -62 -65 -251 - - - - - - - -214 -228 -61 -63 -62 -65 -251
Amortisation -46 -53 -13 -15 -13 -14 -55 - - - - - - - -46 -53 -13 -15 -13 -14 -55
EBIT 679 625 161 177 152 93 583 -24 3 - -20 -19 -20 -59 655 628 161 157 133 73 524
Incidentals -75 -3 -21 -23 -19 -20 -83 24 -3 - 20 19 20 59 -51 -6 -21 -3 - - -24
Operating Income 604 622 140 154 133 73 500 - - - - - - - 604 622 140 154 133 73 500
EBITDA Margin % 19,0% 17,0% 16,8% 17,8% 16,3% 13,0% 16,0% 18,5% 17,0% 16,8% 16,4% 14,9% 11,5% 15,0%
EBIT Margin % 13,7% 11,7% 11,5% 12,4% 10,9% 7,0% 10,5% 13,3% 11,8% 11,5% 11,0% 9,5% 5,5% 9,5%
Return on Sales % 12,2% 11,7% 10,0% 10,8% 9,5% 5,5% 9,0% 12,2% 11,7% 10,0% 10,8% 9,5% 5,5% 9,0%
Moving average ROI % 19,2% 17,8% 17,3% 17,6% 16,8% 15,6% 15,6% 17,4% 18,3% 16,9% 16,7% 15,5% 13,6% 13,6%
Capex 273 365 87 95 125 177 484 - - - - - - - 273 365 87 95 125 177 484
Invested Capital average (12M) 3.545 3.521 3.528 3.615 3.693 3.735 3.735 -81 -115 -54 -55 -57 -57 -57 3.464 3.406 3.474 3.560 3.636 3.678 3.678
OWC 651 685 754 783 734 564 564 -14 - - - - - - 637 685 754 783 734 564 564
OWC % 12,9% 13,3% 13,5% 13,7% 13,2% 10,7% 10,7% 12,6% 13,3% 13,5% 13,7% 13,2% 10,7% 10,7%
Number of Employees 11.080 11.510 11.860 11.980 11.950 10.750 10.750 11.080 11.510 11.860 11.980 11.950 10.750 10.750
As Reported Restatements (Incidentals & IAS 19) New Format

Financial restatement summary for Other Activities
Strategy update 2013 87
FY2010 FY2011 Q1-12 Q2-12 Q3-12 Q4-12 FY2012 FY2010 FY2011 Q1-12 Q2-12 Q3-12 Q4-12 FY2012 FY2010 FY2011 Q1-12 Q2-12 Q3-12 Q4-12 FY2012
Revenues -57 -102 -35 -46 -35 -36 -152 - - - - - - - -57 -102 -35 -46 -35 -36 -152
EBITDA -170 -162 -51 -49 -36 -46 -182 19 9 -1 9 -4 -12 -8 -151 -153 -52 -40 -40 -58 -190
Depreciation -16 -14 -3 -1 -4 -3 -11 - - - - - - - -16 -14 -3 -1 -4 -3 -11
Amortisation -2 - -1 - - - -1 - - - - - - - -2 - -1 - - - -1
EBIT -188 -176 -55 -50 -40 -49 -194 19 9 -1 9 -4 -12 -8 -169 -167 -56 -41 -44 -61 -202
Incidentals 41 6 -4 -9 -27 -40 -80 -6 3 4 1 8 41 54 35 9 - -8 -19 1 -26
Operating Income -147 -170 -59 -59 -67 -89 -274 13 12 3 10 4 29 46 -134 -158 -56 -49 -63 -60 -228
Capex 5 22 1 5 3 4 13 - - - - - - - 5 22 1 5 3 4 13
Restatements (Incidentals & IAS 19) New FormatAs Reported (excluding NA Deco)