AKTIEBOLAGET ATOMENERGI
34
AKTIEBOLAGET ATOMENERGI STUDSVIK, NYKÖPING, SWEDEN 1972
Transcript of AKTIEBOLAGET ATOMENERGI

AKTIEBOLAGET ATOMENERGI
STUDSVIK, NYKÖPING, SWEDEN 1972

AE-4b4
MEASUREMENT AND ANALYSIS OF GAMMA
HEATING IN THE R2 CORF
R Carlsson, LG Larsson
ABSTRACT
Materials are heated in a fission reactor by either fission heating
or by the radiation accompanying the fission. In a materials testing
reactor, as the Studsvik RZ reactor, the radiation or so called gamma
heating is of great interest in the design and evaluation of irradiation
experiments. Measurements of gamma heating have been performed
in different core positions in the RZ using several different materials.
These measurements are described in detail, analysed and correlated
with the power distribution in the reactor core. A short debcription
of the principles for calculating gamma heating in irradiation devices
is also given.
Pr in ted and dis t r ibuted in January 1973.
CONTENTS Page
1. INTRODUCTION 3
2. PRINCIPLES OF THE MEASUREMENTS 3
2. 1 Principles of the gamma thermometer design 3
2. 2 Relationship between measured temperatures and gammaheating 4
2. 2. 1 A simple model 4
2. 2. 2 Comparison of experiments 4
2. 2. 3 A refined model 5
2. 2. 4 Calibration of the gamma thermometer 6
3. MEASUREMENTS 7
3. 1 General considerations 7
3. 2 Measurements in the 30 MW core 7
3. 3 Measurements in the start-up experiments of the 50 MW 8core
3. 4 Measurements in the 50 MW core using as absorbersstainless steel, graphite and lead 8
3. 5 Summary of the measurements 8
4. ANALYSIS OF THE MEASUREMENTS 9
4. 1 Axial integration of gamma heating 9
4. 2 Analysis of gamma heating as a function of neighbouringfuel element power 9
4. 3 Influence of control rod positioning 10
4. 4 Relationship between gamma heating in stainless steel, 1 1graphite and lead
5. CONVERSION OF MEASURED GAMMA HEATING TO GAMMAHEATING IN ACTUAL RIGS 11
6. CONCLUSIONS 12
7. REFERENCES 13
TABLES
FIGURES

1. INTRODUCTION
Knowledge of gamma heating is essential for calculation of the
power of both non-fissile and fissile experiments in the core. It is
of course most important in a non-fissile experiment or an experi-
ment with low concentration of fissile atoms, bu' due to t'le large
degree of gamma heating in the R2 core, knowledge of gamma heating
can be said to be essential for calculations of power and temperatures
in all types of experiments in the R2.
This report gives a complete summary of the measurements of
gamma heating which have been performed in the R2 core and describes
a model for calculation of gamma heating in rigs and experiments.
Gamma heating is defined here as the specific power, usually
measured in W/g, which is absorbed by a non-fissile material when
placed in the reactor core. The name gamma heating can be discussed,
since other radiation types (|3f fast neutrons) contribute, but in most
cases in a core, as in the R2 reactor, the absorbed gamma photons
give the largest contribution to the absorbed heat.
2. PRINCIPLES OF THE MEASUREMENTS
2. T Principles of the gamma thermometer design
The measurements in the R2 core of gamma heating have been
made using a so-called gamma thermometer of the type developed
and used in Halden [ 1 ] and in Grenoble [2], The gamma thermometer
which has been used here is shown in figure 1 with the rig design pre-
sented in figure 2. It consists of a cylindrical heat absorber, usually
made of stainless steel, but in later experiments also of graphite and
lead. This cylinder is placed in a stainless steel container, filled with
helium of atmospheric pressure and sealed. The temperature is
measured on the outside of the container and in the center of the ab-
sorber by Chromel-Alumel thermocouples. The temperatures have
been measured, either by means of a bridge as in the first experi-
ments, or by means of a digital voltmeter directly connected to the
R2 data logging system as in the latest experiments.
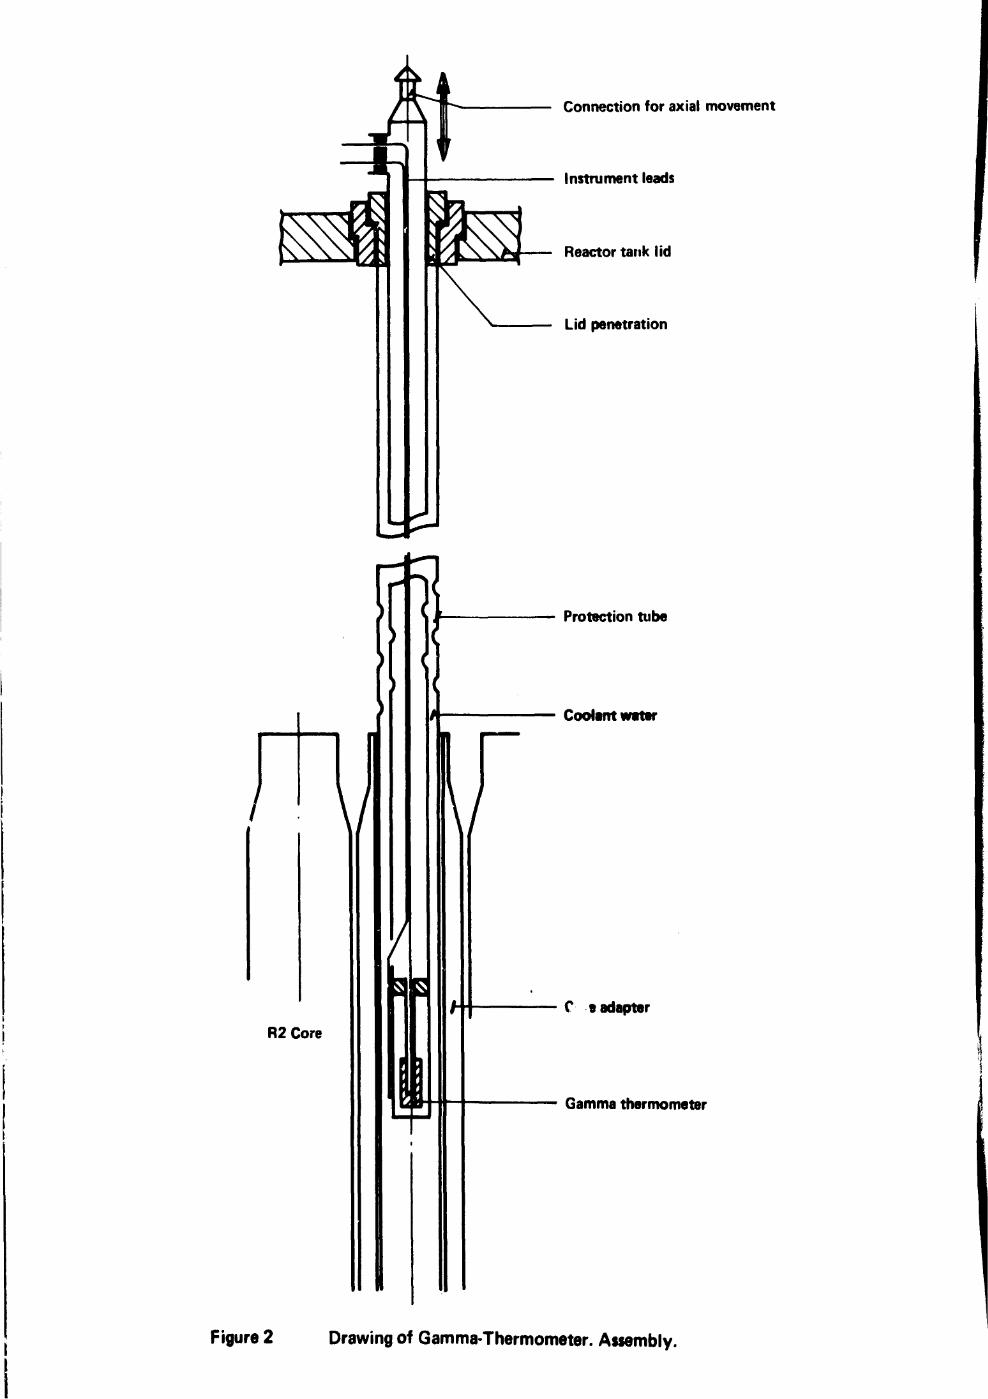
The gamma thermometer is placed in a rig, which is designed so
that the absorber can be placed in well defined axial positions in the
reactor core. The design of the rig and the absorber can be seen in
fig 2.

- 4 -
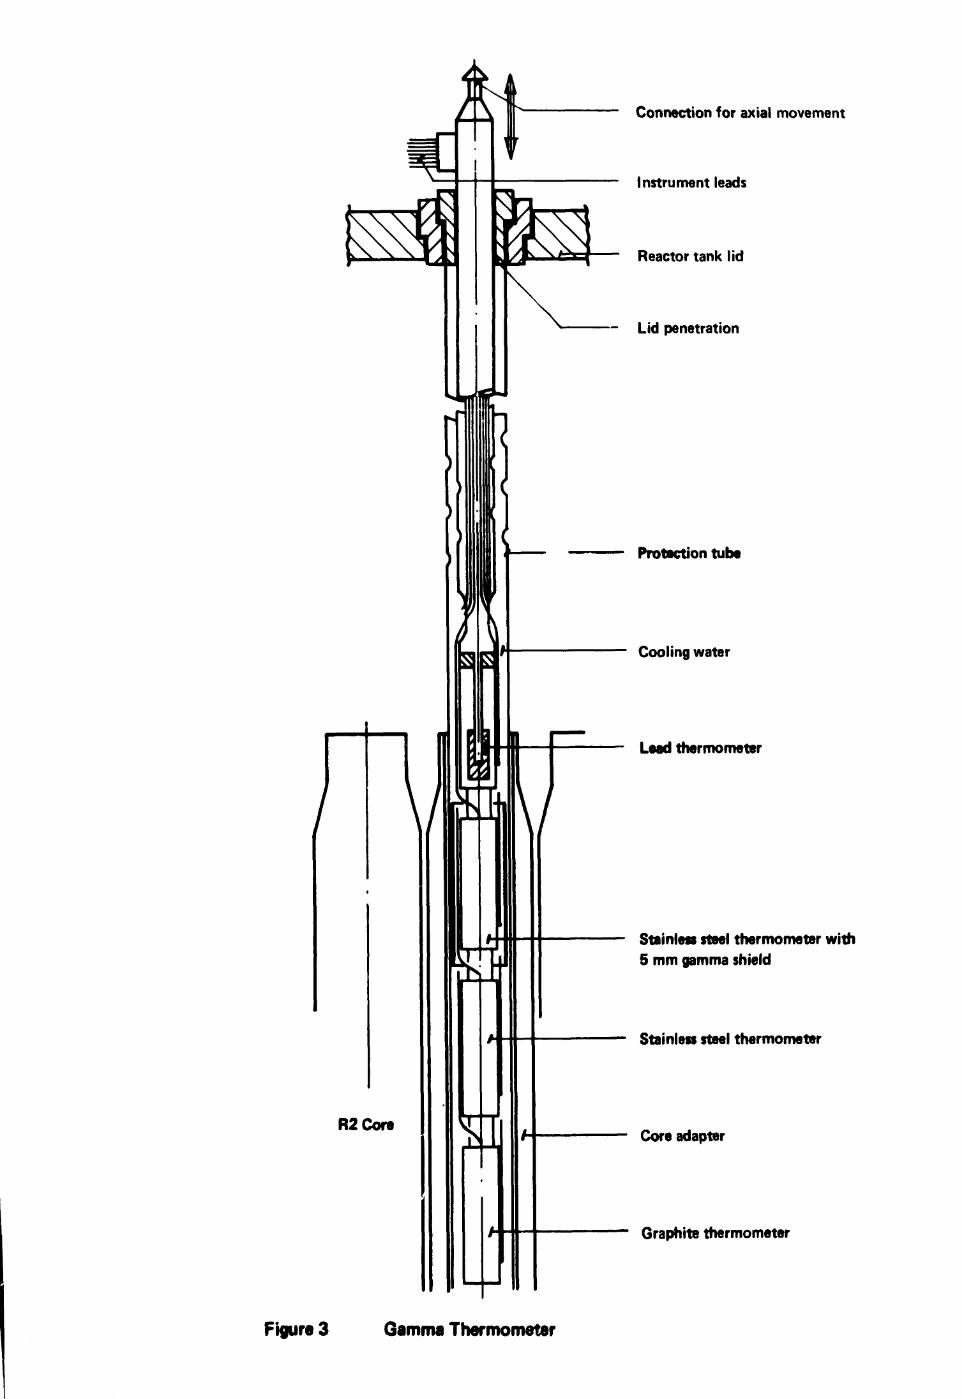
The later experiments were performed using both le?H, graphite
and stainless steel as absorbers. The design of this rig is seen in
fig 3.
The dimensioning of the absorbers is made according to the prin-
ciples presented in [ 3].
2. 2 Relationship between measured temperatures and gamma heating
2. 2. 1 A simple__mode_l_
A thorough analysis of the relationship between measured tempera-
tures and gamma heating is made in ref [3] . The basic principles
of this analysis are presented here for completeness.
Assuming that the specific heat of the absorber (C) and the heat
resistance between the absorber and the outer cylinder (R) are con-
stant, the following relationship between gamma heating (P) and
temperature difference between absorber and cylinder (0) holds.
p = f - e , (i)O
Here t is the time constant of the gamma thermometer, e. g.
when the gamma thermometer is taken suddenly into the gamma field,
the time response of the temperature is
0(t) = 9 1 ( ? - e " ^ o ) (2)
If the mass of the absorber is M the following relations hold
tQ = RMC (3)
91 = MPR (4)
From eq (1) it is evident, that gamma heating can be measured
if the specific heat C is known and if the time constant t and the tem-o
perature difference at equilibrium 9. are measured.
_ ari s_on__of jsx££J irn e nt s
According to the simple model, presented under 2. 2. 1 , the same
time constant t should appear if the gamma thermometer is taken
rapidly out from a gamma field. Then the response of the temperature
difference should be

Experiments, both out-of-pile using ice and boiling water, nnd
in-pile, using the possible axial movement of the absorber, have shown
that this simple model is not adequate. The exponential nature, as in
eq (2) and (5), is however found experimentally, but the time constants
in eq (2) and (5) are not the same.
The time dependence of the temperature in a typical case is found
in fig 5. From this figure one can see that the time constant is differ-
ent when the gamma thermometer is cooled as to when it is heated. The
analysis with different temperatures shows however, as stated before,
that the representation of the rise and decline to equilibrium by means
of an exponential function with a time constant is a very good approxi-
mation. The value of this time constant varies, however, with the
equilibrium temperature. These results are consistent with the conclu-
s i o n s d r a w n i n re f [ 2 ] and [ 3 ] .
Experimentally determined values of the time constant vs the equi-
librium temperature are found in fig 6 and fig 7. From these figures it
is evident that a linear temperature dependence is a good approxi-
mation for the time constant.
The simpliest way of refining the simple model, presented in 2. 2. 1,
is to assume a linear temperature dependence of the specific heat and
the heat resistance,
C = C + C] • 9 (6)
R = R + R] . 9 (7)
where C and R are the values at the temperature of the outer cylin-o o r ;
der, e.g. the temperature of cooling water of the core, usually
- 50°C.
A solution of the heat balance differential equation with proper
boundary conditions will give the following values for the series ex-
pansion of the "time constant" at heating
C RtQ = TO , 1 + (0,368 • - J - + 1.368 • ^1 ) e ] ; (8)
o o

- 6 -
and at
o
cooling
ro
u
f 0. 632c i
o
R
o(9)
with
T = M • R - C (10)o o o
The values of gamma heating will be for heating
C v C R 2. 718J
o o o
° 1 + ( 0 .368^ + 1.368^)o o
and for cooling
c ] ^ R1 e1] + 9 ^C - ] + C • 0. 632 9 r ^ ' 2 . 718 (R + R , 9 . ^
o o o ' ' Q / 1 ? \. _ _ e ] (12)
1 + 0.632 ( ^ + ^ I ) 9 1o o
2. 2. 4 Calibration of the gamma thermornete^r_
Thus, from eq (11) and eq (12), the values of gamma heating
can be derived from measurements of the equilibrium temperature dif-
ference 9 , once the temperature dependence of the specific heat and
the heat resistance are known. This dependence can, however, be cal-
culated from the linear dependence of the time constant vs equilibrium
temperature (fig 6 and 7) as shown by eq (8) and (9). In this way the
gamma thermometer can be calibrated. The only parameter that must
be taken from literature data is C . The other parameters C,/C ,o l o
R./R and T can be found from analysis of data as given in fig 6 and 7.
Two tests of the calibration and the validity of the model can easily
be done. Firstly, the values of the time constant approach T as 9,
approaches 0 in both the cooling case and the heating case. This is
experimentally found to be true within 2 %. Secondly, the values of
C./C should be consistent with values of the temperature dependence

- 7 -
of the specific heat. For stainless steel, the experimental values 01-4 -1
this parameter are of the order of 7 • 10 degree , which is ingood agreement with literature data in this temperature range [ 5],
The values of the specific heat at temperature 50°C (C ) which are
used in the calculations are given in table 1.
3. MEASUREMENTS
3. 1 General considerations
The measurements have been performed using three different
gamma thermometers. The first experiments were made in the 30 MW
core and are reported by Ralf Karlsson [3] , In the start-up program
of the 50 MW core, gamma thermometer measurements were also made
and reported [4], The latest series of experiments has been performed
in 1970/71 using the special gamma thermometer with stainless steel,
graphite and lead as absorbers, presented in fig 3.
In the evaluation, different ways of performing the measurements
have naturally been used. For instance, the first temperature meas-
urements were made using a bridge and then these data were used as
input to a computer program to calculate the gamma heating accord-
ing to eq 1 1 and eq 12. In the latest experiments, however, the meas-
urement and analysis were performed using the R2 data logging system
with the HP computer. Tne principle cf calculation has however been
the same as the one presented in chapter 2.
The reason for a presentation here of all the measurements made
hitherto is of course to make this description as complete as possible
and also to show that the analysis of the experimental data is consistent,
no matter what reactor core or special type of gamma thermometer
is used.
In most cases the measurements were made in six axial positions
in the core, once a day in different radial positions. In this way the
influence on the gamma heating of the control rod setting can be ana-
lysed.
3. 2 Measurements in the 30 MW core
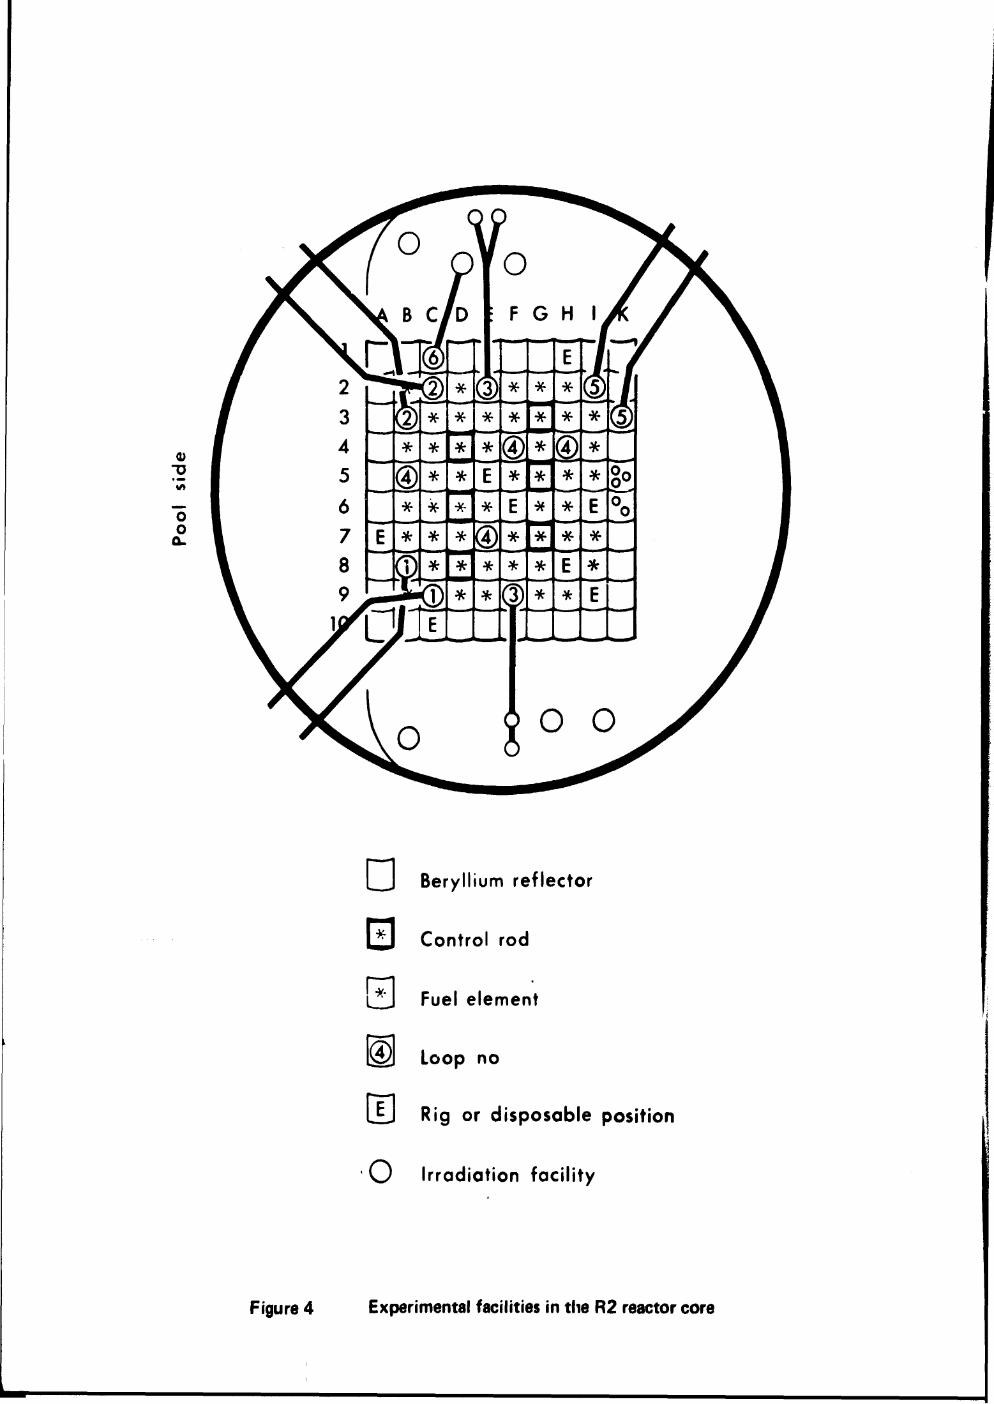
The measurements in the 30 MW core are presented in [ 3], These
measurements were performed in the position B5, F6 and F9. (The
core layout is presented in fig 4. ) The gamma thermometer used was
quite similar to the one presented in fig 2, The sensitivity of the gamma
- 8 -
thermometer was of the order of 45 C/(W/g). Typical measurements
from this series of experiments are presented in fig 8, showing gamma
heating in stainless steel measured in position B5 in the six different
axial positions using the setting of the control rods as parameter. The
measurements are summarized in table 3.
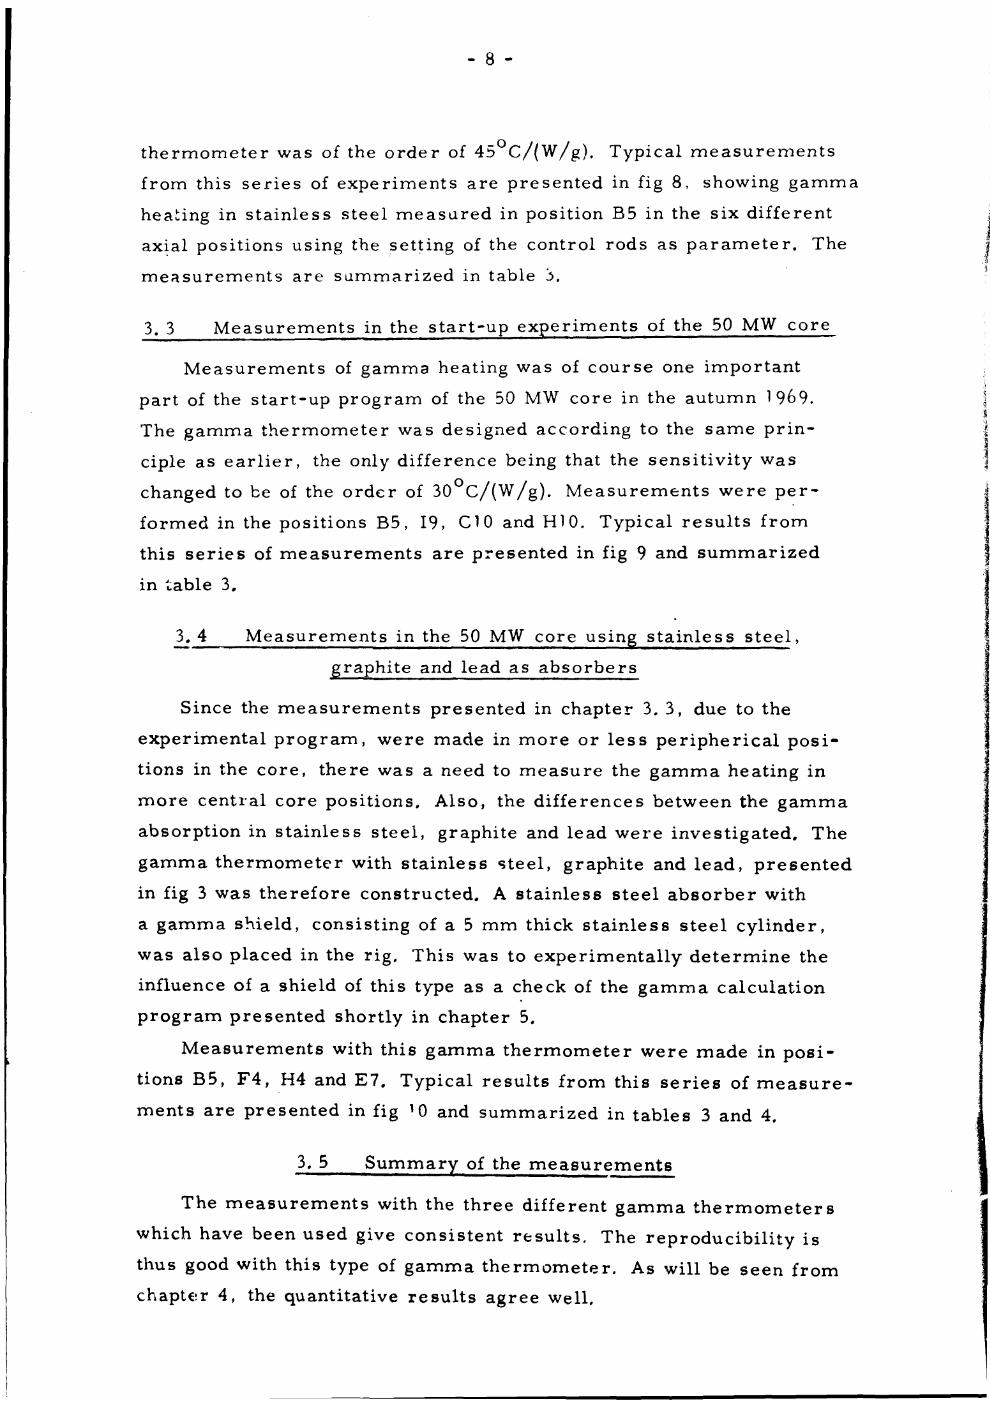
3. 3 Measurements in the start-up experiments of the 50 MW core
Measurements of gamma heating was of course one important
part of the start-up program of the 50 MW core in the autumn 1969.
The gamma thermometer was designed according to the same prin-
ciple as earlier, the only difference being that the sensitivity was
changed to be of the order of 30 C/(W/g). Measurements were per-
formed in the positions B5, 19, CIO and H10. Typical results from
this series of measurements are presented in fig 9 and summarized
in table 3.
3,4 Measurements in the 50 MW core using stainless steel,
graphite and lead as absorbers
Since the measurements presented in chapter 3. 3, due to the
experimental program, were made in more or less peripherical posi-
tions in the core, there was a need to measure the gamma heating in
more central core positions. Also, the differences between the gamma
absorption in stainless steel, graphite and lead were investigated. The
gamma thermometer with stainless steel, graphite and lead, presented
in fig 3 was therefore constructed. A stainless steel absorber with
a gamma shield, consisting of a 5 mm thick stainless steel cylinder,
was also placed in the rig. This was to experimentally determine the
influence of a shield of this type as a check of the gamma calculation
program presented shortly in chapter 5.
Measurements with this gamma thermometer were made in posi-
tions B5, F4, H4 and E7. Typical results from this series of measure-
ments are presented in fig 10 and summarized in tables 3 and 4.
3. 5 Summary of the measurements
The measurements with the three different gamma thermometers
which have been used give consistent results. The reproducibility is
thus good with this type of gamma thermometer. As will be seen from
chapter 4, the quantitative results agree well.
- 9 -
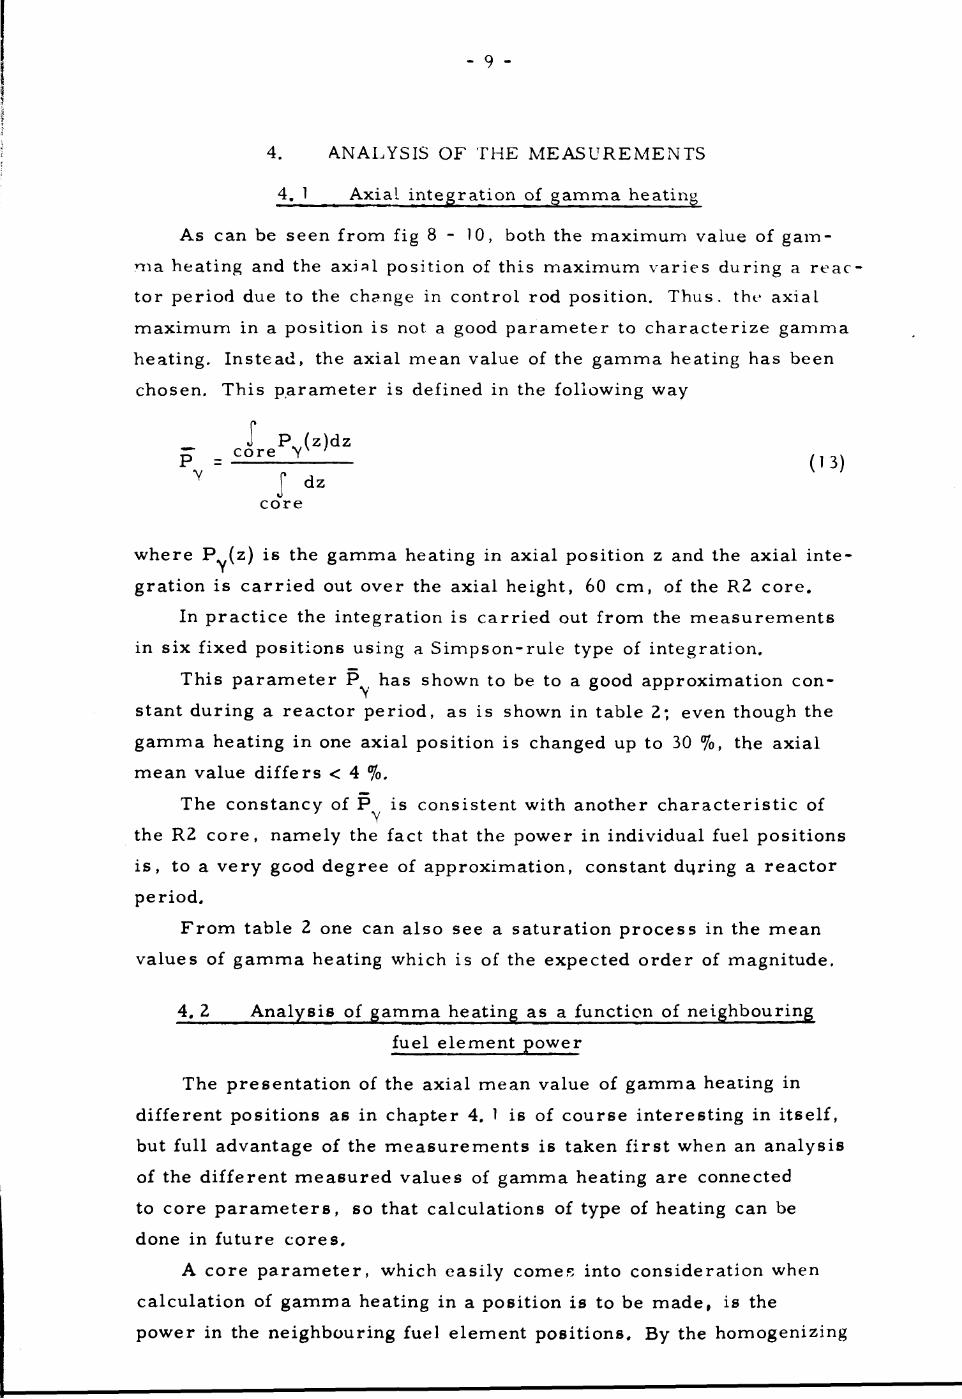
4. ANALYSIS OF THE MEASUREMENTS
4. 1 Axial integration of gamma heating
As can be seen from fig 8 - 1 0 , both the maximum value of gam-
ma heating and the axial position of this maximum varies during a reac-
tor period due to the change in control rod position. Thus, the axial
maximum in a position is not a good parameter to characterize gamma
heating. Instead, the axial mean value of the gamma heating has been
chosen. This parameter is defined in the following way
_ J Pjz)dzP = C ° r e y (13)
Y J dzcore
where Pv(z) is the gamma heating in axial position z and the axial inte-
gration is carried out over the axial height, 60 cm, of the R2 core.
In practice the integration is carried out from the measurements
in six fixed positions using a Simpson-rule type of integration.
This parameter P has shown to be to a good approximation con-
stant during a reactor period, as is shown in table 2; even though the
gamma heating in one axial position is changed up to 30 %, the axial
mean value differs < 4 %.
The constancy of P is consistent with another characteristic of
the R2 core, namely the fact that the power in individual fuel positions
is, to a very good degree of approximation, constant dijring a reactor
period.
From table 2 one can also see a saturation process in the mean
values of gamma heating which is of the expected order of magnitude.
4. 2 Analysis of gamma heating as a function of neighbouring
fuel element power
The presentation of the axial mean value of gamma heating in
different positions as in chapter 4. 1 is of course interesting in itself,
but full advantage of the measurements is taken first when an analysis
of the different measured values of gamma heating are connected
to core parameters, so that calculations of type of heating can be
done in future cores.
A core parameter, which easily comes into consideration when
calculation of gamma heating in a position is to be made, is the
power in the neighbouring fuel element positions. By the homogenizing

- 10 -
of a fuel element and assuming a value of the gamma energy of 1 MeV,
it was possible to calculate the relative range of gammas when trans-
ported from one position to th-̂ other. This (rather crude) model gave
the weight factors as presented in fig 1 1. Here the fuel position closest
to the experimental position has arbitrarily been given the weight 1. 00.
Presentation of the thus weighted power in the neighbouring fuel
element together with the axial mean value of the gamma heating is
made in table 3, which is presented graphically in fig 11.
From fig 11 it is evident that the representation of P., with the
parameter ^CD.-WP. is useful. A. least square analysis of fig 1 1 gives
the following relationship between the parameters
Py = 1.37 • 2a)j^Pj - 0. 15 (14)j
Here P is measured in W/g stainless steel and Pj in MW. The
standard deviation between the measured gamma heating and the cal-
culated gamma heating according to Eq (14) is found to be 5. 5 %.
4. 3 Influence of control rod positioning
The influence of control rod positioning on gamma heating can
easily be analysed by dividing the measured gamma heating in different
positions by the axial mean value of the gamma heating, calculated
according to chapter 4. 1. Thus, relative values of gamma heating
for different axial positions are calculated and these values are, as
expected, found not to vary from core to core, but to be constant within
the experimental positions. In fact, it is found that when the influence
of control rods is discussed, it is possible to divide the experimental
positions in two groups, one representing positions in the vicinity of
a control rod (F4, H4, E5, E7 and H8)'and one representing positions
close to the beryllium-reflector (B5, E2, F2 and 19). The influence of
control rod position for the first group is given by fig 12 and for the sec-
ond group by fig 13, The line in these figures represents a parabolic ap-
proximation of the influence of the control rods. This was done to smooth
out the experimental points.
Using fig 12, 13 and the parabolic approximation, it is possible to
draw a more practical figure, giving the axial distribution of gamma
heating with the control rod setting as parameter. This is done in fig
14 and 15.

- u -
4.4 Relationship between gamma heating in stainless steel,
graphite and lead
All values of gamma heating which have been reported hitherto
refer to gamma heating in W/g stainless steel. Due to the importance
of gamma heating in calculations of the power in the coated particle
fuels, graphite was introduced as absorber in the latest gamma ther-
mometer. To measure gamma heating in a heavy material, lead was
also introduced as absorber in this rig. These absorbers were of
course calibrated in the same way as the stainless steel absorbers,
as was presented in chapter 2. 2. 4. The values of the calibration con-
stants were in this case the same as was expected from literature
data.
The ratio between the gamma heating in W/g of respective ma-
terial and the gamma heating in W/g stainless steel is seen in table 4.
The relationship between gamma heating in graphite and stainless
steel shows a difference if the measurements were performed during the
start-up of the reactor or after the reactor has been run on 50 MW
for some time. Two factors can give this difference. Firstly, the tem-
perature of the water coolant, which defines the lower temperature
in the temperature difference measurements varies from ~ 20 to
50 C during start-up, whereas in the analysis the specific heat C
is taken at 50 C. Also, gamma radiation is by no means saturated
during a start-up period, whereas the difference in saturation when
the reactor has run on constant power for some time can be neglected.
This fact has not been analysed further, since the interesting factors
in this context are what happens during the power periods of the reac-
tor and not during start-up.
The values of gamma heating in lead is, as expected from the
larger absorption coefficient of lead at lower energies, larger th^n
the gamma heating in stainless steel. The ratio that is presented in
table 4 is the ratio with the thermometer just at the core edge. Due
to the large degree of gamma heating and the low melting point of lead,
measurements could not be taken in the core with the reactor at full
power.
5. CONVERSIONS OF MEASURED GAMMA HEATING TO GAMMA
HEATING IN ACTUAL RIGS
In previous chapters, we have presented measurements and an
analysis of these measurements, giving a consistent picture of the
gamma heating in the gamma thermometer. The aim of the work and

- 12 -
effort spent on this problem is, however, to go one step further and
give principles of calculations for actual rigs. For this purpose,
a computer program GAMMA [8] , was developed.
This program uses the point-kernel method, also called the build-
up factor method because it includes the use of energy deposition build-
up factors. This method is widely used due to its simplicity and favour-
able agreement with experimental results. Gamma rays from fission,
fission products and neutron capture are included and the resulting
gamma field divided into seven energy groups. The source volume is
divided into sub-volumes with special consideration to the R2 core geom-
etry. The program is now being tested and a report of these test cal-
culations will be given elsewhere. It can however be noted, that the cal-
culated influence of stainless steel absorber and the ratio of gamma
heating in graphite to the gamma heating in stainless steel is in good
agreement with the figures given in table 4. The absorption in lead is,
however, not very well described by the calculations, which is a con-
sequence of the rather crude group structure for low energies.
The calculation of gamma heating in actual rigs will be conducted
in the following way. For a given experiment, calculations are made
with the GAMMA program with both the actual rig and the gamma
thermometer in the irradiation position. The first calculation will
be done with dose points in different positions to give the radial and
axial distribution of the gamma heating. Calculations with the gamma
thermometer will, however, only be done with the dose point symmet-
rical in the SS absorber. Thus, these calculations give ratios of the
actual gamma heating in the rig relative to the gamma heating in SS.
The latter is then calculated using the outline given in chapter 4.2.
6. CONCLUSIONS
The data and the analysis presented here give a complete and con-
sistent picture of the measured gamma heating in the R2 core. With
the GAMMA program available, as indicated in chapter 5, a firm
ground can be laid for the calculations of gamma heating in experiments
and rigs in the R2 core as well as for new geometries and materials.
- 13 -
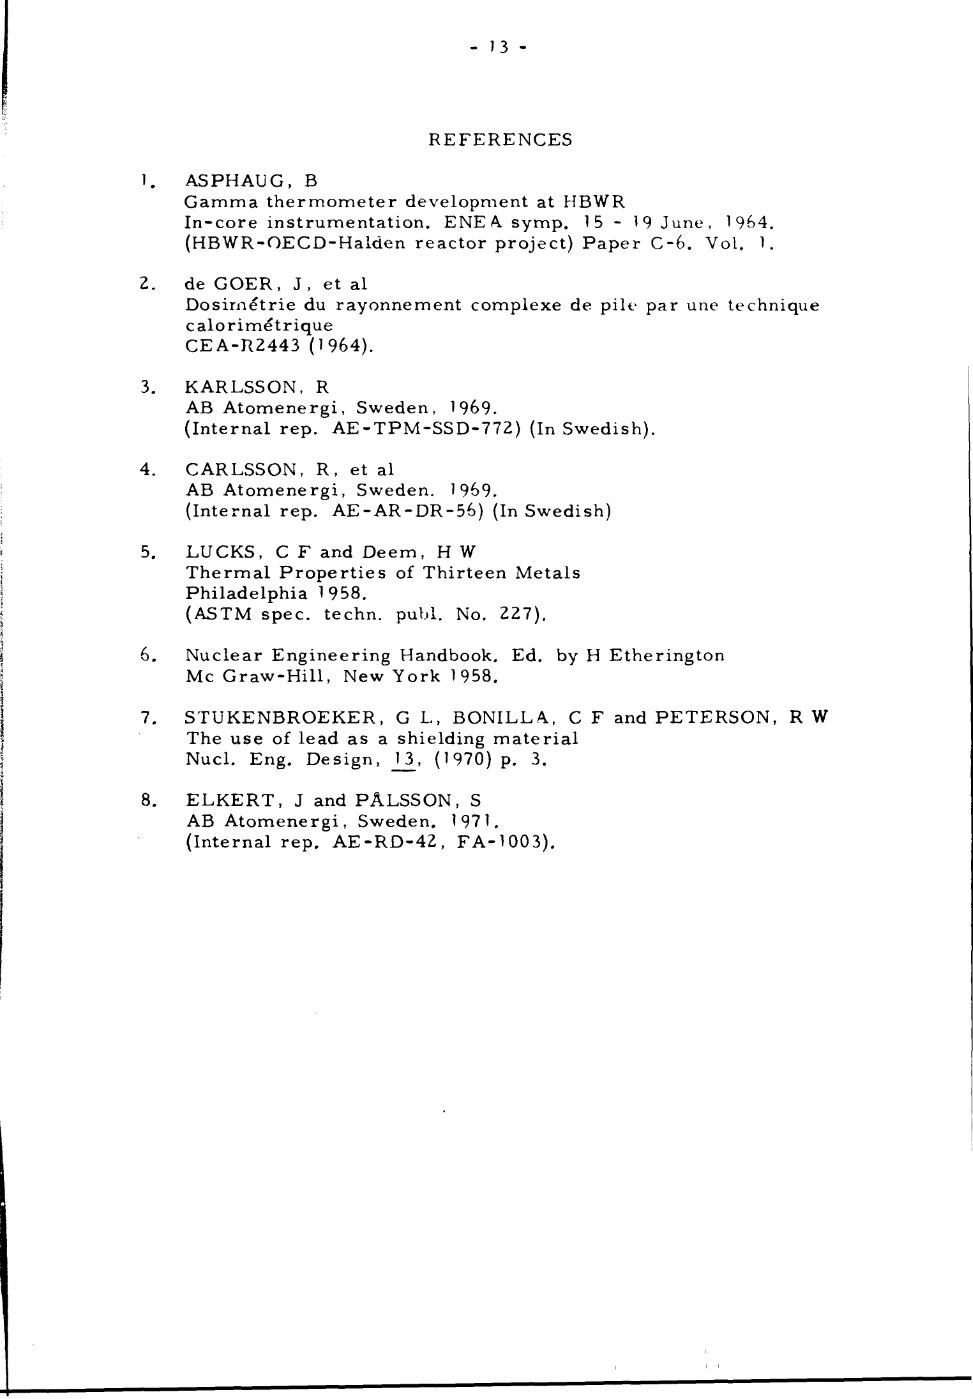
REFERENCES
1. ASPHAUG, BGamma thermometer development at HBWRIn-core instrumentation. ENEA. symp. 1 5 - 1 9 June, 1964.(HBWR-OECD-Halden reactor project) Paper C-6. Vol. 1.
2. de GOER, J , et alDosirnétrie du rayonnement complexe de pile par une techniquecalorimétriqueCEA-R2443 (1964).
3. KARLSSON, RAB Atomenergi, Sweden, 1969.(Internal rep. AE-TPM-SSD-772) (In Swedish).
4. CARLSSON, R, et alAB Atomenergi, Sweden. 1969.(Internal rep. AE-AR-DR-56) (In Swedish)
5. LUCKS, C F and Deem, H WThermal Properties of Thirteen MetalsPhiladelphia 1958.(ASTM spec, techn. publ. No. 227).
6. Nuclear Engineering Handbook. Ed. by H EtheringtonMe Graw-Hill, New York 1958.
7. STUKENBROEKER, G L, BONILLA, C F and PETERSON, R WThe use of lead as a shielding materialNucl. Eng. Design, _1_3» (1970) p. 3.
8. ELKERT, J and PÄLSSON, SAB Atomenergi, Sweden. 1971.(Internal rep. AE-RD-42, FA-1003).
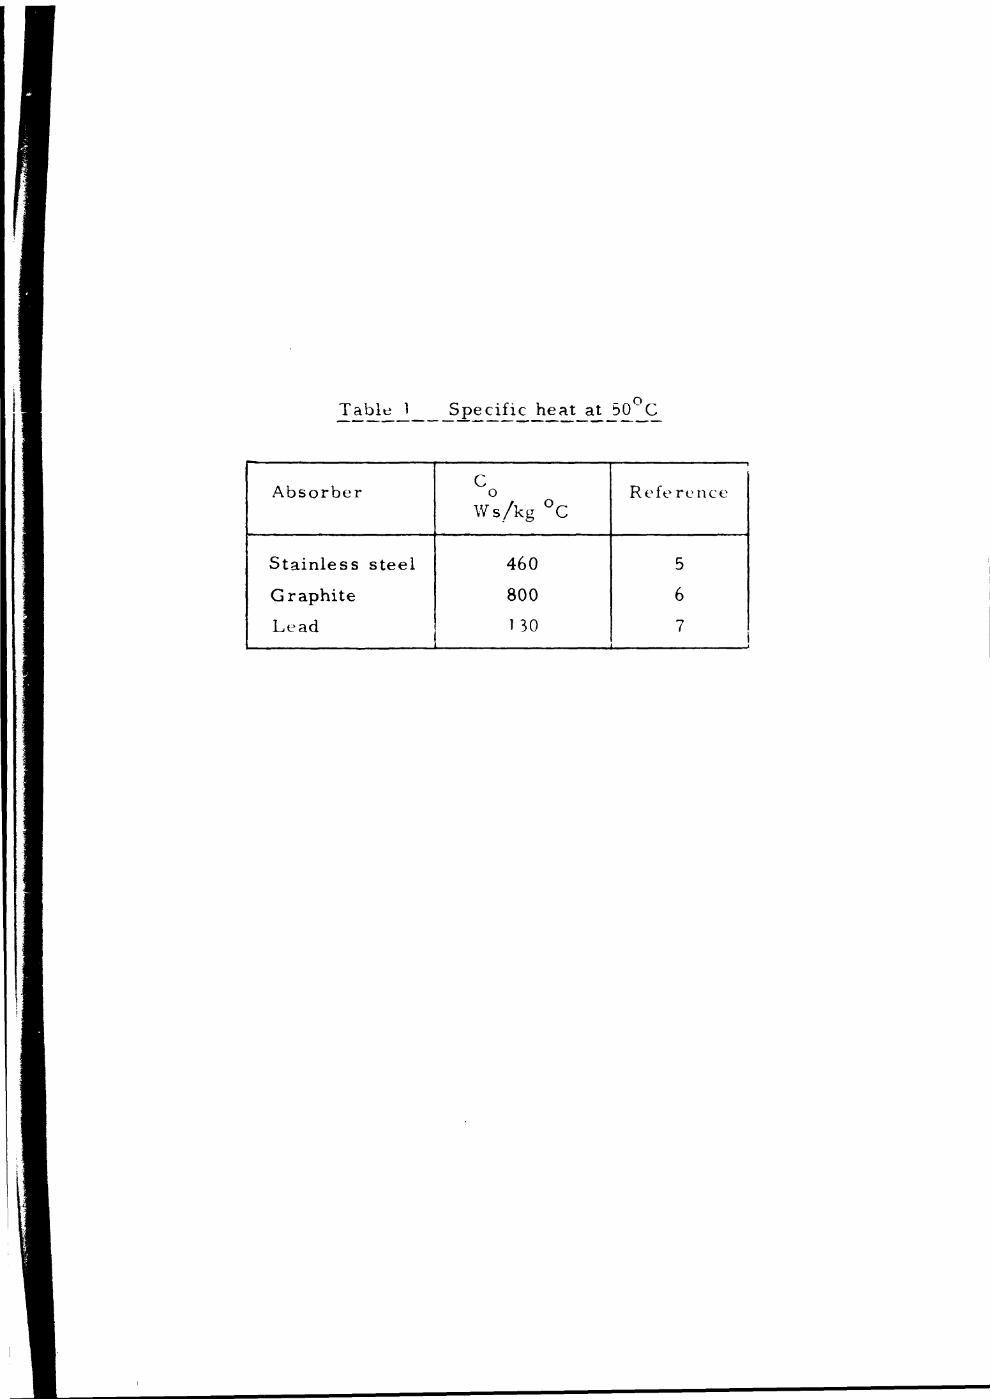
Table 1 Specific heat at 50 C
Absorber
Stainless steel
Graphite
Lead
Co
Ws/kg °C
460
800
130
Reference
5
6
7

Table 2 Gamma thermometer in pos F4 period 027 1 , core 352
Date ofmeasure-
ment
0131
0201
0202
0203
0204
0205
0206
0207
0208
0209
0210
021 1
0212
0213
0214
0215
0216
Controlrod
position
46. 0
46. 8
47. 8
48. 7
49. 5
51. 0
52. 0
53. 0
54. 2
55. 3
56. 8
58.0
59.0
60.0
6 1 . 8
63. 5
65.4
Gamma heating in W/g
z = -30 cm
6. 97
6. 88
6. 82
6. 74
6. 64
6. 58
6. 48
.6. 40
6. 30
6. 21
6. 10
6. 04
5. 94
5. 81
5. 70
5. 61
5.49
z = - 18 cm
11.49
1 1. 41
1 1. 30
1 1. 20
1 1. 08
10. 87
10. 84
10.69
10. 63
10. 48
10. 27
10. 12
10. 01
9.91
9.71
9. 53
9. 34
stainless s
z = -6 cm
12. 36
12. 45
12. 53
12.48
12. 40
12.44
12. 46
12. 33
12. 30
12. 22
12. 15
12. 00
1 1. 95
1 1.82
1 1. 73
^ 1. 62
1 1. 38
feel in di f ferent axial posit ions
z - 6 cm
9.80
9. 94
10. 04
10. 26
10. 39
10. 53
10. 70
10. 75
10. 96
1 1.07
1 1. 18
1 1.27
1 1. 32
1 1.42
1 1.64
1 1. 54
1 1. 50
z = 18 cm
6. 55
6. 66
6. 77
6. 90
7. 00
7. 14
7. 32
7.43
7. 62
7. 82
8. 08
8. 15
8.49
8. 73
8.90
8. 93
9. 35
z = 30 cm
3.41
3. 42
3.49
3. 52
3. 63
3.66
3. 76
3. 82
3. 90
3. 99
4. 15
4. 24
4.45
4. 58
4.69
4. 82
5. 03
Axialmeanvalue
9. 18
9. 23
9. 27
9. 31
9. 32
9. 34
9. 41
9. 39
9.45
9. 46
9.49
9.46
9. 51
9. 53
9. 55
9. 48
9.47

___J^e^^r^^_^i^jriean:_va_lue__of £amma heating in W/gn neighbouring fuel elements
Measure-ment
accordingto chapt
3.2
3. 3
3.4
CoreNo
195C
195C
201
203
288
289
290
293
299306
309
340
341
342
343
345
346
352
353
354
357
375
376
Position
F6
B5
F9
B5
19
B5
cio1)
19B5
B5
H 1 0 1 )
E7
B5
H4
B5
B5
F4
F4
B5
F4
F4
F9E2
MW
5.61
3.40
3. 52
3. 00
2.43
5.25
1. 18
2. 33
5.08
5.47
1.44
8.04
5.57
6.52
6. 16
5. 16
6.69
6. 93
5. 18
7.02
6. 88
5, 19
5.04
W/g
7.98
4. 76
5.28
4.44
2. 77
7. 32
3.05
3.20
6. 54
6.74
2.42
1 1.64
6.998. 34
7.03
7.03
8. 94
9.40
7.08
10.08
9.05
6.896. 15
' Pos C10 and H10 are in the Be-reflector of thecore (see fig 5)

Table 4
SS
SSS
C
Pb
and stainless ^ _ _
stainless steel absorber
stainless steel absorber with shield
graphite absorber
lead absorber
CoreNo
340
341
342
343
345
346
352
353
353
Mean
Position
E7
B5
H4
B5
B5
F 4
F 4
B5
B5
values
SSS/SS
0. 81
0. 79
0. 77
0. 78
0. 77
0. 78
0.76
0. 81
0. 73
0.78
c/ss
(1.05)1
0. 89
0.90
0.89
0.89
(0 .95) 2
(0 .95) 2
(0. 98)1
(0. 95)2
0.89
Pb/SS
1. 46
(U3)1
1. 33
1. 31
1. 34
1.43
1.41
1.43
1. 28
1. 37
Only during the start-up of the period
Only two values in the beginning of the period

30 mm
20 mm
10 mm
1
• * * •
Support tube
Heat conductor
He gas
C/A Thermocouples
Heat absorber
Stainless steel containment
Figure 1 Gamma thermometer.
R2 Core
Connection for axial movement
Instrument leads
Reactor tank lid
Lid penetration
Protection tube
Coolant water
C »adapter
Gamma thermometer
Figure 2 Drawing of Gamma-Thermometer. Assembly.
Connection for axial movement
Instrument leads
Reactor tank lid
- Lid penetration
Protection tube
Cooling water
Lead thermometer
Stainless steel thermometer with5 mm gamma shield
Stainless steel thermometer
Core adapter
Graphite thermometer
Figure 3 Gamma Thermometer
0)13
OO
Q.
Beryllium reflector
Control rod
Fuel element
E
Loop no
Rig or disposable position
O Irradiation facility
Figure 4 Experimental facilities in the R2 reactor core

100 -*
50 -
20 -
10 -
* heating
o cooling
to = 24.7 s
10 20 30i
40
i
50 60 70 s
Figure 5 The rise and decline of equilibrium temperature vs time

Figure 6 The time constant fcr hating as a function ofthe equilibrium temperature difference
oo
- 8
T8

Figure 7 The time constant forcooling as a function ofthe equilibrium tem-perature
oo
K
X * M
r.
XX
XXK
Oin
\- 8
h S

Figure 8 Gamma heating in stainless steel measured in positionB5 using the setting of the control rods as parameter.Reactor power 30 MW. Core 203
x 48 cm• 5? cmA 55 cmD 58 cmo 61 cm
PTW/g
200 300 mm
R2

Figure 9 Gamma heating in stainless steel measured in position B5 usingthe setting of the control rods as parameter.Reactor power 50 MW. Core 299
9 - -
PTW/g
o 53 cmD 59 cmV 63 cm
5 - -
4 - -
3 - •
2 - -
1 • -
•300 •200 •100 100 200 300 mm
R2CL

Figure 10 Gamma heating in stainless steel measured in position B5 using thesetting of the control rods as parameter.Reactor power 50 MW. Core 353
o 53cmD 59cmV 63cm
I
300 mm
R2CL

Figure 11 The axial mean value of gamma heating using the weighted power inthe neighbouring fuel elements as parameter.
SE
3 I1-1
10.
_. o
- o>
- 00
0.04
0.10
0.20
0.10
0.04
0.10
0.43
1.00
0.43
0.10
0.20
1.00
X
1.00
oro
0.10
0.43
1.00
0.43
0.10
0.04
0.10
oro
0.10
0.04
in
Si•8
- CO
- C\!
esi co *•co vi vi
a o
I00
I(0 CM

Figure 12 Relative value of gamma heating in different axial positions as a function ofcontrol rod position in R2. Central positions.
1.4 H
1.3 H
1.2 H
1.1 H
1.0
0.4 H
0.8 H
0.7 H
0.6 -
0.5 H
0.4 H
0.3 H
Z - + 300
o o

Figure 13 Relative value of gamma heating in different axial positions as a function ofcontrol rod position in R2. Peripheral positions.
i .4 "
1.3 -i
1.2 H
1.1 H
1.C
0.9 H
n.8 H
0.7 H
0.6 H
0.5 H
0.4 H
0.3 H
= + 60
^̂ i __m Z - + 300

Figure 14 Relative axial gamma heating in a central position in R2 with setting of
control rods as parameter.
45
50556065
66 cm
00»
56»50»45»
•300 200 300 mm
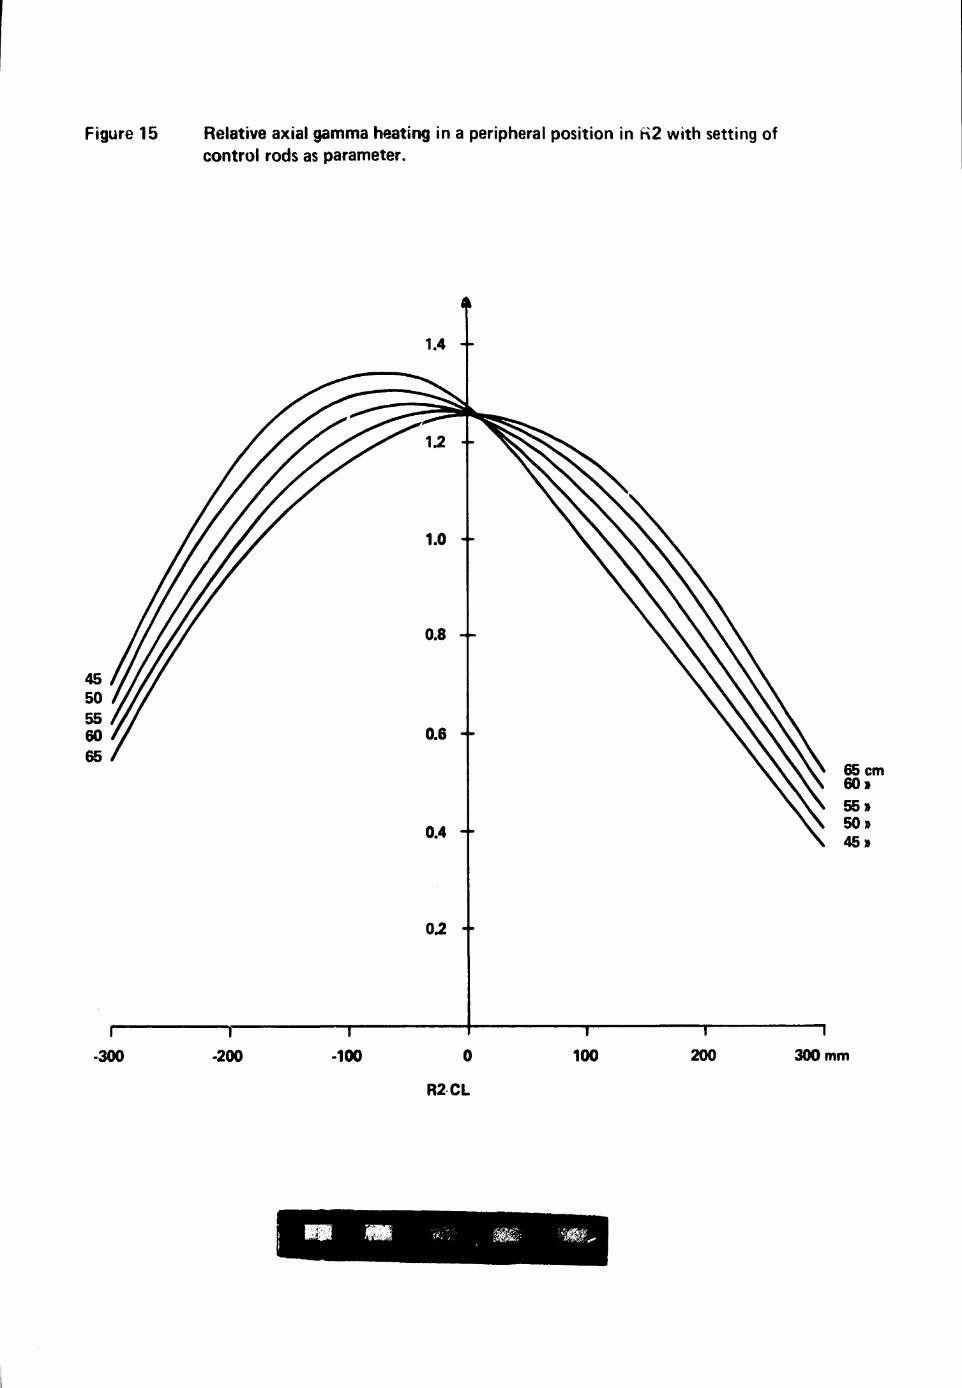
Figure 15 Relative axial gamma heating in a peripheral position in K2 with setting ofcontrol rods as parameter.
65 cm60»55»50»45»
-300 200 300 mm

copper-reflected fast
G. Malmskog. 1970
of tracei
LIST OF PUBLISHED AE-REPORTS
1-390 (See back cover earlier reports.)
391. Half-life measurements in '»I . By V. Berg and A. Höglund. 1970. 16 pSw. cr. 10:-.
392. Measurement of the neutron spectra in FRO cores 5, 9 and PuB-5 usingresonance sandwich detectors. By T. L. Andersson and M. N. Qazi. 1970.30 p. Sw. cr. 10:-.
393. A gamma scanner using a Ge(Li) semi-conductor detector with the possi-bility of operation in anti-coincidence mode. By R. S. Forsyth and W. H.Blackadder. 1970. 22 p. Sw. cr. 10:-.
394. A study of the 190 keV transition in "'La. By B. Berg, A. Höglund and BFogelberg. 1970 22 p. Sw cr. 10:-.
395. Magnetoacoustic waves and instabilities in a Hall-effect-dominiated plasmaBy S. Palmgren. 1970. 20 p. Sw. cr. 10:-.
396. A new boron analysis method. By J. Weitman, N. Dåverhög and S. Farvol-den. 1970 26 p. Sw. cr. 10:-.
397. Progress report 1969. Nuclear chemistry. 1970. 39 p. Sw. cr. 10:-.398. Prompt gamma radiation from fragments in the thermal fission of " 'U . By
H. Albinsson and L. Lindow. 1970. 48 p. Sw. cr. 10:-.399. Analysis of pulsed source experiments performed in
assemblies. By J. Kockum. 1970. 32 p. Sw. cr. 10:-.400. Table of half-lives for excited nuclear levels. By S
33 p. Sw. cr. 10:-.401. Needle type solid state detectors for in vivo ,..-asure-nent
activity. By A. Lauber, M. Wolgast. 1970. 43 p. Sw cr 10:-402. Application of pseudo-random signals to the Agesta nuclear power station
By P-A. Bliselius. 1970. 30 p. Sw. cr. 10:-.403. Studies of redox equilibria at elevated temperatures 7 An automatic di-
vided-function autoclave and cell with flowing liquid junction for electrochemical measurements on aqueous systems. By K. Johnsson. D Lewis andM. de Pourbaix. 1970. 38 p. Sw. cr. 10:-.
404. Reduction of noise in closed loop servo s/stems. By K. Nygaard 137023 p. Sw. cr. 10:-.
405. Spectral parameters in water-moderated lattices. A survey of experimentaldata with the aid of two-group formulae. By E. K. Sokolowski. 1970. 22 p.Sw. cr. 10:-.
406. The decay of optically thick helium plasmas, taking into account ionizingcollisions between metastable atoms or molecules. By J. S'.cvelelt 1970.18 p. Sw. cr. 10:-.
407. Zooplankton from Lake Magelungen, Central Sweden 1960-63. Ely E. Aim-quist. 1970. 62 p. Sw. cr. 10:-.
408. A method for calculating the washout of elemental iodine by water sprays.By E Bachofner and R. Hesböl. 1970. 24 p. Sw. cr. 10:-.
409. X-ray powder diffraction with Guinier-HSgg focusing cameras. By A. Brown1970. 102 p. Sw. cr. 10:-.
410. General physic section Progress report. Fiscal year 1969/70. By J. Braun.1970. 92 p. Sw cr. 10:-.
411. In-pite determination of the thermal conductivity of UOi in the range 500-2 500 degrees centigrade. By J-A Gyllander. 1971. 70 p. Sw. cr. 10:-.
412. A study of the ring test for determination of transverse ductility of fuelelement canning. By G. Anevi and G. Östberg. 1971. 17 p. Sw. cr. 1 5 - .
413. Pulse radiolysis of Aqueous Solutions of aniline and substituted anilines.By H. C. Christensen. 1971. 40 p. Sw. cr. 15:-.
414. Radiolysis of aqueous toluene solutions. By H. C. Christensen and R. Gustaf-son. 1971. 20 p. Sw. cr. 15:-.
415. The influence of powder characteristics on process and product parame-ters in UO; pelletization. By U. Runfors. 1971. 32 p. Sw. cr. 15:-.
416. Quantitative assay of Pu239 and Pu240 by neutron transmission measure-ments. By E. Johansson. 1971. 26 p. Sw. cr 15:-.
417. Yield of prompt gamma radiation in slow-neutron induced fission of >"U asa function of the total fragment kinetic energy. By H. Albinsson. 1971. 38 p.Sw. cr. 15:-.
418. Measurements of the spectral !:jht emission from decaying high pressurehelium plasmas. By J. Stevefelt and J. Johansson. 1971. 48 p. Sw. cr. 15:-
419. Progress report 1970. Nuclear chemistry. 1971. 32 p. Sw. cr. 15:-.420. Energies and yields of prompt gamma rays from fragments in slow-neutron
Induced fission of " ' U . By H. Albinsson. 1971. 56 p. Sw. cr. 15:-.421. Decay curves and half-lives of gamma-emitting states from a study of prompt
fission gamma radiation. By H. Albinsson. 1971. 28 p. Sw. cr. 15:-.422. Adjustment of neutron cross section data by a least square fit of calculated
quantities to experimental results. Part 1. Theory. By H. Higgblom. 1971. 28p. Sw. cr. 15:-.
423. Personnel dosimetry at AB Atomenergi during 1969. By J. Carlsson and T.Wahlberg. 1971. 10 p. Sw. cr. 15:-.
424. Some elements of equilibrium diagrams for systems of iron with water above100°C and with simple chloride, carbonate and sulfate melts. By D. Lewis.1971. 40 p. Sw. cr. 15:-.
425. A study of material buckling in uranium-loaded assemblies of the fast reactorFRO. By R. Håkansson and L. I. Tirén. 1971. 32 p. Sw. cr. 15:-.
426. Dislocation line tensions in the noble metals, the alkali metals and /?-Brass.By B. Pettersson and K. Malén. 1971. 14 p. Sw. cr. 15:-.
427. Studies of fine structure in the flux distribution due to the heterogeneityin tome FRO cores. By T. L. Andersson and H. Häggblom. 1971. 32 p Sw.cr. 15:-.
428. Integral measurement of fission-product reactivity worths in some fast re-actor spectra. By T. L. Andersson. 1971. 36 p. Sw. c». 15:-.
429. Neutron energy spectra from neutron induced fission of " 'U at 0.95 MeVand of " 'U at 1.35 and 2.02 MeV. By E. Almén, B. Holmqvist and T. Wied-llng. 1971. 16 p. Sw. cr. 15:-.
430. Optical model analyses of experimental fast neutron elastic scattering data.By B. Holmqvist and T. Medling. 1971. 238 p. Sw. cr. 20:-.
431. Theoretical studies of aqueous systems above 25°C. 1. Fundamental con-cept* for equilibrium diagrams and some general features of the watersystem. By Derek Lewis. 1971. 27 p. Sw. cr. 15:-.
432. Theoretical studies of aqueous systems above 25°C . 2. The iron - watersystem. By Derek Lewis. 1971. 41 p. Sw. cr. 15:-.
433. A detector for (n,y) cross section measurements. By J Hellström and S.Beshai. 1971. 22 p. Sw. cr. 15:-.
434. Influence of elastic anisotropy on extended dislocation nodes. By B.Petterston. 1971. 27 p. Sw cr. 15:-.
435. Lattice dynamics of CsBr. By S. Ro!andson and G. Raunio. 1971. 24 p. Sw.cr. 15:-.
436. The hydrolysis of iron (III) and iron (II) ions between 25 C and 375 C. ByDerek Lewis. 1971.16 p. Sw cr. 15:-.
437. Studies of the tendency of intergranular corrosion cracking of austeniticFe-Cr-Ni alloys in high purity water at 30(PC. By W. Hiibner, B. Johanssonand M. de Pourbaix. 1971. 30 p. Sw. cr. 15:-.
438. Studies concerning water-surface deposits in recovery boilers. By O. Strand-berg, J. Arvesen and L. Dahl. 1971. 132 p. Sw. cr. 15.-.
439. Adjustment of neutron cross section data by a least square fit of calcu-lated quantities to experimental results. Part I I . Numerical results. By H.Häggblom. 1971. 70 p. Sw. cr. 15:-.
440. Self-powered neutron and gamma detectors for in-core measurements. ByO. Strindehag. 1971. 16 p. Sw cr. 15:-.
441. Neutron capture gamma ray cross sections for Ta, Ag. In and Au between30 and 175 keV. By J. Hellström and S. Beshai. 1971. 30 p. Sw. cr. 15:-.
442. Thermodynamical properties of the solidified rare gases. By I. Ebbsjö. 1971.46 p. Sw. cr. 15:-.
443. Fast neutron radiative capture cross sections for some important standardsfrom 30 keV to 1.5 MeV. By J. Hellström. 1971. 22 p. Sw. cr. 15:-.
444. A Ge (Li) bore hole probe for in situ gamma ray spectrometry. By A. Lauberand O. Landström. 1971. 26 p. Sw. cr. 15:-.
445. Neutron inelastic scattering study of liquid argon. By K. Sköld, J. M. Rowe,G. Ostrowski and P. D. Randolph. 1972. 62 p. Sw. cr. 15:-.
446. Personnel dosimetry at Studsvik during 1970. By L. Hedlin and C.-O. Widell.1972.. 8 p. Sw. cr. 15:-.
447. On the action of a rotat.-jg magnetic field on a conducting liquid. By E.Dahlberg. 1972. 60 p. Sw. cr. 15:-.
448. Low grade heat from thermal electricity production. Quantity, worth andpossible utilisation in Sweden. By J. Christensen. 1972. 102 p. Sw. cr. 15:-.
449. Personnel dosimetry at studsvik during 1971. By L. Hedlin and C.-O. Widell.1972. 8 p. Sw. cr. 15:-.
450. Deposition of aerosol particles in electrically charged membrane filters. ByL. Ström. 1972. 60 p. Sw. cr. 15:-.
451. Depth distribution studies of carbon in steel surfaces by means of chargedparticle activation analysis with an account of heat and diffusion effects inthe sample. By D. Brune, J. Lorenzen and E. Witalis. 1972. 46 p. Sw. cr. 15:-.
452. Fast neutron elastic scattering experiments. By M. Salarna. 1972. 98 p. Sw.cr. 15:-.
453. Progress report 1971 Nuclear chemistry. 1972. 21 p. Sw. cr. 15:-.454. Measurement of bone mineral content using radiation sources. An annotated
bibliography. By P. Schmeling. 1972. 64 p. Sw. cr. 15:-.455. Long-term test of self-powered deectors in HBWR. By M. Brakas, O. Strin-
dehag and B. Söderlund. 24 p. 1972. Sw. cr. 15:-.456. Measurement of the effective delayed neutron fraction in three different
FRO-cores. By !.. Moberg and J. Kockum. 1972. Sw. cr. 15:-.457. Applications of magnetohydrodynamics in the metal industry. By T. Robinson,
J. Braun and S. Linder. 1972. 42 p. Sw. cr. 15:-.458. Accuracy and precision studies of a radiochemical multielement method for
activation analysis in the fielJ of life sciences. By K. Samsahl. 1972. 20 p.Sw. cr. 15:-.
459. Temperature increments from deposits on heat transfer surfaces: the thermalresistivity and thermal conductivity of deposits of magnetite, calcium hydro-xy apatite, humus and copper oxides. By T. Kelén and J. Arvesen. 1972. 68p. Sw. cr. 15:-.
460. lonization of a high-pressure gas flow in a longitudinal discharge, By S.Palmgren. 1972. 20 p. Sw. cr. 15:-.
461. The caustic stress corrosion cracking of alloyed steels — an electrochemicalstudy. By L. Dahl, T. Dahlgren and N. Lagmyr. 1972. 43 p. Sw. cr. 15:-.
462. clectrodaposition of "point" Cu1!5l toentgen sources. By P. Beronius, B.Johansson and R. Söremark. 1972. 12 p. Sw. cr. 15:-.
463. A twin large-area proportional flow counter for the assay of plutonium inhuman lungs. By R. C. Sharma, I. Nilsson and L. Lindgren. 1972. 50 p. Sw.cr. 15:-.
464. Measurements and analysis of gamma heating in the R2 core. By R. Carlssonand L. G. Larsson. 1972. 34 p. Sw. cr. 15:-.
List of published AES-reports (In Swedish)
1. Analysis by means of gamma spectrometry. By D. Brune. 1961. 10 p. Sw.cr. 6:-.
2. Irradiation changes and neutron atmosphere in reactor pressure vessels-some points of view. By M. Grounes. 1962. 33 p. Sw. cr. 6:-.
3. Study of the elongation limit in mild steel. By G. Dstberg and R. Alier-mo. 1963. 17 p. Sw. cr. 6:-.
4. Technical purchasing in the reactor field. By Erik Jonson. 1963. 64 p.Sw. cr. 8:-.
5. Agesta nuclear power station. Summary of technical data, descriptions,etc. for the reactor. By B. Lilliehöök. 1964. 336 p. Sw. cr. 15:-.
6. Atom Day 1965. Summary of lectures and discussions. By S. Sandström.1966. 321 p. Sw. cr. 15:-.
7. Building materials containing radium considered from the radiation pro-tection point of view. By Stig O. W. Bergström and Tor Wahlberg. 1967.26 p. Sw. cr. 10:-.
8. Uranium market. 1971. 30 p. Sw. cr. 15:-.9. Radiography day at Studsvik. Tuesday 27 april 1971. Arranged by AB Atom-
energi, IVA's Committee for nondestructive testing and TRC AB 1971.102 p.Sw. cr. 15:-.
10. The supply of enriched uranium. By M. Mårtensson. 1972. 53 p. Sw. cr. 15:-.Additional copies available from the Library of AB Atomenergi, Fack, S-611 01NykSping 1, Sweden.
EOS-tryckerierna, Stockholm 1972