AJM innerpages Jan mar 2013 final - Aurora's Business School APR-JUN 2013.pdf · body of the...
36
4 5 7 21 28 37 38 From the Editor's Desk Guidelines for Authors Apparel Shopping Behaviour: A study of management students in Mumbai and Navi Mumbai - Sandeep Bhanot Insurance as Growth Engine for Building India: A brief disposition - V Jayalakshmi Gender Differences in Internet Usage and Attitudes toward Internet Advertising - Dr. E Krishna Karthik, Dr. P Raghunadha Reddy Call for Papers Guidelines for Submission of Book Reviews in AJM Contents EDITED, PRINTED, PUBLISHED AND OWNED BY MEGHAMALINI PATURI, 401, A. H.NO. 12-5-C/6/1, OM SAI EMRALD APARTMENTS, VIJAYAPURI, TARNAKA, SECUNDERABAD, HYDERABAD, A.P. PRINTED AT AKRUTHI OFFSET PRINTERS, H.NO.1-1-191/A, CHIKKADAPALLY, HYDERABAD-500020, A.P. PUBLISHED AT AURORA'S BUSINESS SCHOOL, CHIKKADAPALLY, HYDERABAD -500 020, A.P. EDITOR:MEGHAMALINI PATURI.
Transcript of AJM innerpages Jan mar 2013 final - Aurora's Business School APR-JUN 2013.pdf · body of the...

4
5
7
21
28
37
38
From the Editor's Desk
Guidelines for Authors
Apparel Shopping Behaviour: A study of management students in Mumbai and Navi Mumbai- Sandeep Bhanot
Insurance as Growth Engine for Building India: A brief disposition - V Jayalakshmi
Gender Differences in Internet Usage and Attitudes toward Internet Advertising- Dr. E Krishna Karthik, Dr. P Raghunadha Reddy
Call for Papers
Guidelines for Submission of Book Reviews in AJM
Contents
EDITED, PRINTED, PUBLISHED AND OWNED BY MEGHAMALINI PATURI, 401, A. H.NO. 12-5-C/6/1, OM SAI EMRALD APARTMENTS, VIJAYAPURI, TARNAKA, SECUNDERABAD, HYDERABAD, A.P. PRINTED AT AKRUTHI OFFSET PRINTERS, H.NO.1-1-191/A, CHIKKADAPALLY, HYDERABAD-500020, A.P. PUBLISHED AT AURORA'S BUSINESS SCHOOL, CHIKKADAPALLY, HYDERABAD -500 020, A.P. EDITOR:MEGHAMALINI PATURI.

AURORAS JOURNAL OF MANAGEMENT 4 APR – JUN 2013

Guidelines for Authors
Auroras Journal of Management (AJM) invites original papers from scholars, academicians and practitioners pertaining to management, business, and organizational issues. AJM also welcomes articles dealing with the social, economic and political factors that influence the business and industry. Papers, based on theoretical or empirical research or experience, should illustrate the practical applicability and/ or policy implications of work described.
The Editorial Board offers the following guidelines which are to be followed while contributing papers for publication in AJM:
ManuscriptThe Author should send three copies of the final manuscript. The text should be double-spaced on A4 size paper with one-inch margins all around. The Author's name should not appear anywhere on the body of the manuscript to facilitate the blind review process. The Author may send a hardcopy of the manuscript to Aurora's Business School or e-mail the MS Word Document at [email protected]. The manuscripts should be submitted in triplicate and should have been proof-read by the Author(s) before submission.
The paper should accompany the following on separate sheets (1) An executive summary of about 500 words along with five key words, and (2) A brief biographical sketch (60-80) words of the Author describing current designation and affiliation, specialization, number of books and articles in refereed journals, and membership on editorial boards and companies, etc. along with their contact information.
AJM has the following features:l Research Articles which present emerging issues and ideas that call for action or rethinking by
managers, administrators and policy makers in organizations. Recommended length of the article should be limited to 7,500 words.
l Book Reviews which covers reviews of contemporary and classical books on Management.l Articles on with social, economic and political issues which deal with the analysis and resolution
of managerial and academic issues based on analytical, empirical or case research/ studies/ illustrations.
Headings/Sub-HeadingsThe manuscript should not contain more than 2-3 headings. It is suggested that lengthy and verbose headings and sub-headings should be avoided.
Acronyms, Quotes and LanguageAcronyms should be expanded when used for the first time in the text. Subsequently, acronyms can be used and should be written in capitals only. Quotes taken from books, research papers and articles should be reproduced without any change. British English is recommended as compared to American English. Keeping the diversity of the readers in mind, it is suggested that technical terminologies should be explained in detail while complicated jargons may be avoided.
AURORAS JOURNAL OF MANAGEMENT 5 APR – JUN 2013

Tables, Numbers and PercentagesAll tables, charts, and graphs should be given on separate sheets with titles. Wherever necessary, the source should be indicated at the bottom. Number and complexity of such exhibits should be as low as possible. All figures should be indicated in million and billion. All graphs should be in black and not in colour. The terms 'and' and 'percentage' should not be denoted by their symbols (& and %). Instead the complete word must be used. All figures/numbers <10, mentioned in the text, should be written only in words.
Notes and ReferencesThe notes and references shall be presented at the end of the text, with notes preceding the list of references. Both, the notes and references should be numbered in their order of appearance in the text.
Endnotes, italics, and quotation marks should be kept to the minimum.
References should be complete in all respects:(a) The reference for journals shall be given as :
Hannan M T and Freeman J (1977), "The Population Ecology of Organizations", American Journal of Sociology, Vol.82, No.5,pp.929-964
(b) The reference for books shall be be given as :Hooda R P (1998), Indian Securities Market, Excel Books, New Delhi.
CopyrightWherever copyrighted material is used, the Authors should be accurate in reproduction and obtain permission from copyright holders, if necessary. Articles published in Auroras Journal of Management should not be reproduced or reprinted in any form, either in full or in part, without prior written permission from the Editor.
Review ProcessThe Editorial Board will share the manuscript with two or more referees for their opinion regarding the suitability of the papers/articles for publication. The review process usually takes about 3 months. Auroras Journal of Management reserves the right of making editorial amendments in the final draft of the manuscript to suit the journal's requirements and reserves the right to reject articles. Rejected articles will not be returned to the Author. Instead, only a formal communication of the decision will be conveyed.
Electronic CopyThe Author is advised to send an electronic version of the manuscript in MS Word once the paper is accepted for publication.
ProofsCorrespondence and proofs for correction will be sent to the first Author unless otherwise indicated.
ReprintsThe Author is entitled to receive 25 reprints free of charge.
AURORAS JOURNAL OF MANAGEMENT 6 APR – JUN 2013

1. Introduction: 1.1 Apparel Industry: Apparel is one of the basic necessities of human civilization along with food, water and shelter. The Apparel Industry reflects people's lifestyles and shows their social and economic status. The Apparel and Textile industry is India's second largest industry after IT Industry. At present, it is amongst the fastest growing industry segment and is also the second largest foreign exchange earner for the country. The apparel industry accounts for 26% of all Indian exports. The Indian government has targeted the apparel and textiles industry segments to reach $50 billion by the year 2015.
One of the most interesting features of the apparel industry is that, it migrates from high cost nations to the low cost nations. The growth of the domestic demand for clothing in India is linked with the success of the retailing sector. India presently has entered the second phase of growth and is witnessing a massive rise in the domestic demand. This is primarily due to the rise in the standard of
Apparel is one of the basic necessities of human civilization along with food, water and shelter. The Apparel Industry reflects people's lifestyles and shows their social and economic status. The Apparel and Textile industry is India's second largest industry after the IT Industry. College students as a young consumer group have gained significant importance from marketers in recent years because of their growing purchasing power. They have easy access to credit cards and income from part-time jobs to spend. Students tend to spend money on clothing and beauty products, and find these items to be important. Therefore, college students' apparel shopping orientation is important to research because it is an important sector of consumer behaviour. The purpose of the study is to understand the Indian apparel market in terms of market size and growth and to study the important demographic, psychological and socio-economic factors which influence the consumer purchase behaviour for apparel with reference to college going students, especially management students. Initially, a study was done on the apparel market in India through books and the internet. Then a questionnaire was prepared to collect primary data from management students of different areas, family income, gender, and attitude regarding purchase behaviour of apparel. The collected data was then analysed using various quantitative tools. The relation between various demographic variables and consumer behaviour on apparel is expected to be understood. Apparel companies can target the right target segment in terms of gender, age group, family income, personality, culture etc. by understanding the preferences of the students and can devise strategies to enable the students to access their products easily.
Keywords: Apparel, consumer behaviour, management students
Aurora’s Business School
7AURORAS JOURNAL OF MANAGEMENT APR – JUN 2013

living caused by the rise in the middle-income groups. In our present economic world of demand and supply, price and quality are the key factors, which determine the success of any business. The key element here though, is the cost of labor. India and China have a comparative advantage in this industry though, their vast labor forces and the relatively low cost of labour.
Since, India and China have the advantage of making textiles and so fabric costs are lower than in other countries, they have become the Apparel sourcing choice for many international companies. Sourcing choices arise from profitability. This includes considering costs, such as, buying factors of production, like land, buildings and machines versus factors affecting revenues, including pricing, marketing, and distribution. The issues of labor, material, shipping costs and tariffs structure also affect the sourcing choices. Since, apparel production is a labor-intensive activity, wage rates are also a major factor of consideration in sourcing decisions. This gives immediate competitive advantage to producers in countries like India and China to export to more developed and high cost countries like the United States and the European Union.
1.2 Consumer purchase behaviour: The actions a person takes in purchasing and using products and services, including the mental and social processes that precede and follow these actions can be called as consumer behaviour. It helps us to answer questions such as:(i) Why people choose one product or brand over another?(ii) How they make these choices, and (iii) How companies use this knowledge to provide value to consumers
Consumer purchase decision process: Behind the visible act of making a purchase, lies a decision that must be investigated. The purchase decision process is the stages a buyer passes through in making choices about which products and services to buy. There are five stages of consumer behaviour: (i) problem recognition (ii) information search (iii) alternative evaluation (iv) purchase decision (v) post purchase behaviour
1.3 Consumer purchase behaviour of apparel : The Indian economy has grown over the last 10 years with new jobs created in the ITES sector, Biomedical, Automotive engineering, Apparel manufacturing and Civil engineering. The growth is strongly led by Information Technology Enabled Services (ITES); this is supported by the education sector with increase in the number of students enrolling for higher education and large numbers of students graduating every year thus creating a large pool of technical and managerial manpower. The working class people segment has grown since the economic growth and it has benefited middle class and upper middle class people. Due to the increase in the number of working people and substantial raise in income, spending power has increased over the years, and particularly the young Indians in the age of 15 – 25 like to shop more.
Apparel is a highly symbolic product category due to its high visibility. Individuals will often make assumptions about a person's self-concept simply on the basis of his/her clothing (Soloman & Rabolt, 1999). Self-concept is a dynamic structure that changes according to the nature of the social surroundings or situation (Banister & Hogg, 2006). Consumers will change their consumption behavior based on a current change in their self-concepts (Banister & Hogg, 2006). The symbolic nature of clothing as a visual expression of self-concept can incorporate various clothing styles, brands, retailer outlets and memberships in particular subcultures (Soloman & Rabolt, 1999).
Apparel Shopping Behaviour: A study of management students in Mumbai and Navi Mumbai
8AURORAS JOURNAL OF MANAGEMENT APR – JUN 2013

1.4 Consumer purchase behavior of apparel among college going students : College students as a young consumer group have gained significant importance from marketers in recent years because of their growing purchasing power. They have easy access to credit cards (Schor, 1998) and income from part-time jobs to spend. Students tend to spend money on clothing and beauty products, and find these items to be important. Therefore, college students' apparel shopping orientation is important to research because it is an important sector of consumer behavior.
2. Objective: i. To study the Indian apparel market in terms of market size and growth, focusing on men's apparel
market, women's apparel market, boys' and girls' apparel market.ii. To study the important demographic, psychological and socio-economic factors which influence
the consumer purchase behaviour for apparel with reference to college going students, especially management students.
iii. To study how consumer behaviour for apparel is influenced by factors like family income, gender and peer influence. This will help companies to devise different strategies to promote their apparel brands based on preferences of the students.
3. Literature review: 3.1 Consumer behaviour of apparel : Gupta (2004) investigated the factors influencing the choice of private label in departmental stores of Hyderabad for two product categories—processed food and toiletries. A study conducted by Memon (2006) wanted to trace the impact of private level brands on retailing dealing in garments. This work considered only two retail brands Westside and Pantaloons in Ahmedabad city and accepted the hypothesis that people are ready to switch over to other brands if the same facilities are available. Jinhee Nam et al (2007) in their study examined the apparel and shopping preferences of mature women in America. Independent living residents were surveyed concerning fashion consciousness, fashion information sources and shopping behaviours. Young and mature consumers' reactions to female apparel ensembles were compared. Mature subjects purchased apparel for pleasure or need, but less for conformity. Recently, Radha Krishna and Shylajan (2007) proposed a conceptual model and considered the influence of various marketing and demographic factors on consumers' habitual buying behaviour towards branded articles. But identification of factors, existence of which indulges consumers to go for organized retail apparel brands are still left unturned. Lahiri, Isita et al (2010) in their study make an attempt to identify the factors of the consumers' buying behavior that is influenced by retail apparel segment, and to assess the importance of each of them to consumers in selecting apparel from organized retail outlets. Krishna, C. V. (2011) says that Indian retail is in an expansion spree and many companies are joining the retail landscape. After food and groceries segment apparel is the next large retail segment and the consumption of apparel is also very large in volume. Previously the manufacturing brands used to lead the apparel category in the early days and the penetration of the private label brands was very small. But now things have changed and private label brands are leading in every segment. In the apparel segment also many private label brands are leading the competition. Consumer buying behavior is mainly affected by many determinant factors and this paper aims at understanding and identifying the important determinant factors affecting the consumer buying behavior towards private label apparel. Sullivan, Pauline et al (2012) say that despite Generation Y (Gen Y) consumers' significant role as a decision maker in the market, it is increasingly challenging for retailers to understand these consumers' behavior and psychology. To enhance an in-depth understanding of Gen Y consumers, this study examined the effect of fashion involvement (FI) and perceived experiential value (EV) on Gen Y consumers' retail apparel patronage behaviour.
Aurora’s Business School
9AURORAS JOURNAL OF MANAGEMENT APR – JUN 2013

3.2 Consumer behaviour for apparel with reference to college going students: McKinney, Letecia et al (2004) The purpose of this research was to examine the influence of selected social factors on the clothing buying behaviour patterns of black college consumers. The sample consisted of 333 students from two US universities. Results showed that social participation was significantly related to store patronage. No difference was found in patronage behaviour for the variables of reference group, social involvement, fashion involvement, clothing benefits sought, and social environment. Mohamadou L Fadiga et al (2005) in their study identify sources of demand growth for apparel in the US based on consumer demographic profiles, regions, and product characteristics. Cowart, Kelly O.; Goldsmith, Ronald E. (2007) investigate motivations for online apparel consumption using the Consumer Styles Inventory. Data from a sample of 357 US college students showed that quality consciousness, brand consciousness, fashion consciousness, hedonistic shopping, impulsiveness and brand loyalty were positively correlated with online apparel shopping. Price sensitivity was negatively correlated with online spending. Min-Young Lee et al (2008) in their paper on Mexican college students aim to examine the effects of general consumer variables (i.e. normative interpersonal influence and brand consciousness) and brand-specific variables (i.e. perceived quality and emotional value) on purchase intention toward a US apparel brand. Kumar, Archana et al (2009) examine the direct and indirect effects of individuals' self-concept, product-oriented variables (i.e. consumer's need for uniqueness (NFU), and clothing interest), and brand-specific variables (i.e. perceived quality and emotional value) on purchase intention toward a US retail brand versus a local brand that are available in the Indian market. Kaushal, Shailesh K. (2011) examines the teenagers"behavior in reference to fashion apparel purchase intentions and fashion marketing strategies in Lucknow with survey among700 teenagers regarding their attitudes toward apparels purchase. The paper first uses both exploratory and confirmatory factor analysis to examine the factor structure and psychometric properties of these items.
4. Research Methodology: i. Research Design : First a secondary study was done on the apparel market in India through books
and the internet. Then a questionnaire was prepared to collect primary data from management students of different areas, family income, gender, and attitude regarding purchase behaviour of apparel.
ii. Sampling design: A random sample of 60 management students residing in Mumbai and Navi Mumbai was taken and would cover people of different incomes and gender.
iii. Data collection: The primary data was collected using a structured questionnaire.iv. Data analysis: The collected data was then analysed using various quantitative tools.
5. Findings: The overall size of textile and apparel industry, including the domestic market and exports, is currently estimated at Rs. 327000 crore (US $ 70 bn).
It is pegged to grow at Rs. 1032000 crore (US $ 220 bn) by 2020, with a CAGR of 11%. As per the latest report by Technopak, Indian Textile & Apparel Compendium 2010, the Indian domestic textile and apparel market size in 2009 was Rs. 218570 crore (US $ 47bn) and is expected to grow at the rate of 11% CAGR to reach Rs. 656000 crore (US $ 140 bn) by 2020.
10AURORAS JOURNAL OF MANAGEMENT APR – JUN 2013
Apparel Shopping Behaviour: A study of management students in Mumbai and Navi Mumbai

Indian apparel market size and growth
Total Apparel market (Rs. Crore)
Components of Apparel market (CAGR)
Aurora’s Business School
11AURORAS JOURNAL OF MANAGEMENT APR – JUN 2013
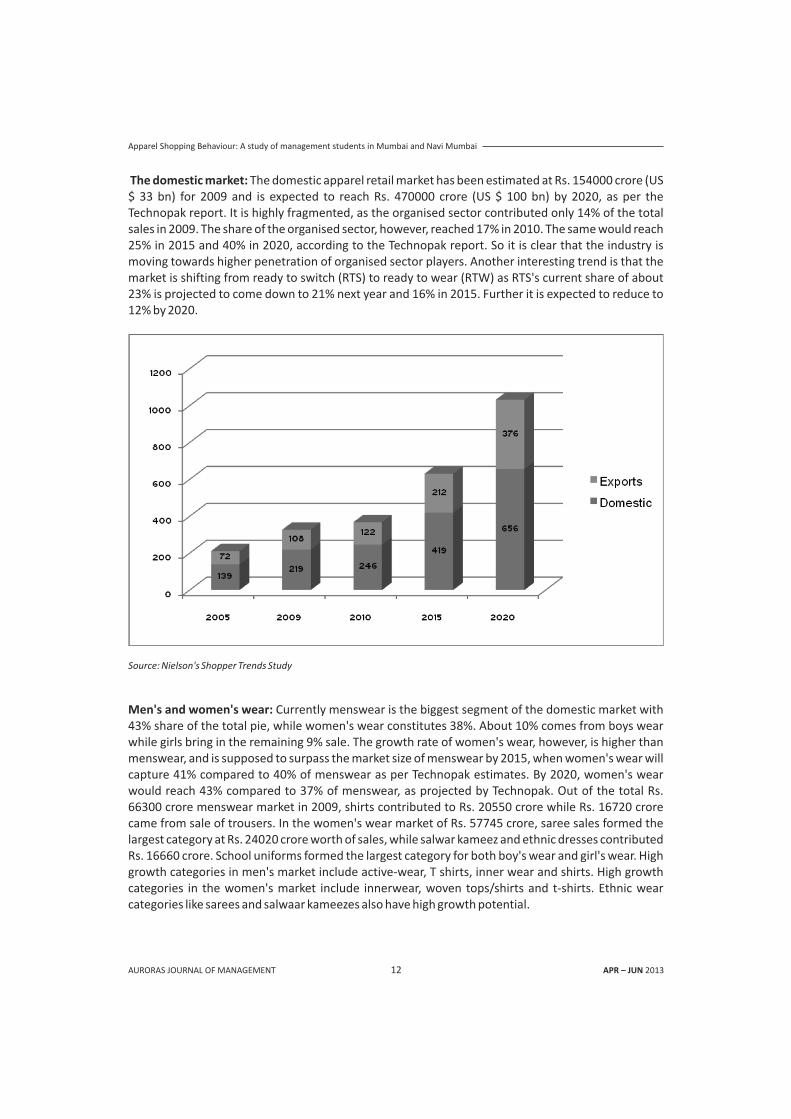
The domestic market: The domestic apparel retail market has been estimated at Rs. 154000 crore (US $ 33 bn) for 2009 and is expected to reach Rs. 470000 crore (US $ 100 bn) by 2020, as per the Technopak report. It is highly fragmented, as the organised sector contributed only 14% of the total sales in 2009. The share of the organised sector, however, reached 17% in 2010. The same would reach 25% in 2015 and 40% in 2020, according to the Technopak report. So it is clear that the industry is moving towards higher penetration of organised sector players. Another interesting trend is that the market is shifting from ready to switch (RTS) to ready to wear (RTW) as RTS's current share of about 23% is projected to come down to 21% next year and 16% in 2015. Further it is expected to reduce to 12% by 2020.
Source: Nielson's Shopper Trends Study
Men's and women's wear: Currently menswear is the biggest segment of the domestic market with 43% share of the total pie, while women's wear constitutes 38%. About 10% comes from boys wear while girls bring in the remaining 9% sale. The growth rate of women's wear, however, is higher than menswear, and is supposed to surpass the market size of menswear by 2015, when women's wear will capture 41% compared to 40% of menswear as per Technopak estimates. By 2020, women's wear would reach 43% compared to 37% of menswear, as projected by Technopak. Out of the total Rs. 66300 crore menswear market in 2009, shirts contributed to Rs. 20550 crore while Rs. 16720 crore came from sale of trousers. In the women's wear market of Rs. 57745 crore, saree sales formed the largest category at Rs. 24020 crore worth of sales, while salwar kameez and ethnic dresses contributed Rs. 16660 crore. School uniforms formed the largest category for both boy's wear and girl's wear. High growth categories in men's market include active-wear, T shirts, inner wear and shirts. High growth categories in the women's market include innerwear, woven tops/shirts and t-shirts. Ethnic wear categories like sarees and salwaar kameezes also have high growth potential.
12AURORAS JOURNAL OF MANAGEMENT APR – JUN 2013
Apparel Shopping Behaviour: A study of management students in Mumbai and Navi Mumbai

Men's Apparel market (Rs. Crore)
Source: Technopak Analysis
Women's Apparel market (Rs. Crore)
Source: Technopak Analysis
Aurora’s Business School
13AURORAS JOURNAL OF MANAGEMENT APR – JUN 2013

Analysis of primary data: A sample of 60 management students was taken out of which 33 were male and 27 were female. Following were the findings among the students: 1. In case of male students, approximately equal number of students purchased their apparel from
retail stores and malls, while in case of female students, majority of them purchased apparel from malls.
2. Majority of male and female students purchased casual apparel rather than formal apparel.3. Majority of male and female students purchased readymade apparel rather than stitched clothes.4. All the male students went for western apparel while majority of female students went for western
apparel.5. The number of male and female students buying local and foreign brands were almost equal.6. For both male and female students, if their brand is not available, majority of them either shift to
another brand or buy whichever is available.7. Majority of male and female students said that discount offers or promotion gimmicks influence
their choice of apparel.8. Most of the male students and all the female students purchased apparel by actually visiting the
store and not through e-commerce.9. Majority of male students purchased apparel based on their own choice or on the opinion of their
friends. Majority of female students purchased apparel based on their own choice.10. 70% of male students were not influenced by their friends' choice of brand or type of apparel,
while around half of the female students were influenced by their friends' choice of brand or type of apparel.
11 .Majority of the male and female students spent between Rs. 500 and Rs. 2000 on apparel.12. About 18% of male students and about 25% of female students said that they got influenced by
movies in their choice of apparel.13. In case of male students, about 50% of them had their expenditure on apparel funded by parents
and 50 % by their pocket money. In case of female students, 67% of them had their expenditure on apparel funded by parents and 33 % by their pocket money.
14 The most important factors considered while buying apparel were: Good quality, Reasonable price, Suiting the personality, and Convenient to wear.
6. General conclusions:a. Various factors were considered which influence the purchase of apparel. These were given ratings
from 1 to 5 on a Likert scale with 1 as highest and 5 as lowest.
Mean
Buying apparel is not expensive here 2.92It saves money 3.00Many options are available 1.62Latest designs are available 1.69It is fashionable to buy from here 2.85Outlet name carries extra weightage 3.08Clothes bought are of high quality 2.00I buy because other people come here 4.23Attracted by ads 3.77Convenient to buy because It offers pick and choice 1.92Buying here increases social recognition 3.62Various discount offers attract me 2.38
14AURORAS JOURNAL OF MANAGEMENT APR – JUN 2013
Apparel Shopping Behaviour: A study of management students in Mumbai and Navi Mumbai

Then average rating was found for these factors. It was found that the most important factors were(a) Many options are available(b) Latest designs are available(c ) Clothes bought are of high quality(d) Convenient to buy.
(b) Chi square test
gender * type of apparel bought Cross tabulation
Chi-Square Tests
Ho: There is no relation between gender and type of apparel boughtH1: There is a relation between gender and type of apparel bought
Since the significance value is greater than the level of significance 0.05, hence we accept Ho and conclude that there is no relation between gender and type of apparel bought.
Aurora’s Business School
15AURORAS JOURNAL OF MANAGEMENT APR – JUN 2013

(C). Chi square test
Ho: There is no relation between income group and type of apparel bought
H1: There is a relation between income group and type of apparel bought.
Since the significance value is greater than 0.05, we accept Ho and conclude that there is no relation between income group and type of apparel bought.
16AURORAS JOURNAL OF MANAGEMENT APR – JUN 2013
Case Processing Summary
Cases
Valid Missing Total
N Per cent N Per cent N Per cent
Income group * type of
apparel bought
13 100.0% 0 .0% 13 100.0%
Income group * type of apparel bought Cross tabulation
Type of apparel bought
Total casual formal
Income group 40000-60000 Count 1 1 2
Expected Count 1.5 .5 2.0
60000-80000 Count 3 0 3
Expected Count 2.3 .7 3.0
80000-100000 Count 1 1 2
Expected Count 1.5 .5 2.0
more than 1 lakh Count 5 1 6
Expected Count 4.6 1.4 6.0
Total Count 10 3 13
Expected Count 10.0 3.0 13.0
Apparel Shopping Behaviour: A study of management students in Mumbai and Navi Mumbai

(d). Chi square test
Ho: There is no relation between gender and frequency of purchaseH1: There is a relation between gender and frequency of purchase
Since the significance value is greater than 0.05, we accept Ho and conclude that there is no relation between gender and frequency of purchase.
(e ). Chi square test
Ho: There is no relation between income group and frequency of purchaseH1: There is a relation between income group and frequency of purchase
Since the significance value is greater than 0.05, we accept Ho and conclude that there is no relation between income group and frequency of purchase.
Aurora’s Business School
17AURORAS JOURNAL OF MANAGEMENT APR – JUN 2013

(f). ANOVA
18AURORAS JOURNAL OF MANAGEMENT APR – JUN 2013
Apparel Shopping Behaviour: A study of management students in Mumbai and Navi Mumbai

Ho: There is no significant difference between the average expenditure on apparel among different income groupsH1: There is a significant difference between the average expenditure on apparel among different income groups
Since the significance level is greater than 0.05, we accept Ho and conclude that there is no significant difference between the average expenditure on apparel among different income groups.
(g). Unpaired t test
Ho: There is no significant difference between the average expenditure on apparel among men and womenH1: There is a significant difference between the average expenditure on apparel among men and women
Since the significance value is greater than 0.05, we accept Ho and conclude that there is no significant difference between the average expenditure on apparel among men and women.
Aurora’s Business School
19AURORAS JOURNAL OF MANAGEMENT APR – JUN 2013

20AURORAS JOURNAL OF MANAGEMENT APR – JUN 2013
References:Apparel Retail: Labeling the Indian Market (2006), available at: www.ibef.org.
Archana Kumar, Yown Kyung Kim and Lou Pelton (2007),. “Indian consumer‟s purchase behaviour towards US versus local brands”, International Journal of Retail and distribution Management, 37(6), pp.510-526.
Berman B and Evans J (2002), Retail Management: A Strategic Approach, Pearson Education, Asia,
Singapore.
Biswas, R., (2006), “India‟s changing consumer”, Chain Store Age, 82(5), p.A2.
Clark, R.A., and Goldsmith, R.E., (2005), “Spreading their Sales”, Business India Intelligence, 12(6), pp.1-2.
Gopal, A and Srinivasan, R (2006),” The Indian Consumer”, Harvard Business Review, 84 (10), pp.22-23
Gupta A (2004), “Factors Affecting the Trial of Private Labels in Departmental Store: Evidence from
India”, The Icfai Journal of Brand Management, Vol. 1, No. 3, pp. 6-21.
Hair, J.M., Anderson, R.E., Tatham, R.L., Black, W.C., and Babin, B.J., (2006), Multivariate Data Analysis, Sixth Edition, Pearson Prentice Hall, Copper Scordle Rver, NJ.
Harvey M (2003), Insights of the Fashion Business, pp. 1-16 and 22-29, Prentice Hall.8. Jinhee Nam; Hamlin, Reagan; Hae Jin Gam; Ji Hye Kang; Jiyoung Kim; Pimpawan Kumphai; Starr, Cathy; Richards, Lynne, 'The fashion conscious behaviours of mature female consumers', International Journal of Consumer Studies. Jan2007, Vol. 31 Issue 1, p102-108. 7p.
Jaya Halepete and K.V.Sesadri Iyyer (2008), “Multidimensional investigation of apparel retailing in India”, International Level of Retail and Distribution Management, 36(9), pp.676-688
Jinhee Nam; Hamlin, Reagan; Hae Jin Gam; Ji Hye Kang; Jiyoung Kim; Pimpawan Kumphai; Starr, Cathy; Richards, Lynne, 'The fashion conscious behaviours of mature female consumers', International Journal of Consumer Studies. Jan2007, Vol. 31 Issue 1, p102-108. 7p.
Kawabata, Hiroko; Rabolt, Nancy J., 'Comparison of clothing purchase behaviour between US and Japanese female university students', Journal of Consumer Studies & Home Economics. Dec1999, Vol. 23 Issue 4, p213-223. 11p.
Kim, H., Damhorst, M., and Lee, K., (2002), “Apparel Involvement and Advertisement Process”, Journal of Fashion Marketing and Management, 6(3), pp.277-302.
Kinra, N., (2006), “The effect of country of origin on foreign brand names in the Indian Maket”, Marketing Intelligence and Planning, 24(1), pp.15-30.
Krishna, C. V, ' Determinants of Consumer Buying Behaviour: An Empirical Study of Private Label Brands in Apparel Retail', Vilakshan: The XIMB Journal of Management, Sep2011, Vol. 8 Issue 2, p43-56. 14p
Kumar, Archana; Youn-Kyung Kim; Pelton, Lou, 'Indian consumers' purchase behaviour towards US versus local brands', International Journal of Retail & Distribution Management. 2009, Vol. 37 Issue 6, p510- 526. 17p.
Lahiri, Isita; Samanta, Pradip Kumar, 'Factors Influencing Purchase of Apparels', IUP Journal of Marketing Management, . Feb2010, Vol. 9 Issue 1/2, p73-87. 15p
Lau, K.C., and Phau, I., (2007), “Extending Symbolic brands using their personality: examining antecedents and implications toward brand image fit and brand dilution”, Psychology and Marketing, 24(5), pp.421-424.
McKinney, Letecia; Legette-Traylor, Dana; Kincade, Doris; Holloman, Lillian, 'Selected social factors and the clothing buying behaviour patterns of black college consumers', International Review of Retail, Distribution & Consumer Research, Oct2004, Vol. 14 Issue 4, p389-40
Memon S S(2006), “Garment Lifestyle Retailing Stores: Vis á Vis Impact of Private Labels: A Paradigm Shift”, The Icfai Journal of Marketing Management, Vol. 5, No. 3, pp. 54-69.
Radha Krishna G and Shylajan C S (2007), “Determinants of Habitual Buying Behavior: A Study on Branded Apparel”, The Icfai Journal of Marketing Management, Vol. VI, No. 3, pp. 6-21.
Rusch R (2003), “Private Lebels: Does Branding Matter?”, in Suresh K (Ed.), Retailing: Concepts and Cases, The Icfai University Press, Hyderabad.
Smith P R and Taylor J (2005), Marketing Communications: An Integrated Approach, Kogan Page India, London.
Sullivan, Pauline; Kang, Jiyun ; Heitmeyer, Jeanne, ' Fashion involvement and experiential value: Gen Y retail apparel patronage', International Review of Retail, Distribution & Consumer Research. Dec2012, Vol. 22 Issue 5, p459-483. 25p
About the AuthorAbout the Author
Associate Professor, SIES College of Management Studies, Nerul, Navi Mumbai-400614. He can be contacted at [email protected]
Apparel Shopping Behaviour: A study of management students in Mumbai and Navi Mumbai

IntroductionDInsurance companies as financial intermediaries have always played a prominent role in the Indian financial system. As financial intermediaries, the critical functions performed by insurance companies include brokerage function, asset transformation function, investment function, inter-generational wealth transfer function, implementation of the credit policy of the government in the area of priority sector lending, etc. Hitherto, the Life Insurance Corporation (LIC) of India has been the backbone of the Indian capital markets. The contribution of the insurance companies as investors through approved investments is significant.
With the opening up of the insurance industry in the year 2000, following the recommendation of the Malhotra committee has brought about a sea-change in terms of volumes of business and variety of products. Consumers today have choice. The investment of the insurance companies especially in the Infrastructure Sectors is the special focus of the present paper. Of the total investments, of the insurance companies in various sectors like Government securities, the Infrastructure and Social sector investments of the total insurance industry including both the Life and General insurance companies over the last few years from 2004 to 2011 have been increasing significantly as seen below in the Figure.1.
The Indian insurance industry has witnessed a sea change in terms of volume and numbers over the past decade ever since the sector has been opened to private and foreign participation in year 2000. Further, the Insurance industry is also seen as the “engine for growth” by the Regulator IRDA. The contribution of this segment of the financial system has been very significant, next only to the software industry as various reports and surveys reveal. The Insurance industry has recorded a CAGR of about 25 percent annually, over the last few years, evidencing increased awareness levels amongst the public. The general public, today in India still see insurance products more like an investment product rather than as a risk mitigation tool. The Life insurance market is more driven by market linked products, which were unheard of in the past.
However, even after a decade since year 2000, insurance penetration and density is dismally low, and not very encouraging. Life insurance to a certain extent is preferred because of the inherent tax incentives in-built, but for the general insurance business, people in India have not yet understood the need and importance of protecting themselves against any property and liability risk exposures. This paper, therefore, attempts to document in particular the role of insurance as a financial intermediary for building India and highlight the potential market that is available for the Insurance companies to tap.
21AURORAS JOURNAL OF MANAGEMENT APR – JUN 2013
Aurora’s Business School
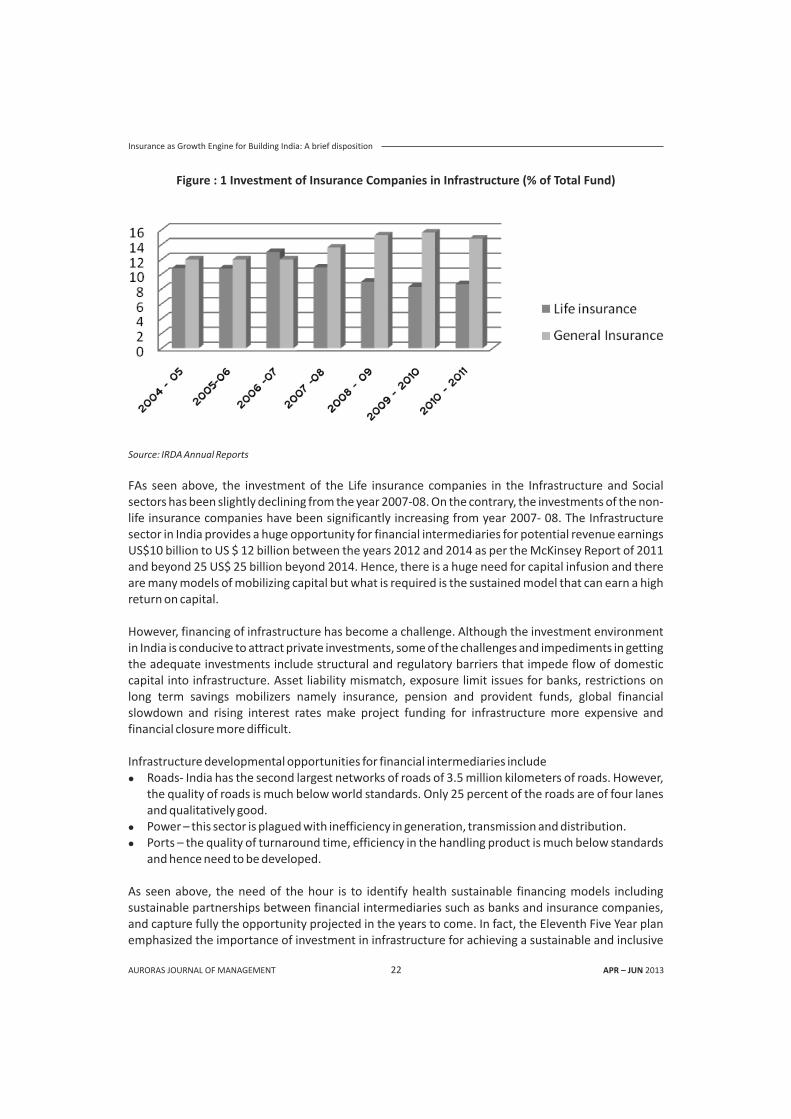
Figure : 1 Investment of Insurance Companies in Infrastructure (% of Total Fund)
Source: IRDA Annual Reports
FAs seen above, the investment of the Life insurance companies in the Infrastructure and Social sectors has been slightly declining from the year 2007-08. On the contrary, the investments of the non-life insurance companies have been significantly increasing from year 2007- 08. The Infrastructure sector in India provides a huge opportunity for financial intermediaries for potential revenue earnings US$10 billion to US $ 12 billion between the years 2012 and 2014 as per the McKinsey Report of 2011 and beyond 25 US$ 25 billion beyond 2014. Hence, there is a huge need for capital infusion and there are many models of mobilizing capital but what is required is the sustained model that can earn a high return on capital.
However, financing of infrastructure has become a challenge. Although the investment environment in India is conducive to attract private investments, some of the challenges and impediments in getting the adequate investments include structural and regulatory barriers that impede flow of domestic capital into infrastructure. Asset liability mismatch, exposure limit issues for banks, restrictions on long term savings mobilizers namely insurance, pension and provident funds, global financial slowdown and rising interest rates make project funding for infrastructure more expensive and financial closure more difficult.
Infrastructure developmental opportunities for financial intermediaries include l Roads- India has the second largest networks of roads of 3.5 million kilometers of roads. However,
the quality of roads is much below world standards. Only 25 percent of the roads are of four lanes and qualitatively good.
l Power – this sector is plagued with inefficiency in generation, transmission and distribution. l Ports – the quality of turnaround time, efficiency in the handling product is much below standards
and hence need to be developed.
As seen above, the need of the hour is to identify health sustainable financing models including sustainable partnerships between financial intermediaries such as banks and insurance companies, and capture fully the opportunity projected in the years to come. In fact, the Eleventh Five Year plan emphasized the importance of investment in infrastructure for achieving a sustainable and inclusive
22AURORAS JOURNAL OF MANAGEMENT APR – JUN 2013
Insurance as Growth Engine for Building India: A brief disposition

growth of 9 to 10 per cent of GDP over the next decade. However, there has been gap between the estimated amount of investments and actual amounts made as seen in the table below.
Table : 1 Sector – wise Investments : Tenth Plan and Eleventh Plan
As seen above, the investments amongst all the sectors in the revised projection of the plan shows a significant increase over the last Tenth plan figures, indicating the growth in the demand for these sectors. However, the projections of the Twelfth Five year plan show a very significant increase in all the sectors showing the potential opportunity to raise the capital through proactive participation by financial intermediaries.
23AURORAS JOURNAL OF MANAGEMENT APR – JUN 2013
Aurora’s Business School

Table – 2 Projected Investment in Infrastructure during Twelfth Five Year Plan
The infrastructure investment as a percentage of GDP is projected to increase from 8.37 percent to 9.95 percent. Financing of these projects will be the challenge.
As per the Report of the Committee on Infrastructure Financing (2007), the financing of infrastructure in the coming years will have to be progressively financed by way of user charges to meet the growing demand. Secondly, the share of private sector in infrastructure investment would have to rise substantially. Further, the Committee believed that meeting these two challenges would require important changes in the way the sectors are governed and in addressing the constraints in the financing system. Although the percentage of domestic savings can be channelized into these sectors by the financial intermediaries, the constraints in the financial system act as a deterrent. As far as financing of infrastructure by insurance companies is concerned, insurance companies have invested limited amounts in private infrastructure development. This can be attributed to regulatory restrictions, underdeveloped corporate bond markets and the absence of efficient credit risk transfer mechanisms (such as securitization, credit derivatives, credit insurance etc.). Furthermore, insurance companies traditional preference is for investment in public sector.
The Committee's recommendations have two broad aims: (a) widen the scope of infrastructure financing by insurance companies in terms of sectors, and (b) liberalize the investment guidelines in terms of quality and types of eligible instruments, while
relying more on management decisions.
While the first recommendation relates to the definition of infrastructure, the second relates to the rigidities of regulation. Insurance companies' investments portfolio cuts across government securities classified as 'approved investment' and 'other than approved investment'. Investment in both debt and equity can be made in both these classes. Only approved investments are eligible for inclusion in
24AURORAS JOURNAL OF MANAGEMENT APR – JUN 2013
Insurance as Growth Engine for Building India: A brief disposition

'Infrastructure and Social Sector', which requires minimum mandated investment on one hand and are not constrained by exposure norms on the other. There are, however, some provisions under the approved category that discourage the scope of both debt and equity investments in infrastructure. These restrictions need to be relaxed with respect to infrastructure sectors to provide the insurance companies greater flexibility in deciding appropriate portfolio and wider access to instruments. The committee made the following recommendations:i. Harmonizing the definition of Infrastructure;ii. Liberalizing investment guidelines for debt instruments; andiii. Liberalizing investment guidelines for equity instruments.
By bringing greater clarity to definition of infrastructure on one hand and widening its scope on the other, a harmonized definition will create new avenues for infrastructure investment by insurance companies, facilitate design and implementation of special regulations and provide fiscal incentives for infrastructure. The current IRDA investment guidelines allow investment in assets/instruments under approved category for consideration under 'Infrastructure and Social Sector', only if they have a minimum credit rating of AA (or A+ in exceptional cases with investment committee approval). Since infrastructure companies typically do not enjoy high credit rating during the initial years, the recommendation will expand the avenues of investment in the infrastructure space.
It may be noted that this is only a facilitating measure, the actual investment portfolio would depend on the commercial judgment and risk appetite of the insurers' investment committees. To further facilitate investment in equity of infrastructure companies, it is recommended that all equity investments in listed infrastructure companies be considered as approved investments. Also, to allow insurance companies to take advantage of the mutual funds with schemes targeted at investment (including equity) in infrastructure companies, investment in these schemes may also be considered as approved investments. This will enable insurance companies to seek higher return while maintaining liquidity, and at the same time, benefit from the experience of professional management. Hence, this could be a bigger challenge for companies to manage.
As per the Report on Urban Infrastructure by High powered Expert Committee (HPEC), 2011, the infrastructure requirement in Urban cities for the period 2012 – 2031 is clearly depicted in the table below regarding the investment in infrastructure.
Table – 3 Urban Cities 2012 – 2031 (in Crores)
25AURORAS JOURNAL OF MANAGEMENT APR – JUN 2013
Urban transport 4,49,426Renewal & Development including slums 4,08,955Water Supply 3,20,908Sewerage 2,42,688Strom water drains 1,91,031Capacity building 1,01,759Basic support infrastructure 97,935Solid waste management 48,582Street lighting 18,580Other sectors 3,09,815GRAND TOTAL 39,18,670
Source : Report on Urban Infrastructure by HPEC
Aurora’s Business School

Further the committee also projected an increase in the population and the number of metro cities as cited below.
Figure 2 : Metro Cities and Population
Conclusion
The outlook for the Indian economy going forward offers a plethora of opportunities for all the financial intermediaries in mobilizing and deploying of funds from household sector to infrastructure sector. Reforms of insurance and pension funds would go a long way to streamline infrastructure investments. Vision 2020 summarizes the ultimate destiny for the financial intermediaries.
“By 2020, the people of India will be more numerous, better educated, healthier andmore prosperous than at any time in our long history. In our vision of India in 2020 is of a nation
bustling with energy, entrepreneurship and innovation”.
References:Investment in Infrastructure during the Eleventh Five Year Plan, Published by Secretariat for
Infrastructure, Planning Commission, Government of India.
Jain, Sameer., Investing in Developed Country Private Infrastructure Funds, Citi Alternative Investments
McKinsey and Company's Report on Building India.
Report of the Committee on India Vision 2020, Planning Commission, Government of India, 2002.
Report of the Committee on Infrastructure Financing May, 2007.
Report on Urban Infrastructure by High powered Expert Committee (HPEC), 2011.
26AURORAS JOURNAL OF MANAGEMENT APR – JUN 2013
Source : Report on Urban Infrastructure by HPEC
Insurance as Growth Engine for Building India: A brief disposition

Appendix – 1 Investments of Insurance Companies in Infrastructure (in % to Total Fund)
2004 - 05 2005-06 2006 -07 2007 -08 2008 - 09 2009 - 2010 2010 - 2011
Life insurance 10.81 10.76 13 10.91 8.97 8.29 8.65
General Insurance 12 12 12 13.61 15.25 15.63 14.8
Appendix – 2Urban cities and Population
Year No of Metro cities % of Population
1951 5 18.9
1961 7 23.6
1981 12 27.7
2001 35 37.8
2011 50 42.3
27AURORAS JOURNAL OF MANAGEMENT APR – JUN 2013
About the AuthorAbout the Author
Assistant Professor, Siva Sivani Institute of Management, Kompally, Hyderabad, Andhra Pradesh,
[email protected], [email protected]
Aurora’s Business School

28AURORAS JOURNAL OF MANAGEMENT
Although there has been much publicity about the internet, empirical research focusing on it is still relatively sparse. Much of the existent research on the internet has been predicated upon data collected in Europe and America. To date, there is a dearth of published studies on the internet in the Indian context. This study examines gender differences in internet usage and attitudes toward internet advertising in India. Data were collected on internet users via a questionnaire survey placed on the world wide web. 512 usable responses were received, of which 377 (73.6%) were males and 135 (26.4%) were females. Gender differences in terms of the demographic profile of internet users, usage patterns, factors affecting an enjoyable internet experience and attitudes toward internet advertising were examined. By understanding the internet usage and attitudes toward advertising, designers and marketers can better strategize their advertising designs.
1. INTRODUCTION:The digital age has already made significant changes to each of the elements of the promotion mix. Companies increasingly see the Internet as an important medium through which advertising messages can be directed towards consumers. However, very little is known of consumer beliefs about internet advertising, attitudes toward internet advertising in India.
India is an ideal country in Asia to examine the internet phenomenon since it stands in fourth place representing highest population of internet users in the world (Internet World Stat, 2011). Despite the popularity of the internet, little empirical research has been done outside of Europe and America.
This study is more focused and seeks to further contribute to a better understanding of the internet phenomenon in India. Specifically, we examine gender differences in the following areas: profile of internet users, detailed usage patterns and uses of the internet, and attitudes toward internet advertising.
2. REVIEW OF LITERATUREThe objective of this study is to shed light on these issues by studying the gender differences in internet usage and attitudes toward internet advertising. This section reviews literature on demographic influence on internet usage, internet usage patterns, internet usage motivations and attitudes toward internet advertising.
2.1 Demographic Influence on Internet UsageTeo (2001) proposed a research model which seeks to examine how demographic variables like gender, age, and educational level and motivational variables like perceived ease of use, perceived
APR – JUN 2013

29AURORAS JOURNAL OF MANAGEMENT
usefulness and perceived enjoyment are associated with internet usage in terms of messaging, browsing, downloading, and purchasing. This study acts as a base for the present study to examine gender influence on internet usage.
Most of the researchers studied the impact of demographic variables (age, gender, education, and income) on internet usage, and found significant differences (Teo, 2001; Taylor et al., 2003; and Bimber, 2003), whereas, a few studies found no significant differences with respect to demographic variables (Luan et al., 2008). These demographic variables also explained the beliefs about the internet which influences that consumers' attitude towards internet (Porter and Naveen, 2006). It was found that perceived ease of use and perceived usefulness significantly influenced the internet usage and also explained the attitudes toward using internet.
There are different types of activities users do on internet. Teo (1998) classified the internet usage activities as messaging, browsing, downloading and purchasing. Whereas Richardson (2009) categorized them into social, domestic, education and work–related activities based on the purpose of using internet. Studies applied internet usage patterns such as length of internet usage (Internet experience), frequency of using internet, and quantity of internet usage (no. of hours/ week or day) and demographic variables to explain the users' internet activities. Studies also showed the influence of these variables on internet usage purpose and attitudes toward internet.
2.2 Attitudes toward AdvertisingThe advertising industry worldwide is experiencing tremendous changes. Advertising has become one of the important elements in our modern life. Consumers' attitudes toward advertising and their potential impact on their behaviour and decision making should not be underestimated. It is generally believed that those holding positive attitudes toward advertising would be more likely to be persuaded for a behavioural response. Internet advertising is any form of commercial content available on the internet that is designed by businesses to inform consumers about a product or service (Schlosser et al. 1999). Internet advertisement can be delivered via any channel (e.g., video clip, print or audio), in any form (e.g., an e-mail message or an interactive game or a banner), and provides information at any degree of depth (e.g., a corporate logo or an official website). Unlike traditional one-way advertisement, internet advertising allows consumer to take active role in marketing communication with its unique characteristic 'Interactivity'.
For long time researchers investigated consumer attitudes toward advertising (Zanot, 1984; Pollay & Mittal, 1993). As reviewed by Zanot (1984), the first large-scale survey assessing public opinion toward advertising was conducted by Gallup Organization Inc. (1959) which found that a majority of the respondents generally liked advertising and that most of those respondents liked it because they felt it being informative.
Belief is a precursor to the individuals' attitudes toward advertising. A few studies came out with a list of seven belief factors about web advertising engendering individuals' positive attitudes toward it. They are: product information, social role and image, hedonic/please, value corruption, fallacy/no sense, good for the economy and materialism (Previte et al., 1998; Tan and Chia, 2007) derived from Pollay and Mittal's (1993) study. A few other studies (Ducoffe, 1995; Brackett and Carr, 2001; and Liya Wang, 2007) found factors like information, entertainment, irritation, and deceptiveness (credibility) are influencing attitudes toward the advertising.
APR – JUN 2013
Aurora’s Business School

30AURORAS JOURNAL OF MANAGEMENT
Mehta and Sivadas (1995) found newsgroup users held negative attitudes towards advertising. In contrast, business executives researched by Ducoffe (1995) found advertising neither irritating nor annoying. This signifies that the attitudes differ across sample population and the attitude towards advertising, in general, is channel dependent. Though earlier literatures reported positive attitudes of the public toward advertising (Ducoffe, 1995; Shavitt et al., 1998), in majority of the recent studies consumers' negative attitudes toward advertising were reported.
Beginning with Ducoffe (1996), studies on attitudes toward internet advertising confirmed that the factors of information, entertainment, and irritation are important predictors of internet advertising value. Further, a strong relationship between advertising value and attitudes toward internet advertising was found.
Previte and Forrester (1998) revealed mixed overall attitudes toward internet advertising. Although most respondents found internet advertising as informative, it was not enjoyable. Schlosser, et al., (1999) found entertainment the most prominent predictor of attitude similar to the results found by Ducoffe (1996). Their study concluded that entertainment and information were not sufficient in understanding and explaining the complexity of internet users' attitudes toward internet advertising. The effectiveness of advertising depends on attitude to the medium in which it appears. In addition, the demographic variables could also influence the attitude (Brackett and Carr, 2001; and Wang et al., 2002). For instance, in a study by Shavitt et al. (1998) Americans, younger non-white male consumers who were less educated and had less income were found to be more inclined towards TV advertising.
Some researcher have used the Pollay and Mittal (1993) study and some others Ducoffe (1996) or Brackett and Carr (2001) studies to examine the attitudes toward internet advertising. Apart from this, researchers have focused on number of factors that affect internet usage to study the users' attitude. Apparent differences between new and experienced users on like or dislike of internet advertising were reported (Previte and Forrest, 1998). The major factors that showed significantly influence attitudes toward internet advertising are length, frequency, quantity and location of use (Rettie et al. 2003) and different consumer motives (Rodgers and Thorson, 2000). The individuals having positive attitude towards internet, browse the internet more often (Luo, 2002); and effectiveness of advertising depends on attitudes toward the medium in which it appears.
3. NEED FOR THE STUDYThough there has been much publicity about the internet, empirical research focusing on its usage patterns is relatively sparse. Research conducted on the internet is more in Europe and USA than in Asia (Teo, 1998). More so a little research has been conducted in developing countries like India, though internet cuts across national boundaries and cultures (Hsu et al, 2001). Secondly, over the years researchers have been obsessed with measuring attitudes toward advertising using student samples. The literature amply states that attitudes differ according to sample population. Using students as subject for the study (homogeneous undergraduate college students) also threaten external validity. A study that examines the consumers' attitudes toward internet advertising and their internet usage characteristics is necessary to update and enrich the literature in the Indian context.
4. RESEARCH DESIGNResearch in this area is descriptive providing the inventory of feelings regarding internet usage and internet advertising from gender point of view, thereby examining the impact of gender on attitudes towards internet advertising.
APR – JUN 2013
Gender Differences in Internet Usage and Attitudes toward Internet Advertising

31AURORAS JOURNAL OF MANAGEMENT APR – JUN 2013
The paradigms of Teo (2001), Brackett and Carr (2001), and Wang, et al. (2002), provide basic framework for the research design of the present study. Continuing the legacy of earlier research works, the research design of the present study considered perceived ease of use, perceived usefulness and perceived enjoyment as predictors of internet having significant influence on its usage. Further, perceived information, perceived entertainment, perceived irritation, perceived credibility and advertising value as antecedents of attitudes toward internet advertising. The objective of the present study is to conduct an in-depth study on consumers' attitudinal responses toward internet advertising with reference to their gender. The study attempts to test the hypothetical relationship between gender, internet usage patterns and attitudes toward on internet advertising.
In this study the purpose of using internet is put into seven categories: information search, client/job–based, entertainment, downloads, mails and chatting, shopping/banking, and games. These categories are further grouped into leisure activities, work–related activities and family or household activities to study the influence of purpose on internet usage and attitudes toward internet advertising.
5. RESEARCH HYPOTHESISEarlier research studies represented that young people are heavy users of internet, like looking at ads and feel more comfortable while doing so (Shavitt et al., 1998; Taylor et al., 2003). Furthermore, they have positive attitudes toward internet ads. Gender has also been shown relevant in internet use and in forming attitudes toward internet advertisements. General conclusion is that male consumers show more favourable attitudes toward ads than female consumers (Shavitt et al., 1998; Bimber, 2003; Luan et al., 2008). Many studies confirmed the significant role of gender in internet usage (Teo, 2001). As the present study is confined to 'gender' as underlying factor of influence over internet usage and attitudes toward internet advertising, the following are the hypothesis framed: H1: There is a significant difference between male and female respondents in the internet usage
with respect to time spent and purpose.H2: There is a significant attitudinal difference between male and female respondents towards
using internet.H3: There is a significant attitudinal difference between male and female respondents toward
internet advertising.
6. SAMPLING DECISIONSFor developing the data collection instrument, an extensive review of articles was carried out in internet and advertising related journals, magazines, internet websites, etc. Furthermore, interviews were conducted with sixteen experienced internet users who are spending a minimum of eight hours per week on internet to identify the tasks the internet is being used for, factors affecting an enjoyable internet experience.
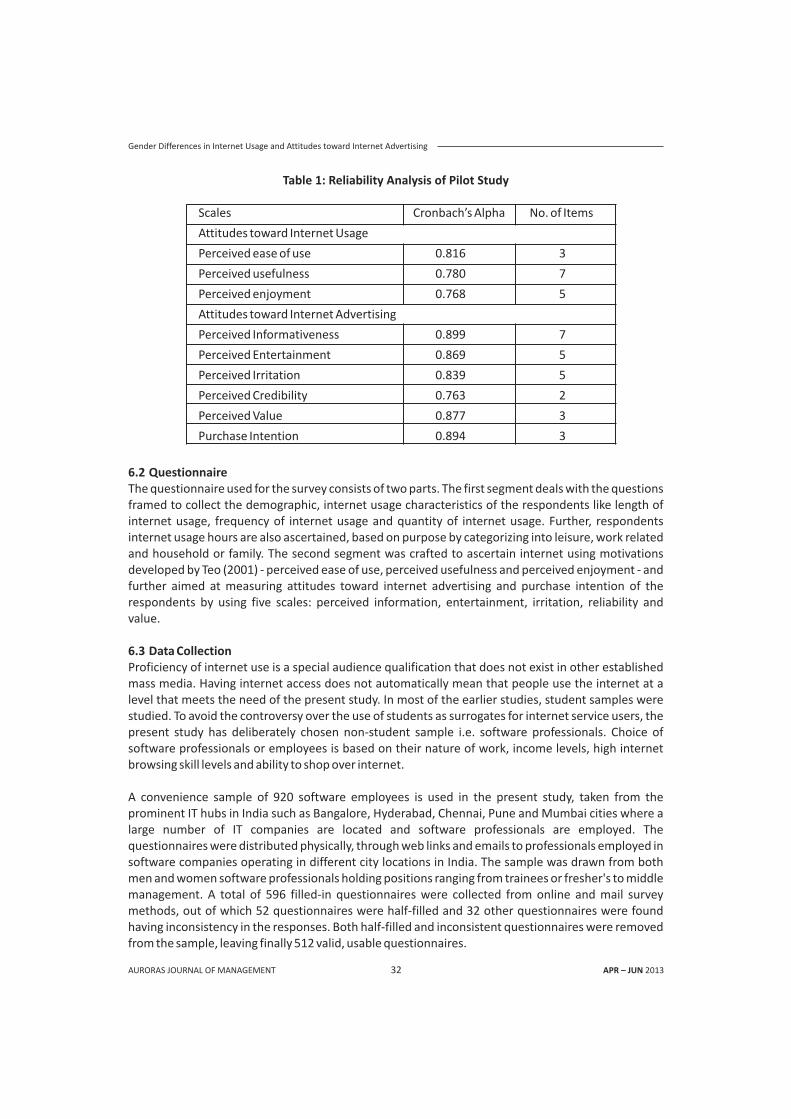
6.1 Pilot StudyThe initial format of the questionnaire prepared was pretested in the pilot study on 50 business management students in the first stage. Modifications were made based on the subjects' feedback to improve the clarity and presentation of questionnaire items, and the filled-in questionnaires were later examined for scale reliability and validity. The reliability of scales internal consistency was tested, using Cronbach's alpha coefficient. Ideally, this coefficient value should be above 0.7. From the table 1, it can be seen that the scales used to measure the attitudes toward internet usage and attitudes toward internet advertising have high levels of consistency. Thus, the scales used in the study for measuring attitudes passed the test of reliability.
Aurora’s Business School
32AURORAS JOURNAL OF MANAGEMENT
Table 1: Reliability Analysis of Pilot Study
Scales Cronbach’s Alpha No. of Items
Attitudes toward Internet Usage
Perceived ease of use 0.816 3
Perceived usefulness 0.780 7
Perceived enjoyment 0.768 5
Attitudes toward Internet Advertising
Perceived Informativeness 0.899 7
Perceived Entertainment 0.869 5
Perceived Irritation 0.839 5
Perceived Credibility 0.763 2
Perceived Value 0.877 3
Purchase Intention 0.894 3
APR – JUN 2013
6.2 QuestionnaireThe questionnaire used for the survey consists of two parts. The first segment deals with the questions framed to collect the demographic, internet usage characteristics of the respondents like length of internet usage, frequency of internet usage and quantity of internet usage. Further, respondents internet usage hours are also ascertained, based on purpose by categorizing into leisure, work related and household or family. The second segment was crafted to ascertain internet using motivations developed by Teo (2001) - perceived ease of use, perceived usefulness and perceived enjoyment - and further aimed at measuring attitudes toward internet advertising and purchase intention of the respondents by using five scales: perceived information, entertainment, irritation, reliability and value.
6.3 Data CollectionProficiency of internet use is a special audience qualification that does not exist in other established mass media. Having internet access does not automatically mean that people use the internet at a level that meets the need of the present study. In most of the earlier studies, student samples were studied. To avoid the controversy over the use of students as surrogates for internet service users, the present study has deliberately chosen non-student sample i.e. software professionals. Choice of software professionals or employees is based on their nature of work, income levels, high internet browsing skill levels and ability to shop over internet.
A convenience sample of 920 software employees is used in the present study, taken from the prominent IT hubs in India such as Bangalore, Hyderabad, Chennai, Pune and Mumbai cities where a large number of IT companies are located and software professionals are employed. The questionnaires were distributed physically, through web links and emails to professionals employed in software companies operating in different city locations in India. The sample was drawn from both men and women software professionals holding positions ranging from trainees or fresher's to middle management. A total of 596 filled-in questionnaires were collected from online and mail survey methods, out of which 52 questionnaires were half-filled and 32 other questionnaires were found having inconsistency in the responses. Both half-filled and inconsistent questionnaires were removed from the sample, leaving finally 512 valid, usable questionnaires.
Gender Differences in Internet Usage and Attitudes toward Internet Advertising

33AURORAS JOURNAL OF MANAGEMENT APR – JUN 2013
7. FINDINGS OF THE STUDYH1: There is a significant difference between male and female software professionals in the
internet usage with respect to time spent and purpose.
To test the hypothesis, the student's “t” test was conducted to examine the differences between male and female software professionals in internet usage with respect to time spent and purpose, which compares the mean scores of two groups on a given variable. From the table 2, it is obvious that mean values for male and female are of same magnitude except in frequency of using internet and internet usage for leisure activities. Males dominate in frequency of using internet, whereas females dominate in leisure use-related activities.
The t-test results amply demonstrate that there are no significant gender variations in internet usage and its purpose, the exceptions being, frequency of internet usage and its use in leisure-related activities.
Table 2: Gender Differences in Internet Usage and its Purposes
This could be explained away in terms of the nature of the sample selected for the present study. Basically, differences do not exist between male – female software professionals as to their spending time on internet and type of job or task they perform in organisations. Even though some distinct cultural inclinations may exist in India, it may not be seen significant in job environment while working. The t-test results clearly show that there are no gender differences in internet usage and internet using purpose. Therefore, H1 is rejected.
Some earlier studies found significant difference between men and women in this respect prior to the year 2000 (Teo, 2001). But, the recent studies found no significant gender differences in internet usage (Luan et al., 2008; Richardson, 2009). Thus, the finding of this study is consistent with those of the previous studies which reported no significant differences between male and female respondents in the internet usage with respect to time spent and purpose.
H2: There is a significant attitudinal difference between male and female respondents towards using internet.
Table 3 portrays the t-test results to examine the gender attitudinal differences towards internet usage. It is observed from the table that the mean shows significant differences between male and female. The attitudes toward internet usage was examined using Technology Acceptance Model
Note: Significance at 95% confidence level.
Aurora’s Business School

34AURORAS JOURNAL OF MANAGEMENT APR – JUN 2013
(TAM) by considering three scales such as perceived ease of use, perceived usefulness and perceived enjoyment. Though the previous hypothesis is rejected showing no gender differences in using internet, the attitude toward using internet shows a different pattern. The t-test results show a statistical significant difference between male and female with respect to their attitudes toward internet usage.
Table 3: Gender Attitudinal Differences towards Internet Usage
H3: There is a significant attitudinal difference between male and female software professionals toward internet advertising
The attitudes toward internet advertising are examined for its significance at 0.05 level (95% confidence interval), using t-test. The t-values of attitudes toward internet advertising are not significant at 0.05 level (t=0.782). But significant differences exist in terms of perceived information (t=3.251), perceived entertainment (t=-3.173), perceived credibility (t=2.231) and purchase intention (t=2.276).
Table 4: Gender Attitudinal Differences towards Internet Advertising
The results show no attitudinal differences between males and females. Specifically, to males internet advertising is more informative and credible as compared to females, whereas to females internet advertising is more entertaining. The purchase intention is found more in males than in females. Though some differences exist in their perceptions, overall male–female attitudes are not significantly different. Thus, H2 is rejected.
Brackett & Carr (2001) reported that demographic variables had direct impact on attitudes toward internet advertising. Idris et al. (2009) also found that the personal factors like gender and age had high level of significant relationship to the attitudes toward various media advertising, online and
Note:*significant at 95% confidence interval.
Note:*significant at 95% confidence interval.
Gender Differences in Internet Usage and Attitudes toward Internet Advertising

35AURORAS JOURNAL OF MANAGEMENT APR – JUN 2013
traditional. But, the findings of the present study indicate no gender influence on attitudes toward internet advertising, which is not in conformity with those of the previous studies. Thus, the study has opened a new vista to investigate the attitudes toward internet advertising in Indian context as influenced by demographic variables exclusively.
8. CONCLUSIONThe present research involving internet usage patterns of software professionals found that the usage averaged 12-13 hours per week or 2-3 hours per day. The internet usage is higher in leisure, moderate when related to work and low in case of family/household purpose, which implies the low level usage of internet for online shopping or internet transactions in India. It was found that the software professionals hold neither positive nor negative attitudes towards internet advertising, i.e., their attitudes toward internet advertising are neutral. These neutral attitudes reveal that software professionals accept and ignore/reject internet advertising simultaneously. They perceive internet advertising both positive and negative – being informative, entertaining, useful and irritating.
The study found no significant gender differences among software professionals as to their internet usage patterns, exceptions being its usage frequency and its use during leisure. The internet usage during leisure is dominant in female professionals, and usage frequency dominant in male professionals. Further, no gender differences were noticed in attitudes toward internet advertising. The attitudes of males were found dominant in perceived information, and credibility of advertising, whereas those of females in perceived entertainment. The irritation and credibility were similarly perceived both by male and female software professionals. The overall attitudes were reported to be the same among male and female software professionals.
ReferencesBimber Bruce. (2003), "Measuring the Gender Gap on the Internet", Social Science Quarterly, Vol. 81, No. 3, pp.
13-22.
Brackett, L.K. & Carr, B.N. (2001). “Cyberspace Advertising vs. Other Media: Consumer vs. Mature Student Attitudes”, Journal of Advertising Research, Vol. 41, No. 5, pp. 23-32.
Davis, F. D. (1989), “Perceived Usefulness, Perceived Ease of Use and User Acceptance of Information Technology”, MIS Quarterly, Vol. 13, No. 3, pp. 319-340.
Ducoffe, R. H. (1995), “How Consumers Assess the Value of Advertising”, Journal of Current Issues and Research in Advertising, Vol. 17, No. 1, pp. 1-18.
Ducoffe, R. H. (1996), “Advertising Value and Advertising on the Web”, Journal of Advertising Research, Vol. 36, No. 5, pp. 21-35.
Lim Y.M., Yap C.S., and Lau T.C. (2010), “Response to Internet Advertising Among Malaysian Young Consumers”, Cross-Cultural Communication, Vol. 6, No. 2, pp. 93-99.
Liya Wang (2007), "The Effects of Internet Advertising Attitude and Brand Image on Purchase Intention: A Study of Online Users in Taiwan”, Thesis, National Cheng Kung University.
Luan W.S., Fung N.S., and Atan Hanafi. (2008), "Gender Differences in the Usage and Attitudes toward the Internet among Student Teachers in a Public Malaysian University", American Journal of Applied Sciences, Vol. 5, No. 6, pp. 689-697.
Luo Xueming. (2002), "Uses and Gratifications Theory and E-Consumer Behaviors: A Structural Equation Modelling Study", Journal of Interactive Advertising, Vol. 2, No. 2, Spring 2002. [Online] http://www.jiad.org/ (Accessed on 17.11.2009)
Mehta, R., Sivadas, E. (1995), “Comparing Response Rates and Response Content in Mail versus Electronic Mail Surveys”, Journal of Market Research Society, Vol. 37, No. 4, pp. 429-439
Aurora’s Business School

36AURORAS JOURNAL OF MANAGEMENT APR – JUN 2013
Pollay, R.W. & Mittal, B. (1993), "Here's the Beef: Factors, Determinants, and Segments in Consumer Criticism of Advertising", Journal of Marketing, Vol. 57, No. 3, pp. 99-114.
Porter C.E., and Naveen. B. (2006), "Using the Technology Acceptance Model to Explain How Attitudes Determine Internet Usage: The Role of Perceived Access Barriers and Demographics", Journal of Business Review, Vol. 59, pp. 999-1007
Previte Josephine & Ed Forrest (1998), "Internet Advertising: An Assessment of Consumer Attitudes to Advertising on the Internet", ANZMAC 1998 conference, pp. 2040 – 2052
Previte Josephine & Ed Forrest (1998), "Internet Advertising: An Assessment of Consumer Attitudes to Advertising on the Internet", ANZMAC 1998 conference, pp. 2040 – 2052
Rettie Ruth, Robinson Helen and Jenner Blaise (2003), "Does Internet Advertising Alienate Users?" Kingston Business School, Occasional Paper Series No. 52. [Online] http://eprints.kingston.ac.uk/6393/ (Accessed on 14.02.2010)
Richardson Keith (2009), “An Investigation into Internet Use by 45-54 year olds”, Thesis submitted to University of Chester.
Rodgers shelly and Thorson Esther (2000), "The Interactive Advertising Model: How users perceive and Process Online Ads", Journal of Interactive Advertising, Vol. 1, No. 1 (Fall 2000), pp. 42-61 [Online] http://jiad.org/voll/nol/rodgers (Accessed on 19.08.2009)
Schlosser E. Ann, Shavitt Sharon and Kanfer Alaina (1999), "Survey of Internet Users' Attitudes Toward Internet Advertising", Journal of Interactive Marketing, Vol. 13, No. 3, pp 34-54.
Shavitt, S., Lowrey, P.M. and Haefner J.E. (1998), "Public Attitudes Toward Advertising: More Favourable Than You Might Think", Journal of Advertising Research, (July/August), pp. 7-22
Tan Soo Jiuan and Chia Lily (2007), "Are We Measuring the Same Attitude? Understanding Media Effects on Attitude towards Advertising", Marketing Theory articles, Sage Publications, Vol. 7, No. 4, pp. 353-377
Taylor J. Wal, Zhu X. Grant, Dekkers John, and Marshall Stewart (2003), "Socio-Economic Factors Affecting Home Internet Usage Patterns in Central Queensland", Informing Science Journal, Vol. 6, pp. 233-246
Teo Thompson S.H. (1998), "Differential effects of occupation on Internet usage", Internet Research: Electronic Networking Applications and Policy, Vol. 8, No. 2, pp. 156-165
Teo Thompson S.H. (2001), “Demographic and Motivating Variables Associated with Internet Usage Activities,” Internet Research: Electronic Networking and Policy, Vol. 11, No. 2, pp. 125- 137.
Wang. C, Zhang Ping, Choi Risook, and Eredita D. Michael (2002), "Understanding Consumers Attitude Toward Advertising", Human-Computer Interaction Studies in MIS, 2002 – 8th Americas Conference on Information, Systems, pp. 1143-1148. [Online] http://melody.syr.edu/pzhang/publications/AMCIS02_Wang_etal.pdf (Accessed on 16.09.2009)
Zanot, E. (1984), “Public Attitudes towards Advertising: The American Experience”, International Journal of Advertising, Vol. 3, No. 1, pp. 3-15.
About the AuthorsAbout the Authors
* Associate Professor, Rayalaseema Institute of Information and Management Sciences, Tirupati.** Professor, Department of Management Studies, Sri Venkateswara University, Tirupati.
Gender Differences in Internet Usage and Attitudes toward Internet Advertising

Call for Papers
Auroras Journal of Management ( , a quarterly publication of the Aurora's Business School, Hyderabad, India, is a journal addressed to managers in the industry, the government and non-profit organizations. It aims at disseminating the results of research studies that are of relevance to their jobs and capable of being applied at their work-place. AJM provides a combination of scholarly research papers and papers that are conceptual and application-oriented. It does not confine itself to any one functional area, but invites articles relating to all areas of management, marketing, finance, organizational behavior, and human resources, operations, etc. The journal also features articles on various sectors like industry, agriculture, banking, international trade, urban and rural development, public systems, and information systems cutting across functions.
Auroras Journal of Management welcomes high quality papers on management, business, and organizational issues both from academicians and practitioners. Papers based on theoretical/empirical research/ experience should satisfy the criteria for good quality research and show the practical applicability and/or policy implications of their conclusions. All articles are first screened at the Editor's level, and those considered of sufficiently high quality are double blind refereed by reviewers who ensure a high standard of academic rigor in all the articles.
Authors can submit their contribution for consideration under any of these features:l Research Articles which present emerging issues and ideas that call for action or rethinking by
managers, administrators and policy makers in organizations. Recommended length of the article, not exceeding 7,500 words.
l Book Reviews which covers reviews of contemporary and classical books on management.l Articles on social, economic and political issues which deal with the analysis and resolution of
managerial and academic issues based on analytical, empirical or case research/ studies/ illustrations.
Please send your articles to:Editor
Auroras Journal of ManagementAurora's Business School
ChikkadapallyHyderabad- 500 020. India
You may also mail your papers/articles to [email protected]
AJM)
37AURORAS JOURNAL OF MANAGEMENT APR – JUN 2013

Guidelines for Submission of Book Reviews in AJM
Auroras Journal of Management (AJM) invites the submission of both, commissioned and unsolicited book reviews, on scholarly topics of relevance to managers and management educators.
1. The reviews need to be restricted to 3000 words.
2. The review should begin with listing of the bibliographical details of the book comprising of the full title and sub-title and the name of the Author as it appears on the cover, details of the place and name of the publisher, year of publication, the number of pages in the book, and the price, if listed. Please do include the ISBN as well, since it will helps in tracking the book.
3. Reviews can be written by one or more reviewers, mentioning clearly their name(s) along with the details and institutional affiliations, if any.
4. Reviews should engage with issues, problems and themes articulated in the book and make a rigorous attempt to identify and assess the main set of arguments that have been put forth by the Author. It should, in other words, be a strong engagement with the conceptual structure of the book and should bring out its strengths and weaknesses. The structure of the review should avoid a mere 'chapter by chapter' summary.
5. References are to be avoided.
6. An in-depth analysis of the book is more important than using the review as an opportunity to survey the area per se. However, the review may, situate the book in a given genre or a particular series of scholarly publication whenever it is appropriate.
7. It would be useful if the reviewer could also include comments on the stylistic aspects of the book.
8. In the case of commissioned book review, the reviewers are expected to meet the deadline for submission and return the proofed copy of the review to the Editorial office with consent for publication.
38AURORAS JOURNAL OF MANAGEMENT APR – JUN 2013