Airtel Africa plcBharti Airtel Uganda Holdings B.V., Bharti Airtel Zambia Holdings B.V., Celtel...
59
Report on the results for the third quarter and nine months ended December 31, 2019 Airtel Africa plc Ion January 28, 2020 The financial statements included in this quarterly report fairly presents in all material respects the financial position, results of operations and cash flow of the Group as of, and for the periods presented in this report. | Mobile Services I Mobile Money | AIRTEL AFRICA
Transcript of Airtel Africa plcBharti Airtel Uganda Holdings B.V., Bharti Airtel Zambia Holdings B.V., Celtel...

Report on the results for the third quarter and nine months ended December 31, 2019
Airtel Africa plc
Ion
January 28, 2020
The financial statements included in this quarterly report fairly presents in all material respects the financial position,
results of operations and cash flow of the Group as of, and for the periods presented in this report.
| Mobile Services I Mobile Money |
AIRTEL AFRICA
Page 1 of 58
Supplemental Disclosures
Basis of preparation:- The financial information contained in this report
is drawn from Airtel Africa plc’s interim condensed consolidated financial
statements prepared under IAS 34 for the third quarter and nine months
ended 31 December 2019 and extracted from Airtel Africa plc’s Historical
Financial Information prepared under International Financial Reporting
Standard (IFRS) (as contained in the prospectus) for all the comparative
periods presented.
Use of certain Non-GAAP measures:- This result announcement contains
certain information on the Group’s results of operations and cash flows
that have been derived from amounts calculated in accordance with
International Financial Reporting Standard (IFRS), but are not in
themselves IFRS measures. They should not be viewed in isolation as
alternatives to the equivalent IFRS measures and should be read in
conjunction with the equivalent IFRS measures.
Further, disclosures are also provided under “7.2 Use of Non - GAAP Financial Information” on page 33
Safe Harbor: The IAS 34 financials considered for the purpose of this
report is unaudited.
Convenience translation: - We publish our financial statements in
United States Dollars. All references herein to “US dollars”, “USD” and
“US$” are to United States dollars. Translation of income statement items
have been made from local currencies of Africa operating units to USD
(unless otherwise indicated) using the respective monthly average rates.
Translation of statement of financial position items has been made using
the closing rate. All amounts translated as described above are provided
solely for the convenience of the reader, and no representation is made
that the local currencies or USD amounts referred to herein could have
been or could be converted into USD or local currencies respectively, as
the case may be, at any particular rate, the above rates or at all. Any
discrepancies in any table between totals and sums of the amounts listed
are due to rounding off.
Others: In this report, the terms “we”, “us”, “our”, “ Airtel - Africa”, or
“Africa”, unless otherwise specified or the context otherwise implies, refer
to the Airtel Africa plc and its subsidiaries, Bharti Airtel International
(Netherlands) B.V., Africa Towers N.V., Airtel (Seychelles) Limited, Airtel
Congo S.A, Airtel Gabon S.A., Airtel Madagascar S.A., Airtel Malawi plc,
Airtel Mobile Commerce B.V., Airtel Mobile Commerce Holdings B.V.,
Airtel Mobile Commerce Kenya Limited, Airtel Mobile Commerce Limited
(Malawi), Airtel Mobile Commerce Madagascar S.A., Airtel Mobile
Commerce Rwanda Limited, Airtel Mobile Commerce (Seychelles)
Limited, Airtel Mobile Commerce Tanzania Limited, Airtel Mobile
Commerce Tchad SARL, Airtel Mobile Commerce Uganda Limited, Airtel
Mobile Commerce Zambia Limited , Airtel Money RDC S.A., Airtel Money
Niger S.A., Airtel Money S.A. (Gabon), Airtel Networks Kenya Limited,
Airtel Networks Limited, Airtel Networks Zambia plc, Airtel Rwanda
Limited, Airtel Tanzania plc (formerly known as Airtel Tanzania Limited),
Airtel Tchad S.A., Airtel Uganda Limited, Bharti Airtel Africa B.V., Bharti
Airtel Chad Holdings B.V. , Bharti Airtel Congo Holdings B.V., Bharti Airtel
Developers Forum Limited, Bharti Airtel Gabon Holdings B.V. , Bharti
Airtel Kenya B.V., Bharti Airtel Kenya Holdings B.V., Bharti Airtel
Madagascar Holdings B.V. , Bharti Airtel Malawi Holdings B.V. , Bharti
Airtel Mali Holdings B.V., Bharti Airtel Niger Holdings B.V. , Bharti Airtel
Nigeria B.V. , Bharti Airtel Nigeria Holdings II B.V. , Bharti Airtel RDC
Holdings B.V. , Bharti Airtel Services B.V. , Bharti Airtel Tanzania B.V.,
Bharti Airtel Uganda Holdings B.V., Bharti Airtel Zambia Holdings B.V.,
Celtel (Mauritius) Holdings Limited, Airtel Congo RDC S.A., Celtel Niger
S.A., Channel Sea Management Company (Mauritius) Limited, Congo
RDC Towers S.A., Gabon Towers S.A. (under dissolution), Indian Ocean
Telecom Limited, Madagascar Towers S.A., Malawi Towers Limited,
Mobile Commerce Congo S.A., Montana International, Partnership
Investments S.A.R.L, Société Malgache de Telephonie Cellulaire SA,
Tanzania Towers Limited, Bharti Airtel Rwanda Holdings Limited , Airtel
Money Transfer Ltd, Airtel Money Tanzania Limited , Airtel Mobile
Commerce Nigeria Limited (incorporate w.e.f. August 31, 2017), Airtel
Mobile Commerce Nigeria B.V.(incorporated w.e.f. 5th December, 2018),
Airtel Mobile Commerce (Seychelles) B.V. (incorporated w.e.f. 29th
January, 2019), Airtel Mobile Commerce Congo B.V. (incorporated w.e.f.
29th January, 2019), Airtel Mobile Commerce Kenya B.V. (incorporated
w.e.f. 29th January, 2019), Airtel Mobile Commerce Madagascar B.V.
(incorporated w.e.f. 29th January, 2019), Airtel Mobile Commerce Malawi
B.V. (incorporated w.e.f. 29th January, 2019), Airtel Mobile Commerce
Rwanda B.V. (incorporated w.e.f. 29th January, 2019), Airtel Mobile
Commerce Tchad B.V. (incorporated w.e.f. 29th January, 2019), Airtel
Mobile Commerce Uganda B.V. (incorporated w.e.f. 29th January, 2019),
Airtel Mobile Commerce Zambia B.V. (incorporated w.e.f. 29th January,
2019), Airtel International LLP (incorporated w.e.f. 27th March, 2019.
Disclaimer: By reading this presentation you agree to be bound by the
following conditions.
The information contained in this presentation in relation to Airtel Africa
plc ("Airtel Africa") and its subsidiaries has been prepared solely for use
at this presentation. The presentation is not directed to, or intended for
distribution to or use by, any person or entity that is a citizen or resident
or located in any jurisdiction where such distribution, publication,
availability or use would be contrary to law or regulation or which would
require any registration or licensing within such jurisdiction.
References in this presentation to "Airtel Africa", "Group", "we", "us" and
"our" when denoting opinion refer to Airtel Africa plc and its subsidiaries.
Forward-looking statement
This document contains certain forward-looking statements including
"forward-looking" statements made within the meaning of Section 21E of
the United States Securities Exchange Act of 1934, regarding our
intentions, beliefs or current expectations concerning, amongst other
things, our results of operations, financial condition, liquidity, prospects,
growth, strategies and the economic and business circumstances
occurring from time to time in the countries and markets in which the
Group operates.
These statements are often, but not always, made through the use of
words or phrases such as "believe," "anticipate," "could," "may," "would,"
"should," "intend," "plan," "potential," "predict," "will," "expect," "estimate,"
"project," "positioned," "strategy," "outlook", "target" and similar
expressions.
It is believed that the expectations reflected in this document are
reasonable, but they may be affected by a wide range of variables that
could cause actual results to differ materially from those currently
anticipated.
All such forward-looking statements involve estimates and assumptions
that are subject to risks, uncertainties and other factors that could cause
actual future financial condition, performance and results to differ
materially from the plans, goals, expectations and results expressed in
the forward-looking statements and other financial and/or statistical data
within this communication.
Among the key factors that could cause actual results to differ materially
from those projected in the forward-looking statements are uncertainties
related to the following: the impact of competition from illicit trade; the
impact of adverse domestic or international legislation and regulation;
changes in domestic or international tax laws and rates; adverse
litigation and dispute outcomes and the effect of such outcomes on
Airtel Africa’s financial condition; changes or differences in domestic or
Page 2 of 58
international economic or political conditions; the ability to obtain price
increases and the impact of price increases on consumer affordability
thresholds; adverse decisions by domestic or international regulatory
bodies; the impact of market size reduction and consumer down-trading;
translational and transactional foreign exchange rate exposure; the
impact of serious injury, illness or death in the workplace; the ability to
maintain credit ratings; the ability to develop, produce or market new
alternative products and to do so profitably; the ability to effectively
implement strategic initiatives and actions taken to increase sales
growth; the ability to enhance cash generation and pay dividends and
changes in the market position, businesses, financial condition, results
of operations or prospects of Airtel Africa.
Past performance is no guide to future performance and persons needing
advice should consult an independent financial adviser. The forward-
looking statements contained in this document reflect the knowledge and
information available to Airtel Africa at the date of preparation of this
document and Airtel Africa undertakes no obligation to update or revise
these forward-looking statements, whether as a result of new
information, future events or otherwise. Readers are cautioned not to
place undue reliance on such forward-looking statements.
No statement in this communication is intended to be, nor should be
construed as, a profit forecast or a profit estimate and no statement in
this communication should be interpreted to mean that earnings per
share of Airtel Africa plc for the current or any future financial periods
would necessarily match, exceed or be lower than the historical
published earnings per share of Airtel Africa plc.
Financial data included in this document are presented in US$ rounded
to the nearest Millions. Therefore, discrepancies in the tables between
totals and the sums of the amounts listed may occur due to such
rounding.
No profit or earnings per share forecasts
No statement in this communication is intended to be, nor should be
construed as, a profit forecast or a profit estimate and no statement in
this communication should be interpreted to mean that earnings per
share of Airtel Africa for the current or any future financial periods would
necessarily match, exceed or be lower than the historical published
earnings per share of Airtel Africa.
Audience
The material in this presentation is provided for the purpose of giving
information about Airtel Africa and its subsidiaries to investors only and
is not intended for general consumers. Airtel Africa, its directors,
employees, agents or advisers do not accept or assume responsibility to
any other person to whom this material is shown or into whose hands it
may come and any such responsibility or liability is expressly disclaimed.
Page 3 of 58
TABLE OF CONTENTS
Section 1 Performance at a glance 4
Section 2 Financial Highlights
2.1 Consolidated - Summary of Consolidated Financial Statements 5
2.2 Consolidated - Summary of Statement of Financial Positions 6
Section 3 Segment Wise – Summary of Financial Statements
3.1 Summarized Statement of Operations 7
3.2 Segment Wise Contribution 10
Section 4 Product wise – Summary of Financial Statements
4.1 Mobile Services – Summarized Statement of Operations 11
4.2 Mobile Services – Segment Wise Contribution 15
4.3 Mobile Money – Summarized Statement of Operations 16
4.4 Product Wise Contribution 17
Section 5 Operating Highlights 18
Section 6 Management Discussion and Analysis
6.1 Reporting Methodology 22
6.2 Key Company Developments 22
6.3 Results of Operations 23
Section 7 Detailed Financial and Related Information 29
Section 8 Net Debt and Cost Schedules 35
Section 9 Trends and Ratio Analysis 37
Section 10 Key Accounting Policies 50
Section 11 Glossary 55
Page 4 of 58
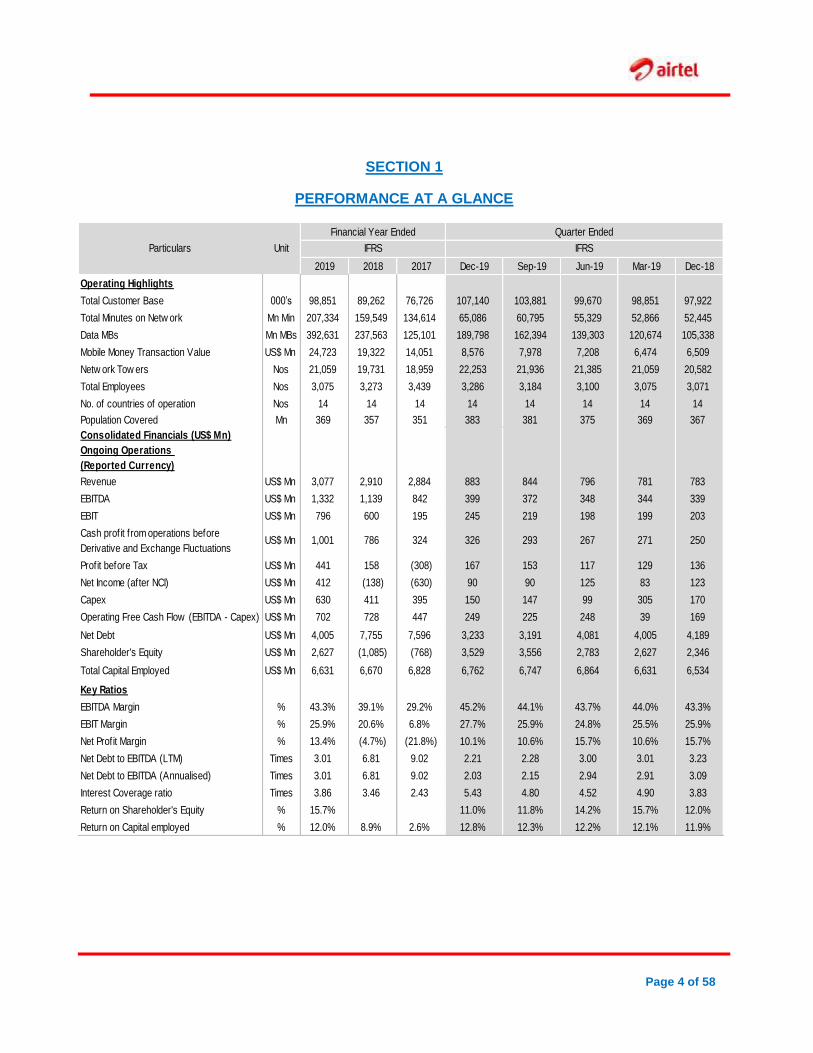
SECTION 1
PERFORMANCE AT A GLANCE
Financial Year Ended Quarter Ended
2019 2018 2017 Dec-19 Sep-19 Jun-19 Mar-19 Dec-18
Operating Highlights
Total Customer Base 000’s 98,851 89,262 76,726 107,140 103,881 99,670 98,851 97,922
Total Minutes on Netw ork Mn Min 207,334 159,549 134,614 65,086 60,795 55,329 52,866 52,445
Data MBs Mn MBs 392,631 237,563 125,101 189,798 162,394 139,303 120,674 105,338
Mobile Money Transaction Value US$ Mn 24,723 19,322 14,051 8,576 7,978 7,208 6,474 6,509
Netw ork Tow ers Nos 21,059 19,731 18,959 22,253 21,936 21,385 21,059 20,582
Total Employees Nos 3,075 3,273 3,439 3,286 3,184 3,100 3,075 3,071
No. of countries of operation Nos 14 14 14 14 14 14 14 14
Population Covered Mn 369 357 351 383 381 375 369 367
Consolidated Financials (US$ Mn)
Ongoing Operations
(Reported Currency)
Revenue US$ Mn 3,077 2,910 2,884 883 844 796 781 783
EBITDA US$ Mn 1,332 1,139 842 399 372 348 344 339
EBIT US$ Mn 796 600 195 245 219 198 199 203
Cash profit from operations before
Derivative and Exchange FluctuationsUS$ Mn 1,001 786 324 326 293 267 271 250
Profit before Tax US$ Mn 441 158 (308) 167 153 117 129 136
Net Income (after NCI) US$ Mn 412 (138) (630) 90 90 125 83 123
Capex US$ Mn 630 411 395 150 147 99 305 170
Operating Free Cash Flow (EBITDA - Capex) US$ Mn 702 728 447 249 225 248 39 169
Net Debt US$ Mn 4,005 7,755 7,596 3,233 3,191 4,081 4,005 4,189
Shareholder's Equity US$ Mn 2,627 (1,085) (768) 3,529 3,556 2,783 2,627 2,346
Total Capital Employed US$ Mn 6,631 6,670 6,828 6,762 6,747 6,864 6,631 6,534
Key Ratios
EBITDA Margin % 43.3% 39.1% 29.2% 45.2% 44.1% 43.7% 44.0% 43.3%
EBIT Margin % 25.9% 20.6% 6.8% 27.7% 25.9% 24.8% 25.5% 25.9%
Net Profit Margin % 13.4% (4.7%) (21.8%) 10.1% 10.6% 15.7% 10.6% 15.7%
Net Debt to EBITDA (LTM) Times 3.01 6.81 9.02 2.21 2.28 3.00 3.01 3.23
Net Debt to EBITDA (Annualised) Times 3.01 6.81 9.02 2.03 2.15 2.94 2.91 3.09
Interest Coverage ratio Times 3.86 3.46 2.43 5.43 4.80 4.52 4.90 3.83
Return on Shareholder's Equity % 15.7% 0.0% 0.0% 11.0% 11.8% 14.2% 15.7% 12.0%
Return on Capital employed % 12.0% 8.9% 2.6% 12.8% 12.3% 12.2% 12.1% 11.9%
IFRSParticulars Unit IFRS
Page 5 of 58
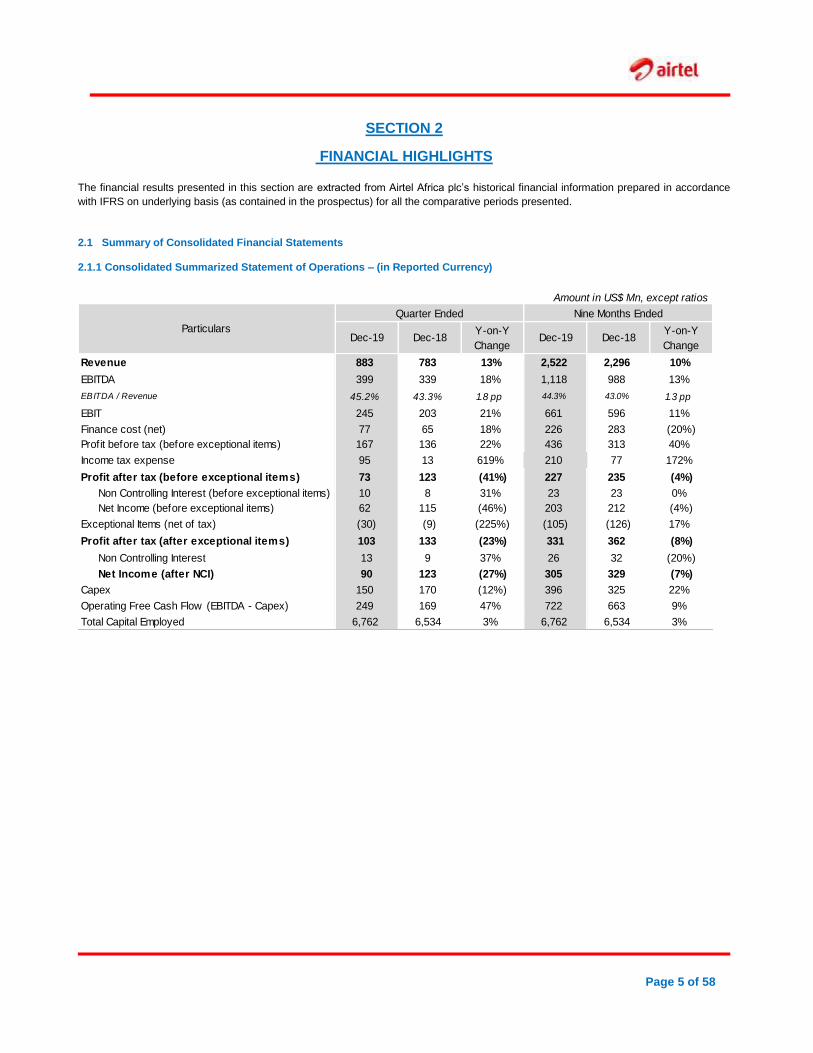
SECTION 2
FINANCIAL HIGHLIGHTS
The financial results presented in this section are extracted from Airtel Africa plc’s historical financial information prepared in accordance
with IFRS on underlying basis (as contained in the prospectus) for all the comparative periods presented.
2.1 Summary of Consolidated Financial Statements
2.1.1 Consolidated Summarized Statement of Operations – (in Reported Currency)
Amount in US$ Mn, except ratios
Quarter Ended Nine Months Ended
Dec-19 Dec-18Y-on-Y
ChangeDec-19 Dec-18
Y-on-Y
Change
Revenue 883 783 13% 2,522 2,296 10%
EBITDA 399 339 18% 1,118 988 13%
EBITDA / Revenue 45.2% 43.3% 1.8 pp 44.3% 43.0% 1.3 pp
EBIT 245 203 21% 661 596 11%
Finance cost (net) 77 65 18% 226 283 (20%)
Profit before tax (before exceptional items) 167 136 22% 436 313 40%
Income tax expense 95 13 619% 210 77 172%
Profit after tax (before exceptional items) 73 123 (41%) 227 235 (4%)
Non Controlling Interest (before exceptional items) 10 8 31% 23 23 0%
Net Income (before exceptional items) 62 115 (46%) 203 212 (4%)
Exceptional Items (net of tax) (30) (9) (225%) (105) (126) 17%
Profit after tax (after exceptional items) 103 133 (23%) 331 362 (8%)
Non Controlling Interest 13 9 37% 26 32 (20%)
Net Income (after NCI) 90 123 (27%) 305 329 (7%)
Capex 150 170 (12%) 396 325 22%
Operating Free Cash Flow (EBITDA - Capex) 249 169 47% 722 663 9%
Total Capital Employed 6,762 6,534 3% 6,762 6,534 3%
Particulars
Page 6 of 58
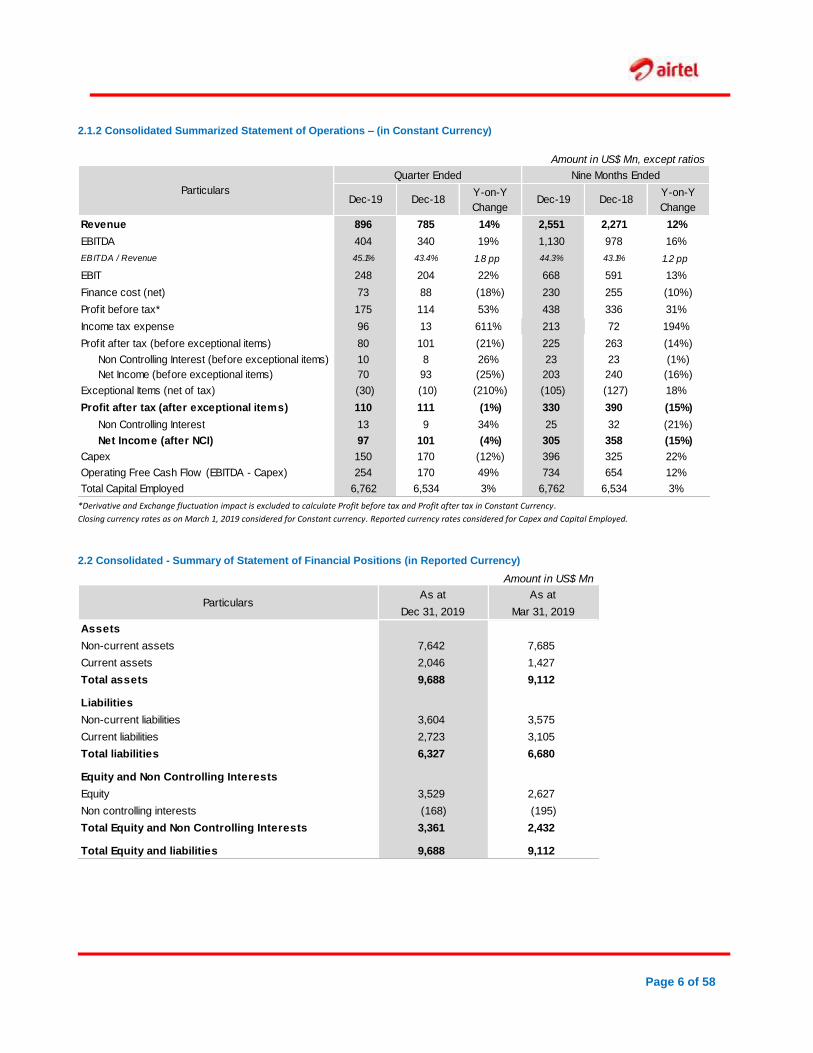
2.1.2 Consolidated Summarized Statement of Operations – (in Constant Currency)
Amount in US$ Mn, except ratios
Quarter Ended Nine Months Ended
Dec-19 Dec-18Y-on-Y
ChangeDec-19 Dec-18
Y-on-Y
Change
Revenue 896 785 14% 2,551 2,271 12%
EBITDA 404 340 19% 1,130 978 16%
EBITDA / Revenue 45.1% 43.4% 1.8 pp 44.3% 43.1% 1.2 pp
EBIT 248 204 22% 668 591 13%
Finance cost (net) 73 88 (18%) 230 255 (10%)
Profit before tax* 175 114 53% 438 336 31%
Income tax expense 96 13 611% 213 72 194%
Profit after tax (before exceptional items) 80 101 (21%) 225 263 (14%)
Non Controlling Interest (before exceptional items) 10 8 26% 23 23 (1%)
Net Income (before exceptional items) 70 93 (25%) 203 240 (16%)
Exceptional Items (net of tax) (30) (10) (210%) (105) (127) 18%
Profit after tax (after exceptional items) 110 111 (1%) 330 390 (15%)
Non Controlling Interest 13 9 34% 25 32 (21%)
Net Income (after NCI) 97 101 (4%) 305 358 (15%)
Capex 150 170 (12%) 396 325 22%
Operating Free Cash Flow (EBITDA - Capex) 254 170 49% 734 654 12%
Total Capital Employed 6,762 6,534 3% 6,762 6,534 3%
Particulars
*Derivative and Exchange fluctuation impact is excluded to calculate Profit before tax and Profit after tax in Constant Currency. Closing currency rates as on March 1, 2019 considered for Constant currency. Reported currency rates considered for Capex and Capital Employed.
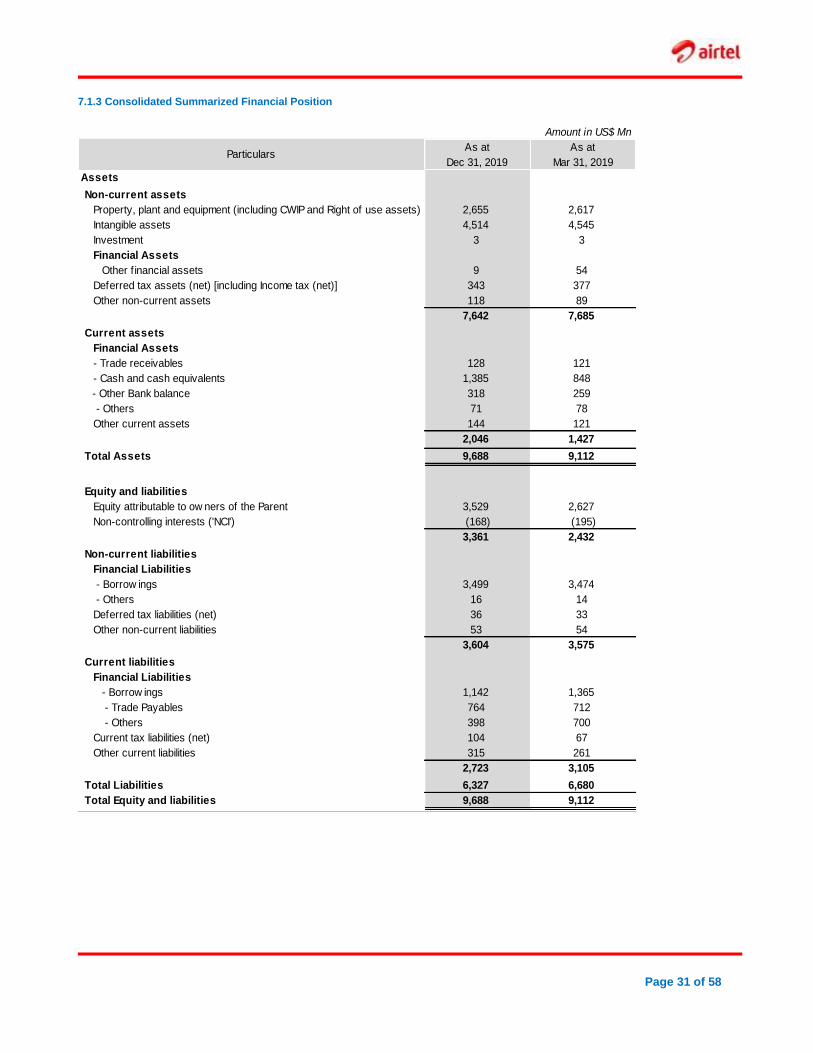
2.2 Consolidated - Summary of Statement of Financial Positions (in Reported Currency)
Amount in US$ Mn
As at As at
Dec 31, 2019 Mar 31, 2019
Assets
Non-current assets 7,642 7,685
Current assets 2,046 1,427
Total assets 9,688 9,112
Liabilities
Non-current liabilities 3,604 3,575
Current liabilities 2,723 3,105
Total liabilities 6,327 6,680
Equity and Non Controlling Interests
Equity 3,529 2,627
Non controlling interests (168) (195)
Total Equity and Non Controlling Interests 3,361 2,432
Total Equity and liabilities 9,688 9,112
Particulars
Page 7 of 58
SECTION 3
SEGMENT WISE – SUMMARY OF FINANCIAL STATEMENTS Segmental reporting includes all businesses of that geography.
3.1 Summarized Statement of Operations
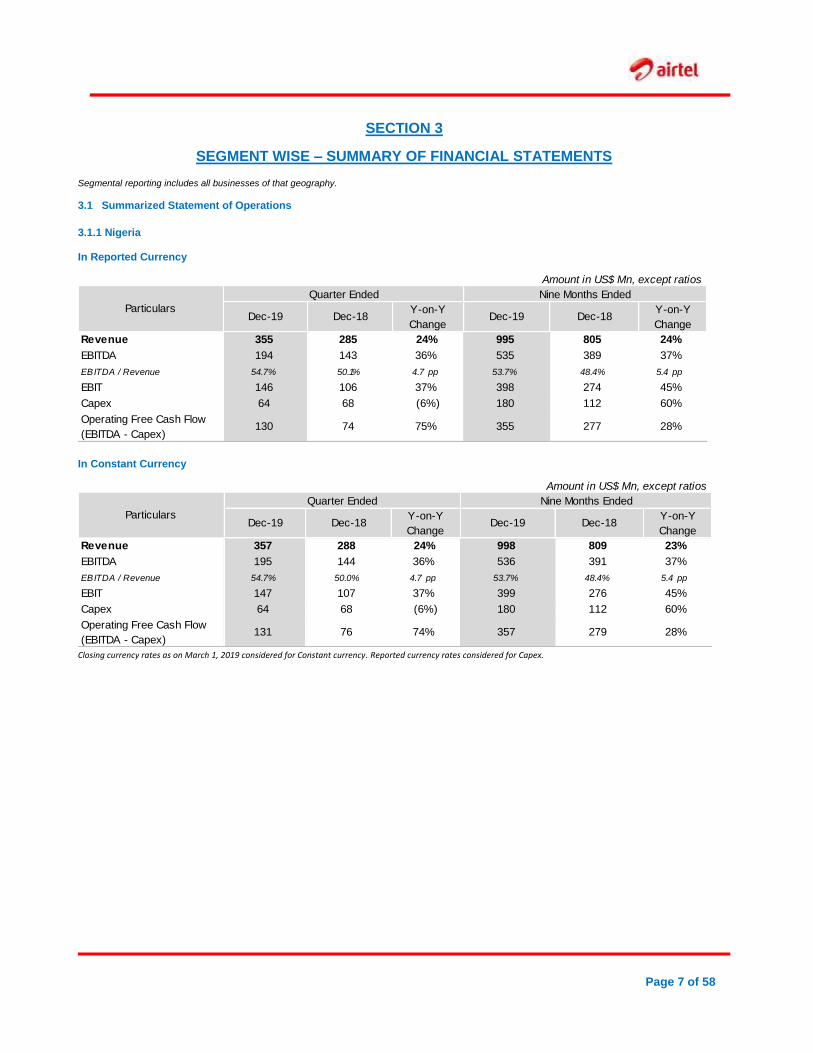
3.1.1 Nigeria In Reported Currency
Amount in US$ Mn, except ratios
Quarter Ended Nine Months Ended
Dec-19 Dec-18Y-on-Y
ChangeDec-19 Dec-18
Y-on-Y
Change
Revenue 355 285 24% 995 805 24%
EBITDA 194 143 36% 535 389 37%
EBITDA / Revenue 54.7% 50.1% 4.7 pp 53.7% 48.4% 5.4 pp
EBIT 146 106 37% 398 274 45%
Capex 64 68 (6%) 180 112 60%
Operating Free Cash Flow
(EBITDA - Capex)130 74 75% 355 277 28%
Particulars
In Constant Currency
Amount in US$ Mn, except ratios
Quarter Ended Nine Months Ended
Dec-19 Dec-18Y-on-Y
ChangeDec-19 Dec-18
Y-on-Y
Change
Revenue 357 288 24% 998 809 23%
EBITDA 195 144 36% 536 391 37%
EBITDA / Revenue 54.7% 50.0% 4.7 pp 53.7% 48.4% 5.4 pp
EBIT 147 107 37% 399 276 45%
Capex 64 68 (6%) 180 112 60%
Operating Free Cash Flow
(EBITDA - Capex)131 76 74% 357 279 28%
Particulars
Closing currency rates as on March 1, 2019 considered for Constant currency. Reported currency rates considered for Capex.
Page 8 of 58
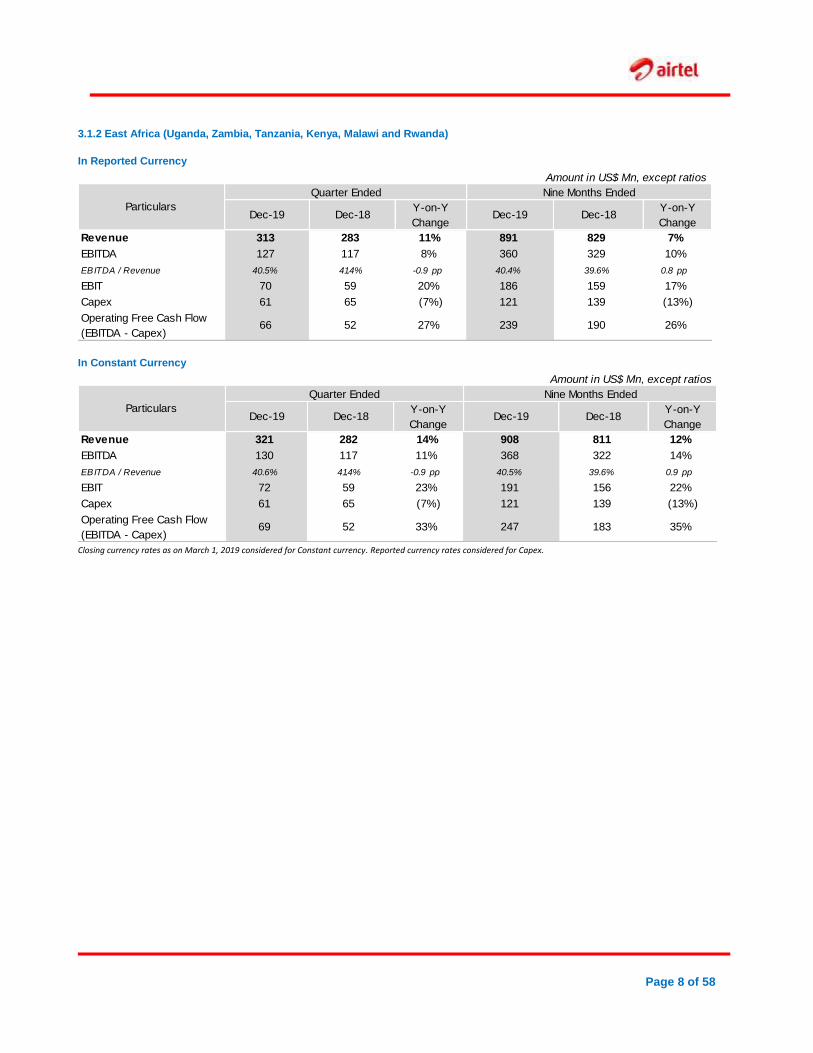
3.1.2 East Africa (Uganda, Zambia, Tanzania, Kenya, Malawi and Rwanda)
In Reported Currency
Amount in US$ Mn, except ratios
Quarter Ended Nine Months Ended
Dec-19 Dec-18Y-on-Y
ChangeDec-19 Dec-18
Y-on-Y
Change
Revenue 313 283 11% 891 829 7%
EBITDA 127 117 8% 360 329 10%
EBITDA / Revenue 40.5% 41.4% -0.9 pp 40.4% 39.6% 0.8 pp
EBIT 70 59 20% 186 159 17%
Capex 61 65 (7%) 121 139 (13%)
Operating Free Cash Flow
(EBITDA - Capex)66 52 27% 239 190 26%
Particulars
In Constant Currency
Amount in US$ Mn, except ratios
Quarter Ended Nine Months Ended
Dec-19 Dec-18Y-on-Y
ChangeDec-19 Dec-18
Y-on-Y
Change
Revenue 321 282 14% 908 811 12%
EBITDA 130 117 11% 368 322 14%
EBITDA / Revenue 40.6% 41.4% -0.9 pp 40.5% 39.6% 0.9 pp
EBIT 72 59 23% 191 156 22%
Capex 61 65 (7%) 121 139 (13%)
Operating Free Cash Flow
(EBITDA - Capex)69 52 33% 247 183 35%
Particulars
Closing currency rates as on March 1, 2019 considered for Constant currency. Reported currency rates considered for Capex.
Page 9 of 58
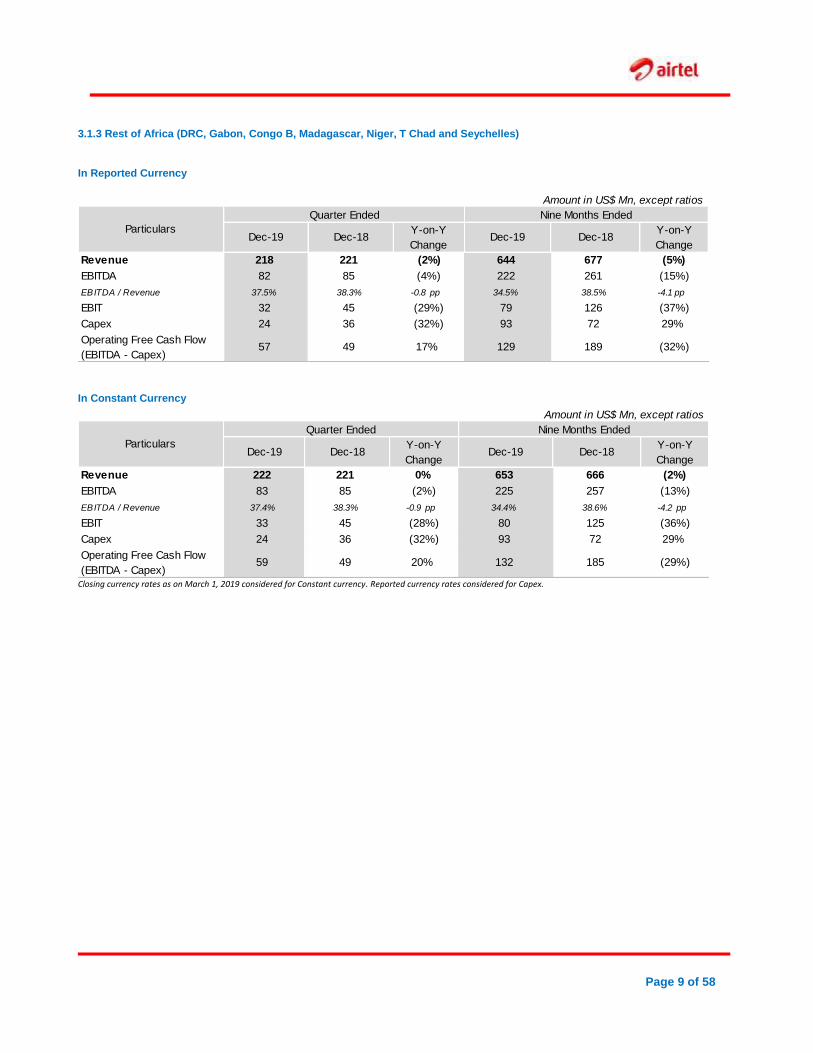
3.1.3 Rest of Africa (DRC, Gabon, Congo B, Madagascar, Niger, T Chad and Seychelles)
In Reported Currency
Amount in US$ Mn, except ratios
Quarter Ended Nine Months Ended
Dec-19 Dec-18Y-on-Y
ChangeDec-19 Dec-18
Y-on-Y
Change
Revenue 218 221 (2%) 644 677 (5%)
EBITDA 82 85 (4%) 222 261 (15%)
EBITDA / Revenue 37.5% 38.3% -0.8 pp 34.5% 38.5% -4.1 pp
EBIT 32 45 (29%) 79 126 (37%)
Capex 24 36 (32%) 93 72 29%
Operating Free Cash Flow
(EBITDA - Capex)57 49 17% 129 189 (32%)
Particulars
In Constant Currency
Amount in US$ Mn, except ratios
Quarter Ended Nine Months Ended
Dec-19 Dec-18Y-on-Y
ChangeDec-19 Dec-18
Y-on-Y
Change
Revenue 222 221 0% 653 666 (2%)
EBITDA 83 85 (2%) 225 257 (13%)
EBITDA / Revenue 37.4% 38.3% -0.9 pp 34.4% 38.6% -4.2 pp
EBIT 33 45 (28%) 80 125 (36%)
Capex 24 36 (32%) 93 72 29%
Operating Free Cash Flow
(EBITDA - Capex)59 49 20% 132 185 (29%)
Particulars
Closing currency rates as on March 1, 2019 considered for Constant currency. Reported currency rates considered for Capex.
Page 10 of 58
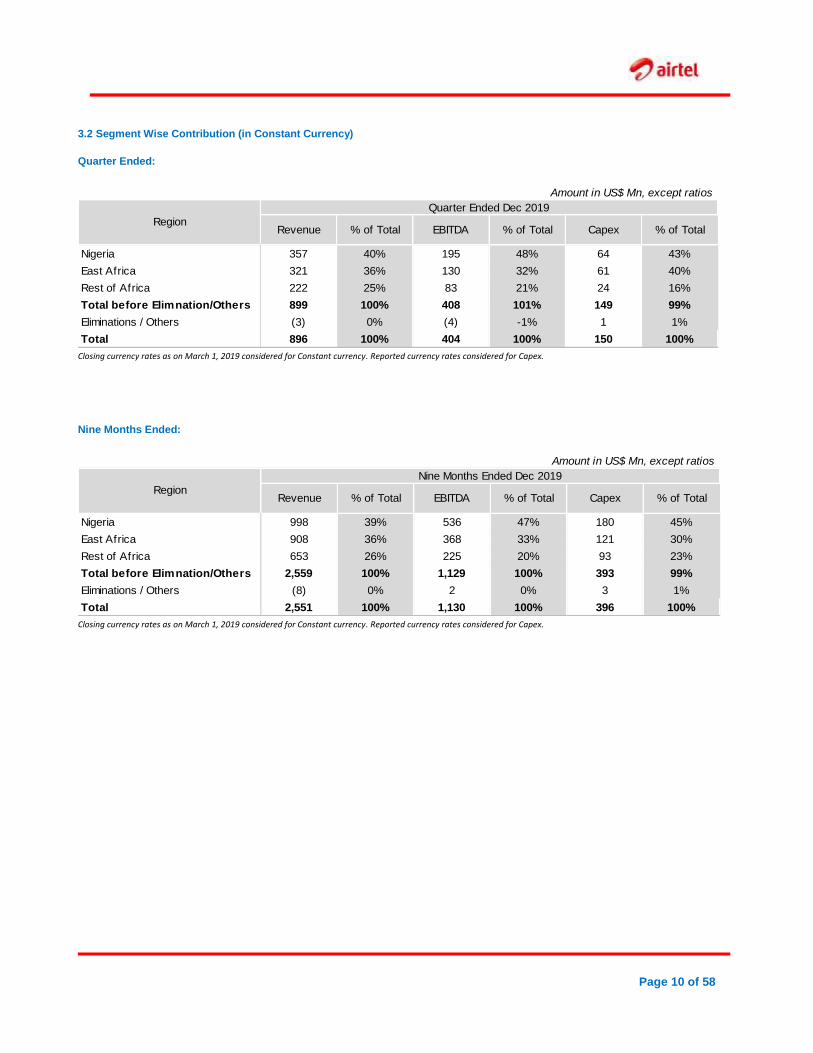
3.2 Segment Wise Contribution (in Constant Currency)
Quarter Ended:
Amount in US$ Mn, except ratios
Quarter Ended Dec 2019
Revenue % of Total EBITDA % of Total Capex % of Total
Nigeria 357 40% 195 48% 64 43%
East Africa 321 36% 130 32% 61 40%
Rest of Africa 222 25% 83 21% 24 16%
Total before Elimnation/Others 899 100% 408 101% 149 99%
Eliminations / Others (3) 0% (4) -1% 1 1%
Total 896 100% 404 100% 150 100%
Region
Closing currency rates as on March 1, 2019 considered for Constant currency. Reported currency rates considered for Capex.
Nine Months Ended:
Amount in US$ Mn, except ratios
Nine Months Ended Dec 2019
Revenue % of Total EBITDA % of Total Capex % of Total
Nigeria 998 39% 536 47% 180 45%
East Africa 908 36% 368 33% 121 30%
Rest of Africa 653 26% 225 20% 93 23%
Total before Elimnation/Others 2,559 100% 1,129 100% 393 99%
Eliminations / Others (8) 0% 2 0% 3 1%
Total 2,551 100% 1,130 100% 396 100%
Region
Closing currency rates as on March 1, 2019 considered for Constant currency. Reported currency rates considered for Capex.
Page 11 of 58
SECTION 4
PRODUCT WISE – SUMMARY OF FINANCIAL STATEMENTS
4.1 Mobile Services- Summarized Statement of Operations
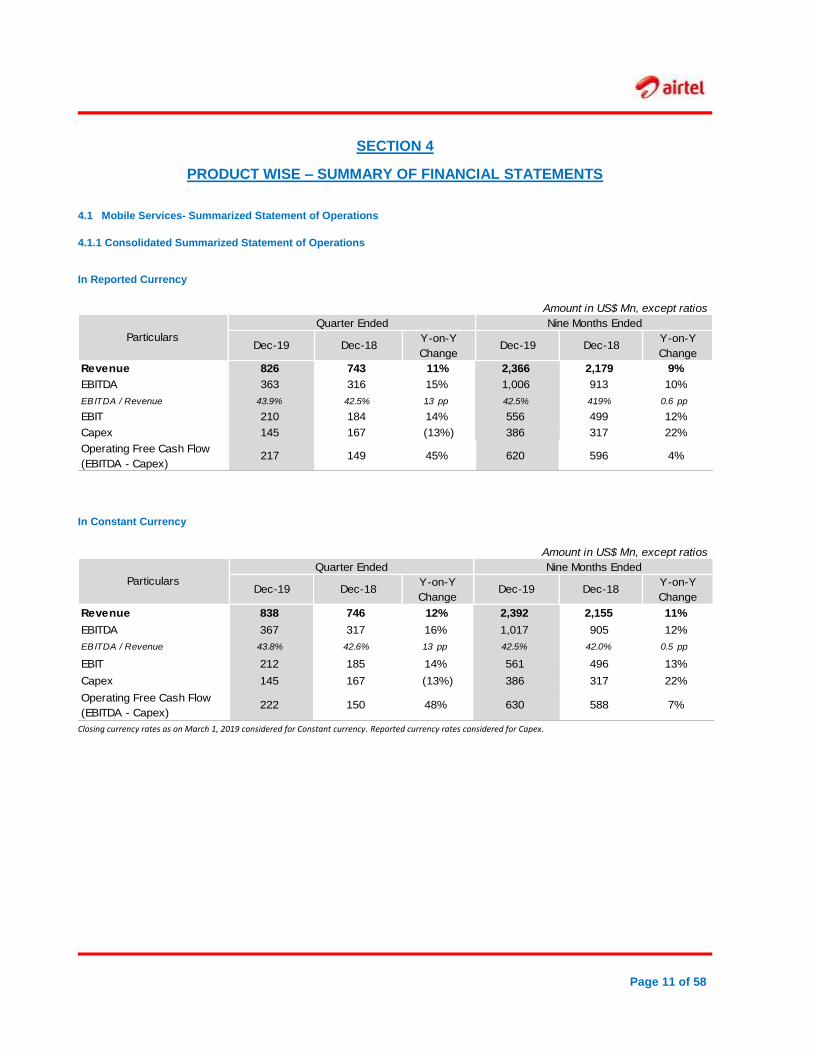
4.1.1 Consolidated Summarized Statement of Operations In Reported Currency
Amount in US$ Mn, except ratios
Quarter Ended Nine Months Ended
Dec-19 Dec-18Y-on-Y
ChangeDec-19 Dec-18
Y-on-Y
Change
Revenue 826 743 11% 2,366 2,179 9%
EBITDA 363 316 15% 1,006 913 10%
EBITDA / Revenue 43.9% 42.5% 1.3 pp 42.5% 41.9% 0.6 pp
EBIT 210 184 14% 556 499 12%
Capex 145 167 (13%) 386 317 22%
Operating Free Cash Flow
(EBITDA - Capex)217 149 45% 620 596 4%
Particulars
In Constant Currency
Amount in US$ Mn, except ratios
Quarter Ended Nine Months Ended
Dec-19 Dec-18Y-on-Y
ChangeDec-19 Dec-18
Y-on-Y
Change
Revenue 838 746 12% 2,392 2,155 11%
EBITDA 367 317 16% 1,017 905 12%
EBITDA / Revenue 43.8% 42.6% 1.3 pp 42.5% 42.0% 0.5 pp
EBIT 212 185 14% 561 496 13%
Capex 145 167 (13%) 386 317 22%
Operating Free Cash Flow
(EBITDA - Capex)222 150 48% 630 588 7%
Particulars
Closing currency rates as on March 1, 2019 considered for Constant currency. Reported currency rates considered for Capex.
Page 12 of 58
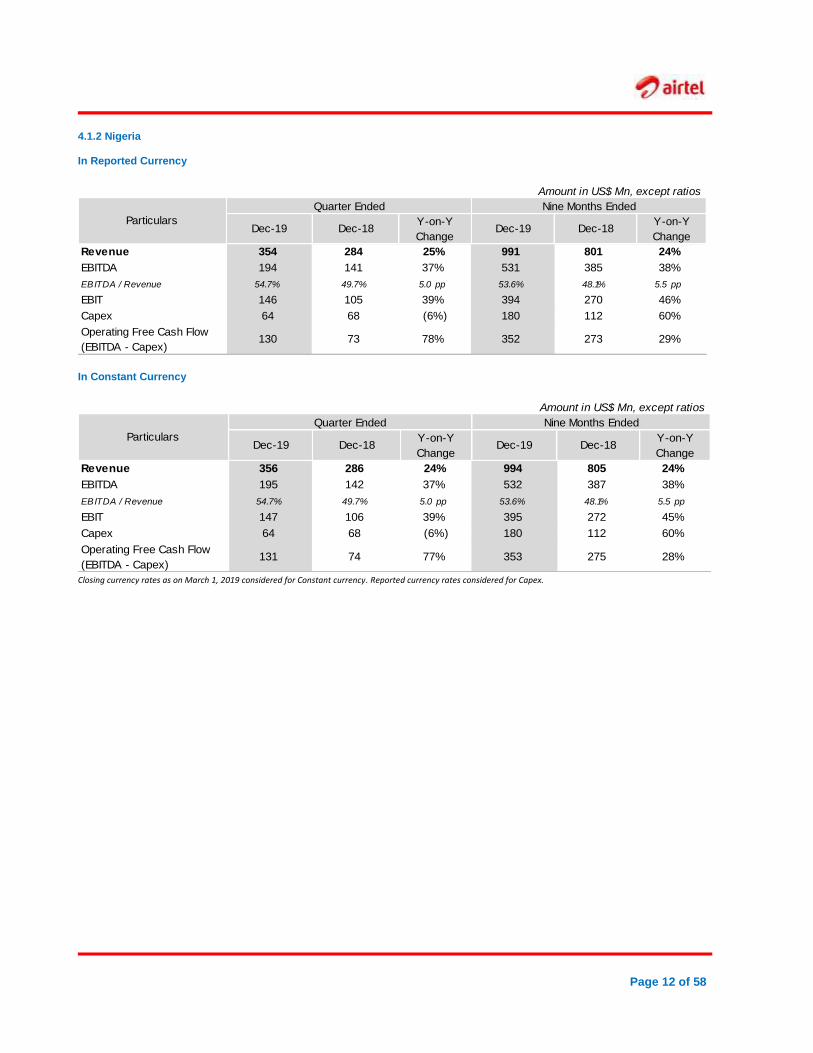
4.1.2 Nigeria In Reported Currency
Amount in US$ Mn, except ratios
Quarter Ended Nine Months Ended
Dec-19 Dec-18Y-on-Y
ChangeDec-19 Dec-18
Y-on-Y
Change
Revenue 354 284 25% 991 801 24%
EBITDA 194 141 37% 531 385 38%
EBITDA / Revenue 54.7% 49.7% 5.0 pp 53.6% 48.1% 5.5 pp
EBIT 146 105 39% 394 270 46%
Capex 64 68 (6%) 180 112 60%
Operating Free Cash Flow
(EBITDA - Capex)130 73 78% 352 273 29%
Particulars
In Constant Currency
Amount in US$ Mn, except ratios
Quarter Ended Nine Months Ended
Dec-19 Dec-18Y-on-Y
ChangeDec-19 Dec-18
Y-on-Y
Change
Revenue 356 286 24% 994 805 24%
EBITDA 195 142 37% 532 387 38%
EBITDA / Revenue 54.7% 49.7% 5.0 pp 53.6% 48.1% 5.5 pp
EBIT 147 106 39% 395 272 45%
Capex 64 68 (6%) 180 112 60%
Operating Free Cash Flow
(EBITDA - Capex)131 74 77% 353 275 28%
Particulars
Closing currency rates as on March 1, 2019 considered for Constant currency. Reported currency rates considered for Capex.
Page 13 of 58
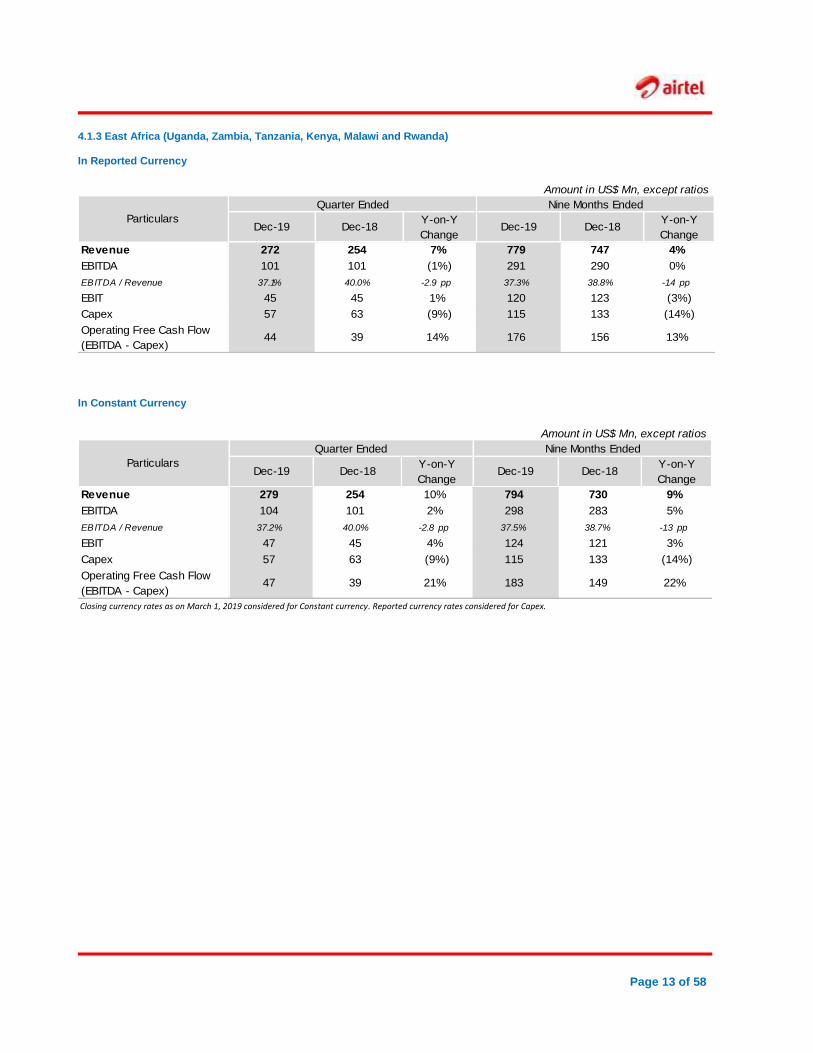
4.1.3 East Africa (Uganda, Zambia, Tanzania, Kenya, Malawi and Rwanda) In Reported Currency
Amount in US$ Mn, except ratios
Quarter Ended Nine Months Ended
Dec-19 Dec-18Y-on-Y
ChangeDec-19 Dec-18
Y-on-Y
Change
Revenue 272 254 7% 779 747 4%
EBITDA 101 101 (1%) 291 290 0%
EBITDA / Revenue 37.1% 40.0% -2.9 pp 37.3% 38.8% -1.4 pp
EBIT 45 45 1% 120 123 (3%)
Capex 57 63 (9%) 115 133 (14%)
Operating Free Cash Flow
(EBITDA - Capex)44 39 14% 176 156 13%
Particulars
In Constant Currency
Amount in US$ Mn, except ratios
Quarter Ended Nine Months Ended
Dec-19 Dec-18Y-on-Y
ChangeDec-19 Dec-18
Y-on-Y
Change
Revenue 279 254 10% 794 730 9%
EBITDA 104 101 2% 298 283 5%
EBITDA / Revenue 37.2% 40.0% -2.8 pp 37.5% 38.7% -1.3 pp
EBIT 47 45 4% 124 121 3%
Capex 57 63 (9%) 115 133 (14%)
Operating Free Cash Flow
(EBITDA - Capex)47 39 21% 183 149 22%
Particulars
Closing currency rates as on March 1, 2019 considered for Constant currency. Reported currency rates considered for Capex.
Page 14 of 58
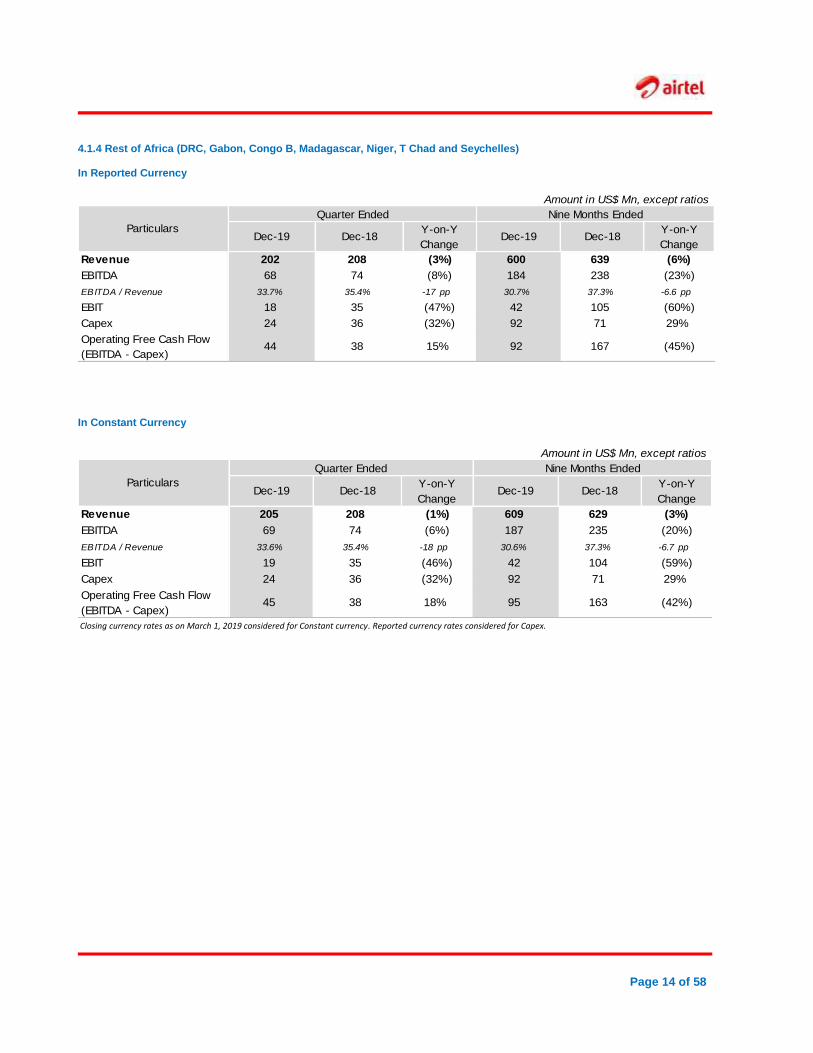
4.1.4 Rest of Africa (DRC, Gabon, Congo B, Madagascar, Niger, T Chad and Seychelles) In Reported Currency
Amount in US$ Mn, except ratios
Quarter Ended Nine Months Ended
Dec-19 Dec-18Y-on-Y
ChangeDec-19 Dec-18
Y-on-Y
Change
Revenue 202 208 (3%) 600 639 (6%)
EBITDA 68 74 (8%) 184 238 (23%)
EBITDA / Revenue 33.7% 35.4% -1.7 pp 30.7% 37.3% -6.6 pp
EBIT 18 35 (47%) 42 105 (60%)
Capex 24 36 (32%) 92 71 29%
Operating Free Cash Flow
(EBITDA - Capex)44 38 15% 92 167 (45%)
Particulars
In Constant Currency
Amount in US$ Mn, except ratios
Quarter Ended Nine Months Ended
Dec-19 Dec-18Y-on-Y
ChangeDec-19 Dec-18
Y-on-Y
Change
Revenue 205 208 (1%) 609 629 (3%)
EBITDA 69 74 (6%) 187 235 (20%)
EBITDA / Revenue 33.6% 35.4% -1.8 pp 30.6% 37.3% -6.7 pp
EBIT 19 35 (46%) 42 104 (59%)
Capex 24 36 (32%) 92 71 29%
Operating Free Cash Flow
(EBITDA - Capex)45 38 18% 95 163 (42%)
Particulars
Closing currency rates as on March 1, 2019 considered for Constant currency. Reported currency rates considered for Capex.
Page 15 of 58
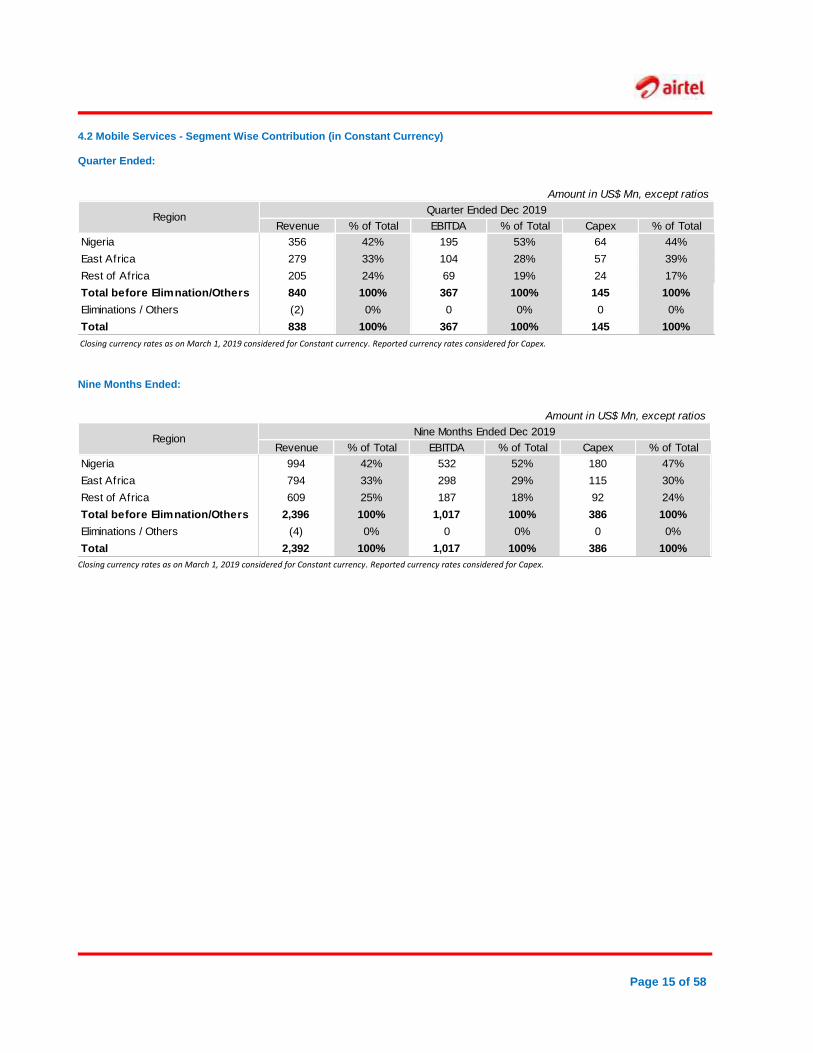
4.2 Mobile Services - Segment Wise Contribution (in Constant Currency) Quarter Ended:
Amount in US$ Mn, except ratios
Quarter Ended Dec 2019
Revenue % of Total EBITDA % of Total Capex % of Total
Nigeria 356 42% 195 53% 64 44%
East Africa 279 33% 104 28% 57 39%
Rest of Africa 205 24% 69 19% 24 17%
Total before Elimnation/Others 840 100% 367 100% 145 100%
Eliminations / Others (2) 0% 0 0% 0 0%
Total 838 100% 367 100% 145 100%
Region
Closing currency rates as on March 1, 2019 considered for Constant currency. Reported currency rates considered for Capex.
Nine Months Ended:
Amount in US$ Mn, except ratios
Nine Months Ended Dec 2019
Revenue % of Total EBITDA % of Total Capex % of Total
Nigeria 994 42% 532 52% 180 47%
East Africa 794 33% 298 29% 115 30%
Rest of Africa 609 25% 187 18% 92 24%
Total before Elimnation/Others 2,396 100% 1,017 100% 386 100%
Eliminations / Others (4) 0% 0 0% 0 0%
Total 2,392 100% 1,017 100% 386 100%
Region
Closing currency rates as on March 1, 2019 considered for Constant currency. Reported currency rates considered for Capex.
Page 16 of 58
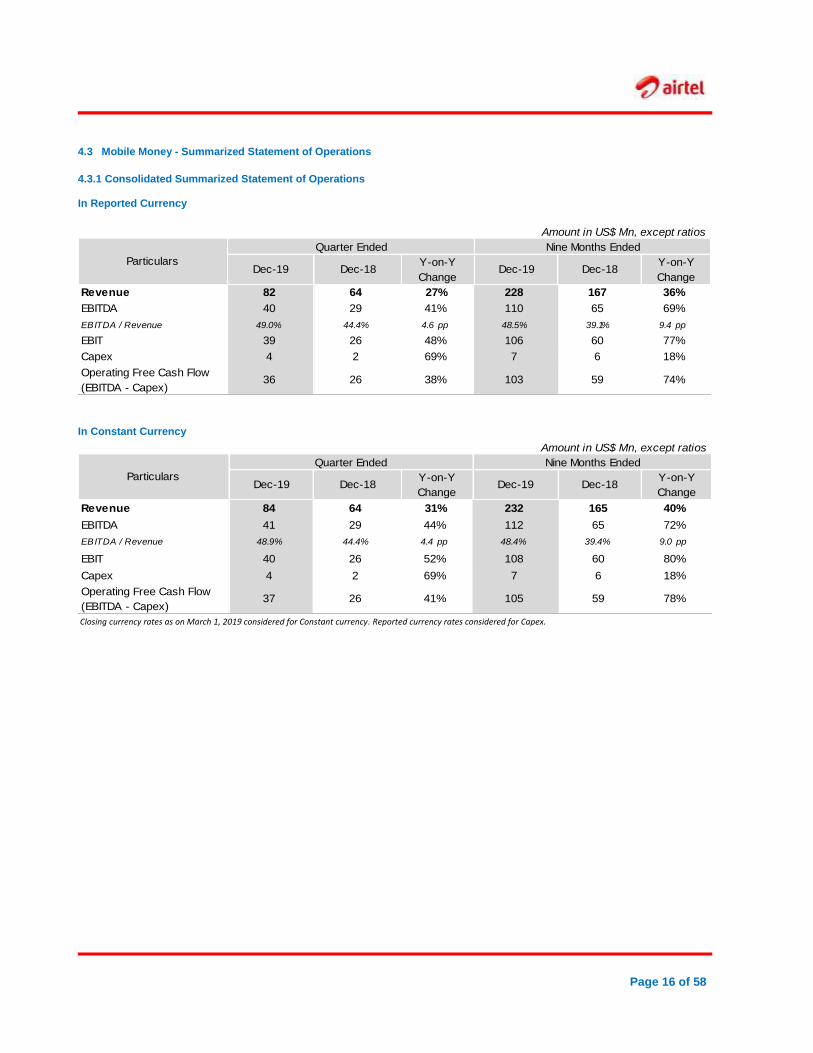
4.3 Mobile Money - Summarized Statement of Operations
4.3.1 Consolidated Summarized Statement of Operations In Reported Currency
Amount in US$ Mn, except ratios
Quarter Ended Nine Months Ended
Dec-19 Dec-18Y-on-Y
ChangeDec-19 Dec-18
Y-on-Y
Change
Revenue 82 64 27% 228 167 36%
EBITDA 40 29 41% 110 65 69%
EBITDA / Revenue 49.0% 44.4% 4.6 pp 48.5% 39.1% 9.4 pp
EBIT 39 26 48% 106 60 77%
Capex 4 2 69% 7 6 18%
Operating Free Cash Flow
(EBITDA - Capex)36 26 38% 103 59 74%
Particulars
In Constant Currency
Amount in US$ Mn, except ratios
Quarter Ended Nine Months Ended
Dec-19 Dec-18Y-on-Y
ChangeDec-19 Dec-18
Y-on-Y
Change
Revenue 84 64 31% 232 165 40%
EBITDA 41 29 44% 112 65 72%
EBITDA / Revenue 48.9% 44.4% 4.4 pp 48.4% 39.4% 9.0 pp
EBIT 40 26 52% 108 60 80%
Capex 4 2 69% 7 6 18%
Operating Free Cash Flow
(EBITDA - Capex)37 26 41% 105 59 78%
Particulars
Closing currency rates as on March 1, 2019 considered for Constant currency. Reported currency rates considered for Capex.
Page 17 of 58
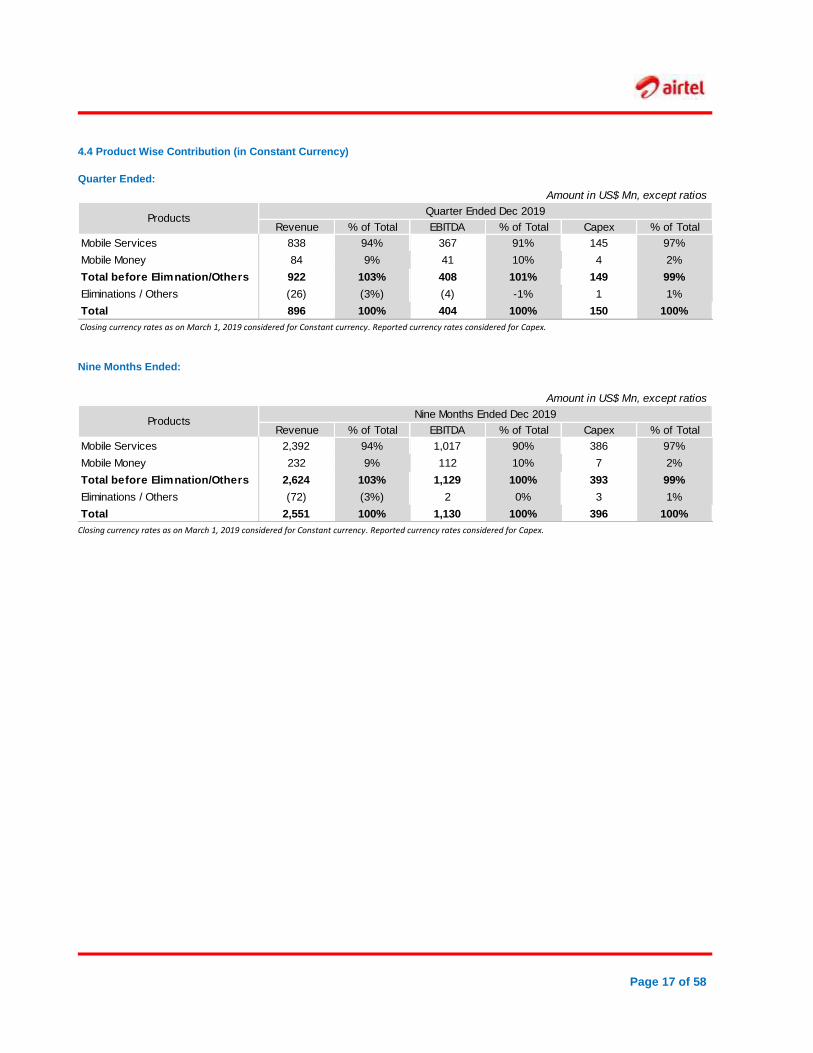
4.4 Product Wise Contribution (in Constant Currency)
Quarter Ended:
Amount in US$ Mn, except ratios
Quarter Ended Dec 2019
Revenue % of Total EBITDA % of Total Capex % of Total
Mobile Services 838 94% 367 91% 145 97%
Mobile Money 84 9% 41 10% 4 2%
Total before Elimnation/Others 922 103% 408 101% 149 99%
Eliminations / Others (26) (3%) (4) -1% 1 1%
Total 896 100% 404 100% 150 100%
Products
Closing currency rates as on March 1, 2019 considered for Constant currency. Reported currency rates considered for Capex.
Nine Months Ended:
Amount in US$ Mn, except ratios
Nine Months Ended Dec 2019
Revenue % of Total EBITDA % of Total Capex % of Total
Mobile Services 2,392 94% 1,017 90% 386 97%
Mobile Money 232 9% 112 10% 7 2%
Total before Elimnation/Others 2,624 103% 1,129 100% 393 99%
Eliminations / Others (72) (3%) 2 0% 3 1%
Total 2,551 100% 1,130 100% 396 100%
Products
Closing currency rates as on March 1, 2019 considered for Constant currency. Reported currency rates considered for Capex.
Page 18 of 58
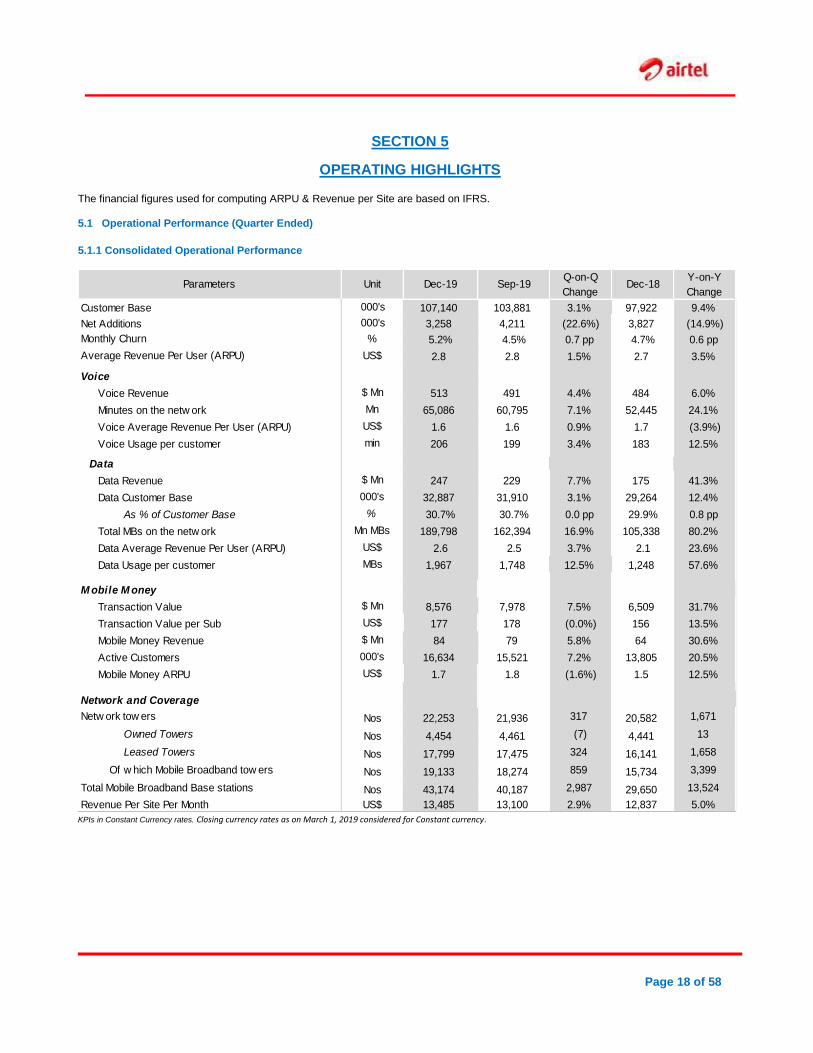
SECTION 5
OPERATING HIGHLIGHTS
The financial figures used for computing ARPU & Revenue per Site are based on IFRS. 5.1 Operational Performance (Quarter Ended)
5.1.1 Consolidated Operational Performance
Parameters Unit Dec-19 Sep-19Q-on-Q
ChangeDec-18
Y-on-Y
Change
Customer Base 000's 107,140 103,881 3.1% 97,922 9.4%
Net Additions 000's 3,258 4,211 (22.6%) 3,827 (14.9%)
Monthly Churn % 5.2% 4.5% 0.7 pp 4.7% 0.6 pp
Average Revenue Per User (ARPU) US$ 2.8 2.8 1.5% 2.7 3.5%
Voice
Voice Revenue $ Mn 513 491 4.4% 484 6.0%
Minutes on the netw ork Mn 65,086 60,795 7.1% 52,445 24.1%
Voice Average Revenue Per User (ARPU) US$ 1.6 1.6 0.9% 1.7 (3.9%)
Voice Usage per customer min 206 199 3.4% 183 12.5%
Data
Data Revenue $ Mn 247 229 7.7% 175 41.3%
Data Customer Base 000's 32,887 31,910 3.1% 29,264 12.4%
As % of Customer Base % 30.7% 30.7% 0.0 pp 29.9% 0.8 pp
Total MBs on the netw ork Mn MBs 189,798 162,394 16.9% 105,338 80.2%
Data Average Revenue Per User (ARPU) US$ 2.6 2.5 3.7% 2.1 23.6%
Data Usage per customer MBs 1,967 1,748 12.5% 1,248 57.6%
M obile M oney
Transaction Value $ Mn 8,576 7,978 7.5% 6,509 31.7%
Transaction Value per Sub US$ 177 178 (0.0%) 156 13.5%
Mobile Money Revenue $ Mn 84 79 5.8% 64 30.6%
Active Customers 000's 16,634 15,521 7.2% 13,805 20.5%
Mobile Money ARPU US$ 1.7 1.8 (1.6%) 1.5 12.5%
Network and Coverage
Netw ork tow ers Nos 22,253 21,936 317 20,582 1,671
Owned Towers Nos 4,454 4,461 (7) 4,441 13
Leased Towers Nos 17,799 17,475 324 16,141 1,658
Of w hich Mobile Broadband tow ers Nos 19,133 18,274 859 15,734 3,399
Total Mobile Broadband Base stations Nos 43,174 40,187 2,987 29,650 13,524
Revenue Per Site Per Month US$ 13,485 13,100 2.9% 12,837 5.0% KPIs in Constant Currency rates. Closing currency rates as on March 1, 2019 considered for Constant currency.
Page 19 of 58
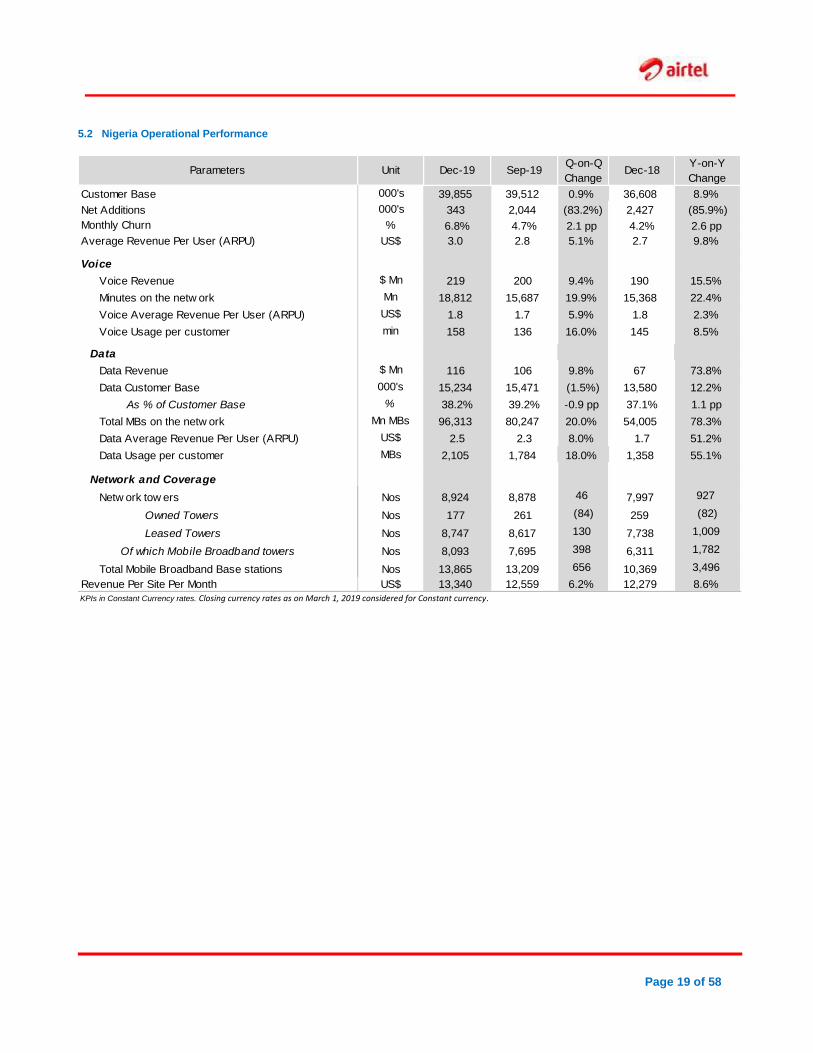
5.2 Nigeria Operational Performance
Parameters Unit Dec-19 Sep-19Q-on-Q
ChangeDec-18
Y-on-Y
Change
Customer Base 000's 39,855 39,512 0.9% 36,608 8.9%
Net Additions 000's 343 2,044 (83.2%) 2,427 (85.9%)
Monthly Churn % 6.8% 4.7% 2.1 pp 4.2% 2.6 pp
Average Revenue Per User (ARPU) US$ 3.0 2.8 5.1% 2.7 9.8%
Voice
Voice Revenue $ Mn 219 200 9.4% 190 15.5%
Minutes on the netw ork Mn 18,812 15,687 19.9% 15,368 22.4%
Voice Average Revenue Per User (ARPU) US$ 1.8 1.7 5.9% 1.8 2.3%
Voice Usage per customer min 158 136 16.0% 145 8.5%
Data
Data Revenue $ Mn 116 106 9.8% 67 73.8%
Data Customer Base 000's 15,234 15,471 (1.5%) 13,580 12.2%
As % of Customer Base % 38.2% 39.2% -0.9 pp 37.1% 1.1 pp
Total MBs on the netw ork Mn MBs 96,313 80,247 20.0% 54,005 78.3%
Data Average Revenue Per User (ARPU) US$ 2.5 2.3 8.0% 1.7 51.2%
Data Usage per customer MBs 2,105 1,784 18.0% 1,358 55.1%
Network and Coverage
Netw ork tow ers Nos 8,924 8,878 46 7,997 927
Owned Towers Nos 177 261 (84) 259 (82)
Leased Towers Nos 8,747 8,617 130 7,738 1,009
Of which Mobile Broadband towers Nos 8,093 7,695 398 6,311 1,782
Total Mobile Broadband Base stations Nos 13,865 13,209 656 10,369 3,496
Revenue Per Site Per Month US$ 13,340 12,559 6.2% 12,279 8.6%
KPIs in Constant Currency rates. Closing currency rates as on March 1, 2019 considered for Constant currency.
Page 20 of 58
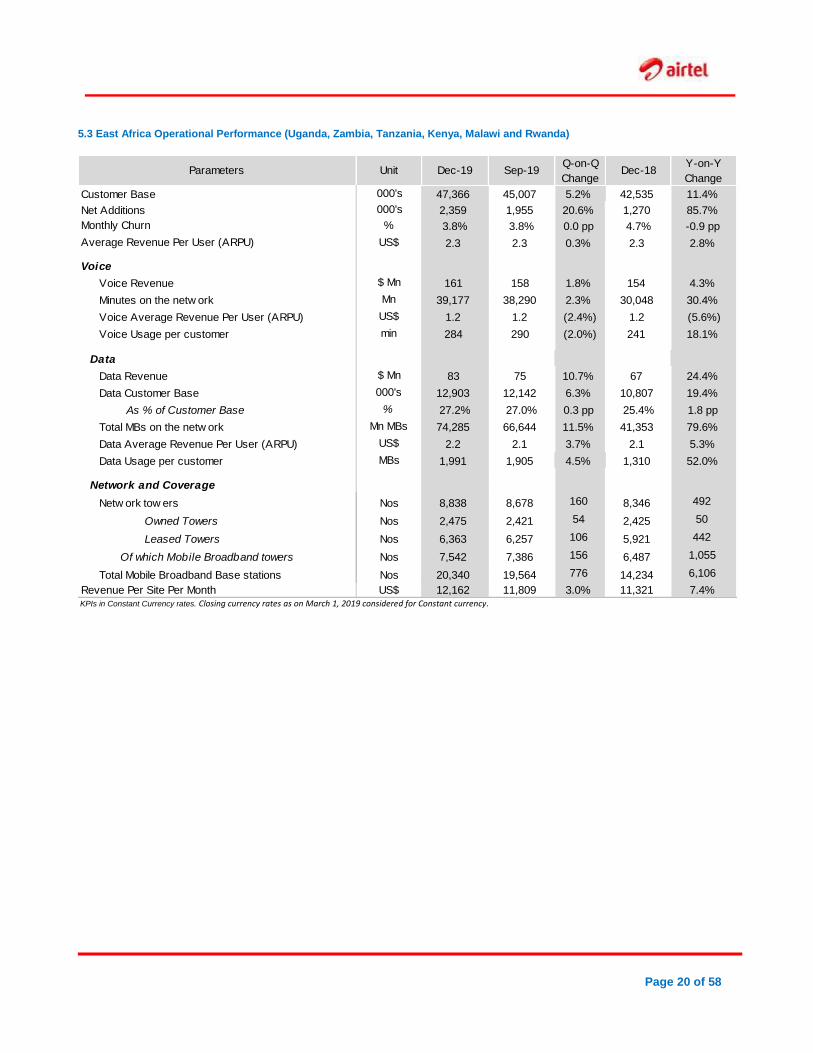
5.3 East Africa Operational Performance (Uganda, Zambia, Tanzania, Kenya, Malawi and Rwanda)
Parameters Unit Dec-19 Sep-19Q-on-Q
ChangeDec-18
Y-on-Y
Change
Customer Base 000's 47,366 45,007 5.2% 42,535 11.4%
Net Additions 000's 2,359 1,955 20.6% 1,270 85.7%
Monthly Churn % 3.8% 3.8% 0.0 pp 4.7% -0.9 pp
Average Revenue Per User (ARPU) US$ 2.3 2.3 0.3% 2.3 2.8%
Voice
Voice Revenue $ Mn 161 158 1.8% 154 4.3%
Minutes on the netw ork Mn 39,177 38,290 2.3% 30,048 30.4%
Voice Average Revenue Per User (ARPU) US$ 1.2 1.2 (2.4%) 1.2 (5.6%)
Voice Usage per customer min 284 290 (2.0%) 241 18.1%
Data
Data Revenue $ Mn 83 75 10.7% 67 24.4%
Data Customer Base 000's 12,903 12,142 6.3% 10,807 19.4%
As % of Customer Base % 27.2% 27.0% 0.3 pp 25.4% 1.8 pp
Total MBs on the netw ork Mn MBs 74,285 66,644 11.5% 41,353 79.6%
Data Average Revenue Per User (ARPU) US$ 2.2 2.1 3.7% 2.1 5.3%
Data Usage per customer MBs 1,991 1,905 4.5% 1,310 52.0%
Network and Coverage
Netw ork tow ers Nos 8,838 8,678 160 8,346 492
Owned Towers Nos 2,475 2,421 54 2,425 50
Leased Towers Nos 6,363 6,257 106 5,921 442
Of which Mobile Broadband towers Nos 7,542 7,386 156 6,487 1,055
Total Mobile Broadband Base stations Nos 20,340 19,564 776 14,234 6,106
Revenue Per Site Per Month US$ 12,162 11,809 3.0% 11,321 7.4%
KPIs in Constant Currency rates. Closing currency rates as on March 1, 2019 considered for Constant currency.
Page 21 of 58
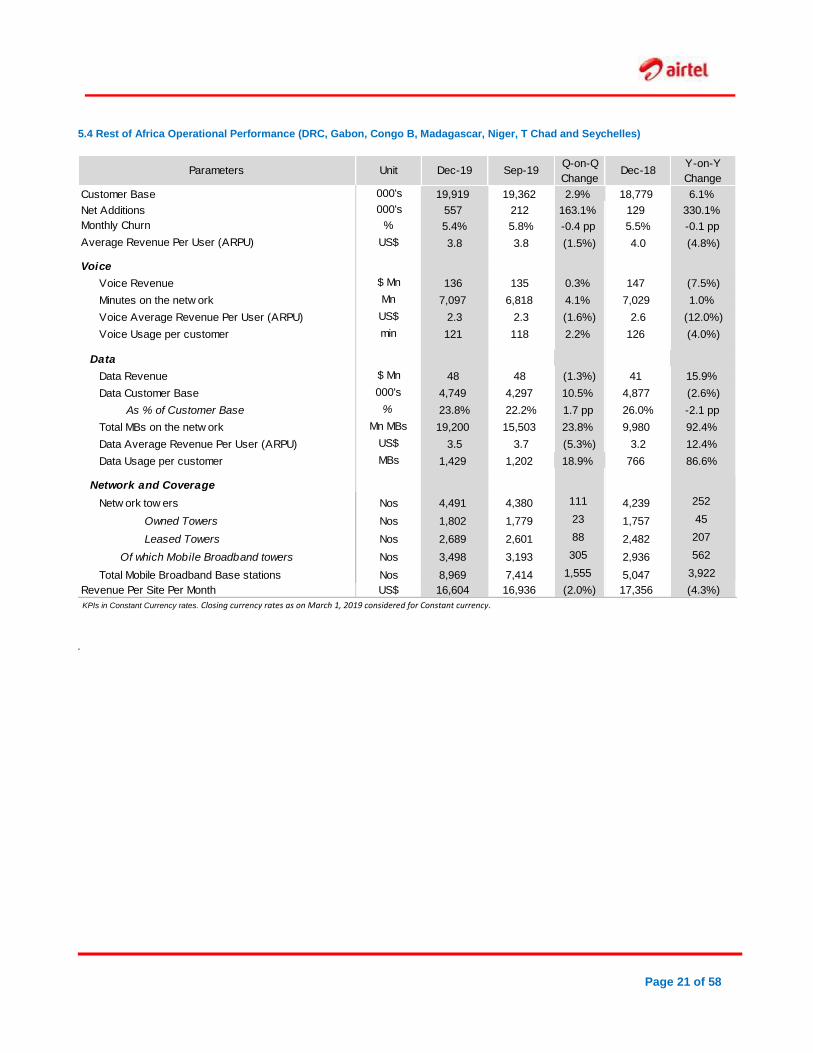
5.4 Rest of Africa Operational Performance (DRC, Gabon, Congo B, Madagascar, Niger, T Chad and Seychelles)
Parameters Unit Dec-19 Sep-19Q-on-Q
ChangeDec-18
Y-on-Y
Change
Customer Base 000's 19,919 19,362 2.9% 18,779 6.1%
Net Additions 000's 557 212 163.1% 129 330.1%
Monthly Churn % 5.4% 5.8% -0.4 pp 5.5% -0.1 pp
Average Revenue Per User (ARPU) US$ 3.8 3.8 (1.5%) 4.0 (4.8%)
Voice
Voice Revenue $ Mn 136 135 0.3% 147 (7.5%)
Minutes on the netw ork Mn 7,097 6,818 4.1% 7,029 1.0%
Voice Average Revenue Per User (ARPU) US$ 2.3 2.3 (1.6%) 2.6 (12.0%)
Voice Usage per customer min 121 118 2.2% 126 (4.0%)
Data
Data Revenue $ Mn 48 48 (1.3%) 41 15.9%
Data Customer Base 000's 4,749 4,297 10.5% 4,877 (2.6%)
As % of Customer Base % 23.8% 22.2% 1.7 pp 26.0% -2.1 pp
Total MBs on the netw ork Mn MBs 19,200 15,503 23.8% 9,980 92.4%
Data Average Revenue Per User (ARPU) US$ 3.5 3.7 (5.3%) 3.2 12.4%
Data Usage per customer MBs 1,429 1,202 18.9% 766 86.6%
Network and Coverage
Netw ork tow ers Nos 4,491 4,380 111 4,239 252
Owned Towers Nos 1,802 1,779 23 1,757 45
Leased Towers Nos 2,689 2,601 88 2,482 207
Of which Mobile Broadband towers Nos 3,498 3,193 305 2,936 562
Total Mobile Broadband Base stations Nos 8,969 7,414 1,555 5,047 3,922
Revenue Per Site Per Month US$ 16,604 16,936 (2.0%) 17,356 (4.3%)
KPIs in Constant Currency rates. Closing currency rates as on March 1, 2019 considered for Constant currency.
.
Page 22 of 58
SECTION 6
MANAGEMENT DISCUSSION AND ANALYSIS
6.1 Reporting Methodology
The information contained in this report is based on Airtel
Africa plc interim condensed consolidated financial
statements prepared under IAS 34 for the three and nine
months ended 31 December 2019.
The information, apart from the extract of the Financial
Statements in Section 7, is on underlying basis and
exceptional items are shown separately. This enables an
organic comparison of results with past periods.
6.2 Key company developments
MSCI inclusion
On 7 November 2019, Airtel Africa plc was added to the MSCI
Small Cap index.
Nigeria spectrum acquisition
In November 2019, Airtel Networks Limited (“Airtel Nigeria”)
signed an agreement with Intercellular Nigeria Limited, in order to
acquire an additional 10 MHz spectrum in the 900 MHz band in
Nigeria for a consideration of $70 million, excluding NCC Fees as
per the NCC Spectrum Trading Guidelines. The acquisition of this
additional spectrum will allow Airtel Nigeria to expand and
strengthen its LTE network across the country.
The Acquisition is subject to regulatory approval by the Nigerian
Communications Commission (NCC).
Airtel TV
In December 2019, we launched Airtel TV in Nigeria and Zambia
with more than 5000 hours of videos free of any subscription fees.
The Airtel TV app is available in Android as well as iOS and it is a
one stop platform for Live TV, Music videos, news, sports and
much more. In addition, Airtel TV also offers live TV on popular
channels such as Trace (Africa, Urban, Tropical, Mziki, Sport Stars
and Gospel), Bloomberg Television, Gametoon, Bollywood,
Fashion Box, God TV, Nautical, Al Jazeera English and Inspiration
TV, among others.
Western Union
In January 2020, Airtel Group has signed a strategic partnership
with Western Union. Through this partnership, Airtel Money
customers will be able to reliably send and receive international
money transfers directly from their phones, using the Airtel Africa
mobile money wallet. This paves the way for Airtel Africa to further
cater to the needs of local and global community members to
move money and enable international cross-border payments.
This partnership helps Airtel Africa to take an active part in the
international money transfer business that happens to and from its
operating countries.
Tanzania additional spectrum
Airtel Tanzania has been allocated an additional spectrum of 10
MHz in 1800 MHz band with an annual fee of $ 0.6 Mn. With this
allocation, Airtel Tanzania has 22.5 MHz spectrum in 1800 Band.
In addition, Airtel Tanzania has been authorized by the TCRA
(Tanzania Communications Regulatory Authority) to use 10 MHz
in the 700 MHz band for 8 months from 21st October. The license
of 700 MHz band will be issued post completion of a total of $ 12
Mn payment to the regulatory authorities in June 2020.
Announcement of Airtel Malawi listing on Malawi Stock
Exchange
On 24 December 2019, further to its announcement of 11
December 2019 of its intention to float its local business Airtel
Malawi plc (“Airtel Malawi” or the “Subsidiary”) on the Malawi Stock
Exchange, it was announced that the price for the initial public
offering had been set at MK 12.69 ($ 0.02) per ordinary share. The
offer is expected to comprise of 1.65 billion shares, representing
15% of the issued share capital. An additional 550 million shares,
representing 5% of the issued share capital will be made available
subject to the exercise of the over-allotment option. Airtel Malawi
expects to raise gross proceeds of up to MK 27.92 billion ($ 37.5
million) and the price implies a market capitalisation on admission
of MK 139.59 billion ($ 187.4 million).
Page 23 of 58
6.3 Results of Operations
The financial results presented in this section are compiled based on the consolidated financial statements prepared in accordance with International Financial
Reporting Standards (IFRS) and the underlying information.
Key Highlights – For Nine-month period ended on December 31, 2019
Customer base grew by 9.4% to 107.1 Mn
Revenue increased by 9.9% to $ 2,522 Mn for the nine-month period ended 31 December 2019, with Q3'20 revenue growth increasing to 12.8%
In constant currency terms, revenue grew by 12.4% during the nine-month period ended 31 December 2019 and 14.2% in Q3'20. This was the 8th consecutive quarter of double-digit constant currency growth.
Growth was recorded across all services, with revenue in Voice, Data and Mobile Money up by 3.9%, 39.0% and 40.4% respectively in constant currency
EBITDA was $1,118 Mn for the nine-month period, up 13.2%, while constant currency EBITDA growth was 15.5% over the same period
EBITDA margin in reported currency was 44.3%, an increase of 1.3 pp, while there was an increase of 1.2 pp in constant currency terms
Operating profit increased by 21.3% and was up 23.7% in constant currency
Free cash flow almost doubled to $ 391 Mn in the period
EPS before exceptional items was $ 5.8¢ and Basic EPS was $ 8.6¢
Net debt to EBITDA was 2.2x, compared to 3.2x as of December 2018
Key Highlights – For the Quarter ended December 31, 2019
Reported revenues increased to $ 883 Mn, up 12.8%, with constant currency growth of 14.2%. This was the 8th consecutive quarter of double-digit constant currency growth.
Revenue growth of 14.2% in constant currency as a result of continued strong performance in Nigeria and East Africa and an improvement in the performance of the Rest of Africa
Growth was broad based across all services with revenue in Voice, Data and Mobile Money up by 5.3%, 41.3% and 30.6% respectively
Reported EBITDA was $ 399 Mn, up 17.5%, while constant currency EBITDA growth was 18.9%
EBITDA margin in reported currency was 45.2%, an increase of 1.8 pp and the same is in constant currency. Results for the Nine-month period ended on December 31, 2019
6.4.1 Airtel Africa Consolidated
Revenue increased by 9.9%, with constant currency growth of
12.4% being partially offset by currency devaluation. Growth in the
third quarter accelerated to 14.2% in constant currency as a result
of continued strong performance in Nigeria and East Africa and an
improvement in the performance of the Rest of Africa. Revenue
growth of 12.4%, was largely driven by the robust growth of our
customer base, up by 9.4%, to 107.1 Mn and ARPU growth of
2.2%. Revenue growth was broad-based across all services; voice
revenue up 3.9%, data revenue up 39.0% and mobile money up
40.4% during the period in constant currency.
Operating profit amounted to $ 657 Mn, up 21.3% in reported
currency and 23.7% in constant currency, as a result of strong
revenue growth, while operating expenditures as a percentage of
revenue remained broadly stable.
Finance costs reduced by $ 57 Mn driven by a 17% decrease in
interest costs, which more than offset an increase in other finance
charges as a result of one off gains incurred in the prior year,
higher costs related to the initial public offering and higher impact
of foreign exchange on debt.
The total tax charge for the period was $ 170 Mn, as compared to
a tax credit of $ 111 Mn in the same period last year, as a result of
higher operating profit and withholding tax on dividends, as Airtel
Nigeria, our largest and most profitable market, declared a first
dividend. In addition, the prior year period benefitted from one-off
items which included deferred tax recognition in Nigeria of $ 170
Mn and a reversal of tax provision of $ 55 Mn.
Profit after tax was $ 331 Mn, down by 2.2% due to one-off
deferred tax recognition in Nigeria in the nine-month period ending
31 December 2018.
Basic EPS was $ 8.6¢, down 53.6%, due to the increase in the
number of shares issued. If all the shares as at 31 December 2019
had been issued on 1 April 2018, the restated Basic EPS for nine
months ended 31 December 2019 would have been $ 8.1¢ and
nine months ended 31 December 2018 would have been $ 8.1¢.
EBITDA was $ 1,118 Mn, up 13.2% largely driven by 15.5%
constant currency growth, partially offset by currency devaluation.
EBITDA margin was at 44.3%, an improvement of 1.3 pp
compared to the previous year largely driven by revenue growth
Page 24 of 58
and operating efficiencies. EBITDA margin in Q3’20 expanded by
1.8 pp in constant currency.
Foreign exchange had an adverse impact of $ 54.2 Mn on revenue
and $ 21.8 Mn on EBITDA, largely driven by the devaluation of the
Zambian Kwacha and Central African Franc. The currency
exchange rates in other markets remained broadly stable
compared to the same period last year.
The adjusted effective tax rate for the current period was 37.4%
as compared to 40.3% in the same period of last year. The
adjusted effective tax rate is lower compared to the previous
financial year primarily on account of deferred tax asset
recognition in Rest of Africa.
The adjusted effective tax rate is higher than the weighted average
statutory tax rate of ~ 33% largely due to the profit mix between
various countries.
Exceptional items of $ 104 Mn for the nine-months ended 31
December 2019, mainly consisted of a $ 72 Mn gain related to the
expired indemnity to certain pre-IPO investors and Q3’20
benefitted from $ 27 Mn one-off gain largely as a result of the
reassessment of the life of customers leading to a deferment of
customer acquisition costs.
Free cash flow was $ 391 Mn, up by 90.4%. The EBITDA increase
and lower interest payments due to lower debt were only partially
offset by capex increase, due to network modernization as well as
roll-out of additional sites.
Earnings Per Share before exceptional items was $ 5.8¢, down
50.1%, as a result of an increase in the number of shares issued.
However, if these shares had been issued on 1st April 2018, the
restated EPS before exceptional items for nine-month ended 31
December 2019 would have been $ 5.4¢ and $ 5.0¢ cents for the
nine-month ended 31 December 2018.
6.4.2 Net Debt
In December 2019, net debt was $ 3,233 Mn compared to $ 4,189
Mn in December 2018. The reduction in net debt of $ 956 Mn is a
result of an increase in cash from the net IPO proceeds of $ 670
Mn and a reduction in debt by $ 143 Mn. As a result, leverage
reduced to 2.2x as of December 2019.
6.4.3 Going Concern
As part of their assessment of going concern the Directors have
taken into account all factors likely to affect its future performance
and financial position, including the Group’s cash flow under both
base and a number of reasonable worst case scenarios.
Additionally, the Directors have considered the potential financial
impact on the Group of the adverse judgement of the Honourable
Supreme Court of India on 24 October 2019 on its intermediate
parent company.
Since that time, the Group’s intermediate parent company has
successfully raised approximately $3 billion of additional capital
through a combination of qualified institutional equity placement
and convertible bond offerings.
In the Director’s opinion the execution of these activities has
reduced the level of uncertainty about the ability of the Group’s
intermediate parent company to comply with the judgement.
As a result, the Directors have concluded that the previously
highlighted material uncertainty around the Group’s ability to
continue as a going concern no longer exists and that the Group
has adequate committed and non-committed facilities to operate
as a going concern.
6.4.3 Segment Wise – Africa
6.4.3.1 Nigeria
Reported revenue was up 23.6% for the nine-month period ended
31 December 2019, with Q3’20 growth of 24.4%. Growth in
constant currency was 23.4% for the nine-month period and Q3’20
of 23.9% which is largely in line with the reported growth as a result
of a stable foreign exchange rate.
Constant currency revenue growth of 23.4%, was driven largely by
the voice revenue growth of 13.9% and data growth of 75%. Data
revenue growth in Q3’20 was 73.8% in constant currency.
The voice revenue increase of 13.9% was driven by customer
base growth of 8.9%. The customer base expansion was driven
by the efficient sales and distribution network supported by the
accelerated rollout of our network infrastructure.
Data revenue increased by 75% and contributed 71% to overall
revenue growth for the nine-month period. Data revenue growth
was driven by the increase in the data customer base, as a result
of the growth in the 4G network rollout and data ARPU growth.
The data customer base grew by 12.2% driven by the accelerated
rollout of our 4G network, (as of 31 December 2019, 63.7% of the
total sites are 4G). Data ARPU grew by 45.8% in the nine-month
period with Q3’20 growth of 51.2%. Data usage increased by
86.2% and now 49.3% (as of Q3’20) of the total usage is on the
4G network. In the nine-month period, data revenue accounted for
31.6% of Nigeria revenue compared to a 22.3% in the prior period
and 32.5% in Q3’20.
EBITDA margin in constant currency increased by 5.4 pp as a
result of revenue growth and operating efficiencies.
Exceptional item in nine-month period December 2019 benefitted
from $ 9.3 Mn one-off gain largely as a result of reassessment of
life of customers leading to a deferment of customer acquisition
costs.
Capital expenditure amounted to $ 180 Mn, an increase from $
112 Mn in the prior period as the business continued to expand
and invest in the network infrastructure, as the number of 4G sites
increased 1.4x.
Operating Free Cash Flow was $ 355 Mn, up 28.2%, largely as a
result of double-digit EBITDA growth partially offset by an increase
in capital expenditures.
6.4.3.2 East Africa
Revenue in East Africa grew by 7.5% in the nine-month period
ended 31 December 2019. Constant currency growth of 12.0%
was partially offset by currency devaluation in Zambia and Malawi.
Page 25 of 58
Revenue growth of 12.0% in constant currency was driven by
growth across all services. All countries delivered a solid
performance and contributed to revenue growth, with the
exception of Rwanda.
Voice revenue was up 4.5%, largely driven by customer growth of
11.4% and an increased usage per customer of 14.1%.
Data revenue increased by 17.4%, and by 24.4% in Q3’20. Data
revenue growth of 17.4% was driven by the increase in the data
customer base, up 19.4% and an increase in data usage per
customer, up 55.1%. The growth was supported by the rollout of
the 4G network. Smartphone penetration was up 2.6%. We
continued to offer popular “more for more” data bundles which
supported the overall growth of data usage. In the nine-month
period data revenue accounted for 25.2% of total revenue in East
Africa. The improvement in Q3’20 data revenue growth was mainly
driven by Kenya, Malawi and Zambia as a result of increased 4G
data usage, up by almost 4x, and data ARPU increase.
Mobile money revenue increased by 44.1% in reported currency
and by 48.6% in constant currency. The increase was driven by
customer base growth of 19.9% and transaction value per
customer growth of 23.1%. We continued to expand the mobile
money distribution network (increasing the number of agents,
kiosks and Airtel Money Branches). In Q3’20, the YoY expansion
slowed compared to the same period in the prior year which
benefitted from extensive distribution roll out in Zamiba and
Tanzania.
EBITDA margin in constant currency increased by 0.9 pp as a
result of revenue growth and operating leverage. EBITDA margin
slightly reduced in Q3’20 due to an increase in operating expenses
as a result of investment in network expansion and higher
marketing spend.
Exceptional item in nine-month period December 2019 benefitted
from $ 14 Mn one-off gain largely as a result of reassessment of
life of customers leading to a deferment of customer acquisition
costs.
Capital expenditure amounted to $ 121 Mn, slightly lower than the
prior period as a large part of the network modernization in East
Africa was completed in the previous year. As a result of lower
capex and higher EBITDA, operating free cash flow amounted to
$ 239 Mn, up 26.2%.
6.4.3.3 Rest of Africa
Performance in Rest of Africa continued to improve and in the third
quarter the business was broadly stable as a result of improved
performance in voice and continued good performance in data and
mobile money. Nevertheless, Rest of Africa continued to be
impacted by macroeconomic weakness in some of the countries
in the region.
Revenue decreased by 4.9% in reported currency and 1.9% in
constant currency, as growth in data, mobile money and other
revenue did not fully offset a decline in voice revenue.
Performance improved in Q3 with revenue broadly stable as
growth in Democratic Republic of Congo, Chad and Seychelles
was offset by decline in the rest of the region.
Voice revenue decreased by 9.7%, largely due to the reduction in
interconnect usage charges in Niger, Madagascar and Chad and
overall market weakness in some of the countries in the segment.
Data revenue was up 19.8% largely driven by the increase in data
usage per sub by 61.2% resulting from the accelerated rollout of
4G services and network upgrade. During the period, more than
1,500 additional sites were rolled out on the 4G network, which
accounted for more than 55% of the total sites. More than 3,900
broadband base stations were rolled out during the nine-month
period.
Mobile money revenue was up 27.3% with all key markets
delivering double-digit growth, supported by the growth of mobile
money customer base (+25.5%) and further expansion of the
distribution network.
EBITDA margin in constant currency decreased by 4.2 pp as a
result of lower revenue and one-off quality of services charge in
Gabon in the first quarter.
Exceptional item in nine-month period December 2019 benefitted
from $ 3.5 Mn one-off gain largely as a result of reassessment of
life of customers leading to a deferment of customer acquisition
costs.
Capital expenditure amounted to $ 93 Mn compared with $ 72 Mn
in the previous period, as we continued to invest in network
modernization, the rollout of the 4G network, more than doubling
the number of 4G sites.
6.4.4 Product wise Africa
6.4.4.1 Mobile services:
Voice revenue increased by 1.6% in reported currency and by
3.9% in constant currency, largely driven by customer growth of
9.4%, as a result of a stable churn at 4.9% and the expansion of
distribution network and expansion of infrastructure network. In
Q3’20 revenue growth improved as a result of improved
performance in Nigeria and Rest of Africa.
Voice ARPU decreased 5.5% in constant currency terms, largely
driven by weakness in Rest of Africa and a decrease in
interconnect usage charges across key markets in East Africa and
Rest of Africa.
Data Revenue was up 39% in constant currency in the nine-month
period, largely driven by an increase in data customer base, 4G
network rollout and data usage growth. Data customer growth of
12.4% was driven by a rollout of our 4G network, which
represented 62.3% of the sites on 4G network, increase in
smartphone penetration by 2.3%, accelerated rollout of the 4G
network and the addition of more than 13,500 broadband base
stations. 30.7% of the total customer base is data users, increased
from 29.9% in the previous period.
Overall data usage increased 80.7% and data usage per customer
was up 56.3% to 1,760MB/subs/month, supported by an
expansion of our 4G network and continuation of popular “more for
more” data bundles, contributing data ARPU growth of 20.3%.
Page 26 of 58
Data revenue accounted for 26.8% of total revenue, up from
21.7% in the prior period in constant currency.
6.4.4.2 Mobile Money
In the nine-month period, mobile money revenue amounted to $
228 Mn, up 36.3% in reported currency and by 40.4% in constant
currency, driven by the growth of the customer base which was up
20.5%, and transaction value growth of 30.2%. Growth in the
customer base was largely driven by the expansion of the
distribution network, as we continued to invest in exclusive kiosks
and mobile money branches, up 30.6% and 157% respectively
compared to last year. The expansion of the merchant ecosystem
and the provision of more affordable tariffs further contributed to
transaction value growth.
Revenue growth slowed to 30.6% in constant currency largely as a result of the benefit from extensive distribution roll out in Zambia and Gabon incurred in the same period last year.
EBITDA in mobile money increased by 69.1%, amounting to $ 110
Mn, driven by the revenue growth and lean cost structure, resulting
in a better flow through in EBITDA. As a result, underlying the
EBITDA margin improved to 48.5%, up from 39.1%.
Total transaction value was up 30.2% in constant currency, with
an annualized value of more than $ 34.3 billion (Q3’20 annualized)
driven by the expansion of our distribution network.
Mobile money active customer base amounted to 16.6 Mn, up
20.5% versus the previous year with the mobile money customer
base currently representing 15.5% of the total base.
Mobile money ARPU was up 18.5% driven by a growth of
transaction value per sub and higher contribution from P2P and
merchant payment
Results for the Quarter ended December 31, 2019
6.5.1 Airtel Africa Consolidated
As on 31 Dec 2019, the group had a customer base of 107 Mn as
compared to 98 Mn in the corresponding quarter last year, an
increase of 9.4%. Total minutes on network during the quarter
registered a growth of 24.1% to 65.1 Bn as compared to 52.4 Bn
in the corresponding quarter last year.
Data customers increased by 3.6 Mn to 32.9 Mn as compared to
29.2 Mn in the corresponding quarter last year. Increase in data
subscribers is mainly led by increased smartphone penetration, up
2.5 % to 31.5%, and the expansion of 3G and 4G network (13,500
broadband base stations added and 4G sites now contributing for
62% total sites). The total MBs on the network grew at 80.2% to
189.8 Bn MBs compared to 105.3 Bn MBs in the corresponding
quarter last year. Data usage per customer during the quarter was
at 1,967 MBs as compared to 1,248 MBs in the corresponding
quarter last year, an increase of 57.6%.
Mobile Money revenue in constant currency grew by 30.6% driven
by customer growth of 20.5% and transaction value growth of
31.7%. Growth was largely driven by the expansion of the
distribution infrastructure, as the business invested in exclusive
kiosks and mobile money branches, up 59% and 157%
respectively compared to last year. In addition, expansion of the
merchant ecosystem and affordable tariffs has contributed to
transaction value growth.
Reported Gross revenue increased by 12.8% and constant
currency growth of 14.2% was partially offset by currency
devaluation. Constant currency revenue growth was largely driven
by 9.4% increase in the customer base, to 107 Mn, and ARPU
growth of 3.5% at $ 2.8. The growth was contributed by double
digit revenue growth in Nigeria and East Africa and an
improvement in the performance in Rest of Africa segment. Across
products, revenue growth in constant currency was widespread
with mobile Voice up 5.3%, Data up 41.3%, and Mobile Money up
30.6%.
For the quarter, EBITDA in reported currency was $ 399 Mn, up
17.5%, constant currency growth was 18.9%, partially offset by
currency devaluation. EBITDA margin was at 45.2%, an
improvement of 1.8 pp.
In constant currency, EBITDA for quarter was at $ 404.4 Mn as
compared to $ 340.3 Mn in the corresponding quarter last year.
EBITDA margin improved by 1.8 pp and was at 45.1% for the
quarter as compared to 43.4% in the corresponding quarter last
year.
On reported basis, net Finance costs increased by $ 12 Mn due to
forex loss of $ 5 Mn in current quarter as compared to forex gain
of $ 23 Mn in corresponding quarter last year. This led to increase
in Net finance cost by $ 28 Mn partially offset by lower interest cost
by $ 16 Mn as a result of lower debt.
The total tax charge for the period was $ 83 Mn, as compared to a
tax credit of $ 28 Mn in the same period last year as a result of
higher operating profit and withholding tax on dividends, as Airtel
Nigeria, our largest and most profitable market, declared a first
dividend. In addition, prior year period benefitted from one-off
items which included deferred tax recognition in Nigeria of $ 47 Mn
and a reversal of tax provision of $ 27 Mn.
On reported basis, Profit after Tax was $ 90.2 Mn, a decrease of
$ 33 Mn compared to the prior year, which is largely contributed
by higher tax expense as explained above.
Capital expenditure during the quarter was $ 150 Mn, largely on
account of investment in data capacities and network
modernization.
Operating free cash flow in Constant Currency during the quarter
is at $ 254 Mn, as compared to $ 170 Mn in the corresponding
quarter last year.
Page 27 of 58
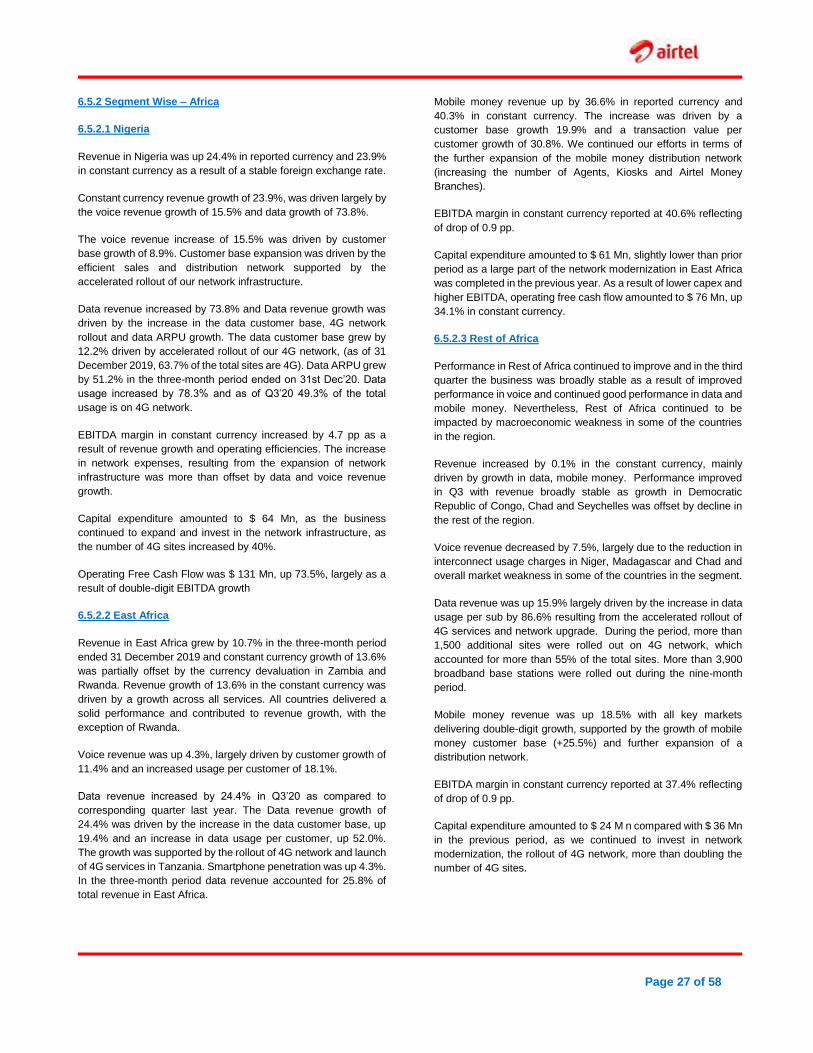
6.5.2 Segment Wise – Africa
6.5.2.1 Nigeria
Revenue in Nigeria was up 24.4% in reported currency and 23.9%
in constant currency as a result of a stable foreign exchange rate.
Constant currency revenue growth of 23.9%, was driven largely by
the voice revenue growth of 15.5% and data growth of 73.8%.
The voice revenue increase of 15.5% was driven by customer
base growth of 8.9%. Customer base expansion was driven by the
efficient sales and distribution network supported by the
accelerated rollout of our network infrastructure.
Data revenue increased by 73.8% and Data revenue growth was
driven by the increase in the data customer base, 4G network
rollout and data ARPU growth. The data customer base grew by
12.2% driven by accelerated rollout of our 4G network, (as of 31
December 2019, 63.7% of the total sites are 4G). Data ARPU grew
by 51.2% in the three-month period ended on 31st Dec’20. Data
usage increased by 78.3% and as of Q3’20 49.3% of the total
usage is on 4G network.
EBITDA margin in constant currency increased by 4.7 pp as a
result of revenue growth and operating efficiencies. The increase
in network expenses, resulting from the expansion of network
infrastructure was more than offset by data and voice revenue
growth.
Capital expenditure amounted to $ 64 Mn, as the business
continued to expand and invest in the network infrastructure, as
the number of 4G sites increased by 40%.
Operating Free Cash Flow was $ 131 Mn, up 73.5%, largely as a
result of double-digit EBITDA growth
6.5.2.2 East Africa
Revenue in East Africa grew by 10.7% in the three-month period
ended 31 December 2019 and constant currency growth of 13.6%
was partially offset by the currency devaluation in Zambia and
Rwanda. Revenue growth of 13.6% in the constant currency was
driven by a growth across all services. All countries delivered a
solid performance and contributed to revenue growth, with the
exception of Rwanda.
Voice revenue was up 4.3%, largely driven by customer growth of
11.4% and an increased usage per customer of 18.1%.
Data revenue increased by 24.4% in Q3’20 as compared to
corresponding quarter last year. The Data revenue growth of
24.4% was driven by the increase in the data customer base, up
19.4% and an increase in data usage per customer, up 52.0%.
The growth was supported by the rollout of 4G network and launch
of 4G services in Tanzania. Smartphone penetration was up 4.3%.
In the three-month period data revenue accounted for 25.8% of
total revenue in East Africa.
Mobile money revenue up by 36.6% in reported currency and
40.3% in constant currency. The increase was driven by a
customer base growth 19.9% and a transaction value per
customer growth of 30.8%. We continued our efforts in terms of
the further expansion of the mobile money distribution network
(increasing the number of Agents, Kiosks and Airtel Money
Branches).
EBITDA margin in constant currency reported at 40.6% reflecting
of drop of 0.9 pp.
Capital expenditure amounted to $ 61 Mn, slightly lower than prior
period as a large part of the network modernization in East Africa
was completed in the previous year. As a result of lower capex and
higher EBITDA, operating free cash flow amounted to $ 76 Mn, up
34.1% in constant currency.
6.5.2.3 Rest of Africa
Performance in Rest of Africa continued to improve and in the third
quarter the business was broadly stable as a result of improved
performance in voice and continued good performance in data and
mobile money. Nevertheless, Rest of Africa continued to be
impacted by macroeconomic weakness in some of the countries
in the region.
Revenue increased by 0.1% in the constant currency, mainly
driven by growth in data, mobile money. Performance improved
in Q3 with revenue broadly stable as growth in Democratic
Republic of Congo, Chad and Seychelles was offset by decline in
the rest of the region.
Voice revenue decreased by 7.5%, largely due to the reduction in
interconnect usage charges in Niger, Madagascar and Chad and
overall market weakness in some of the countries in the segment.
Data revenue was up 15.9% largely driven by the increase in data
usage per sub by 86.6% resulting from the accelerated rollout of
4G services and network upgrade. During the period, more than
1,500 additional sites were rolled out on 4G network, which
accounted for more than 55% of the total sites. More than 3,900
broadband base stations were rolled out during the nine-month
period.
Mobile money revenue was up 18.5% with all key markets
delivering double-digit growth, supported by the growth of mobile
money customer base (+25.5%) and further expansion of a
distribution network.
EBITDA margin in constant currency reported at 37.4% reflecting
of drop of 0.9 pp.
Capital expenditure amounted to $ 24 M n compared with $ 36 Mn
in the previous period, as we continued to invest in network
modernization, the rollout of 4G network, more than doubling the
number of 4G sites.
Page 28 of 58
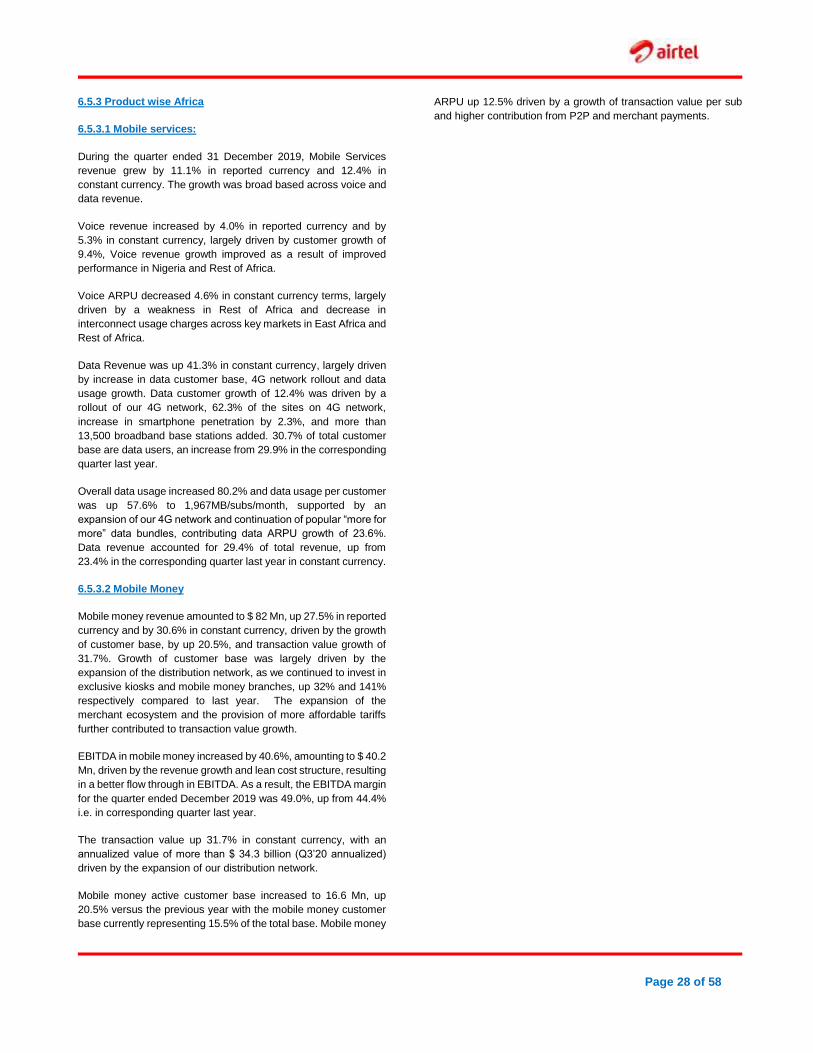
6.5.3 Product wise Africa
6.5.3.1 Mobile services:
During the quarter ended 31 December 2019, Mobile Services
revenue grew by 11.1% in reported currency and 12.4% in
constant currency. The growth was broad based across voice and
data revenue.
Voice revenue increased by 4.0% in reported currency and by
5.3% in constant currency, largely driven by customer growth of
9.4%, Voice revenue growth improved as a result of improved
performance in Nigeria and Rest of Africa.
Voice ARPU decreased 4.6% in constant currency terms, largely
driven by a weakness in Rest of Africa and decrease in
interconnect usage charges across key markets in East Africa and
Rest of Africa.
Data Revenue was up 41.3% in constant currency, largely driven
by increase in data customer base, 4G network rollout and data
usage growth. Data customer growth of 12.4% was driven by a
rollout of our 4G network, 62.3% of the sites on 4G network,
increase in smartphone penetration by 2.3%, and more than
13,500 broadband base stations added. 30.7% of total customer
base are data users, an increase from 29.9% in the corresponding
quarter last year.
Overall data usage increased 80.2% and data usage per customer
was up 57.6% to 1,967MB/subs/month, supported by an
expansion of our 4G network and continuation of popular “more for
more” data bundles, contributing data ARPU growth of 23.6%.
Data revenue accounted for 29.4% of total revenue, up from
23.4% in the corresponding quarter last year in constant currency.
6.5.3.2 Mobile Money
Mobile money revenue amounted to $ 82 Mn, up 27.5% in reported
currency and by 30.6% in constant currency, driven by the growth
of customer base, by up 20.5%, and transaction value growth of
31.7%. Growth of customer base was largely driven by the
expansion of the distribution network, as we continued to invest in
exclusive kiosks and mobile money branches, up 32% and 141%
respectively compared to last year. The expansion of the
merchant ecosystem and the provision of more affordable tariffs
further contributed to transaction value growth.
EBITDA in mobile money increased by 40.6%, amounting to $ 40.2
Mn, driven by the revenue growth and lean cost structure, resulting
in a better flow through in EBITDA. As a result, the EBITDA margin
for the quarter ended December 2019 was 49.0%, up from 44.4%
i.e. in corresponding quarter last year.
The transaction value up 31.7% in constant currency, with an
annualized value of more than $ 34.3 billion (Q3’20 annualized)
driven by the expansion of our distribution network.
Mobile money active customer base increased to 16.6 Mn, up
20.5% versus the previous year with the mobile money customer
base currently representing 15.5% of the total base. Mobile money
ARPU up 12.5% driven by a growth of transaction value per sub
and higher contribution from P2P and merchant payments.
Page 29 of 58
SECTION 7
DETAILED FINANCIAL AND RELATED INFORMATION
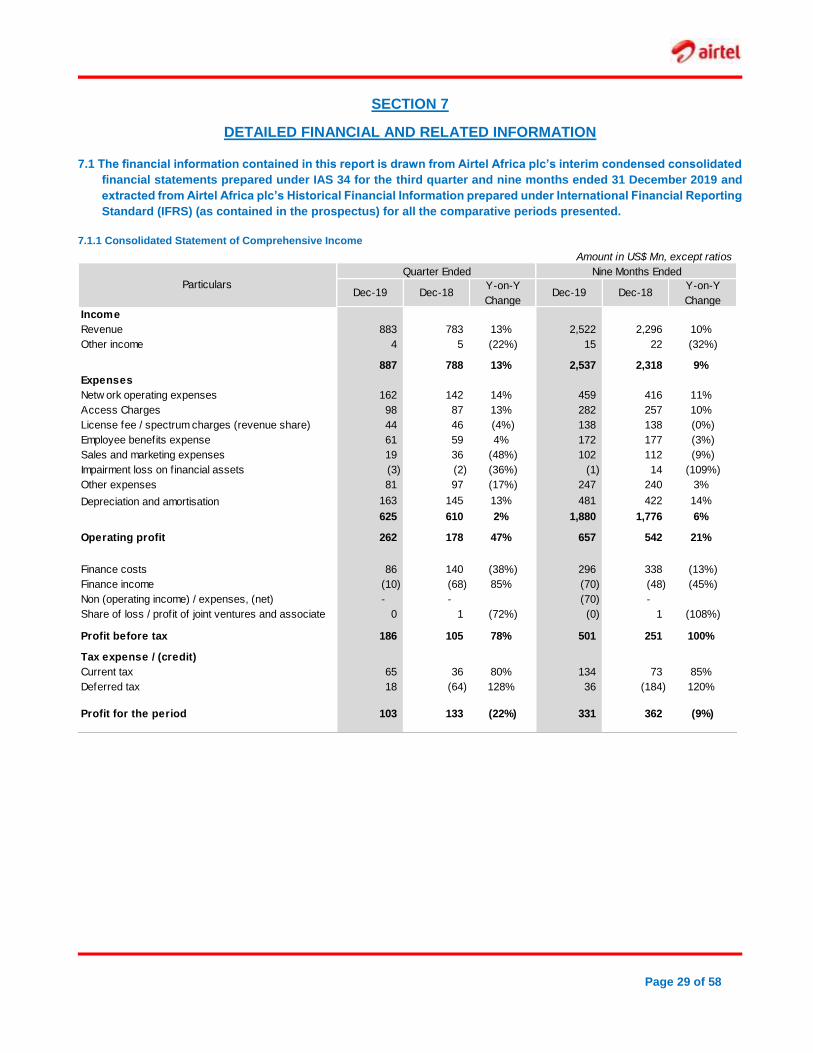
7.1 The financial information contained in this report is drawn from Airtel Africa plc’s interim condensed consolidated
financial statements prepared under IAS 34 for the third quarter and nine months ended 31 December 2019 and
extracted from Airtel Africa plc’s Historical Financial Information prepared under International Financial Reporting
Standard (IFRS) (as contained in the prospectus) for all the comparative periods presented.
7.1.1 Consolidated Statement of Comprehensive Income
Amount in US$ Mn, except ratios
Quarter Ended Nine Months Ended
Dec-19 Dec-18Y-on-Y
ChangeDec-19 Dec-18
Y-on-Y
Change
Income
Revenue 883 783 13% 2,522 2,296 10%
Other income 4 5 (22%) 15 22 (32%)
887 788 13% 2,537 2,318 9%
Expenses
Netw ork operating expenses 162 142 14% 459 416 11%
Access Charges 98 87 13% 282 257 10%
License fee / spectrum charges (revenue share) 44 46 (4%) 138 138 (0%)
Employee benefits expense 61 59 4% 172 177 (3%)
Sales and marketing expenses 19 36 (48%) 102 112 (9%)
Impairment loss on f inancial assets (3) (2) (36%) (1) 14 (109%)
Other expenses 81 97 (17%) 247 240 3%
Depreciation and amortisation 163 145 13% 481 422 14%
625 610 2% 1,880 1,776 6%
Operating profit 262 178 47% 657 542 21%
Finance costs 86 140 (38%) 296 338 (13%)
Finance income (10) (68) 85% (70) (48) (45%)
Non (operating income) / expenses, (net) - - (70) -
Share of loss / profit of joint ventures and associate 0 1 (72%) (0) 1 (108%)
Profit before tax 186 105 78% 501 251 100%
Tax expense / (credit)
Current tax 65 36 80% 134 73 85%
Deferred tax 18 (64) 128% 36 (184) 120%
Profit for the period 103 133 (22%) 331 362 (9%)
Particulars
Page 30 of 58
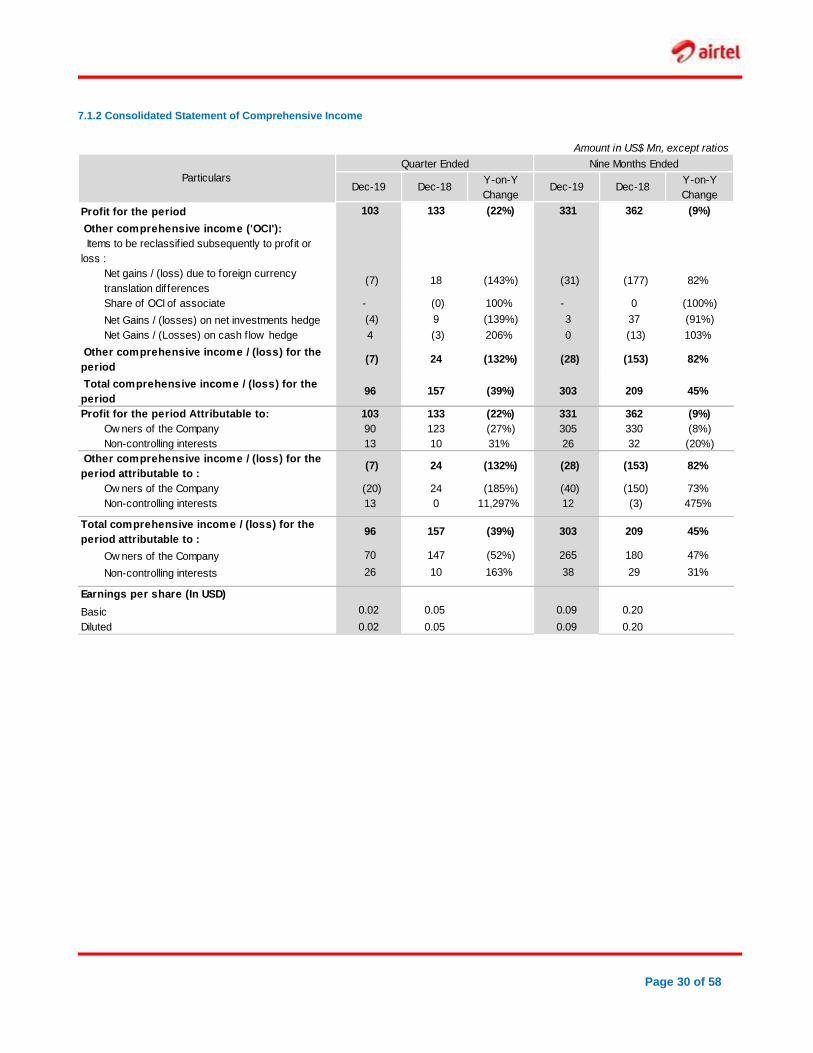
7.1.2 Consolidated Statement of Comprehensive Income
Amount in US$ Mn, except ratios
Quarter Ended Nine Months Ended
Dec-19 Dec-18Y-on-Y
ChangeDec-19 Dec-18
Y-on-Y
Change
Profit for the period 103 133 (22%) 331 362 (9%)
Other comprehensive income ('OCI'):
Items to be reclassif ied subsequently to profit or
loss :
Net gains / (loss) due to foreign currency
translation differences (7) 18 (143%) (31) (177) 82%
Share of OCI of associate - (0) 100% - 0 (100%)
Net Gains / (losses) on net investments hedge (4) 9 (139%) 3 37 (91%)
Net Gains / (Losses) on cash flow hedge 4 (3) 206% 0 (13) 103%
Other comprehensive income / (loss) for the
period (7) 24 (132%) (28) (153) 82%
Total comprehensive income / (loss) for the
period 96 157 (39%) 303 209 45%
Profit for the period Attributable to: 103 133 (22%) 331 362 (9%)
Ow ners of the Company 90 123 (27%) 305 330 (8%)
Non-controlling interests 13 10 31% 26 32 (20%)
Other comprehensive income / (loss) for the
period attributable to : (7) 24 (132%) (28) (153) 82%
Ow ners of the Company (20) 24 (185%) (40) (150) 73%
Non-controlling interests 13 0 11,297% 12 (3) 475%
Total comprehensive income / (loss) for the
period attributable to : 96 157 (39%) 303 209 45%
Ow ners of the Company 70 147 (52%) 265 180 47%
Non-controlling interests 26 10 163% 38 29 31%
Earnings per share (In USD)
Basic 0.02 0.05 0.09 0.20
Diluted 0.02 0.05 0.09 0.20
Particulars
Page 31 of 58
7.1.3 Consolidated Summarized Financial Position
Amount in US$ Mn
As at As at
Dec 31, 2019 Mar 31, 2019
Assets
Non-current assets
Property, plant and equipment (including CWIP and Right of use assets) 2,655 2,617
Intangible assets 4,514 4,545
Investment 3 3
Financial Assets
Other f inancial assets 9 54
Deferred tax assets (net) [including Income tax (net)] 343 377
Other non-current assets 118 89
7,642 7,685
Current assets
Financial Assets
- Trade receivables 128 121
- Cash and cash equivalents 1,385 848
- Other Bank balance 318 259
- Others 71 78
Other current assets 144 121
2,046 1,427
Total Assets 9,688 9,112
Equity and liabilities
Equity attributable to ow ners of the Parent 3,529 2,627
Non-controlling interests ('NCI') (168) (195)
3,361 2,432
Non-current liabilities
Financial Liabilities
- Borrow ings 3,499 3,474
- Others 16 14
Deferred tax liabilities (net) 36 33
Other non-current liabilities 53 54
3,604 3,575
Current liabilities
Financial Liabilities
- Borrow ings 1,142 1,365
- Trade Payables 764 712
- Others 398 700
Current tax liabilities (net) 104 67
Other current liabilities 315 261
2,723 3,105
Total Liabilities 6,327 6,680
Total Equity and liabilities 9,688 9,112
Particulars
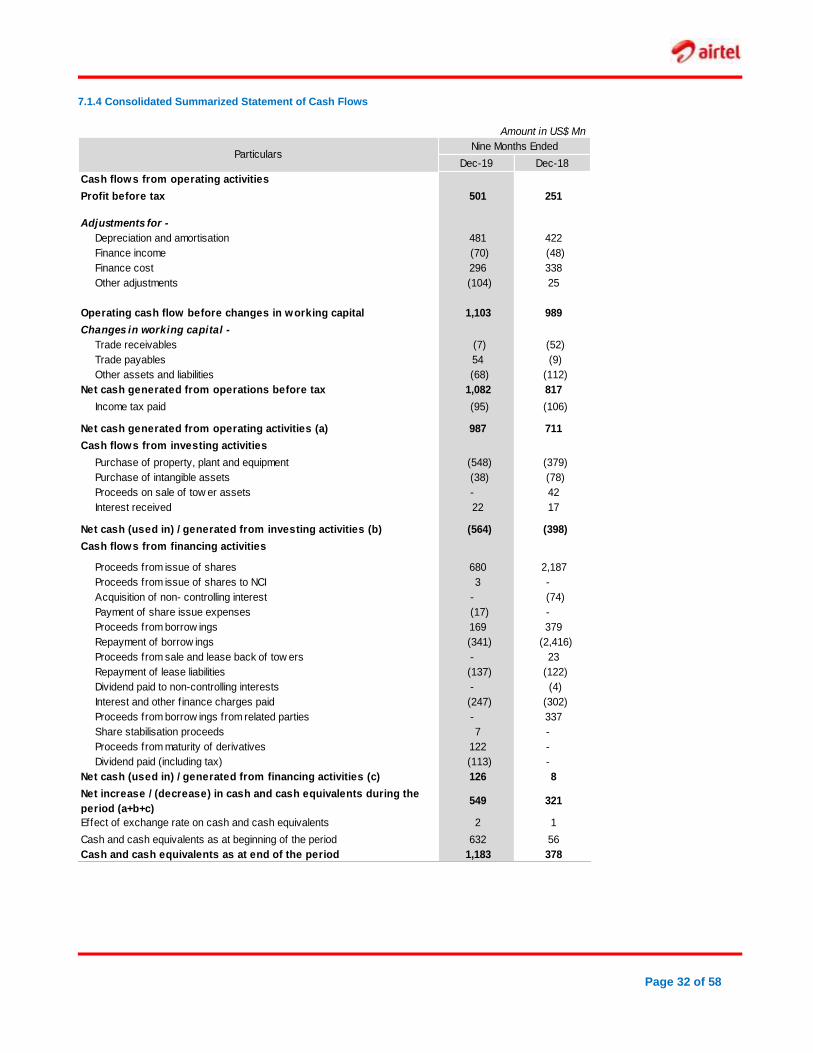
Page 32 of 58
7.1.4 Consolidated Summarized Statement of Cash Flows
Amount in US$ Mn
Nine Months Ended
Dec-19 Dec-18
Cash flows from operating activities
Profit before tax 501 251
Adjustments for -
Depreciation and amortisation 481 422
Finance income (70) (48)
Finance cost 296 338
Other adjustments (104) 25
Operating cash flow before changes in working capital 1,103 989
Changes in working capital -
Trade receivables (7) (52)
Trade payables 54 (9)
Other assets and liabilities (68) (112)
Net cash generated from operations before tax 1,082 817
Income tax paid (95) (106)
Net cash generated from operating activities (a) 987 711
Cash flows from investing activities
Purchase of property, plant and equipment (548) (379)
Purchase of intangible assets (38) (78)
Proceeds on sale of tow er assets - 42
Interest received 22 17
Net cash (used in) / generated from investing activities (b) (564) (398)
Cash flows from financing activities
Proceeds from issue of shares 680 2,187
Proceeds from issue of shares to NCI 3 -
Acquisition of non- controlling interest - (74)
Payment of share issue expenses (17) -
Proceeds from borrow ings 169 379
Repayment of borrow ings (341) (2,416)
Proceeds from sale and lease back of tow ers - 23
Repayment of lease liabilities (137) (122)
Dividend paid to non-controlling interests - (4)
Interest and other f inance charges paid (247) (302)
Proceeds from borrow ings from related parties - 337
Share stabilisation proceeds 7 -
Proceeds from maturity of derivatives 122 -
Dividend paid (including tax) (113) -
Net cash (used in) / generated from financing activities (c) 126 8
Net increase / (decrease) in cash and cash equivalents during the
period (a+b+c) 549 321
Effect of exchange rate on cash and cash equivalents 2 1
Cash and cash equivalents as at beginning of the period 632 56
Cash and cash equivalents as at end of the period 1,183 378
Particulars
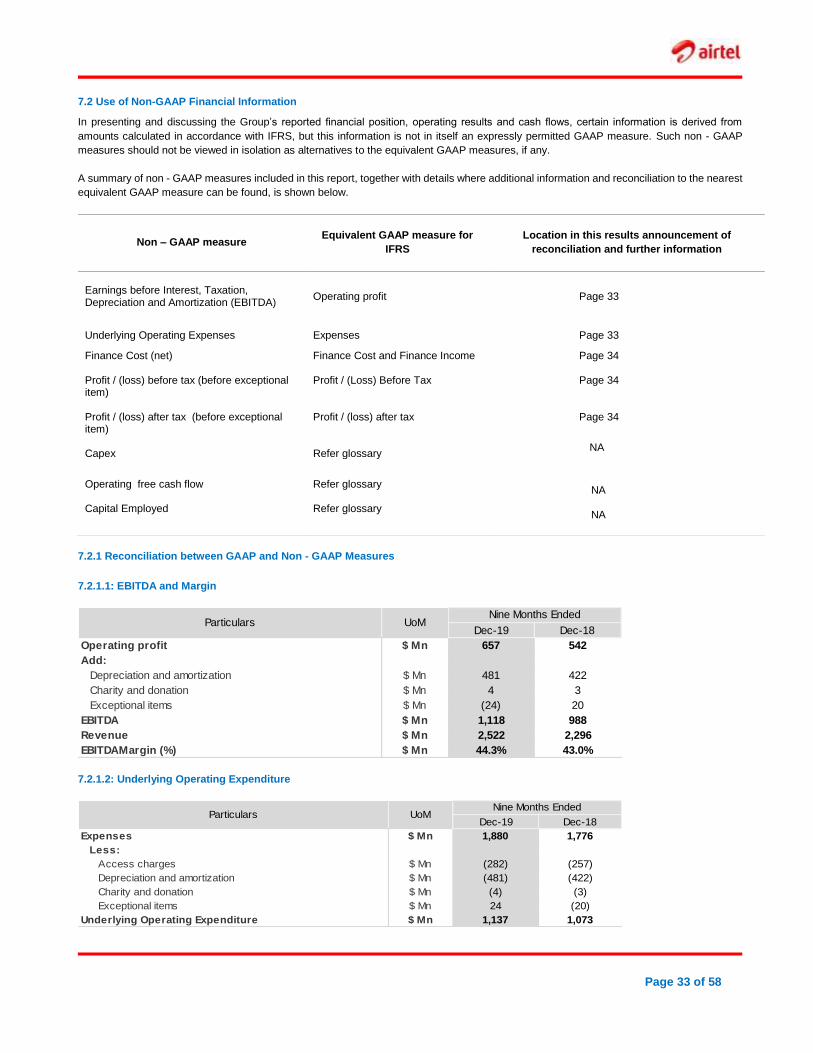
Page 33 of 58
7.2 Use of Non-GAAP Financial Information In presenting and discussing the Group’s reported financial position, operating results and cash flows, certain information is derived from
amounts calculated in accordance with IFRS, but this information is not in itself an expressly permitted GAAP measure. Such non - GAAP
measures should not be viewed in isolation as alternatives to the equivalent GAAP measures, if any.
A summary of non - GAAP measures included in this report, together with details where additional information and reconciliation to the nearest
equivalent GAAP measure can be found, is shown below.
Non – GAAP measure Equivalent GAAP measure for
IFRS
Location in this results announcement of
reconciliation and further information
Earnings before Interest, Taxation, Depreciation and Amortization (EBITDA)
Operating profit
Page 33
Underlying Operating Expenses Expenses Page 33
Finance Cost (net) Profit / (loss) before tax (before exceptional item) Profit / (loss) after tax (before exceptional item) Capex
Finance Cost and Finance Income Profit / (Loss) Before Tax Profit / (loss) after tax Refer glossary
Page 34 Page 34 Page 34
NA
Operating free cash flow
Refer glossary
NA
Capital Employed Refer glossary NA
7.2.1 Reconciliation between GAAP and Non - GAAP Measures
7.2.1.1: EBITDA and Margin
Dec-19 Dec-18
Operating profit $ Mn 657 542
Add:
Depreciation and amortization $ Mn 481 422
Charity and donation $ Mn 4 3
Exceptional items $ Mn (24) 20
EBITDA $ Mn 1,118 988
Revenue $ Mn 2,522 2,296
EBITDAMargin (%) $ Mn 44.3% 43.0%
Particulars UoMNine Months Ended
7.2.1.2: Underlying Operating Expenditure
Dec-19 Dec-18
Expenses $ Mn 1,880 1,776
Less:
Access charges $ Mn (282) (257)
Depreciation and amortization $ Mn (481) (422)
Charity and donation $ Mn (4) (3)
Exceptional items $ Mn 24 (20)
Underlying Operating Expenditure $ Mn 1,137 1,073
Particulars UoMNine Months Ended
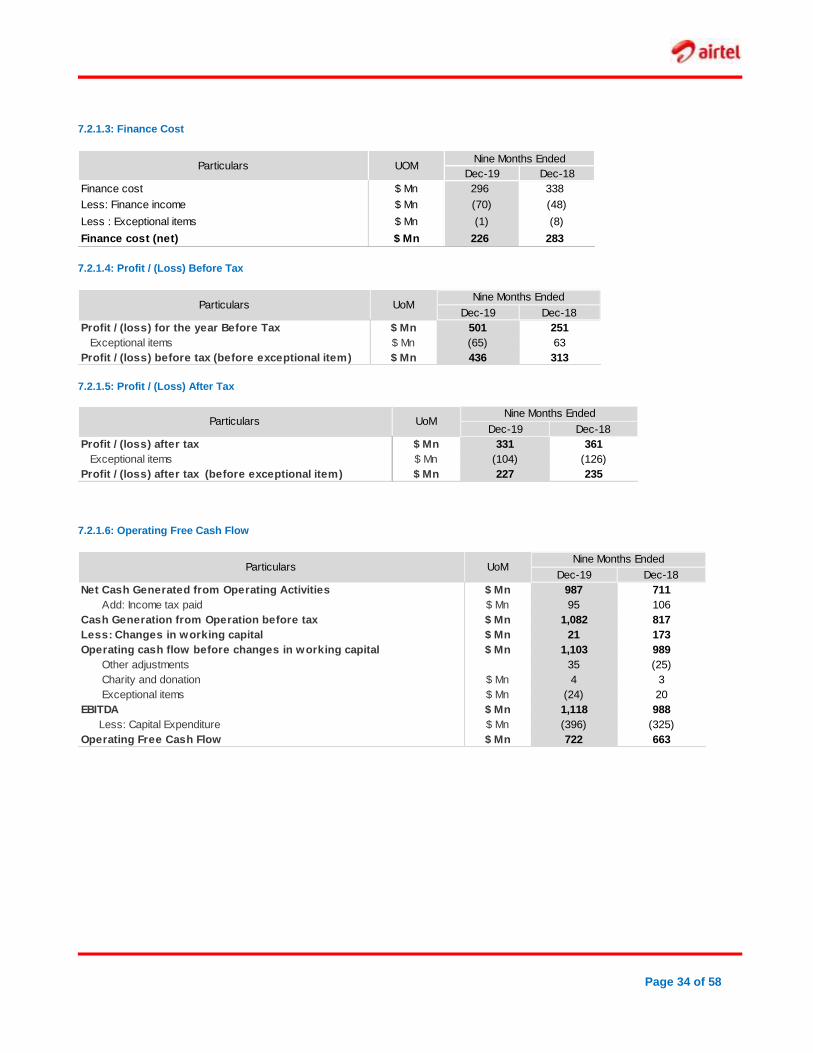
Page 34 of 58
7.2.1.3: Finance Cost
Nine Months Ended
Dec-19 Dec-18
Finance cost $ Mn 296 338
Less: Finance income $ Mn (70) (48)
Less : Exceptional items $ Mn (1) (8)
Finance cost (net) $ Mn 226 283
Particulars UOM
7.2.1.4: Profit / (Loss) Before Tax
Dec-19 Dec-18
Profit / (loss) for the year Before Tax $ Mn 501 251
Exceptional items $ Mn (65) 63
Profit / (loss) before tax (before exceptional item) $ Mn 436 313
Particulars UoMNine Months Ended
7.2.1.5: Profit / (Loss) After Tax
Dec-19 Dec-18
Profit / (loss) after tax $ Mn 331 361
Exceptional items $ Mn (104) (126)
Profit / (loss) after tax (before exceptional item) $ Mn 227 235
Particulars UoMNine Months Ended
7.2.1.6: Operating Free Cash Flow
Dec-19 Dec-18
Net Cash Generated from Operating Activities $ Mn 987 711
Add: Income tax paid $ Mn 95 106
Cash Generation from Operation before tax $ Mn 1,082 817
Less: Changes in working capital $ Mn 21 173
Operating cash flow before changes in working capital $ Mn 1,103 989
Other adjustments 35 (25)
Charity and donation $ Mn 4 3
Exceptional items $ Mn (24) 20
EBITDA $ Mn 1,118 988
Less: Capital Expenditure $ Mn (396) (325)
Operating Free Cash Flow $ Mn 722 663
Particulars UoMNine Months Ended
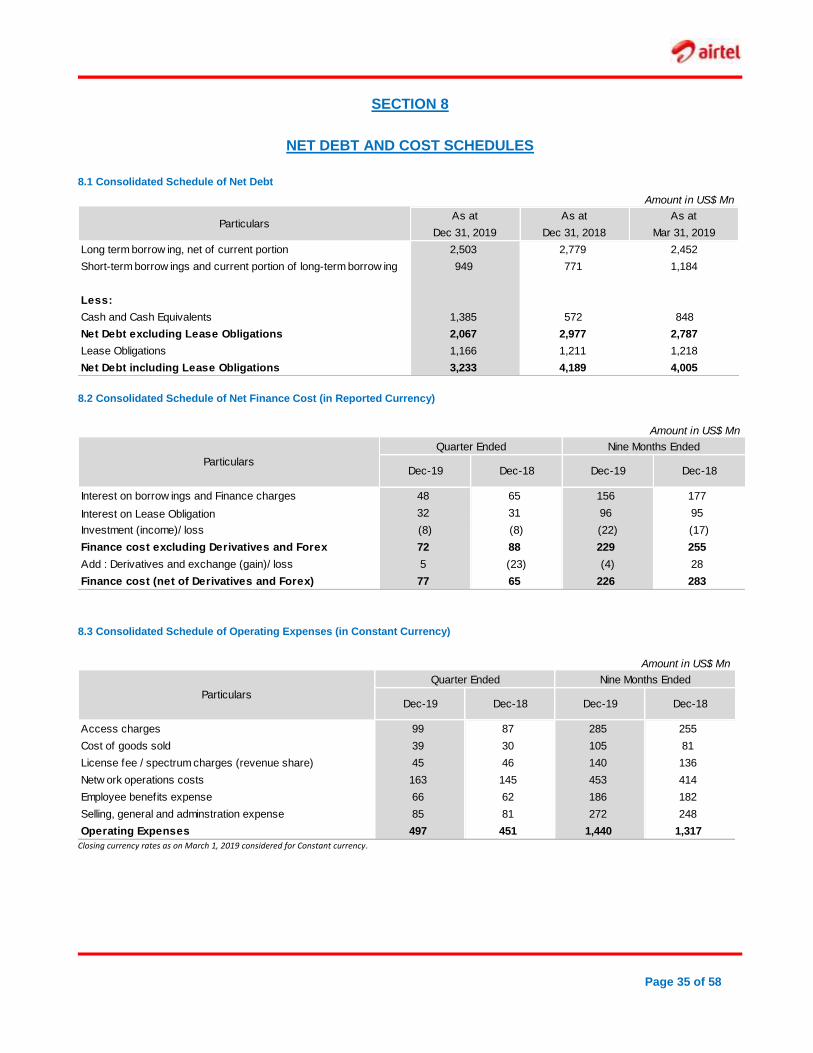
Page 35 of 58
SECTION 8
NET DEBT AND COST SCHEDULES
8.1 Consolidated Schedule of Net Debt
Amount in US$ Mn
As at As at As at
Dec 31, 2019 Dec 31, 2018 Mar 31, 2019
Long term borrow ing, net of current portion 2,503 2,779 2,452
Short-term borrow ings and current portion of long-term borrow ing 949 771 1,184
Less:
Cash and Cash Equivalents 1,385 572 848
Net Debt excluding Lease Obligations 2,067 2,977 2,787
Lease Obligations 1,166 1,211 1,218
Net Debt including Lease Obligations 3,233 4,189 4,005
Particulars
8.2 Consolidated Schedule of Net Finance Cost (in Reported Currency)
Amount in US$ Mn
Quarter Ended Nine Months Ended
Dec-19 Dec-18 Dec-19 Dec-18
Interest on borrow ings and Finance charges 48 65 156 177
Interest on Lease Obligation 32 31 96 95
Investment (income)/ loss (8) (8) (22) (17)
Finance cost excluding Derivatives and Forex 72 88 229 255
Add : Derivatives and exchange (gain)/ loss 5 (23) (4) 28
Finance cost (net of Derivatives and Forex) 77 65 226 283
Particulars
8.3 Consolidated Schedule of Operating Expenses (in Constant Currency)
Amount in US$ Mn
Quarter Ended Nine Months Ended
Dec-19 Dec-18 Dec-19 Dec-18
Access charges 99 87 285 255
Cost of goods sold 39 30 105 81
License fee / spectrum charges (revenue share) 45 46 140 136
Netw ork operations costs 163 145 453 414
Employee benefits expense 66 62 186 182
Selling, general and adminstration expense 85 81 272 248
Operating Expenses 497 451 1,440 1,317
Particulars
Closing currency rates as on March 1, 2019 considered for Constant currency.
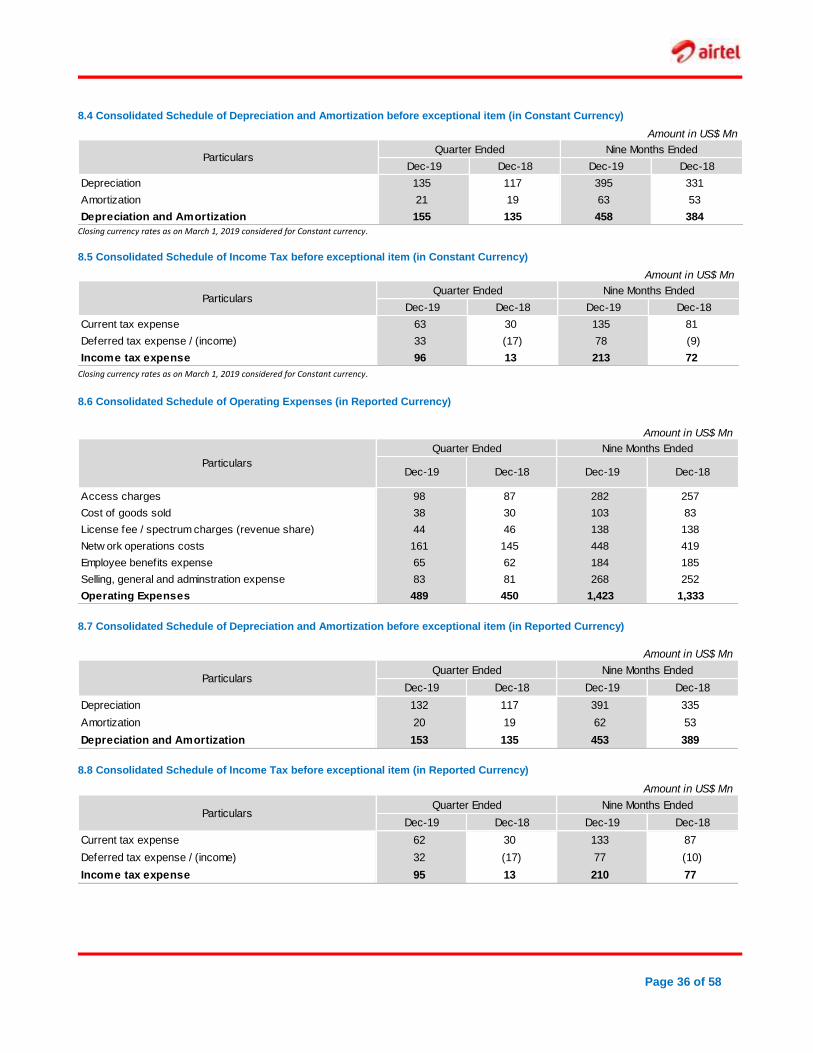
Page 36 of 58
8.4 Consolidated Schedule of Depreciation and Amortization before exceptional item (in Constant Currency)
Amount in US$ Mn
Quarter Ended Nine Months Ended
Dec-19 Dec-18 Dec-19 Dec-18
Depreciation 135 117 395 331
Amortization 21 19 63 53
Depreciation and Amortization 155 135 458 384
Particulars
Closing currency rates as on March 1, 2019 considered for Constant currency.
8.5 Consolidated Schedule of Income Tax before exceptional item (in Constant Currency)
Amount in US$ Mn
Quarter Ended Nine Months Ended
Dec-19 Dec-18 Dec-19 Dec-18
Current tax expense 63 30 135 81
Deferred tax expense / (income) 33 (17) 78 (9)
Income tax expense 96 13 213 72
Particulars
Closing currency rates as on March 1, 2019 considered for Constant currency.
8.6 Consolidated Schedule of Operating Expenses (in Reported Currency)
Amount in US$ Mn
Quarter Ended Nine Months Ended
Dec-19 Dec-18 Dec-19 Dec-18
Access charges 98 87 282 257
Cost of goods sold 38 30 103 83
License fee / spectrum charges (revenue share) 44 46 138 138
Netw ork operations costs 161 145 448 419
Employee benefits expense 65 62 184 185
Selling, general and adminstration expense 83 81 268 252
Operating Expenses 489 450 1,423 1,333
Particulars
8.7 Consolidated Schedule of Depreciation and Amortization before exceptional item (in Reported Currency)
Amount in US$ Mn
Quarter Ended Nine Months Ended
Dec-19 Dec-18 Dec-19 Dec-18
Depreciation 132 117 391 335
Amortization 20 19 62 53
Depreciation and Amortization 153 135 453 389
Particulars
8.8 Consolidated Schedule of Income Tax before exceptional item (in Reported Currency)
Amount in US$ Mn
Quarter Ended Nine Months Ended
Dec-19 Dec-18 Dec-19 Dec-18
Current tax expense 62 30 133 87
Deferred tax expense / (income) 32 (17) 77 (10)
Income tax expense 95 13 210 77
Particulars
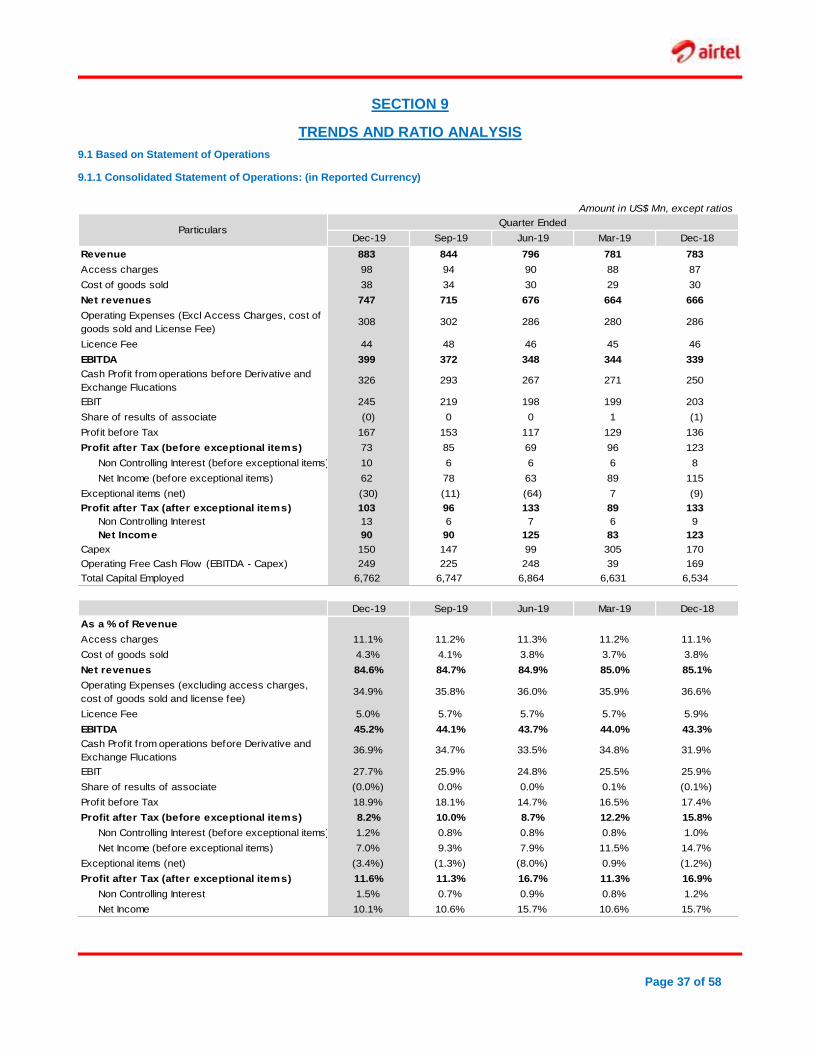
Page 37 of 58
SECTION 9
TRENDS AND RATIO ANALYSIS
9.1 Based on Statement of Operations
9.1.1 Consolidated Statement of Operations: (in Reported Currency)
Amount in US$ Mn, except ratios
Quarter Ended
Dec-19 Sep-19 Jun-19 Mar-19 Dec-18
Revenue 883 844 796 781 783
Access charges 98 94 90 88 87
Cost of goods sold 38 34 30 29 30
Net revenues 747 715 676 664 666
Operating Expenses (Excl Access Charges, cost of
goods sold and License Fee)308 302 286 280 286
Licence Fee 44 48 46 45 46
EBITDA 399 372 348 344 339
Cash Profit from operations before Derivative and
Exchange Flucations326 293 267 271 250
EBIT 245 219 198 199 203
Share of results of associate (0) 0 0 1 (1)
Profit before Tax 167 153 117 129 136
Profit after Tax (before exceptional items) 73 85 69 96 123
Non Controlling Interest (before exceptional items) 10 6 6 6 8
Net Income (before exceptional items) 62 78 63 89 115
Exceptional items (net) (30) (11) (64) 7 (9)
Profit after Tax (after exceptional items) 103 96 133 89 133
Non Controlling Interest 13 6 7 6 9
Net Income 90 90 125 83 123
Capex 150 147 99 305 170
Operating Free Cash Flow (EBITDA - Capex) 249 225 248 39 169
Total Capital Employed 6,762 6,747 6,864 6,631 6,534
Dec-19 Sep-19 Jun-19 Mar-19 Dec-18
As a % of Revenue
Access charges 11.1% 11.2% 11.3% 11.2% 11.1%
Cost of goods sold 4.3% 4.1% 3.8% 3.7% 3.8%
Net revenues 84.6% 84.7% 84.9% 85.0% 85.1%
Operating Expenses (excluding access charges,
cost of goods sold and license fee)34.9% 35.8% 36.0% 35.9% 36.6%
Licence Fee 5.0% 5.7% 5.7% 5.7% 5.9%
EBITDA 45.2% 44.1% 43.7% 44.0% 43.3%
Cash Profit from operations before Derivative and
Exchange Flucations36.9% 34.7% 33.5% 34.8% 31.9%
EBIT 27.7% 25.9% 24.8% 25.5% 25.9%
Share of results of associate (0.0%) 0.0% 0.0% 0.1% (0.1%)
Profit before Tax 18.9% 18.1% 14.7% 16.5% 17.4%
Profit after Tax (before exceptional items) 8.2% 10.0% 8.7% 12.2% 15.8%
Non Controlling Interest (before exceptional items) 1.2% 0.8% 0.8% 0.8% 1.0%
Net Income (before exceptional items) 7.0% 9.3% 7.9% 11.5% 14.7%
Exceptional items (net) (3.4%) (1.3%) (8.0%) 0.9% (1.2%)
Profit after Tax (after exceptional items) 11.6% 11.3% 16.7% 11.3% 16.9%
Non Controlling Interest 1.5% 0.7% 0.9% 0.8% 1.2%
Net Income 10.1% 10.6% 15.7% 10.6% 15.7%
Particulars
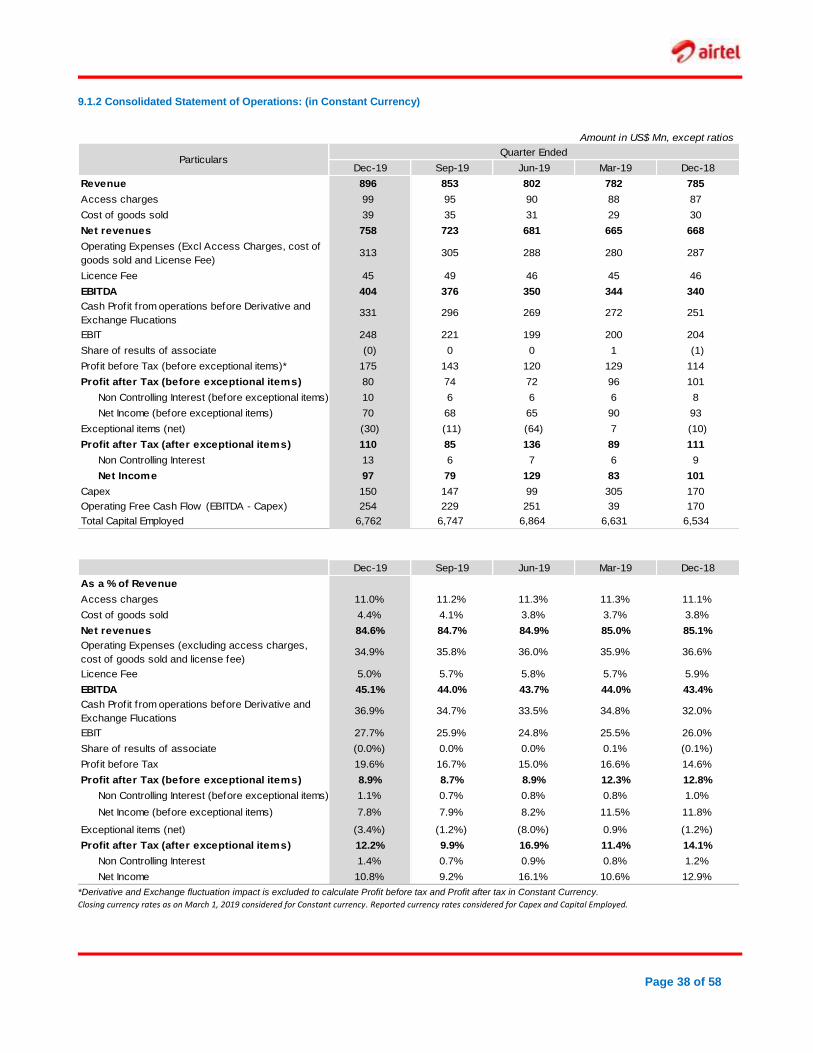
Page 38 of 58
9.1.2 Consolidated Statement of Operations: (in Constant Currency)
Amount in US$ Mn, except ratios
Quarter Ended
Dec-19 Sep-19 Jun-19 Mar-19 Dec-18
Revenue 896 853 802 782 785
Access charges 99 95 90 88 87
Cost of goods sold 39 35 31 29 30
Net revenues 758 723 681 665 668
Operating Expenses (Excl Access Charges, cost of
goods sold and License Fee)313 305 288 280 287
Licence Fee 45 49 46 45 46
EBITDA 404 376 350 344 340
Cash Profit from operations before Derivative and
Exchange Flucations331 296 269 272 251
EBIT 248 221 199 200 204
Share of results of associate (0) 0 0 1 (1)
Profit before Tax (before exceptional items)* 175 143 120 129 114
Profit after Tax (before exceptional items) 80 74 72 96 101
Non Controlling Interest (before exceptional items) 10 6 6 6 8
Net Income (before exceptional items) 70 68 65 90 93
Exceptional items (net) (30) (11) (64) 7 (10)
Profit after Tax (after exceptional items) 110 85 136 89 111
Non Controlling Interest 13 6 7 6 9
Net Income 97 79 129 83 101
Capex 150 147 99 305 170
Operating Free Cash Flow (EBITDA - Capex) 254 229 251 39 170
Total Capital Employed 6,762 6,747 6,864 6,631 6,534
Dec-19 Sep-19 Jun-19 Mar-19 Dec-18
As a % of Revenue
Access charges 11.0% 11.2% 11.3% 11.3% 11.1%
Cost of goods sold 4.4% 4.1% 3.8% 3.7% 3.8%
Net revenues 84.6% 84.7% 84.9% 85.0% 85.1%
Operating Expenses (excluding access charges,
cost of goods sold and license fee)34.9% 35.8% 36.0% 35.9% 36.6%
Licence Fee 5.0% 5.7% 5.8% 5.7% 5.9%
EBITDA 45.1% 44.0% 43.7% 44.0% 43.4%
Cash Profit from operations before Derivative and
Exchange Flucations36.9% 34.7% 33.5% 34.8% 32.0%
EBIT 27.7% 25.9% 24.8% 25.5% 26.0%
Share of results of associate (0.0%) 0.0% 0.0% 0.1% (0.1%)
Profit before Tax 19.6% 16.7% 15.0% 16.6% 14.6%
Profit after Tax (before exceptional items) 8.9% 8.7% 8.9% 12.3% 12.8%
Non Controlling Interest (before exceptional items) 1.1% 0.7% 0.8% 0.8% 1.0%
Net Income (before exceptional items) 7.8% 7.9% 8.2% 11.5% 11.8%
Exceptional items (net) (3.4%) (1.2%) (8.0%) 0.9% (1.2%)
Profit after Tax (after exceptional items) 12.2% 9.9% 16.9% 11.4% 14.1%
Non Controlling Interest 1.4% 0.7% 0.9% 0.8% 1.2%
Net Income 10.8% 9.2% 16.1% 10.6% 12.9%
Particulars
*Derivative and Exchange fluctuation impact is excluded to calculate Profit before tax and Profit after tax in Constant Currency.
Closing currency rates as on March 1, 2019 considered for Constant currency. Reported currency rates considered for Capex and Capital Employed.
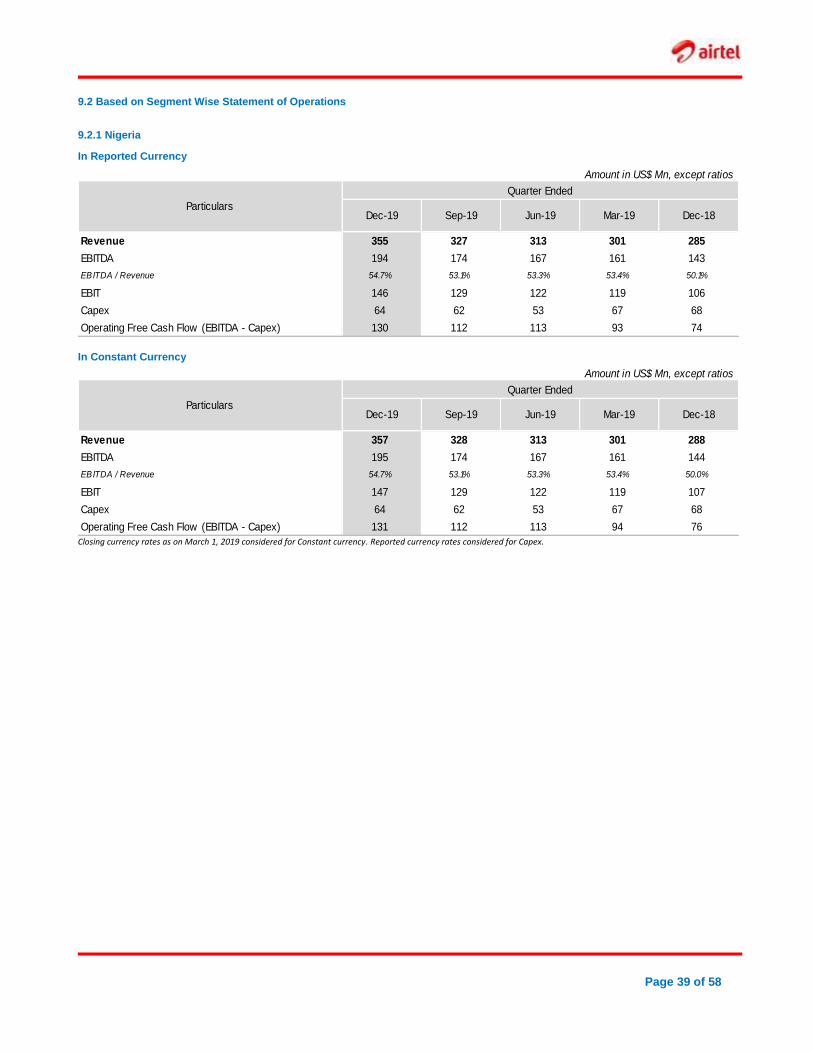
Page 39 of 58
9.2 Based on Segment Wise Statement of Operations
9.2.1 Nigeria
In Reported Currency
Amount in US$ Mn, except ratios
Quarter Ended
Dec-19 Sep-19 Jun-19 Mar-19 Dec-18
Revenue 355 327 313 301 285
EBITDA 194 174 167 161 143
EBITDA / Revenue 54.7% 53.1% 53.3% 53.4% 50.1%
EBIT 146 129 122 119 106
Capex 64 62 53 67 68
Operating Free Cash Flow (EBITDA - Capex) 130 112 113 93 74
Particulars
In Constant Currency
Amount in US$ Mn, except ratios
Quarter Ended
Dec-19 Sep-19 Jun-19 Mar-19 Dec-18
Revenue 357 328 313 301 288
EBITDA 195 174 167 161 144
EBITDA / Revenue 54.7% 53.1% 53.3% 53.4% 50.0%
EBIT 147 129 122 119 107
Capex 64 62 53 67 68
Operating Free Cash Flow (EBITDA - Capex) 131 112 113 94 76
Particulars
Closing currency rates as on March 1, 2019 considered for Constant currency. Reported currency rates considered for Capex.
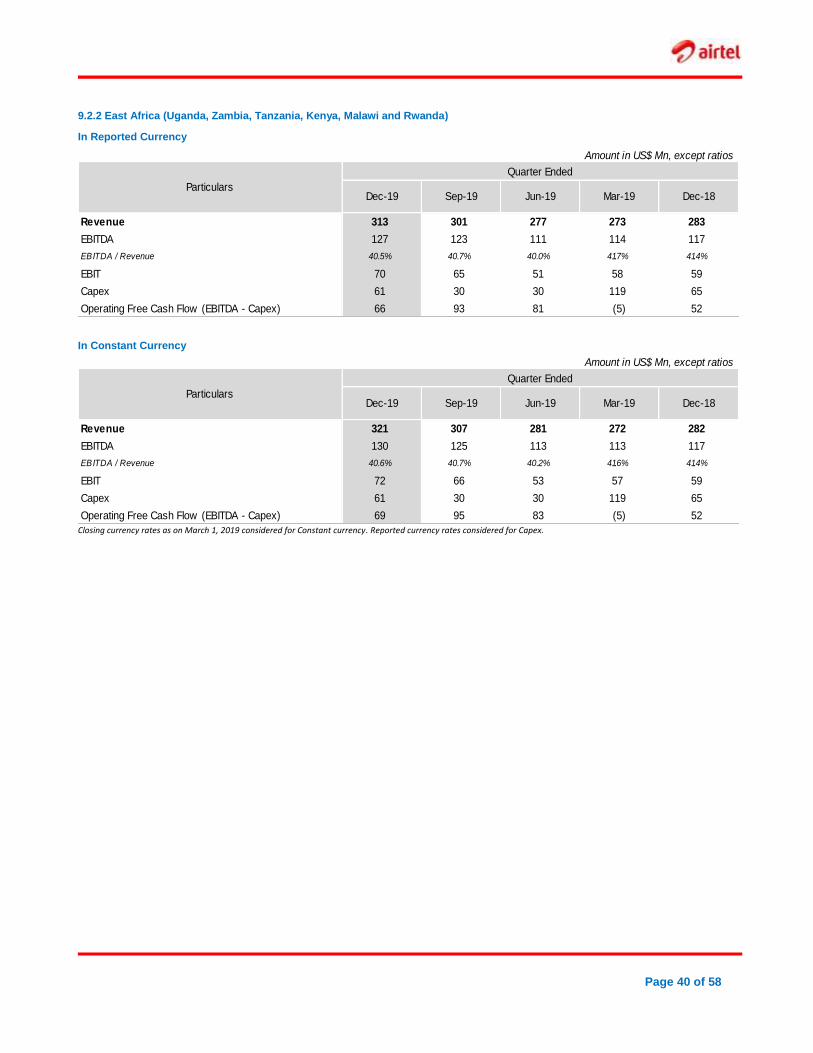
Page 40 of 58
9.2.2 East Africa (Uganda, Zambia, Tanzania, Kenya, Malawi and Rwanda)
In Reported Currency
Amount in US$ Mn, except ratios
Quarter Ended
Dec-19 Sep-19 Jun-19 Mar-19 Dec-18
Revenue 313 301 277 273 283
EBITDA 127 123 111 114 117
EBITDA / Revenue 40.5% 40.7% 40.0% 41.7% 41.4%
EBIT 70 65 51 58 59
Capex 61 30 30 119 65
Operating Free Cash Flow (EBITDA - Capex) 66 93 81 (5) 52
Particulars
In Constant Currency
Amount in US$ Mn, except ratios
Quarter Ended
Dec-19 Sep-19 Jun-19 Mar-19 Dec-18
Revenue 321 307 281 272 282
EBITDA 130 125 113 113 117
EBITDA / Revenue 40.6% 40.7% 40.2% 41.6% 41.4%
EBIT 72 66 53 57 59
Capex 61 30 30 119 65
Operating Free Cash Flow (EBITDA - Capex) 69 95 83 (5) 52
Particulars
Closing currency rates as on March 1, 2019 considered for Constant currency. Reported currency rates considered for Capex.
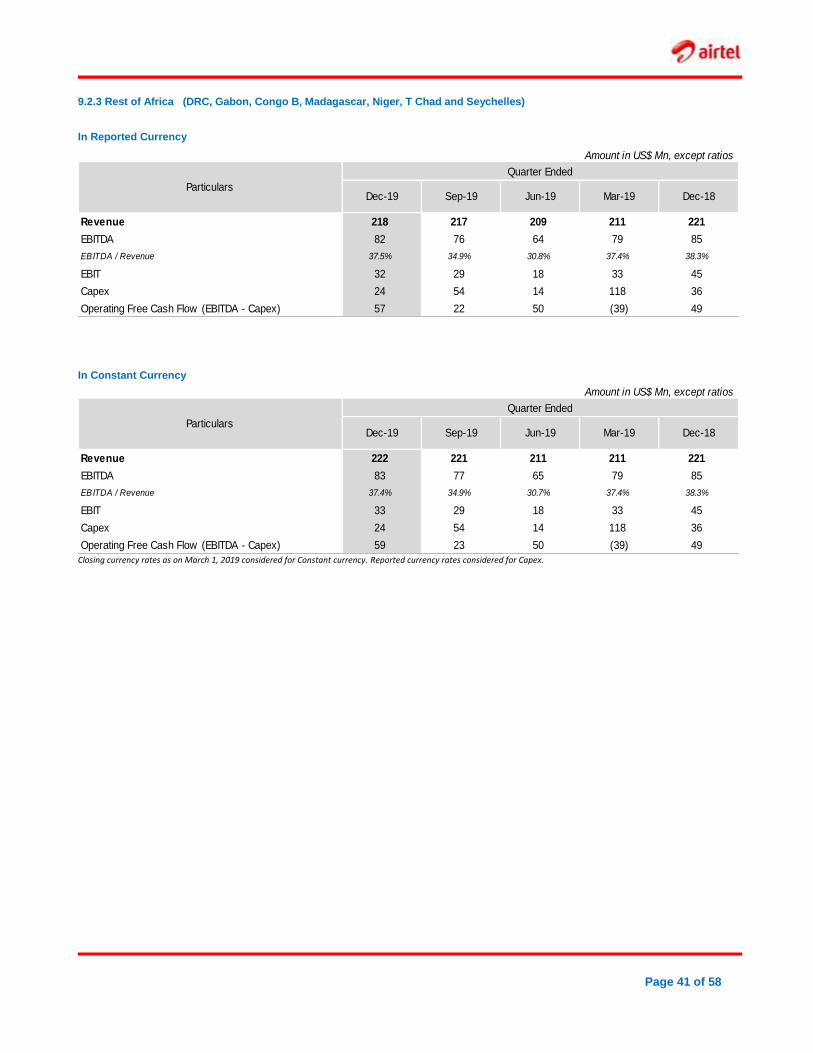
Page 41 of 58
9.2.3 Rest of Africa (DRC, Gabon, Congo B, Madagascar, Niger, T Chad and Seychelles)
In Reported Currency
Amount in US$ Mn, except ratios
Quarter Ended
Dec-19 Sep-19 Jun-19 Mar-19 Dec-18
Revenue 218 217 209 211 221
EBITDA 82 76 64 79 85
EBITDA / Revenue 37.5% 34.9% 30.8% 37.4% 38.3%
EBIT 32 29 18 33 45
Capex 24 54 14 118 36
Operating Free Cash Flow (EBITDA - Capex) 57 22 50 (39) 49
Particulars
In Constant Currency
Amount in US$ Mn, except ratios
Quarter Ended
Dec-19 Sep-19 Jun-19 Mar-19 Dec-18
Revenue 222 221 211 211 221
EBITDA 83 77 65 79 85
EBITDA / Revenue 37.4% 34.9% 30.7% 37.4% 38.3%
EBIT 33 29 18 33 45
Capex 24 54 14 118 36
Operating Free Cash Flow (EBITDA - Capex) 59 23 50 (39) 49
Particulars
Closing currency rates as on March 1, 2019 considered for Constant currency. Reported currency rates considered for Capex.
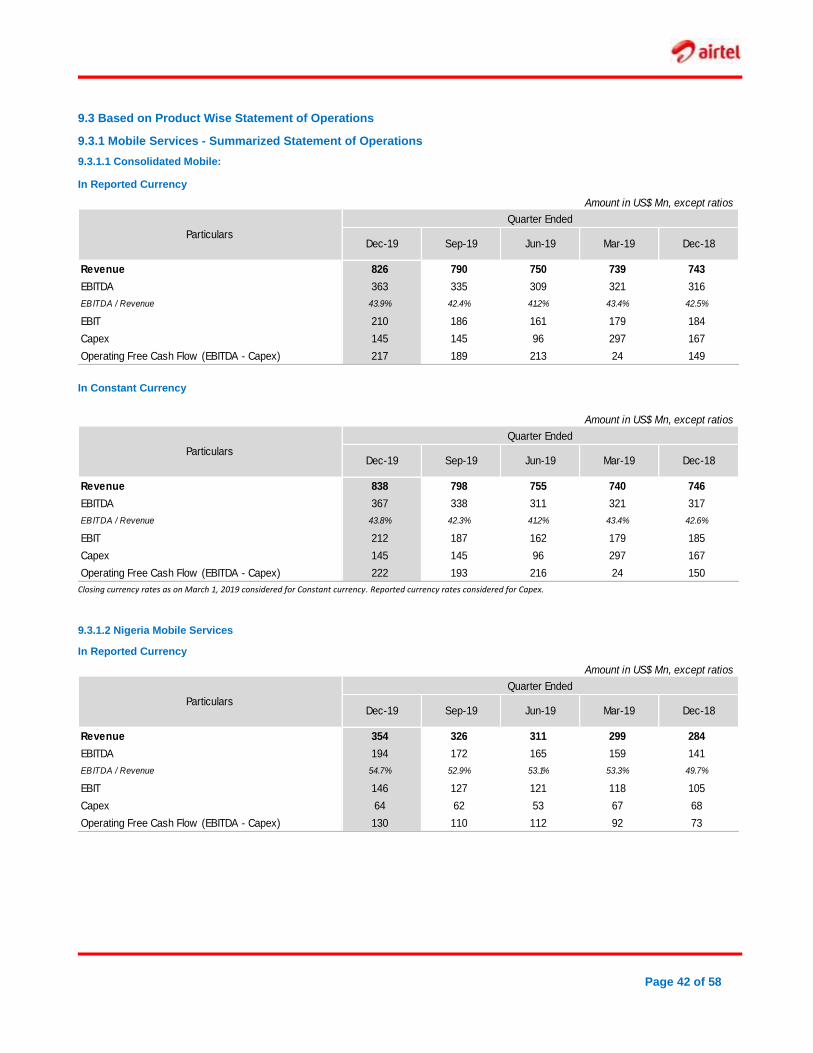
Page 42 of 58
9.3 Based on Product Wise Statement of Operations
9.3.1 Mobile Services - Summarized Statement of Operations
9.3.1.1 Consolidated Mobile:
In Reported Currency
Amount in US$ Mn, except ratios
Quarter Ended
Dec-19 Sep-19 Jun-19 Mar-19 Dec-18
Revenue 826 790 750 739 743
EBITDA 363 335 309 321 316
EBITDA / Revenue 43.9% 42.4% 41.2% 43.4% 42.5%
EBIT 210 186 161 179 184
Capex 145 145 96 297 167
Operating Free Cash Flow (EBITDA - Capex) 217 189 213 24 149
Particulars
In Constant Currency
Amount in US$ Mn, except ratios
Quarter Ended
Dec-19 Sep-19 Jun-19 Mar-19 Dec-18
Revenue 838 798 755 740 746
EBITDA 367 338 311 321 317
EBITDA / Revenue 43.8% 42.3% 41.2% 43.4% 42.6%
EBIT 212 187 162 179 185
Capex 145 145 96 297 167
Operating Free Cash Flow (EBITDA - Capex) 222 193 216 24 150
Particulars
Closing currency rates as on March 1, 2019 considered for Constant currency. Reported currency rates considered for Capex.
9.3.1.2 Nigeria Mobile Services
In Reported Currency
Amount in US$ Mn, except ratios
Quarter Ended
Dec-19 Sep-19 Jun-19 Mar-19 Dec-18
Revenue 354 326 311 299 284
EBITDA 194 172 165 159 141
EBITDA / Revenue 54.7% 52.9% 53.1% 53.3% 49.7%
EBIT 146 127 121 118 105
Capex 64 62 53 67 68
Operating Free Cash Flow (EBITDA - Capex) 130 110 112 92 73
Particulars
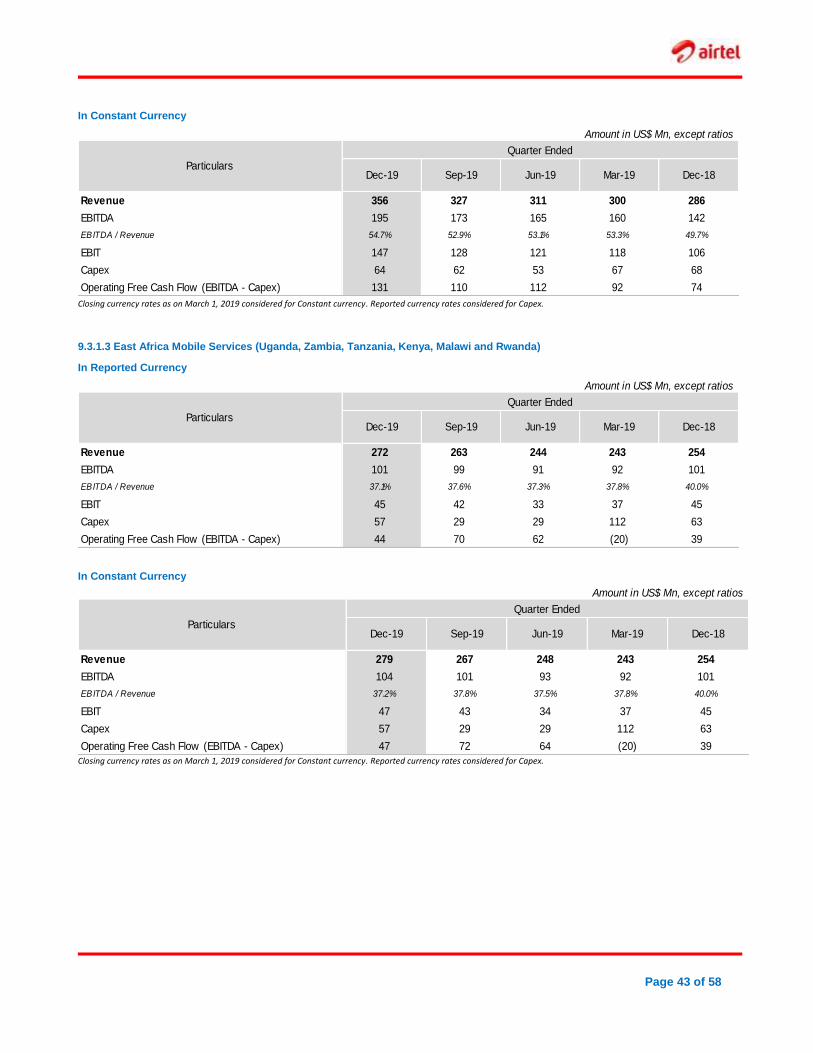
Page 43 of 58
In Constant Currency
Amount in US$ Mn, except ratios
Quarter Ended
Dec-19 Sep-19 Jun-19 Mar-19 Dec-18
Revenue 356 327 311 300 286
EBITDA 195 173 165 160 142
EBITDA / Revenue 54.7% 52.9% 53.1% 53.3% 49.7%
EBIT 147 128 121 118 106
Capex 64 62 53 67 68
Operating Free Cash Flow (EBITDA - Capex) 131 110 112 92 74
Particulars
Closing currency rates as on March 1, 2019 considered for Constant currency. Reported currency rates considered for Capex.
9.3.1.3 East Africa Mobile Services (Uganda, Zambia, Tanzania, Kenya, Malawi and Rwanda)
In Reported Currency
Amount in US$ Mn, except ratios
Quarter Ended
Dec-19 Sep-19 Jun-19 Mar-19 Dec-18
Revenue 272 263 244 243 254
EBITDA 101 99 91 92 101
EBITDA / Revenue 37.1% 37.6% 37.3% 37.8% 40.0%
EBIT 45 42 33 37 45
Capex 57 29 29 112 63
Operating Free Cash Flow (EBITDA - Capex) 44 70 62 (20) 39
Particulars
In Constant Currency
Amount in US$ Mn, except ratios
Quarter Ended
Dec-19 Sep-19 Jun-19 Mar-19 Dec-18
Revenue 279 267 248 243 254
EBITDA 104 101 93 92 101
EBITDA / Revenue 37.2% 37.8% 37.5% 37.8% 40.0%
EBIT 47 43 34 37 45
Capex 57 29 29 112 63
Operating Free Cash Flow (EBITDA - Capex) 47 72 64 (20) 39
Particulars
Closing currency rates as on March 1, 2019 considered for Constant currency. Reported currency rates considered for Capex.
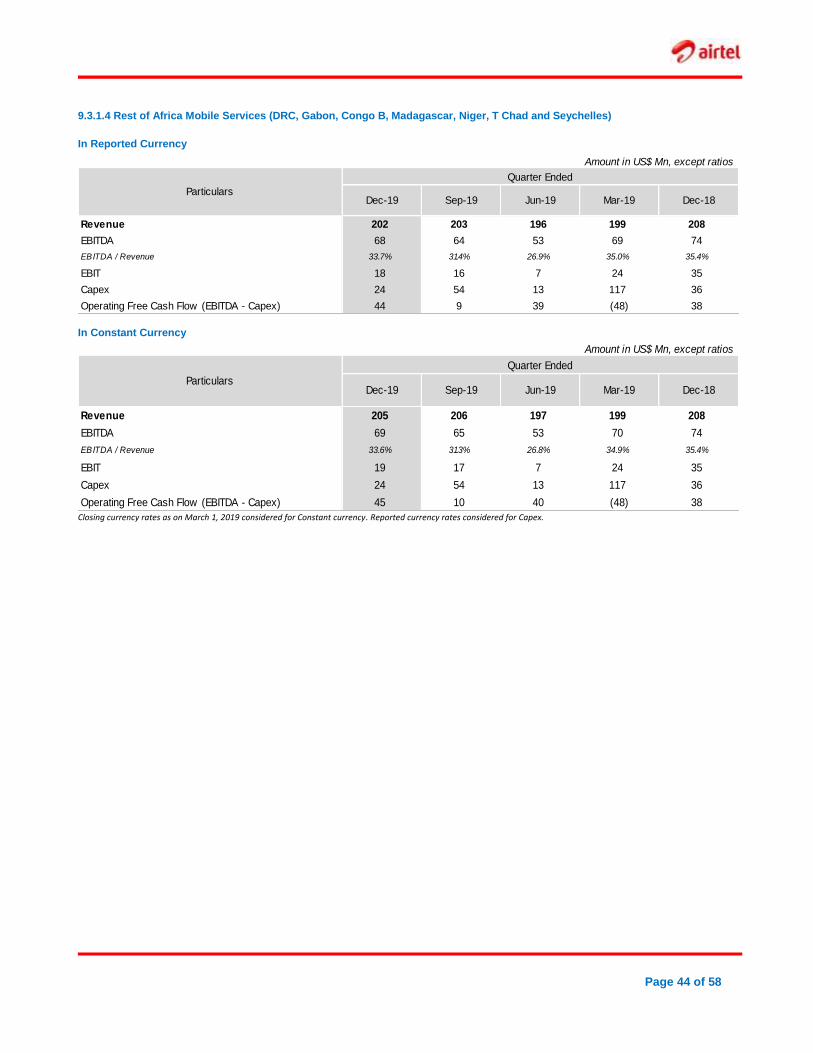
Page 44 of 58
9.3.1.4 Rest of Africa Mobile Services (DRC, Gabon, Congo B, Madagascar, Niger, T Chad and Seychelles)
In Reported Currency
Amount in US$ Mn, except ratios
Quarter Ended
Dec-19 Sep-19 Jun-19 Mar-19 Dec-18
Revenue 202 203 196 199 208
EBITDA 68 64 53 69 74
EBITDA / Revenue 33.7% 31.4% 26.9% 35.0% 35.4%
EBIT 18 16 7 24 35
Capex 24 54 13 117 36
Operating Free Cash Flow (EBITDA - Capex) 44 9 39 (48) 38
Particulars
In Constant Currency
Amount in US$ Mn, except ratios
Quarter Ended
Dec-19 Sep-19 Jun-19 Mar-19 Dec-18
Revenue 205 206 197 199 208
EBITDA 69 65 53 70 74
EBITDA / Revenue 33.6% 31.3% 26.8% 34.9% 35.4%
EBIT 19 17 7 24 35
Capex 24 54 13 117 36
Operating Free Cash Flow (EBITDA - Capex) 45 10 40 (48) 38
Particulars
Closing currency rates as on March 1, 2019 considered for Constant currency. Reported currency rates considered for Capex.
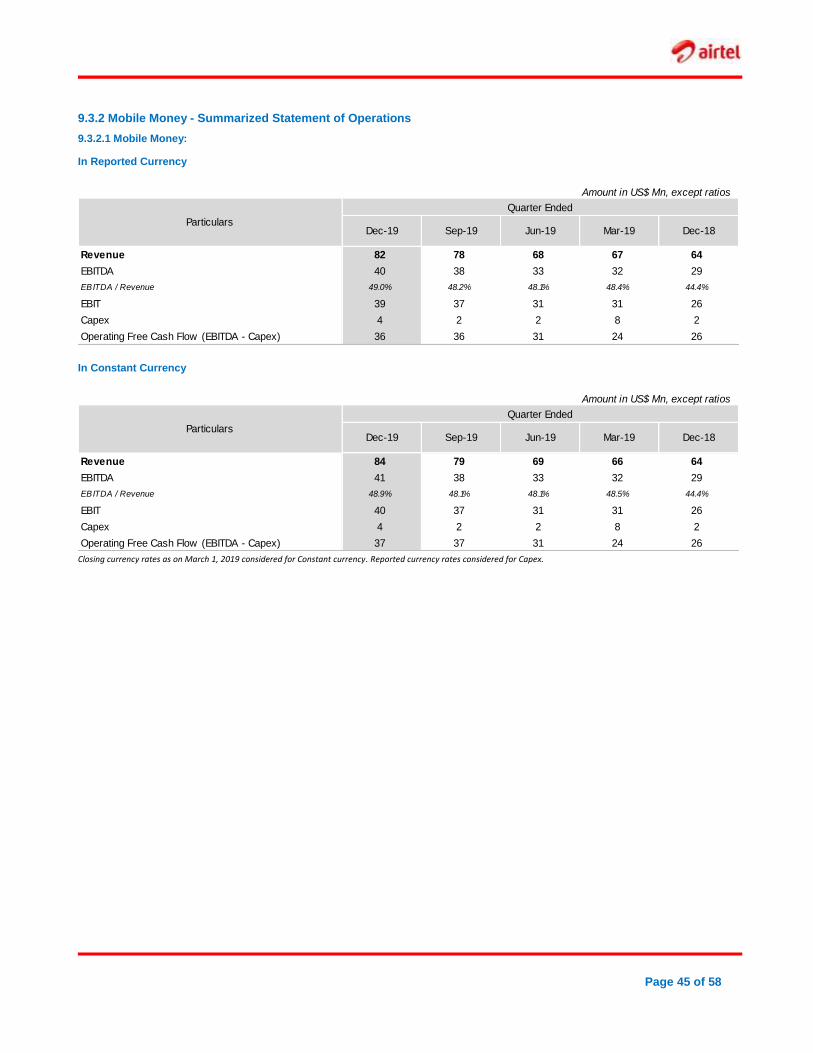
Page 45 of 58
9.3.2 Mobile Money - Summarized Statement of Operations
9.3.2.1 Mobile Money:
In Reported Currency
Amount in US$ Mn, except ratios
Quarter Ended
Dec-19 Sep-19 Jun-19 Mar-19 Dec-18
Revenue 82 78 68 67 64
EBITDA 40 38 33 32 29
EBITDA / Revenue 49.0% 48.2% 48.1% 48.4% 44.4%
EBIT 39 37 31 31 26
Capex 4 2 2 8 2
Operating Free Cash Flow (EBITDA - Capex) 36 36 31 24 26
Particulars
In Constant Currency
Amount in US$ Mn, except ratios
Quarter Ended
Dec-19 Sep-19 Jun-19 Mar-19 Dec-18
Revenue 84 79 69 66 64
EBITDA 41 38 33 32 29
EBITDA / Revenue 48.9% 48.1% 48.1% 48.5% 44.4%
EBIT 40 37 31 31 26
Capex 4 2 2 8 2
Operating Free Cash Flow (EBITDA - Capex) 37 37 31 24 26
Particulars
Closing currency rates as on March 1, 2019 considered for Constant currency. Reported currency rates considered for Capex.
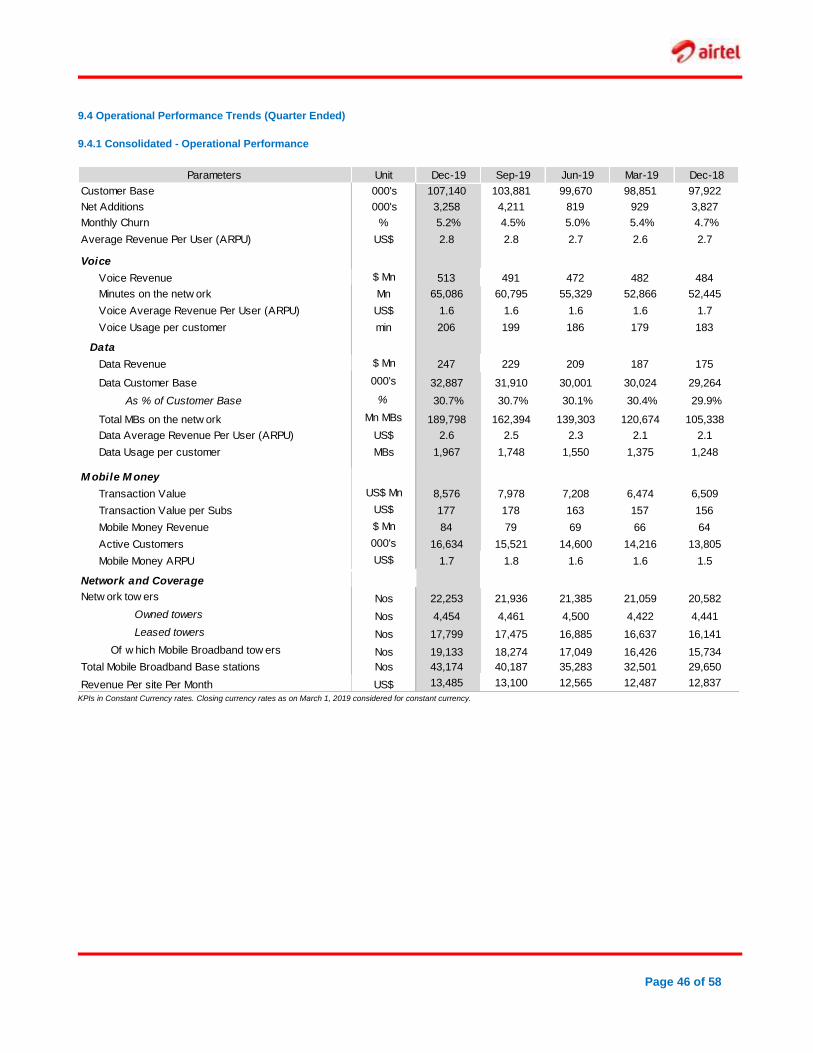
Page 46 of 58
9.4 Operational Performance Trends (Quarter Ended)
9.4.1 Consolidated - Operational Performance
Parameters Unit Dec-19 Sep-19 Jun-19 Mar-19 Dec-18
Customer Base 000's 107,140 103,881 99,670 98,851 97,922
Net Additions 000's 3,258 4,211 819 929 3,827
Monthly Churn % 5.2% 4.5% 5.0% 5.4% 4.7%
Average Revenue Per User (ARPU) US$ 2.8 2.8 2.7 2.6 2.7
Voice
Voice Revenue $ Mn 513 491 472 482 484
Minutes on the netw ork Mn 65,086 60,795 55,329 52,866 52,445
Voice Average Revenue Per User (ARPU) US$ 1.6 1.6 1.6 1.6 1.7
Voice Usage per customer min 206 199 186 179 183
Data
Data Revenue $ Mn 247 229 209 187 175
Data Customer Base 000's 32,887 31,910 30,001 30,024 29,264
As % of Customer Base % 30.7% 30.7% 30.1% 30.4% 29.9%
Total MBs on the netw ork Mn MBs 189,798 162,394 139,303 120,674 105,338
Data Average Revenue Per User (ARPU) US$ 2.6 2.5 2.3 2.1 2.1
Data Usage per customer MBs 1,967 1,748 1,550 1,375 1,248
M obile M oney
Transaction Value US$ Mn 8,576 7,978 7,208 6,474 6,509
Transaction Value per Subs US$ 177 178 163 157 156
Mobile Money Revenue $ Mn 84 79 69 66 64
Active Customers 000's 16,634 15,521 14,600 14,216 13,805
Mobile Money ARPU US$ 1.7 1.8 1.6 1.6 1.5
Network and Coverage
Netw ork tow ers Nos 22,253 21,936 21,385 21,059 20,582
Owned towers Nos 4,454 4,461 4,500 4,422 4,441
Leased towers Nos 17,799 17,475 16,885 16,637 16,141
Of w hich Mobile Broadband tow ers Nos 19,133 18,274 17,049 16,426 15,734
Total Mobile Broadband Base stations Nos 43,174 40,187 35,283 32,501 29,650
Revenue Per site Per Month US$ 13,485 13,100 12,565 12,487 12,837
KPIs in Constant Currency rates. Closing currency rates as on March 1, 2019 considered for constant currency.
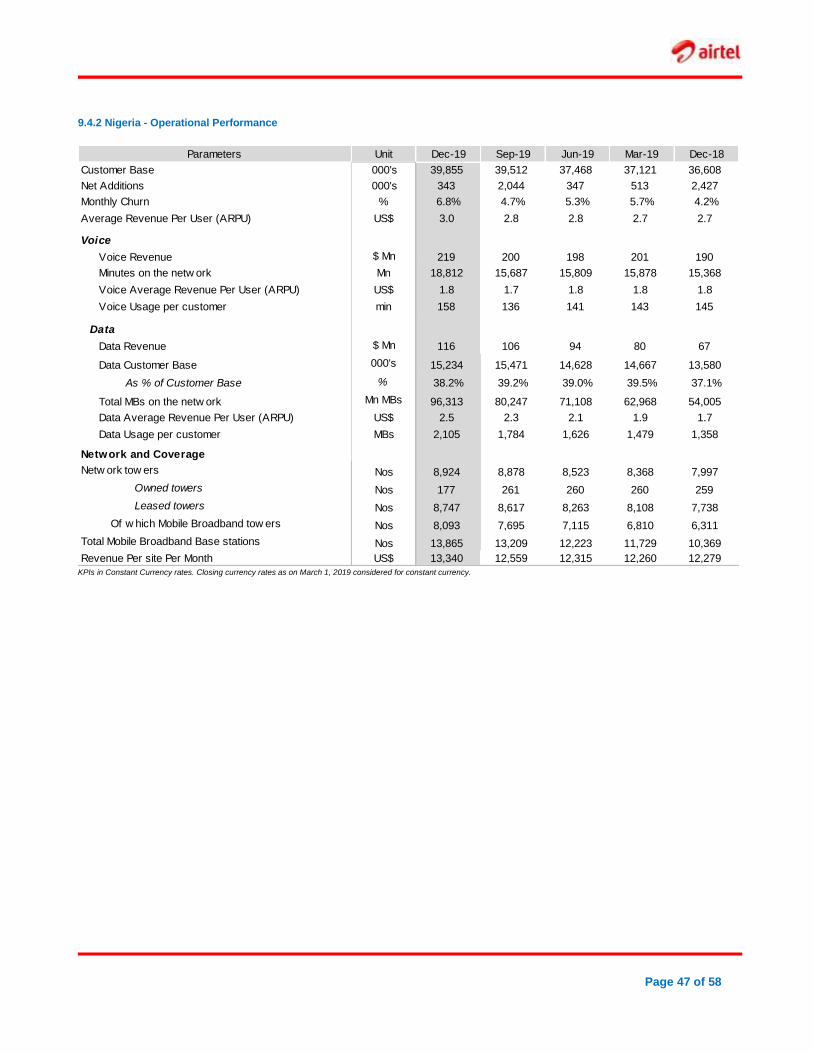
Page 47 of 58
9.4.2 Nigeria - Operational Performance
Parameters Unit Dec-19 Sep-19 Jun-19 Mar-19 Dec-18
Customer Base 000's 39,855 39,512 37,468 37,121 36,608
Net Additions 000's 343 2,044 347 513 2,427
Monthly Churn % 6.8% 4.7% 5.3% 5.7% 4.2%
Average Revenue Per User (ARPU) US$ 3.0 2.8 2.8 2.7 2.7
Voice
Voice Revenue $ Mn 219 200 198 201 190
Minutes on the netw ork Mn 18,812 15,687 15,809 15,878 15,368
Voice Average Revenue Per User (ARPU) US$ 1.8 1.7 1.8 1.8 1.8
Voice Usage per customer min 158 136 141 143 145
Data
Data Revenue $ Mn 116 106 94 80 67
Data Customer Base 000's 15,234 15,471 14,628 14,667 13,580
As % of Customer Base % 38.2% 39.2% 39.0% 39.5% 37.1%
Total MBs on the netw ork Mn MBs 96,313 80,247 71,108 62,968 54,005
Data Average Revenue Per User (ARPU) US$ 2.5 2.3 2.1 1.9 1.7
Data Usage per customer MBs 2,105 1,784 1,626 1,479 1,358
Network and Coverage
Netw ork tow ers Nos 8,924 8,878 8,523 8,368 7,997
Owned towers Nos 177 261 260 260 259
Leased towers Nos 8,747 8,617 8,263 8,108 7,738
Of w hich Mobile Broadband tow ers Nos 8,093 7,695 7,115 6,810 6,311
Total Mobile Broadband Base stations Nos 13,865 13,209 12,223 11,729 10,369
Revenue Per site Per Month US$ 13,340 12,559 12,315 12,260 12,279
KPIs in Constant Currency rates. Closing currency rates as on March 1, 2019 considered for constant currency.
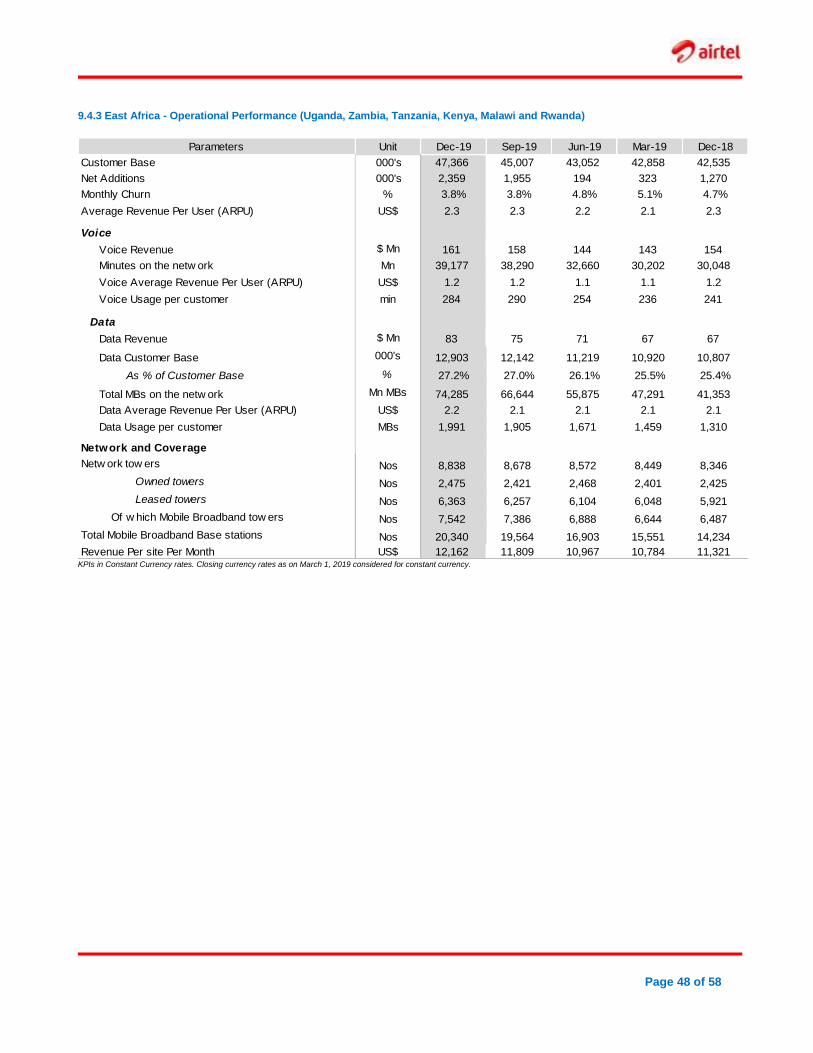
Page 48 of 58
9.4.3 East Africa - Operational Performance (Uganda, Zambia, Tanzania, Kenya, Malawi and Rwanda)
Parameters Unit Dec-19 Sep-19 Jun-19 Mar-19 Dec-18
Customer Base 000's 47,366 45,007 43,052 42,858 42,535
Net Additions 000's 2,359 1,955 194 323 1,270
Monthly Churn % 3.8% 3.8% 4.8% 5.1% 4.7%
Average Revenue Per User (ARPU) US$ 2.3 2.3 2.2 2.1 2.3
Voice
Voice Revenue $ Mn 161 158 144 143 154
Minutes on the netw ork Mn 39,177 38,290 32,660 30,202 30,048
Voice Average Revenue Per User (ARPU) US$ 1.2 1.2 1.1 1.1 1.2
Voice Usage per customer min 284 290 254 236 241
Data
Data Revenue $ Mn 83 75 71 67 67
Data Customer Base 000's 12,903 12,142 11,219 10,920 10,807
As % of Customer Base % 27.2% 27.0% 26.1% 25.5% 25.4%
Total MBs on the netw ork Mn MBs 74,285 66,644 55,875 47,291 41,353
Data Average Revenue Per User (ARPU) US$ 2.2 2.1 2.1 2.1 2.1
Data Usage per customer MBs 1,991 1,905 1,671 1,459 1,310
Network and Coverage
Netw ork tow ers Nos 8,838 8,678 8,572 8,449 8,346
Owned towers Nos 2,475 2,421 2,468 2,401 2,425
Leased towers Nos 6,363 6,257 6,104 6,048 5,921
Of w hich Mobile Broadband tow ers Nos 7,542 7,386 6,888 6,644 6,487
Total Mobile Broadband Base stations Nos 20,340 19,564 16,903 15,551 14,234
Revenue Per site Per Month US$ 12,162 11,809 10,967 10,784 11,321KPIs in Constant Currency rates. Closing currency rates as on March 1, 2019 considered for constant currency.
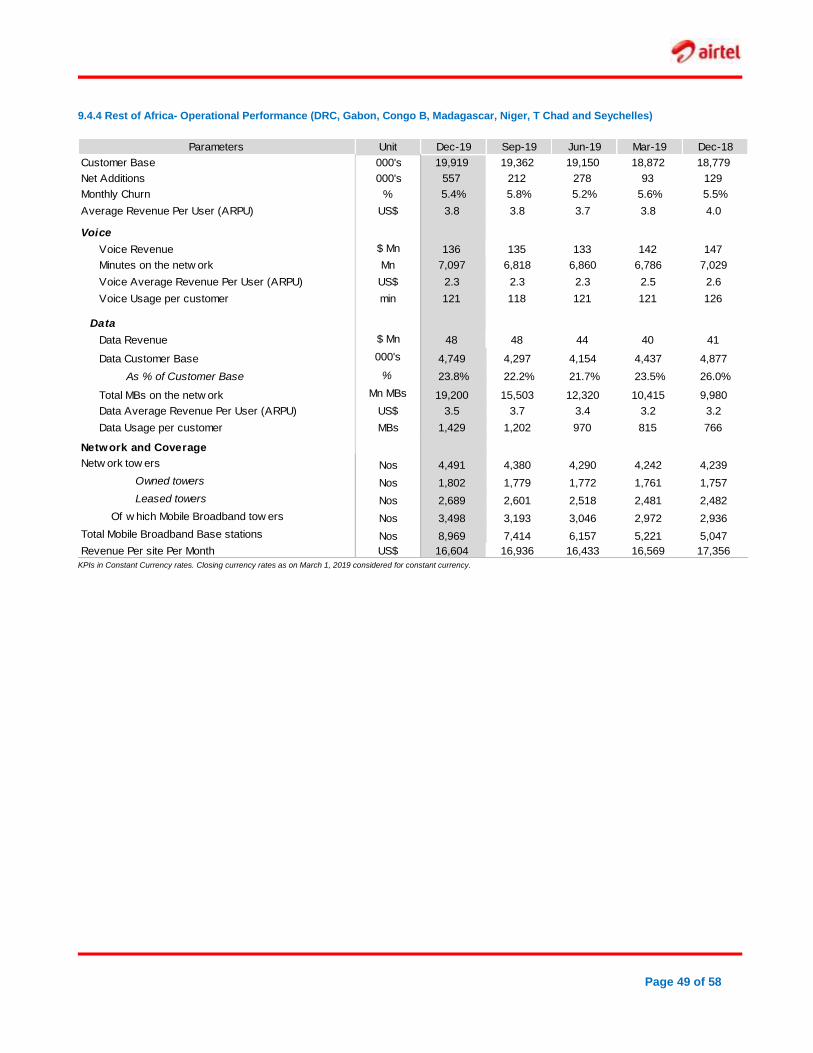
Page 49 of 58
9.4.4 Rest of Africa- Operational Performance (DRC, Gabon, Congo B, Madagascar, Niger, T Chad and Seychelles)
Parameters Unit Dec-19 Sep-19 Jun-19 Mar-19 Dec-18
Customer Base 000's 19,919 19,362 19,150 18,872 18,779
Net Additions 000's 557 212 278 93 129
Monthly Churn % 5.4% 5.8% 5.2% 5.6% 5.5%
Average Revenue Per User (ARPU) US$ 3.8 3.8 3.7 3.8 4.0
Voice
Voice Revenue $ Mn 136 135 133 142 147
Minutes on the netw ork Mn 7,097 6,818 6,860 6,786 7,029
Voice Average Revenue Per User (ARPU) US$ 2.3 2.3 2.3 2.5 2.6
Voice Usage per customer min 121 118 121 121 126
Data
Data Revenue $ Mn 48 48 44 40 41
Data Customer Base 000's 4,749 4,297 4,154 4,437 4,877
As % of Customer Base % 23.8% 22.2% 21.7% 23.5% 26.0%
Total MBs on the netw ork Mn MBs 19,200 15,503 12,320 10,415 9,980
Data Average Revenue Per User (ARPU) US$ 3.5 3.7 3.4 3.2 3.2
Data Usage per customer MBs 1,429 1,202 970 815 766
Network and Coverage
Netw ork tow ers Nos 4,491 4,380 4,290 4,242 4,239
Owned towers Nos 1,802 1,779 1,772 1,761 1,757
Leased towers Nos 2,689 2,601 2,518 2,481 2,482
Of w hich Mobile Broadband tow ers Nos 3,498 3,193 3,046 2,972 2,936
Total Mobile Broadband Base stations Nos 8,969 7,414 6,157 5,221 5,047
Revenue Per site Per Month US$ 16,604 16,936 16,433 16,569 17,356
KPIs in Constant Currency rates. Closing currency rates as on March 1, 2019 considered for constant currency.
Page 50 of 58
SECTION 10
KEY ACCOUNTING POLICIES (AS PER IFRS)
Property, plant and equipment and capital work-in-progress
An item is recognized as an asset, if and only if, it is probable that the future economic benefits associated with the item will flow to the Group and its cost can be measured reliably. PPE is initially recognized at cost. The initial cost of PPE comprises its purchase price (including non-refundable duties and taxes but excluding any trade discounts and rebates), and any directly attributable cost of bringing the asset to its working condition and location for its intended use. Further, it includes assets installed on the premises of customers as the associated risks, rewards and control remain with the Group. Subsequent to initial recognition, PPE is stated at cost less accumulated depreciation and any impairment losses. When significant parts of PPE are required to be replaced at regular intervals, the Group recognizes such parts as separate component of assets. When an item of PPE is replaced, then its carrying amount is de-recognized from the consolidated statement of financial position and cost of the new item of PPE is recognized. The expenditures that are incurred after an item of PPE has been ready to use, such as repairs and maintenance, are normally charged to the consolidated statement of comprehensive income in the period in which such costs are incurred. However, in situations where the said expenditure can be measured reliably, and is probable that future economic benefits associated with it will flow to the Group, it is included in the asset’s carrying value or as a separate asset, as appropriate. Depreciation on PPE is computed using the straight-line method over the estimated useful lives. Freehold land is not depreciated as it has an unlimited useful life. The Group has established the estimated range of useful lives for different categories of PPE as follows:
The useful lives, residual values and depreciation method of PPE are reviewed, and adjusted appropriately, at-least as at each reporting date so as to ensure that the method and period of depreciation are consistent with the expected pattern of economic benefits from these assets. The effect of any change in the estimated useful lives, residual values and / or depreciation method are accounted prospectively, and accordingly, the depreciation is calculated over the PPE’s remaining revised useful life. The cost and the accumulated depreciation for PPE sold, scrapped, retired or otherwise disposed of are de-recognized from the consolidated statement of financial position and the resulting gains / (losses) are included in the consolidated statement of comprehensive income within other expenses / other income.
PPE in the course of construction is carried at cost, less any accumulated impairment and presented separately as capital work-in-progress in the consolidated statement of financial position until capitalized. Such cost comprises of purchase price (including non-refundable duties and taxes but excluding any trade discounts and rebates), and any directly attributable cost.
Goodwill Goodwill represents the cost of the acquired businesses in excess of the fair value of identifiable net assets acquired. Goodwill is not amortized; however it is tested for impairment and carried at cost less any accumulated impairment losses. The gains/ (losses) on the disposal of a cash-generating unit (‘CGU’) include the carrying amount of goodwill relating to the CGU sold (in case goodwill has been allocated to Group of CGUs; it is determined on the basis of the relative fair value of the operations sold).
Other Intangible assets Identifiable intangible assets are recognized when the Group controls the asset, it is probable that future economic benefits attributed to the asset will flow to the Group and the cost of the asset can be measured reliably. The intangible assets that are acquired in a business combination are recognized at fair value as on acquisition date. Other intangible assets are recognized at cost. These assets having a definite useful life are carried at cost less accumulated amortization and any impairment losses. Amortization is computed using the straight-line method over the expected useful life of intangible assets. The Group has established the estimated useful lives of different categories of intangible assets as follows: a. Licenses (including spectrum)
Acquired licenses and spectrum are amortized commencing from the date when the related network is available for intended use in the relevant jurisdiction. The useful lives range from two to twenty-five years. In addition, the Group also incurs a fee on licenses/spectrum that is calculated based on the revenue amount of the period. Such revenue-share based fee is recognized as a cost in the consolidated statement of comprehensive income when incurred. b. Software: Software are amortized over the period of the license, generally not exceeding three years. c. Other acquired intangible assets: Other acquired intangible assets include the following: Customer relationships: Over the estimated life of such relationships which ranges from one year to five years. The useful lives and amortization method are reviewed, and adjusted appropriately, at least at each financial year end so as to ensure that the method and period of amortization are consistent with the expected pattern of economic benefits from these assets. The effect of any change in the estimated useful lives and / or amortization method is accounted prospectively, and accordingly,
Asset Categories Years
Leasehold improvementPeriod of lease or 10-20 years,
as applicable, whichever is less
Buildings 20
Plant and equipment
- Network equipment (including passive
infrastructure)
3-20
Computer equipment 3
Furniture & fixture and office equipment 2-5
Vehicles 3-5
Page 51 of 58
the amortization is calculated over the remaining revised useful life. Further, the cost of intangible assets under development includes the amount of spectrum allotted to the Group and related costs (including borrowing costs that are directly attributable to the acquisition or construction of qualifying assets), if any, for which services are yet to be rolled out and are presented separately in the consolidated statement of financial position.
Investment in Associates An associate is an entity over which the Group has significant influence. Significant influence is the power to participate in the financial and operating policy decisions of the investee but is not control or joint control over those policies. Investment in associate is accounted for using equity method; from the date on which the Group starts exercising significant influence over the associate. At each reporting date, the Group determines whether there is objective evidence that the investment is impaired. If there is such evidence, the Group calculates the amount of impairment as the difference between the recoverable amount of investment and its carrying value.
Leases At inception of a contract, the Group assesses a contract as, or containing, a lease if the contract conveys the right to control the use of an identified asset for a period of time in exchange for consideration. To assess whether a contract conveys the right to control the use of an identified asset, the Group assesses whether the contract involves the use of an identified asset, the Group has the right to obtain substantially all of the economic benefits from use of the asset throughout the period of use; and the Group has the right to direct the use of the asset. a. Group as a lessee The Group recognizes a right-of-use asset and a corresponding lease liability with respect to all lease agreements in which it is the lessee in the consolidated statement of financial position. The lease liability is initially measured at the present value of the lease payments that are not paid at the commencement date, discounted by using the rate implicit in the lease. If this rate cannot be readily determined, the Group uses its incremental borrowing rate. Lease liabilities include the net present value of fixed payments (including in-substance fixed payments), variable lease payments that are based on consumer price index (‘CPI’), the exercise price of a purchase option if the lessee is reasonably certain to exercise that option, and payments of penalties for terminating the lease, if the lease term reflects the lessee exercising that option. The lease payments are discounted using the interest rate implicit in the lease or, if that rate cannot be readily determined, using the Group’s incremental borrowing rate. Subsequently, the lease liability is measured at amortized cost using the effective interest method. It is remeasured when there is a change in future lease payments including due to changes in CPI or if the Group changes its assessment of whether it will exercise a purchase, extension or termination option or when the lease contract is modified and the lease modification is not accounted for as a separate lease. The corresponding adjustment is made to
the carrying amount of the right-of-use asset, or is recorded in profit or loss if the carrying amount of the related right-of-use asset has been reduced to zero. Right-of-use assets are measured at cost comprising the amount of the initial measurement of lease liability, any lease payments made at or before the commencement date less any lease incentives received, any initial direct costs, and restoration costs. Subsequent to initial recognition, right-of-use assets are stated at cost less accumulated depreciation and any impairment losses and adjusted for certain re-measurements of the lease liability. Depreciation is computed using the straight-line method from the commencement date to the end of the useful life of the underlying asset or the end of the lease term, whichever is shorter. The estimated useful lives of right-of-use assets are determined on the same basis as those of the underlying property and equipment. In the consolidated statement of financial position, the right-of-use assets and lease liabilities are presented separately. When a contract includes lease and non-lease components, the Group allocates the consideration in the contract on the basis of the relative stand-alone prices of each lease component and the aggregate stand-alone price of the non-lease components. Short-term leases The Group has elected not to recognize right-of-use assets and lease liabilities for short term leases that have a lease term of 12 months or less. The Group recognizes the lease payments associated with these leases as an expense on a straight-line basis over the lease term. b. Group as a lessor Whenever the terms of the lease transfer substantially all the risks and rewards of ownership to the lessee, the contract is classified as a finance lease. All other leases are classified as operating leases. Amounts due from lessees under a finance lease are recognized as receivables at an amount equal to the net investment in the leased assets. Finance lease income is allocated to the periods so as to reflect a constant periodic rate of return on the net investment outstanding in respect of the finance lease. Rental income from operating leases is recognized on a straight-line basis over the term of the relevant lease. Initial direct costs incurred in negotiating and arranging an operating lease are added to the carrying amount of the leased asset and recognized on a straight line basis over the lease term. When a contract includes lease and non-lease components, the Group applies IFRS 15 to allocate the consideration under the contract to each component. The Group enters into ‘Indefeasible right to use’ (‘IRU’) arrangements wherein the right to use the assets is given over the substantial part of the asset life. However, as the title to the assets and the significant risks associated with the operation and maintenance of these assets remains with the Group, such arrangements are recognized as operating lease. The contracted price is recognized as revenue during the tenure of the agreement. Unearned IRU revenue received in advance is presented as deferred revenue within liabilities in the consolidated statement of financial position.
Page 52 of 58
Derivative financial instruments
Derivative financial instruments, including separated embedded derivatives that are not designated as hedging instruments in a hedging relationship are classified as financial instruments at fair value through profit or loss. Such derivative financial instruments are initially recognized at fair value. They are subsequently measured at their fair value, with changes in fair value being recognized in profit or loss within finance income / finance costs.
Hedging activities
i. Fair value hedge
Some of the Group’s entities use derivative financial instruments (e.g. interest rate / currency swaps) to manage / mitigate their exposure to the risk of change in fair value of the borrowings. The Group designates certain interest swaps to hedge the risk of changes in fair value of recognized borrowings attributable to the hedged interest rate risk. The effective and ineffective portion of changes in the fair value of derivatives that are designated and qualify as fair value hedges are recorded in profit and loss within finance income / finance costs, together with any changes in the fair value of the hedged liability that is attributable to the hedged risk. If the hedge no longer meets the criteria for hedge accounting, the adjustment to the carrying amount of the hedged item is amortized to profit or loss over the period to remaining maturity of the hedged item.
ii. Cash flow hedge Some of the Group’s entities use derivative financial instruments (e.g. foreign currency forwards, options, swaps) to manage their exposure to foreign exchange and price risk. Further, the Group designates certain derivative financial instruments (or its components) as hedging instruments for hedging the exchange rate fluctuation risk attributable to either a recognized item or a highly probable forecast transaction (‘Cash flow hedge’). The effective portion of changes in the fair value of derivative financial instruments (or its components) that are designated and qualify as cash flow hedges, are recognized in other comprehensive income and held as cash flow hedge reserve (‘CFHR’) – within other components of equity. Any gains / (losses) relating to the ineffective portion, are recognized immediately in profit or loss within finance income / finance costs. The amounts accumulated in equity are re-classified to the profit and loss in the periods when the hedged item affects profit / (loss). When a hedging instrument expires or is sold, or when a cash flow hedge no longer meets the criteria for hedge accounting, any cumulative gains / (losses) existing in equity at that time remains in equity and is recognized (on the basis as discussed in the above paragraph) when the forecast transaction is ultimately recognized in the profit and loss. However, at any point of time, when a forecast transaction is no longer expected to occur, the cumulative gains / (losses) that were reported in equity is immediately transferred to the profit and loss within finance income / finance costs. iii. Net investment hedge The Group hedges its net investment in certain foreign subsidiaries. Accordingly, any foreign exchange differences on the hedging instrument (e.g. borrowings) relating to the effective portion of the hedge is recognized in other comprehensive income as foreign currency translation reserve (‘FCTR’) – within other
components of equity, so as to offset the change in the value of the net investment being hedged. The ineffective portion of the gain or loss on these hedges is immediately recognized in profit or loss. The amounts accumulated in equity are included in the profit and loss when the foreign operation is disposed or partially disposed.
Revenue
Revenue is recognized upon transfer of control of promised products or services to the customer at the consideration which the Group has received or expects to receive in exchange of those products or services, net of any taxes / duties and discounts. When determining the consideration to which the Group is entitled for providing promised products or services via intermediaries, the Group assesses whether the intermediary is a principal or agent in the onward sale to the end customer. To the extent that the intermediary is considered a principal, the consideration to which the Group is entitled is determined to be that received from the intermediary. To the extent that the intermediary is considered an agent, the consideration to which the Group is entitled is determined to be the amount received from the customer; the discount provided to the intermediary is recognized as a cost of sale. The Group has entered into certain multiple-element revenue arrangements which involve the delivery or performance of multiple products, services or rights to use assets. At the inception of the arrangement, all the deliverables therein are evaluated to determine whether they represent distinct performance obligations, and if so, they are accounted for separately. Total consideration related to the multiple element arrangements is allocated to each performance obligation based on their relative standalone selling prices. The stand-alone selling prices are determined based on the prices at which the Group sells equipment and network services separately. Revenue is recognized when, or as, each distinct performance obligation is satisfied. The main categories of revenue and the basis of recognition are as follows: a. Service revenue
Service revenue is derived from the provision of telecommunication services and mobile money services to customers. The majority of the customers of the Group subscribe to the services on a pre-paid basis. Telecommunication service revenues mainly pertain to usage, subscription and customer onboarding charges, which include activation charges and charges for voice, data, messaging and value added services. Telecommunication services (comprising voice, data and SMS) are considered to represent a single performance obligation as all are provided over the Group’s network and transmitted as data representing a digital signal on the network. The transmission consumes network bandwidth and therefore, irrespective of the nature of the communication, the customer ultimately receives access to the network and the right to consume network bandwidth. A contract liability is recognized for amounts received in advance, until the services are provided or when the usage of services becomes remote. The Group recognizes revenue from these services as they are provided. Revenue is recognized based on actual units of
Page 53 of 58
telecommunication services provided during the reporting period as a proportion of the total units of telecommunication services to be provided. Subscription charges are recognized over the subscription pack validity period. Customer onboarding revenue and associated cost is recognized upon successful onboarding of customer i.e. upfront. Revenues recognized in excess of amounts invoiced are classified as unbilled revenue. If amounts invoiced / collected from a customer are in excess of revenue recognized, a deferred revenue / advance income is recognized. Service revenues also includes revenue from interconnection / roaming charges for usage of the Group’s network by other operators for voice, data, messaging and signaling services. These are recognized upon transfer of control of services being transferred over time. Revenues from long distance operations comprise of voice services and bandwidth services (including installation), which are recognized on provision of services and over the period of respective arrangements. As part of the mobile money services, the Group earns commission from merchants for facilitating recharges, bill payments and other merchant payments. It also earns commissions on transfer of monies from one customer wallet to another. Such commissions are recognized as revenue on provision of these services by the Group. b. Equipment sales
Equipment sales mainly pertain to sale of telecommunication equipment and related accessories for which revenue is recognized when the control of equipment is transferred to the customer i.e. transferred at a point in time.
Alternative performance measures (APM)- Exceptional items (Non-GAAP Measure)
Management exercises judgment in determining the adjustments to apply to IFRS measurements in order to derive APMs which provide additional useful information on the underlying trends, performance and position of the Group. This assessment covers the nature of the item being one-off or non-routine, whether the cause of occurrence was within the Group’s control or not and the scale of impact of that item on reported performance in accordance with the exceptional items policy. To monitor the financial performance, the Group uses “Underlying Profit / loss before tax”, an APM representing profit or loss before tax for the period excluding the impact of exceptional items. Exceptional items refer to items of income or expense within the consolidated statement of comprehensive income which are of such size, nature or incidence that their exclusion is considered necessary to explain the performance of the Group and improve the comparability between periods. Reversals of previous exceptional items are also considered as exceptional items.
Foreign currency transactions
a. Functional and presentation currency
The items included in financial statements of each of the Group’s entities are measured using the currency of primary economic environment in which the entity operates (i.e. ‘functional currency’).
The financial statements are presented in US Dollar which is the functional and presentation currency of the Group. b. Transactions and balances Transactions in foreign currencies are initially recorded in the relevant functional currency at the rates prevailing at the date of the transaction. Monetary assets and liabilities denominated in foreign currencies are translated into the functional currency at the closing exchange rate prevailing as at the reporting date with the resulting foreign exchange differences, on subsequent re-statement / settlement, recognized in the consolidated statement of comprehensive income within finance costs / finance income. Non-monetary assets and liabilities denominated in foreign currencies are translated into the functional currency using the exchange rate prevalent, at the date of initial recognition (in case they are measured at historical cost) or at the date when the fair value is determined (in case they are measured at fair value) – with the resulting foreign exchange difference, on subsequent re-statement / settlement, recognized in the profit and loss, except to the extent that it relates to items recognized in the other comprehensive income or directly in equity. The equity items denominated in foreign currencies are translated at historical cost. c. Foreign operations
The assets and liabilities of foreign operations (including the goodwill and fair value adjustments arising on the acquisition of foreign entities) are translated into US Dollar at the exchange rates prevailing at the reporting date whereas their statements of profit and loss are translated into US Dollar at monthly average exchange rates and the equity is recorded at the historical rate. The resulting exchange differences arising on the translation are recognized in other comprehensive income and held in foreign currency translation reserve (‘FCTR’), a component of equity. On disposal of a foreign operation (that is, disposal involving loss of control), the component of other comprehensive income relating to that particular foreign operation is reclassified to profit or loss.
Income-taxes The income tax expense comprises of current and deferred income tax. Income tax is recognized in the profit and loss, except to the extent that it relates to items recognized in the other comprehensive income or directly in equity, in which case the related income tax is also recognized accordingly. a. Current tax Current tax is calculated on the basis of the tax rates, laws and regulations, which have been enacted or substantively enacted as at the reporting date in the respective countries where the Group entities operate and generate taxable income. The payment made in excess / (shortfall) of the respective Group entities’ income tax obligation for the period are recognized in the consolidated statement of financial position under non-current income tax assets / liabilities. Any interest, related to accrued liabilities for potential tax assessments are not included in Income tax charge or (credit), but are rather recognized within finance costs. The Group periodically evaluates positions taken in the tax returns with respect to situations in which applicable tax regulations are
Page 54 of 58
subject to interpretation and establishes provisions where appropriate on the basis of amounts expected to be paid to the tax authorities. b. Deferred tax Deferred tax is recognized, using the liability method, on temporary differences arising between the tax bases of assets and liabilities and their carrying values. However, deferred tax is not recognized if it arises from initial recognition of an asset or liability in a transaction other than a business combination that at the time of the transaction affects neither accounting nor taxable profit or loss. Further, deferred tax liabilities are not recognized if they arise from the initial recognition of goodwill. Deferred tax assets are recognized only to the extent that it is probable that future taxable profit will be available against which the temporary differences can be utilized. Moreover, deferred tax is recognized on temporary differences arising on investments in subsidiaries and associate - unless the timing of the reversal of the temporary difference can be controlled and it is probable that the temporary difference will not reverse in the foreseeable future. The unrecognized deferred tax assets / carrying amount of deferred tax assets are reviewed at each reporting date for recoverability and adjusted appropriately. Deferred tax is determined using tax rates (and laws) that have been enacted or substantively enacted by the reporting date and are expected to apply when the related deferred income tax asset is realized or the deferred income tax liability is settled. Income tax assets and liabilities are off-set against each other and the resultant net amount is presented in the consolidated statement of financial position, if and only when, (a) the Group currently has a legally enforceable right to set-off the current income tax assets and liabilities, and (b) when it relate to income tax levied by the same taxation authority and where there is an intention to settle the current income tax balances on net basis.
Transactions with non-controlling interests A change in the ownership interest of a subsidiary, without a change of control, is accounted for as a transaction with equity holders. Any difference between the amount of the adjustment to non-controlling interests and any consideration exchanged is recognized in ‘transactions with NCI reserve’, within equity.
Page 55 of 58
SECTION 11
GLOSSARY
Technical and Industry Terms
Company Related
Average Customers Average Revenue per user (ARPU)
Average customers are derived by computing the average of the monthly average customers for the relevant period. Average revenue earned per user per month, which is derived by dividing total revenue during the relevant period by the average number of customers and dividing the result by the number of months in the relevant period.
Capital Expenditure It is not a GAAP measure and is defined as investment in gross fixed assets (tangible and intangible
excluding spectrum/license) and capital work in progress (CWIP) excluding provisions on CWIP for the period.
Capital Employed It is not a GAAP measure and is defined as sum of shareholder’s equity and net debt.
Cash Profit from Operations before Derivative and Exchange Fluctuation
It is not a GAAP measure and is defined as profit from operating activities before depreciation, amortization and exceptional items adjusted for finance cost (net of finance income) before adjusting for derivative and exchange (gain)/ loss.
Churn
The total number of customer disconnections during the relevant period divided by the average customers in the relevant period.
Customer Base Total number of subscribers that used any of our services (voice calls, SMS, data usage or Mobile Money transaction) in the last 30 days.
Data Customer Base Total subscribers that consumed at least 1MB on the Group’s GPRS, 3G or 4G network in the last 30 days.
Data Usage per Customer
The average data consumption per data subscriber on a monthly basis. It is calculated by dividing the total MBs consumed on the Group’s network during the relevant period by the average data customer base over the same period, and dividing the result by the number of months in the relevant period.
Earnings Per Basic Share Earnings Per Diluted Share
Basic EPS are computed by dividing the profit for the period attributable to the owners of the parent by the weighted average number of shares outstanding during the period. The calculation of Net Profit/ (loss) per diluted share adjusts net profit or loss and the weighted average number of ordinary shares outstanding, to give effect to all dilutive potential ordinary shares that were outstanding during the year. (i) Deferred shares have not been considered for EPS computation as they do not have right to participate
in profits. (ii) The difference between the basic and diluted number of shares at the end of September 2019 being
relates to awards committed but not yet issued under the Group’s share-based payment schemes.
EBITDA It is not a GAAP measure; it is defined as operating profit before depreciation, amortization, CSR cost and
exceptional items.
EBITDA Margin It is not a GAAP measure; It is computed by dividing EBITDA for the relevant period by total revenue for the relevant period.
EBIT Free Cash Flow
It is not a GAAP measure and is defined as EBITDA adjusted for depreciation and amortization. Free Cash Flow defined as Operating Free Cash Flow less cash interest, cash tax and change in operating working capital.
Page 56 of 58
Interest Coverage Ratio
EBITDA for the relevant period divided by interest on borrowing for the relevant period.
Lease Obligation
Lease Obligation represents the present value of the future lease payment obligation.
Mobile Broadband Base stations
It includes all the 3G and 4G Base stations deployed across all technologies/spectrum bands.
Mobile Broadband Towers Minutes of Usage
It means the total number of network towers (defined below) in which unique number of either 3G or 4G Base stations are deployed, irrespective of their technologies. Total numbers of Mobile Broadband Towers are subset of Total Network Towers. Total voice minutes used by customers on the Group’s network during the relevant period.
Network Towers/Sites
Comprises of Base Transmission System (BTS) which holds the radio transceivers (TRXs) that define a cell and coordinates the radio links protocols with the mobile device. It includes all the Ground based, Roof top and In Building Solutions as at the end of the period. Towers as referred to be revenue generating Towers.
Net Debt It is not a GAAP measure and is defined as the long-term borrowings, short term borrowings and leased liability less cash and cash equivalents.
Net Debt to EBITDA (LTM)
It is not a GAAP measure and is computed by dividing Net Debt as at the end of the relevant period by EBITDA for preceding last 12 months (from the end of the relevant period).
Net Debt to EBITDA (Annualized)
It is not a GAAP measure and is computed by dividing net debt as at the end of the relevant period by EBITDA for the relevant period (annualized).
Net Revenues It is not a GAAP measure and is defined as total revenues adjusted for access charges and cost of goods sold for the relevant period.
Net profit margin It is computed by dividing Cash Profit From Operations before Derivative and Exchange Fluctuation by total revenue.
Operating Profit It is a GAAP measure and is computed as Revenue less operating expenditure including depreciation & amortization and operating exceptional items.
Operating Free Cash flow
It is computed by subtracting Capital Expenditure from EBITDA.
Profit / (Loss) after current tax expense
It is not a GAAP measure and is defined as Profit / (Loss) before taxation adjusted for current tax expense.
Return On Capital Employed (ROCE)
For the full year ended ROCE is computed by dividing the earnings before interest and tax for the period by average (of opening and closing) capital employed. For the quarterly computation, it is computed by dividing the earnings before interest and tax for the preceding (last) 12 months from the end of the relevant period by average capital employed. Average capital employed is calculated by considering average of quarterly average for the preceding (last) four quarters from the end of the relevant period.
Return On Equity attributable to equity holders of parent
For the full year ended it is computed by dividing net profit for the period by the closing Equity attributable to equity holders of parent. For the quarterly computations, it is computed by dividing net profit for the preceding last 12 months from the end of the relevant period by the closing Stockholder’s equity for the relevant period.
Revenue per Site per month
Revenue per Site per month is computed by: dividing the total revenues, excluding sale of goods (if any) during the relevant period by the average sites; and dividing the result by the number of months in the relevant period.
Page 57 of 58
Total Employees Total on-roll employees as at the end of respective period.
Total MBs on Network Includes total MBs consumed (uploaded & downloaded) via our network during the relevant period. Voice Minutes on Network
Includes usage on our network (incoming, outgoing and in-roaming minutes) during the relevant period.
Voice Minutes of Usage per Customer per month
Total voice minutes of usage the Group’s network during the relevant period divided by the average number of customers during the same period, divided by the number of months in the relevant period.
Abbreviations
3G
4G
Third - Generation Technology
Fourth - Generation Technology
LTM Last twelve months
GAAP
Group
Generally Accepted Accounting Principles
The Airtel Africa plc, together with its subsidiary undertakings referred to as the ‘Group’
KYC Know Your Customer
IAS
International Accounting Standards
IFRS
International Financial Reporting Standards
PPE
Property, Plant and equipment
Mn
EBITDA
Million
Earnings Before Interest, Tax, Depreciation and Amortization
EPS Earnings Per Share
MI Minority Interest (Non-Controlling Interest)
MB Megabyte
GB Gigabyte
ARPU Average Revenue per user
pp
P2P
Percentage points
Person to Person
Page 58 of 58
Written correspondence to be sent to:
Airtel Africa Investor Relations
E-mail address: [email protected]
Website: https://airtel.africa/investors Tel: (+44) 20 7493 9315