Airport Noise Management Report 2nd Quarter 2016 Noise Management Report 2nd Quarter 2016 Page 3 The...
10
Airport Noise Management Report 2nd Quarter 2016 The Airport Noise Management Report is a publication of the Airport Noise Management Office. This report provides a 2nd quarter summary of St. Louis Lambert International Airport’s operations and noise complaints for 2016. Harris, Inc. provides the data for the Noise Management System. 2 ND Q UARTER Y EAR 2016 There were 86 noise complaints received in the 2nd Quarter of 2016 as compared to the 37 noise complaints in the 2nd Quarter of 2015, an increase of 132.4%. The 86 complaints were from 7 communities. Two callers made 71 complaints (82.6%). The complainants stated that the aircraft were too low, too loud, too frequent and woke them or prevented them from sleeping. There were 56 complaints about night time operations (10:00 p.m. to 7:00 a.m) and 30 complaints about day time operations ( 7:00 a.m. to 10:00 p.m.). Landings and take-offs (operations) during the day time hours ac- counted for 87.1% of the operations while 12.9% of the operations occurred during the night time period. Chart below shows number of complaints by zip code by quarter. N O I S E C O M P L A I N T S ST. CHARLES—63303 (2) ST. JOHN—63114 (2) ST. ANN—63074 (2) UNIVERSITY CITY—63130 (3) FRONTENAC—63131 (1) FLORISSANT—63033 (1) PASADENA PARK—63121 (1) BRIDGETON—63044 (1) ST. LOUIS—63108 (1) PAGEDALE—63133 (1) FERGUSON—63135 (2) Noise Complaints by Zip Code PASADENA HILLS—63121 (51) ST. JOHN—63114 (2) ST. LOUIS—63108 (6) NORMANDY—63121 (22) FERGUSON—63135 (1) HAZELWOOD—63042 (2) BERKELEY—63134 (2) 1st Quarter 2nd Quarter Pasadena Park Pasadena Hills
Transcript of Airport Noise Management Report 2nd Quarter 2016 Noise Management Report 2nd Quarter 2016 Page 3 The...

Airport Noise Management Report 2nd Quarter 2016
The Airport Noise Management Report is a publication of the Airport Noise Management Office. This report provides a 2nd quarter summary of St. Louis Lambert International Airport’s operations and noise complaints for 2016. Harris, Inc. provides the data for the Noise Management System.
2ND QUARTER YEAR 2016
There were 86 noise complaints received in the 2nd Quarter of 2016 as compared to the 37 noise complaints in the 2nd Quarter of 2015, an increase of 132.4%. The 86 complaints were from 7 communities. Two callers made 71 complaints (82.6%). The complainants stated that the aircraft were too low, too loud, too frequent and woke them or prevented them from sleeping.
There were 56 complaints about night time operations (10:00 p.m. to 7:00 a.m) and 30 complaints about day time operations ( 7:00 a.m. to 10:00 p.m.). Landings and take-offs (operations) during the day time hours ac-counted for 87.1% of the operations while 12.9% of the operations occurred during the night time period. Chart below shows number of complaints by zip code by quarter.
N O I S E C O M P L A I N T S
ST. CHARLES—63303 (2) ST. JOHN—63114 (2)
ST. ANN—63074 (2) UNIVERSITY CITY—63130 (3)
FRONTENAC—63131 (1) FLORISSANT—63033 (1)
PASADENA PARK—63121 (1) BRIDGETON—63044 (1)
ST. LOUIS—63108 (1) PAGEDALE—63133 (1)
FERGUSON—63135 (2)
Noise Complaints
by Zip Code
PASADENA HILLS—63121 (51) ST. JOHN—63114 (2)
ST. LOUIS—63108 (6) NORMANDY—63121 (22)
FERGUSON—63135 (1) HAZELWOOD—63042 (2)
BERKELEY—63134 (2)
1st Quarter 2nd Quarter
Pasadena Park
Pasadena Hills
Airport Noise Management Report 2nd Quarter 2016 Page 2
N O I S E M O N I T O R I N G D A T A
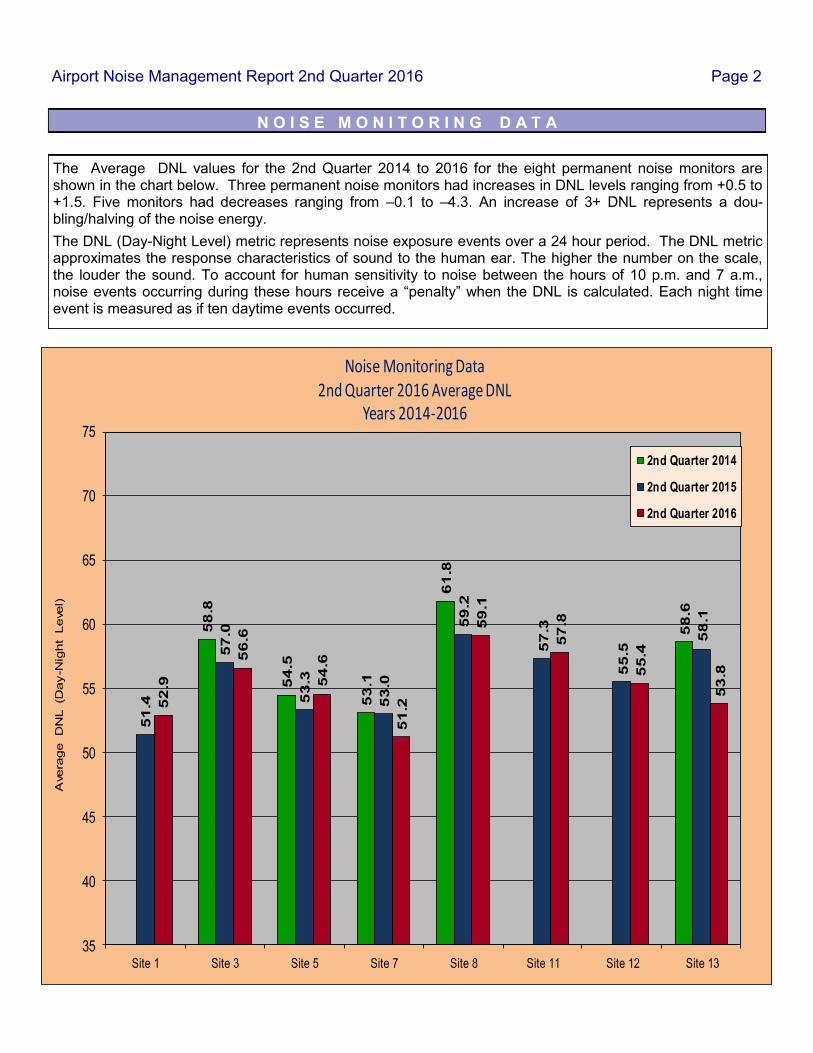
The Average DNL values for the 2nd Quarter 2014 to 2016 for the eight permanent noise monitors are shown in the chart below. Three permanent noise monitors had increases in DNL levels ranging from +0.5 to +1.5. Five monitors had decreases ranging from –0.1 to –4.3. An increase of 3+ DNL represents a dou-bling/halving of the noise energy.
The DNL (Day-Night Level) metric represents noise exposure events over a 24 hour period. The DNL metric approximates the response characteristics of sound to the human ear. The higher the number on the scale, the louder the sound. To account for human sensitivity to noise between the hours of 10 p.m. and 7 a.m., noise events occurring during these hours receive a “penalty” when the DNL is calculated. Each night time event is measured as if ten daytime events occurred.
58
.8
54
.5
53
.1
61
.8
58
.6
51
.4
57
.0
53
.3
53
.0
59
.2
57
.3
55
.5
58
.1
52
.9
56
.6
54
.6
51
.2
59
.1
57
.8
55
.4
53
.8
35
40
45
50
55
60
65
70
75
Site 1 Site 3 Site 5 Site 7 Site 8 Site 11 Site 12 Site 13
Avera
ge D
NL (D
ay-N
ight
Level)
Noise Monitoring Data2nd Quarter 2016 Average DNL
Years 2014-2016
2nd Quarter 2014
2nd Quarter 2015
2nd Quarter 2016
Airport Noise Management Report 2nd Quarter 2016 Page 3
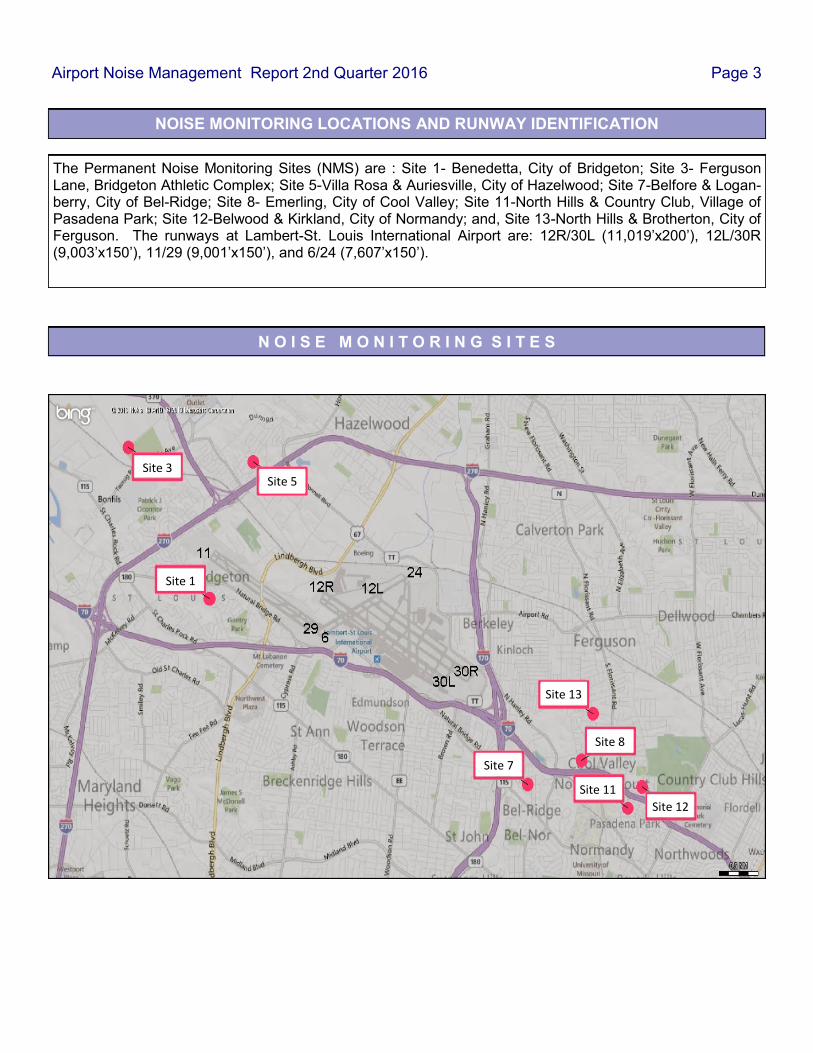
The Permanent Noise Monitoring Sites (NMS) are : Site 1- Benedetta, City of Bridgeton; Site 3- Ferguson Lane, Bridgeton Athletic Complex; Site 5-Villa Rosa & Auriesville, City of Hazelwood; Site 7-Belfore & Logan-berry, City of Bel-Ridge; Site 8- Emerling, City of Cool Valley; Site 11-North Hills & Country Club, Village of Pasadena Park; Site 12-Belwood & Kirkland, City of Normandy; and, Site 13-North Hills & Brotherton, City of Ferguson. The runways at Lambert-St. Louis International Airport are: 12R/30L (11,019’x200’), 12L/30R (9,003’x150’), 11/29 (9,001’x150’), and 6/24 (7,607’x150’).
NOISE MONITORING LOCATIONS AND RUNWAY IDENTIFICATION
Site 5
Site 13
Site 7
Site 8
Site 12
Site 11
Site 3
Site 1
N O I S E M O N I T O R I N G S I T E S

O P E R A T I O N S B Y R U N W A Y
Airport Noise Management Report 2nd Quarter 2016 Page 4
There were 48,123 operations recorded in the 2nd Quarter of 2016 as compared to 47,417 operations in the 2nd Quarter of 2015, an increase of 1.5%. The most utilized runway for known arrivals was Runway 30R (9,065) with 19.1% all operations. The most utilized runway for known departures was Runway 12L (9,447) with 19.9% of all operations. There were 47,525 (98.8%) operations in which the runway was identified and 598 operations (1.2%) where the runways were not identified.
9,447
9,294
9,065
9,032
2,564
2,406
1,763
1,598
961
571
477
417
188
121
93
59
34
33
0 2,000 4,000 6,000 8,000 10,000 12,000
12L DEP
30L DEP
30R ARR
12R ARR
29 DEP
30L ARR
12R DEP
11 ARR
12L ARR
24 ARR
UNK DEP
30R DEP
29 ARR
UNK ARR
11 DEP
24 DEP
6 DEP
6 ARR
ARR = ArrivalsDEP = Departures
Operations by Runway2nd Quarter 2016
47,525 Operations with runways identified48,123 Total Operations
Airport Noise Management Report 2nd Quarter 2016 Page 5
O P E R A T I O N S B Y A I R L I N E
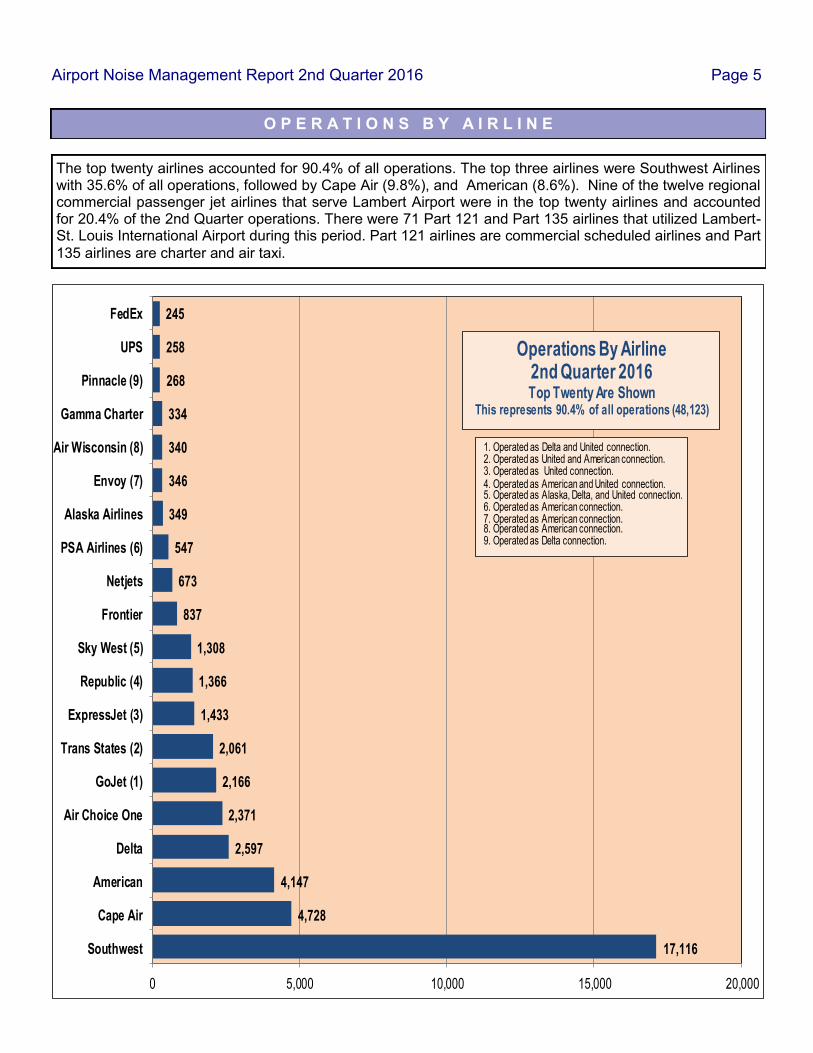
The top twenty airlines accounted for 90.4% of all operations. The top three airlines were Southwest Airlines with 35.6% of all operations, followed by Cape Air (9.8%), and American (8.6%). Nine of the twelve regional commercial passenger jet airlines that serve Lambert Airport were in the top twenty airlines and accounted for 20.4% of the 2nd Quarter operations. There were 71 Part 121 and Part 135 airlines that utilized Lambert-St. Louis International Airport during this period. Part 121 airlines are commercial scheduled airlines and Part
135 airlines are charter and air taxi.
17,116
4,728
4,147
2,597
2,371
2,166
2,061
1,433
1,366
1,308
837
673
547
349
346
340
334
268
258
245
0 5,000 10,000 15,000 20,000
Southwest
Cape Air
American
Delta
Air Choice One
GoJet (1)
Trans States (2)
ExpressJet (3)
Republic (4)
Sky West (5)
Frontier
Netjets
PSA Airlines (6)
Alaska Airlines
Envoy (7)
Air Wisconsin (8)
Gamma Charter
Pinnacle (9)
UPS
FedEx
Operations By Airline2nd Quarter 2016Top Twenty Are Shown
This represents 90.4% of all operations (48,123)
1. Operated as Delta and United connection.2. Operated as United and American connection.3. Operated as United connection.4. Operated as American and United connection.5. Operated as Alaska, Delta, and United connection.6. Operated as American connection.7. Operated as American connection.8. Operated as American connection.9. Operated as Delta connection.
Airport Noise Management Report 2nd Quarter 2016 Page 6
O P E R A T I O N S B Y T Y P E O F S E R V I C E
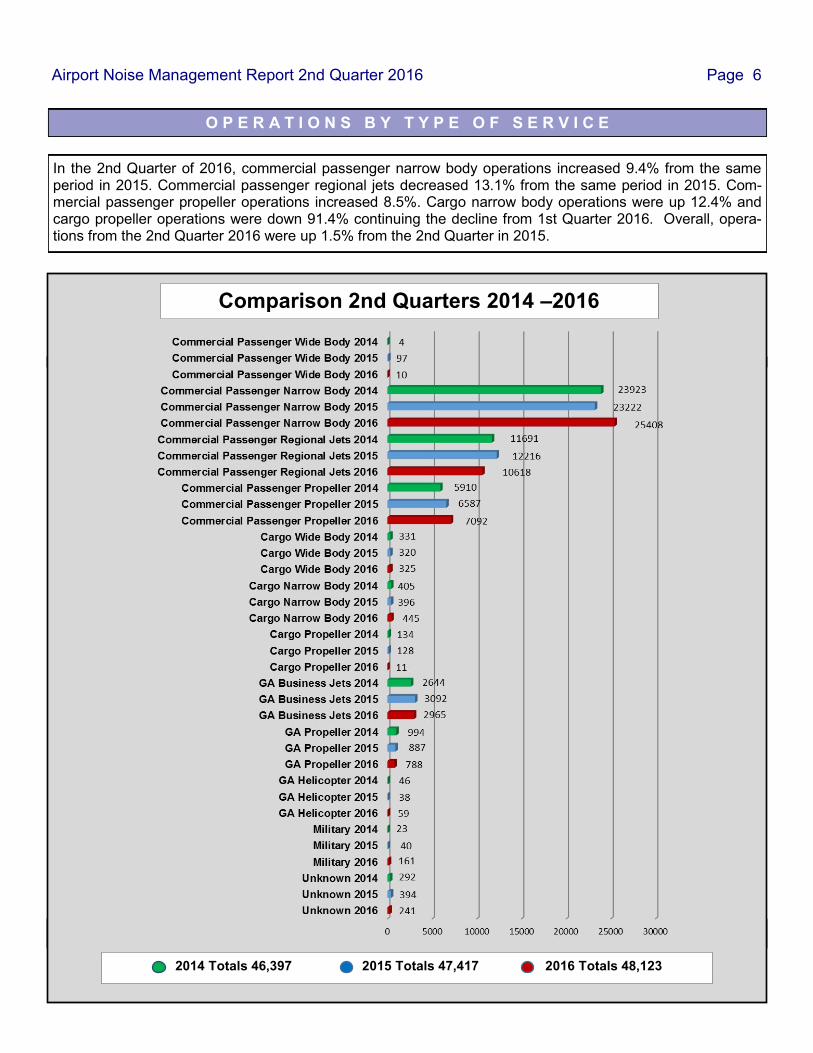
In the 2nd Quarter of 2016, commercial passenger narrow body operations increased 9.4% from the same period in 2015. Commercial passenger regional jets decreased 13.1% from the same period in 2015. Com-mercial passenger propeller operations increased 8.5%. Cargo narrow body operations were up 12.4% and cargo propeller operations were down 91.4% continuing the decline from 1st Quarter 2016. Overall, opera-tions from the 2nd Quarter 2016 were up 1.5% from the 2nd Quarter in 2015.
Comparison 2nd Quarters 2014 - 2016
Fleet
2014 Totals 46,397 2015 Totals 47,417 2016 Totals 48,123
Comparison 2nd Quarters 2014 –2016
Airport Noise Management Report 2nd Quarter 2016 Page 7
O P E R A T I O N S B Y T Y P E O F S E R V I C E
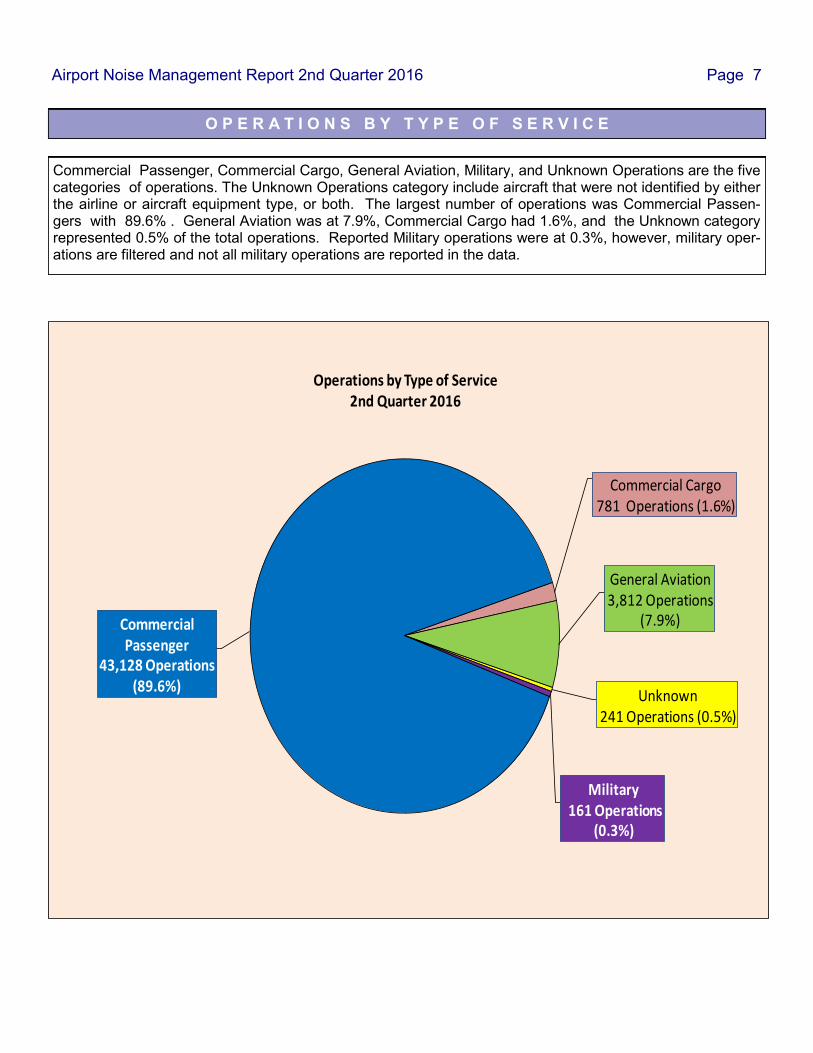
Commercial Passenger, Commercial Cargo, General Aviation, Military, and Unknown Operations are the five categories of operations. The Unknown Operations category include aircraft that were not identified by either the airline or aircraft equipment type, or both. The largest number of operations was Commercial Passen-gers with 89.6% . General Aviation was at 7.9%, Commercial Cargo had 1.6%, and the Unknown category represented 0.5% of the total operations. Reported Military operations were at 0.3%, however, military oper-ations are filtered and not all military operations are reported in the data.
Commercial Passenger
43,128 Operations (89.6%)
Commercial Cargo 781 Operations (1.6%)
General Aviation3,812 Operations
(7.9%)
Unknown241 Operations (0.5%)
Military161 Operations
(0.3%)
Operations by Type of Service2nd Quarter 2016
Airport Noise Management Report 2nd Quarter 2016 Page 8
O P E R A T I O N S B Y A I R C R A F T
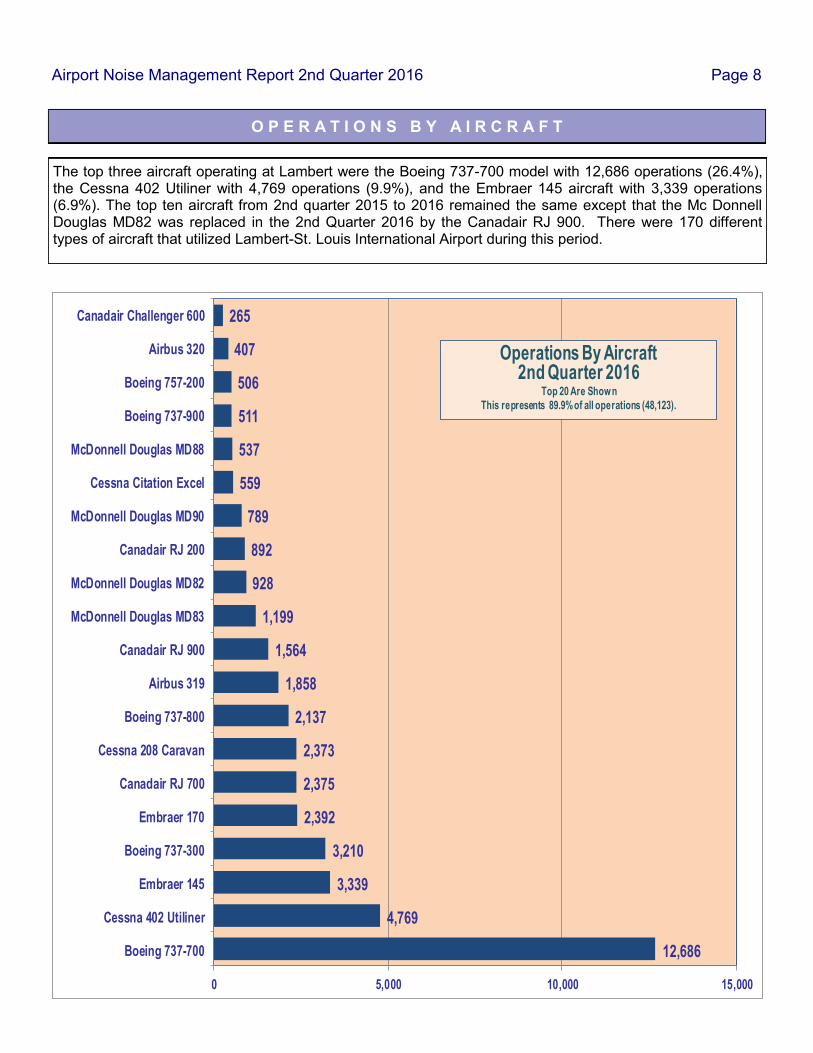
The top three aircraft operating at Lambert were the Boeing 737-700 model with 12,686 operations (26.4%), the Cessna 402 Utiliner with 4,769 operations (9.9%), and the Embraer 145 aircraft with 3,339 operations (6.9%). The top ten aircraft from 2nd quarter 2015 to 2016 remained the same except that the Mc Donnell Douglas MD82 was replaced in the 2nd Quarter 2016 by the Canadair RJ 900. There were 170 different types of aircraft that utilized Lambert-St. Louis International Airport during this period.
12,686
4,769
3,339
3,210
2,392
2,375
2,373
2,137
1,858
1,564
1,199
928
892
789
559
537
511
506
407
265
0 5,000 10,000 15,000
Boeing 737-700
Cessna 402 Utiliner
Embraer 145
Boeing 737-300
Embraer 170
Canadair RJ 700
Cessna 208 Caravan
Boeing 737-800
Airbus 319
Canadair RJ 900
McDonnell Douglas MD83
McDonnell Douglas MD82
Canadair RJ 200
McDonnell Douglas MD90
Cessna Citation Excel
McDonnell Douglas MD88
Boeing 737-900
Boeing 757-200
Airbus 320
Canadair Challenger 600
Operations By Aircraft2nd Quarter 2016
Top 20 Are Shown
This represents 89.9% of all operations (48,123).
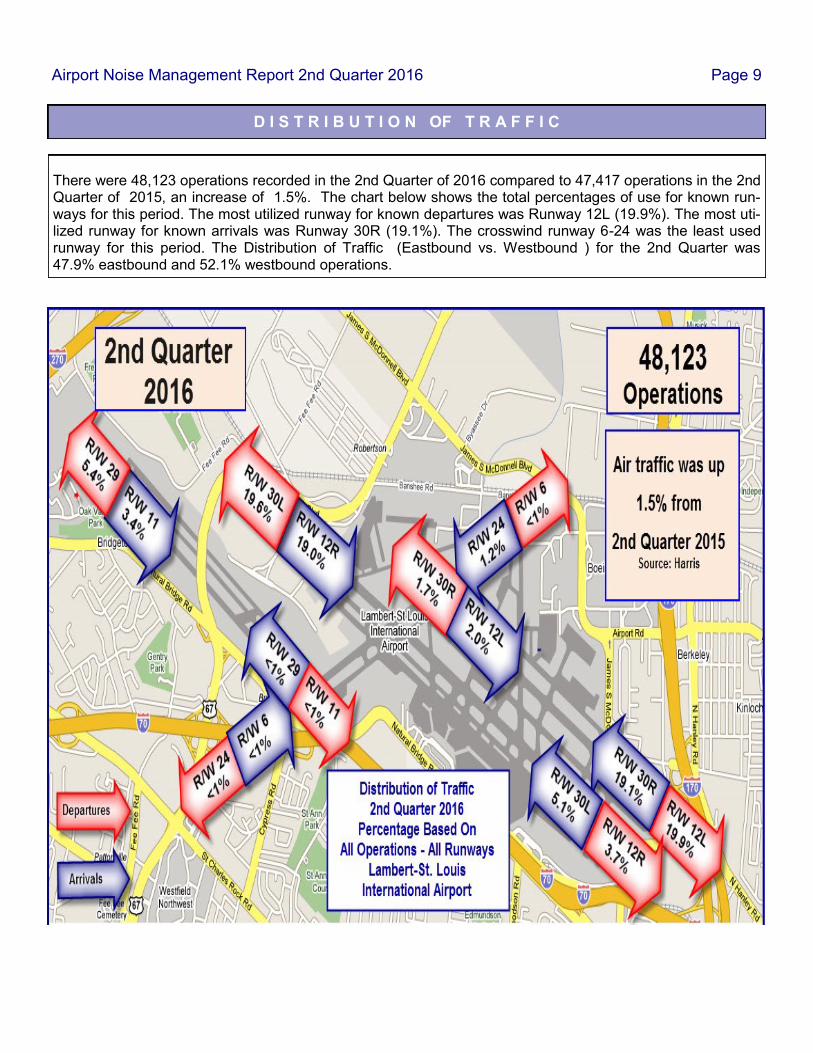
There were 48,123 operations recorded in the 2nd Quarter of 2016 compared to 47,417 operations in the 2nd Quarter of 2015, an increase of 1.5%. The chart below shows the total percentages of use for known run-ways for this period. The most utilized runway for known departures was Runway 12L (19.9%). The most uti-lized runway for known arrivals was Runway 30R (19.1%). The crosswind runway 6-24 was the least used runway for this period. The Distribution of Traffic (Eastbound vs. Westbound ) for the 2nd Quarter was 47.9% eastbound and 52.1% westbound operations.
D I S T R I B U T I O N OF T R A F F I C
Airport Noise Management Report 2nd Quarter 2016 Page 9
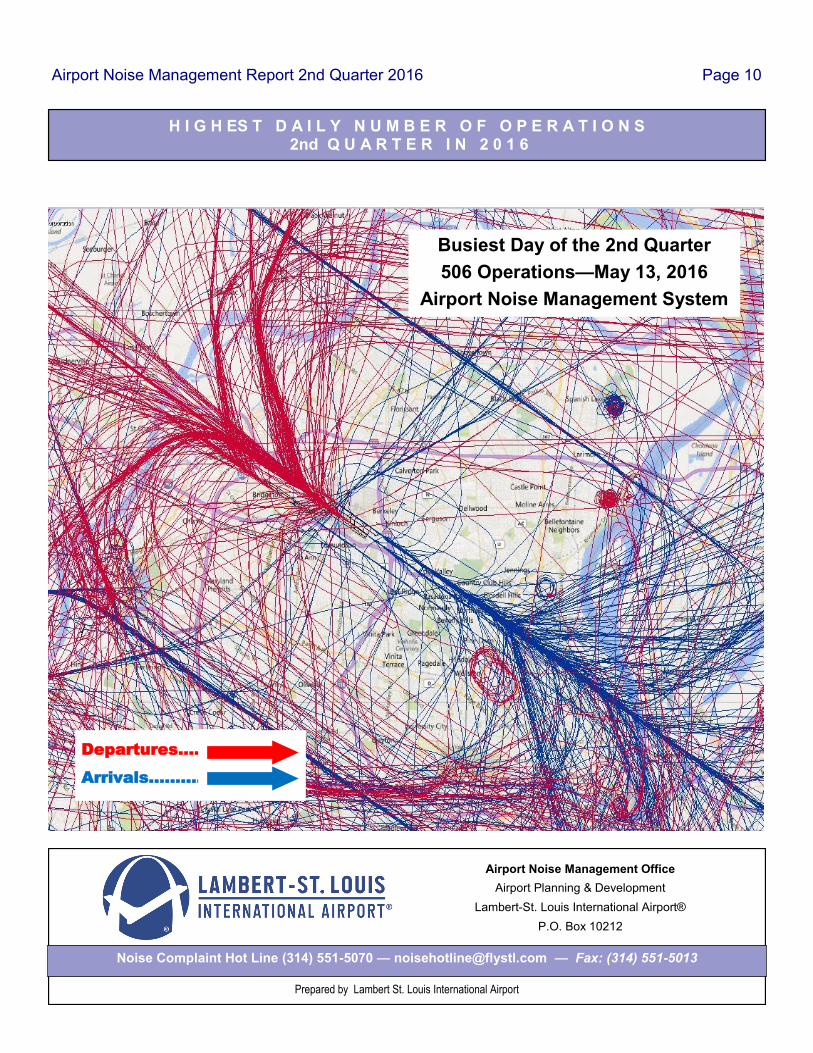
H I G H ES T D A I L Y N U M B E R O F O P E R A T I O N S 2nd Q U A R T E R I N 2 0 1 6
Airport Noise Management Report 2nd Quarter 2016 Page 10
Airport Noise Management Office
Airport Planning & Development
Lambert-St. Louis International Airport®
P.O. Box 10212
Noise Complaint Hot Line (314) 551-5070 — [email protected] — Fax: (314) 551-5013
Prepared by Lambert St. Louis International Airport
Busiest Day of the 1st Quarter
March 31, 2016
STL Traffic Only
576 Daily Operations
Red: Departures
Blue: Arrivals
Busiest Day of the 2nd Quarter
506 Operations—May 13, 2016
Airport Noise Management System
Departures…..
Arrivals……….