
AIRLINE MAINTENANCE COST EXECUTIVE …€¦ · de-identification purposes. ... Landing Gear LLP...
26
MCTF December 2017 An Exclusive Benchmark Analysis (FY2016 data) by IATA’s Maintenance Cost Task Force AIRLINE MAINTENANCE COST EXECUTIVE COMMENTARY PUBLIC VERSION
Transcript of AIRLINE MAINTENANCE COST EXECUTIVE …€¦ · de-identification purposes. ... Landing Gear LLP...
MCTFDecember 2017
An Exclusive Benchmark Analysis (FY2016 data)by IATA’s Maintenance Cost Task Force
AIRLINE MAINTENANCE COST EXECUTIVE COMMENTARY
PUBLIC VERSION

Preliminary Remarks 2
Data & Analysis Methodology 4
Definitions & Acronyms 5
1. Global Picture 6 1.1. Airline Industry Landscape in 2015 8 1.2. World Fleet 11 1.3. Maintenance, Repair & Overhaul (MRO) Market 14
2. FY2015 Snapshot 16 2.1. Fleet Overview 18 2.2. Maintenance Cost Analysis 21 2.2.1. Direct Maintenance Spend 21 2.2.2. Direct Maintenance Spend by Aircraft Category 24 2.2.3. Personnel & Overhead 26 2.3. Aircraft Leasing & Maintenance Reserves 29 2.4. Spare Parts Inventory 33
3. Analysis by Airline Group 36 3.1. Fleet Overview 38 3.2. Maintenance Cost Analysis by Airline Group 40 3.3. Aircraft Leasing & Maintenance Reserves by Airline Group 43
4. Trend Analysis 46 4.1. Fleet Overview 48 4.2. Maintenance Cost Overview 51 4.3. General Trends 56 4.4. Trend Analysis by Airline Group 58
5. Maintenance Cost Trend Analysis by Aircraft Category 62 5.1. Overview by Aircraft Category 64 5.2. Narrowbody Aircraft 66 5.3. Widebody Aircraft 68 5.4. Regional Jets 70 5.5. Turboprops 72
Annex I: MCTF Fleet vs World Fleet 74
Annex II: Base and Component Maintenance Costs by Airline 75
Annex III: Staff 76
Annex IV: Mechanics and Overhead Staff Breakdown 77
Annex V: Time Breakdown 80
Annex VI: Fleet Distribution by Aircraft Family and by Group 81
Annex VII: Operational Data by Aircraft Category 82
Table of Contents
2
Maintenance Cost Task Force (MCTF) collects maintenance cost data from airlines worldwide on an annual basis. The goals of MCTF are to provide the tools, methodology and definitions to be able to determine how much it costs an airline to maintain its fleet and be able to use the data in cases of new fleet introduction or expansion, “make vs. buy” decisions, year-over-year trends, etc.
This report is exclusively distributed to airlines that provided data for 2016 to give them an overview of the MRO market and the opportunity to benchmark against other airlines.
We are doing our maximum to present meaningful analysis and we encourage you to provide feedback on this report so we can improve it again next year.
We will send out a survey for you to provide feedback on this report and help us improve its content.
MCTF data collection is open to all airlines worldwide that would like to benchmark their cost to maintain their fleet. MCTF is open to IATA and non-IATA member airlines. MCTF is open to major, domestic, international, low-cost, regional airlines, etc.
Preliminary remarks
Preliminary Remarks
THE IMPORTANCE OF DATA QUALITY
It takes a fair amount of time for MCTF airlines to gather and submit data, and it takes a lot of effort to validate this data in order to deliver the most relevant benchmark analysis. We often need to contact airlines and ask for clarifications when numbers do not meet the quality checks set. For this initiative to remain viable and reliable, it is critical to focus on the best possible data quality. That’s why we would like to remind you of the importance of making sure your data are accurate before submitting it. For that purpose, built-in checks are included in the data collection form (on three tabs: Summary Tables, Summary Graphs and P&O Graphs) in order to help you get an overview of the main metrics (e.g. maintenance cost per flight hour, per flight cycle or per aircraft). Unscheduled events can cause dramatic impact on maintenance spend, that is why we need also as many comments to explain unusually high or low costs.
the analysis is done in USD as most of the aircraft parts are marketed in USD; therefore currency exchange rates may play a significant role in benchmarking maintenance costs, especially when substantial foreign exchange fluctuations take place.
Finally, the aircraft delivery schedule and the periodicity of the maintenance program can strongly influence costs, especially when many aircraft were delivered within a short period of time.
THE ACCEPTANCE OF DATA
This report analyzes and comments data from 49 airlines. Due to late submission, insufficient data and poor data quality, a few other airlines’ data were excluded from the analysis and report.
THE IMPORTANCE OF REPORTINGOPERATIONAL DATA
The focus of MCTF is clearly on maintenance costs, however operational data (e.g. flight hours, cycles, ASK, fleet size and fleet age) and personnel & overhead data (e.g. number of mechanics and overhead staff, time breakdown, overhead costs, etc.) are very important to calculate unit costs and KPIs.
We would like to draw your attention on the importance of reporting accurate cost data and operational data in order to get the best benchmark data and analysis possible for the benefit of the airline industry and your own airline.
THE IMPORTANCE OF DATA TREATMENT
All the MCTF analyses presented in this report use maintenance cost data as they were provided by the airlines through the standardized IATA toolset. No attempt was made to normalize the data based on any parameters such as operational severity (hours to cycle ratio, utilization, harsh environment, etc.), aircraft ageing, fleet size and commonality, labor rate, etc. Additionally, it should be noted that
4
Data & Analysis Methodology
IATA’s Maintenance Cost Task Force (MCTF) collects maintenance cost data from airlines worldwide on an annual basis.
MCTF Airlines are the carriers which participate in the annual data collection. 49 airlines reported data for FY2016, however one airline was excluded from this report, because they submitted past the deadline and/or data that did not pass the quality checks and subsequent questions to clarify data.
The data are then coded (operators are de-identified) and used as reported (i.e. without any normalization) to create this benchmark report.
All airline data are consolidated and then analyzed considering aircraft type, engine model, fleet size and age, maintenance market segments (line, components, engines, heavy checks and MOD) and elements (labor, material, subcontracted work), flight hours, cycles and geography.
All data presented in this report are de-identified. The two-digit airline codes shown in this report are unique codes given to the participating airlines for de-identification purposes. Although some of these codes may match real IATA airline codes, this is merely a coincidence. If you do not know your airline’s code, please contact us at [email protected].
Typical metrics include: cost per flight hour, cost per departure, cost per aircraft. The cost data unit is US dollar, and the length unit is kilometer.
The goals of MCTF are to provide the tools, methodology and definitions to be able to determine how much it costs an airline to maintain its fleet and be able to use the data in cases of new fleet introduction or expansion, “make vs. buy” decisions, year-over-year trends, etc.
Data & Analysis Methodology
5Definitions and Acronyms
Definitions & Acronyms
ACAircraft
AFIAfrica
AFTKAvailable Freight Tonne Kilometers
Aircraft CategoryNB, WB, RJ, TP (defined below)
Aircraft FamilyAircraft communalities (e.g. A320 Family includes A318, A319, A320, A321; 737 NG includes 737-600/700/800/900)
Aircraft Sub-CategoryNB, WB2, WB3+, RJ, TP (defined below)
ALAirline
APUAuxiliary Power Unit
ASKAvailable-Seat Kilometers
ASPACAsia Pacific
Cost ElementsMaterial, labor and outside repairs (or outsourced, used interchangeably)
Cost SegmentsLine, base, component and engine maintenance
CurrencyAll amounts in this report are in US$, unless specified otherwise.
DMCDirect Maintenance Costs
ESVEngine Shop Visit
EUREurope
FCFlight Cycle
FHFlight Hour
FLFFreight Load Factor
FTKFreight Tonne Kilometers
LATAMLatin America & The Caribbean
LGLanding Gear
LLPLife Limted Part
MCTFMaintenance Cost Task Force
MENAMiddle East & North Africa
MRMaintenance Reserves
MROMaintenance, Repair and Overhaul
MTBRMean Time Between Removals
NAMNorth America
NBNarrow-body single aisle aircraft with more than 100 seats (excludes Embraer 190/195)
PLFPassenger Load Factor
RegionsAfrica (Sub-Saharan Africa), ASPAC (Asia Pacific), MENA (Middle East & North Africa), Americas (North & South America), Europe (includes CIS), N. Asia (China, Hong Kong, Macao, Taiwan, Mongolia)
RJRegional-jets up to 100 seats (includes Embraer 190/195)
RPKRevenue-Passenger Kilometers
Supply ChainIncludes all maintenance activities performed by third party (also called “contract maintenance” or “outsourcing”) and the cost of material purchased to do work in-house
Total Maintenance CostsDMC plus overhead costs
TPTurboprops
TRThrust Reversers
UnitsK ($#,000) Thousand M ($#,000,000) Million B ($#,000,000,000) Billion
UtilizationNumber of flight hours per aircraft per day (= FH / AC / 365 days)
WACCWeighted average cost of capital
WBWide-body aircraft with more than one aisle or equivalent freighter, combination of WB2 and WB3+.
WB2Wide body aircraft equipped with two engines
WB3+Wide body aircraft equipped with three or more engines

1.3. Maintenance, Repair and Overhaul (MRO) Market
Global Picture1.1. Airline Industry Landscape in 20161.2. World Fleet
Global Picture 7
Global Picture
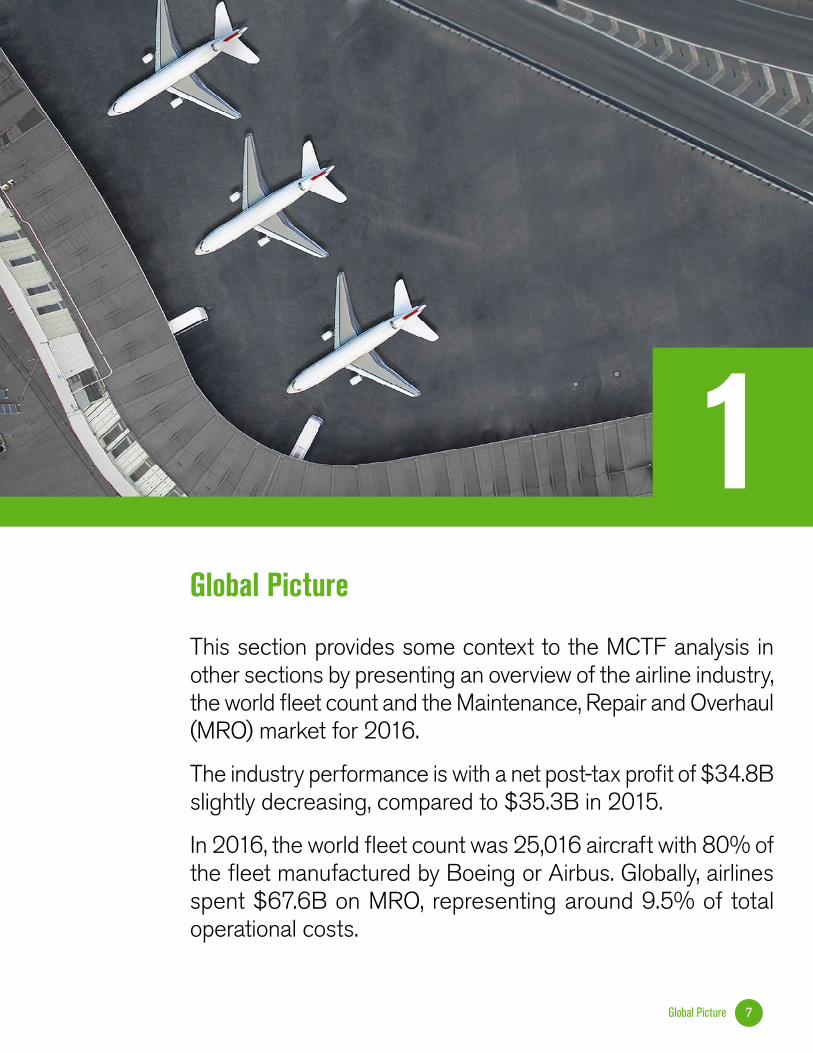
This section provides some context to the MCTF analysis in other sections by presenting an overview of the airline industry, the world fleet count and the Maintenance, Repair and Overhaul (MRO) market for 2016.
The industry performance is with a net post-tax profit of $34.8B slightly decreasing, compared to $35.3B in 2015.
In 2016, the world fleet count was 25,016 aircraft with 80% of the fleet manufactured by Boeing or Airbus. Globally, airlines spent $67.6B on MRO, representing around 9.5% of total operational costs.
1

$B/YEAR
2017
F
2016
E
2015
2014
2013
2012
2011
2010
2009
2008
2007
2006
2005
4.3
-4.1
15.0
-0.1
19.9
12.9
-8.9 -15.91.9
-4.6
21.719.2
14.0
7.5
18.4
6.1
25.3
10.6
35.1
13.7
59.5
35.3
58.3
35.6
48.5
29.8
$/BARREL
2003
2004
2005
2006
2007
2008
2009
2010
2011
2012
2013
2014
2015
2016
2017
3731
3930
5343
77
6371
52
114
98
61
43
8877
10794
130
112
128
114125
107
72
5647
37
6758
Global Picture 8
Aviation has an immeasurable impact on the world we live in, connecting people and cultures, creating opportunities and facilitating economic progress. On top of that, airlines are finally rewarding their investors as 2016 has been the second year of above WACC returns. But it should be noted that $34.8B net profit globally, while exceptional for the airline industry and the strongest financial performance on record, is only sufficient to pay investors a ‘normal’ rate of return for invested capital. Moreover, above WACC returns have only started to be generated outside North America in the past year and are still not widespread across all regions.
Collectively, the airline industry had a net post-tax profit of $34.8B, an 8.8% margin on revenues. The post-tax profit airlines generated this year is slightly down from $35.3B reported in 2015 (8.5% margin).
Jet fuel prices fell significantly during 2016. The average price of a barrel of jet fuel in 2016 was 22% lower than in the previous year (2015). Jet prices climbed to around $60 a barrel at the end of 2016, nearly twice the-year-low-point reached in Jan 2016. The annual average price of jet fuel in year 2016 has been $53.8 per barrel—still much lower than average between 2011 and 2014.
Fig. 1: Industry Net Profits Source: IATA WATS 2017
Operating result Net Result
Fig. 2: Jet Fuel Price per Barrel Annual average Source: IATA WATS 2017
Jet fuel ($ / b) Crude ($ / b)
1.1. Airline Industry Landscape in 2016

RPKs between regions of the world grew at an accelerated rate in 2016, expanding by 7.4% from previous year (2015). The pick–up in the growth trend reflects increasing demand through improvements in the global economic backdrop. The available seat kilometers (ASKs) in 2016 increased by 7.5% compared to last year.
The passenger load factor this year (2016) remained unchanged at 80.4% compared to 2015.
The breakeven load factors further decreased in 2016 due to lower fuel prices and the positive impact of increasing ancillary revenues on yields.
In contrast to passenger loads, which remained unchanged, the freight load factor dropped by 0.6 percentage points in 2016 compared to 2015. Available freight kilometers increased by 4.9% in year 2016 compared to the previous year.
Source: IATA WATS 2017

NAM4.2%
WORLD7.4%
EUR5.4%
MENA11.3%
LATAM4.5% AFI
9.4%
ASPAC10.9%
Global Picture 10
Fig. 3: RPK Growth by Route Area Source: IATA WATS 2017
AFI: AfricaASPAC: Asia Pacific
EUR: EuropeLATAM: Latin America & the Caribbean
MENA: Middle East & North AfricaNAM: North America
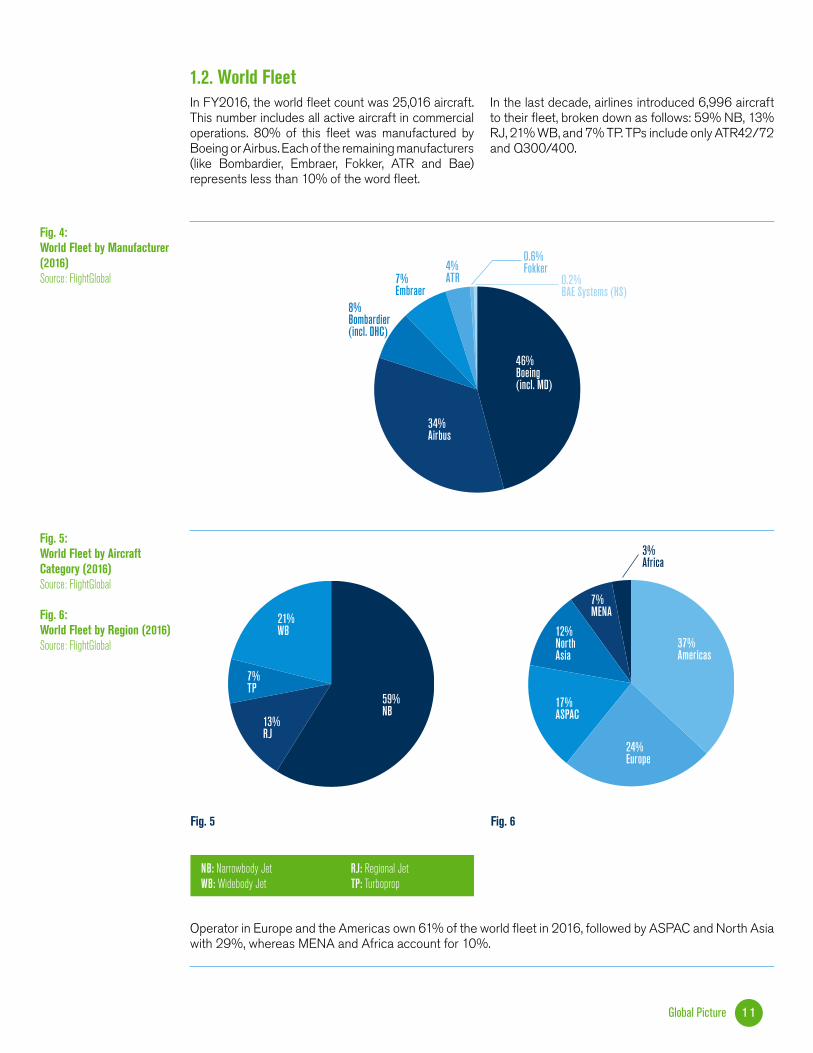
Fig. 5 Fig. 6
59%NB
13%RJ
7%TP
21%WB
3%Africa
12%NorthAsia
17%ASPAC
37%Americas
7%MENA
24%Europe
Global Picture 11
In FY2016, the world fleet count was 25,016 aircraft. This number includes all active aircraft in commercial operations. 80% of this fleet was manufactured by Boeing or Airbus. Each of the remaining manufacturers (like Bombardier, Embraer, Fokker, ATR and Bae) represents less than 10% of the word fleet.
In the last decade, airlines introduced 6,996 aircraft to their fleet, broken down as follows: 59% NB, 13% RJ, 21% WB, and 7% TP. TPs include only ATR42/72 and Q300/400.
Fig. 5: World Fleet by Aircraft Category (2016) Source: FlightGlobal
Fig. 6: World Fleet by Region (2016) Source: FlightGlobal
Fig. 4: World Fleet by Manufacturer (2016) Source: FlightGlobal
1.2. World Fleet
NB: Narrowbody JetWB: Widebody Jet
RJ: Regional JetTP: Turboprop
Operator in Europe and the Americas own 61% of the world fleet in 2016, followed by ASPAC and North Asia with 29%, whereas MENA and Africa account for 10%.
0.6%Fokker
7%Embraer
8%Bombardier (incl. DHC)
46%Boeing (incl. MD)
0.2%BAE Systems (HS)
4%ATR
34%Airbus
FH / AC, FC / AC Utilization(Hours / day)
0
500
1,000
1,500
2,000
2,500
3,000
2016201520142013201220112010200920082007
6
7
8
9
10
11
122,696 2,601
1,413 1,293
7.397.13
Global Picture 12
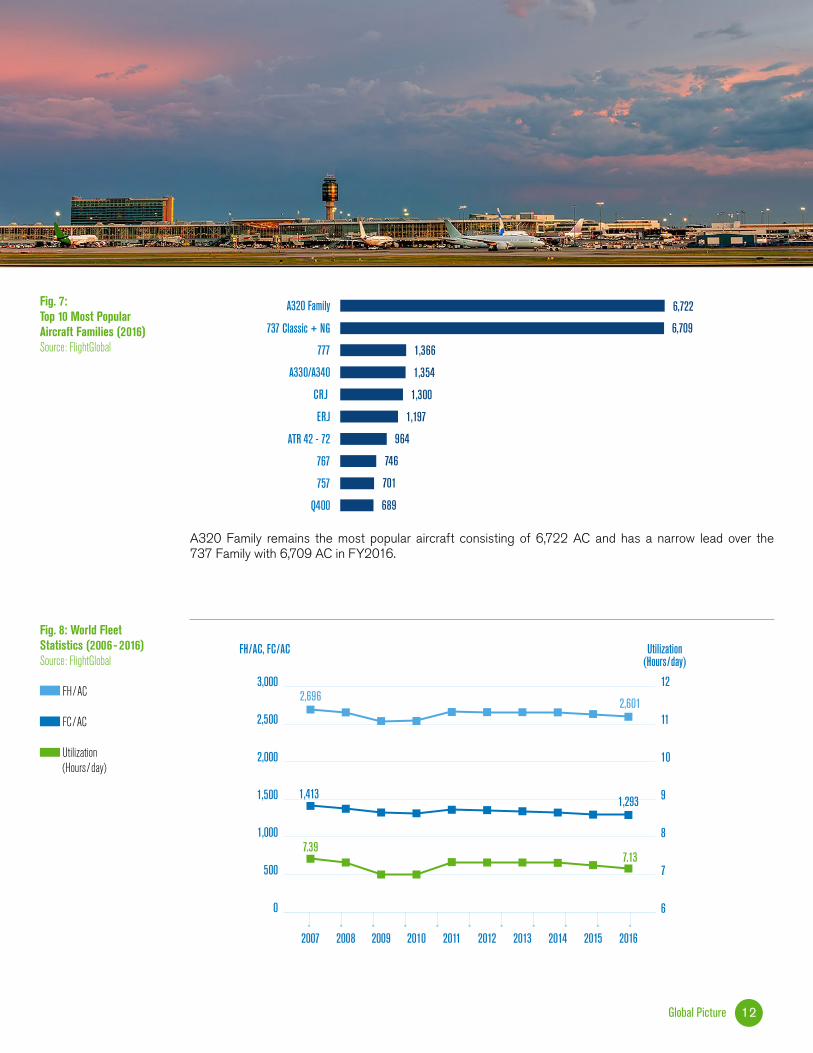
Fig. 7: Top 10 Most Popular Aircraft Families (2016) Source: FlightGlobal
Fig. 8: World Fleet Statistics (2006 - 2016) Source: FlightGlobal
FH / AC
FC / AC
Utilization (Hours / day)
A320 Family remains the most popular aircraft consisting of 6,722 AC and has a narrow lead over the 737 Family with 6,709 AC in FY2016.
A320 Family 6,722
737 Classic + NG 6,709
777 1,366
A330/A340 1,354
CRJ 1,300
ERJ 1,197
ATR 42 - 72 964
767 746
757 701
Q400 689
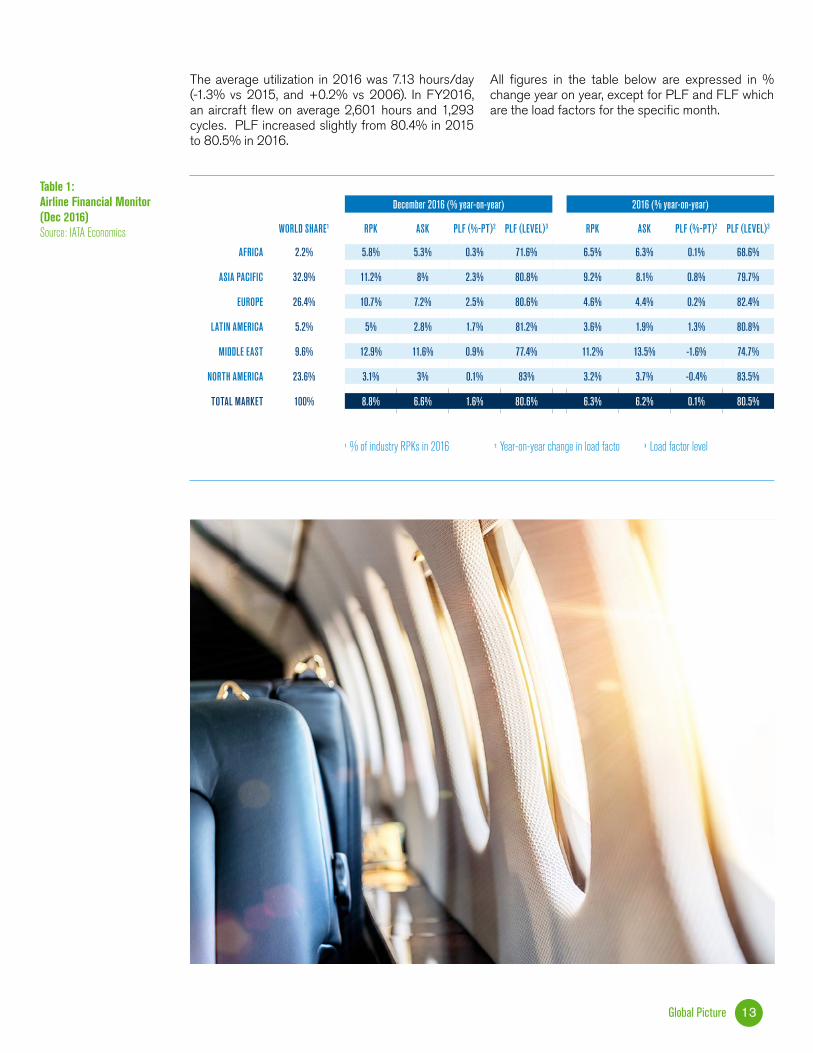
1 % of industry RPKs in 2016 2 Year-on-year change in load facto 3 Load factor level
Global Picture 13
Table 1: Airline Financial Monitor (Dec 2016) Source: IATA Economics
The average utilization in 2016 was 7.13 hours/day (-1.3% vs 2015, and +0.2% vs 2006). In FY2016, an aircraft flew on average 2,601 hours and 1,293 cycles. PLF increased slightly from 80.4% in 2015 to 80.5% in 2016.
All figures in the table below are expressed in % change year on year, except for PLF and FLF which are the load factors for the specific month.
December 2016 (% year-on-year) 2016 (% year-on-year)
WORLD SHARE1 RPK ASK PLF (%-PT)2 PLF (LEVEL)3 RPK ASK PLF (%-PT)2 PLF (LEVEL)3
AFRICA 2.2% 5.8% 5.3% 0.3% 71.6% 6.5% 6.3% 0.1% 68.6%
ASIA PACIFIC 32.9% 11.2% 8% 2.3% 80.8% 9.2% 8.1% 0.8% 79.7%
EUROPE 26.4% 10.7% 7.2% 2.5% 80.6% 4.6% 4.4% 0.2% 82.4%
LATIN AMERICA 5.2% 5% 2.8% 1.7% 81.2% 3.6% 1.9% 1.3% 80.8%
MIDDLE EAST 9.6% 12.9% 11.6% 0.9% 77.4% 11.2% 13.5% -1.6% 74.7%
NORTH AMERICA 23.6% 3.1% 3% 0.1% 83% 3.2% 3.7% -0.4% 83.5%
TOTAL MARKET 100% 8.8% 6.6% 1.6% 80.6% 6.3% 6.2% 0.1% 80.5%

17%Line
22%Base
22%Components
39%Engines
4%Africa
8%MENA
26%Europe
30%Asia
32%Americas
Global Picture 14
Fig. 9: World MRO Spend by Segment (2016) Source: ICF International Global MRO Forecast
Fig. 10: World MRO Spend by region (2016) Source: ICF International Global MRO Forecast
Global MRO spend in 2016 was valued at $67.6B, excluding overhead*. This represented around 9.5% of airlines operational costs.
With a 5.1% increase per annum, the market size is estimated to reach $100.6B in 2026.
1.3. Maintenance, Repair and Overhaul (MRO) Market
*Please note that these numbers approximate the airline industry's direct maintenance cost. The overhead cost of airline technical operational management, the logistics cost related to material management and any other overhead have been excluded from these numbers as well as any depreciation of spare parts.

2016$67.6B
40%
22% 21%17%
LINE
BASE
COMP
ENGIN
E
2026$100.6B
41%
22% 21%16%
LINE
BASE
COMP
ENGIN
E
Global Picture 15
Fig. 11: World MRO Market Forecast (2016-2026)Source: ICF International Global MRO Forecast
THE MAJOR TRENDS OF THE INDUSTRYInvestments in new-generation aircraft with advanced technology are still the major trend which results in:
• Rapidly increasing share of Narrow Body aircraft compared to the other classes,
• Share of new technology aircraft (e.g.: A320neo, B737MAX, A330neo, A350 and B787) reaching up to 58% of the fleet share by 2027,
• Focus on operational efficiency resulting in optimized on-time performance,
• Decreasing operational costs due to enhanced efficiency,
• Digitalization of aircraft operations,
• Common use of big data analytics to support maintenance program and planning (predictive maintenance),
• Widespread use of materials such as carbon fiber composites, hybrid alloys, special coating
• Increased importance of cabin interiors modifications to offer the minimum standards such as premium economy class, onboard Wi-Fi, latest lie-flat seats, etc.
• Changes in maintenance program and planning by “slicing” heavy maintenance work packages and including them in line maintenance to optimize aircraft availability
SOME CHALLENGES AHEAD• Lack of capable systems for big data analysis
• Increasing need to modify/update older aircraft with new technologies in the fleet to avoid complex maintenance program and planning
NEW BUZZ WORD: BLOCKCHAINBlockchain is a shared ledger recording digital transactions and processes within a secure network. It is considered as incorruptible, permanent, verifiable and consensual which makes it one of the preferred solutions for paperless aircraft operations.
Blockchain would allow quick reception of updates, and would facilitate the transfer of aircraft between operators.
EXTERNAL FACTORAgreements of OPEC and other oil producers to decrease the production and thereby raise the oil price
Sources: 2017 Aerospace Services Market Outlook - Boeing (2017)Airline Economic Analysis - Oliver Wyman (2017)Applying Blockchain to MRO - MRO Network (Aug 2017) Aviation Week MRO Trends (Dec 2016)A vision for Blockchain Technologies in Paperless Operations - JetStar Airways (Nov 2017)Blockchain in MRO Could Happen Sooner Than you think - Inside MRO (Aug 2017)FlightGlobal Data (October 2017)Global Fleet & MRO Market Forecast - Oliver Wyman (2017)IATA Economics (Dec 2016)International Global MRO Forecast - ICF (Jan 2017)MRO Market Update & Industry Trends – ICF (Jan 2017)
2.1. Fleet Overview2.2. Maintenance Cost Analysis 2.2.1. Direct Maintenance Spend 2.2.2. Direct Maintenance Spend by Aircraft Category 2.2.3. Personnel & Overhead2.3. Aircraft Leasing & Maintenance Reserves2.4. Spare Parts Inventory
FY2016 Snapshot
FY2016 Snapshot — 49 Airlines 17
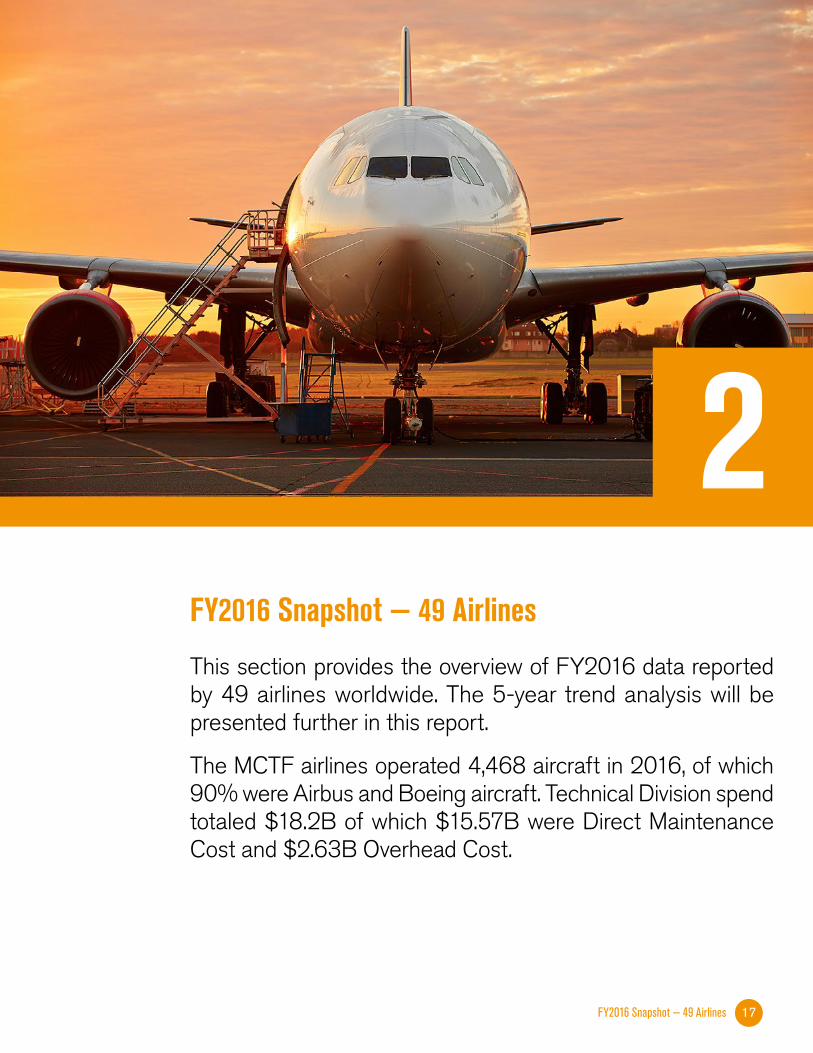
FY2016 Snapshot — 49 Airlines
This section provides the overview of FY2016 data reported by 49 airlines worldwide. The 5-year trend analysis will be presented further in this report.
The MCTF airlines operated 4,468 aircraft in 2016, of which 90% were Airbus and Boeing aircraft. Technical Division spend totaled $18.2B of which $15.57B were Direct Maintenance Cost and $2.63B Overhead Cost.
2

EUROPE (includes CIS)
AL 14 (29%)AC 734 (16%)
AGE 11.0UTIL 8.8
AMERICAS: North & South America
AL 12 (24%)AC 1,680 (38%)
AGE 8.4UTIL 8.4
AFRICA Sub-Saharan Africa
AL 3 (6%)AC 97 (2%)
AGE 8.7UTIL 8.5
MENA Middle East & North Africa
AL 5 (10%)AC 478 (11%)
AGE 6.2UTIL 10.6
ASPAC Asia Pacific
AL 11 (22%)AC 1,114 (25%)
AGE 9.1UTIL 9.0
N. ASIA China, Hong Kong, Macao, Taiwan and Mongolia
AL 4 (8%)AC 365 (8%)
AGE 8.3UTIL 9.3
FY2016 Snapshot — 49 Airlines 18
2.1. Fleet OverviewIn FY2016, the MCTF fleet had 4,468 aircraft, which represented 18% of the world’s fleet.
The MCTF airline fleet size ranged from 1 to over 600 aircraft with an average fleet age of 8.8 years. They flew a total of 14.5 million flight hours, and 5.9 million flight cycles. 15 airlines operated both passenger and freighter aircraft.
Table 2: Fleet Distribution by Region (FY2016 — 49 Airlines)
AL: Airline
AC: Aircraft
Age: Average Fleet Age (years)
Util: Utilization (Hours / Day)
264 A/C 5.9%
16 A/C 0.36%
2,396 A/C 53.6%
1,611 A/C 36.1%
101 A/C 2.3%
61 A/C 1.4%
19 A/C 0.4%
FY2016 Snapshot — 49 Airlines 19
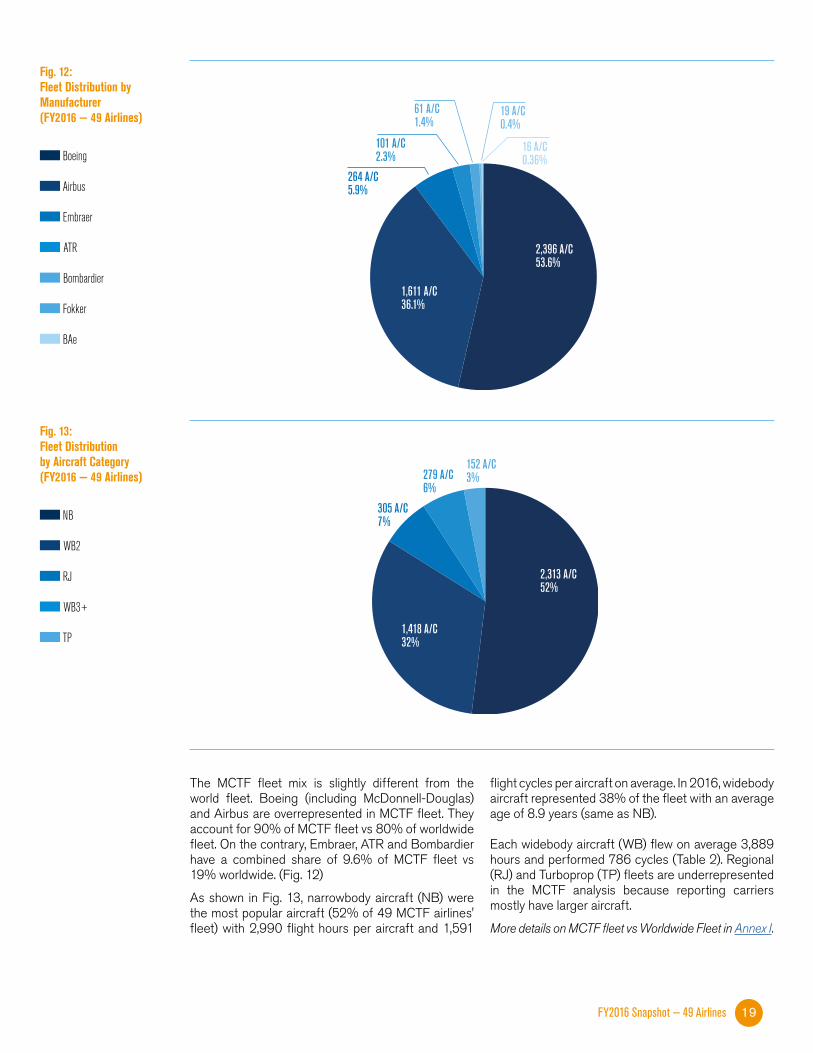
Fig. 12: Fleet Distribution by Manufacturer (FY2016 — 49 Airlines)
Boeing
Airbus
Embraer
ATR
Bombardier
Fokker
BAe
Fig. 13: Fleet Distribution by Aircraft Category (FY2016 — 49 Airlines)
NB
WB2
RJ
WB3+
TP
The MCTF fleet mix is slightly different from the world fleet. Boeing (including McDonnell-Douglas) and Airbus are overrepresented in MCTF fleet. They account for 90% of MCTF fleet vs 80% of worldwide fleet. On the contrary, Embraer, ATR and Bombardier have a combined share of 9.6% of MCTF fleet vs 19% worldwide. (Fig. 12)
As shown in Fig. 13, narrowbody aircraft (NB) were the most popular aircraft (52% of 49 MCTF airlines' fleet) with 2,990 flight hours per aircraft and 1,591
flight cycles per aircraft on average. In 2016, widebody aircraft represented 38% of the fleet with an average age of 8.9 years (same as NB).
Each widebody aircraft (WB) flew on average 3,889 hours and performed 786 cycles (Table 2). Regional (RJ) and Turboprop (TP) fleets are underrepresented in the MCTF analysis because reporting carriers mostly have larger aircraft.
More details on MCTF fleet vs Worldwide Fleet in Annex I.
152 A/C 3%
2,313 A/C 52%
1,418 A/C 32%
305 A/C 7%
279 A/C 6%
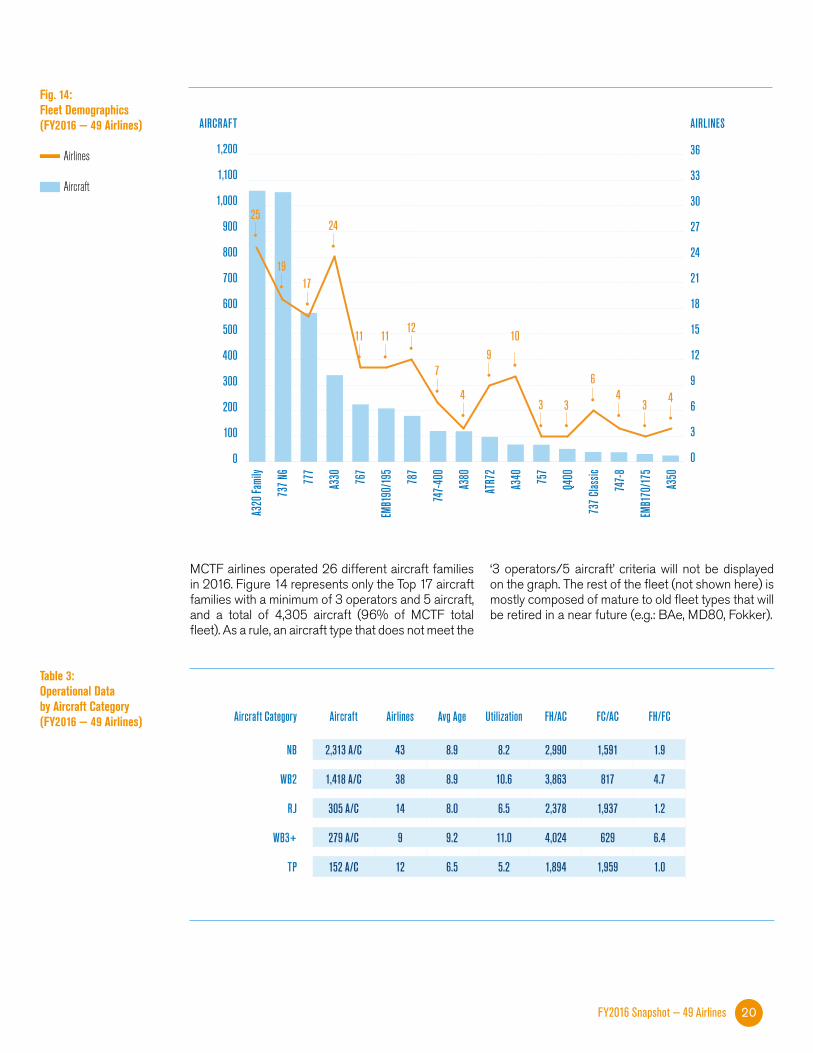
Aircraft Category Aircraft Airlines Avg Age Utilization FH/AC FC/AC FH/FC
NB 2,313 A/C 43 8.9 8.2 2,990 1,591 1.9
WB2 1,418 A/C 38 8.9 10.6 3,863 817 4.7
RJ 305 A/C 14 8.0 6.5 2,378 1,937 1.2
WB3+ 279 A/C 9 9.2 11.0 4,024 629 6.4
TP 152 A/C 12 6.5 5.2 1,894 1,959 1.0
0
100
200
300
400
500
600
700
800
900
1,000
1,100
1,200
A320
Fami
ly
737 N
G
777
A330 76
7
EMB1
90/19
5
787
747-4
00
A380
ATR7
2
A340 75
7
Q400
737 C
lassic
747-8
EMB1
70/17
5
A350
AIRCRAFT AIRLINES
36
33
30
27
24
21
18
15
12
9
6
3
0
25
1917
24
11 1112
7
4
910
3 3 34 4
6
FY2016 Snapshot — 49 Airlines 20
MCTF airlines operated 26 different aircraft families in 2016. Figure 14 represents only the Top 17 aircraft families with a minimum of 3 operators and 5 aircraft, and a total of 4,305 aircraft (96% of MCTF total fleet). As a rule, an aircraft type that does not meet the
‘3 operators/5 aircraft’ criteria will not be displayed on the graph. The rest of the fleet (not shown here) is mostly composed of mature to old fleet types that will be retired in a near future (e.g.: BAe, MD80, Fokker).
Fig. 14:Fleet Demographics (FY2016 — 49 Airlines)
Airlines
Aircraft
Table 3: Operational Data by Aircraft Category (FY2016 — 49 Airlines)

Minimum Average Maximum
Aircraft/Airline 1 91 608
Cost/Airline $3.2M $318M $1,681M
Cost/Flight Hour $0 $1,071 $5,367
Cost/Flight Cycle $0 $2,637 $46,956
Cost/Aircraft $0.0M $3.5M $19.4M
2012$14.19B (46 Airlines)
2016$15.57B(49 Airlines)
ENGINE42%
COMPONENT22%
BASE16%
LINE20%
ENGINE41%
COMPONENT23%
BASE15%
LINE21%
FY2016 Snapshot — 49 Airlines 21
Table 4:Direct Maintenance Cost - Unit Costs (FY2016 — 49 Airlines)
Fig. 15: Evolution of Direct Maintenance Cost Structure by Segment (FY2012 & FY2016)
In FY2016, MCTF airlines reported a total of $18.2B for their technical division spend: this is $15.57B for direct maintenance cost (reported by 49 airlines) and $2.63B for overhead (reported by 43 airlines).
$15.57B represent almost 23% of the world MRO spend (Fig. 15) for 18% of the world fleet. This may be explained by the fact that MCTF fleet is skewed
towards higher gauge aircraft (38% WB in MCTF fleet vs 21% in world fleet).
They employed a total of 34,733 mechanics (reported by 33 airlines) and 22,196 OH staff (reported by 43 airlines).
Staffing and overhead (OH) are analyzed separately in Section 2.2.3.
2.2.1. Direct Maintenance Spend The 49 MCTF airlines reported $15.57B for their direct maintenance costs, the average maintenance costwas $318M per airline, $1,071 per flight hour, $2,637 per flight cycle and $3.5M per aircraft.
2.2. Maintenance Cost Analysis
Engine and components remain the highest cost segments with respectively 41% and 23% of maintenance costs (Fig. 15).
Abnormal values are the result of periodic maintenance effects, redelivery costs etc.
For more information on Component Maintenance Cost Management go to the download section on the MCTF webpage.
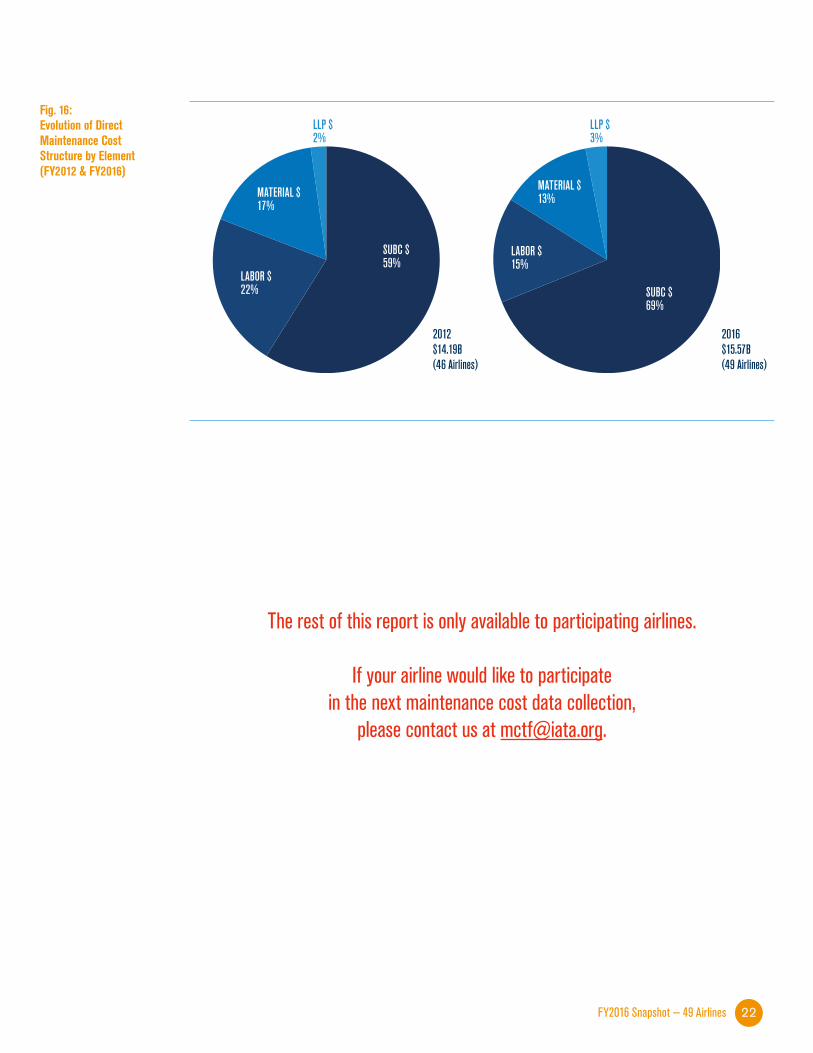
LLP $2%
MATERIAL $17%
LABOR $22%
SUBC $59%
LLP $3%
MATERIAL $13%
LABOR $15%
SUBC $69%
2012$14.19B (46 Airlines)
2016$15.57B(49 Airlines)
FY2016 Snapshot — 49 Airlines 22
Fig. 16: Evolution of Direct Maintenance Cost Structure by Element (FY2012 & FY2016)
The rest of this report is only available to participating airlines.
If your airline would like to participate in the next maintenance cost data collection,
please contact us at [email protected].