Deregulation of the Airline Computer Reservation Systems ...
Journal of Air Law and Commerce Journal of Air Law and Commerce
Volume 50 Issue 2 Article 4
1985
Airline Deregulation: Another Look Airline Deregulation: Another Look
Edward A. Morash
Recommended Citation Recommended Citation Edward A. Morash, Airline Deregulation: Another Look, 50 J. AIR L. & COM. 253 (1985) https://scholar.smu.edu/jalc/vol50/iss2/4
This Article is brought to you for free and open access by the Law Journals at SMU Scholar. It has been accepted for inclusion in Journal of Air Law and Commerce by an authorized administrator of SMU Scholar. For more information, please visit http://digitalrepository.smu.edu.
AIRLINE DEREGULATION: ANOTHER LOOK
BY
DR. EDWARD A. MORASH*
I. INTRODUCTION
INCE OVER FIVE years have elapsed from the passageof the Airline Deregulation Act of 1978 (Act)' and
since the Civil Aeronautics Board (CAB) went out of exist-ence on January 1, 1985,2 the time has come to take an-other look at the effects of airline deregulation. The Actrepresented the culmination of a long debate over the effi-cacy of CAB regulation of the airline industry, particularlyin regard to rates and market entry.3 This legislation sub-stituted a new policy of open entry and flexible pricing forthe airlines while gradually phasing out the CAB.4 Theproponents of deregulation believed that under such apolicy, the airlines would become more efficient and prof-itable, airline labor would gain more employment oppor-tunities, and consumers would benefit from lower fares. 5
The initial experiences under deregulation were quite
* Assistant Professor of Transportation Law; Graduate School of Management,College of Business Administration; Kent State University.
Airline Deregulation Act of 1978, Pub. L. No. 95-504, 92 Stat. 1705 (1978)(amending Federal Aviation Act of 1958, 49 U.S.C. §§ 1301-1542 (1982)).
2 Airline Deregulation Act of 1978, 49 U.S.C. § 1551(a) (1982).3 The Autumn 1975 issue of theJOURNAL OF AIR LAW & COMMERCE was devoted
to this debate. See 41 J. AIR L. & COM. 573, 573-883 (1975).Under the "sunset provisions" of the Act, the CAB's authority over routes
expired on December 31, 1981, it's control over rates and mergers ended on Jan-uary 1, 1983, and the CAB itself went out of existence onJanuary 1, 1985. See 49U.S.C. § 1551(a) (1982).
5 See, e.g., Rakowski & Johnson, Airline Deregulation: Problems and Prospects, 19 Q.REV. ECON. & Bus. 69, 77 (1979); Miller, A Perspective on Airline Regulatory Reform,41 J. AIR L. & CoM. 679 (1975); Simat, Helliesen, & Eicher, The Effects of Route
253
254 JOURNAL OF AIR LA WAND COMMERCE [50
favorable.6 Airline load factors increased substantiallyfollowing the Act, and airline profitability by the end of1978 reached its highest level in over thirty years.7
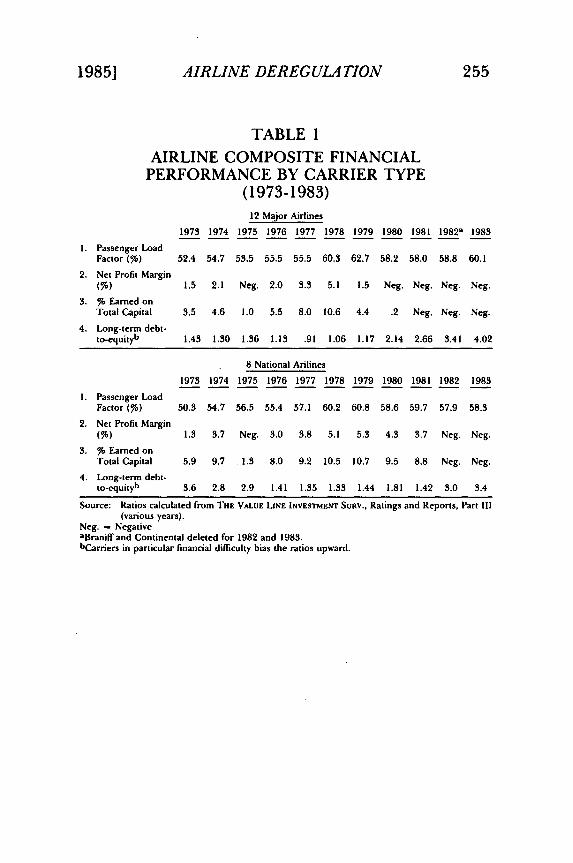
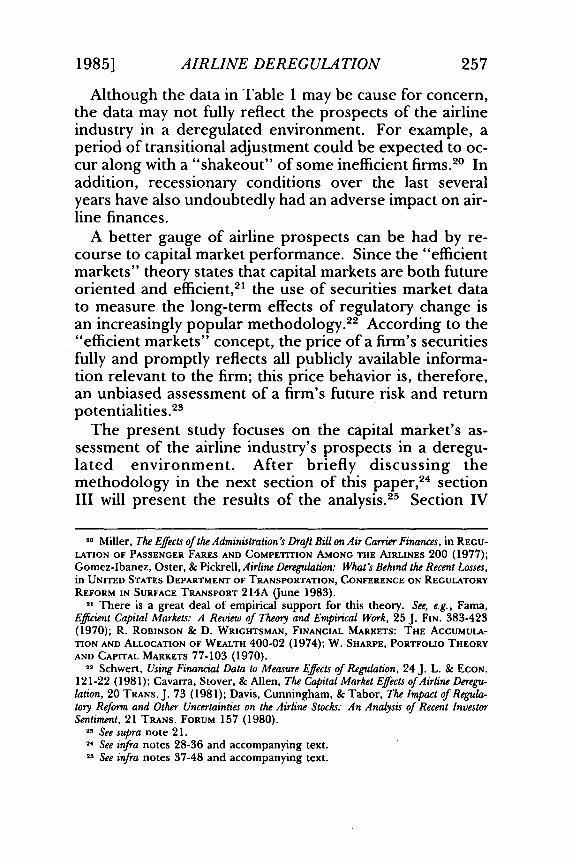
Although profitability for major airlines fell off in 1979(Table 1), the major airlines continued to institute moreefficient practices and to improve load factors.8 Further-more, the smaller national airlines9 continued to enjoyrecord profits through 1981 (Table 1). In fact, during thisperiod it was also becoming apparent that the nationalswere gaining significant market shares at the expense ofthe majors. Thus, by 1982 the nationals held 13 percentof the American market compared to 8 percent in pre-de-regulation periods,' 0 a development which some observ-ers considered favorable."
Despite the early successes of deregulation, the 1980'sbrought serious doubts about the desirability of completederegulation.' 2 Table 1 shows that although both the ma-
Restriction Removal and Discretionary Authority, REGULATION OF PASSENGER FARES AND
COMPETITION AMONG THE AIRLINES 177 (1977).6 AIRLINE DEREGULATION: THE EARLY EXPERIENCE U. Meyer & C. Oster, Jr. eds.
1982); Breyer & Stein, Airline Deregulation: The Anatomy of Reform, in INSTEAD OFREGULATION, 28, 31-33 (R. Poole, Jr. ed. 1982); Cohen, New Air Service and Deregu-lation: A Study in Transition, 44J. AIR L. & COM. 695, 697 (1979).
7 Breyer & Stein, supra note 6, at 9.a One of the efficiency-oriented developments in the aftermath of deregulation
has been the evolution of air carriers toward "hub systems." See STANDARD AND
POOR'S INDUSTRY SURVEYS, Aerospace and Air Transport, Basic Analysis, A32 (Dec. 1,1983) [hereinafter cited as INDUSTRY SURVEYS].
9 As a result of the structural changes that occurred in the industry after dereg-ulation, the CAB in 1981 altered its classification system for air carriers. For themost part, "trunk" carriers are now classified as "major airlines" while the former"local service" carriers are reclassified as "national carriers" (see Table 5 for ex-amples). More specifically, the CAB defined "major airlines" as those with annualrevenues in excess of $1 billion while "national airlines" are those carriers withannual revenues between $75 million and $1 billion. For a discussion of this clas-sification system, see AIRLINE ECONOMICS xxiv (G. James ed. 1982).
10 INDUSTRY SURVEYS, supra note 8, at 32.
1 Graham & Kaplan, Airline Deregulation is Working, REGULATION, May-June1982, at 26.
12 See, e.g., Rose, Three Years After Airline Passenger Deregulation in the United States:
A Report Card on Trunkline Carriers, 21 TRANS. J. 51, 57 (1981); Farris, The MultipleMeanings and Goals of Deregulation: A Commentary, 21 TRANSJ. 44, 49 (198 1);James,The Coming Decade in Commercial Aviation, in AIRLINE ECONOMICS 190 (G. James ed.1982).
1985]
Passenger LoadFactor (%)
Net Profit Margin(%)% Earned onTotal Capital
Long-term debt-to-equityb
1973
52.4
1.5
3.5
1.43
12 Major Airlines
1975 1976 1977 1978
53.5 55.5 55.5 60.3
Neg. 2.0 3.3 5.1
1.0 5.5 8.0 10.6
1.36 1.13 .91 1.06
1979
62.7
1.5
4.4
1.17
1981 1982a
1983
58.0 58.8 60.1
Neg. Neg. Neg.
Neg. Neg. Neg.
2.66 3.41 4.02
8 National Arilines
1973 1974 1975 1976 1977 1978 1979 1980 1981 1982 1983
1. Passenger LoadFactor (%) 50.3 54.7 56.5 55.4 57.1 60.2 60.8 58.6 59.7 57.9 58.3
2. Net Profit Margin(%) 1.3 3.7 Neg. 3.0 3.8 5.1 5.3 4.3 3.7 Neg. Neg.
3. % Earned onTotal Capital 5.9 9.7 1.3 8.0 9.2 10.5 10.7 9.5 8.8 Neg. Neg.
4. Long-term debt-to-equityb 3.6 2.8 2.9 1.41 1.35 1.33 1.44 1.81 1.42 3.0 3.4
Source: Ratios calculated from THE VALUE LINE INVESTMENT Suav., Ratings and Reports, Part III(various years).
Neg. = NegativeaBraniff and Continental deleted for 1982 and 1983.bCarriers in particular financial difficulty bias the ratios upward.
AIRLINE DEREG ULA TION
TABLE 1
AIRLINE COMPOSITE FINANCIALPERFORMANCE BY CARRIER TYPE
(1973-1983)
255
256 JOURNAL OF AIR L1A WAND COMMERCE
jor and national carriers have continued to exhibit highload factors13 in the post-deregulation period, the majorshave experienced four years of negative profit margins aswell as negative or nonexistent earnings on total investedcapital. Furthermore, for 1982 and 1983, the small na-tionals have also lapsed into the non-profit category (Ta-ble 1) with indications that the majors are now meetingthe nationals head-on in the latter's markets.' 4 The mostrecent 1982-1983 airline performance is particularlytroubling since fuel costs steadily declined during this pe-riod,' 5 since airlines obtained significant wage conces-sions from labor,' 6 and since the economy steadilyimproved.1
7
The recent post-deregulation period has also brought aserious deterioration in the capital structures of the majorand national airlines. Thus, Table 1 shows that by 1982and 1983, both major and national airlines had recordlevels of long-term debt in their capital structures.Although an airline debt to equity ratio of 1 to 1 is oftenconsidered desirable,' 8 in 1983 the majors (excludingBraniff and Continental) had an average ratio of over 4 to1, while the nationals had a ratio of over 3 to 1. Further-more, unlike the pre-deregulation period, the majors,which handle the bulk of industry traffic, now have ahigher debt ratio than the nationals (see Table 1).19
13 Load factor is defined as the percentage of seats occupied by revenue passen-gers in an airplane in relation to the total seats available for loading. See Brenner,The Significance of Airline Passenger Load Factors, in AIRLINE ECONOMICS 35 (G. Jamesed. 1982).
14 In addition, airlines are becoming less cooperative with their computerizedreservation systems. See INDUSTRY SURVEYS, supra note 8, at A34.
15 The decline in fuel prices began in the middle of 1981 and since then hasdeclined about 20 percent to eighty-five cents per gallon as of August 1983. See id.at A29.
16 Id. at A42-A43.17 id. at A29.18 Id. at A40.19 While some observers might consider firm capital structure as a management
policy variable, it is also true that managerial policy decisions are constrained byenvironmental conditions and available choices. See Gritta, Bankruptcy Risks Facingthe Major U.S. Airlines, 48J. AIR L. & COM. 89, 91-97 (1982); N. TANEJA, AIRLINESIN TRANSITION 176-78 (1981).
[50
AIRLINE DEREG ULA TION
Although the data in Table 1 may be cause for concern,the data may not fully reflect the prospects of the airlineindustry in a deregulated environment. For example, aperiod of transitional adjustment could be expected to oc-cur along with a "shakeout" of some inefficient firms. ° Inaddition, recessionary conditions over the last severalyears have also undoubtedly had an adverse impact on air-line finances.
A better gauge of airline prospects can be had by re-course to capital market performance. Since the "efficientmarkets" theory states that capital markets are both futureoriented and efficient,2 1 the use of securities market datato measure the long-term effects of regulatory change isan increasingly popular methodology. 22 According to the"efficient markets" concept, the price of a firm's securitiesfully and promptly reflects all publicly available informa-tion relevant to the firm; this price behavior is, therefore,an unbiased assessment of a firm's future risk and returnpotentialities. 2
The present study focuses on the capital market's as-sessment of the airline industry's prospects in a deregu-lated environment. After briefly discussing themethodology in the next section of this paper,24 sectionIII will present the results of the analysis.2 5 Section IV
20 Miller, The Effects of the Administration's Draft Bill on Air Carrier Finances, in REGU-
LATION OF PASSENGER FARES AND COMPETITION AMONG THE AIRLINES 200 (1977);Gomez-Ibanez, Oster, & Pickrell, Airline Deregulation: What's Behind the Recent Losses,in UNITED STATES DEPARTMENT OF TRANSPORTATION, CONFERENCE ON REGULATORYREFORM IN SURFACE TRANSPORT 214A (June 1983).
21 There is a great deal of empirical support for this theory. See, e.g., Fama,Efficient Capital Markets: A Review of Theory and Empirical Work, 25 J. FIN. 383-423(1970); R. ROBINSON & D. WRIGHTSMAN, FINANCIAL MARKETS: THE ACCUMULA-TION AND ALLOCATION OF WEALTH 400-02 (1974); W. SHARPE, PORTFOLIO THEORYAND CAPITAL MARKETS 77-103 (1970).
22 Schwert, Using Financial Data to Measure Effects of Regulation, 24 J. L. & ECON.121-22 (1981); Cavarra, Stover, & Allen, The Capital Market Effects of Airline Deregu-lation, 20 TRANS. J. 73 (1981); Davis, Cunningham, & Tabor, The Impact of Regula-tory Reform and Other Uncertainties on the Airline Stocks: An Analysis of Recent InvestorSentiment, 21 TRANS. FORUM 157 (1980).
23 See supra note 21.24 See infra notes 28-36 and accompanying text.25 See infra notes 37-48 and accompanying text.
19851 257
258 JOURNAL OF AIR LA WAND COMMERCE [50
will then provide a discussion of the results and offer ex-planations for the findings. 6 The final two sections of thepaper will present some proposals for the future, theoverall conclusions, and policy implications for the airlineindustry. 7
II. METHODOLOGY
In order to evaluate investor sentiment toward deregu-lation and the future of the airline industry, a "before andafter" research design was employed with two phases. Inthe first phase, airline bond yields to maturity28 were com-pared with three composite "benchmark" indices bothbefore and after deregulation. Bond yields were utilizedsince debt instruments have been the major source of ex-ternal funds for the airline industry in the past and arelikely to continue to be so in the future. 9 In an efficientmarket, as prospects for the airline industry improve, in-vestors would be expected to bid up the price of airlinebonds so that yields to maturity decline. 0 Conversely, asthe future prospects for air carriers deteriorate, the priceof airline bonds would be expected to fall so that yields tomaturity increase. Stated alternatively, a decline in airline
26 See infra notes 49-80 and accompanying text.27 See infra notes 81-112 and accompanying text.28 A bond yield to maturity can be defined as the rate of discount which makes
the present value of the stream of future interest payments, plus the return ofprincipal at maturity, equal to the current market price of the bond. It is the inter-nal rate of return on a debt instrument held to maturity. Normally, bond yields tomaturity are found by recourse to a "yield table." Alternatively, the yield to ma-turity (YTM) can be approximated by the following formulas:
YTM = Annual coupon interest + (Discount/Number years to maturity)(Current price + Par value)/2or
YTM = Annual coupon interest - (Premium/Number years to maturity)
(Current price + Par value)/2"Discount" means the discount received for bonds purchased below par value and"premium" means the additional payment for bonds purchased above par value.SeeJ. COHEN, E. ZINBARG, & A. ZEIKEL, INVESTMENT ANALYSIS AND PORTFOLIO MAN-AGEMENT 406-07 (1973).
- INDUSTRY SURVEYS, supra note 8, at 41.30 J. COHEN, E. ZINBARG, & A. ZEIKEL, supra note 28, at 405-06; R. ROBINSON &
D. WRIGHTSMAN, supra note 21, at 400.
AIRLINE DEREGULATION
yields to maturity implies both lower risk and lower futuredebt costs, while a rise in yields implies higher investorrisk and consequently higher future debt costs. 31
Because general. economic conditions and the level ofinterest rates also affect bond yields,3 2 it was also neces-sary to compare airline yields over time to "benchmark"indices. The three indices selected were Moody's com-posite of all corporate bonds, a composite of motor car-rier bonds, and a composite of rail bonds.3 3 The selectionof a general market indicator as well as two transportationindices should allow for comparison of the results andshould strengthen or weaken any conclusions achieved.The resulting "spreads" were calculated between airlinebond yields and the corporate, motor, and rail yields overthe period 1973 through 1984. The "spread analyses' '3 4
were then evaluated for the pre-deregulation period(1973-1977), the early post-deregulation period (1978-1980), and the recent post-deregulation period (1981-1984).
The second phase of the research effort was used as acheck to verify the results of the first phase. Airline bondratings were evaluated over time for the pre-deregulationand post-deregulation periods. Moody's bond ratingsrange from the highest rating of "Aaa" to the lowest rat-ing of "C." While each of the nine Moody rating catego-ries has a distinct meaning, bonds rated below "Ba" areconsidered to "lack characteristics of the desirableinvestment.
3 5
31 See Melicher & Rush, Systematic Risk, Financial Data, and Bond Rating Relation-ships in a Regulated Industry Environment, 29J. FIN. 537, 537 (1974); Hettenhouse &Sartoris, An Analysis of the Informational Value of Bond-Ratings Changes, 16 Q. REV.ECON. & Bus. 65, 65 (1976); West, Bond Ratings, Bond Yields, and Financial Regula-tion: Some Findings, 16 J. LAw & ECON. 159, 163 (1973); Bhandari, What's in aChange in an Industrial Bond Rating?, I IJ. Bus. RESEARCH 91, 103 (1983).
32 J. COHEN, E. ZINBARG, & A. ZEIKEL, supra note 28, at 405, 418-19." The data for the airlines and the corporate, motor, and rail indices were all
obtained from the same monthly editions of MOODY'S INVESTORS SERVICE,MOODY'S BOND RECORD, vols. 40-51 (1973-1984).
34 SeeJ. COHEN, E. ZINBARG, & A. ZEIKEL, supra note 28, at 418-19.35 See, e.g., MooDY'S INVESTORS SERVICE, MOODY'S BOND RECORD, vol. 51 no. 6,
at 1 (Aug. 1984).
1985] 259
260 JOURNAL OF AIR LA WAND COMMERCE [50
The data for airline bond yields to maturity and forbond ratings were broken down for the major airlines andthe national airlines. The sample of air carriers consistedof nine major airlines and six national airlines.36 Onlybonds which were outstanding for virtually the entire pe-riod were utilized in the analysis. When a firm had severaloutstanding bonds, an average yield and average ratingwere calculated for the individual firm for the relevanttime period.
III. RESULTS: SPREAD ANALYSIS AND RATINGS BEFORE
AND AFTER DEREGULATION
A. Airline Bond Yields Compared to Corporate Yields
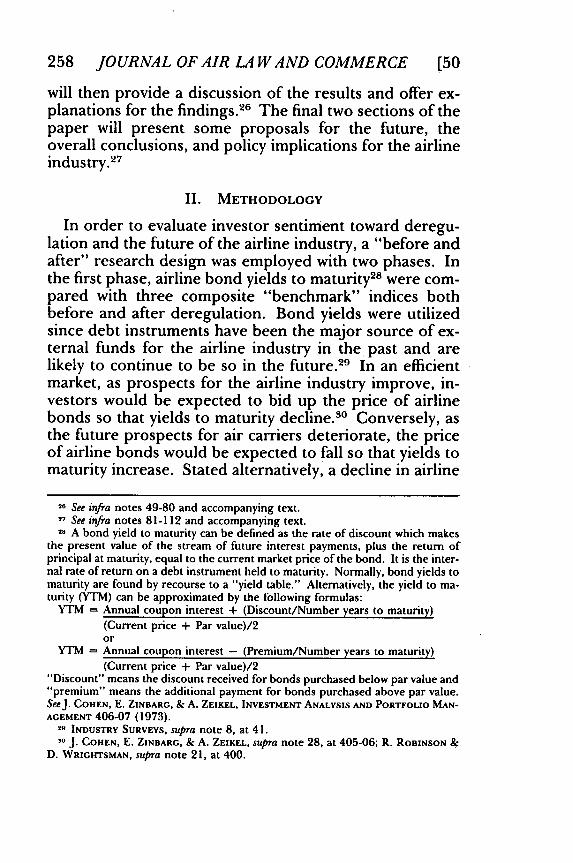
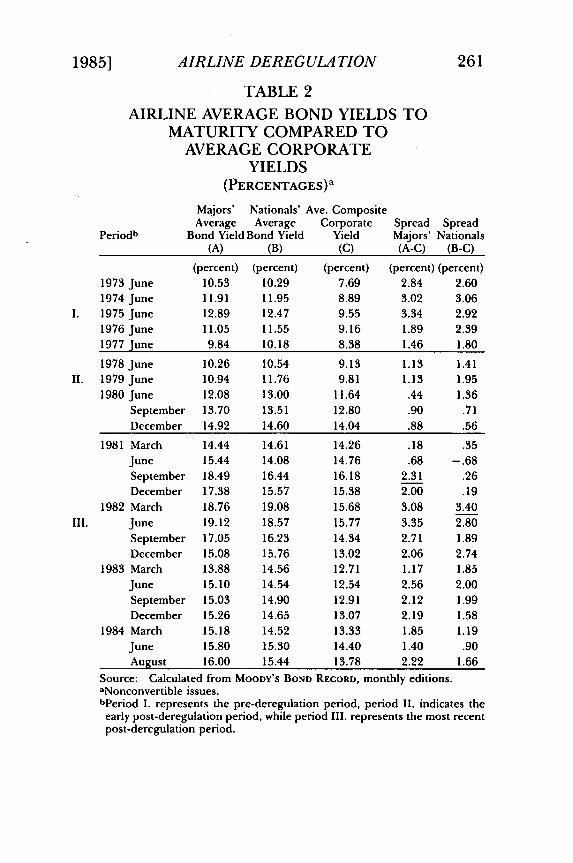
Table 2 compares average airline bond yields to matur-ity with a composite of all corporate bond yields for thepre-deregulation, early post-deregulation, and the mostrecent post-deregulation periods. The "spread analysis"in Table 2 shows that initially the bond market reactedquite favorably to airline deregulation. That is, thespreads between airline bond yields and the compositecorporate yields narrowed substantially during the earlypost-deregulation period (1978-1980). There is also anindication in Table 2 that the market reacted favorably tothe 1976-1977 CAB attempts at "de facto deregulation"during the Chairmanships of Robson and Kahn,37 sincethe airline/corporate spreads actually began to declineduring the 1976-1977 period. This improvement acceler-
S6 The major airlines included American Airlines, Braniff International, Conti-
nental Air Lines, Eastern Air Lines, Pan Am World, Trans World, United AirLines, U.S.Air, and Western Air Lines. The national airlines consisted of FrontierAirlines, Hawaiian Airlines, Ozark Air Lines, P.S.A., Texas International, andWorld Airways.
37 For a historical review of this period, see Altshuler & Teal, The Political Econ-omy of Airline Deregulation, in CURRENT ISSUES IN TRANSPORTATION POLICY 57 (A.Altshuler ed. 1979); P. BIEDERMAN, THE U.S. AIRLINE INDUSTRY: END OF AN ERA
111-13 (1982); R. KANE & A. VOSE, AIR TRANSPORTATION 10-11 (7th ed. 1979).
1985]
Periodb
Majors' Nationals' Ave. CompositeAverage Average Corporate
Bond Yield Bond Yield YieldSpread SpreadMajors' Nationals
(A) (B) (C) (A-C) (B-C)
(percent) (percent) (percent) (percent) (percent)1973 June 10.53 10.29 7.69 2.84 2.601974 June 11.91 11.95 8.89 3.02 3.061975 June 12.89 12.47 9.55 3.34 2.921976 June 11.05 11.55 9.16 1.89 2.391977 June 9.84 10.18 8.38 1.46 1.80
1978 June 10.26 10.54 9.13 1.13 1.411979 June 10.94 11.76 9.81 1.13 1.951980 June 12.08 13.00 11.64 .44 1.36
September 13.70 13.51 12.80 .90 .71December 14.92 14.60 14.04 .88 .56
1981 March 14.44 14.61 14.26 .18 .35June 15.44 14.08 14.76 .68 -. 68September 18.49 16.44 16.18 2.31 .26December 17.38 15.57 15.38 2.00 .19
1982 March 18.76 19.08 15.68 3.08 3.40June 19.12 18.57 15.77 3.35 2.80September 17.05 16.23 14.34 2.71 1.89December 15.08 15.76 13.02 2.06 2.74
1983 March 13.88 14.56 12.71 1.17 1.85June 15.10 14.54 12.54 2.56 2.00September 15.03 14.90 12.91 2.12 1.99December 15.26 14.65 13.07 2.19 1.58
1984 March 15.18 14.52 13.33 1.85 1.19June 15.80 15.30 14.40 1.40 .90August 16.00 15.44 13.78 2.22 1.66
Source: Calculated from MOODY'S BOND RECORD, monthly editions.aNonconvertible issues.bperiod I. represents the pre-deregulation period, period II. indicates theearly post-deregulation period, while period III. represents the most recentpost-deregulation period.
AIRLINE DEREGULATION
TABLE 2
AIRLINE AVERAGE BOND YIELDS TOMATURITY COMPARED TO
AVERAGE CORPORATEYIELDS
(PERCENTAGES)a
261
262 JOURNAL OF AIR LA WAND COMMERCE [50
ated during the early post-deregulation period and mani-fested itself for both the major airlines and the smallernationals, although the nationals improved at a faster rateduring the latter part of 1980 and the first part of 1981(Table 2). It was during this period that the nationalswere surpassing the majors in earnings performance, andit was becoming apparent that the nationals were gainingmarket share at the expense of the majors.3
Despite the bond market's initial favorable reaction toairline deregulation, a reassessment apparently began totake place during the latter part of 1981. Table 2 showsthat beginning in the September quarter of 1981 for themajors and the March quarter of 1982 for the nationals,the yield spreads began to deteriorate substantially. Thedeterioration in yield spreads continued throughout the1981-1984 period at a time when airline fuel costs weredeclining, 39 general interest rates were falling,40 airlineswere increasingly able to bring labor costs under con-trol,4 1 and airline productivity was increasing.42 Further-more, during 1983-1984 the economy was making steadyprogress toward recovery,43 so that Table 2 indicates thatthe bond market was not imputing any advantage from aneconomic upturn to the major and national airlines. Infact, an inspection of the recent yield spreads in Table 2indicates that airline prospects have not been as dismalsince the oil embargo/recession of 1973 to 1975.
In summary, these results suggest that in the recentpost-deregulation period (1981-1984), the bond market isless sanguine about deregulation and the industry's futurethan in the period immediately following deregulation.
38 Davis, Cunningham, and Tabor, supra note 22, at 157; Ellison, The Structural
Change of the Airline Industry Following Deregulation, 21 TRANSP. J. 58, 67 (1982).39 INDUSTRY SURVEYS, supra note 8, at A29, A42.40 Id.41 Id. at A28.42 STANDARD & POOR'S INDUSTRY SURVEYS, Aerospace and Air Transport, Current
Analysis A2-A3, A6 (June 30, 1983)[hereinafter cited as INDUSTRY SURVEYS, CurrentAnalysis].
43 Id. at 2, 7.
AIRLINE DEREG ULA TION
Furthermore, the economy expanded steadily during1983-1984. These results imply that airline capital costs(debt costs) have risen sharply relative to the general mar-ket during the recent post-deregulation period.
B. Airline Bond Yields Compared to Motor and Rail Yields
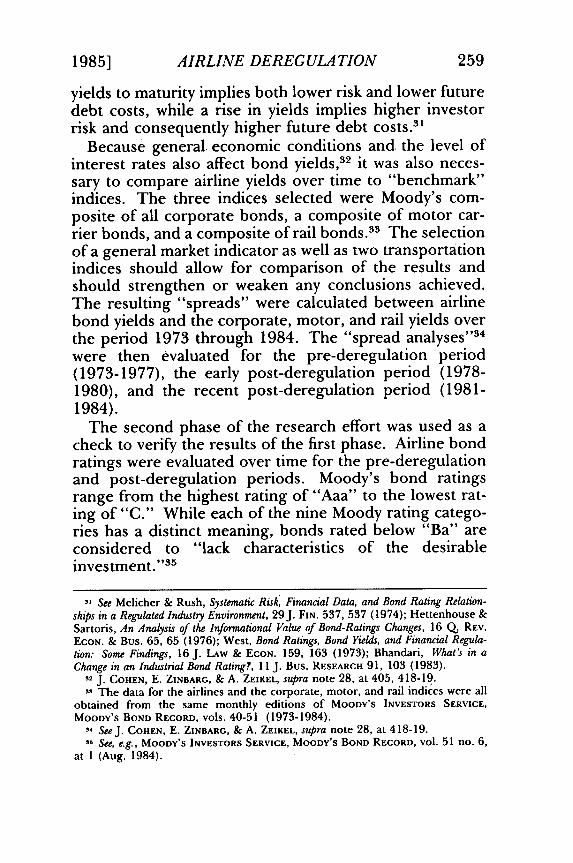
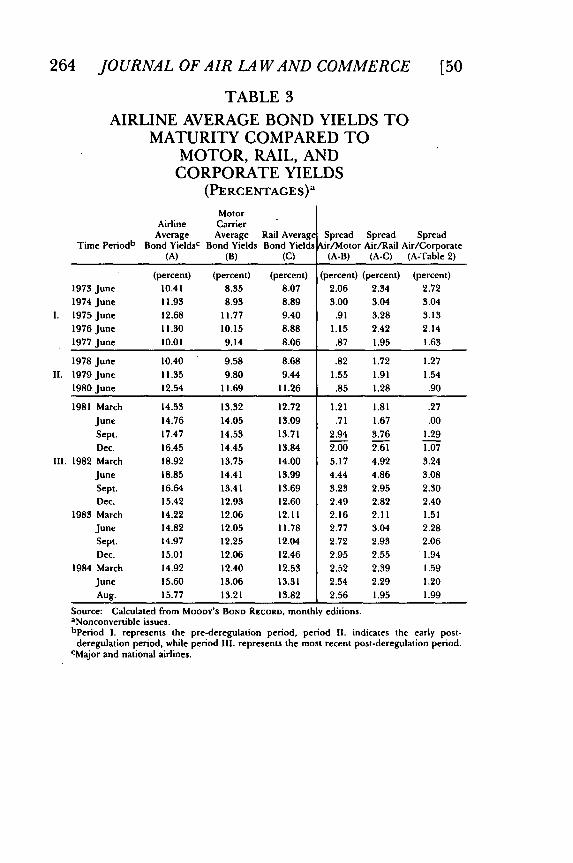
Table 3 compares average airline bond yields to matur-ity with the yields for both motor carriers and rail carri-ers44 for the same time periods previously examined.Although both motor carriers and rail carriers receivedsome regulatory reform in 1980,'4 the extent of deregula-tion was not nearly as comprehensive as that for air carri-ers. Motor and rail carriers are still regulated as to rates,entry, and abandonment. 46
The results of the "spread analysis" in Table 3 are simi-lar to the results achieved with the corporate yields in Ta-ble 2. Initially, the airline spreads declined substantiallyduring the early post-deregulation period (1978-1980)from the pre-deregulation period (1973-1977). Althoughthe airline improvement manifested itself in both the mo-tor and rail comparisions, the improvement over the mo-tor yields was somewhat greater.
In contrast, during the last two quarters of 1981, thebond market began to reassess the impact of deregulationon the airlines' prospects. Table 3 shows that beginningin the September quarter of 1981, the spreads betweenairline yields and both motor and rail yields increased dra-matically. This deterioration in airline performance con-tinued throughout the 1981-1984 period at a time when
44 For the rail index, the 24 carriers in Moody's Rail Bond Yield Averages wereutilized. For the motor index, a sample of motor carrier bonds was selected. Seesupra note 33.
45 The Motor Carrier Act was approved July 1, 1980 while the Staggers Rail Actwas approved October 14, 1980. See Motor Carrier Act of 1980, Pub. L. No. 96-296, 94 Stat. 793 (1980) (codified at 49 U.S.C. § 10521 (1982)); Staggers Rail Actof 1980, Pub. L. No. 96-448, 94 Stat. 1895 (1980) (codified at 49 U.S.C. § 10101(1982)).46 49 U.S.C. §§ 10701-10766, 10903-10906, 10921-10934 (1982).
1985] 263
264 JOURNAL OF AIR LA WAND COMMERCE [50
TABLE 3
AIRLINE AVERAGE BOND YIELDS TOMATURITY COMPARED TO
MOTOR, RAIL, ANDCORPORATE YIELDS
(PERCENTAGES)a
MotorAirline Carrier
Average Average Rail AveragcTime Periodb Bond Yieldsc Bond Yields Bond Yields
(A) (B) (C)
(percent) (percent)
10.41 8.35
11.93 8.93
12.68 11.7711.30 10.15
10.01 9.14
10.40
11.35
12.54
(percent)
8.07
8.89
9.40
8.88
8.06
9.58 8.689.80 9.44
11.69 11.26
13.32
14.05
14.53
14.45
13.75
14.41
13.41
12.93
12.0612.05
12.25
12.06
12.40
13.0613.21
12.72
13.09
13.71
13.84
14.00
13.99
13.6912.6012.11
11.7812.04
12.46
12.53
13.3113.82
Spread Spread Spreadkir/Motor Air/Rail Air/Corporate
(A-B) (A-C) (A-Table 2)
(percent) (percent) (percent)
2.06 2.34 2.723.00 3.04 3.04
.91 3.28 3.13
1.15 2.42 2.14
.87 1.95 1.63
.82 1.72 1.27
1.55 1.91 1.54
.85 1.28 .90
1.21 1.81 .27
.71 1.67 .00
2.94 3.76 1.29
2.00 2.61 1.07
5.17 4.92 3.24
4.44 4.86 3.08
3.23 2.95 2.30
2.49 2.82 2.40
2.16 2.11 1.51
2.77 3.04 2.28
2.72 2.93 2.06
2.95 2.55 '1.94
2.52 2.39 1.59
2.54 2.29 1.20
2.56 1.95 1.99
1973 June
1974 June
1. 1975 June
1976 June
1977 June
1978 June
11. 1979 June
1980 June
1981 March
June
Sept.
Dec.
111. 1982 March
June
Sept.
Dec.
1983 March
June
Sept.
Dec.
1984 March
June
Aug.
Source: Calculated from MOODY's BOND RECORD, monthly editions.aNonconvertible issues.bperiod I. represents the pre-deregulation period, period 11. indicates the early post-
deregulation period, while period Ill represents the most recent post-deregulation period.CMajor and national airlines.
AIRLINE DEREG ULA TION
airlines were becoming more efficient, fuel costs were de-clining, and the economy was expanding. 47 Paradoxically,the airline yield spreads between air and motor carriers(Table 3) are now more unfavorable than during the oilembargo and recession of 1973 (although air carriers aremuch more fuel intensive than motor carriers). These re-sults are consistent with the earlier comparisions for thecomposite corporate yields in that airlines are now viewedless favorably by the capital market.
C. Airline Bond Ratings Before and After Deregulation
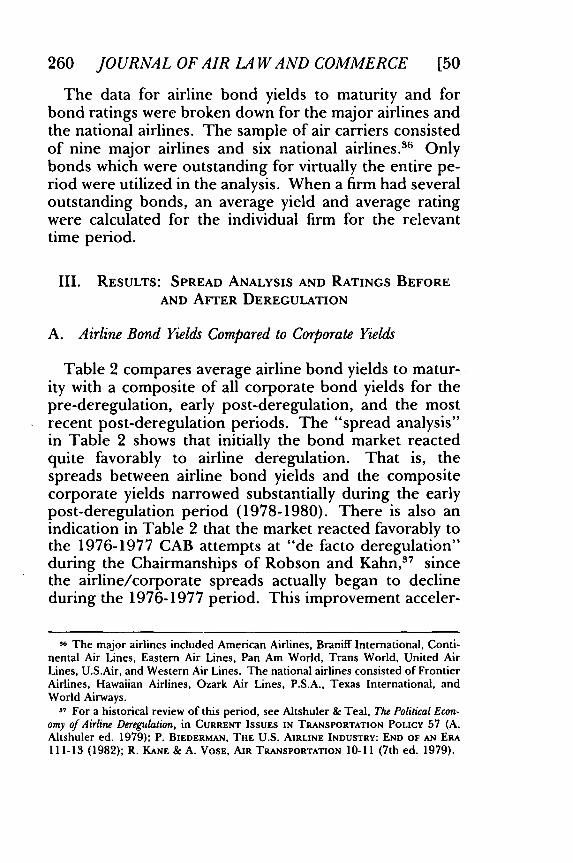
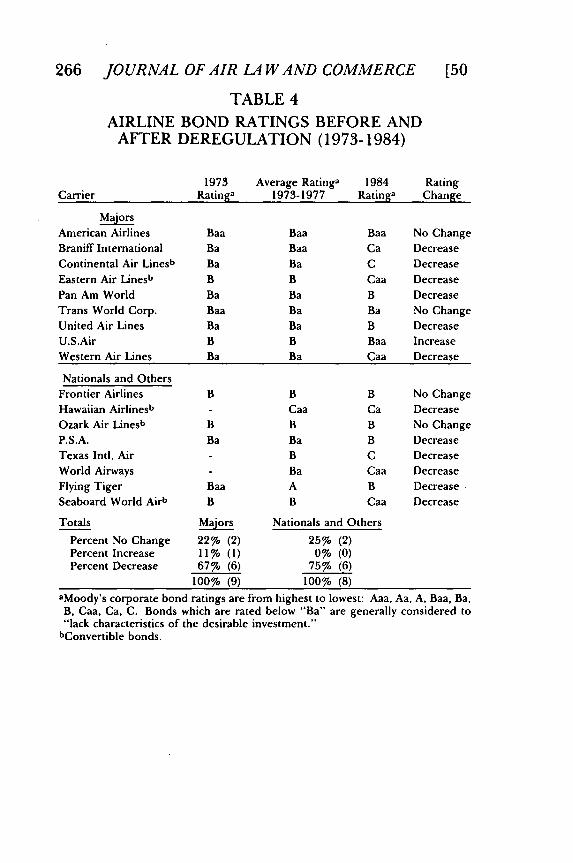
As a final check on the results, Table 4 compares airlinebond ratings for the periods before deregulation with thepost-deregulation period. As shown in Table 4, a major-ity of both the major airlines and the nationals have suf-fered a decline in bond ratings during the post-deregulation period. The bottom of Table 4 shows that67 percent of the majors and 75 percent of the na-tional/other category had a lower bond rating in 1984than during either the 1973 oil embargo or the entire1973-1977 pre-deregulation period. Furthermore, an in-spection of the data indicates that a number of these carri-ers have experienced several downgradings in ratingduring the post-deregulation period. In fact, only onecarrier, U.S.Air, has experienced a rating increase duringthe recent post-deregulation periods.
The results of the examination of bond ratings are con-sistent with the earlier "spread analyses" in that airlinesare looked upon less favorably by the capital market fol-lowing deregulation. Since many financial institutions usea rating of "Ba" as the minimum standard for acceptableinvestment risk,48 it is apparent from Table 4 that mostairlines no longer meet this minimum standard. The im-
47 INDUSTRY SURVEYS, Current Analysis, supra note 42, at A2-A3, A6-A7.48 See West, supra note 31, at 163; Hettenhouse & Sartoris, supra note 31, at 65.
1985] 265
266 JOURNAL OF AIR LA WAND COMMERCE
TABLE 4
AIRLINE BOND RATINGS BEFORE ANDAFTER DEREGULATION (1973-1984)
1973 Average Ratinga 1984 RatingCarrier Ratinga 1973-1977 Ratinga Change
American Airlines Baa Baa Baa No ChangeBraniff International Ba Baa Ca DecreaseContinental Air Linesb Ba Ba C DecreaseEastern Air Linesb B B Caa DecreasePan Am World Ba Ba B DecreaseTrans World Corp. Baa Ba Ba No ChangeUnited Air Lines Ba Ba B DecreaseU.S.Air B B Baa IncreaseWestern Air Lines Ba Ba Caa Decrease
Nationals and OthersFrontier Airlines B B B No ChangeHawaiian Airlinesb Caa Ca DecreaseOzark Air Linesb B B B No ChangeP.S.A. Ba Ba B DecreaseTexas Intl. Air B C DecreaseWorld Airways Ba Caa DecreaseFlying Tiger Baa A B DecreaseSeaboard World Airb B B Caa Decrease
Totals Maos Nationals and Others
Percent No Change 22% (2) 25% (2)Percent Increase 11% (1) 0% (0)Percent Decrease 67% (6) 75% (6)
100% (9) 100% (8)aMoody's corporate bond ratings are from highest to lowest: Aaa, Aa, A, Baa, Ba,
B, Caa, Ca, C. Bonds which are rated below "Ba" are generally considered to"lack characteristics of the desirable investment."
bConvertible bonds.
AIRLINE DEREG ULA TION
plication of these results is that deregulation has accom-panied an increase in airline investment risk and thereforean increase in the airlines' future debt costs.
IV. DISCUSSION OF RESULTS
The results of this study indicate that the capital marketis not enthusiastic about the prospects of the airline in-dustry in a deregulated environment. Although the bondmarket initially looked upon deregulation favorably, a re-assessment of airline prospects began to take place duringthe latter part of 1981 for both the major and nationalcarriers. Thus, the spreads between airline bond yields tomaturity and the composite indices of corporate, motor,and rail bond yields deteriorated substantially during the1981 through 1984 period. Furthermore, as of the end of1984, a majority of both the major and national airlinesnow have lower bond ratings than during the oil em-bargo/recession of 1973 to 1975. In sum, these resultssuggest that the airline industry's future under deregula-tion looks bleak.
Much of the recent financial difficulty of the airline in-dustry can be traced directly to the effects of deregulationon rates and market entry. Although airlines have alwaysused price discounts to some extent, over the last fewyears rate discounting has become rampant, particularlyon the long-haul, high-density routes. While prior to theAct only 45 percent of all passengers travelled under dis-counted tickets, as of 1983 almost 90 percent of all pas-sengers were travelling under discount.4 9 Sinceapproximately one-half of airline passengers are businesstravellers50 and since this market segment is relativelyprice inelastic, 5' the heavy use of discounts appears highly
49 See INDUSTRY SURVEYS, supra note 8, at A28, A42.- ALTHSULER & TEAL, supra note 37, at 54-55.51 Id.
1985] 267
268 JOURNAL OF AIR LA WAND COMMERCE [50
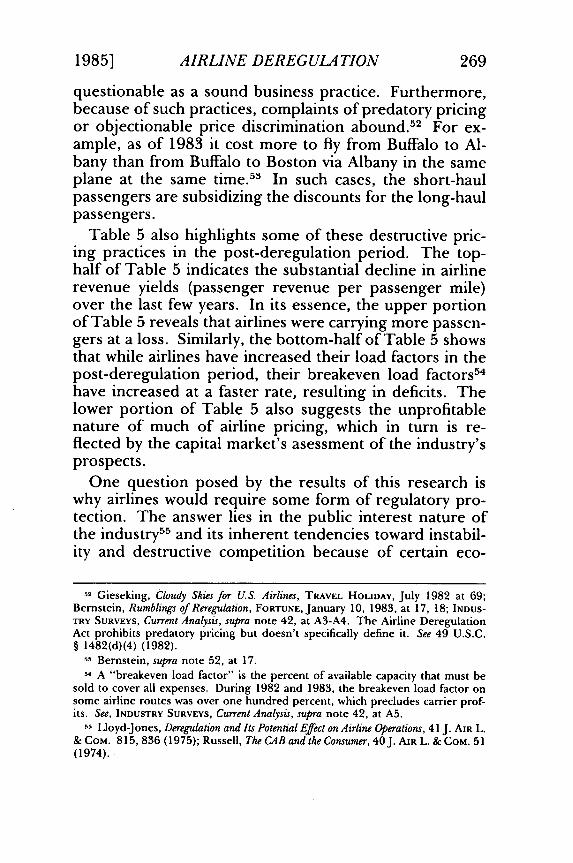
TABLE 5AIRLINE REVENUES PER PASSENGER-MILE
(YIELDS)(YEAR-TO-YEAR PERCENTAGE CHANGES)
1981 1982 19834th Q Ist Q 2nd Q 3rd Q 4th Q 1st Q
Major Airlines
American - 1.7 -15.0 -11.5 - 2.6 - 7.4 - 8.6Continental +10.2 - 8.4 -11.1 - - -12.3Delta +12.3 - 2.1 - 0.1 + 3.5 - 7.2 -15.5Eastern + 4.6 - 1.5 + 3.2 + 3.1 - 3.1 - 5.7Northwest + 2.8 - 4.7 - 6.6 - 2.9 -11.7 - 2.5Pan American - 3.9 - 4.2 + 1.3 + 2.2 + 8.5 + 2.1Republic - 3.2 - 8.4 -14.3 -12.8 -12.0 -18.9TWA + 5.5 - 7.7 - 5.6 - 3.5 - 3.8 -13.6United - 0.6 -14.0 - 6.5 - 1.8 - 5.0 - 8.1U.S.Air + 8.7 + 6.3 + 4.6 + 6.7 - 4.3 - 6.8Western + 1.4 + 1.0 -11.4 - 2.4 -12.0 -19.3
National Airlines
Air Florida 12.4 - 9.3 + 9.8 + 3.4 - + 4.5Frontier + 1.7 - 0.8 - 9.1 - 9.2 - 9.6 -20.9Ozark + 8.0 - 1.5 - 5.3 - 5.8 - -
PSA - 1.8 - 2.9 - 3.2 -10.9 - 5.8 - 7.7Southwest + 8.6 - 4.3 - 8.7 - 5.1 - + 1.8
MAJOR AIRLINES AVERAGE TON-MILE AND BREAKEVEN LOADFACTORS (1974-1982)
No. Total Ton-No. Total Miles Average Ton- AveragePassengers Passengers & Mile Load Breakeven Ton-
Carried Freight Factor Pass. & Mile Load(thousands)a (millions)a Frt.b Factorbc Deficit
(A) (B) (C) (D) (C-D)
1982 208,432 21,046 52.9% 53.8% - .9%1981 205,363 20,537 50.9% 52.3% - 1.4%1980 221,979 21,199 50.5% 50.9% - .4%1979 211,554 21,257 54.2% 53.2% 1.0%1978 196,073 19,712 52.6% 48.9% 3.7%1977 172,231 17,348 48.8% 46.3% 2.5%1976 160,451 16,171 48.3% 49.0% - .7%1975 147,428 14,794 46.6% 46.6% .0%1974 147,999 14,699 47.2% 45.0% 2.2%
Source: STANDARD AND POOR'S INDUSTRY SURVEYS, Aerospace and Air Transport,Current and Basic Analysis, June 30 and December 1, 1983.
aDomestic scheduledbTotal operations. Braniff and Continental eliminated for 1982.cThe percent of available capacity that must be sold to cover all expenses forpassengers and freight.
AIRLINE DEREG ULA TION
questionable as a sound business practice. Furthermore,because of such practices, complaints of predatory pricingor objectionable price discrimination abound.5 2 For ex-ample, as of 1983 it cost more to fly from Buffalo to Al-bany than from Buffalo to Boston via Albany in the sameplane at the same time. 53 In such cases, the short-haulpassengers are subsidizing the discounts for the long-haulpassengers.
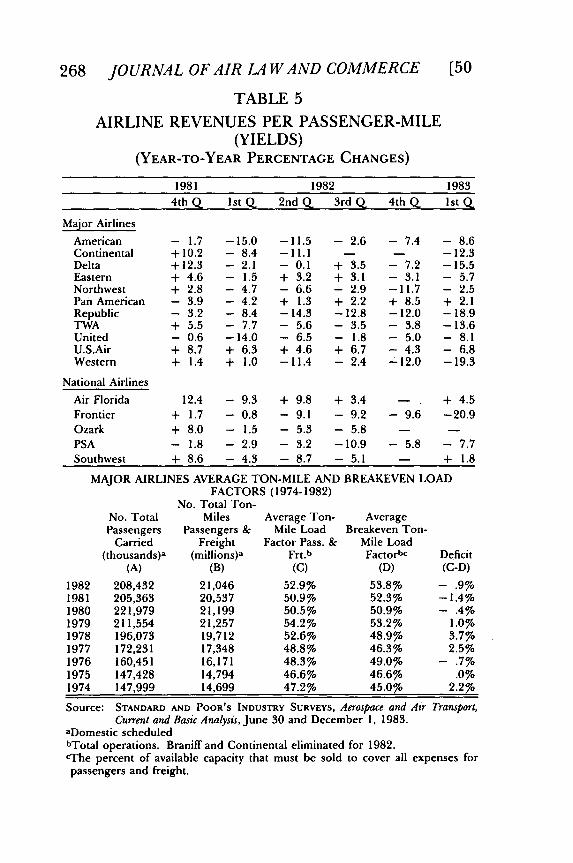
Table 5 also highlights some of these destructive pric-ing practices in the post-deregulation period. The top-half of Table 5 indicates the substantial decline in airlinerevenue yields (passenger revenue per passenger mile)over the last few years. In its essence, the upper portionof Table 5 reveals that airlines were carrying more passen-gers at a loss. Similarly, the bottom-half of Table 5 showsthat while airlines have increased their load factors in thepost-deregulation period, their breakeven load factors54
have increased at a faster rate, resulting in deficits. Thelower portion of Table 5 also suggests the unprofitablenature of much of airline pricing, which in turn is re-flected by the capital market's asessment of the industry'sprospects.
One question posed by the results of this research iswhy airlines would require some form of regulatory pro-tection. The answer lies in the public interest nature ofthe industry5 5 and its inherent tendencies toward instabil-ity and destructive competition because of certain eco-
52 Gieseking, Cloudy Skies for U.S. Airlines, TRAVEL HOLIDAY, July 1982 at 69;Bernstein, Rumblings of Reregulation, FORTUNE, January 10, 1983, at 17, 18; INDUS-TRY SURVEYS, Current Analysis, supra note 42, at A3-A4. The Airline DeregulationAct prohibits predatory pricing but doesn't specifically define it. See 49 U.S.C.§ 1482(d)(4) (1982).
- Bernstein, supra note 52, at 17.54 A "breakeven load factor" is the percent of available capacity that must be
sold to cover all expenses. During 1982 and 1983, the breakeven load factor onsome airline routes was over one hundred percent, which precludes carrier prof-its. See, INDUSTRY SURVEYS, Current Analysis, supra note 42, at A5.
55 Lloyd-Jones, Deregulation and Its Potential Effect on Airline Operations, 41 J. AIR L.& CoM. 815, 836 (1975); Russell, The CAB and the Consumer, 40J. AIR L. & COM. 51(1974).
1985] 269
270 JOURNAL OF AIR LA WAND COMMERCE [50
nomic characteristics it possesses. 5' The airline industry
was originally regulated because of industry instabilityand the potential for destructive competition. As a 1938House Report stated:
The result of this chaotic situation of the air carriers hasbeen to shake the faith of the investing public in their fi-nancial stability and to prevent the flow of funds into theindustry. Unless legislation is enacted which would givecarriers reasonable assurance of the permanency of theiroperation and would protect them from cut-throat compe-tition, a number of the airlines will soon be in serious fi-nancial trouble.58
The latter statement, of course, has a contemporary and"familiar ring" to it.
Several economic characteristics of the airline industryin particular tend to promote instability and destructivecompetition in the absence of regulatory moderation.First, it is well known that airline demand is highly varia-ble as to time of day, time of month, and time of year 59
and that the transportation output can neither be storednor inventoried. 60 In addition, different travelling seg-ments exhibit different price elasticities of demand (forexample, business travel versus vacation travel); 61 once aplane is scheduled, however, most of the costs are fixed in
56 J. KNEAFSEY, J. MOLLOY, R. SIMPSON, & N. TANEJA, THE NEED FOR STABILITY
IN THE AIRLINE INDUSTRY MARKET STRUCTURE: DEREGULATION AFTER FOUR YEARS30-33 (1983).
57 CIVIL AERONAUTICS BOARD, REPORT OF THE CAB SPECIAL STAFF ON REGULA-TORY REFORM 20 (July 1975) [hereinafter cited as CAB Report]. Lloyd-Jones,supra note 55, at 815; Beane, The Antitrust Implications of Airline Deregulation, 45 J.AIR L. & COM. 1001, 1002 (1980); Callison, Airline Deregulation-Only Partially AHoax: The Current Status of the Airline Deregulation Movement, 45J. AIR L. & COM. 961,962-67 (1980); Breyer & Stein, supra note 6, at 10-13.
58 H. R. REP. No. 2254, 75th Cong., 3rd Sess. 2 (1938).59 For a statistical representation of this demand variability, see W. O'CONNOR,
AN INTRODUCTION TO AIRLINE ECONOMICS 65-67 (1978). See also Thornton, Deregu-lation: The CA.B. and its Critics, 43J. AIR L. & COM. 641, 650 (1977).
- Lloyd-Jones, supra note 55, at 837; G. DOUGLAS &J. MILLER, ECONOMIC REG-ULATION OF DOMESTIC AIR TRANSPORT: THEORY AND POLICY 4, 45 (1974).
61 P. BIEDERMAN, supra note 37, at 153; S. SHAW, AIR TRANSPORT 154 (1982).
AIRLINE DEREG ULA TION
the short-run.6 2 Hence, airlines have a natural incentiveto price incrementally or to use some form of price dis-crimination. To work effectively, however, competitivedevices such as stand-by discounts and minimum-stay dis-counts, require that an airline have the ability to separatedifferent market segments for pricing purposes. Someeconomists have long suggested that over time, airlineshave great difficulty in effectively separating traffic andmarket segments in an open entry/open pricing environ-ment.63 In fact, the current situation of almost ninety per-cent of all passengers flying under some type of discountlends credence to this view. 64
Second, it is difficult to accurately forecast the futuredemand for airline services and to match future capacityto this forecasted demand. Airline demand is highly sus-ceptible to swings in the economy,65 and is income elastic(depends on the income levels of travelers).66 Muchtravel, especially near holidays, is similar to a postponabledurable.67 Moreover, there is a long leadtime betweenequipment orders and their receipt.68 For example, thewide-bodied jets were ordered at a time of optimistic de-mand forecasts and stable fuel prices. When the orderswere finally received, neither existed.69 The difficulty inforecasting demand alone tends to promote excess capac-ity in the industry which in turn can cause destructiveprice competition in the absence of regulatory con-
62 S. SHAW, supra note 61, at 93; Thornton, supra note 59, at 84; Brenner, TheNeed for Continued Regulation of Air Transportation, 41 J. AIR L. & CoM. 794 (1975).
63 S. SHAW, supra note 61, at 167; R. KANE & A. VOSE, supra note 37, at 10-14; N.TANEJA, supra note 19, at 126-31; Altshuler & Teal, supra note 37 at 54-55; Thayer,Comparative Research in Transportation; Methodology Without Theory, in 2 UNITEDSTATES DEPT. OF TRANSPORTATION: CONFERENCE ON REGULATORY REFORM IN SUR-FACE TRANSPORTATION 121, 124 (Mar. 1983).
- INDUSTRY SURVEYS, supra note 8, at A28, A42.65 Ellison, supra note 38, at 60.- P. BIEDERMAN, supra note 37, at 18, 22; Breyer & Stein, supra note 6, at 8.67 P. BIEDERMAN, supra note 37, at 29.- R. MANDELL, FINANCING THE CAPITAL REQUIREMENTS OF THE U.S. AIRLINE IN-
DUSTRY IN THE 1980's at xvi, 12 (1979).69 See Thornton, supra note 59, at 643.
1985]
272 JOURNAL OF AIR LA WAND COMMERCE [50
straints. In addition, the problem of excess capacity 70 islikely to become worse as more airport slots become avail-able in the aftermath of the air traffic controllers' strike.7'
Third, most airline markets are characterized by oligo-polistic conditions in that such markets can reasonablysupport only a limited number of competitors.7 2 Such asituation would normally result in "sticky" prices. 73 Butairline markets are also characterized by unusually lowshort-term barriers to entry which can engender excesscapacity and destructive competition. Market entry is rel-atively easy since (1) airline transportation is largely un-differentiated in the minds of consumers (and therefore isprice sensitive),74 (2) airline productive equipment canreadily be redeployed (high factor mobility),75 and (3) sec-ond-hand aircraft are readily available (low-leasing cost ordirect investment costs).76
Given the cost structure of the industry and the absenceof significant barriers to market entry, unrestrained pricecompetition could potentially have deleterious effects onall carriers. For example, in 1982 and 1983, Delta Air-lines attempted to resist widespread discounting on manyof its routes. The net result was a loss of market share.Delta's pricing policy was thereafter modified to meet allcompetitor discounts, resulting in unprofitably low pricesfor this traditionally healthy airline.77 In short, the lowbarriers to entry in the airline industry and the limitednumber of competitors which individual markets can sup-
70 See generally Thayer, And Now the Deregulators: When Will They Learn?, 43J. AIRL. & CoM. 661, 671-72. (1977).
7, See STANDARD AND POOR'S INDUSTRY SURVEYS, Air Transport, Current Analysis, 48(Mar. 4, 1982); Thayer, supra note 63, at 133.
72 Thornton, supra note 59, at 665-67; P. BIEDERMAN, supra note 37, at 103, 150.73 Thornton, supra note 59, at 656.7. loyd-Jones, supra note 55, at 830; W. O'CONNOR, supra note 59, at 5-6.75 S. SHAW, supra note 61, at 92; W. O'CONNOR, supra note 59, at 5-6; C.A.B.
REPORT, supra note 57, at 120; Lloyd-Jones, supra note 55, at 838.70 BREYER & STEIN, supra note 6, at 8; Oster, The New Entrant Airlines: Implications
for Transportation Regulatory Reform, in UNITED STATES DEPT. OF TRANSPORTATION,CONFERENCE ON REGULATORY REFORM IN SURFACE TRANSPORT 324-25 (June 1983);INDUSTRY SURVEYS, supra note 8, at 41.
77 INDUSTRY SURVEYS, Current Analysis, supra note 42, at 3-4.
AIRLINE DEREGULATION
port tend to promote excess capacity and destructiveprice competition.78
Fourth, other economic characteristics can also provokeindustry instability. Harm can possibly be done to inte-grated route systems (balkanization) and interdependentindustries by new non-union entrants. 79 Additionally, the"S curve phenonmenon" suggests that firms will competein terms of excess capacity because the airline with thegreatest number of flights will receive a proportionallygreater market share.8 0 Finally, some travel agents or ar-rangers may have the ability to exercise leverage in ob-taining revenue commissions.8 ' While any one of thepreceding economic characteristics might occur in an-other industry, they are aggregated only in the airline in-dustry. Thus, absent some limited regulation, theseeconomic characteristics tend to promote destructivecompetition in an industry vested with a public interest incommerce, national defense, and safety.
V. ALTERNATIVE PROPOSALS FOR THE FUTURE
The previous section and the results of this study sug-gest that destructive price competition and objectionableprice discrimination can be traced directly to deregulationand the unique economic characteristics of the airline in-dustry. These economic characteristics relate to continu-ing tendencies toward excess capacity, low naturalbarriers to market entry, markets which can support only
78 Lloyd-Jones, supra note 55, at 839; Oster, supra note 75, at 400; W.O'CONNOR, supra note 59, at 5-6; Heymsfeld, An Introduction to Regulatory Reform forAir Transportation, 41 J. AIR L. & COM. 665, 671 (1975).
79 Lloyd-Jones, supra note 55, at 822, 825, 828; S. SHAW, supra note 61, at 93;Thayer, supra note 63, at 128; N. TANEJA, supra note 19, at 129; INDUSTRY SURVEYS,supra note 8, at A34.
so W. FRUHAN, JR., THE FIGHT FOR COMPETITIVE ADVANTAGE: A STUDY OF THEUNITED STATES DOMESTIC TRUNK AIR CARRIERS 126-129 (1972); P. Biederman,supra note 37, at 26, 48, 153, 169-170.
a' In 1982 travel agents sold approximately two-thirds of airline tickets; travelcommissions represented 6.4 percent of total airline operating costs, compared to3.5 percent in pre-deregulation periods. See AIRLINE ECONOMICS supra note 9, at196, 205; S. SHAW, supra note 61, at 182-86; Thornton, supra note 59, at 658;INDUSTRY SURVEYS, supra note 8, at A43.
27319851
274 JOURNAL OF AIR LA WAND COMMERCE
a limited number of competitors, and an inability of theairlines to segregate price sensitive segments of the mar-ket from other market segments over time. Furthermore,recessionary conditions also exacerbate industryproblems. Absent some form of regulatory moderation,these economic conditions will promote destructive pricecompetition, cross-subsidization of markets, and industryinstability. As a result, the financial market is not enthusi-astic about the airline industry's prospects in a com-pletely deregulated environment.
The recent financial difficulty of the airline industry andthe foregoing economic observations commend someform of regulation of airline practices. Such proposals areemanating from several sources.82 Two proposals whichwould deal directly with the problem of excess airline ca-pacity, and thus destructive price competition, favoreither a reimposition of entry controls or the collectiveadjustment of flight schedules by the airlines themselves.In regard to entry controls, it is unlikely that governmen-tal policy would ever again directly limit the number ofcompetitors by returning to the restrictive certificationprocess of the past. It has recently been suggested, how-ever, that the United States Department of Transporta-tion ration or "auction-off' airport slots to eliminatecongestion at airports.83 This policy, of course, wouldlimit entry and would indirectly reduce excessive pricecompetition.
In regard to the joint scheduling of services, one rec-ommendation would provide American air carriers with
82 Bernstein, Rumblings of Reregulation, FORTUNE,Jan. 10, 1983, at 17; Ott, Boeing
Official Decries Industry's Condition, Av. WEEK & SPACE TECH., Oct. 31, 1983, at 28;Glines, Deregulation, the Bomb That Exploded, AIR LINE PILOT, Nov. 1983, at 16;Gieseking, Cloudy Shies for U. S. Airlines, TRAVEL HOLIDAY, July 1982, at 69; Greg-ory, Airlines in Endless Transition, Av. WEEK & SPACE TECH., Nov. 14, 1983, at 19;Congress May Reconsider Deregulation, Av. WEEK & SPACE TECH., Mar. 14, 1983, at194; AFL-CIO Demands End to Deregulation of Air Industry and Anti-Union Acts, TRAFFICWORLD, Dec. 12, 1983, at 26; S. SHAW, supra note 61, at 235; N. TANEJA, AIRLINEPLANNING: CORPORATE, FINANCIAL AND MARKETING 6-7, 121 (1982).
83 INDUSTRY SURVEYS, supra note 8, at A28. See also DOT on Slot Allocations, TRAF-FIC WORLD, June 6, 1983, at 8; and Ott, supra note 81, at 29.
[50
AIRLINE DEREG ULA TION
antitrust immunity to jointly discuss and adjust their flightdepartures, arrivals, and schedules.84 Such a proposalwould be similar to the Canadian airline policy of "coop-eration" where competing carriers have recently been al-lowed to "rationalize their services" by providing jointscheduling of equipment, interconnection of flights, jointhandling at airports, and cooperative marketing of theservices.85 The purported advantages of this policy toconsumers are more stable prices, more direct flights todestination (yet fewer flights to choose from), and agreater selection of departure times since most airlinescurrently schedule flights during peak periods.8 6 The dis-advantages to consumers are fewer deep discounts andless price competition since fewer carriers would be com-peting between origin and destination points. For the air-lines, the major advantages would be a reduction indestructive price competition, better capacity utilization,increased load factors, improved interconnected schedul-ing, and most importantly, an improvement in financialperformance. It is noteworthy, however, that even dur-ing the restrictive CAB regulatory periods of the past, col-lective reductions in capacity were not allowed.88
Consequently, as with the proposal for regulatory entrycontrols, the likelihood of discussions among competingairlines over joint scheduling is not great.
An additional, and preferable, proposal relates to air-line pricing practices. While rate controls would not elim-inate the industry's excess capacity, they would relieve thesymptomatic problems of destructive price competition,objectionable price discrimination, and the precarious fi-nancial position of the industry.8 9 Although few airline
84 Airlines Urge CAB to Reject Antitrust Bid, Av. WEEK & SPACE TECH., Aug. 27,1983, at 30-31.85 Ellison, Simpson, & Smith, Co-operation: A Pragmatic Response by Canadian Air-
lines to 'Deregulation', 24 TRANSP. RESEARCH F. 675 (1983).8. Id. at 679.87 Id. at 677.88 See Airlines Urge CAB to Reject Antitrust Bid, supra note 83, at 30-31.
89 J. KNEAFSEY, J. MOLLOY, R. SIMPSON, & N. TANEJA, supra note 56, at 49-50;
1985] 275
276 JOURNAL OF AIR LA WAND COMMERCE
observers would recommend a return to the overly re-strictive price regulations of the past, one useful approachfor the future would be "regulation by exceptions." Sev-eral variations of this concept exist, but essentially, suchan approach would involve limited regulatory rate con-trols over exceptions or specific deviations from somestandard, preferably cost-related base rate. Thus, ratherthan regulatory deliberations on all airline rate filings,consideration would only be given to serious departuresfrom the standard or norm. After outlining a number ofvariations on this concept, the benefits and disadvantagesof a "regulation by exceptions" approach will beaddressed.
First, a "regulation by exceptions" approach might en-tail a "zone of rate flexibility" or "zone of reasonable-ness" in which airlines could raise or lower rates withoutregulatory interference. Such a proposal could be easilyimplemented. Initially, the Airline Deregulation Act pro-vided for such a "zone" where rates could be raised 5percent or lowered 50 percent annually without CAB ap-proval. 90 However, even this initial zone was substantiallywider than the zones established for motor carriers (up 10percent or down 10 percent) and rail carriers (an adjust-ment of 6 percent) under their respective, more limitedderegulation legislation. 9' Now of course, there are nolimitations on changes in airline pricing.92
If the motor carrier "model" were adopted, the mostimportant statutory provisions would involve the defini-tion of the standard "base rate," limitations on changeswithin the zone, and adjustments for competitive and in-flationary conditions.9" The agency regulating motorcarriers, the Interstate Commerce Commission (Commis-
Cortley, The Industry in Crisis: The Overcapacity Paradox, AIR LINE PILOT, Feb. 1984,at 14.
- Airline Deregulation Act of 1978, 49 U.S.C. § 1482(d)(4) (1982).91 Motor Carrier Act of 1980, 49 U.S.C. § 10708(d)(1) (1982); Staggers Rail Act
of 1980, 49 U.S.C. § 10707(a) (1982).02 Airline Deregulation Act of 1978, 49 U.S.C. § 1482(d)(1-4) (1982).In Motor Carrier Act of 1980, 49 U.S.C. § 10708(d)(1-4)(1982).
[50
AIRLINE DEREG ULA TION
sion), is prohibited from interfering with a proposed rateon the basis that it is too high or too low if the rate is notmore than 10 percent above or below a specified point ofreference.94 This base rate or standard is defined as therate in effect one year prior to the effective date of theproposed rate. The limitations on the carrier changeswithin the zone require the carrier to notify the Commis-sion that it wishes to have the rate considered under the"zone of rate freedom" provisions, that the carrier actsindependently of other carriers, and that no antitrust im-munity will cover rates set within the zone.9 5 An adjust-ment for competitive conditions allows the Commissionto increase the zone up to 5 percentage points during anyone year period if it finds that there is sufficient actual orpotential competition to regulate rates and that the carri-ers, shippers, and public will benefit from increased rateflexibility.96 Adjustments can also be made for inflationby making the base rate (i.e., the rate in effect one yearprior to the effective date of the proposed rate) reflectchanges during the past year in the Producers Price Indexas published by the Department of Labor. 7
If the rail "model" were followed, the relevant issueswould again center around the calculation of the standardbase rate, conditions for use of the zone, and adjustmentsfor competition and inflation.98 In the rail model, thebase rate is defined as the rate in effect on the first day ofan applicable five-year period. 99 This base rate is "ad-justed" by a rail "cost adjustment factor" which factors inchanges in the costs of material and labor over time. Car-riers are allowed individual rate adjustments up to the"adjusted base rate" plus 6 percent per year. 00 After1984, the zone dropped to 4 percent per year and is only
- Id. § 10708(d)(1).95 Id. § 10708(d)(4).
Id. § 10708(d)(2).97 Id. § 10708(d)(3).98 Staggers Rail Act of 1980, 49 U.S.C. § 10707(a) (1982).
Id. § 10707(a)(1).- Id. § 10707(b)(1).
1985] 277
278 JOURNAL OF AIR LA WAND COMMERCE [50
available to carriers with inadequate earnings.' 0' Finally,the zone of flexibility cannot be used for rates which aremore than 20 percent above a threshold rate which is dis-cussed below. 102 Although the zone of flexibility does notdirectly deal with competitive and inflationary conditions,under another provision of the deregulation legislation,the Interstate Commerce Commission can use an "infla-tion index" to prescribe quarterly percentage rate in-creases on an industry-wide, territory-wide, or individualcarrier basis.' 0 3
Under a variation of the "regulation by exceptions" ap-proach, like that imposed on rail carriers, a "rate floor"and "rate ceiling" could be established for airline rates.In the case of railroad deregulation, the "rate floor" wasdefined as "any rate which contributed to the going con-cern value" of the firm, while any rate greater than "varia-ble costs" was presumed to be reasonable and tocontribute to "going concern value."'' 0 4 The rate, how-ever, may be challenged on grounds other than reasona-bleness, such as discrimination. 0 5 To determine the"rate ceiling," all rail rates initially below 160 percent ofvariable costs were also deemed to be reasonable. 10 6 Thisthreshold will increase by formula over time until theCommission determines that rail carriers are earning ade-quate revenues.
Given the economic characteristics of the airline indus-try which make it difficult to define variable costs becausethe identification of costs that vary with changes in outputis extremely sensitive to the time horizon, a more appro-priate means of setting "standard fare" rates would bebased on total costs. Rates would then deviate from thisstandard only within narrow limits. This proposal wouldalso eliminate instances of objectionable price discrimina-
to, Id. § 10707a(d).102 Id. § 10707(e)(2).103 Id. § 10712(a).1- Id. § 10701(c).,o0 Id. § 10701(c)(3).- Id. § 10709(d).
AIRLINE DEREG ULA TION
tion. Originally, the Airline Deregulation Act providedfor such a "standard fare;" however, it was notmandatory.107
A final form of "regulation by exceptions" can be de-rived by combining several of the preceding options intoone single proposal. As a specific example, ProfessorsKneafsey, Molloy, Simpson, and Taneja of the Massachu-setts Institute of Technology have recently outlined athree-part proposal for future limited rate regulation ofthe airlines.' 08 Their proposal would involve (1) mileagebased base rates; (2) a 25 percent zone of rate flexibility;and (3) an "exceptions zone" requiring regulatory ap-proval. Specifically, they propose that each airline file adistance-based fare structure for a basic service (e.g.,coach). These rates must be on file for sixty days andwould not be subject to regulatory investigation or sus-pension. Rates for shorter distances must not exceedrates for longer trips and there must be no personal dis-crimination or contractual arrangements. Individual mar-ket exceptions to the distance-based rates would beallowed up to some specified percentage (i.e., plus or mi-nus 25 percent). These exceptions would be filed thirtydays in advance. Any competing carrier could match therates on short notice. Other fares outside the limits onmarket deviation would be filed subject to governmentapproval. To gain approval, the carrier would have to ex-plain why a particular market should be granted a devia-tion outside the prescribed deviations.' 0 9
While the exact details of a "regulation by exceptions"approach can be debated, the advantages of such a propo-sal would be significant. By having regulation focus onrate "exceptions," the benefits of competition could bepreserved while simultaneously rationalizing and stabiliz-ing airline pricing." 0 Although limited rate regulation
107 Airline Deregulation Act of 1978, 49 U.S.C. § 1482(d)(4) (1982).0- J. KNEAFSEY, J. MOLLOY, R. SIMPSON, & N. TANEJA, supra note 56, at 51-52.
109 Id.o10 Id. at 50. See also Congress May Reconsider Deregulation, supra note 81, at 195-96;
1985] 279
280 JOURNAL OF AIR LA WAND COMMERCE [50
will not eliminate the industry's excess capacity, it wouldalleviate one of its major symptoms-destructive pricecompetition. Furthermore, limited regulation wouldthwart objectionable personal discrimination and cross-subsidization between travel markets or communitiessince rates would be based on definitive standards such ascosts or distances. Consumers would also be more certainabout the level of fares, and airlines would once againearn normal profits. The major disadvantages are thatsome regulatory involvement would be required and con-sumers would not have the temporary advantage of somedeep discounts which have been available in the past.
VI. CONCLUSIONS
At a time when the airlines must raise huge sums of cap-ital to replace aging equipment,"' this study indicatesthat the capital market is not enthusiastic about the air-lines' prospects. Consequently, airline future debt costshave risen substantially relative to the debt costs of otherbusinesses in the general market and relative to debt costsof other modes of transportation. Since these other en-terprises have also been affected by similar economic con-ditions, the capital markets reflect that the airline industrywill continue to face hardships in a deregulated environ-ment. As outlined in section III of this paper, much ofthe recent financial difficulty of the airline industry can beattributed directly to the destructive price competitionmade possible by the Airline Deregulation Act of 1978.Financial problems have arisen because of the special eco-nomic characteristics of the airline industry, particularly
DOT's View of Airline Deregulation Challenged by Small Cities, Labor, TRAFFIC WORLD,
June 20, 1982, at 16-17.M See, e.g., Income Uncertainty Slows Airline Fleet Replacement, Av. WEEK & SPACE
TECH., Sept. 3, 1984, at 168. It has been estimated that the airline industry mustraise approximately $90 billion in the 1980's to replace equipment. It has alsobeen estimated that a 5 percent return on revenue (net profit margin) will be re-quired for airlines to attract sufficient capital to accomplish this equipment re-placement and for growth. Such a return has not been achieved since 1978 (Table1). See AIRLINE ECONOMICS supra note 9, at xx, 114; N. TANEJA, supra note 19, at178; R. MANDELL, supra note 68, at 111; INDUSTRY SURVEYS, supra note 8, at 41.
AIRLINE DEREG ULA TION
tendencies toward excess capacity, low barriers to entry,and markets which can reasonably support only a limitednumber of competitors.
While few industry observers would recommend a re-turn to the comprehensive and restrictive regulatory poli-cies of the past, the results of this study indicate that somelimited form of regulation might be appropriate. As out-lined in the previous section, it would be possible to rein-stitute a limited form of entry controls, for example, byrationing airport slots or by controlling the frequency ofairline flight departures. Alternatively, airlines could beallowed to rationalize their own services by collectively"cooperating" in adjusting their flight schedules. Both ofthese options would directly deal with the problem of ex-cess capacity as well as reduce congestion at airports.Since both would involve restricting the number of com-petitors in certain markets, however, the desirability ofthese policy options are open to question.
A policy preferred by the author would involve "regula-tion by exceptions," emphasizing regulatory rate involve-ment only for significant departures from the standard ornorm. Although such a policy would not directly elimi-nate the industry's excess capacity, it would alleviate oneof its major symptoms-destructive price competition.Consequently, a "regulation by exceptions" policy wouldpreserve the major benefits of competition while reducingexcessive discounts, objectional price discrimination, andindustry instability.
While the exact details of a "regulation by exceptions"approach can be debated, several variants of the conceptwere explored. One alternative would be to reinstitute a"zone of rate flexibility" in which carriers could adjustrates by some specified percentage without regulatory in-terference. Key issues to be resolved would be definitionof the base rate, width of the zone, and periodic adjust-ments for inflation and competitive conditions. Second, a"rate floor" and "ceiling" could be defined for airlinerates similar to that imposed on rail carriers. In the case
1985] 281
282 JOURNAL OF AIR LA WAND COMMERCE [50
of railroad deregulation, both the "floor" and "ceiling"were related to variable costs.1 2 Because of the difficultyof accurately defining variable costs in the airline industry,requiring that airline rates conform to a mileage-basedfare structure might be more appropriate. This wouldalso eliminate instances of objectionable personal andplace discrimination. Alternatively, rates could be tied toa total cost-based "standard fare" and only be allowed todeviate from this standard within narrow limits.
Although these alternatives do not exhaust the numberof possible options, some form of "regulation by excep-tions" should be adopted in order to rationalize airlinepricing. In fact, it would be possible to combine severalof these options into one single proposal as outlined inthe previous section of this paper. In the absence of somelimited form of regulatory intervention, one can expectairline performance to continue to deteriorate in the yearsahead. As one commentator has noted, "[t]he interest ofthe consumer is by no means always in opposition to thatof the airlines. Indeed, it certainly can be argued that thepublic has a great stake in having profitable airlines thatcan offer safe, efficient service and have the capital to in-vest in new and better aircraft." '" 3
Staggers Rail Act of 1980, 49 U.S.C. §§ 10707(a), 10709(d) (1982).113 W. O'CONNOR, supra note 59, at 80.