
Airborne radiometric survey data and a DTM as covariates ...
37
For Peer Review Airborne radiometric survey data and a DTM as covariates for regional scale mapping of soil organic carbon across Northern Ireland. B. G. Rawlins a,* , B. P. Marchant b , D. Smyth c , C. Scheib a , R. M. Lark b & C. Jordan d . a British Geological Survey, Keyworth, Nottingham NG12 5GG, UK b Rothamsted Research, Harpenden, Hertfordshire AL5 2JQ, UK c Geological Survey of Northern Ireland, Belfast BT9 5BF, UK d Agri-Food and Biosciences Institute, Belfast BT9 5PX, UK * Corresponding author: B. G. Rawlins British Geological Survey Keyworth Nottingham NG12 5GG UK phone: +44 (0) 115 9363140 Fax: +44 (0) 115 936 3100 e-mail: [email protected] 1 Page 1 of 37 European Journal of Soil Science CORE Metadata, citation and similar papers at core.ac.uk Provided by NERC Open Research Archive
Transcript of Airborne radiometric survey data and a DTM as covariates ...

For Peer Review
Airborne radiometric survey data and a DTM as covariates
for regional scale mapping of soil organic carbon across
Northern Ireland.
B. G. Rawlinsa,∗, B. P. Marchantb, D. Smythc, C. Scheiba, R. M. Larkb & C. Jordand.
aBritish Geological Survey, Keyworth, Nottingham NG12 5GG, UK
bRothamsted Research, Harpenden, Hertfordshire AL5 2JQ, UK
cGeological Survey of Northern Ireland, Belfast BT9 5BF, UK
dAgri-Food and Biosciences Institute, Belfast BT9 5PX, UK
∗ Corresponding author: B. G. Rawlins
British Geological Survey
Keyworth
Nottingham NG12 5GG
UK
phone: +44 (0) 115 9363140
Fax: +44 (0) 115 936 3100
e-mail: [email protected]
1
Page 1 of 37 European Journal of Soil ScienceCORE Metadata, citation and similar papers at core.ac.uk
Provided by NERC Open Research Archive

For Peer Review
Summary1
Soil scientists require cost-effective methods to make accurate regional predictions of2
soil organic carbon (SOC) content. We assess the suitability of airborne radiometric3
data and digital elevation data as covariates to improve the precision of predictions of4
SOC from an intensive survey in Northern Ireland. Radiometric data (K band) and, to5
a lesser extent, altitude are shown to increase the precision of SOC predictions when6
they are included in linear mixed models of SOC variation. However the statistical7
distribution of SOC in Northern Ireland is bimodal and therefore unsuitable for geo-8
statistical analysis unless the two peaks can be accounted for by the fixed effects in9
the linear mixed models. The upper peak in the distribution is due to areas of peat10
soils. This problem may be partly countered if soil maps are used to classify areas of11
Northern Ireland according to their expected SOC content and then different models12
are fitted to each of these classes. Here we divide the soil in Northern Ireland into three13
classes, namely mineral, organo mineral and peat. This leads to a further increase in14
the precision of SOC predictions and the median square error is 2.2 %2. However a15
substantial number of our observations appear to be mis-classified and therefore the16
mean squared error in the predictions is larger (30.6 %2) since it is dominated by large17
errors due to mis-classification. Further improvement in SOC prediction may therefore18
be possible if better delineation between areas of large SOC (peat) and small SOC19
(non-peat) could be achieved.20
2
Page 2 of 37European Journal of Soil Science

For Peer Review
Introduction21
Soil organic carbon (SOC) is one of the most important constituents of the soil im-22
parting structural stability, increased water holding capacity, acting as a source of23
nutrients, and as a store of terrestrial carbon. The quantity of organic carbon in the24
top 30 cm of the soil profile typically reflects the interplay of several factors including25
climate (annual rainfall and temperature), elevation, local topography and land use.26
Soil scientists require cost-effective methods to make accurate estimates of SOC con-27
tent, which could be used to estimate soil-related carbon-dioxide emissions under the28
UNFCCC (United Nations Framework Convention on Climate Change).29
Traditional, grid-based sampling, with laboratory measurement and univariate30
interpolation of SOC is subject to large estimation uncertainties at unsampled points.31
These can be significantly reduced if intensive, secondary covariates such as data from32
remote sensors are used for prediction by cokriging (McBratney & Webster, 1983),33
regression kriging (Odeh et al., 1995), or the use of linear mixed models (Lark et34
al., 2006). A variety of covariates have been shown to improve prediction of SOC.35
For example, terrain attributes and land use have been shown to be correlated with36
SOC at multiple scales (Mueller & Pierce, 2003), whilst hyperspectral airborne data37
(Selige et al., 2006), surface reflectance (Chen et al., 2000) and electrical conductivity38
(Simbahan et al., 2006) was shown to be correlated with SOC in arable soils over scales39
from a few to tens of kilometres. These secondary covariates are likely to be more or40
less applicable in various types of soil environment (e.g. vegetated and unvegetated),41
and at differing scales.42
Another potential covariate which can be used in both vegetated and unvege-43
tated environments are measurements of gamma radiation from the decay of natural44
radionuclides in the soil. This radiation can be measured using airborne sensors; the45
data correspond to the top 50 cm of a mineral-dominated soil, and depths of up to46
one metre in low density materials such as peat. Airborne radiometric survey has been47
used extensively in Australia for digital soil mapping (Cook et al., 1996). Typically48
3
Page 3 of 37 European Journal of Soil Science

For Peer Review
the data on emissions are processed to generate values from three spectral bands which49
correspond to the decay of potassium (K), thorium (Th) and uranium (U). In a recent50
study in Australia, Minasny et al. (2006) combined data on radiometric K, land use51
and terrain attributes to develop a depth-based function for estimation of SOC.52
There are two reasons why we might expect spatial correlation between gamma53
emissions from the soil and its SOC content in the wetter landscape of north-western54
Europe. First, the well-established spatial correlation between gamma-ray attenuation55
and soil moisture (Carroll, 1981) extends to SOC because the latter accumulates in56
soils which are wet or waterlogged for much of the year. Water reduces the intensity57
of gamma-rays significantly more than air; a 10% increase in soil water leads to a58
reduction in K gamma radiation by the same amount (Minty, 1979). Second, for soil59
with a wide range of SOC contents, the mineral content (and gamma emission) will be60
smaller where organic matter contents are larger for soils derived from the same parent61
material (with similar mineral composition). As the organic matter content rises, the62
mineral content declines in a simple, two-component composition. It may be possible63
to use these relationships to improve SOC estimation in organic rich soils such as those64
of the Arctic Tundra (Smith et al., 2004) or temperate latitudes such as Scotland and65
Wales (Scottish Executive, 2007), so this approach warrants further investigation.66
There have been relatively few regional-scale, airborne radiometric surveys of67
landscapes in which SOC contents represent significant terrestrial carbon stores – such68
surveys have been undertaken in Finland (Lilja & Nevalainen, 2005) and Sweden (Lun-69
den et al., 2001). One example is the recently-completed Tellus survey of Northern70
Ireland (13 550 km2), in which SOC measurements and airborne geophysical surveys71
(including the detection of gamma emitting radiation) were undertaken at around the72
same time. The aim of this paper is to determine to what extent airborne radiometric73
survey data and terrain attributes can be used as secondary covariates to improve esti-74
mates of SOC across the landscape of Northern Ireland. A second objective is to assess75
whether improvements in SOC estimation based on these covariates differs markedly76
4
Page 4 of 37European Journal of Soil Science

For Peer Review
for the three major soil types across this landscape. Also we explore whether the77
inclusion of information on radiometric K means that the number of observations of78
SOC required for adequate predictions is reduced. We discuss the implications of our79
findings for improving the estimation of SOC in cognate landscapes and some potential80
limitations to the application of airborne radiometric survey for this purpose.81
Methods82
Study region and surveys83
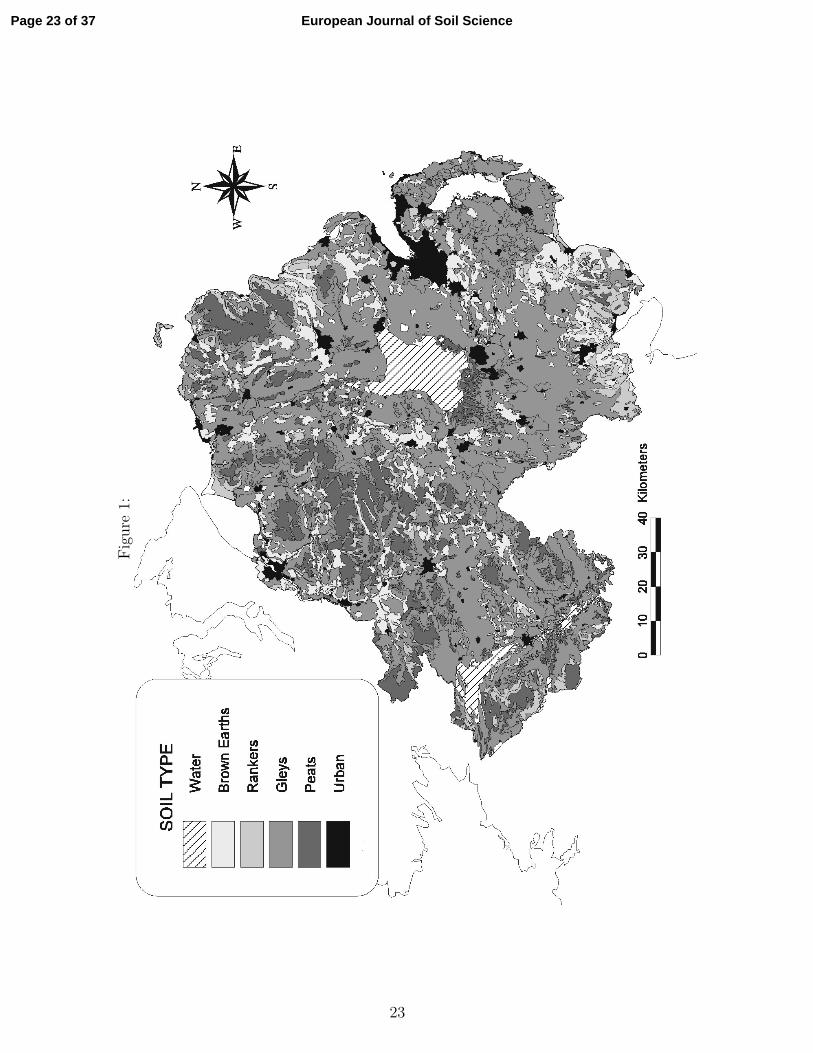
The soils of Northern Ireland have been described by Cruickshank (1997) and comprise84
poorly-drained gley soils (54%), peats and rankers (24%) and freely drained soils (16%)85
– see Figure 1. In the soil surveys of Northern Ireland described by Cruickshank (1997)86
soil inspection pits were dug to between 80 and 90 cm. The larger proportion of gley87
soils by comparison to England, Wales and Scotland reflects the wetter environment88
of Northern Ireland, where average annual rainfall for the vast majority of the region89
is greater than 1 m, with a minimum of around 0.75 m. Large areas of the region90
are more than 100 m above sea level, with a maximum attitude around 850 m, whilst91
central and eastern areas have lower elevations (<40 m).92
The airborne geophysical survey of the whole of Northern Ireland was flown in93
the summers of 2005 and 2006. Radiometric data were collected with an Exploranium94
GR820 256 channel gamma spectrometer system comprising 32 litres of downward95
looking NaI(Tl) detectors and 8 litres of upward looking detectors. Data were collected96
every second (approximately 70 m flight line distance). The gamma radiation measured97
comes from a shallow surface layer of no more than about 30 cm in rock, although this98
will increase for low-density unconsolidated materials, perhaps to a maximum of a few99
metres in dry peat. The ground area or footprint, from which most of the contribution100
of gamma radiation comes, has the form of an ellipse elongated in the flight direction.101
For example, at 56 m altitude, 75% of the measured radiation will come from a width102
of about 150 m, extending to around 220 m along the flight line (Pitkin & Duval, 1980).103
Survey lines were spaced 200 m apart and orientated NNW or SSE (165 and 345 ◦), with104
5
Page 5 of 37 European Journal of Soil Science

For Peer Review
tie-lines 2000 m apart, and at right angles to the flight line directions, acquired only in105
the early part of the survey. The flying height was 56 m above ground in rural areas.106
Procedures for processing the airborne radiometric data were based on those described107
in AGSO and IAEA reference manuals (Grasty & Minty, 1995; IAEA, 1991). The108
processing included corrections for aircraft and cosmic background radiation, aircraft109
altitude and spectral interactions. The corrected count rates were used to estimate110
the concentration of the three radioelements across specific energy ranges (MeV): K111
(1.37–1.57), U (1.66–1.86), Th (2.41 – 2.81). The survey yielded ca. 1.2 million values112
for equivalent K(%) and Th (mg kg−1), U (mg kg−1) and man-made radionuclides,113
predominantly 137Cs, although we do not consider the latter in this paper.114
To assess whether temporal fluctuations in soil moisture status during the pe-115
riod of the airborne surveys was broadly representative of the long-term average, we116
extracted from the MIDAS database (UK Meteorological Office) monthly rainfall data117
(mm) throughout 2005 and 2006, along with average monthly rainfall between 1961118
and 1990 for meteorological stations across Northern Ireland.119
The soil geochemical survey was undertaken between July 2004 and March 2006.120
A sample of topsoil was collected from a site in every other square kilometre of the Irish121
National Grid, by simple random selection within each square, subject to the avoidance122
of roads, tracks, railways, urban areas and other seriously disturbed ground. There were123
6862 sample sites in total. At each site soil was taken with a hand auger from between124
depths of 5 and 20 cm from five holes at the corners and centre of a square with a side of125
length 20 m and combined to form a bulked sample. All samples of soil were air-dried126
in a dedicated temperature controlled oven at 30 ◦C for 2–3 days and disaggregated.127
From each a 50-g sub-sample was ground in an agate planetary ball mill. The total128
concentrations of 55 major and trace elements were determined in each sample by129
wavelength and energy dispersive XRFS (X-Ray Fluorescence Spectrometry), although130
we only consider K (%), Th (mg kg−1) and U (mg kg−1) in this study. Soil organic131
carbon was estimated in each sample using loss-on-ignition analysis by heating a sub-132
6
Page 6 of 37European Journal of Soil Science

For Peer Review
sample 450 ◦C for eight hours and multiplying the mass difference by 0.58 (Broadbent,133
1953). The coefficient of variation for this method for 174 replicate analyses of a sample134
standard was 3.6%.135
The topographic data were a series of 50-m spaced observations for elevation136
(m) covering Northern Ireland (Ordnance Survey of Northern Irelands data) based137
on airborne, photogrammetric acquisition; 65% of the data are accurate to ± 1 metre.138
Simple linear interpolators are often used to create continuous Digital Elevation Models139
(DEMs; Moore et al., 1991) from stereo, aerial photo-derived point elevation data. We140
used inverse distance weighted (IDW) interpolation to form a DEM surface in ESRI141
ArcMapTM .142
We used the DEM to estimate Compound Topographic Index (CTI) in ArcInfo143
WorkStationTM which has been shown to be correlated with SOC content (Moore et al.,144
1993). We extracted values for elevation (m) and CTI for the soil sampling locations145
by point intersection.146
We used a spatial join procedure to associate each soil sampling observation with147
its nearest radiometric survey observation. The median distance between the sample148
sites and the corresponding radiometric measurement was 52 m, with an interquartile149
range of 47 m showing that the soil sampling locations fall entirely within the support of150
the airborne detector. We used digital versions of the (1:50,000) soil maps of Northern151
Ireland to form a three-fold classification of the soil sampling locations (see Figure 1):152
organic soils (SOC > 20 % and > 50 cm in thickness; peats), organo mineral soils153
(with an organic surface horizon overlying mineral subsoil; peaty podzols, rankers and154
humic-gleays) and mineral soils (no organic horizon and SOC< 10 %; brown-earths,155
podzols, gleys and rankers).156
Exploratory analysis157
The appropriateness of using the airborne measurements of K, Th and U as auxiliary158
information in a regional survey of SOC was initially explored by (i) comparing the159
summary statistics with those of the corresponding ground based variables (Table 1)160
7
Page 7 of 37 European Journal of Soil Science

For Peer Review
and (ii) by calculating the correlation coefficients between the airborne and ground161
based variables and the estimates of SOC based upon LOI analysis (Table 2). Sim-162
ilarly we also explored the correlation of SOC with the two terrain variables. These163
exploratory analyses were the basis for deciding on the variables to include in our164
models of SOC variation.165
We calculated total annual rainfall for a subset of 20 meteorological stations166
across Northern Ireland for both 2005 and 2006, the years in which the airborne surveys167
were flown. A comparison of these data with the long-term, average annual rainfall168
(1961-1990) indicated that they were of a similar magnitude. We also plotted monthly169
rainfall totals for observations from several meteorological stations during 2005 and170
2006 and compared these to the long-term monthly averages (1961-1990). There was no171
compelling evidence that rainfall throughout 2005 or 2006 was spatially or temporally172
anomalous and so we feel justified in assuming that the soil moisture regime over the173
period of the airborne survey was representative of its long-term variation.174
Spatial analysis: linear mixed models175
A prediction set of 3000 observations was randomly extracted from the SOC data set176
and the remaining observations were used as a validation set. We considered linear177
mixed models of the form178
z = Xβ + η, (1)
where X is an n × p design matrix containing values of p auxiliary variables or fixed179
effects, β is the length p vector containing the coefficients of the fixed effects and180
η ∼ N (0,V) is a vector of spatially correlated random residuals with a Gaussian181
distribution and covariance matrix V. We assume that the spatial correlation of η can182
be represented by an isotropic nested nugget and Matern variogram model183
γ (h) = c0 + c1
{1− 1
2ν−1Γ (ν)
(h
a
)ν
Kν
(h
a
)}for h > 0,
γ (h) = 0 for h = 0, (2)
where h is the lag distance separating observation pairs, ν is a smoothing parameter,184
8
Page 8 of 37European Journal of Soil Science

For Peer Review
Kν a modified Bessel function of the second kind of order ν (Abramowitz & Stegun,185
1972) and Γ is the gamma function. Bessel and gamma functions may be calculated by186
many standard numerical packages such as IMSL (1994). The smoothness parameter187
gives the Matern function greater flexibility for modelling the spatial covariance than188
more commonly-used models such as the exponential and spherical models (Webster189
& Oliver, 2007). For each fixed effects matrix we calculated β, the estimate of β, by190
ordinary least squares, subtracted Xβ from the data and used the method of moments191
(Matheron, 1962) to fit the vector of variogram parameters α = (c0, c1, a, ν). Following192
Cressie (1985), when fitting the variogram model to the experimental variogram by least193
squares we applied weights194
wi =N (hi)
γ (hi)2 , (3)
where N(hi) is the number of observation pairs within the bin centred on lag hi and195
γ(hi) is the experimental variogram for hi. Generally the REML estimator is recom-196
mended for fitting linear mixed models (Lark et al., 2006) because there is known to be197
some bias when the method of moments is applied. However for 3000 observations this198
bias will be very small and does not justify the prohibitive computation time required199
by REML.200
We fitted a number of linear mixed models with different fixed effects to the201
prediction data to compare (i) the effectiveness of including different auxiliary variables202
as fixed effects (ii) the effectiveness of fitting a single model for all soil types with the203
effectiveness of fitting different models for each of our three broad soil classes and (iii)204
how the precision of the different linear mixed models varies with the intensity of SOC205
observations. The variables to be included as fixed effects were selected according to206
the findings of our exploratory analyses.207
Each linear mixed model was fitted first to all the prediction data. The linear208
mixed models assume that the random effects are Gaussian and therefore we log trans-209
form the data if the skew is greater than 1 and this assumption is implausible (Webster210
& Oliver, 2007). We note that strictly we should test the skew once we have subtracted211
9
Page 9 of 37 European Journal of Soil Science

For Peer Review
the fixed effects from the data. However this could lead to the data being transformed212
for some but not all of the models so in order to make fair comparisons between the213
different models we decide whether to transform based upon the skew of the raw data.214
The entire prediction set had skew equal to 2.03. Therefore a log transform was ap-215
plied and the skew was reduced to 0.92. The empirical best linear unbiased predictor216
(E-BLUP) was used to predict SOC content at the validation sites (Lark et al., 2006).217
To calculate the mean prediction in the original units – and the mean squared error218
MSE between the predictions and observed SOC values at the validation sites – an219
unbiased inverse log transform (Cressie, 2004) was performed.220
The prediction and validation data were then divided into the three soil classes221
according to our three-fold classification and separate models were fitted to the predic-222
tion data from each class and the appropriate soil class model was used to predict SOC223
content at each validation location by the E-BLUP. The skew for the SOC in mineral224
soil was 3.94 which was reduced to 0.80 by applying a log transform. No transform was225
applied to data from the organo mineral and peat soil classes because they had skew226
of 0.86 and -0.53 respectively.227
The values of SOC are substantially larger on peat soils than mineral soils and228
sites at which the soil is mis-classified are likely to have large prediction errors which229
will dominate the MSE. We therefore also record the median square error (MdSE) and230
the MdSE based upon the back transform to the median prediction in the original231
units.232
This test was then repeated using random subsets of ns of the prediction data233
where ns = 100, 200, . . . 2900, to explore how the quality of the predictions at the234
validation sites varies with the number of SOC observations.235
Results236
Exploratory analysis237
The airborne radiometric estimates of K and Th were strongly correlated with their238
measurements in the soil survey (r=0.86 and 0.80 respectively; Table 2) which demon-239
10
Page 10 of 37European Journal of Soil Science

For Peer Review
strates that the airborne survey is an effective method for estimating these elements.240
Airborne radiometric estimates of K exhibited a strong negative correlation with ground-241
based estimates of SOC (r= -0.51); this correlation was stronger than for Th, U and242
total counts. We therefore chose to include radiometric K as a fixed effect in a linear243
mixed model of SOC. Furthermore, plots of radiometric K against SOC (not shown)244
suggested that this relationship may be nonlinear and therefore the square of radio-245
metric K (K2) was also included as a fixed effect.246
We also explored the correlation of SOC with the two terrain parameters: altitude247
and compound topographic index (CTI). First we transformed the SOC data to a248
more Gaussian distribution by taking natural logarithms; the transformed variable249
had a skewness coefficient of 0.94. The correlation coefficients (r) between log SOC250
and altitude and CTI were, respectively: 0.6 and -0.03. Given the strong positive251
correlation between SOC and altitude we chose to include the latter as a fixed effect252
in the estimation of SOC.253
The histogram of the SOC observations across all soil types in Northern Ireland254
is shown in Figure 2a. The distribution of SOC is bimodal. The main peak occurs255
between 0 and 10 % and there is a secondary peak around 50 %, which corresponds to256
peat soils. Bimodal distributions are not suited to geostatistical analyses and therefore257
this histogram vindicates our decision to analyse mineral, organo mineral and peat258
soils separately. We expect that mineral soils will have SOC less than 20 % and peat259
soils will have SOC greater than 20 %; this is the threshold adopted in Northern260
Ireland. According to the (1:50,000) soil map of Northern Ireland, 5552 (81.0 %) of261
the observations are from mineral soils, 382 (5.6 %) are from organo mineral soils and262
915 (13.4 %) are from peat soils. Figures 2 b, c and d show the distribution of SOC263
for mineral, organo mineral and peat soils.264
The largest peak in the organo mineral soils is for SOC less than 10 % but there is265
a secondary peak greater than 50 %. Thus a substantial proportion of our observations266
appear to be misclassified by the soil map. This is likely to be because the soil map267
11
Page 11 of 37 European Journal of Soil Science

For Peer Review
is unsuitable for recognising very local variations in soil type. The soil classification is268
partially successful in separating the observations with large and small SOC and the269
secondary peak is not evident in the mineral soil distribution. However, some larger270
than expected SOC values remain in the mineral soil set (4 % of mineral soils have271
SOC greater than 20 %). The majority of peat soil observations have SOC greater272
than 40 % although 26 % of observations have SOC less than 20 %.273
Spatial analysis: linear mixed models274
The effectiveness of six different linear mixed models of SOC variation were compared.275
The fixed effects for these models were:276
Model 1 Constant (i. e. the mean),277
Model 2 Constant and altitude,278
Model 3 Constant and K,279
Model 4 Constant, K and K2,280
Model 5 Constant, altitude and K,281
Model 6 Constant, altitude, K and K2.282
Figures 3-6 show the variograms fitted to residuals of all soils, mineral soils, organo283
mineral soils and peat soils respectively. On the all soils variogram the sill variance is284
largest when the fixed effects consist of a constant (the overall mean). The sill variance285
is reduced when altitude is also included in the fixed effects and further reductions286
are achieved by including radiometric K. The smallest variances are seen for Model 6.287
A similar pattern is seen on the mineral soils variogram although the semi-variances288
are substantially smaller for each model than the all soils variograms. For the organo289
mineral and peat variograms the sill variances are again largest with constant fixed290
effects and a greater reduction in these variances is achieved by including radiometric291
K rather than altitude. There is some evidence of spatial correlation in the Model 1292
(constant mean) variograms on organo mineral and peat soils but the proportion of293
spatially correlated variation becomes smaller as other variables are added to the fixed294
effects. This indicates that the spatial correlation has been resolved by the inclusion295
12
Page 12 of 37European Journal of Soil Science

For Peer Review
of other variables in the fixed effects.296
Figures 7-9 illustrate the different components of a single Model 6 linear mixed297
model fitted on all soils types. The log SOC observations are presented in Figure 7, the298
contributions from the fixed effects are presented in Figure 8 and the residuals between299
the observations and fixed effect contributions are presented in Figure 9. The fixed300
effects contain many of the large scale features of the observations such as large SOC301
values in the NE, SE, SW and a cluster slightly NW of centre. The residuals show302
less spatial structure, as would be expected from the almost all nugget variogram for303
Model 6 in Figure 3.304
The MSEs between the observations and predictions at the validation sites are305
shown in Table 3 and the MdSEs in Table 4. We indicate the number of soil classes into306
which the prediction set is divided for fitting of the linear mixed model. The first two307
rows of each table show the errors upon predicting SOC over the entire validation set.308
In the remaining six rows the validation set is divided according to the soil classification309
and the errors for each classification are shown.310
As variables are added to the fixed effects the MSEs and MdSEs generally decrease311
in the same pattern as the semi-variances in Figures 3-6 with the largest decreases312
occurring when radiometric K is added to the fixed effects. This illustrates that SOC313
is correlated with altitude but more effective information comes from radiometric K.314
The MSEs and MdSEs are smaller when separate models are fitted to each soil315
class than when the soil classes are combined. For example the smallest MSE for316
the model fitted to the entire prediction set is 41.08 %2 whereas the smallest MSE317
when three separate models are fitted is 30.38 %2. The greatest improvement for three318
models over one model is seen for peat, particularly when the fixed effects include319
radiometric K. The MSEs for mineral soils when three models are fitted are slightly320
larger than those from a single model. We suspect that this is an artefact due to321
the large squared differences between predictions and observations which have been322
mis-classified as mineral. To illustrate this Table 5 contains the MSEs for mineral323
13
Page 13 of 37 European Journal of Soil Science

For Peer Review
soils when only observations with SOC less than 20 % are included in the validation324
set. Removing the observations from mineral soils which we assume are mis-classified325
reduces the MSEs, and the MSEs for three models are now substantially less than those326
for one model. The MdSEs are consistently smaller than the MSEs further illustrating327
that the MSEs are dominated by classification errors.328
Figure 9 compares root MSEs for SOC from Model 6 (the model which generally329
had the smallest MSE), Model 2 (the model with the smallest MSE of those models330
which did not include radiometric K as a fixed effect) and Model 1 (the model with no331
auxiliary information) against n. In each of these plots, separate models are fitted for332
each soil class. The results are combined to give the MSE across Northern Ireland in (a)333
and plots (b), (c) and (d) show the absolute differences over mineral, organo mineral334
and peat soils respectively. In each plot a substantial improvement upon including335
radiometric K in the fixed effects is evident. We also note that the precision of our336
predictions decreases very slowly as n decreases.337
Discussion338
The distribution of SOC will be bimodal over any study region which contains both339
organic and mineral soils. Thus if we wish to map SOC over such a region we must340
address the problem of applying geostatistics to bimodal distributions. By dividing the341
study region into three soil classes based on a (1:50,000) soil map of Northern Ireland342
we substantially improved the precision of SOC predictions across Northern Ireland.343
However a proportion of soils appeared to be mis-classified. The errors at these sites344
dominate the MSEs which are much larger than the corresponding MdSEs which are345
more robust to a proportion of large errors due to mis-classification. Therefore further346
improvements in regional predictions should be based upon improving our ability to347
differentiate peat and non peat soils. Some mis-classification may be inevitable because348
it is not practical to create soil maps which resolve very small scale deposits of organic349
or mineral soil. This classification may be significantly improved by using airborne350
hyperspectral data (McMorrow et al., 2004) or satellite data (e.g. ASTER or Landsat).351
14
Page 14 of 37European Journal of Soil Science

For Peer Review
Even without such improvements, the approach we describe could be applied to the352
data from the Tellus survey in combination with data on soil bulk density to improve353
current estimates of carbon pools across Northern Ireland, in which peat soils are354
estimated to account for more than 50% of the total (Cruickshank et al., 1998).355
Further work is required to elucidate the factors influencing the airborne esti-356
mates of radiometric K and its spatial correlation with SOC for each of the three soil357
types. The two dominant factors which influence this are: i) the variation in mineral-K358
content; this decreases with increasing quantities of soil organic matter, and ii) increas-359
ing soil-moisture resulting in greater attenuation of the gamma signal from the soil.360
This would require contemporaneous measurements of soil moisture content which we361
do not have from the original survey.362
There are likely to be limitations to the widespread application of airborne radio-363
metric data as a covariate for mapping SOC. First, it relies upon a spatial correlation364
between SOC and long-term (i.e. annual) soil moisture content which is only likely365
to occur in certain combinations of climate, topography and land use where SOC has366
accumulated above some minimum threshold. The soils of northern Europe include sig-367
nificant areas with soils common to those in northern Ireland, particularly the Gleysols368
and Histosols of northern Scandanavia, the Baltic States and Russia. Further work is369
required to establish the utility of airborne radiometric data as a covariate for map-370
ping SOC, particularly for the large area of Podzols across northern Europe (European371
Soil Bureau Netowrk, 2005). Second, patterns of antecedent rainfall conditions and the372
quantity of precipitation during the airborne survey may cause unusually large temporal373
and spatial variations in soil moisture contents across the study area. This may reduce374
the degree of spatial correlation between SOC and the gamma radiation which is due to375
greater attenuation of the latter where the ground is wetter and where carbon accumu-376
lates. To address this potential limitation, it may be possible to ensure surveys are not377
flown when significantly atypical soil moisture conditions occur, based on antecedent378
rainfall data and medium-term precipitation forecasts. In addition, laboratory-based379
15
Page 15 of 37 European Journal of Soil Science

For Peer Review
soil column experiments, in which in-situ measurements of gamma radiation are made380
under controlled soil moisture conditions for soils with range of SOC contents, could be381
used to calibrate the relationship between airborne radiometric data and SOC based382
on antecendent rainfall data. Finally, where the soil parent material contains very little383
K (0.5 %), such as quartzite, the accuracy of airborne radiometric estimation of soil-K384
may be insufficient. However, 90 % of European soils contain more than 0.83 % K (or385
1 % K2O; Salminen, 2005) suggesting that for the vast majority of soils, accuracy near386
the limit of detection is unlikely to be problematic.387
One of the main applications of SOC maps is the estimation of carbon stocks.388
Where soil carbon is concentrated in the upper horizons, radiometry may be partic-389
ularly useful as a covariate as it measures gamma radiation from the upper 35 cm of390
the solum. However, in deep organic-rich soils or areas of Arctic tundra where SOC391
may be transported to depth by cryoturbation (Ping et al., 1997), the utility of gamma392
radiometry will be diminished because no information is provided for the deeper parts393
of the soil profile.394
Conclusions395
Our results show that the precision of regional predictions of SOC across Northern396
Ireland are substantially improved by including auxiliary information on radiometric397
K from airborne surveys as fixed effects in a linear mixed model of SOC variation. To398
a lesser extent the precision is also improved by including altitude in the linear mixed399
model. We have also seen that the number of observations of SOC may be substantially400
reduced with little cost in terms of the precision of the predictions. However the401
MSEs between predictions and observations are still large even when radiometric K402
and altitude are included in the linear mixed model. This is because SOC in Northern403
Ireland has a bimodal distribution which is not suited to geostatistical analyses. After404
separating the soil into three main classes (mineral, organo mineral and organic), the405
MSEs are substantially reduced. However, large independent validation errors occur406
at certain mis-classified sites where, for example, the soil map shows a mineral soil but407
16
Page 16 of 37European Journal of Soil Science

For Peer Review
its SOC content indicates it is organic. Improvements in our ability to differentiate408
between mineral and organic-rich soils are required to make better predicitions of the409
SOC at the regional scale.410
Acknowledgements411
The Tellus surveys were financed in Northern Ireland by the the Department of En-412
terprise, Trade and Investment and the ’Building Sustainable Prosperity’ scheme of413
the Rural Development Programme. Topographic data based upon Ordnance Survey414
of Northern Irelands R© data with the permission of the Controller of Her Majesty’s415
Stationery Office, c©Crown copyright and database rights License Number DMOU205.416
Rainfall data for Northern Ireland were provided from the MIDAS database of the UK417
Meteorological Office. This paper is published with the permission of the Director of418
the British Geological Survey (Natural Environment Research Council) and the Di-419
rector of the Geological Survey of Northern Ireland. B.P. Marchant and R.M. Lark’s420
contributions were part of Rothamsted’s program in Mathematical and Computational421
Biology which is funded by the Biotechnology and Biological Sciences Research Council422
of the United Kingdom. The authors wish to acknowledge the contributions of all staff423
from the Geological Survey of Northern Ireland (including Dr C. Van Dam) and the424
British Geological Survey who were involved in the organisation, collection, analysis or425
processing of the airborne radiometric and soil survey data from the Tellus survey.426
References427
Broadbent, F.E. 1953. The soil organic fraction. Advances in Agronomy, 5, 153–183.428
York.429
Carroll, T.R. 1981, Airborne soil moisture measurement using natural terrestrial430
gamma radiation. Soil Science, 132, 358–366.431
Chen, F., Kissel, D.E., West, L.T., Rickman, D., Luvall, J.C. & Adkins, W. 2005.432
17
Page 17 of 37 European Journal of Soil Science

For Peer Review
Mapping surface soil organic carbon for crop fields with remote sensing. Journal433
Of Soil And Water Conservation, 60, 51–57.434
Cook, S.E., Corner, R.J., Groves, P.R. & Grealish, G. J. 1996. Use of airborne435
gamma radiometric data for soil mapping. Australian Journal of Soil Research,436
34, 183–194.437
Cressie, N. 2006. Block kriging for lognormal spatial processes. Mathematical Geology,438
38, 413–443.439
Cruickshank, M M, Tomlinson, R W, Devine, P M, & Milne, R M. 1998. Carbon in the440
vegetation and soils of Northern Ireland. Biology and Environment: Proceedings441
of the Royal Irish Academy, 98, 9–21.442
Cruickshank, J.G. 1997. Soil and Environment: Northern Ireland. Queen’s University443
of Belfast, Belfast.444
European Soil Bureau Network, 2005. Soil Atlas of Europe Office for official publi-445
caitons of the European Communities, Luxembourg.446
Grasty, R.L. & Minty, B.R.S. 1995. A guide to the technical specifications for air-447
borne gamma-ray surveys. Australian Geological Survey Organisation: Record448
1995/20.449
IAEA, 1991. Airborne gamma ray spectrometer surveying. International Atomic En-450
ergy Agency, Technical Report Series, No. 323.451
Jordan, C. & Higgins, A. 2007. A generalised map of major soil types for Northern452
Ireland at a scale of 1:250,000. Agri- Food and Biosciences Institute, Belfast.453
Based on Cruickshank, J.G. 1997. Soil and Environment: Northern Ireland.454
Queen’s University of Belfast, Belfast.455
Lark, R.M., Cullis, B.R. & Welham, S.J. 2006. On spatial prediction of soil properties456
in the presence of a spatial trend: the empirical best linear unbiased predictor457
18
Page 18 of 37European Journal of Soil Science

For Peer Review
(E-BLUP) with REML. European Journal of Soil Science, 57, 787–799.458
Lilja, H. & Nevalainen, R. 2005. Developing a digital soil map for Finland. In: Digital459
Soil Mapping: An Introductory Perspective eds P. Lagacherie, A.B McBratney &460
M. Voltz. pp. 67-74. Elsevier, Amsterdam, The Netherlands.461
Lunden, B., Wang, G. & Wester, K. 2001. A GIS based analysis of data from Landsat462
TM, airborne geophysical measurements, and digital maps for geological remote463
sensing in the Stockholm region, Sweden. International Journal of Remote Sens-464
ing, 22, 517–532.465
Matern, B. 1960. Spatial variation. Meddelanden fran Statens Skogsforskningsinsti-466
tut, 49. [2nd Edition (1986), Lecture Notes in Statistics, No. 36, Springer, New467
York].468
McBratney, A.B. & Webster, R. 1983. Optimal Interpolation and Isarithmic Mapping469
of Soil Properties.5. Co-Regionalization and Multiple Sampling Strategy. Journal470
of Soil Science 34, 137–162.471
McMorrow, M.J.M., Cutler, M.E.J., Evans, M. G. & Al-Roichdi, A. 2004. Hyperspec-472
tral indices for characterizing upland peat composition. International Journal of473
Remote Sensing, 25, 313–325.474
Minasny, B., McBratney, A.B., Mendonca-Santos, M.L., Odeh, I.O.A. & Guyon, B.475
2006. Prediction and digital mapping of soil carbon storage in the Lower Namoi476
Valley. Australian Journal Of Soil Research, 44, 233–244.477
Minty, B.R.S. 1997. Fundamentals of airborne gamma-ray spectrometry. AGSO Jour-478
nal of Australian Geology and Geophysics, 17, 39–50.479
Moore, I.D., Gessler, P.E., Nielsen, G.A., and Petersen, G.A. 1993. Terrain attributes:480
estimation methods and scale effects. In , (ed A.J. Jakeman, M.B. Beck & M.481
McAleer), pp. 189 - 214. John Wiley & Sons, Chichester.482
19
Page 19 of 37 European Journal of Soil Science

For Peer Review
Moore, I.D., Grayson, R.B. & Ladson, A. R. 1991. Digital Terrain Modelling: a483
Review of Hydrological, Geomorphological and Biological Applications. Hydro-484
logical Processes, 5, 3-30.485
Mueller, T.G. & Pierce, F.J. 2003. Soil carbon maps: enhancing spatial estimates486
with simple terrain attributes at multiple scales. Soil Science Society of America487
Journal, 67, 258–627.488
Odeh, I.O.A., McBratney, A.B. & Chittleborough, D.J. 1995. Further results on489
prediction of soil properties from terrain attributes: heterotopic cokriging and490
regression kriging. Geoderma, 67, 215–226.491
Ping, C.L., Michaelson, G.J. & Kimble, J.M. 1997. Carbon storage along a lattiudinal492
transect in Alaska. Nutrient Cycling in Agroecosystems, 49, 235–242.493
Pitkin, J.A. & Duval, J.S. 1980. Design parameters for aerial gamma surveys. Geo-494
physics, 45, 1427–1439.495
Rawlins, B.G., Webster, R. & Lark, R.M. 2007. Understanding airborne radiomet-496
ric survey signals across part of eastern England. Earth Surface Processes and497
Landforms, 32, 1503–1515.498
Saliminen, R. 2005. Geochemical Atlas of Europe: Part 1. Geological Survey of499
Finland, Espoo.500
Scottish Executive, 2007. ECOSSE Estimating Carbon in Organic Soils Sequestration501
and Emissions. http://www.scotland.gov.uk/Resource/Doc/170721/0047848.pdf.502
Accessed 20th September 2007.503
Selige, T., Bohner, J. & Schmidhalter, U. 2006. High resolution topsoil mapping us-504
ing hyperspectral image and field data in multivariate regression modeling pro-505
cedures. Geoderma, 136, 235–244.506
20
Page 20 of 37European Journal of Soil Science

For Peer Review
Simbahan, G.C. & Dobermann, A. 2006. Sampling optimization based on secondary507
information and its utilization in soil carbon mapping. Geoderma, 133, 345–362.508
Smith, L.C., MacDonald, G.M., Velichko, A.A., Beilam, D.W., Borisova, O.K., Frey,509
K.E., Kremenetski, K.V. & Sheng, Y. 2004. Siberian peatlands a net carbon sink510
and global methane source since the early Holocene. Science, 303, 353–356.511
Webster, R. & Oliver, M.A. 2007. Geostatistics for Environmental Scientists: second512
edition. John Wiley & Sons, Chichester.513
21
Page 21 of 37 European Journal of Soil Science

For Peer Review
List of Figures and Captions
Figure 1 Simple classification of the dominant soil types in Northern Ireland.
Figure 2 Histograms of SOC across (a) all soil types (b) mineral soils (c) organo
mineral soils (d) peats in Northern Ireland.
Figure 3 Variograms of residuals from Model 1 (M1) to Model 6 (M6) in all soils.
Figure 4 Variograms of residuals from Model 1 (M1) to Model 6 (M6) in mineral
soils.
Figure 5 Variograms of residuals from Model 1 (M1) to Model 6 (M6) in organo
mineral soils.
Figure 6 Variograms of residuals from Model 1 (M1) to Model 6 (M6) in peat soils.
Figure 7 Log SOC in all soils. Coordinates are metres of the Irish National Grid.
Figure 8 Model 6 fixed effects for log SOC in all soils. Coordinates are metres of the
Irish National Grid.
Figure 9 Residuals from Model 6 for log SOC in all soils. Coordinates are metres of
the Irish National Grid.
Figure 10 Root mean square error at validation sites against number of random
observations for Model 1, Model 2 and Model 6 over (a) all soils, (b) mineral
soils, (c) organo mineral soils (d) peat soils.
22
Page 22 of 37European Journal of Soil Science
For Peer Review
Fig
ure
1:
23
Page 23 of 37 European Journal of Soil Science

For Peer Review
Fig
ure
2:
010
2030
4050
60
0200400600800
SO
C /
%
Frequency
(a)
All
010
2030
4050
60
0200400600800
SO
C /
%
Frequency
(b)
Min
eral
010
2030
4050
60
051015202530
SO
C /
%
Frequency
(c)
Org
ano
min
eral
010
2030
4050
60
050100150
SO
C /
%
Frequency
(d)
Pea
t
24
Page 24 of 37European Journal of Soil Science

For Peer Review
Figure 3:
0 0.5 1 1.5 2 2.5 3 3.5
x 104
0
0.1
0.2
0.3
0.4
0.5
0.6
Distance /m
Sem
i−va
rianc
e /lo
g(%
2 )
All Soils
M1
M2
M5
M6
M4
M3
25
Page 25 of 37 European Journal of Soil Science

For Peer Review
Figure 4:
0 0.5 1 1.5 2 2.5 3 3.5
x 104
0
0.05
0.1
0.15
0.2
0.25
Distance /m
Sem
i−va
rianc
e /lo
g(%
2 )
Mineral soils
M1
M2
M3
M4M5M6
26
Page 26 of 37European Journal of Soil Science

For Peer Review
Figure 5:
0 0.5 1 1.5 2 2.5 3 3.5
x 104
0
50
100
150
200
250
300
Distance /m
Sem
i−va
rianc
e /%
2
Organo Mineral soils
M2
M1
M5
M3
M6M4
27
Page 27 of 37 European Journal of Soil Science

For Peer Review
Figure 6:
0 0.5 1 1.5 2 2.5 3 3.5
x 104
0
50
100
150
200
250
300
350
400
Distance /m
Sem
i−va
rianc
e /%
2
Peat soils
M3
M2
M1
M6M5M4
28
Page 28 of 37European Journal of Soil Science

For Peer Review
Fig
ure
7:
29
Page 29 of 37 European Journal of Soil Science

For Peer Review
Fig
ure
8:
30
Page 30 of 37European Journal of Soil Science

For Peer Review
Fig
ure
9:
31
Page 31 of 37 European Journal of Soil Science

For Peer Review
Figure 10:
0 1000 2000 30004
6
8
10
12
No. of observations
Roo
t MS
E /%
(a) All
0 1000 2000 30004
4.5
5
5.5
6
No. of observations
Roo
t MS
E /%
(b) Mineral
0 1000 2000 30005
10
15
20
No. of observations
Roo
t MS
E /%
(d) Peat
0 1000 2000 30000
10
20
30
No. of observations
Roo
t MS
E /
%
(c) Organo Mineral
M2
M1
M1
M6
M1M1
M2
M2M2
M6
M6
M6
32
Page 32 of 37European Journal of Soil Science

For Peer Review
Table 1 Summary statistics for the soil and the nearest radiometric survey location
(n=6862). Units are % for K and soil organic carbon (SOC), mg kg−1 for Th and U.
By SS we denote the soil geochemical survey data, and by Rad the radiometric data.
Element K Th UDataset SS-K Rad-K SS-Th Rad-Th SS-U Rad-U SS-SOC
Mean 1.38 0.91 5.04 3.44 2.48 0.79 13.57
Median 1.47 0.89 5.00 3.19 2.30 0.68 7.49
Variance 0.52 0.38 8.10 7.96 8.10 0.64 212
Standard deviation 0.72 0.61 3.00 2.82 2.85 0.80 14.6
Skewness 0.07 0.50 2.48 2.52 29.2 2.82 1.99
Loge skewness 0.94
33
Page 33 of 37 European Journal of Soil Science

For Peer Review
Table 2 Correlation matrix for K, Th, U and soil organic carbon (SOC) for the soil
survey (SS) data and the nearest neighbouring radiometric data (Rad).
Dataset and element
SS-K SS-Th SS-U SS-SOC Rad-K Rad-Th Rad-U
SS-K 1
SS-Th 0.75 1
SS-U 0.18 0.45 1
SS-SOC -0.63 -0.45 -0.03 1
Rad-K 0.86 0.71 0.25 -0.51 1
Rad-Th 0.67 0.80 0.39 -0.36 0.79 1
Rad-U 0.51 0.66 0.36 -0.29 0.60 0.70 1
34
Page 34 of 37European Journal of Soil Science

For Peer Review
Table 3 MSEs for SOC predictions from Models 1-6 (M1- M6) at all validation sitesand at validation sites classified as mineral, organo mineral (O M) and peat soils. Unitsare %2.
Soils Soil classesa M1 M2 M3 M4 M5 M6All 1 119.42 116.67 60.18 41.08 67.69 49.37
3 78.70 73.14 36.92 30.60 34.24 30.38
Mineral 1 34.45 30.11 17.74 14.95 17.89 15.443 26.34 24.95 20.97 19.57 19.79 18.85
O M 1 215.24 319.65 107.04 93.01 139.65 108.083 238.53 216.96 127.05 102.98 112.88 110.74
Peat 1 523.05 485.37 262.17 156.18 298.53 202.273 286.82 265.99 83.69 58.82 77.79 58.04
a The number of soil classes into which the prediction set is divided when fitting thelinear mixed model.
35
Page 35 of 37 European Journal of Soil Science

For Peer ReviewTable 4 MdSDs for SOC predictions from Models 1-6 (M1-M6) at all validation sitesand at validation sites classified as mineral, organo mineral (O M) and peat soils. Unitsare %2.
Soils Soil classesa M1 M2 M3 M4 M5 M6All 1 4.77 4.69 3.37 2.99 3.41 3.01
3 3.22 3.03 2.45 2.20 2.38 2.26
Mineral 1 2.79 2.84 1.96 1.91 2.01 1.973 1.94 1.83 1.65 1.53 1.51 1.51
O M 1 51.00 40.13 22.83 22.85 21.07 18.713 102.37 93.12 49.17 37.81 39.57 45.14
Peat 1 406.92 282.18 169.17 101.81 130.21 99.703 192.38 190.50 27.70 12.07 26.33 10.06
a The number of soil classes into which the prediction set is divided when fitting thelinear mixed model.
36
Page 36 of 37European Journal of Soil Science

For Peer Review
Table 5 MSEs for SOC predictions from Models 1-6 (M1- M6) on validation sitesclassified as mineral soils when observations greater than 20 % are removed from thevalidation set. Units are %2.
Soils Soil classesa M1 M2 M3 M4 M5 M6Mineral 1 21.85 15.73 10.60 8.94 8.81 8.00
3 6.93 6.71 5.87 5.83 5.69 5.76
a The number of soil classes into which the prediction set is divided when fitting thelinear mixed model.
37
Page 37 of 37 European Journal of Soil Science


![Overview and Scutiny Power BI slides.pptx [Read-Only]€¦ · Dtm 4 Consultant Pod g Dtm I Dtm 8 7 Dtm 3 8 7 Dtm 6 Dtm Pod 4 8 Dtm Pod 4 5 Dtm 2 8 Dtm Pod 8 Dtm I 7 Dtm 4 Dtm Pod](https://static.fdocuments.us/doc/165x107/5fb41d34b5c9a8274925974c/overview-and-scutiny-power-bi-read-only-dtm-4-consultant-pod-g-dtm-i-dtm-8-7-dtm.jpg)