Airborne observation of mixing across the entrainment … · Airborne observation of mixing across...
15
Atmos. Chem. Phys., 16, 6011–6025, 2016 www.atmos-chem-phys.net/16/6011/2016/ doi:10.5194/acp-16-6011-2016 © Author(s) 2016. CC Attribution 3.0 License. Airborne observation of mixing across the entrainment zone during PARADE 2011 Florian Berkes 1,2,a , Peter Hoor 1 , Heiko Bozem 1 , Daniel Kunkel 1 , Michael Sprenger 3 , and Stephan Henne 4 1 Institute for Atmospheric Physics, Johannes Gutenberg University Mainz, Mainz, Germany 2 Department of Atmospheric Chemistry, Max Planck Institute for Chemistry, Mainz, Germany 3 Institute for Atmospheric and Climate Science, ETH Zurich, Zürich, Switzerland 4 Empa Swiss Federal Laboratories for Materials Science and Technology, Dübendorf, Switzerland a now at: Institute of Energy and Climate Research-8: Troposphere, Forschungszentrum Jülich GmbH, Jülich, Germany Correspondence to: Florian Berkes ([email protected]) Received: 23 September 2015 – Published in Atmos. Chem. Phys. Discuss.: 27 October 2015 Revised: 13 April 2016 – Accepted: 1 May 2016 – Published: 18 May 2016 Abstract. This study presents the analysis of the structure and air mass characteristics of the lower atmosphere during the field campaign PARADE (PArticles and RAdicals: Diel observations of the impact of urban and biogenic Emissions) on Mount Kleiner Feldberg in southwestern Germany dur- ing late summer 2011. We analysed measurements of mete- orological variables (temperature, moisture, pressure, wind speed and direction) from radio soundings and of chemical tracers (carbon dioxide, ozone) from aircraft measurements. We focus on the thermodynamic and dynamic properties that control the chemical distribution of atmospheric constituents in the boundary layer. We show that the evolution of tracer profiles of CO 2 and O 3 indicate mixing across the inversion layer (or entrainment zone). This finding is supported by the analysis of tracer–tracer correlations which are indicative for mixing and the relation of tracer profiles in relation to the evolution of the boundary layer height deduced from radio soundings. The study shows the relevance of entrainment processes for the lower troposphere in general and specifi- cally that the tracer–tracer correlation method can be used to identify mixing and irreversible exchange processes across the inversion layer. 1 Introduction The evolution of the planetary boundary layer (PBL) from stably stratified in the morning to well mixed in the afternoon is a multifaceted process and potentially leads to enhanced mixing between the PBL and the free troposphere (FT) (Stull, 1988). At sunset, a stable boundary layer with low turbu- lence intensity grows near the surface (Mahrt, 2014). Be- tween this layer and the FT, a neutrally stratified layer re- mains, resulting from the decay of turbulence of the convec- tive PBL during daytime. This layer, called the residual layer, maintains the chemical composition of the original convec- tive PBL (Stull, 1988). The turbulent-convective PBL and the overlaying FT are separated by the capping inversion, which often acts as a transport barrier. This barrier, which is in- dicated by changes of the vertical gradients of temperature, humidity, aerosol content and chemical constituents, can be overcome by frontal activity (Sinclair et al., 2010). Frontal systems ahead of the respective cold and warm sectors of a cyclonic depression lead to vertical exchange between the PBL and the FT and potentially mix both air masses (Don- nell et al., 2001). This is also the case for shallow and deep convection (e.g. Flaty et al., 1995; Hauf et al., 1995). The so-called entrainment zone (EZ) is a layer of intermittent tur- bulence at the top of the PBL where air masses from the FT are entrained into the capping inversion and thus can interact with convective thermals from the PBL (e.g. Angevine, 2007; Bange et al., 2007). Based on lidar (Träumner et al., 2011), wind profiler (Cohn and Angevine, 2000) and ceilometer measurements (Eresmaa et al., 2006), the extent of the EZ was estimated to be 20–40 % of the PBL depth (Martin et al., 2014). Airborne flux measurements of heat and moisture were used to determine the impact of entrainment on their budgets Published by Copernicus Publications on behalf of the European Geosciences Union.
Transcript of Airborne observation of mixing across the entrainment … · Airborne observation of mixing across...

Atmos. Chem. Phys., 16, 6011–6025, 2016
www.atmos-chem-phys.net/16/6011/2016/
doi:10.5194/acp-16-6011-2016
© Author(s) 2016. CC Attribution 3.0 License.
Airborne observation of mixing across the entrainment
zone during PARADE 2011
Florian Berkes1,2,a, Peter Hoor1, Heiko Bozem1, Daniel Kunkel1, Michael Sprenger3, and Stephan Henne4
1Institute for Atmospheric Physics, Johannes Gutenberg University Mainz, Mainz, Germany2Department of Atmospheric Chemistry, Max Planck Institute for Chemistry, Mainz, Germany3Institute for Atmospheric and Climate Science, ETH Zurich, Zürich, Switzerland4Empa Swiss Federal Laboratories for Materials Science and Technology, Dübendorf, Switzerlandanow at: Institute of Energy and Climate Research-8: Troposphere, Forschungszentrum Jülich GmbH, Jülich, Germany
Correspondence to: Florian Berkes ([email protected])
Received: 23 September 2015 – Published in Atmos. Chem. Phys. Discuss.: 27 October 2015
Revised: 13 April 2016 – Accepted: 1 May 2016 – Published: 18 May 2016
Abstract. This study presents the analysis of the structure
and air mass characteristics of the lower atmosphere during
the field campaign PARADE (PArticles and RAdicals: Diel
observations of the impact of urban and biogenic Emissions)
on Mount Kleiner Feldberg in southwestern Germany dur-
ing late summer 2011. We analysed measurements of mete-
orological variables (temperature, moisture, pressure, wind
speed and direction) from radio soundings and of chemical
tracers (carbon dioxide, ozone) from aircraft measurements.
We focus on the thermodynamic and dynamic properties that
control the chemical distribution of atmospheric constituents
in the boundary layer. We show that the evolution of tracer
profiles of CO2 and O3 indicate mixing across the inversion
layer (or entrainment zone). This finding is supported by the
analysis of tracer–tracer correlations which are indicative for
mixing and the relation of tracer profiles in relation to the
evolution of the boundary layer height deduced from radio
soundings. The study shows the relevance of entrainment
processes for the lower troposphere in general and specifi-
cally that the tracer–tracer correlation method can be used to
identify mixing and irreversible exchange processes across
the inversion layer.
1 Introduction
The evolution of the planetary boundary layer (PBL) from
stably stratified in the morning to well mixed in the afternoon
is a multifaceted process and potentially leads to enhanced
mixing between the PBL and the free troposphere (FT) (Stull,
1988). At sunset, a stable boundary layer with low turbu-
lence intensity grows near the surface (Mahrt, 2014). Be-
tween this layer and the FT, a neutrally stratified layer re-
mains, resulting from the decay of turbulence of the convec-
tive PBL during daytime. This layer, called the residual layer,
maintains the chemical composition of the original convec-
tive PBL (Stull, 1988). The turbulent-convective PBL and the
overlaying FT are separated by the capping inversion, which
often acts as a transport barrier. This barrier, which is in-
dicated by changes of the vertical gradients of temperature,
humidity, aerosol content and chemical constituents, can be
overcome by frontal activity (Sinclair et al., 2010). Frontal
systems ahead of the respective cold and warm sectors of
a cyclonic depression lead to vertical exchange between the
PBL and the FT and potentially mix both air masses (Don-
nell et al., 2001). This is also the case for shallow and deep
convection (e.g. Flaty et al., 1995; Hauf et al., 1995). The
so-called entrainment zone (EZ) is a layer of intermittent tur-
bulence at the top of the PBL where air masses from the FT
are entrained into the capping inversion and thus can interact
with convective thermals from the PBL (e.g. Angevine, 2007;
Bange et al., 2007). Based on lidar (Träumner et al., 2011),
wind profiler (Cohn and Angevine, 2000) and ceilometer
measurements (Eresmaa et al., 2006), the extent of the EZ
was estimated to be 20–40 % of the PBL depth (Martin et al.,
2014).
Airborne flux measurements of heat and moisture were
used to determine the impact of entrainment on their budgets
Published by Copernicus Publications on behalf of the European Geosciences Union.
6012 F. Berkes et al.: Airborne observation of a mixing event across the entrainment zone during PARADE 2011
(e.g. Driedonks and Tennekes, 1984; Canut et al., 2010), and
to understand the influence of entrainment on the develop-
ment of boundary layer clouds (Stevens et al., 2003) and the
decay of stratocumulus clouds (e.g. Lilly, 1968). Malinowski
et al. (2013) showed that turbulent mixing between the cloud
top and the FT depends on the thermodynamic properties
(static stability) and wind shear (dynamic instability). More-
over, radiative effects can change the entrainment flux at the
cloud tops and lead to exchange and mixing as well between
the FT and PBL (Moeng et al., 1999).
Modelling studies revealed that changes of the (static)
stability, low-level wind shear, and turbulent motions af-
fect not only the growth of the boundary layer but also the
entrainment at the PBL top (e.g. Driedonks and Tennekes,
1984; Sullivan et al., 1998; Cohen, 2000). Lock et al. (2000)
showed that mixing and entrainment at the top of the PBL de-
pend on the surface buoyancy flux, the inversion strength and
on the influence of wind shear (Conzemius and Fedorovich,
2006).
In recent years substantial efforts have been made to un-
derstand the driving physical processes of temperature and
humidity transport during the growth or decay of the PBL
as summarised by Lothon et al. (2014). It is still difficult to
quantify the role of the EZ for the mixing of trace gases,
because of its high spatial, vertical and temporal variability
(Martin et al., 2014). Vila-Guerau de Arellano (2004) was
able to show that the downward transport of CO2 from the
FT into the PBL can enhance or reduce CO2 mixing ratios
within the PBL which then can lead to a misinterpretation
of possible CO2 sources. Vertical gradients of ozone exist
as well between the PBL and FT, and they are strongly af-
fected by transport processes and chemical reactions. Mea-
surements and modelling studies of O3 revealed that convec-
tive transport of ozone precursors leads to chemical ozone
formation in the FT and enhances the background concen-
trations (Hov and Flatoy, 1997; Henne et al., 2005). Cooper
et al. (2015) highlighted that surface air quality regulations
in the US strongly depend on accurate knowledge of base-
line ozone, which is defined as ozone transported downwind
from anthropogenic and natural sources, while forecast of
baseline ozone needs large knowledge of all different trans-
port processes. This includes intercontinental transport from
Asia, which is often associated with episodes of enhanced
ozone concentrations over large parts of the western US that
is located at relatively high altitudes (Lin et al., 2012). More-
over, downward transport of ozone-rich air from the FT can
enhance ozone mixing ratio in the PBL (Beck et al., 1997;
McKendry and Lundgren, 2000; Jaffe, 2011).
Neuman et al. (2012) used tracer–tracer (CO-O3) cor-
relations to identify the in-mixing of ozone from the FT
into the PBL. This approach is commonly used to iden-
tify stratosphere–troposphere exchange (e.g. Fischer et al.,
2000; Hoor, 2002). Generally the approach makes the as-
sumption of two well-mixed reservoirs, which give rise to
linear tracer–tracer relationships in the case of mixing. How-
ever, the boundary layer acts as a barrier for mixing and often
exhibits strong trace gas gradients. Therefore the distribution
of data points in tracer–tracer scatter plots sub-divide into
distinct groups depending on the mixing ratios of the respec-
tive well-mixed reservoirs. Mixing between these air masses
leads to linear connections between these groups (mixing
lines).
Handisides (2001) presented ozone and peroxy radical ob-
servations from the local valley and from Mount Kleiner
Feldberg and linked his findings to transport within different
boundary layer structures in summertime. Moreover during
winter, Wetter (1998) observed on the top of Mount Kleiner
Feldberg CO plumes transported out of the stable boundary
layer below the summit. In both studies the PBL structure
was not investigated in detail. However, this is necessary to
understand and interpret the temporal evolution of the spa-
tial distribution of atmospheric trace species measured within
and above the PBL, especially over complex terrain where
handover processes between the PBL and the FT are addi-
tionally triggered by thermally induced flow systems (Koss-
mann et al., 1999; Henne et al., 2004).
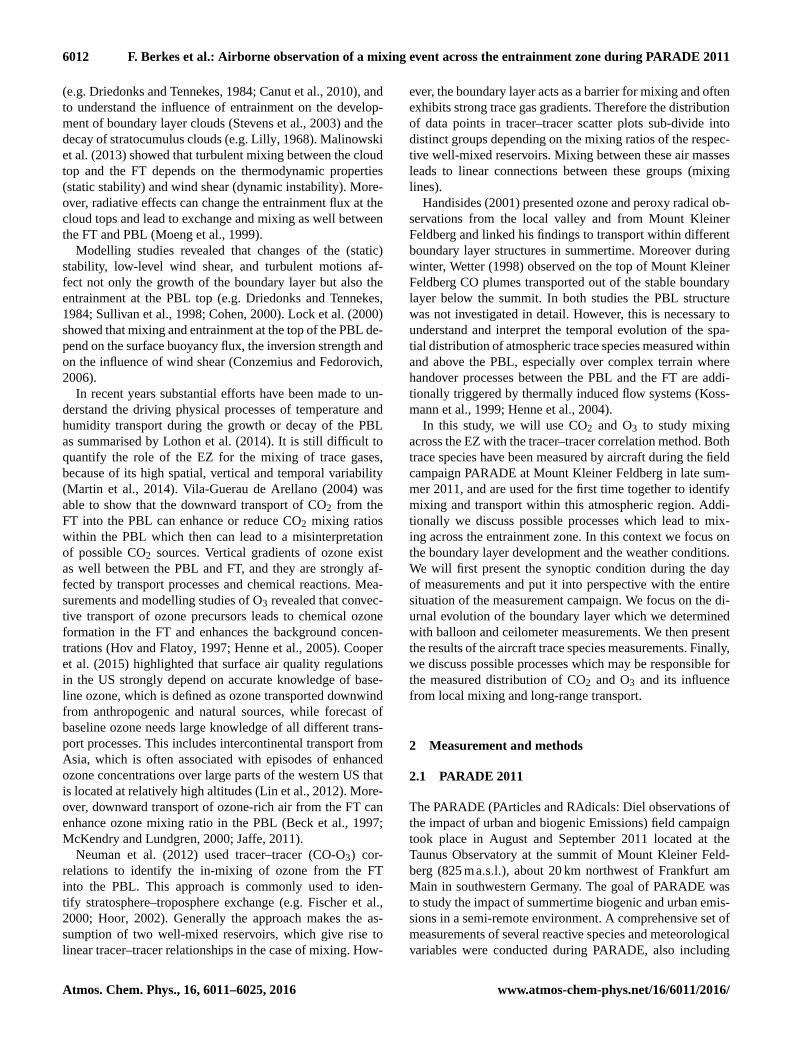
In this study, we will use CO2 and O3 to study mixing
across the EZ with the tracer–tracer correlation method. Both
trace species have been measured by aircraft during the field
campaign PARADE at Mount Kleiner Feldberg in late sum-
mer 2011, and are used for the first time together to identify
mixing and transport within this atmospheric region. Addi-
tionally we discuss possible processes which lead to mix-
ing across the entrainment zone. In this context we focus on
the boundary layer development and the weather conditions.
We will first present the synoptic condition during the day
of measurements and put it into perspective with the entire
situation of the measurement campaign. We focus on the di-
urnal evolution of the boundary layer which we determined
with balloon and ceilometer measurements. We then present
the results of the aircraft trace species measurements. Finally,
we discuss possible processes which may be responsible for
the measured distribution of CO2 and O3 and its influence
from local mixing and long-range transport.
2 Measurement and methods
2.1 PARADE 2011
The PARADE (PArticles and RAdicals: Diel observations of
the impact of urban and biogenic Emissions) field campaign
took place in August and September 2011 located at the
Taunus Observatory at the summit of Mount Kleiner Feld-
berg (825 ma.s.l.), about 20 km northwest of Frankfurt am
Main in southwestern Germany. The goal of PARADE was
to study the impact of summertime biogenic and urban emis-
sions in a semi-remote environment. A comprehensive set of
measurements of several reactive species and meteorological
variables were conducted during PARADE, also including
Atmos. Chem. Phys., 16, 6011–6025, 2016 www.atmos-chem-phys.net/16/6011/2016/

F. Berkes et al.: Airborne observation of a mixing event across the entrainment zone during PARADE 2011 6013
in situ measurements of ozone and carbon dioxide (Phillips
et al., 2012; Bonn et al., 2014; Li et al., 2015).
Mount Kleiner Feldberg is mostly covered with coniferous
forest, except on the top where the observations took place
during PARADE. Meteorological measurements for temper-
ature, wind, humidity, global radiation are performed by
a permanently operating observatory of the German Weather
Service (DWD) and of the State of Hessen environmental
agency (HLUG) (Crowley et al., 2010). The station is known
for its quite remote character under prevailing northwesterly
winds (Klein et al., 2010). However, this rural region is af-
fected by pollution from the Rhine-Main Area (including
the cities of Frankfurt/Main, Wiesbaden, and Mainz) when
wind directions have a southerly component. The area north
of Mount Kleiner Feldberg (50–100 km) is less populated
and without major industry. In the direct vicinity of Mount
Kleiner Feldberg are a few main roads, some small towns
within 5 km, and two similarly sized mountain peaks: Großer
Feldberg (878 m) and Altkönig (798 m).
During this field campaign the synoptic conditions in-
volved predominately south westerly winds, mainly related
to troughs over the northeastern Atlantic and to high pressure
systems over central Europe. The south-westerly winds ad-
vected enhanced levels of anthropogenic pollution to Kleiner
Feldberg and were interrupted by northern to north easterly
winds several times. In these cases the probed air masses
showed rather low levels of anthropogenic pollution (Phillips
et al., 2012). We will present additional details on the synop-
tic conditions below.
2.2 Measurements
2.2.1 Aircraft instrumentation
A P68D Partenavia turbo prop aircraft operated by Envis-
cope GmbH (www.enviscope.de, last access: 12 November
2014) was equipped with several instruments to perform
measurements in and above the planetary boundary layer on
3 days (31 August, 2 and 6 September 2011) during the cam-
paign. The aircraft flew five research flights from Mainz to
Mount Kleiner Feldberg. Ascending profiles were flown up
and downstream of the surface station, while descending pro-
files were performed directly over Mount Kleiner Feldberg.
The ascending flight legs were conducted in different regions
and are not included in the averaged profiles of the follow-
ing analysis. The descending flight legs were flown in spirals
with a diameter of about 10–15 km. The maximum flight al-
titude was 3000 m a.s.l and the flight time was approximately
2 to 3 hours. A typical flight track is shown in Fig. 1 and illus-
trates the sampling strategy. In total, 13 descent profiles were
obtained at different locations and times for each variable.
CO2 was measured with a modified commercial
CO2/H2O analyser (LI-6262, LI-COR Inc.) with a to-
tal uncertainty of 0.55 ppmv (= one standard deviation σ )
determined from regular in-flight calibrations and a time
Latit
ude
[deg
rees
]
Longitude [degrees]
Figure 1. Topographic map (colour bar in m) of the Rhein-Main
Area in southwest Germany near Frankfurt am Main including the
flight pattern on 6 September 2011 (black line). Vertical profiles are
indicated by the flight track spirals. All descending profiles were
flown near the summit of Mount Kleiner Feldberg, while ascending
profiles have been taken up- and downwind.
resolution of 1 Hz (Gurk et al., 2008). Ozone (O3) was
measured by UV absorption every 10 s with the commercial
gas analyser O342M (Environnement S.A.) with a total
uncertainty of 1.3 ppbv for a moist air mass with less than
10gkg−1 specific humidity (Köllner, 2013). The response
time of the instruments (5 %/95 %) was 3 s (CO2) and 9 s
(O3), and the final data correction accounted for different
residence times in the inlet lines. The ambient temperature
and moisture were measured every second with a commer-
cial HMP230 (Vaisala) with an accuracy of two to three
percent for relative humidity and 0.5 ◦C for temperature.
The ambient pressure (SETRA Model 270) was measured
with an accuracy of 0.55 hPa (Enviscope GmbH, personal
communication, 2014). The particle number concentration
was measured by the Optical Particle Counter (Grimm SKY-
OPC 1.129) for a size range of 0.25–32 µm (32 channels)
and a time resolution of 1 Hz. Additionally, particle number
concentrations of particles with diameters between 10 nm
and 5 µm were measured with a modified condensation
particle counter (CPC-Modell 3007, TSI) every second.
These measurements are reported for standard temperature
(273.15 K) and pressure (1013.25 hPa) conditions (STP).
Three-second average measurements are analysed corre-
sponding to a spatial resolution of about 150 m at an average
aircraft velocity of 50 m s−1. The aircraft descent took about
10 min, so that the 3 s data yielded a vertical resolution of 3–
4 m. For further analysis of the vertical structure of the trace
gases measurements between 1000 and 3000 ma.s.l. Kleiner
Feldberg (approx. 150 m over the mountain summit), each
vertical profile is linearly interpolated to a uniform vertical
grid with 10 m resolution.
www.atmos-chem-phys.net/16/6011/2016/ Atmos. Chem. Phys., 16, 6011–6025, 2016

6014 F. Berkes et al.: Airborne observation of a mixing event across the entrainment zone during PARADE 2011
2.2.2 Surface-based and radiosonde measurements
Vertical profiles of temperature, relative humidity and po-
sition were obtained from 174 radiosondes (GRAW DFM-
06, www.graw.de, last access: 12 November 2014). Between
four and ten radiosondes were launched each day, start-
ing usually 1 hr before sunrise and ending 1 hour after sun-
set. The sampling rate of 1 Hz results in a vertical resolu-
tion of about 1–2 m. The data have been interpolated onto
an equidistant vertical grid with 20 m resolution. The pres-
sure is obtained from these observations. Wind speed and
wind direction are calculated from temporal changes of the
current position of the balloon relative to the surface sta-
tion. The near-surface temperature measurements were com-
pared to the temperature measurement from the local ob-
servatory. The comparison revealed a high positive corre-
lation with an r2= 0.99 and a mean absolute deviation of
|TRS− TDWD| = 0.56 ± 0.50 ◦C.
The Ceilometer CHM 15 k-x from Jenoptik (www.
jenoptik.com, last access: 12 November 2014) is primarily
designed to determine the cloud base from 200 m to 15 km
above ground. In the absence of clouds, the backscatter sig-
nal can also be used for detecting aerosol layers (Münkel
et al., 2007). The laser emits a light pulse with a repetition
rate of 5–7 kHz, a pulse time of 1 ns and a wavelength of
λ= 1064 nm, with a vertical resolution of 15 m. Thus, every
30 s a vertical backscatter profile is obtained.
Surface-based CO2 measurements were performed with
a commercial CO2/H2O analyser (LI-6262, LI-COR Inc.)
with a total uncertainty of 2 ppmv determined from regular
calibrations and a time resolution of 1 Hz. Additionally CO2
was measured from the mobile laboratory (MoLa) (Drewnick
et al., 2012) with a commercial CO2/H2O analyser (LI-840,
LI-COR Inc.) without regular calibrations and a separate in-
let line. These data were provided as 10 min mean values
and are only used here to illustrate the diurnal cycle of CO2.
Surface-based ozone measurements were performed by var-
ious instruments with different techniques at different loca-
tions during this campaign. At Mount Kleiner Feldberg O3
was measured by UV absorption with a commercial O3 anal-
yser (Model 49, Thermo Environmental Instruments Inc.).
The total uncertainty was 5 % (2σ ) and the data were pro-
vided as 10 min averages (Li et al., 2015). HLUG provides
30 min averaged O3 measurements using a commercial UV
absorption instrument (API 400) (Crowley et al., 2010).
2.3 Determination of the planetary boundary layer
height
The planetary boundary layer height (PBLH) was calcu-
lated from the radio soundings using the surface based bulk
Richardson number RiB (Vogelezang and Holtslag, 1996;
Seibert et al., 2000). The dimensionless bulk Richardson
number RiB is defined as the ratio of the vertical stability
and the vertical shear of the horizontal wind:
RiB =g
θv
1θv1z
(1u)2+ (1v)2, (1)
with g the gravitational acceleration, θv the virtual potential
temperature, z the altitude, and u, v the horizontal wind com-
ponents (Vogelezang and Holtslag, 1996). The differences1
are obtained from the respective values at the surface and the
layers above. RiB provides an appropriate measure to char-
acterise the stratification of the atmosphere and to determine
the PBLH. The thermal stratification is determined from the
sign of the bulk Richardson number. The flow is statically
stable if RiB is greater than zero, or else statically unstable or
neutral. Furthermore, ifRiB is below a critical value, the flow
will become dynamically unstable and marks the altitude be-
tween the turbulent boundary layer and the stable stratified
free troposphere. We used a threshold value of RiB = 0.38
which distinguish between a turbulent (low values of RiB)
and a stable (large values of RiB) boundary layer. The same
value is also used in the mesoscale model that we will in-
troduce later (Fay, 1998). For clarity, the threshold value has
been varied between 0.2 and 0.5 following suggestions from
Zilitinkevich and Baklanov (2002) and Zhang et al. (2014),
however, with a negligible effect on the results.
The PBLH has further been determined with the ceilome-
ter, following the approach from Schneider and Eixmann
(2002), to observe the height of the aerosol layer more fre-
quently than with the radio soundings. The method is based
on iterative averaging of the backscatter profile. Once the
mean value has decreased to half the maximum average value
inside the PBL, this altitude is designated to be the PBLH.
Additionally, the height of the residual layer can be deter-
mined with this method at night. For our analysis we ex-
cluded all backscatter profiles which were observed during
cloudy conditions. The determined boundary layers of the
remaining backscatter profiles are averaged on an hourly ba-
sis.
2.4 Lagrangian air mass analysis
For the surface observations 24 h backward trajectories were
calculated using LAGRANTO (Wernli and Davies, 1997;
Sprenger and Wernli, 2015) from the position of Mount
Kleiner Feldberg at 200 m above surface level (approxi-
mately between the modelled and actual mountain height)
at 12:00 UTC for each day of the campaign. For the air-
craft observations 24 h backward trajectories were calcu-
lated every 10 s along the flight path for each individual
flight using LAGRANTO. In both cases, the trajectories were
driven by model wind fields from the COSMO-7 analysis
(Doms, 2011; Doms et al., 2011), operated by Swiss Na-
tional Weather Service (MeteoSwiss). The meteorological
fields from COSMO-7 are available every hour, the horizon-
tal resolution is about 7 km, and 61 vertical levels are used
from the surface up to 20 hPa. The trajectories are calculated
Atmos. Chem. Phys., 16, 6011–6025, 2016 www.atmos-chem-phys.net/16/6011/2016/

F. Berkes et al.: Airborne observation of a mixing event across the entrainment zone during PARADE 2011 6015
Days in Aug.–Sep. 2011
Figure 2. Daily averaged CO2 observations and the associated stan-
dard deviation during the measurement campaign parade on the
Mount Kleiner Feldberg. The shaded areas indicate periods of high-
pressure influence (white) and low-pressure influence (grey).
from the three-dimensional, kinematic wind field, not tak-
ing into account additional parametrisations for convection
or turbulence.
2.5 Synoptic conditions during PARADE 2011
The synoptic conditions were alternating mainly between
two kinds of weather patterns. Prior to the start of the mea-
surement period (15–18 August 2011) the situation was dom-
inated by a low pressure system over northwestern Europe
and a high pressure system over central Europe. On 19 Au-
gust 2011 a cold front related to a low pressure system over
the north sea passed over the measurement area. This was
then followed by high pressure conditions over central Eu-
rope (20–26 August 2011) with very warm and humid tem-
peratures. This period was again succeeded by the passage
of a low pressure system late in the day on 26 August 2011
which formed over the eastern Atlantic. This led to relatively
low temperatures with Tmax < 14 ◦C and continued until the
end of August (31 August 2011). Similar conditions were
found during the last days of the campaign, only interrupted
by fair weather between the end of August and 4 September
2011.
This synoptic pattern is well reflected by the daily mean
carbon dioxide (CO2) mixing ratio observed at the surface
for the entire campaign (Fig. 2). CO2 showed larger val-
ues during high pressure conditions (grey area), while lower
CO2 values were observed during low pressure conditions
(white area). Figure 3 shows that the near-surface based LA-
GRANTO backward trajectories match well with these syn-
optic conditions. Clean air masses from the north-west to
westerly direction over the North Atlantic are linked to low
CO2 mixing ratios, while enhanced CO2 values are related to
the potentially polluted continental regions in southerly wind
directions or related to local fair weather conditions. Note
Latit
ude
[deg
rees
]
Longitude [degrees]
Figure 3. Backward trajectories, starting from the Mount Kleiner
Feldberg at 200 m altitude over the surface for each day at
12:00 UTC up to 24 h based on wind fields from COSMO-7. The
colours represent the daily averages of CO2 measurements from
Mount Kleiner Feldberg (Fig. 2).
Figure 4. Surface pressure chart provided by the German Weather
Service (DWD) over Europe on 6 September 2011, 12:00 UTC. The
red box indicates the measurement area.
that biogenic uptake of CO2 through photosynthesis was of
minor importance at the end of the European growing season
and that the CO2 flux was probably dominated by anthro-
pogenic emissions (Rivier et al., 2010).
3 Results
3.1 Synoptic situation on 6 September 2011
In the following we focus on one particular day (6 September
2011) when two research flights were completed. The two
www.atmos-chem-phys.net/16/6011/2016/ Atmos. Chem. Phys., 16, 6011–6025, 2016

6016 F. Berkes et al.: Airborne observation of a mixing event across the entrainment zone during PARADE 2011
Figure 5. Diurnal variation of the residual layer height (RLH) and
planetary boundary layer height (PBLH) derived from radiosondes
(black) and ceilometer (red, hourly averaged). The distinction be-
tween the turbulent boundary layer and the stable FT is shown by
the bulk Richardson number RiB (grey scale). RLH is derived from
the radiosonde temperature profiles (black dashed) and from 1 hr
averaged aerosol layer heights (AHL) calculated from the ceilome-
ter backscatter profiles (red dashed). Blue circles indicate the oc-
currence of clouds during that day. The global radiation (GR, blue
line) is provided from HLUG in Wm−2. Vertical profiles of CO2
are shown for different aircraft flights over Mount Kleiner Feldberg
during this day in rainbow colours; for details see Figs. 7 and 8.
flights were flown in a prefrontal high pressure zone with
a cyclonic system in northern Europe and high pressure in
the south (Fig. 4). The approaching frontal system was asso-
ciated with high wind speeds over central Europe, carrying
air masses rapidly from the Atlantic Ocean to central Europe.
A first trough reached western Europe on 5 September 2011,
and marked the beginning of a series of low pressure systems.
The next low was already present over Britain and Ireland.
Its cold front was semi-occluded with the prefrontal warm
front. Part of this warm front was situated over north-western
France (Fig. 4). The strong westerly wind transported colder
air masses from the Atlantic Ocean and fostered the evolu-
tion of small-scale convective cells.
3.2 Diurnal evolution of the boundary layer on
6 September 2011
In this section, we briefly discuss the diurnal evolution of the
PBL on 6 September 2011. We show the temporal evolution
of RiB over Mount Kleiner Feldberg (Fig. 5). The vertical
profiles of RiB have been calculated solely from the radio
soundings and were linearly interpolated between each pro-
file in this figure. In the morning hours low values of RiBare confined to the lowest layers (so called stable boundary
layer). The extent of these low values increases during the
day up to 2000 ma.s.l.. This reflects the growth of the PBL.
In the morning hours a second inversion layer was indicated
by the radiosounding profiles at around 2000–2500 ma.s.l.
280 290 300 310
Θv [K]
500
1000
1500
2000
2500
3000
3500
Altitude [m
asl]
06 UTC
10 UTC
11 UTC
14 UTC
0 10 20 30
Wind speed[ms
-1]
500
1000
1500
2000
2500
3000
3500
180 225 270
Wind direction[degrees]
500
1000
1500
2000
2500
3000
3500
Figure 6. Profiles of (a) virtual potential temperature, (b) wind
speed, and (c) wind direction derived from radiosondes during the
day (black: 06:00 UTC, red: 10:00 UTC, blue: 11:00 UTC, orange:
14:00 UTC) on 6 September 2011.
This inversion further coincides with an increased backscat-
ter signal detected by the ceilometer. The backscatter signal
is related to an aerosol layer as well as the bottom of shallow
cumulus clouds and marks the altitude of the residual layer.
The stable and residual layers merged between 10:00 and
11:00 UTC; afterwards only a single layered structure (now
referred to as planetary boundary layer (PBL)) is detectable.
Figure 6 shows profiles of the virtual potential temperature,
wind speed and wind direction from the radio soundings
just before and after the flights during that day. The PBLH
at 11:00 UTC is located at 1640 ma.s.l. with an inversion
strength of about 3 K. The maximum PBLH of 1981 ma.s.l.
occurred at 14:00 UTC, while the strengthening of the tem-
perature inversion increased to about 10 K. The wind direc-
tion within the PBL and FT was mostly constant during that
day, whereas the wind speed increased within the FT and de-
creased within the PBL during the day. Later on, the PBLH
decreased to about 500 m before the onset of precipitation at
around 18:00 UTC (Fig. 5).
The air mass composition was probed twice during
this day. The first flight took place between 07:00 and
09:30 UTC, while the second flight was between 11:00 and
14:00 UTC. Thus, a composition change of the PBL was ex-
pected from flight one to flight two, since the first flight took
place before the two layers merged, while the second oc-
curred after this event.
3.3 Vertical profiles of trace gases during the boundary
layer growth
Figure 7 also shows CO2 profiles for the morning
(07:27 UTC), noon (11:42 UTC) and afternoon (13:12 UTC).
The profiles are colour-coded with specific humidity along
the flight leg. The PBLH (black dashed line) and residual
layer height (grey line), derived from the gradient of the
Atmos. Chem. Phys., 16, 6011–6025, 2016 www.atmos-chem-phys.net/16/6011/2016/

F. Berkes et al.: Airborne observation of a mixing event across the entrainment zone during PARADE 2011 6017
Figure 7. Vertical profiles of (a) CO2 and of (b) O3 in the morning
(07:27 UTC) on 6 September 2011. The colour shows the specific
humidity, and the horizontal lines show the boundary layer height
(black dashed line) and the residual layer height (dashed grey line).
humidity profiles, correspond well to the derived boundary
layer heights from the radiosonde measurements.
In the morning the vertical profiles of CO2 clearly show
the three-layer structure of the PBL (Fig. 7a). Within the
stable layer we observed a large variability of CO2 mix-
ing ratios ranging between 380.0 and 394.3 ppmv below
1000 m altitude. Between 1000 and 2300 ma.s.l. the verti-
cal profile of CO2 in the residual layer was almost con-
stant with mean values (CO2) of 380.5 (±0.16) ppmv, in-
dicating that the residual layer was well mixed. A strong
CO2 gradient at 2300 ma.s.l. reveals a sharp separation be-
tween the PBL and the FT which has a mean CO2 of
about 383.0 (±0.58) ppmv). In the afternoon (13:12 UTC)
CO2 is again well mixed within the PBL with CO2 =
382.1 (±0.35) ppmv (see Fig. 5). A clear separation to the
FT is evident again, with mean FT-CO2 mixing ratios of
383.7 (±0.38) ppmv).
The transition period between the measurements of these
two profiles is characterised by a much more variable CO2
profile, especially above the PBLH (Fig. 7b). CO2 decreases
within the PBL with a mean value of 382.9 (±0.49) ppmv.
Above 1500 ma.s.l. in the FT mean CO2 mixing ratios show
a double peaked structure with maximum values of almost
386 ppmv and minimum values of 382 ppmv. Thus, a large
variability with altitude is evident. Above 2300 ma.s.l. CO2
mixing ratios are more comparable again to mixing ratios
observed in the morning and the afternoon with a mean value
of 383.9 (±0.61) ppmv.
The vertical profiles of O3 show a similar temporal evolu-
tion development (Figs. 7 and 8). Largest O3 values are found
in the FT above the boundary layer throughout the day and
exceed local PBL values by typically 10 ppbv. The only ex-
ception is the transition period at 11:42 UTC, when O3 shows
(b)(a)
Figure 8. Same as Fig. 7 at noon. The measurement points between
1640 and 2200 ma.s.l. are influenced by mixing from the PBL and
the FT.
a large variability. As for CO2 a double peak structure is ev-
ident, however, the maxima and minima are anti-correlated
between CO2 and O3. Furthermore, O3 minima and CO2
maxima show large values of water vapour mixing ratio qv.
These values exceed the commonly measured humidity val-
ues (less than 2 gkg−1) in the FT. Since the aircraft was al-
lowed only to operate in cloud-free conditions, the large hu-
midity values were only observed within the PBL. We will
now analyse in detail how this complex structure is related to
the observed development of the boundary layer structure.
3.4 Mixing deduced from correlations
The vertical profiles of O3 and CO2 and their temporal evo-
lution over the course of the day are used to study a po-
tential mixing event on 6 September 2011 above Mount
Kleiner Feldberg. For this we now apply tracer–tracer cor-
relations (e.g. Fischer et al., 2000; Hoor, 2002). Figure 9
shows the scatter plot between O3 and CO2 in the morning
(07:27 UTC). Using the moisture information and mean val-
ues of CO2 and O3 it is possible to identify two separated air
masses. The air mass in the residual and stable layers has low
O3 values and variable values of CO2 and qv. The air mass
in the FT is rather characterised by larger values of O3, low
values of qv and less variability in CO2.
At 11:42 UTC the appearance of the scatter plot changes
significantly (Fig. 10). The chemical characteristics of two
different air masses still can be identified, of which one has
the characteristics of a boundary layer air mass (larger val-
ues for qv) and one of an FT air mass (lower values of qv).
However, the air mass in the FT now also shows a larger
variability in CO2 which we see as an indication of a PBL air
mass that has entered the FT. Moreover, the O3 mixing ratios
www.atmos-chem-phys.net/16/6011/2016/ Atmos. Chem. Phys., 16, 6011–6025, 2016

6018 F. Berkes et al.: Airborne observation of a mixing event across the entrainment zone during PARADE 2011
q [g
kg
]v
-1Figure 9. Correlations between CO2 and O3 during the observa-
tions at 07:27 UTC colour-coded according to specific humidity
measurements. The aircraft descended from the FT into the PBL,
indicated by a clear separation from the chemical signature.
q [g
kg
]v
-1
Figure 10. Same as Fig. 9 at noon. The measurement points be-
tween 1640 and 2200 ma.s.l. (black boxes) are related due to the
mixed air masses from the stable layer and the FT.
in the PBL are also slightly increased which could be related
to downward transport of a FT air mass.
Using now also the temporal and spatial information of
the measured data points, a linear relationship between the
FT and PBL air masses in the tracer–tracer scatter plot be-
comes evident (Fig. 10). This line is highlighted with the
black boxes. These data points have been measured consec-
utively in an altitude range between 1640 and 2200 m, which
is just above the PBLH at 11:42 UTC (Fig. 5). The EZ was
situated at this location and time. Thus we regard these data
points as the result of mixing, and the observed linear tracer–
tracer relationship as mixing line, since it relates to the evo-
lution of the boundary layer structure during this day. The
specific humidity of this mixing line shows a slightly larger
variability than the variability of the FT background (Fig. 8).
This further supports our hypothesis of measuring a rather
fresh mixing event. Note further that during this time clouds
were present in the observation area with the cloud tops at
around 2400 ma.s.l., according to the on-board observations
and a post-flight analysis of photos taken during the flight.
However, the strong variations of ozone, moisture and CO2
for the profile at 11:42 UTC (Fig. 7) have been observed ex-
clusively in-between clouds.
In short, we identify local mixing between air masses from
the PBL and the FT from the results of the tracer–tracer cor-
relation technique for the trace gases CO2 and O3. Addi-
tionally, this mixing is supported by a larger variability of
the specific humidity within the mixing region. In the fol-
lowing subsections, we will discuss processes which might
have contributed to this mixing event as well as if this mix-
ing event was influenced by long-range transport.
4 Discussion
4.1 Impact of long-range transport?
The origin of the probed air masses is investigated with 24 h
kinematic backward trajectories using LAGRANTO (see
Sect. 2.4) for this 1-day period. Figure 11 shows the zonal
position of the backward trajectories along the flight path at
release time (0 h),−12 and−24 h prior to the measurements.
Additionally, the trajectories are colour-coded with the ozone
mixing ratio as measured onboard the aircraft. Ozone was
chosen, as tracer in this figure, because of its strong ver-
tical gradient. The ozone mixing ratio is averaged for the
trajectory positions backward in time for each hour in bins
of 0.5◦ longitude and 250 m altitude. The binning compro-
mises all calculated trajectories and reflects the transport of
air for a time period 24 h before the observations for the sec-
ond flight around noon. It is evident that the measurement
region has been influenced by air masses from two different
origins (Fig. 11). The trajectory analysis reveals that the air
mass probed above 2000 m with large O3 mixing ratios has
been transported rapidly from westerly directions towards the
measurement site. Furthermore, only these trajectories reside
within the FT with the high O3 mixing ratios. The trajectories
at lower levels indicate that the air mass at this altitude range
with low O3 mixing ratios has been advected more slowly.
Importantly, air masses initialised below 2000 m, thus mainly
within the turbulent boundary layer, show a larger spread of
the trajectories and tend to stay in the boundary layer corre-
sponding to low ozone mixing ratios. A similar behaviour is
evident from CO2 (not shown) confirming a clear separation
between free tropospheric and boundary layer transport.
We conclude that the entrainment zone separates ozone-
rich air masses, which were transported in the free tropo-
sphere with higher wind speed than from air masses, which
resided in the boundary layer with lower wind speed, as in-
dicated by the low ozone mixing ratios. The clear vertical
Atmos. Chem. Phys., 16, 6011–6025, 2016 www.atmos-chem-phys.net/16/6011/2016/

F. Berkes et al.: Airborne observation of a mixing event across the entrainment zone during PARADE 2011 6019
Longitude [degrees] Longitude [degrees] Longitude [degrees]
(a) (b) (c)
Figure 11. Temporal evolution of air mass origins between 11:00 and 13:00 UTC on 6 September 2011. The trajectory positions are colour
coded by mixing ratios of ozone as measured along the flight leg. The data are binned by 0.5◦ longitude and 250 m altitude (for details see
text). The black line marks the maximum PBLH during that time.
separation of air masses between the FT and PBL is therefore
reflected by the different chemical signature of the air masses
and is an indication that the two respective air masses were
spatially separated. It is thus an indication that the air masses
must have been mixed shortly before or at the measurement
location.
4.2 Impact of the local boundary layer conditions and
cloud development
We will now show whether local mixing between bound-
ary layer air and the air in the free troposphere can ex-
plain the observed signatures of mixing. The PBLH reaches
1640 ma.s.l. with an inversion strength of 3 K at 11:00 UTC.
The residual layer height in the morning, as identified
from the ceilometer and secondary temperature inversions
from the radio soundings, reaches 2100 m. From 11:42 to
13:12 UTC the PBLH grew to 2000 ma.s.l. and reaches
a temperature inversion strength of 8–10 K. On the one hand,
the growth of the boundary layer since 11:42 UTC is an indi-
cation for further entrainment of the overlying air masses into
the PBL, which leads to further mixing. On the other hand,
the increase of the inversion strength limits the entrainment
from air above and also the upward transport to the FT and
reduced mixing (Angevine, 2007).
As shown in Fig. 5 the boundary layer top during the mea-
surements was affected by the occurrence of clouds. These
clouds were aligned along straight lines (Fig. 12), which is
also evident from satellite images (not shown). The presence
of clouds can affect the strength of the inversion layer as
well as of the mixing between PBL and FT. Stevens (2007)
and Malinowski et al. (2011) showed that radiative cool-
ing at the upper edge of the clouds promotes a downward
mixing of air and thus influences the inversion strength and
might also contribute to the observed mixing event by en-
trainment of dry air from the FT. This can be seen by the
decrease of the mean specific humidity between 1640 and
2200 ma.s.l. from the morning (qv = 2.8 (±1.2)gkg−1) to
noon time (qv = 2.1 (±0.7)gkg−1).
Figure 12. Cloud formation below the flight track at about
11:32 UTC. Just before measuring a profile by descending above
Mount Kleiner Feldberg. The arrows show the mean wind direction.
An important feature of these cloud structures is the for-
mation of roll vortices, which are aligned along the axis of
the cloud bands. The cloud bands can be regarded as an indi-
cator of shallow convection within the boundary layer. Moist
air is lifted from near the surface up to the top of the PBL
where the clouds form and the air descends in-between the
clouds. The indicated air motion contributes especially to
a further mixing of the PBL air mass, but can also increase
the mixing potential between the PBL and the FT. This can
then result in the vertical profiles of CO2 as observed be-
tween the morning and the afternoon on 6 September 2011
(see Fig. 6). Hägeli et al. (2000) observed similar relation-
ships for temperature and for moisture profiles within the
cloud free area between the cloud streets. It should be noted
that many experimental studies are restricted to cloud-free
conditions as summarised by Kalthoff et al. (2013).
So we suggest that the mixing event is linked to the evolu-
tion of shallow convection and consecutive cloud formation
at the top of the PBL. Therefore, we will discuss the three
CO2 profiles during this day (Fig. 7), which reflect the sus-
www.atmos-chem-phys.net/16/6011/2016/ Atmos. Chem. Phys., 16, 6011–6025, 2016
6020 F. Berkes et al.: Airborne observation of a mixing event across the entrainment zone during PARADE 2011
pected dynamic processes from theoretical approaches (e.g.
Etling and Brown, 1993; Lock et al., 2000; Stevens et al.,
2003).
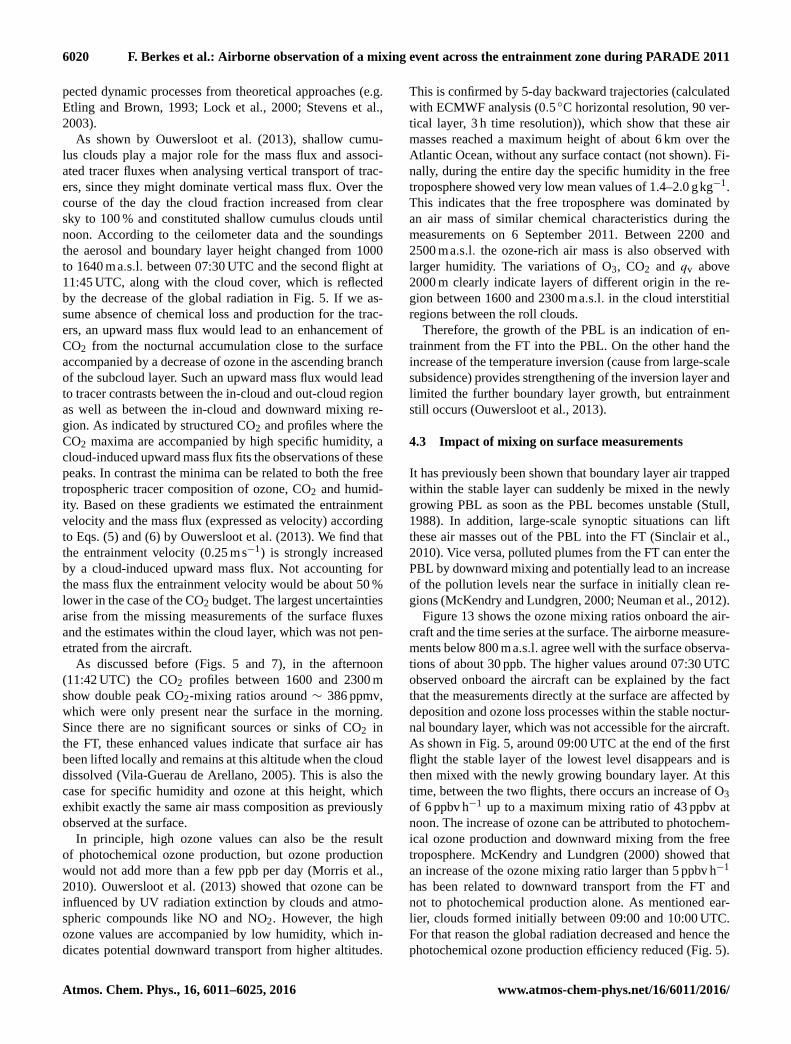
As shown by Ouwersloot et al. (2013), shallow cumu-
lus clouds play a major role for the mass flux and associ-
ated tracer fluxes when analysing vertical transport of trac-
ers, since they might dominate vertical mass flux. Over the
course of the day the cloud fraction increased from clear
sky to 100 % and constituted shallow cumulus clouds until
noon. According to the ceilometer data and the soundings
the aerosol and boundary layer height changed from 1000
to 1640 ma.s.l. between 07:30 UTC and the second flight at
11:45 UTC, along with the cloud cover, which is reflected
by the decrease of the global radiation in Fig. 5. If we as-
sume absence of chemical loss and production for the trac-
ers, an upward mass flux would lead to an enhancement of
CO2 from the nocturnal accumulation close to the surface
accompanied by a decrease of ozone in the ascending branch
of the subcloud layer. Such an upward mass flux would lead
to tracer contrasts between the in-cloud and out-cloud region
as well as between the in-cloud and downward mixing re-
gion. As indicated by structured CO2 and profiles where the
CO2 maxima are accompanied by high specific humidity, a
cloud-induced upward mass flux fits the observations of these
peaks. In contrast the minima can be related to both the free
tropospheric tracer composition of ozone, CO2 and humid-
ity. Based on these gradients we estimated the entrainment
velocity and the mass flux (expressed as velocity) according
to Eqs. (5) and (6) by Ouwersloot et al. (2013). We find that
the entrainment velocity (0.25 ms−1) is strongly increased
by a cloud-induced upward mass flux. Not accounting for
the mass flux the entrainment velocity would be about 50 %
lower in the case of the CO2 budget. The largest uncertainties
arise from the missing measurements of the surface fluxes
and the estimates within the cloud layer, which was not pen-
etrated from the aircraft.
As discussed before (Figs. 5 and 7), in the afternoon
(11:42 UTC) the CO2 profiles between 1600 and 2300 m
show double peak CO2-mixing ratios around ∼ 386 ppmv,
which were only present near the surface in the morning.
Since there are no significant sources or sinks of CO2 in
the FT, these enhanced values indicate that surface air has
been lifted locally and remains at this altitude when the cloud
dissolved (Vila-Guerau de Arellano, 2005). This is also the
case for specific humidity and ozone at this height, which
exhibit exactly the same air mass composition as previously
observed at the surface.
In principle, high ozone values can also be the result
of photochemical ozone production, but ozone production
would not add more than a few ppb per day (Morris et al.,
2010). Ouwersloot et al. (2013) showed that ozone can be
influenced by UV radiation extinction by clouds and atmo-
spheric compounds like NO and NO2. However, the high
ozone values are accompanied by low humidity, which in-
dicates potential downward transport from higher altitudes.
This is confirmed by 5-day backward trajectories (calculated
with ECMWF analysis (0.5 ◦C horizontal resolution, 90 ver-
tical layer, 3 h time resolution)), which show that these air
masses reached a maximum height of about 6 km over the
Atlantic Ocean, without any surface contact (not shown). Fi-
nally, during the entire day the specific humidity in the free
troposphere showed very low mean values of 1.4–2.0 gkg−1.
This indicates that the free troposphere was dominated by
an air mass of similar chemical characteristics during the
measurements on 6 September 2011. Between 2200 and
2500 ma.s.l. the ozone-rich air mass is also observed with
larger humidity. The variations of O3, CO2 and qv above
2000 m clearly indicate layers of different origin in the re-
gion between 1600 and 2300 ma.s.l. in the cloud interstitial
regions between the roll clouds.
Therefore, the growth of the PBL is an indication of en-
trainment from the FT into the PBL. On the other hand the
increase of the temperature inversion (cause from large-scale
subsidence) provides strengthening of the inversion layer and
limited the further boundary layer growth, but entrainment
still occurs (Ouwersloot et al., 2013).
4.3 Impact of mixing on surface measurements
It has previously been shown that boundary layer air trapped
within the stable layer can suddenly be mixed in the newly
growing PBL as soon as the PBL becomes unstable (Stull,
1988). In addition, large-scale synoptic situations can lift
these air masses out of the PBL into the FT (Sinclair et al.,
2010). Vice versa, polluted plumes from the FT can enter the
PBL by downward mixing and potentially lead to an increase
of the pollution levels near the surface in initially clean re-
gions (McKendry and Lundgren, 2000; Neuman et al., 2012).
Figure 13 shows the ozone mixing ratios onboard the air-
craft and the time series at the surface. The airborne measure-
ments below 800 ma.s.l. agree well with the surface observa-
tions of about 30 ppb. The higher values around 07:30 UTC
observed onboard the aircraft can be explained by the fact
that the measurements directly at the surface are affected by
deposition and ozone loss processes within the stable noctur-
nal boundary layer, which was not accessible for the aircraft.
As shown in Fig. 5, around 09:00 UTC at the end of the first
flight the stable layer of the lowest level disappears and is
then mixed with the newly growing boundary layer. At this
time, between the two flights, there occurs an increase of O3
of 6 ppbv h−1 up to a maximum mixing ratio of 43 ppbv at
noon. The increase of ozone can be attributed to photochem-
ical ozone production and downward mixing from the free
troposphere. McKendry and Lundgren (2000) showed that
an increase of the ozone mixing ratio larger than 5 ppbv h−1
has been related to downward transport from the FT and
not to photochemical production alone. As mentioned ear-
lier, clouds formed initially between 09:00 and 10:00 UTC.
For that reason the global radiation decreased and hence the
photochemical ozone production efficiency reduced (Fig. 5).
Atmos. Chem. Phys., 16, 6011–6025, 2016 www.atmos-chem-phys.net/16/6011/2016/

F. Berkes et al.: Airborne observation of a mixing event across the entrainment zone during PARADE 2011 6021
Time in September 2011
00:00 04:00 08:00 12:00 16:00 20:00 00:00
O3 [
pp
bv]
20
25
30
35
40
45
50
55HLUG
UV
Figure 13. Surface ozone measurements of different instruments
at different inlets (HLUG (blue, 30 min mean) and UV absorption
(red, 10 min mean)) on Mount Kleiner Feldberg (825 ma.s.l.), in-
cluding the aircraft observations (mean and standard deviation be-
tween 1000 to 1600 ma.s.l.) on 6 September 2011.
Time in September 2011
00:00 04:00 08:00 12:00 16:00 20:00 00:00
CO
2 [ppm
v]
378
380
382
384
386
388
390
392
394
396UNI MZ
MOLA
Figure 14. CO2 surface measurements (on Mount Kleiner Feld-
berg (825 ma.s.l.), see Sect. 2.2), including the aircraft observa-
tions (mean and standard deviation between 1000 to 1600 m a.s.l.)
on 6 September 2011. The high CO2 fluctuations at 08:00 UTC are
demonstrated by the mean (red star), standard deviation (black error
bars), median (red bar) and maximum/minimum values (blue bar).
Figure 14 shows the CO2 mixing ratio onboard the air-
craft and near the surface. The airborne CO2 measurements
show low mixing ratios of 381 ppmv (08:00 UTC) compared
to the high CO2 surface measurements. This large difference
is due to accumulated CO2 in the stable boundary layer dur-
ing night. This is consistent with slightly enhanced ozone
measured onboard the aircraft for this period (see Fig. 13).
The aircraft was always flying at least 100 m above the sur-
face where the CO2 values are already much lower compared
to the stable surface layer below. Note that the CO2 profile in
Fig. 5 also indicates much higher CO2 values at the lowest
levels, which are in the same range as observed at the surface
at Mount Kleiner Feldberg. Thus during night, CO2 at the
surface is dominated by plant respiration and anthropogenic
CO2 emissions. During day a potential effect from downward
mixing at the surface is probably masked by some local up-
take of CO2 by vegetation.
The particle number concentration measurements show
very low values of 1–2 particles ccm−1 within the FT. Within
the PBL we observe a larger particle number concentra-
tion from the CPC (210 particles ccm−1) than from the OPC
(40 particles ccm−1). Since the measurement site is covered
by cumulus clouds (see Fig. 4), it is obvious that particles
larger than 100 nm were activated to form cloud droplets.
These measurements could not be used to further support
the mixing process. Furthermore, the backscatter signal from
the ceilometer was mostly affected by the clouds (after
10:00 UTC) and therefore we observed only the cloud base
height. The increase of O3 near the surface is most likely
the result of mixing of O3-rich air masses from the FT. This
downward transport process would match well with the time
of occurrence of the mixing line.
5 Conclusions
Extensive surface-based, balloon-based and airborne mea-
surements were collected as part of the measurement cam-
paign PARADE on Mount Kleiner Feldberg (825 m) in sum-
mer 2011. We used these data to investigate the diurnal evo-
lution of the boundary layer height over this complex terrain
as well as the potential impact of local and long-range trans-
port of trace gases. Our focus was on two research flights
on 6 September 2011 where vertical tracer properties of CO2
and O3 indicated the occurrence of mixing across the entrain-
ment zone. The planetary boundary layer height was deter-
mined using the bulk Richardson number (RiB) from mea-
surements taken from radio soundings. This approach can
be used both under stable and unstable conditions using the
same criteria. The boundary layer top grew from 860 ma.s.l.
in the morning up to 2000 ma.s.l. in the afternoon. During
this growth it merged with the residual layer (2100 ma.s.l. at
06:00 UTC). Negative RiB values indicated that the PBL is
convectively driven and turbulent during that day, and thus
well mixed. Additionally, airborne measurements of various
trace gases (CO2 and O3) and particle number concentrations
were performed in cloud-free areas during that day.
The temporal evolution of the measured vertical trace gas
profiles showed the evolution of the PBL as observed with
the radio soundings. The merging of the stable boundary
layer, residual layer and free troposphere with the convective
driven boundary layer is involved with mixing of the trace
gases from these different atmospheric layers, and leads to
complex vertical profiles of the trace gases. The tracer–tracer
correlations have been applied to identify this mixing event
and the effect on the trace gas distribution change across the
transport barrier at the boundary layer top. This mixing line
is probably formed by vertical uplift of CO2-rich and O3-
poor air masses from the morning stable boundary layer. The
strong western wind transported cold air masses from the At-
www.atmos-chem-phys.net/16/6011/2016/ Atmos. Chem. Phys., 16, 6011–6025, 2016

6022 F. Berkes et al.: Airborne observation of a mixing event across the entrainment zone during PARADE 2011
lantic Ocean and caused the development of cloud streets.
The structure of the trace gas profiles resembles the vertical
cloud structure. We found the mixed air masses in the cloud
interstitial space. This is consistent with convective uplifting
and mixing with FT air at the cloud top within the clouds and
subsidence of outside the clouds. It is suggested that these
conditions forced mixing between the FT and the PBL. It
cannot be excluded that the mixing event was affected by
long-range transport. The analysis of the local meteorologi-
cal situation and the trace gas observations, however, provide
strong evidence that the local boundary layer growth leads to
mixing at the PBL top. This is supported by the specific hu-
midity, which shows on the mixing line a slightly larger vari-
ability than the variability of the FT background humidity.
The additional formation of shallow convective clouds at the
PBL top (and roll convection) probably led to an efficient ex-
change between the boundary layer and the free troposphere.
We conclude that rapid boundary layer growth and its in-
teraction with convective clouds at the PBL top can effi-
ciently mix both air masses and lead to variability that can
be characterised by mixing lines. Moreover, the analysis of
mixing lines provides a powerful tool to identify the occur-
rence and the effect of processes, which lead to a constituent
exchange and mixing across the inversion layer.
The Supplement related to this article is available online
at doi:10.5194/acp-16-6011-2016-supplement.
Acknowledgements. The authors are grateful to all PARADE mem-
bers making this field campaign successful, and especially thank
John Crowley for organising it. We particularly thank Enviscope
GmbH for the execution of the flights and their excellent support
during the campaign. We acknowledge Ralf Weigel for providing
the particle number concentrations measurements onboard the air-
craft. Moreover, we thank Andreas Reiffs and Uwe Parchatka for
providing the surface ozone measurements, and Johannes Fachinger
for the surface CO2 observations from MoLa. Janina Wendling is
acknowledged for analysis of the ceilometer measurements, and
we would like to thank Szymon Malinowski for fruitful discus-
sion. Furthermore, we acknowledge the German Weather Service
(DWD), the Swiss National Weather Service (MeteoSwiss) and
ECMWF for providing meteorological analysis during the field
campaign. MODIS satellite images were obtained from rapid fire.
This work was supported by the International Max Planck Research
School (IMPRS) and the aircraft flights were founded by the MPIC.
D. Kunkel acknowledges funding from the German Science Foun-
dation under grant HO 4225/2-1. We would like to thank the two
anonymous reviewers for their helpful comments.
The article processing charges for this open-access
publication were covered by a Research
Centre of the Helmholtz Association.
Edited by: G. Feingold
References
Angevine, W. M.: Transitional, entraining, cloudy, and coastal
boundary layers, Acta Geophys., 56, 2–20, doi:10.2478/s11600-
007-0035-1, 2007.
Arya, S. P.: Introduction to Micrometeorology, vol. 79, 2nd edn.,
Academic Press, 2001.
Bange, J., Spieß, T., and van den Kroonenberg, A.: Characteristics
of the early-morning shallow convective boundary layer from
Helipod Flights during STINHO-2, Theor. Appl. Climatol., 90,
113–126, doi:10.1007/s00704-006-0272-2, 2007.
Beck, J. P., Asimakopoulos, N., Bazhanov, V., Bock, H. J.,
Chronopoulos, G., Muer, D. D., Ebel, A., Flatøy, F., Hass, H.,
van Haver, P., Hov, O., Jakobs, H. J., Kirchner, E. J. J., Kunz, H.,
Memmesheimer, M., van Pul, W. A. J., Speth, P., Trickl, T.,
and Varotsos, C.: Exchange of Ozone Between the Atmospheric
Boundary Layer and the Free Troposphere, Springer-Verlag,
doi:10.1007/978-3-642-58729-0_5, 1997.
Bonn, B., Bourtsoukidis, E., Sun, T. S., Bingemer, H., Rondo, L.,
Javed, U., Li, J., Axinte, R., Li, X., Brauers, T., Sonderfeld, H.,
Koppmann, R., Sogachev, A., Jacobi, S., and Spracklen, D. V.:
The link between atmospheric radicals and newly formed parti-
cles at a spruce forest site in Germany, Atmos. Chem. Phys., 14,
10823–10843, doi:10.5194/acp-14-10823-2014, 2014.
Canut, G., Lothon, M., Saïd, F., and Lohou, F.: Observation
of entrainment at the interface between monsoon flow and
the Saharan Air Layer, Q. J. Roy. Meteor. Soc., 136, 34–46,
doi:10.1002/qj.471, 2010.
Cohen, C.: A Quantitative investigation of entrainment and
detrainment in numerically simulated cumulonimbus
clouds, J. Atmos. Sci., 57, 1657–1674, doi:10.1175/1520-
0469(2000)057<1657:AQIOEA>2.0.CO;2, 2000.
Cohn, S. A. and Angevine, W. M.: Boundary layer height and en-
trainment zone thickness measured by lidars and wind-profiling
radars, J. Appl. Meteorol., 39, 1233–1247, doi:10.1175/1520-
0450(2000)039<1233:BLHAEZ>2.0.CO;2, 2000.
Conzemius, R. J. and Fedorovich, E.: Dynamics of sheared convec-
tive boundary layer entrainment – Part I: Methodological back-
ground and large-eddy simulations, J. Atmos. Sci., 63, 1151–
1178, doi:10.1175/JAS3691.1, 2006.
Cooper, O. R., Langford, A. O., Parrish, D. D., and Fahey, D.
W.: Challenges of a lowered US ozone standard, Science, 6239,
1096–1097, doi:10.1126/science.aaa5748, 2015.
Crowley, J. N., Schuster, G., Pouvesle, N., Parchatka, U., Fis-
cher, H., Bonn, B., Bingemer, H., and Lelieveld, J.: Nocturnal ni-
trogen oxides at a rural mountain-site in south-western Germany,
Atmos. Chem. Phys., 10, 2795–2812, doi:10.5194/acp-10-2795-
2010, 2010.
Doms, D.: A description of the nonhydrostatic regional COSMO-
model, Part I: Dynamics and numerics, Tech. rep., Deutscher
Wetterdienst, 2011.
Atmos. Chem. Phys., 16, 6011–6025, 2016 www.atmos-chem-phys.net/16/6011/2016/

F. Berkes et al.: Airborne observation of a mixing event across the entrainment zone during PARADE 2011 6023
Doms, D., Förstner, J., Heise, E., Herzog, H., Mironov, D., Raschen-
dorfer, M., Reinhardt, T., Ritter, B., Schrodin, R., Schulz, J., and
Vogel, G.: A description of the nonhydrostatic regional COSMO-
model, Part II: Physical parameterization, Tech. rep., Deutscher
Wetterdienst, 2011.
Donnell, E. A., Fish, D. J., Dicks, E. M., and Thorpe, A. J.:
Mechanisms for pollutant transport between the boundary
layer and the free troposphere, J. Geophys. Res., 106, 7847,
doi:10.1029/2000JD900730, 2001.
Drewnick, F., Böttger, T., von der Weiden-Reinmüller, S.-L.,
Zorn, S. R., Klimach, T., Schneider, J., and Borrmann, S.: De-
sign of a mobile aerosol research laboratory and data processing
tools for effective stationary and mobile field measurements, At-
mos. Meas. Tech., 5, 1443–1457, doi:10.5194/amt-5-1443-2012,
2012.
Driedonks, A. and Tennekes, H.: Entrainment effects in the well-
mixed atmospheric boundary layer, Bound.-Lay. Meteorol., 30,
75–105, doi:10.1007/978-94-009-6514-0_4, 1984.
Eresmaa, N., Karppinen, A., Joffre, S. M., Räsänen, J., and
Talvitie, H.: Mixing height determination by ceilometer, At-
mos. Chem. Phys., 6, 1485–1493, doi:10.5194/acp-6-1485-2006,
2006.
Etling, D. and Brown, R. A.: Roll vortices in the planetary
boundary layer: A review, Bound.-Lay. Meteorol., 65, 215–248,
doi:10.1007/BF00705527, 1993.
Fay, B.: Evaluation and intercomparison of mixing heights based
on the new prognostic turbulence scheme of the pre-operational
limited area model at the german weather service, Harmo5 Con-
ference, Rhodes, Greece, 18–21 May, 1998.
Fischer, H., Wienhold, F. G., Hoor, P., Bujok, O., Schiller, C.,
Siegmund, P., Ambaum, M., Scheeren, H. A., and Lelieveld, J.:
Tracer correlations in the northern high latitude lowermost strato-
sphere: Influence of cross-tropopause mass exchange, Geophys.
Res. Lett., 27, 97–100, doi:10.1029/1999GL010879, 2000.
Flaty, F., Hov, O., and Smit, H.: Three-dimensional model studies
of exchange processes of ozone in the troposphere over Europe,
J. Geophys. Res., 100, 11465–11481, doi:10.1029/95JD00845,
1995.
Gurk, Ch., Fischer, H., Hoor, P., Lawrence, M. G., Lelieveld, J., and
Wernli, H.: Airborne in-situ measurements of vertical, seasonal
and latitudinal distributions of carbon dioxide over Europe, At-
mos. Chem. Phys., 8, 6395–6403, doi:10.5194/acp-8-6395-2008,
2008.
Hägeli, P., Steyn, D. G., and Strawbridge, K. B.: Spatial
and temporal variability of mixed-layer depth and entrain-
ment zone thickness, Bound.-Lay. Meteorol., 96, 47–71,
doi:10.1023/A:1002790424133, 2000.
Handisides, G. M.: The influence of peroxy radicals on ozone
production, Dissertation, Johann Wolfgang Goethe University,
Frankfurt a. M., 2001.
Hauf, T., Schulte, P., Alheit, R., and Schlager, H.: Rapid verti-
cal trace gas transport by an isolated midlatitude thunderstorm,
J. Geophys. Res., 100, 22957–22970, doi:10.1029/95JD02324,
1995.
Henne, S., Furger, M., Nyeki, S., Steinbacher, M., Neininger, B.,
de Wekker, S. F. J., Dommen, J., Spichtinger, N., Stohl, A., and
Prévôt, A. S. H.: Quantification of topographic venting of bound-
ary layer air to the free troposphere, Atmos. Chem. Phys., 4, 497–
509, doi:10.5194/acp-4-497-2004, 2004.
Henne, S., Dommen, J., Neininger, B., Reimann, S., Staehelin, J.,
and Prevot, A. S. H.: Influence of mountain venting in the Alps
on the ozone chemistry of the lower free troposphere and the Eu-
ropean pollution export, J. Geophys. Res.-Atmos., 110, D22307,
doi:10.1029/2005JD005936, 2005.
Hoor, P.: Seasonal variations of a mixing layer in the lower-
most stratosphere as identified by the CO-O 3 correlation
from in situ measurements, J. Geophys. Res., 107, 4044,
doi:10.1029/2000JD000289, 2002.
Hov, O. and Flatoy, F.: Convective redistribution of ozone
and oxides of nitrogen in the troposphere over Europe
in summer and fall, J. Atmos. Chem., 28, 319–337,
doi:10.1023/A:1005780730600, 1997.
Jaffe, Dan: Relationship between surface and free tropospheric
ozone in the Western US, Environ. Sci. Technol., 45, 432–438,
doi:10.1021/es1028102, 2011.
Kalthoff, N., Träumner, K., Adler, B., Späth, S., Behrendt, A.,
Wieser, A., Handwerker, J., Madonna, F., and Wulfmeyer, V.:
Dry and moist convection in the boundary layer over the Black
Forest – a combined analysis of in situ and remote sensing data,
Meteorol. Z., 22, 445–461, doi:10.1127/0941-2948/2013/0417,
2013.
Klein, H., Nickovic, S., Haunold, W., Bundke, U., Nillius, B.,
Ebert, M., Weinbruch, S., Schuetz, L., Levin, Z., Barrie, L. A.,
and Bingemer, H.: Saharan dust and ice nuclei over Central Eu-
rope, Atmos. Chem. Phys., 10, 10211–10221, doi:10.5194/acp-
10-10211-2010, 2010.
Köllner, F.: Charakterisierung und Einsatz eines flugzeuggetrage-
nen Ozonmessgerätes in der Grenzschicht, Thesis, Johannes-
Gutenberg Universität, Mainz, 2013.
Kossmann, M., Corsmeier, U., De Wekker, S. F., Fiedler, F.,
Vögtlin, R., Kalthoff, N., Güsten, H., and Neininger, B.: Obser-
vations of handover processes between the atmospheric bound-
ary layer and the free troposphere over mountaineous terrain, At-
mos. Phys., 72, 329–350, 1999.
Li, J., Reiffs, A., Parchatka, U., and Fischer, H.: In situ measure-
ments of atmospheric CO and its correlation with NOx and O3
at a rural mountain site, Metrol. Meas Syst., 22, 25–38, 2015.
Lilly, D. K.: Models cloud-topped mixed layers under a strong in-
version, Tech. Rep. July 1967, 1968.
Lin, M., Fiore, A. M., Horowitz, L. W., Cooper, O. R., Naik, V.,
Holloway, J., Johnson, B. J., Middlebrook, A. M., Oltmans, S. J.,
Pollack, I. B., Ryerson, T. B., Warner, J. X., Wiedinmyer, C., Wil-
son, J., and Wyman, B.: Transport of Asian ozone pollution into
surface air over the western United States in spring, J. Geophys.
Res.-Atmos., 117, 1–20, doi:10.1029/2011JD016961, 2012.
Lock, A. P., Brown, A. R., Bush, M. R., Martin, G. M.,
Smith, R. N. B., Ock, A. P. L., Rown, A. R. B., Ush, M. R. B.,
and Artin, G. M. M.: A new boundary layer mixing scheme
– Part I: Scheme description and single-column model
tests, Mon. Weather Rev., 128, 3187–3199, doi:10.1175/1520-
0493(2000)128<3187:ANBLMS>2.0.CO;2, 2000.
Lothon, M., Lohou, F., Pino, D., Couvreux, F., Pardyjak, E. R.,
Reuder, J., Vilà-Guerau de Arellano, J., Durand, P., Hartogensis,
O., Legain, D., Augustin, P., Gioli, B., Lenschow, D. H., Faloona,
I., Yagüe, C., Alexander, D. C., Angevine, W. M., Bargain, E.,
Barrié, J., Bazile, E., Bezombes, Y., Blay-Carreras, E., van de
Boer, A., Boichard, J. L., Bourdon, A., Butet, A., Campistron,
B., de Coster, O., Cuxart, J., Dabas, A., Darbieu, C., Deboudt,
www.atmos-chem-phys.net/16/6011/2016/ Atmos. Chem. Phys., 16, 6011–6025, 2016
6024 F. Berkes et al.: Airborne observation of a mixing event across the entrainment zone during PARADE 2011
K., Delbarre, H., Derrien, S., Flament, P., Fourmentin, M., Garai,
A., Gibert, F., Graf, A., Groebner, J., Guichard, F., Jiménez, M.
A., Jonassen, M., van den Kroonenberg, A., Magliulo, V., Mar-
tin, S., Martinez, D., Mastrorillo, L., Moene, A. F., Molinos,
F., Moulin, E., Pietersen, H. P., Piguet, B., Pique, E., Román-
Cascón, C., Rufin-Soler, C., Saïd, F., Sastre-Marugán, M., Se-
ity, Y., Steeneveld, G. J., Toscano, P., Traullé, O., Tzanos, D.,
Wacker, S., Wildmann, N., and Zaldei, A.: The BLLAST field
experiment: Boundary-Layer Late Afternoon and Sunset Turbu-
lence, Atmos. Chem. Phys., 14, 10931–10960, doi:10.5194/acp-
14-10931-2014, 2014.
Mahrt, L.: Stably stratified atmospheric boundary layers, Annu.
Rev. Fluid Mech., 46, 23–45, doi:10.1146/annurev-fluid-010313-
141354, 2014.
Malinowski, S. P., Haman, K. E., Kopec, M. K., Kumala, W.,
and Gerber, H.: Small-scale turbulent mixing at stratocumulus
top observed by means of high resolution airborne tempera-
ture and LWC measurements, J. Phys. Conf. Ser., 318, 072013,
doi:10.1088/1742-6596/318/7/072013, 2011.
Malinowski, S. P., Gerber, H., Jen-La Plante, I., Kopec, M. K.,
Kumala, W., Nurowska, K., Chuang, P. Y., Khelif, D., and
Haman, K. E.: Physics of Stratocumulus Top (POST): turbu-
lent mixing across capping inversion, Atmos. Chem. Phys., 13,
12171–12186, doi:10.5194/acp-13-12171-2013, 2013.
Martin, S., Beyrich, F., and Bange, J.: Observing entrainment pro-
cesses using a small unmanned aerial vehicle: a feasibility study,
Bound.-Lay. Meteorol., 150, 449–467, doi:10.1007/s10546-013-
9880-4, 2014.
McKendry, I. and Lundgren, J.: Tropospheric layering of
ozone in regions of urbanized complex and/or coastal
terrain: a review, Prog. Phys. Geog., 24, 329–354,
doi:10.1177/030913330002400302, 2000.
Moeng, C.-M., Sullivan, P. P., and Stevens, B.: Including radiative
effects in an entrainment rate formula for buoyancy-driven PBLs,
J. Atmos. Sci., 56, 1031–1049, 1999.
Morris, G. A., Ford, B., Rappenglück, B., Thompson, A. M., Mef-
ferd, A., Ngan, F., and Lefer, B.: An evaluation of the interac-
tion of morning residual layer and afternoon mixed layer ozone
in Houston using ozonesonde data, Atmos. Environ., 44, 4024–
4034, doi:10.1016/j.atmosenv.2009.06.057, 2010.
Münkel, C., Eresmaa, N., Räsänen, J., and Karppinen, A.: Retrieval
of mixing height and dust concentration with lidar ceilometer,
Bound.-Lay. Meteorol., 124, 117–128, doi:10.1007/s10546-006-
9103-3, 2007.
Neuman, J. A., Trainer, M., Aikin, K. C., Angevine, W. M.,
Brioude, J., Brown, S. S., de Gouw, J. A., Dube, W. P.,
Flynn, J. H., Graus, M., Holloway, J. S., Lefer, B. L., Nedelec, P.,
Nowak, J. B., Parrish, D. D., Pollack, I. B., Roberts, J. M., Ry-
erson, T. B., Smit, H., Thouret, V., and Wagner, N. L.: Ob-
servations of ozone transport from the free troposphere to the
Los Angeles basin, J. Geophys. Res.-Atmos., 117, D00V09,
doi:10.1029/2011JD016919, 2012.
Ouwersloot, H. G., Vilà-Guerau de Arellano, J., van Stratum, B.
J. H., Krol, M. C., and Lelieveld, J.: Quantifying the trans-
port of subcloud layer reactants by shallow cumulus clouds
over the Amazon, J. Geophys. Res.-Atmos., 118, 13041–13059,
doi:10.1002/2013JD020431, 2013.
Phillips, G. J., Tang, M. J., Thieser, J., Brickwedde, B., Schus-
ter, G., Bohn, B., Lelieveld, J., and Crowley, J. N.: Signifi-
cant concentrations of nitryl chloride observed in rural conti-
nental Europe associated with the influence of sea salt chloride
and anthropogenic emissions, Geophys. Res. Lett., 39, L10811,
doi:10.1029/2012GL051912, 2012.
Rivier, L., Peylin, P., Ciais, P., Gloor, M., Rödenbeck, C., Geels, C.,
Karstens, U., Bousquet, P., Brandt, J., and Heimann, M.: Eu-
ropean CO2 fluxes from atmospheric inversions using regional
and global transport models, Climatic Change, 103, 93–115,
doi:10.1007/s10584-010-9908-4, 2010.
Schneider, J. and Eixmann, R.: Three years of routine Raman lidar
measurements of tropospheric aerosols: Backscattering, extinc-
tion, and residual layer height, Atmos. Chem. Phys., 2, 313–323,
doi:10.5194/acp-2-313-2002, 2002.
Seibert, P., Beyrich, F., Gryning, S.-E., Joffre, S., and Ras-
mussen, A.: Review and intercomparison of operational methods
for the determination of the mixing height, Atmos. Environ., 34,
1001–1027, doi:10.1016/S1352-2310(99)00349-0, 2000.
Sinclair, V. A., Gray, S. L., and Belcher, S. E.: Controls
on boundary layer ventilation: Boundary layer processes
and large-scale dynamics, J. Geophys. Res., 115, D11107,
doi:10.1029/2009JD012169, 2010.
Sprenger, M. and Wernli, H.: The LAGRANTO Lagrangian anal-
ysis tool – version 2.0, Geosci. Model Dev., 8, 2569–2586,
doi:10.5194/gmd-8-2569-2015, 2015.
Stevens, B.: On the growth of layers of nonprecipitat-
ing cumulus convection, J. Atmos. Sci., 64, 2916–2931,
doi:10.1175/JAS3983.1, 2007.
Stevens, B., Lenschow, D. H., Vali, G., Gerber, H., Bandy, A.,
Blomquist, B., Brenguier, J.-L., Bretherton, C. S., Burnet, F.,
Campos, T., Chai, S., Faloona, I., Friesen, D., Haimov, S.,
Laursen, K., Lilly, D. K., Loehrer, S. M., Malinowski, S. P.,
Morley, B., Petters, M. D., Rogers, D. C., Russell, L., Savic-
Jovcic, V., Snider, J. R., Straub, D., Szumowski, M. J., Tak-
agi, H., Thornton, D. C., Tschudi, M., Twohy, C., Wetzel, M.,
and van Zanten, M. C.: Dynamics and chemistry of marine stra-
tocumulus DYCOMS-II, B. Am. Meteorol. Soc., 84, 579–593,
doi:10.1175/BAMS-84-5-579, 2003.
Stull, R. B.: An Introduction to Boundary Layer Meteorology,
vol. 13, Springer, the Netherlands, Dordrecht, doi:10.1007/978-
94-009-3027-8, 1988.
Sullivan, P. P., Moeng, C.-H., Stevens, B., Lenschow, D. H.,
and Mayor, S. D.: Structure of the entrainment zone
capping the convective atmospheric boundary layer,
J. Atmos. Sci., 55, 3042–3064, doi:10.1175/1520-
0469(1998)055<3042:SOTEZC>2.0.CO;2, 1998.
Träumner, K., Kottmeier, C., Corsmeier, U., and Wieser, A.: Con-
vective boundary-layer entrainment: short review and progress
using doppler lidar, Bound.-Lay. Meteorol., 141, 369–391,
doi:10.1007/s10546-011-9657-6, 2011.
Vila-Guerau de Arellano, J.: Entrainment process of carbon diox-
ide in the atmospheric boundary layer, J. Geophys. Res., 109,
D18110, doi:10.1029/2004JD004725, 2004.
Vila-Guerau de Arellano, J., Kim, S.-W. and Barth, M. C. and Pat-
ton, E. G.: Transport and chemical transformations influenced by
shallow cumulus over land, Atmos. Chem. Phys., 12, 3219–3231,
doi:10.5194/acp-5-3219-2005, 2005.
Vogelezang, D. and Holtslag, A.: Evaluation and model impacts of
alternative boundary-layer height formulations, Bound.-Lay. Me-
teorol., 81, 245–269, doi:10.1007/BF02430331, 1996.
Atmos. Chem. Phys., 16, 6011–6025, 2016 www.atmos-chem-phys.net/16/6011/2016/

F. Berkes et al.: Airborne observation of a mixing event across the entrainment zone during PARADE 2011 6025
Wernli, H. and Davies, H. C.: A lagrangian-based analysis of ex-
tratropical cyclones. I: The method and some applications, Q. J.
Roy. Meteor. Soc., 123, 467–489, doi:10.1002/qj.49712353811,
1997.
Wetter, T.: Messungen des CO- und H2 -Mischungsverhältnisses
im Winter 1996/97, Thesis, Johann Wolfgang Goethe University,
Frankfurt am Main, 1998.
Zhang, Y., Gao, Z., Li, D., Li, Y., Zhang, N., Zhao, X., and Chen, J.:
On the computation of planetary boundary-layer height using the
bulk Richardson number method, Geosci. Model Dev., 7, 2599–
2611, doi:10.5194/gmd-7-2599-2014, 2014.
Zhu, Z., Sun, X., Zhao, F. and Meixner, F.X.: Ozone concentra-
tions, flux and potential effect on yield during wheat growth in
the Northwest-Shandong Plain of China, J. Environ. Sci., 34, 1–
9, doi:10.1016/j.jes.2014.12.022, 2015.
Zilitinkevich, S. and Baklanov, A.: Calculation of the height of the
stable boundary layer in practical applications, Bound.-Lay. Me-
teorol., 105, 389–409, doi:10.1023/A:1020376832738, 2002.
www.atmos-chem-phys.net/16/6011/2016/ Atmos. Chem. Phys., 16, 6011–6025, 2016