Air Travel at the Edge of Chaos - George Mason …catsr.ite.gmu.edu/pubs... · Air Travel at the...
48
CENTER FOR AIR TRANSPORTATION SYSTEMS RESEARCH CENTER FOR AIR TRANSPORTATION SYSTEMS RESEARCH CENTER FOR AIR TRANSPORTATION SYSTEMS RESEARCH CENTER FOR AIR TRANSPORTATION SYSTEMS RESEARCH Air Travel at the Edge of Chaos George L. Donohue, Ph.D. Professor Systems Engineering and Operations Research Director of the Center for Air Transportation Systems Research Volgenau School of Information Technology and Engineering NASA Ames Director’s Forum November 16 , 2007 © George L. Donohue 2007
Transcript of Air Travel at the Edge of Chaos - George Mason …catsr.ite.gmu.edu/pubs... · Air Travel at the...

CENTER FOR AIR TRANSPORTATION SYSTEMS RESEARCHCENTER FOR AIR TRANSPORTATION SYSTEMS RESEARCHCENTER FOR AIR TRANSPORTATION SYSTEMS RESEARCHCENTER FOR AIR TRANSPORTATION SYSTEMS RESEARCH
Air Travel at the Edge of ChaosGeorge L. Donohue, Ph.D.
Professor Systems Engineering and Operations ResearchDirector of the Center for Air Transportation Systems Research
Volgenau School of Information Technology and Engineering
NASA Ames Director’s Forum November 16 , 2007
© George L. Donohue 2007
2
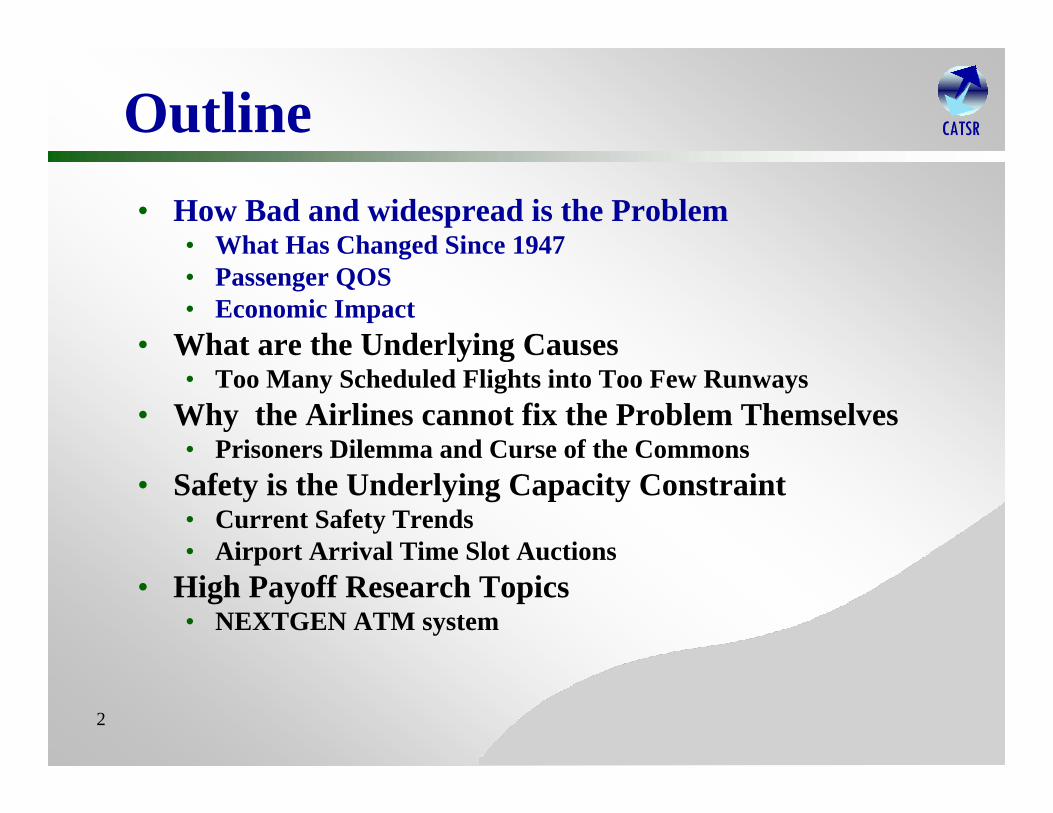
CATSRCATSRCATSRCATSROutline• How Bad and widespread is the Problem
• What Has Changed Since 1947• Passenger QOS• Economic Impact
• What are the Underlying Causes• Too Many Scheduled Flights into Too Few Runways
• Why the Airlines cannot fix the Problem Themselves• Prisoners Dilemma and Curse of the Commons
• Safety is the Underlying Capacity Constraint• Current Safety Trends• Airport Arrival Time Slot Auctions
• High Payoff Research Topics • NEXTGEN ATM system

3
CATSRCATSRCATSRCATSRWhat has Changed since 1947?
•Transonic vs. Subsonic Aircraft•40,000 ft vs. 20,000 ft Altitude•Avionics:
• Flight Management Systems• Required Navigation Perf.
0.1nm• Required Time of Arrival• Traffic Collision Avoidance
System – On the Aircraft!• AOC Data Links• Zero Visibility Landing
Systems•ATC radar Separation•WHAT HAS NOT CHANGED
• Air Traffic Controllers talking to Pilots using WW II AM Radio Technology

4
CATSRCATSRCATSRCATSRSome Little Known Facts
•Modern Jet Aircraft “Gate-to-Gate”Travel Time is the Same or Longerthan Propeller aircraft (DC-6 circa 1947) for many routes in NE Triangle
• Typical Jet Aircraft is 70% Faster and fly's 80% Higher
•Jet Aircraft can fly Over most bad weather•Modern Commercial Jet Aircraft can land in very low visibility•Airport Congestion Causes Most ATC Delays and Airline Schedule Padding Masks Real “Gate-to-Gate”Delay

5
CATSRCATSRCATSRCATSR
Overscheduled Airports are the Problem:Average Delay per Flight
Ordered by Arrival Delay at Outbound Destination. (minute) [Ning Xu GMU 2007]
-20.0
-15.0
-10.0
-5.0
0.0
5.0
10.0
15.0
20.0
25.0
30.0
35.0
40.0
ATL JFK
PH
L
MSP
ORD MIA
EW
R
DTW
DFW IA
D
CLT FLL
LGA
ME
M
BO
S
MC
O
DC
A
BW
I
IAH
SE
A
TPA
DE
N
CLE PIT
LAS
MD
W
STL
CV
G
PH
X
SFO LA
X
PD
X
SLC
SA
N
34 OEP Airport
Del
ays
per F
light
(min
ute)
Airport DelayEarly-arrival GapInbound DelayAirborne DelayArrival Delay at Outbound Dest.
Summer 2005 at 34 OEP Airports

6
CATSRCATSRCATSRCATSR
Delay Incurred at Major Airports Propagate Network Wide (Summer 2005)
-550000
-350000
-150000
50000
250000
450000
650000
850000
1050000
1250000
1450000
ATL
OR
D
DFW
EWR
PHL
MS
P
DTW
DEN
BOS
JFK
LGA
IAH
IAD
CLT
MCO DC
A
PHX
MIA
LAX
LAS
BW
I
SEA FL
L
CVG
CLE
MDW SF
O
TPA
PIT
STL
SLC
SAN
MEM PD
X
34 OEP Airport
Tota
l Del
ays
(min
ute)
Airport DelayEarly-arrival GapInbound DelayAirborne DelayArrival Delay at Outbound Dest.
Total Delay Ordered by Arrival Delay at Outbound Destination. (minute)
[Ning Xu GMU 2007]
20,000 Flight Hours

7
CATSRCATSRCATSRCATSR
NYNJ comparison to Comparable European Airports
Data taken from ACI-NA, EC PR2006 and FAA ASPM
Total Total Average DelaysAirport Movements Passengers Minutes
2005 2000 2005 2000 2006Frankfurt, Gr (FRA) 490,147 458,731 52,219,412 49,360,630 2.7London, UK (LHR) 477,884 466,815 67,915,403 64,606,826 3
Newark (EWR) 437,402 450,187 33,999,990 34,188,468 28.8Amsterdam, NL (AMS) 420,736 432,480 44,163,098 39,606,925 0.7
New York Laguardia (LGA) 404,853 384,554 <29,000,000 <28,000,000 23.4Munich (MUC) 398,838 - <29,000,000 1.8
New York Kennedy (JFK) <353,000 <384,000 41,885,104 32,856,220 24.3Madrid, Sp (MAD) 415,677 <384,000 41,940,059 32,893,190 1.8
8
CATSRCATSRCATSRCATSR
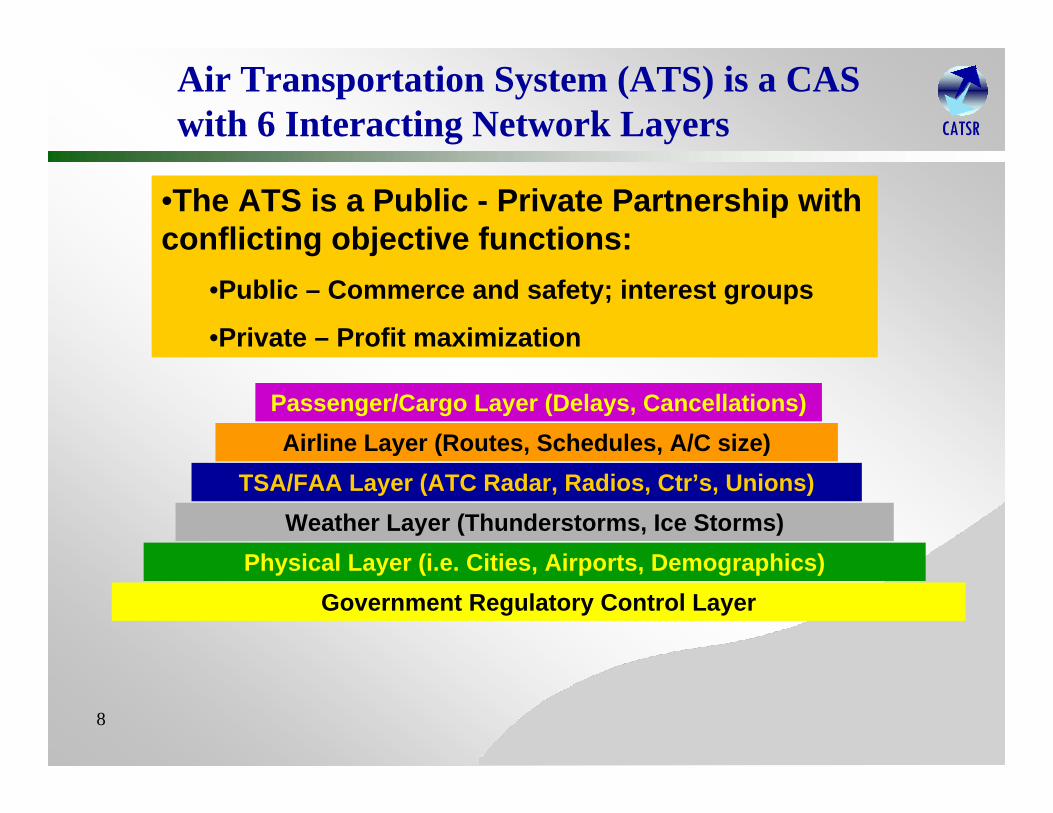
Air Transportation System (ATS) is a CAS with 6 Interacting Network Layers
Government Regulatory Control LayerPhysical Layer (i.e. Cities, Airports, Demographics)
Weather Layer (Thunderstorms, Ice Storms)
Airline Layer (Routes, Schedules, A/C size)TSA/FAA Layer (ATC Radar, Radios, Ctr’s, Unions)
Passenger/Cargo Layer (Delays, Cancellations)
•The ATS is a Public - Private Partnership with conflicting objective functions:
•Public – Commerce and safety; interest groups
•Private – Profit maximization

9
CATSRCATSRCATSRCATSR
Air Transportation System is Designedto Move Passengers and Cargo
Passenger Tier Performance = f (Vehicle Tier Performance, Passenger Factors i.e. Aircraft Gauge, Load Factor, Cancellations)

10
CATSRCATSRCATSRCATSRPassenger Total Delay – Airports• 10 of the OEP-35 airports 50% Total EPTD• some airports significantly impact Passenger Delay more than
others (e.g. ORD, ATL, DFW and MCO)
50%
Close Network of OEP35 Airport in 2004

11
CATSRCATSRCATSRCATSR
200 Routes generate 50% of Total Passenger Delay
• 17% of the 1044 routes between OEP-35 airports 50% Total EPTD• LGA, JFK, EWR, PHL connected Routes 11 out of top 20 routes
50%
Close Network of OEP35 Airport in 2004

12
CATSRCATSRCATSRCATSR
Top 20 Worst Airports in the US:Passenger Quality of Service Metric
Year
Rank Airports
Prob. Of PaxDelay >45 min Airports
Prob. Of PaxDelay >45 min Airports
Prob. Of PaxDelay >45 min Airports
Prob. Of PaxDelay >45 min
1 ORD 14% EWR 18% ORD 17% EWR 16%2 EWR 14% LGA 17% EWR 16% LGA 15%3 LGA 13% ATL 14% LGA 15% ORD 15%4 PHL 12% PHL 13% PHL 15% PHL 13%5 ATL 11% BOS 13% JFK 14% ATL 12%6 MIA 9% ORD 12% IAD 12% JFK 11%7 FLL 9% FLL 12% MIA 12% BOS 11%8 MCO 9% JFK 12% ATL 12% MIA 11%9 DFW 9% MIA 11% MDW 12% FLL 10%
10 LAS 9% SFO 11% DTW 12% IAD 10%11 BOS 9% SEA 10% DFW 12% DFW 10%12 SFO 9% IAD 10% BOS 11% SFO 10%13 IAD 9% TPA 10% DEN 11% DTW 9%14 JFK 9% MCO 10% CLT 10% MCO 9%15 CLE 9% BWI 9% IAH 10% LAS 9%16 SEA 8% PIT 9% CLE 10% CLE 9%17 TPA 8% PDX 9% PIT 10% PIT 9%18 STL 8% DTW 9% DCA 10% SEA 9%19 PDX 8% LAS 9% MEM 10% MDW 9%20 BWI 8% DCA 9% SFO 10% DCA 9%
2004 2005 2006 Average of 2004 to 2006
D. Wang, GMU PhD. In Progress

13
CATSRCATSRCATSRCATSR
Many Highly Congested Airports can Shift Passengers to other Large Airports
ConnectingAirport Passengers
%Chicago O'Hare 59
Newark NJ 32NY LaGuardia 8
NY JFK 40Philadelphia 38
Atlanta 66Boston 15Miami 55
Washington Dulles 53Dallas/Fort Worth 60
FAA 2006 NPIAS
14
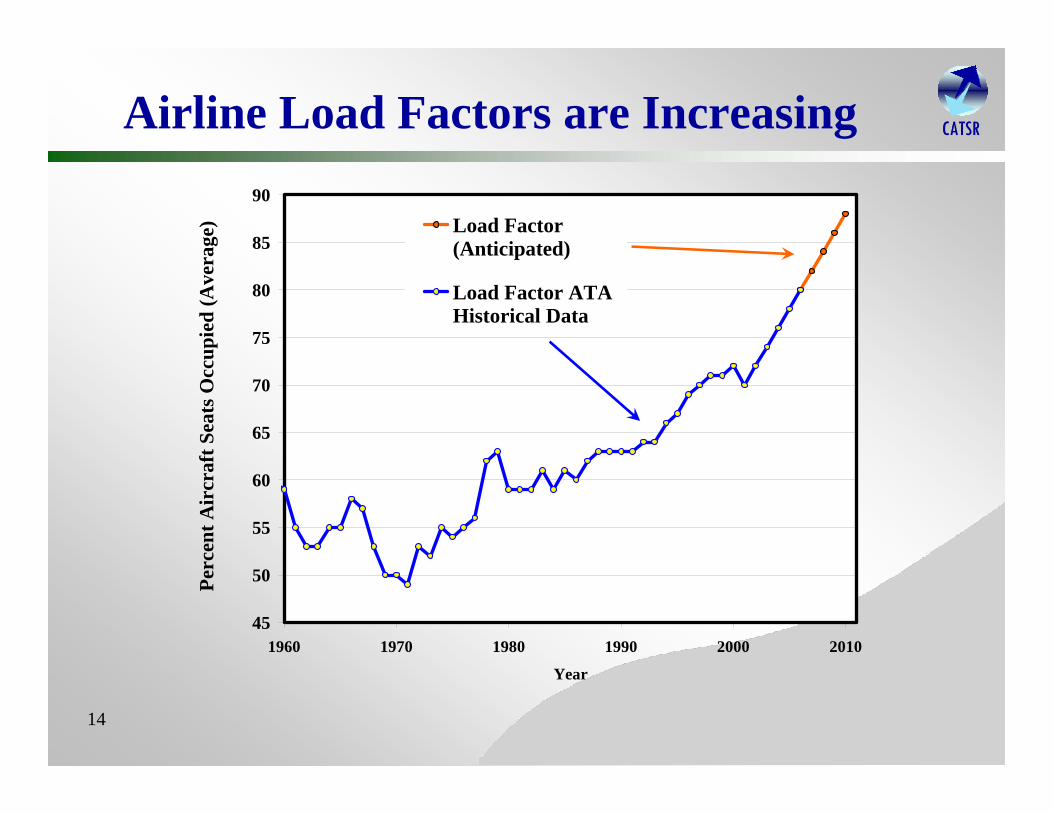
CATSRCATSRCATSRCATSRAirline Load Factors are Increasing
45
50
55
60
65
70
75
80
85
90
1960 1970 1980 1990 2000 2010
Year
Perc
ent A
ircr
aft S
eats
Occ
upie
d (A
vera
ge) Load Factor
(Anticipated)
Load Factor ATAHistorical Data
15
CATSRCATSRCATSRCATSR
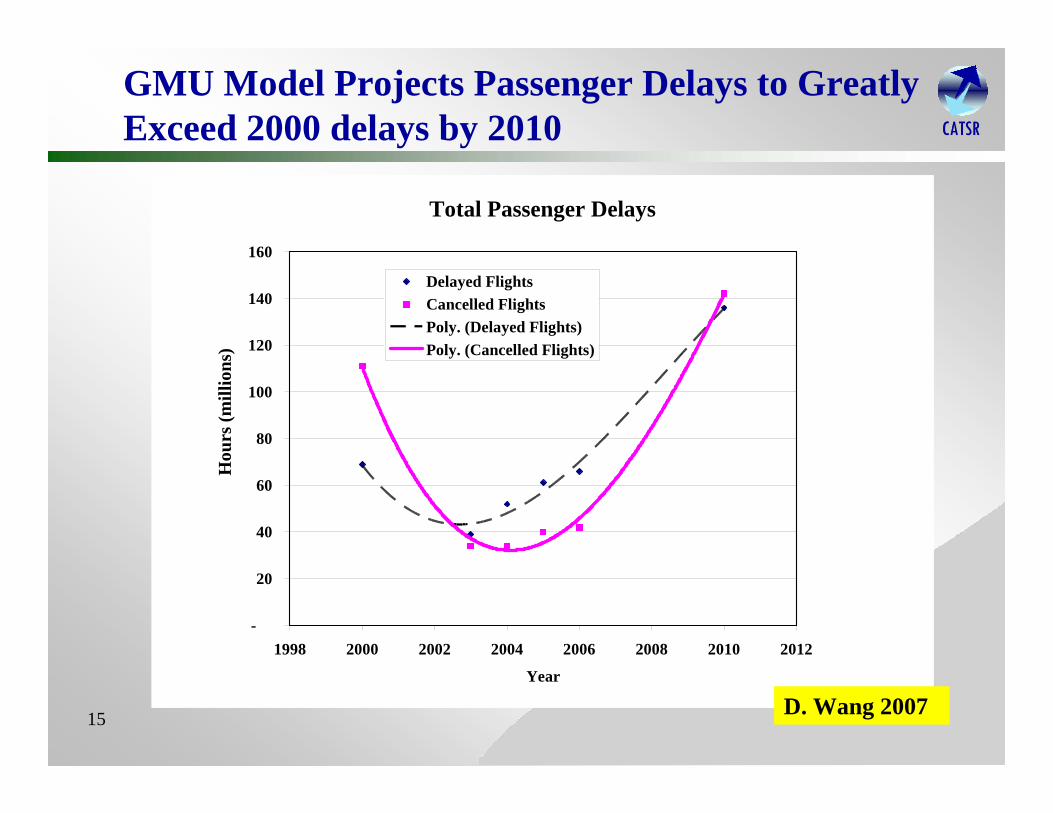
GMU Model Projects Passenger Delays to Greatly Exceed 2000 delays by 2010
Total Passenger Delays
-
20
40
60
80
100
120
140
160
1998 2000 2002 2004 2006 2008 2010 2012
Year
Hou
rs (m
illio
ns)
Delayed FlightsCancelled FlightsPoly. (Delayed Flights)Poly. (Cancelled Flights)
D. Wang 2007

16
CATSRCATSRCATSRCATSR
Annual Passenger Enplanements Predicted to be Lost: FAA Forecast to 2025
Annual Projected Enplanements Foregone Because of Airport Capacity Constraints
0
5
10
15
20
25
30
ATL
BO
S
BW
I
CLE CLT
CVG DC
A
DEN
DFW
DTW
EWR
FLL
HN
L
IAD
IAH
JFK
LAS
LAX
LGA
MC
O
MD
W
MEM M
IA
MSP
OR
D
PDX
PHL
PHX
PIT
SAN
SEA
SFO
SLC
STL
TPA
Airports
Ann
ual E
npla
nem
ents
Los
t (M
illio
ns)
202520152005
Optimistic: All Planned Airport Improvements
Occur
All available landing slots fully utilized regardless of congestion
EWR
ORDJFK
FAA 2005 TAF & 2004 Benchmark
LGA

17
CATSRCATSRCATSRCATSR
Estimated Annual Cost to US (Lost Consumer Surplus, 2005$) due to Expected Airport Capacity Limitations
$0
$5
$10
$15
$20
$25
100% 95% 90% 85% 80%Usable NAS Capacity (%)
Ann
ual C
ost t
o U
S Ec
onom
y ($
B) CY2015, All A/P
Improvements
CY2015, No A/PImprovements
CY2025, All A/PImprovements
CY2025, No A/PImprovements
--FAA Assumptions on Growth in Airport Operations--Boeing Passenger Growth Assumptions: 3.6% per year--Aircraft Upgage: 5% in 2015, 10% in 2025
Shaver 2007
Assumes:$200/segment ticketPrice Elasticity = -1

18
CATSRCATSRCATSRCATSR
Minimum Congestion Cost is a function of NEXTGEN Technology Effectiveness and Network Efficiency
$0
$5
$10
$15
$20
0.8 0.85 0.9 0.95 1Congestion Factor
Ann
ual C
onge
stio
n C
ost (
$B)
Consumer Surplus Costs Resulting From Limiting Airport Slots
Sum of Costs ($B)
Costs Resulting from PassengerDelays and Flight Cancellations
Caution: Some Costs Not Included

19
CATSRCATSRCATSRCATSROutline• How Bad and widespread is the Problem
• What Has Changed Since 1947• Passenger QOS• Economic Impact
• What are the Underlying Causes• Too Many Scheduled Flights into Too Few Runways
• Why the Airlines cannot fix the Problem Themselves• Prisoners Dilemma and Curse of the Commons
• Safety is the Underlying Capacity Constraint• Current Safety Trends• Airport Arrival Time Slot Auctions
• High Payoff Research Topics• NEXTGEN ATM system
20
CATSRCATSRCATSRCATSR
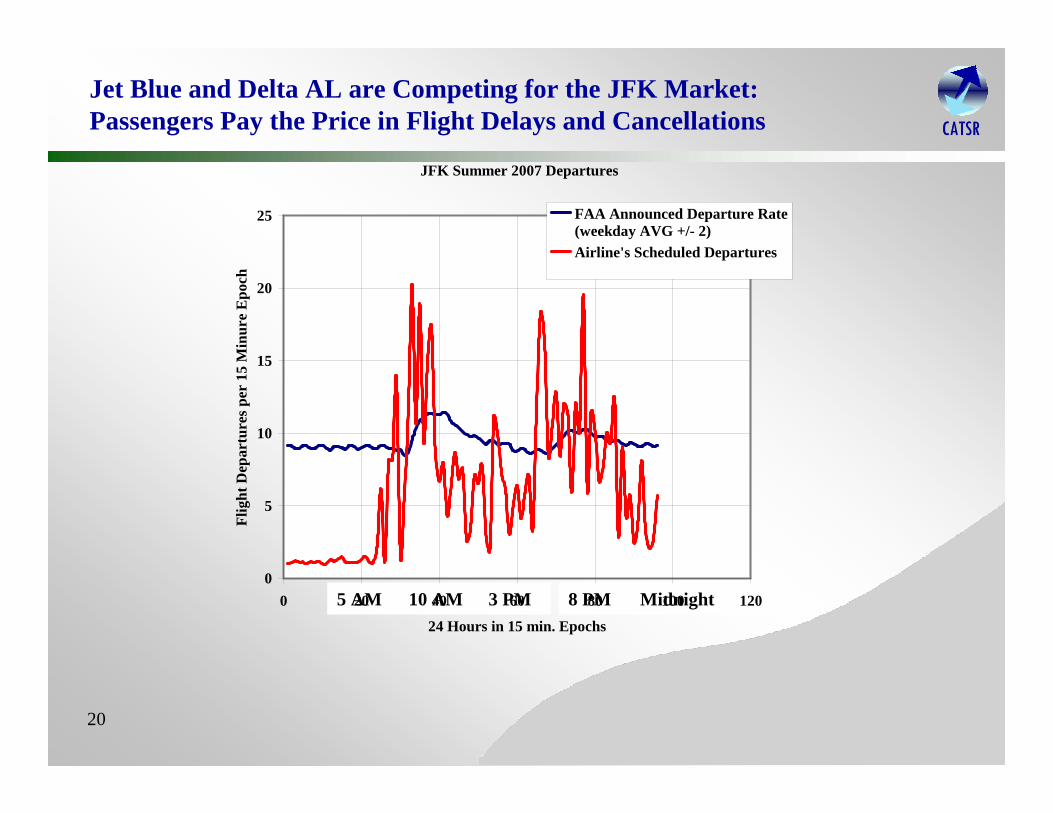
Jet Blue and Delta AL are Competing for the JFK Market:Passengers Pay the Price in Flight Delays and Cancellations
5 AM 10 AM 3 PM 8 PM Midnight
JFK Summer 2007 Departures
0
5
10
15
20
25
0 20 40 60 80 100 120
24 Hours in 15 min. Epochs
Flig
ht D
epar
ture
s per
15
Min
ure
Epo
ch
FAA Announced Departure Rate(weekday AVG +/- 2)Airline's Scheduled Departures
21
CATSRCATSRCATSRCATSR
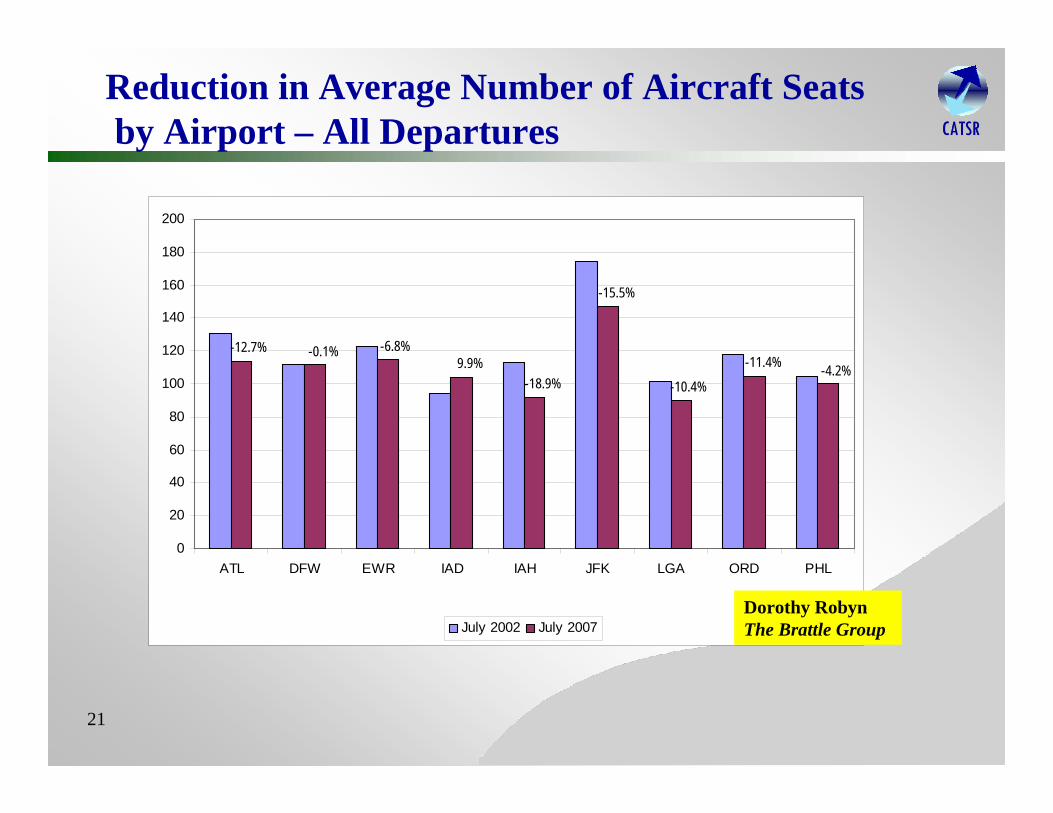
Reduction in Average Number of Aircraft Seatsby Airport – All Departures
-4.2%-11.4%
-10.4%
-15.5%
-18.9%9.9%
-6.8%-0.1%-12.7%
0
20
40
60
80
100
120
140
160
180
200
ATL DFW EWR IAD IAH JFK LGA ORD PHL
July 2002 July 2007Dorothy RobynThe Brattle Group
22
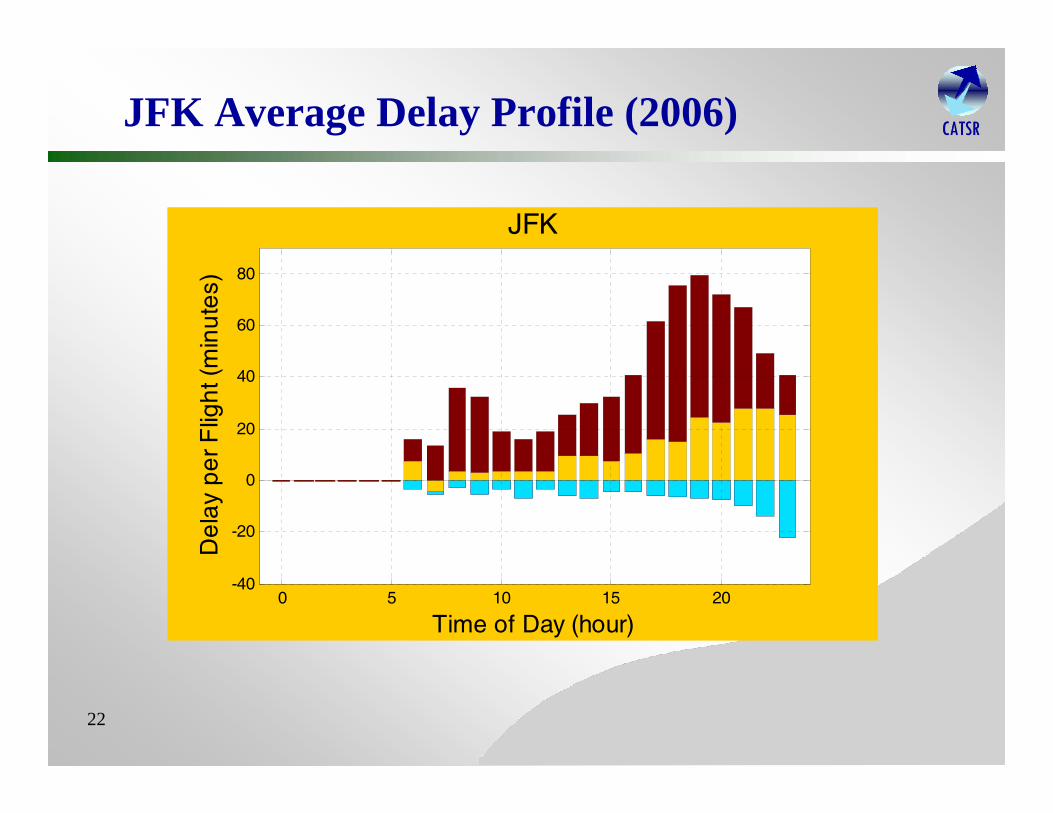
CATSRCATSRCATSRCATSRJFK Average Delay Profile (2006)
Time of Day (hour)
De
lay
pe
r Flig
ht (
min
ute
s)JFK
0 5 10 15 20-40
-20
0
20
40
60
80

23
CATSRCATSRCATSRCATSR
New York LaGuardia Airport:Case Study of a Slot Controlled Airport
Data (2005):• Throughput:
404,853 flights/yr• Average flight delay:
38 min• Revenue passengers:
26,671,787• Average aircraft size:
96 passenger• Average inter-city fare:
$133

24
CATSRCATSRCATSRCATSR
NYNJ Airport with Current Slot Controls:LGA 2004 – 2006 (DOT Data)
Marginal Rate IFR Rate
Calculated Capacity (Today) and Actual Throughput
Optimum Rate
0
20
40
60
0 20 40 60
Departures per Hour
Arr
ival
s pe
r Hou
r
Calculated Capacity - Today
Facility Reported Rate - LGA(arrivals, departures per hr)
39,39
Each symbol represents actual traffic during a single hour
Infrequent Most Frequent
0
20
40
60
0 20 40 60
Departures per Hour
Arr
ival
s pe
r Hou
r
37,37
0
20
40
60
0 20 40 60
Departures per Hour
Arr
ival
s pe
r Hou
r
37,37
Time of Day (hour)
Del
ay p
er
Flig
ht (
min
ute
s)
LGA
0 5 10 15 20-40
-20
0
20
40
60
80

25
CATSRCATSRCATSRCATSR
Current Government Rules at LGA Lead to Poor Use of Runway Resources
• Inefficient use of resources
Airports loseAirlines lose
(Low load factor/Small
Aircraft)
Airports winAirlines win
(High Load Factor/Large
Aircraft)
26
CATSRCATSRCATSRCATSROutline• How Bad and widespread is the Problem
• What Has Changed Since 1947• Passenger QOS• Economic Impact
• What are the Underlying Causes• Too Many Scheduled Flights into Too Few Runways
• Why the Airlines cannot fix the Problem Themselves• Prisoners Dilemma and Curse of the Commons
• Safety is the Underlying Capacity Constraint• Current Safety Trends• Airport Arrival Time Slot Auctions
• High Payoff Research Topics• NEXTGEN ATM system
27
CATSRCATSRCATSRCATSR
Why do the Airlines Schedule beyond the Maximum Safe RW Capacity with Flights that Loose Revenue?
• There is no government regulation to limit schedules for safety or compensate passengers for delays and cancellations• These were errors in the 1978 Deregulation Act
• Passenger surveys indicate that frequency and price are the most desirable characteristics of a flight
• Passengers are not told of consequences of schedule to travel predictability
• If any one airline decided to offer rational schedules, their competition will offer more frequency to capture market share• Thus, still producing delays and cancellations for all
• In Game Theory, this is called the Prisoner’s Dilemma
28
CATSRCATSRCATSRCATSROutline• How Bad and widespread is the Problem
• What Has Changed Since 1947• Passenger QOS• Economic Impact
• What are the Underlying Causes• Too Many Scheduled Flights into Too Few Runways
• Why the Airlines cannot fix the Problem Themselves• Prisoners Dilemma and Curse of the Commons
• Safety is the Underlying Capacity Constraint• Current Safety Trends• Airport Arrival Time Slot Auctions
• High Payoff Research Topics• NEXTGEN ATM system

29
CATSRCATSRCATSRCATSR
Part 121 (Scheduled Commercial)Accident Rates are Increasing
My filtered part-121 accidents
y = 0.0533x + 1.0647
0
0.5
1
1.5
2
2.5
1995
1996
1997
1998
1999
2000
2001
2002
2003
2004
2005
2006
coun
t per
milli
on o
pera
tions
Analysis from Zohreh Nazeri, PhD GMU 2007

30
CATSRCATSRCATSRCATSRTrends for Incidents Associated with Accidents
Trends of the factors in incident databases• Pilot factors decreasing• Aircraft factors slowly decreasing• ATC factors increasing
Pilot primary factors in ASRS reports
y = -7.1868x + 123.330
20406080
100120140160
1995
1996
1997
1998
1999
2000
2001
2002
2003
2004
2005
2006
coun
t per
mill
ion
oper
atio
ns
Aircraft primary factors in ASRS reports
y = -3.8007x + 683.79
0
200
400
600
800
1000
1995
1996
1997
1998
1999
2000
2001
2002
2003
2004
2005
2006
coun
t per
mill
ion
oper
atio
ns
ATC primary factors in ASRS reports
y = 0.0824x + 29.716
0
10
20
30
40
50
1995
1996
1997
1998
1999
2000
2001
2002
2003
2004
2005
2006
coun
t per
mill
ion
oper
atio
ns
ATC incidents in FAA/OED data, Terminal
y = 1.4581x + 18.118
05
10
15202530
3540
95 96 97 98 99 00 ;01 02 03 04
coun
t per
milli
onop
erat
ions
Analysis from Zohreh Nazeri,
PhD GMU 2007

31
CATSRCATSRCATSRCATSRATC factors – Communication Errors
Top complexity factors associated with ATC factors:
• number of aircraft in airspace -- airspace design
• runway configuration -- controller experience
Top-10 traffic complexity factors associated w ith communcation errors
0.00%
10.00%
20.00%
30.00%
40.00%
other
blank
#a/c,
othe
r
#a/c
airsp
ace,
#a/c,
othe
rair
spac
e, oth
er
#a/c,
expe
rienc
e, oth
er
rwy c
onfig
, othe
rair
spac
e
#a/c,
rwy c
onfig
% c
omm
err
ors
These factors will get worse over time:
• air transportation is projected to grow for the next 10 years
• majority of controllers will retire within next few years
Analysis from Zohreh Nazeri,
PhD GMU 2007

32
CATSRCATSRCATSRCATSRAircraft factors
“Flight Control System” problems growingOther aircraft factors decreasing
Growth of aircraft problems in SDRS data
-0.7-0.6-0.5-0.4-0.3-0.2-0.1
00.10.20.3
Fligh
t Con
trol S
ystem
Nacell
e/Pylo
n atta
chmen
t
Collisi
on A
voida
nce S
ystem Wing
Compre
ssor
Assem
blyLa
nding
Gea
r
tren
d lin
e sl
op
Aircraft flight control system problems
y = 0.4037x - 0.2704
00.5
11.5
22.5
33.5
44.5
1995
1996
1997
1998
1999
2000
2001
2002
2003
coun
t per
milli
on o
pera
tions
Analysis from Zohreh Nazeri, PhD GMU 2007

33
CATSRCATSRCATSRCATSR
Safety at Principle Network Nodes(i.e. Airports) is the Constraint
• Aircraft Safety Separation Time over the Runway Threshold sets the ATS capacity limits
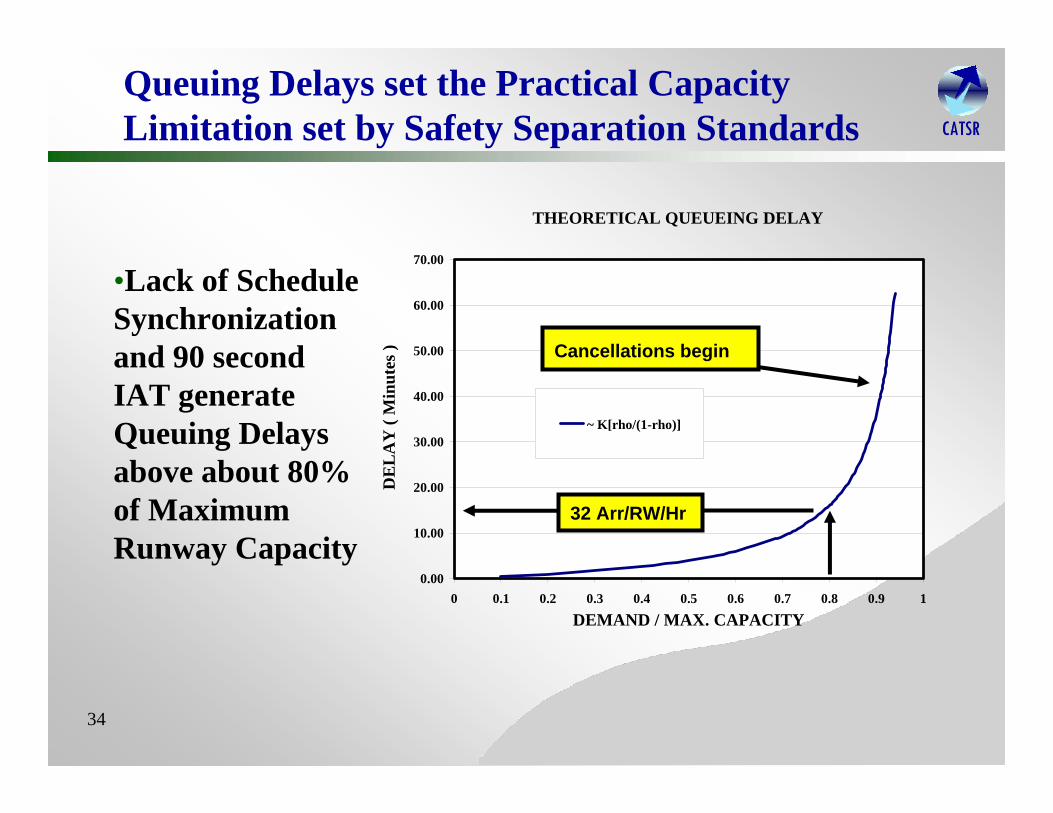
• Critical Technical Parameters that Define Network Capacity:• Runway Occupancy Time (ROT)• Landing Aircraft Inter-Arrival Time (IAT)• Capmax = 90 sec IAT at 10-3 PSRO = 40 Arr/RW/Hr• Queuing Delay Onset at ~ 80% = 32 Arr/RW/Hr
limit for Predictable Performance
34
CATSRCATSRCATSRCATSR
Queuing Delays set the Practical Capacity Limitation set by Safety Separation Standards
•Lack of Schedule Synchronization and 90 second IAT generate Queuing Delays above about 80% of Maximum Runway Capacity
THEORETICAL QUEUEING DELAY
0.00
10.00
20.00
30.00
40.00
50.00
60.00
70.00
0 0.1 0.2 0.3 0.4 0.5 0.6 0.7 0.8 0.9 1
DEMAND / MAX. CAPACITY
DE
LA
Y (
Min
utes
)
~ K[rho/(1-rho)]
32 Arr/RW/Hr
Cancellations begin

35
CATSRCATSRCATSRCATSR
Data Analysis Process to Estimate:IAT, IAD and ROT pdf’s
Runway
Threshold
Airplane i+1
Airplane i
Aircraft Type Threshold Leave RunwayHeavy 10:23:14 10:24:04Large 10:24:28 10:25:13Large 10:26:16 10:27:12Small 10:28:32 10:29:28
. . .
. . .
. . .
Col. Clint Haynie, USA PhD., 2002
Yue Xie, PhD. 2005
36
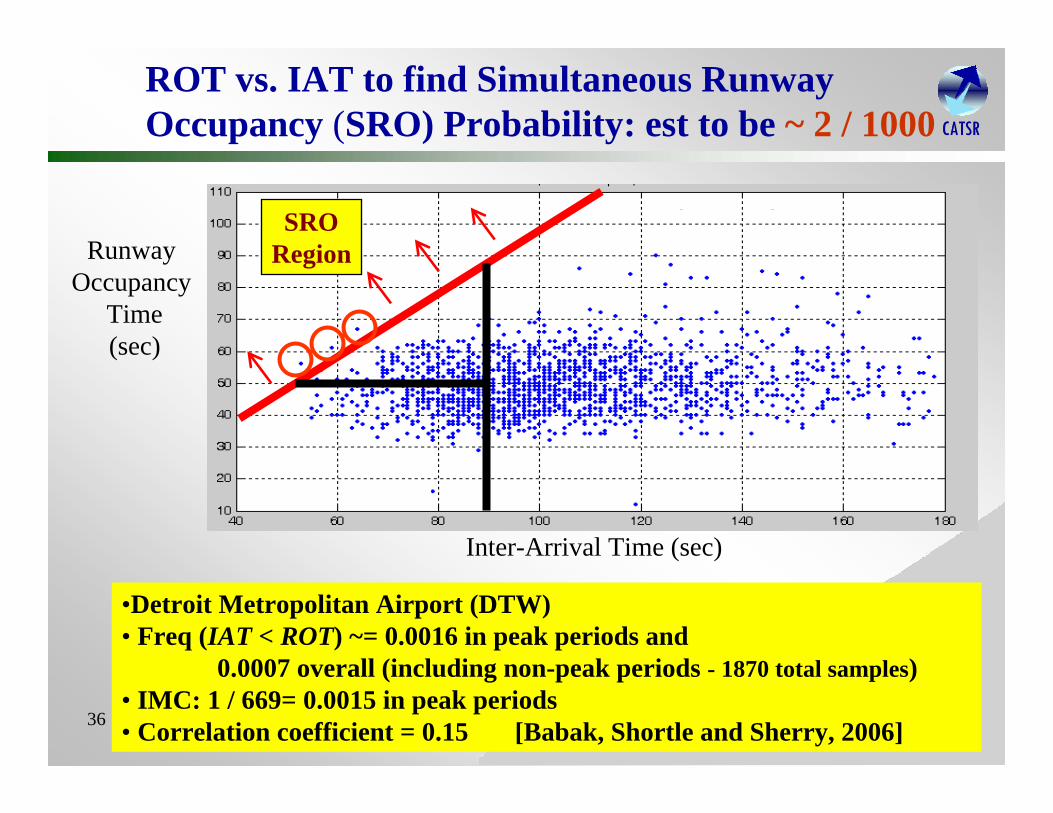
CATSRCATSRCATSRCATSR
ROT vs. IAT to find Simultaneous Runway Occupancy (SRO) Probability: est to be ~ 2 / 1000
Inter-Arrival Time (sec)
Runway Occupancy
Time(sec)
SRORegion
•Detroit Metropolitan Airport (DTW)• Freq (IAT < ROT) ~= 0.0016 in peak periods and
0.0007 overall (including non-peak periods - 1870 total samples)• IMC: 1 / 669= 0.0015 in peak periods• Correlation coefficient = 0.15 [Babak, Shortle and Sherry, 2006]
37
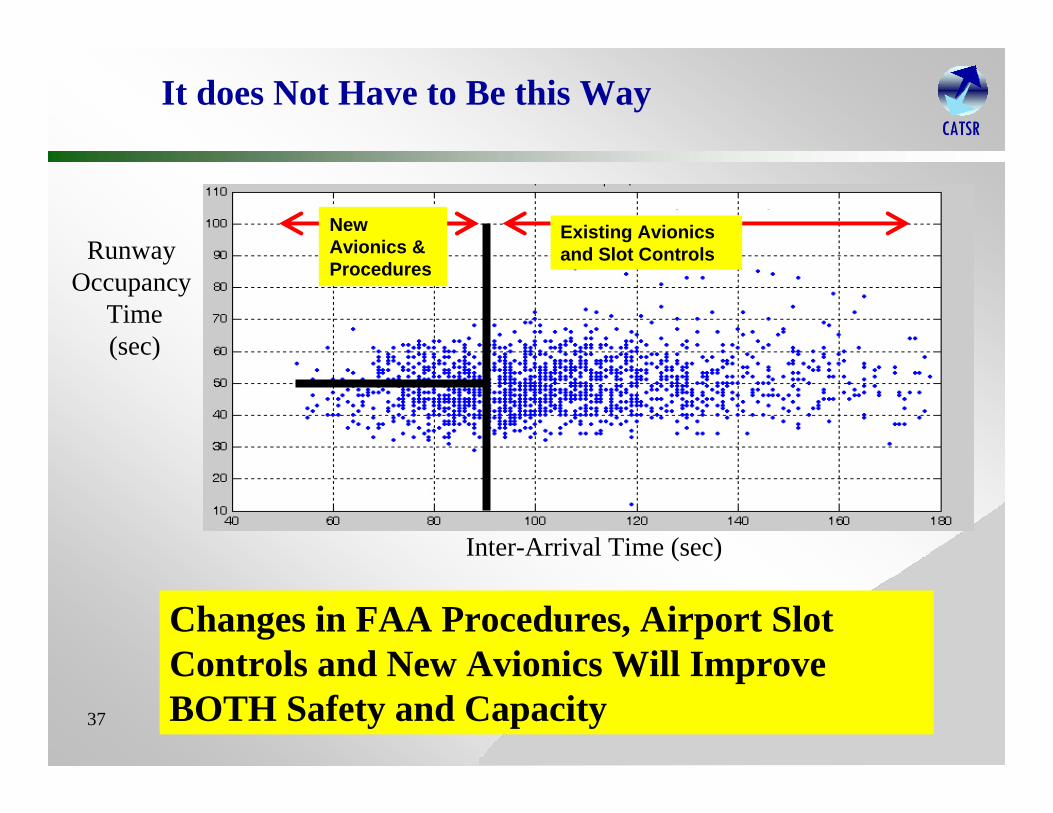
CATSRCATSRCATSRCATSRIt does Not Have to Be this Way
Inter-Arrival Time (sec)
Runway Occupancy
Time(sec)
New Avionics & Procedures
Existing Avionics and Slot Controls
Changes in FAA Procedures, Airport Slot Controls and New Avionics Will Improve BOTH Safety and Capacity

38
CATSRCATSRCATSRCATSRSummary on Capacity
• 40 Arrival per Runway per Hour is current Safety Maximum
• 32 Arrivals per Runway per Hour is ONSET of Queuing Delays• Using Current (OLD) Technology• Using Current (OUTDATED) ATC Procedures
• FAA has Refused to Mandate New Technology and Procedures to Reduce the Variability in IAT to Increase BOTH Safety and Capacity

39
CATSRCATSRCATSRCATSR
Marginal Rate IFR Rate
Calculated Capacity (Today) and Actual Throughput
Optimum Rate
0
20
40
60
80
0 20 40 60 80
Departures per Hour
Arr
ival
s pe
r Hou
r
Calculated Capacity - Today
Facility Reported Rate - EWR(arrivals, departures per hr)
Each symbol represents actual traffic during a single hour
Infrequent Most Frequent
42, 42
0
20
40
60
80
0 20 40 60 80
Departures per Hour
Arr
ival
s pe
r Hou
r
40, 40
0
20
40
60
80
0 20 40 60 80
Departures per Hour
Arr
ival
s pe
r Hou
r
33, 33
EWR :
DoT/FAA
2004 Capacity Benchmark Report
Capacity Increase:Closer Spacing & better Schedule Synchronization
All Weather
40
CATSRCATSRCATSRCATSR
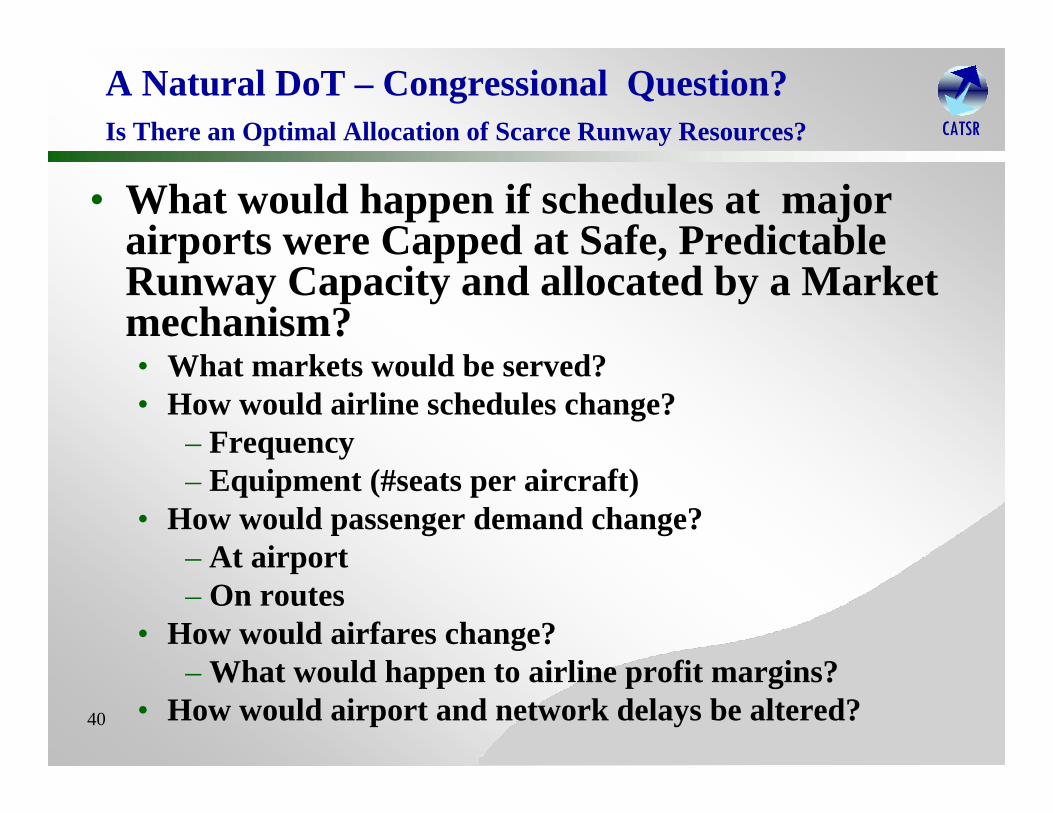
• What would happen if schedules at major airports were Capped at Safe, Predictable Runway Capacity and allocated by a Market mechanism?• What markets would be served?• How would airline schedules change?
– Frequency– Equipment (#seats per aircraft)
• How would passenger demand change?– At airport– On routes
• How would airfares change?– What would happen to airline profit margins?
• How would airport and network delays be altered?
A Natural DoT – Congressional Question?Is There an Optimal Allocation of Scarce Runway Resources?

41
CATSRCATSRCATSRCATSRModeling Approach and Assumptions
• Port Authority of NY&NJ has the ability to Determine and Set an Optimum Schedule to:• Operate at Competitive Profit Margins• Maximize Passenger Throughput• Ensure an Airline Operating Profit (Max, 90%,80%)
• All Current Origin and Destination Markets are Considered• 67 Scheduled Daily Serviced Markets
• Current Market Price Elasticity Remains Constant

42
CATSRCATSRCATSRCATSRNY LGA Has 67 Daily Markets
43
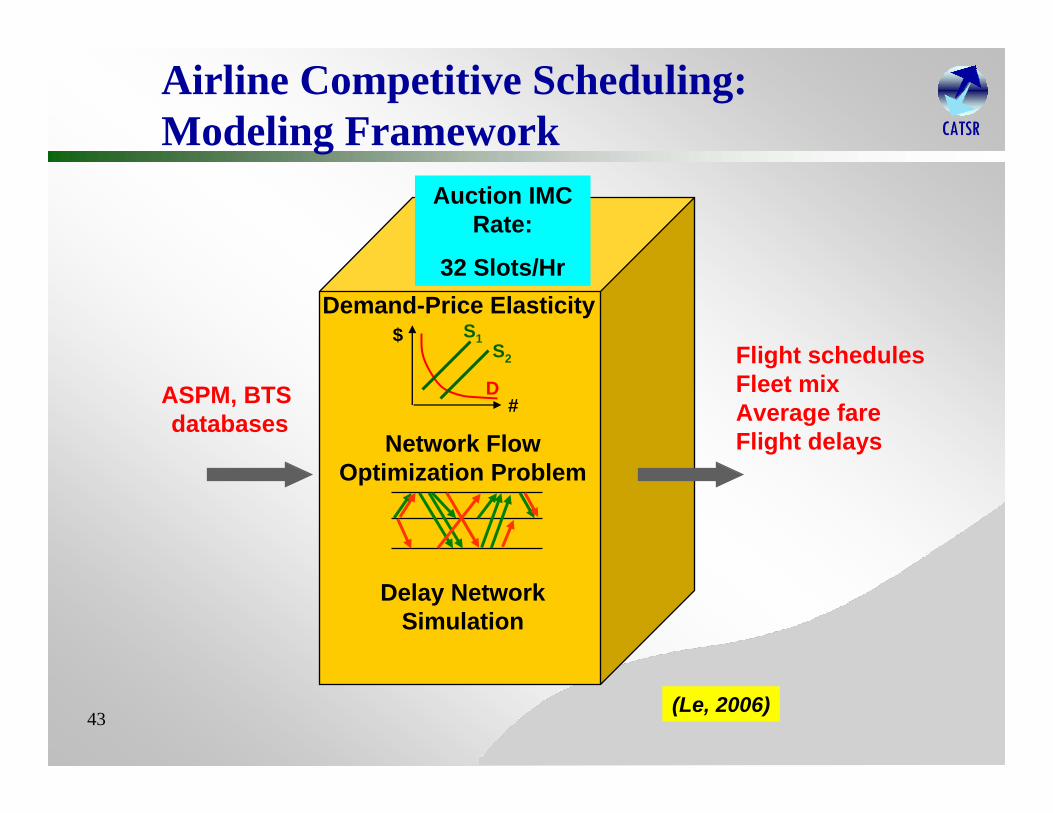
CATSRCATSRCATSRCATSR
Network Flow Optimization Problem
(Le, 2006)
Demand-Price Elasticity$
#
S1S2
DASPM, BTS databases
Delay Network Simulation
Flight schedulesFleet mixAverage fareFlight delays
Airline Competitive Scheduling: Modeling Framework
Auction IMC Rate:
32 Slots/Hr
44
CATSRCATSRCATSRCATSR
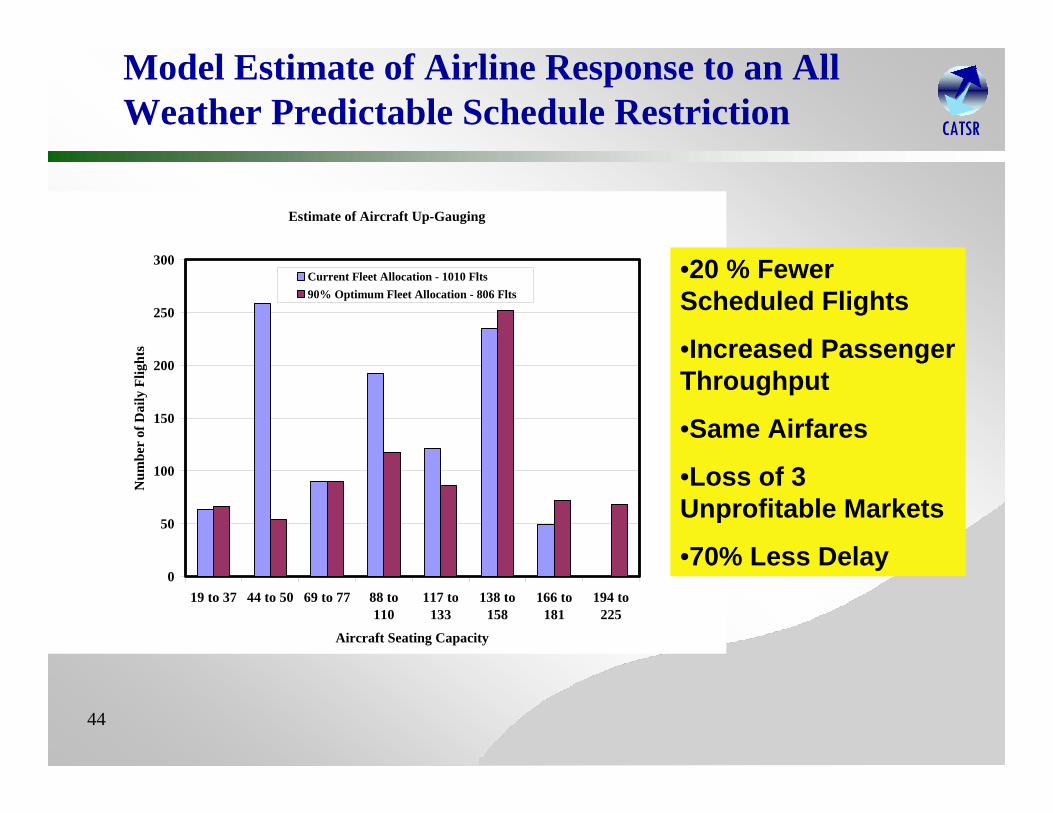
Model Estimate of Airline Response to an All Weather Predictable Schedule Restriction
Estimate of Aircraft Up-Gauging
0
50
100
150
200
250
300
19 to 37 44 to 50 69 to 77 88 to110
117 to133
138 to158
166 to181
194 to225
Aircraft Seating Capacity
Num
ber
of D
aily
Flig
hts
Current Fleet Allocation - 1010 Flts 90% Optimum Fleet Allocation - 806 Flts
•20 % Fewer Scheduled Flights
•Increased Passenger Throughput
•Same Airfares
•Loss of 3 Unprofitable Markets
•70% Less Delay

45
CATSRCATSRCATSRCATSROutline• How Bad and widespread is the Problem
• What Has Changed Since 1947• Passenger QOS• Economic Impact
• What are the Underlying Causes• Too Many Scheduled Flights into Too Few Runways
• Why the Airlines cannot fix the Problem Themselves• Prisoners Dilemma and Curse of the Commons
• Safety is the Underlying Capacity Constraint• Current Safety Trends• Airport Arrival Time Slot Auctions
• High Payoff Research Topics• NEXTGEN ATM system

46
CATSRCATSRCATSRCATSR
The Predicted Growth in Aviation Demand is based on Passenger Demand NOT Aircraft Operations
• Larger Aircraft will be required to meet X2 or X3 demand• Business Jet and VLJ Air Taxi Service will emerge to
compete with Commercial aviation due to current System Failure• May not be able to put the Geni back in the Bottle• Environmental Implications?
• New Aircraft (e.g. B 787) should be Environmentally Friendly (Emissions/passenger/mi.?)• US airlines are not currently ordering them due to poor financial
position• New Public Policy will be needed to Deal with these
Complex Adaptive System Problems• NEXTGEN System not addressing these issues

47
CATSRCATSRCATSRCATSRIS NGATS addressing the Problem?
• ADS-B (out), 4-D trajectories, RNP-0.1• Good but NOT ENOUGH
• Aircraft Gauge, Schedule Synchronization and Network Load Balancing will Be Required• Annual Combinatorial Clock Slot Auctions ?
• Aircraft Separation in Terminal Airspace and on the Runways MUST be REDUCED by X3!• Closely Spaced, Fully-coupled Autopilot Formation
Landings with 2 – Lane Runways?• Closely Spaced Airports need to be Cross-linked
with Runway Independent Air Transport• New Generation of Heavy Lift Helicopters?

48
CATSRCATSRCATSRCATSR
Center for Air Transportation System Research Publications and Information
• http://catsr.ite.gmu.edu
– Other Useful Web Sites
• http://mytravelrights.com• http://gao.gov• http://www.airconsumer.ost.dot.gov