Air Resources Board - cdpr.ca.gov · II. Chemical Pronerties of Permethrin The following...
32
=: /7-i(l;)L Air Resources Board P * John D. Dunlap, III, Chairman P.O. Box 2815 * 2020 L Street + Sacramento, California 958 12 - www.arb.ca.gov Pete Wilson Governor MEMORANDUM TO: Douglas Y. Okumura, Chief Environmental Monitoring and Pest Management Branch Departmentof Pesticide Regulation FROM: DATE: November 17,1998 SUBJECT: FINAL REPORT FOR THE 1997 PERMETHRIN AIR MONITORING Attached is the final “Report for the Application (Butte County) and Ambient (Monterey County) Air Monitoring of Permethrin.” The separate volume of appendices for the report has been forwarded to Pam Wales of your staff and is available upon request. As per your October 27,199s memorandum, you had no comments on the draft report. Theseresults are intended for identifying the presence of permethrin in ambient air. Additional air monitoring near the useof permethrin may be necessary to determineif there is a needfor mitigation. The locations of the ambientmonitoring sites and the monitoring period should be evaluatedwhen the 1997permethrin use data becomes available. If you or your staff have questions or need further information, pleasecontactme at (916) 263-1630 or Mr. Kevin Mongar at (916) 263-2063. Attachment cc: Ray Menebroker, SSD (w/Attachment and Appendices) Richard W. Nutter, Monterey County Agricultural Commissioner (w/Attachment) Doug Quetin, Monterey Bay Unified APCD (w/Attachment) Richard Price, Butte County Agricultural Commissioner (w/Attachment) Larry Odle, Butte County AQMD (w/Attachment) Pam Wales, DPR (w/Attachment and Appendices) SharonSeidel, OEHHA (w/Attachment) Chuck Mourer, Env. Toxicology Department,UCD (W/Attachment and Appendices) California Environmental ProtectionAgency Printed on Recycled Paper
Transcript of Air Resources Board - cdpr.ca.gov · II. Chemical Pronerties of Permethrin The following...
=: /7-i(l;)L
Air Resources Board P *
John D. Dunlap, III, Chairman P.O. Box 28 15 * 2020 L Street + Sacramento, California 958 12 - www.arb.ca.gov Pete Wilson
Governor
MEMORANDUM
TO: Douglas Y. Okumura, Chief Environmental Monitoring and Pest Management Branch Department of Pesticide Regulation
FROM:
DATE: November 17,1998
SUBJECT: FINAL REPORT FOR THE 1997 PERMETHRIN AIR MONITORING
Attached is the final “Report for the Application (Butte County) and Ambient (Monterey County) Air Monitoring of Permethrin.” The separate volume of appendices for the report has been forwarded to Pam Wales of your staff and is available upon request. As per your October 27,199s memorandum, you had no comments on the draft report.
These results are intended for identifying the presence of permethrin in ambient air. Additional air monitoring near the use of permethrin may be necessary to determine if there is a need for mitigation. The locations of the ambient monitoring sites and the monitoring period should be evaluated when the 1997 permethrin use data becomes available.
If you or your staff have questions or need further information, please contact me at (916) 263-1630 or Mr. Kevin Mongar at (916) 263-2063.
Attachment
cc: Ray Menebroker, SSD (w/Attachment and Appendices) Richard W. Nutter, Monterey County Agricultural Commissioner (w/Attachment) Doug Quetin, Monterey Bay Unified APCD (w/Attachment) Richard Price, Butte County Agricultural Commissioner (w/Attachment) Larry Odle, Butte County AQMD (w/Attachment) Pam Wales, DPR (w/Attachment and Appendices) Sharon Seidel, OEHHA (w/Attachment) Chuck Mourer, Env. Toxicology Department, UCD (W/Attachment and Appendices)
California Environmental Protection Agency Printed on Recycled Paper

State of California California Environmental Protection Agency
AIR RESOURCES BOARD
Report for the Application (Butte County) and Ambient (Monterey County) Air Monitoring
of Permethrin
Engineering and Laboratory Branch
Monitoring and Laboratory Division
Project No. C97-04 1 a (Application) C97-04 1 (Ambient)
Date: November 17, 1998
This report has been reviewed by the staff of the California Air Resources Board and approved for publication. Approval does not signify that the contents necessarily reflect the views and policies of the Air Resources Board, nor does mention of trade names or commercial products constitute endorsement or recommendation for use.
Summary
Report for the Application (Butte County) and Ambient (Monterey County) Air Monitoring
of Permethrin
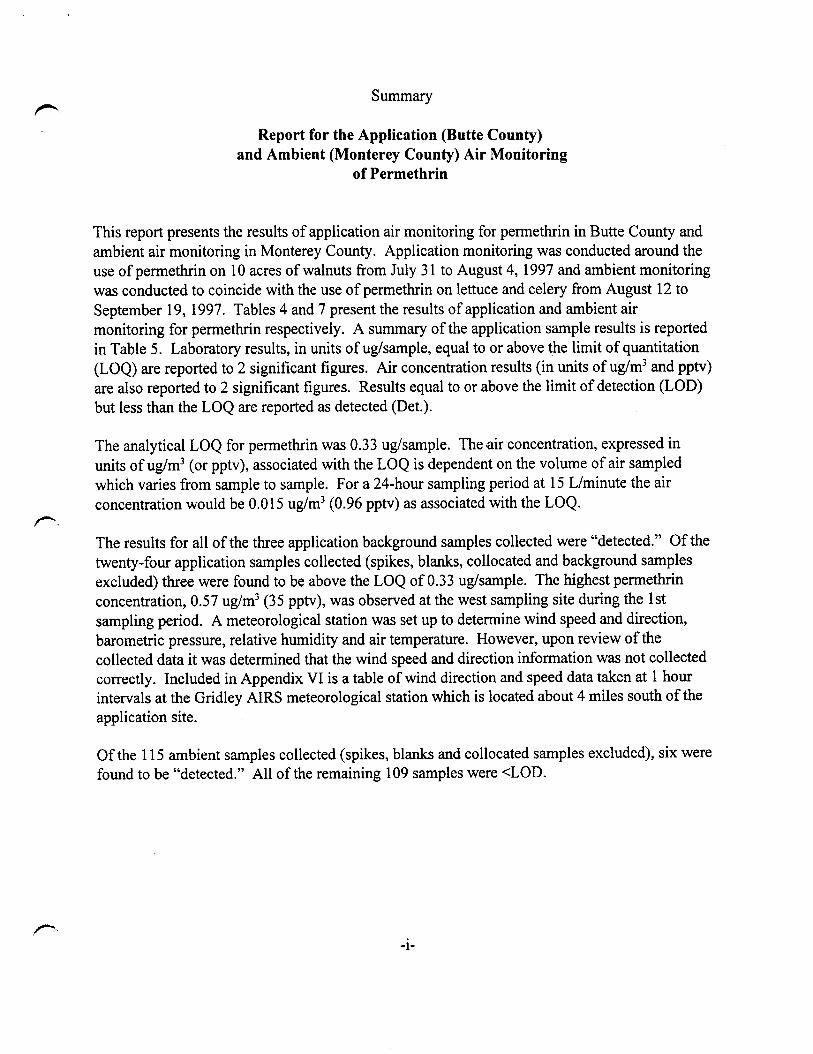
This report presents the results of application air monitoring for permethrin in Butte County and ambient air monitoring in Monterey County. Application monitoring was conducted around the use of permethrin on 10 acres of walnuts from July 3 1 to August 4, 1997 and ambient monitoring was conducted to coincide with the use of permethrin on lettuce and celery from August 12 to September 19, 1997. Tables 4 and 7 present the results of application and ambient air monitoring for permethrin respectively. A summary of the application sample results is reported in Table 5. Laboratory results, in units of @sample, equal to or above the limit of quantitation (LOQ) are reported to 2 significant figures. Air concentration results (in units of ug/m3 and pptv) are also reported to 2 significant figures. Results equal to or above the limit of detection (LOD) but less than the LOQ are reported as detected (Det.).
The analytical LOQ for permethrin was 0.33 @sample. The *air concentration, expressed in units of ug/m3 (or pptv), associated with the LOQ is dependent on the volume of air sampled which varies from sample to sample. For a 24-hour sampling period at 15 L/minute the air concentration would be 0.015 ug/m’ (0.96 pptv) as associated with the LOQ.
The results for all of the three application background samples collected were “detected.” Of the twenty-four application samples collected (spikes, blanks, collocated and background samples excluded) three were found to be above the LOQ of 0.33 ug/sample. The highest permethrin concentration, 0.57 ug/m3 (35 pptv), was observed at the west sampling site during the 1st sampling period. A meteorological station was set up to determine wind speed and direction, barometric pressure, relative humidity and air temperature. However, upon review of the collected data it was determined that the wind speed and direction information was not collected correctly. Included in Appendix VI is a table of wind direction and speed data taken at 1 hour intervals at the Gridley AIRS meteorological station which is located about 4 miles south of the application site.
Of the 115 ambient samples collected (spikes, blanks and collocated samples excluded), six were found to be “detected.” All of the remaining 109 samples were CLOD.
-i-
Acknowledgments
Staff of the ARB Testing Section collected the application and ambient samples. Assistance was provided by the Butte County Agricultural Commissioner’s Office and the Monterey County Agricultural Commissioner’s Office. Chemical analyses were performed by the Trace Analytical Laboratory at the University of California at Davis.
-ii-
1.
II.
III.
IV.
V.
p VI.
VII.
TABLE OF CONTENTS
Pag;e INTRODUCTION ......................................................... 1
CHEMICAL PROPERTIES OF PERMETHRIN ................................. 2
SAMPLING .............................................................. 2
A. APPLICATIONMONITORING ........................................ 2
B. AMBIENTMONITORING ............................................ 4 .
ANALYTICAL METHODOLOGY SUMMARY ................................ 6
APPLICATION AND AMBIENT RESULTS ................................... 6
A. APPLICATION MONITORING RESULTS .............................. 7
B. AMBIENT MONITORING RESULTS .................................. 7
QUALITY ASSURANCE ................................................... 7
QUALITY ASSURANCE RESULTS .......................................... 8
A. METHOD DEVELOPMENT .......................................... 8
B. TRIPBLANKS ..................................................... 8
C. APPLICATION BACKGROUND SAMPLE RESULTS ..................... 9
D. COLLOCATED SAMPLE RESULTS ................................... 9
E. LABORATORY SPIKES ............................................. 9
F. TRIPSPIKES ...................................................... 9
G. FIELD SPIKES . . . . . . . . . . . . . . . . . . . . . . . . . . . . . . . . . . . . . . . . . . . . . . . . . . . . 10
. . . -lll-
peter
peter
peter
peter
peter
peter
peter
peter
peter
peter
peter
peter
peter
peter
peter
peter
peter
peter
LIST OF FIGURES
1. PERMETHRIN AMBIENT MONITORING AREA ....................... 11
2. PERMETHRIN APPLICATION SITE .................................. 12
3. PERMETHRIN APPLICATION MET. DATA SITES ...................... 13
1.
2.
3.
4.
5.
6.
7.
IJST OF TABLES
APPLICATION INFORMATION ...................................... 3
APPLICATION SAMPLING PERIODS ................................. 4
AMBIENT SAMPLING SITES ........................................ 5
PERMETHRIN APPLICATION MONITORING RESULTS ............. 14- 15
SUMMARY OF PERMETHRIN APPLICATION RESULTS ................ 16
PERMETHIUN APPLICATION COLLOCATED RESULTS ................ 17
PERMETHRIN AMBIENT MONITORING RESULTS ................. 18-23
8. PERMETHIUN APPLICATION LAB SPIKE RESULTS ................... 24
9. PERMETHRJN APPLICATION TRIP SPIKE RESULTS ................... 24
10. PERMETHRIN APPLICATION FIELD SPIKE RESULTS ................. 24
11. PERMETHRIN AMBIENT LAB SPIKE RESULTS ....................... 25
12. PERMETHRIN AMBIENT TRIP SPIKE RESULTS ....................... 25
13. PERMETHRIN AMBIENT FIELD SPIKE RESULTS ..................... 25
I.
II.
APPENDICES (contained in a separate volume)
SAMPLING PROTOCOL . . . . . . . . . . . . . . . . . . . . . . . . . . . . . . . . . . . . . . . . . . . . . 1
LABORATORYREPORT . . . . . . . . . . . . . . . . . . . . . ..a.................... 8
-iv-
peter
peter
peter
peter
peter
peter
peter
peter
peter
peter
peter
peter
peter
peter
peter
peter
peter
peter
peter
peter

III. APPLICATION USE REPORT ....................................... 39
IV. DPR’s “MONITORING RECOMMENDATIONS FOR PERMETHRIN” ...... 40
V. APPLICATION AND AMBIENT FIELD LOG SHEETS ................... 48
VI. PERMETHRIN APPLICATION METEOROLOGICAL DATA .............. 59
-v-
peter
peter
peter
peter

Report for the Application (Butte County) and Ambient (Monterey County) Air Monitoring
of Permethrin
I. Introduction
At the request of the California Department of Pesticide Regulation (DPR) (February 7, 1997 Memorandum, Sanders to Lew), the Air Resources Board (ARB) staff determined airborne concentrations of the pesticide permethrin over a six week ambient monitoring program in populated areas of Monterey County, conducted to coincide with the use of permethrin on lettuce and celery. Application monitoring was conducted in Butte County around the use of permethrin on 10 acres of walnuts. This monitoring was done to fulfill the requirements of AB 180713219 (Food and Agricultural Code, Division 7, Chapter 3, Article 1.5) which requires the ARB “to document the level of airborne emissions . . . . of pesticides which may be determined to pose a present or potential hazard...” when requested by the DPR. Method development and sample analyses were conducted by the Trace Analytical Laboratory (TAL) at the University of California Davis. Field monitoring was conducted by staff of the ARB Testing Section.
m The “Protocol for the Ambient and Application Monitoring of Permethrin” is enclosed separately as Appendix I (page 1 of a separate volume of appendices to this report).
The TAL report, “Method Development, Ambient Site and Application Site Monitoring for Permethrin in Air Samples Using XAD-4@ as a Trapping Medium”, is enclosed separately as Appendix II (page 8 of the separate volume of appendices to this report). The sampling/analysis Standard Operating Procedures (SOP) are also enclosed in Appendix II (page 10 of the separate volume of appendices to this report).
The pesticide use report for the application study is enclosed separately as Appendix III (page 39 of the separate volume of appendices to this report).
The DPR’s February 7, 1997 memorandum, “Air Monitoring Recommendation for Permethrin” is enclosed separately as Appendix IV (page 40 of the separate volume of appendices to this report).
The application and ambient field log sheets are enclosed separately as Appendix V (page 48 of the separate volume of appendices to this report.
The application meteorological monitoring results are enclosed separately as Appendix VI (page 59 of the separate volume of appendices to this report).
-l-

II. Chemical Pronerties of Permethrin
The following information regarding the chemical properties of permethrin was obtained from the DPR’s February 7, 1997 “Air Monitoring Recommendation for Permethrin” (page 40 of appendices).
Permethrin (CAS:52645-53-1) exists as either colorless crystals or a light yellow viscous liquid. Technical material contains 60% trans- and 40% cis- isomers. Permethrin has a molecular formula of C2,H2,,C1203, a molecular weight of 391.29 g/mole, and a specific density of .960 at 25 “C. It has a water solubility of 0.2 mg/L at 20 “C, a Henry’s Constant of 1 .O x 10ms atmsm3/mol at 20-25 “C, and a vapor pressure of 1.88 x 10-* mmHG at 20°C. Permethrin is miscible with most organic solvents except ethylene glycol.
Exposure limits for permethrin are: ACGIH TLV:TWA 0.05 mg/m3 ppm, STEL 0.2 mg/m3. Permethrin’s acute oral LD,, is approximately 4,000 mg/kg for rats. It’s LCsO (48 hour) is 5.4 ug/L for rainbow trout, and 1.8 ug/L for bluegill sunfish. Based on it’s potential reproductive considerations, permethrin has entered the risk assessment process at DPR under the SB 950 (Birth Defect Prevention Act of 1984).
III. Sampling
p A sketch of the sampling apparatus is shown in Attachment A of Appendix I (appendices pg. 7). Samples were collected by passing a measured volume of ambient air through XAD-4 resin. The resin holders are 4-314” long x l-55/66” O.D. and made of Teflon. Each holder contained approximately 30 cc of specially prepared XAD-4 resin provided by the TAL. The resin was held in place by stainless steel screens on each side of the resin and between the Teflon support rings. Calibrated rotameters were used to set and measure sample flow rates. The rotameters were calibrated using a certified digital bubble flowmeter. The flow rate, 15 Lpm was accurately measured and the sampling system operated continuously with the exact operating interval noted. Samplers were leak checked prior to and after each sampling period with the sampling cartridges installed. Any change in the flow rates was recorded in the field log book (see appendices pg. 48). The resin tubes were protected from direct sunlight with aluminum foil and supported about 1.5 meters above the ground (or roof) during the sampling period. At the end of each sampling period the tubes were capped and placed in zip-lock plastic bags with an identification label affixed. The field log book was used to record start and stop times, sample identifications and any other significant comments. Subsequent to sampling, the samples were transported on dry ice, as soon as reasonably possible, to the TAL. The samples were stored in the freezer or extracted/analyzed immediately.
A. Annlication Monitoring
The use pattern for permethrin suggested that application-site monitoring should be conducted in p association with an application rate of 0.30 pounds permethrin per acre or greater. A 10 acre walnut
-2-

p orchard in Butte County was chosen for the application monitoring site. Refer to Figure 2 for a diagram of the application site. Refer to Appendix III (page 39 of appendices) for a copy of the pesticide use report.
Information collected regarding the application included: 1) the elevation of each sampling station with respect to the field, 2) the orientation of the field with respect to North (identified as either true or magnetic), 3) an accurate record of the positions of the monitoring equipment with respect to the field, including the distance each monitor is positioned away from the edge of the field and an accurate drawing of the monitoring site showing the precise location of the monitoring equipment and any wind obstacles with respect to the field, 4) the field size, 5) the application rate, 6) formulation and 7) method and length of application. Details regarding the site and application are summarized below in Table 1.
Table 1. Application Information
Range/Township/Section: Product Applied: Type of Application: Application Rate:
R2E/Tl8N/S35 Ambush Spray, blower 1.95 lbs. Ambush per acre (0.39 Ibs. permethrin A.I. Per acre)
Applicator: John Taylor Fertilizers
A three day monitoring period was recommended in the DPR’s February 7,1997 “Air Monitoring Recommendation for Permethrin” with intended sampling times as follows: (where the first sample is started at the start of application) application + 1 hour, followed by one 2-hour sample, one 4- hour sample, two 8-hour samples and two 24-hour samples.
Prior to the application, background samples were taken at north, west and south positions to establish if any permethrin was detectable in the air before the application (i.e., from nearby applications). The background samples were collected from 1200 on July 3 1 to 07 15 on August 1, 1997 (19.25 hours). Referring to Figure 2, with the rows oriented east/west, the August 1 application started at 0800 and ended at 1000 and the application started at the southwest corner. Every other row was sprayed through the orchard followed by application to the remaining rows. Table 2 lists the actual sampling periods.
-3-
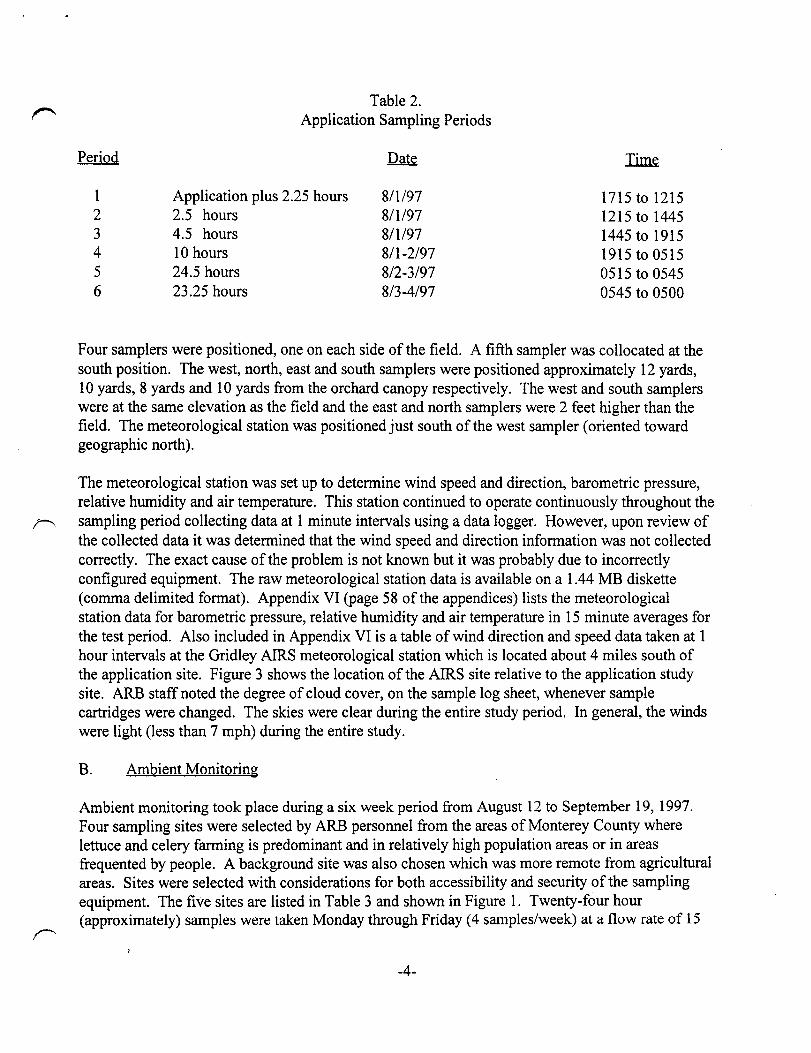
Table 2. Application Sampling Periods
Period Time
1 Application plus 2.25 hours 8/l/97 1715 to 1215 2 2.5 hours 8/l/97 1215 to 1445 3 4.5 hours 8/l/97 1445 to 1915 4 10 hours 8/l -2197 1915 to 0515 5 24.5 hours 812-3197 0515 to 0545 6 23.25 hours 813-4197 0545 to 0500
Four samplers were positioned, one on each side of the field. A fifth sampler was collocated at the south position. The west, north, east and south samplers were positioned approximately 12 yards, 10 yards, 8 yards and 10 yards from the orchard canopy respectively. The west and south samplers were at the same elevation as the field and the east and north samplers were 2 feet higher than the field. The meteorological station was positioned just south of the west sampler (oriented toward geographic north).
The meteorological station was set up to determine wind speed and direction, barometric pressure, relative humidity and air temperature. This station continued to operate continuously throughout the
P sampling period collecting data at 1 minute intervals using a data logger. However, upon review of the collected data it was determined that the wind speed and direction information was not collected correctly. The exact cause of the problem is not known but it was probably due to incorrectly configured equipment. The raw meteorological station data is available on a 1.44 MB diskette (comma delimited format). Appendix VI (page 58 of the appendices) lists the meteorological station data for barometric pressure, relative humidity and air temperature in 15 minute averages for the test period. Also included in Appendix VI is a table of wind direction and speed data taken at 1 hour intervals at the Gridley AIRS meteorological station which is located about 4 miles south of the application site. Figure 3 shows the location of the AIRS site relative to the application study site. ARB staff noted the degree of cloud cover, on the sample log sheet, whenever sample cartridges were changed. The skies were clear during the entire study period. In general, the winds were light (less than 7 mph) during the entire study.
B. Ambient Monitoring
Ambient monitoring took place during a six week period from August 12 to September 19, 1997. Four sampling sites were selected by ARB personnel from the areas of Monterey County where lettuce and celery farming is predominant and in relatively high population areas or in areas frequented by people. A background site was also chosen which was more remote from agricultural areas. Sites were selected with considerations for both accessibility and security of the sampling equipment. The five sites are listed in Table 3 and shown in Figure 1. Twenty-four hour (approximately) samples were taken Monday through Friday (4 samples/week) at a flow rate of 15 ~
-4-

Lpm. Twenty-four discreet sampling-days were monitored at each site (19 at the background site) for a total of 115 samples (plus 30 collocated samples, 4 trip blanks and 15 quality assurance spikes). Refer to Appendix V (page 48 of the appendices) for field sample log sheets.
Table 3. Ambient Sampling Sites
CAS North Monterey County High School (83 1) 633-5221 13990 Castroville Blvd. Castroville, CA 950 12
Don Pedroni, Principal
Range/Township/Section: R.2E/T.13S/S.28 (estimated)*
MON Monterey Bay Unified APCD, Ambient Air Monitoring Station 24580 Silver Cloud Court Monterey, CA 93940
(83 1) 647-94 11 Walt McDonald
Range/Township/Section: R. 1 E/T. 16S/S. 1 -NE l/4 (estimated)*
CHS Chualar School (83 1) 679-2504 24285 Lincoln St. Marco A. Sigala, Principal Chualar, CA 93925 Range/Township/Section: R.4E/T. 16S/S.3 (estimated)*
SUS Spreckles Union School (831) 455-1831 P.O. Box 7308 Carol Johnson, Principal Spreckles, CA 93962 Range/Township/Section: R.3E/T. 15S/S. 16 (estimated)*
GPS Gonzalez Police Station (83 1) 675-5000 109 4th St. Carlos Lopez Gonzalez, CA 93926 Range/Township/Section: R.SE/T.16S/S.29 (estimated)*
*USGS maps did not have R/T/S grids outlined in the monitoring site locations. Gridlines were extrapolated and R/T/S estimated.
The North Monterey County High School is in the small town of Castroville. There are agricultural fields approximately 1 to 2 miles in all directions from the school. The sampling unit was placed on the roof of a single story building at a height of approximately 15 feet. The sampling cartridges were positioned approximately 4 feet above the roof. Thus, air was sampled through the cartridges at a height of approximately 19 feet.
-5-

n The background monitoring was conducted at the Monterey Bay Unified APCD’s ambient air monitoring station in Monterey. The sampler was placed on a second story roof near other APCD monitoring equipment at a height of approximately 28 feet. The sampling cartridges were positioned approximately 4 feet above the roof. Thus, air was sampled through the cartridges at a height of approximately 32 feet.
The Chualar School is situated on the east side of the small town of Chualar. The school is surrounded by farmland, approximately 50 to 100 yards to the north, east and south and % mile to the west. The sampling unit was placed on the roof of a single story building at a height of approximately 14 feet. The sampling cartridges were positioned approximately 4 feet above the roof. Thus, air was sampled through the cartridges at a height of approximately 18 feet.
The Spreckles Union School is located in a residential area of Spreckles. Crops are grown at a distance of approximately 50 to 75 yards to the south and east and l/4 to L/2 mile to the north and west. The sampling unit was placed on the top of a single story building at a height of approximately 12 feet. The sampling cartridges were positioned approximately 4 feet above the roof. Thus, air was sampled through the cartridges at a height of approximately 16 feet.
The Gonzalez Police Station is in the small town of Gonzalez. There are crops grown approximately 314 of a mile to the north, east and south and approximately 2 miles to the west of the school. The sampling unit was placed on the roof of a single story building at a height of
r approximately 12 feet, The sampling cartridges were positioned approximately 4 feet above the roof. Thus, air was sampled through the cartridges at a height of approximately 16 feet.
IV. Analytical Methodologv
“The Standard Operating Procedures for Sampling and Analysis of Permethrin” are enclosed as Appendix III (page 10 of appendices). The procedures specify that the exposed XAD-4 resin tubes are stored in an ice chest on dry ice or in a freezer until desorbed with 75 mL of ethyl acetate. An aliquot is concentrated prior to injecting 3 UL on to a gas chromatograph equipped with a mass selective detector. Results areas of both cis and tram isomers are summed and reported as total permethrin.
V, Annlication and Ambient Results
Tables 4 and 7 present the results of application and ambient air monitoring for permethrin respectively. A summary of the application sample results is reported in Table 5. Laboratory results, in units of uglsample, equal to or above the limit of quantitation (LOQ) are reported to 2 significant figures. Air concentration results (in units of ug/m3 and pptv) are also reported to 2 significant figures. The equation used to convert permethrin air concentration from units of ug/m’ to volume/volume units at 1 atmosphere and 25 “C is:
-6-
pptv = (ug/m3) (1000)x (0.0820575 liter-atmmole-X)(298 “K) = (62.5) x (ug/m’) (1 atm)(391.29 gram/mole)
The TAL determined the minimum detection limit (0.10 t&sample) as 2 times the minimum concentration injected (25 pg/uL) times the minimum total volume (2.0 mL) times the dilution factor (one-half of the sample used). The limit of quantitation used for reporting results in this report is LOQ=3.3 x LOD, which is equal to 0.33 @sample. The air concentration, expressed in units of ug/m’ (or pptv), associated with the LOQ is dependent on the volume of air sampled which varies from sample to sample. For a 24-hour sampling period at 15 Lpm the air concentration would be 0.015 ug/m3 (0.96 pptv) as associated with the LOQ.
A. Application Monitoring Results
Since the wind speed and direction data are not available for the application site, the application sample results have not been summarized as associated with sampling period wind roses.
The results for all of the three application background samples collected were “detected”. Of the twenty-four application samples collected (spikes, blanks, collocated and background samples excluded) three were found to be above the LOQ of 0.33 ug/sample. The highest permethrin concentration, 0.57 us/m3 (35 pptv), was observed at the west sampling site during the 1st sampling period.
e Referring to the field log sheets (page 48 of the appendices), all of the samples were collected under clear sky conditions.
B. Ambient MonitorinP Results
Of the 115 ambient samples collected (spikes, blanks and collocated samples excluded), six were found to be “detected”. All of the remaining 109 samples were CLOD.
VI. Qualitv Assurance
Field quality control (QC) for the application monitoring included the following:
1) Four field spikes (same environmental and experimental conditions as those occurring at the time of ambient sampling) prepared by the Testing Section staff. The field spikes were obtained by sampling ambient air during the background sampling at 15 Lpm (collocated with a background sample);
2) four trip spikes; 3) replicate samples (collocated) collected at one of the four sampling sites; 4) a trip blank; and 5) background samples.
-7-
The DPR’s February 7, 1997 memo, “Monitoring Recommendation for Permethrin”, stated that “Field blank and field spike samples should be collected at the same environmental (temperature, humidity, exposure to sunlight) and experimental (similar air flow rates) conditions as those occurring at the time of sampling.” The background samples were collected at the same environmental and experimental conditions as those occurring at the time of sampling (except for total sample volume). However, no “field blanks” were collected. Collection of true field blanks would involve rather complicated procedures and is not practical under field conditions. The trip blank was collected at the time of the sampling but did not experience the same environmental and experimental conditions except for transport and storage.
Field QC for the ambient monitoring included the following:
1) Five field spikes (same environmental and experimental conditions as those occurring at the time of ambient sampling) prepared by the Testing Section staff; the field spikes were obtained by sampling ambient air at the background monitoring site for 24 hour periods at 15 Lpm (these field spikes should have been collocated with an ambient background sample);
2) five trip spikes; 3) replicate (collocated) samples taken for six dates at each sampling location; and 4) four trip blanks (see comment above regarding field blanks).
p The instrument dependent parameters (reproducibility, linearity and LOD) are discussed in the SOP (page 10 of the appendices) and in the analytical report (page 8 of the appendices). A chain of custody sheet accompanied all samples. Rotameters were calibrated before the monitoring using a calibrated digital bubblemeter. The rotameter calibrations were also checked at the end of the study and were found to be unchanged.
VII. Quality Assurance Results
A. Method Development
Refer to Appendix I (page 10 of the appendices), “Standard Operating Procedure for the Sampling and Analysis of Permethrin”, for discussion and results of method development studies. Freezer stability studies showed that there was no loss of permethrin over a 64 day storage period. The TAL report does not list the specific sample analysis dates. However, the samples were normally extracted and analyzed immediately upon receipt and no samples were stored more than the documented storage period.
B. Trip Blanks
The application and ambient trip blank results were all less than the LOD of 0.10 uglsample for permethrin.
-8-
f? C. &&cation Backuround Samnle Resultq
Permethrin was “detected” in all of the three application background samples.
D. Collocated Sample Results
The results of application collocated samples are .listed in Table 6. The relative difference (RD = difference/average x 100) is listed. There are no established acceptance criteria for collocated samples for this program. Generally though, relative difference results of up to 40% (i.e., the average f 20%) are reasonable.
For the application study, six pairs of collocated samples were collected. Five of the pairs had “detected” results. The remaining pair had one result above the LOQ and the other result was “detected.”
For the ambient study, thirty pairs of collocated samples were collected. None of the pairs had results above the LOD.
E. Laboratory Spikes
Laboratory spikes are prepared at the same time and at the same level as the trip spike and field spike sets. The laboratory spikes are kept in a freezer until extraction and analysis. The extraction and analysis of laboratory, trip and field spikes normally occurs at the same time. Laboratory spikes were prepared by Testing Section staff.
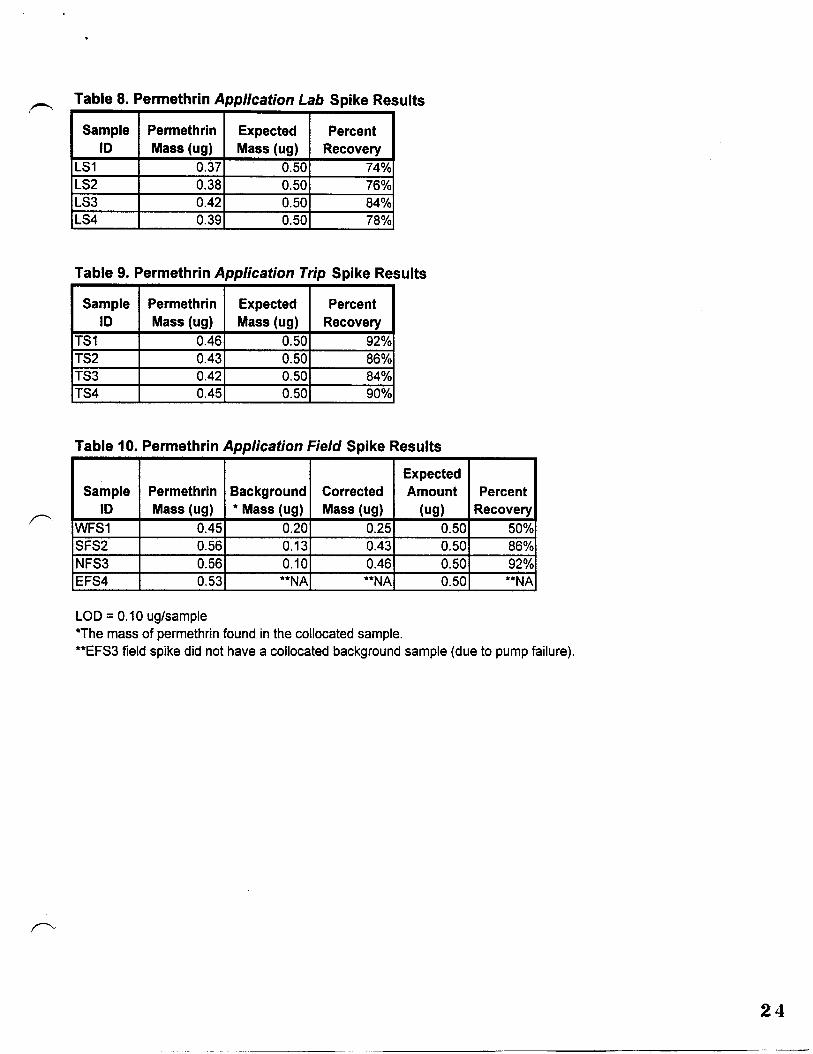
The laboratory spike results for the application and ambient studies are listed in Tables 8 and 11 respectively. Each of the nine spike sampling cartridges was spiked with 0.50 ug of permethrin. The average recoveries for the application lab spikes was 78% and for the ambient lab spikes was 92%.
F. Trip Spikes
Trip spikes are prepared at the same time and at the same level as the laboratory spike and field spike sets. The trip spikes are kept in a freezer until transported to the field. The trip spike samples are kept on dry ice in an ice chest (the same one used for samples) during transport to and from the field and at all times while in the field except for trip spike sample log-in and labeling. Trip spikes were prepared by Testing Section staff.
The trip spike results for the application and ambient studies are listed in Tables 9 and 12 respectively. Each of the nine spike sampling cartridges was spiked with 0.50 ug of permethrin. The average recovery for the application trip spikes was 88%. The average recovery for the ambient trip spikes was 92%. These results are consistent with the lab spike results and indicate
-9-

r- that the sample transport, storage and analytical procedures used in this study produce acceptable results for permethrin.
G. Field Snikes
Field spikes are prepared at the same time and at the same level as the laboratory spike and trip spike sets. The field spikes are ,kept in a freezer until transported to the field. The field spike samples are kept on dry ice in an ice chest (the same one used for samples) during transport to and from the field and at all times while in the field except for the sampling period. Field spikes were collected at the same environmental and experimental conditions as those occurring at the time of ambient sampling. The field spikes were obtained by sampling ambient air through a previously spiked cartridge. The field spikes should have been collocated with an ambient or background sample. However, due to technician error no collocated background samples were collected for the ambient study. No collocated background was collected (due to pump failure) at the east site during the application study. The background level of permethrin is assumed to have been CLOD. Field spike sets for the application and ambient studies were prepared by Testing Section staff,
The field spike results for the application and ambient studies are listed in Tables 10 and 13 respectively. Each of the nine spike sampling cartridges was spiked with 0.50 ug of permethrin. The average recovery for the north, west and south site application field spikes was 76%. The
P average recovery for the ambient field spikes was 100%. These results are consistent with the lab and trip spike results and indicate that the sampling, sample transport, storage and analytical procedures used in this study produce acceptable results for permethrin.
-lO-

J ,’ -I FIGURE 1 PERMETHRIN AwBIENT MONITORING AREA ) :.~ -.-I.
v LaSegunda
De San Carlos
Scale I / -5 mi Ex Mission .
c -1 I I -121 13'05", 3624'cj ~-.~> ..--mm--...- . . . . --._.^^ (+881ea uung rreuswn mappmg 3.” Copyngnl1987. Chicago Map Corporation 8 TRIUS, In
w
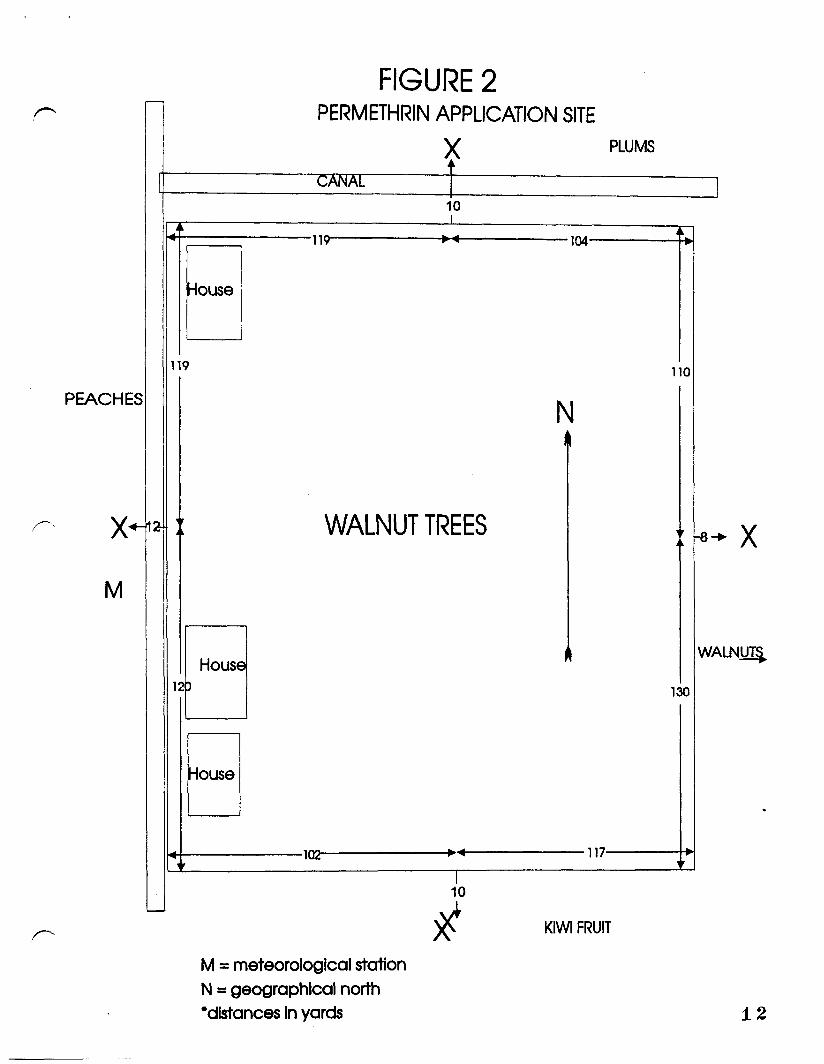
FIGURE 2 PERMETHRIN APPLICATION SITE
PEACHE!
t
CANAL
PLUMS
I 10 I
“II
119 104 c,
OUSB
I19
WALNUTTREES
1 House I I
10
Hous 1
1-m-117 L v
li0
>\c M = meteorological station N = geographical north *distances in yards
KIWI FRUIT
12

13
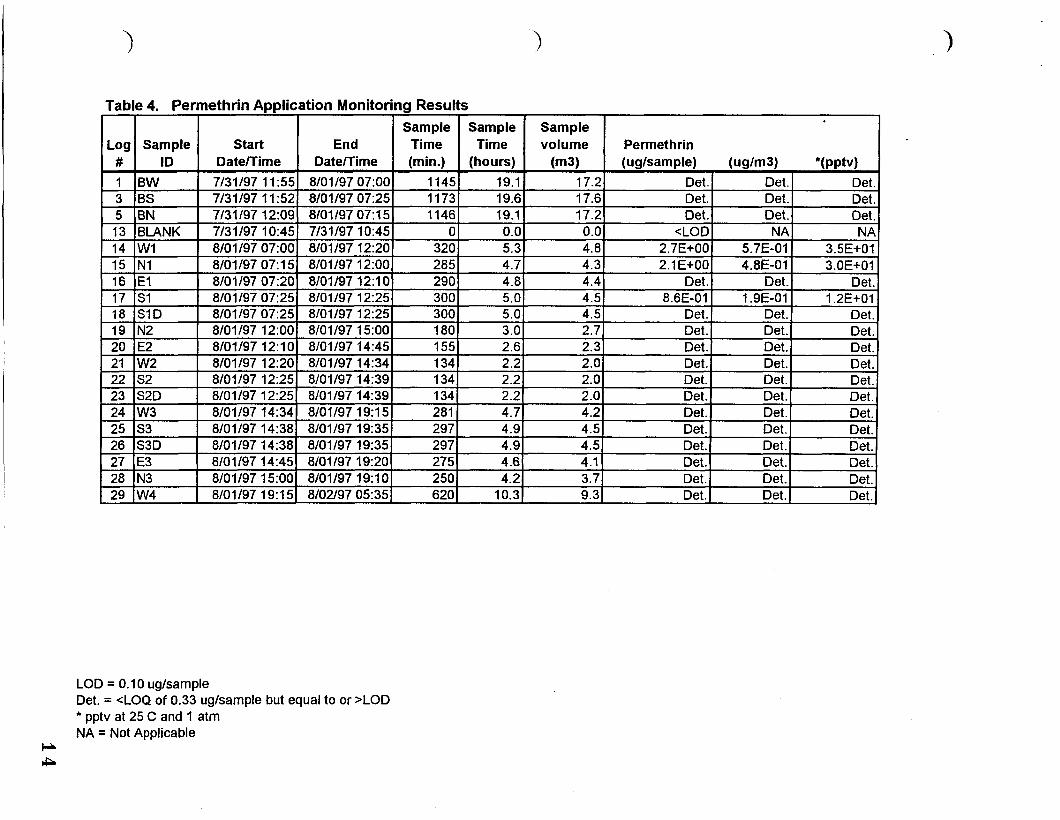
Table 4. Permethrin Application Monitoring Results Sample Sample Sample
,
Log Sample Start End Time Time volume Permethrin ID 1 Date/Time 1 Date/Time 1 (min.) 1 (hours) 1 OW 1 (uglsample) (w/m3) *(PPtv) 1
I,“,,“, I I.“” 8101197 07:OO 1145 19.1 17.2 Det. Det. Det. 7131197 1152 8/01/97 07:25 1173 19.6 17.6 Det. Det. Det.
orn.4
’ lo:451 7/31/97 lo:451 0.01 0.01 CLODI NAI NAI
22 Is2 1 8/01/! ^A aI ID I 23 IW
“I” ,,a, ‘f.‘J,
;:o”
“Cl. UGl. UtZl.
Det. Det. Det. 37 12:251 8/01/97 14:391 1341 2.2 2.0 Det. Det. Det.
1 8/01/97 12:251 8/01/97 14:391 1341 2.2 2.0 Det. Det. Det.
LVJ, -r.d L. J.“LT” I
4.4 Det. Det. Det. 37 07:251 8/01/97 12:251 3001 5.0 4.5 8.6E-01 1.9E-01 1.2E+Ol
11/97 07:251 8/01/97 12:251 3001 5.0 4.5 Det. Det. Det. 180) 2.7) Det.1 Det. 1 Det.(
24 IW3 1 8/01/97 14:34) 8lOll97 25 IS3 1 8/01/97 14:381
- ..-. i/01/97 19:15 281 4.7 19:35 297 4.9 .
4.2 4.5 Det. Det. Det. Det. Det. Det.
141381 8/01/97 19:35 297 4.9 4.5 Det. Det net 4n.3n 17E AC
26 S3D 8101197 ..-- -. - ..-_ 27 E3 8101197 14:45 Q’n”n7 28 N3 8/01/97 15:OO 8101197 19:lOl 250) 4.21 29 w4 8/01/97
..- 4.1 3.7
---. Det. Det. Det. [
- --. Det. Det. Det.
--_. Det. Det. Det. 19:151 8/02/97 05:351 6201 10.3) 9.31
LOD = 0.10 ug/sample Det. = <LOQ of 0.33 ug/sample but equal to or >LOD * pptv at 25 C and 1 atm NA = Not Applicable
c1 lb

Table 4. Permethrin AaDlication Monitorina Results Sample Sample Sample
Log Sample Start End Time Time volume Permethrin # ID Date/Time Date/Time (min.) (hours) OW (uglsample) (w/W *(PPtv)
30 s4 8101197 19:35 8102197 05:30 595 9.9 8.9 Det. I Det. I Det. 31 S4D 8101197 19:35 8102197 05:30 595 9.9 8.9 Det. 1 Det.1 Det. 32 E4 810119 33 N4 8/O
Det. I Det.1 Deq Det. I Det. 1 Det.1
1~6 i
1475 24.6 22.1 Det. Det. Det. 8103197 05:45 8104197 05:lO 1405 23.4 21.1 Det. Det. Det. 8103197 06:OO 8104197 05:05 1385 23.1 20.8 Det. Det. Det. 8103197 05:45 8104197 05:OO 1395 23.3 20.9 Det. Det. Det. 8103197 05:55 8104197 04:57 1382 23.0 20.7 Det. Det. Det.
13821 23.01 20.71 Det. I Det. I Det.
LOD = 0.10 uglsample Det. = cLOQ of 0.33 ughample but equal to or >LOD * pptv at 25 C and 1 atm NA = Not Applicable
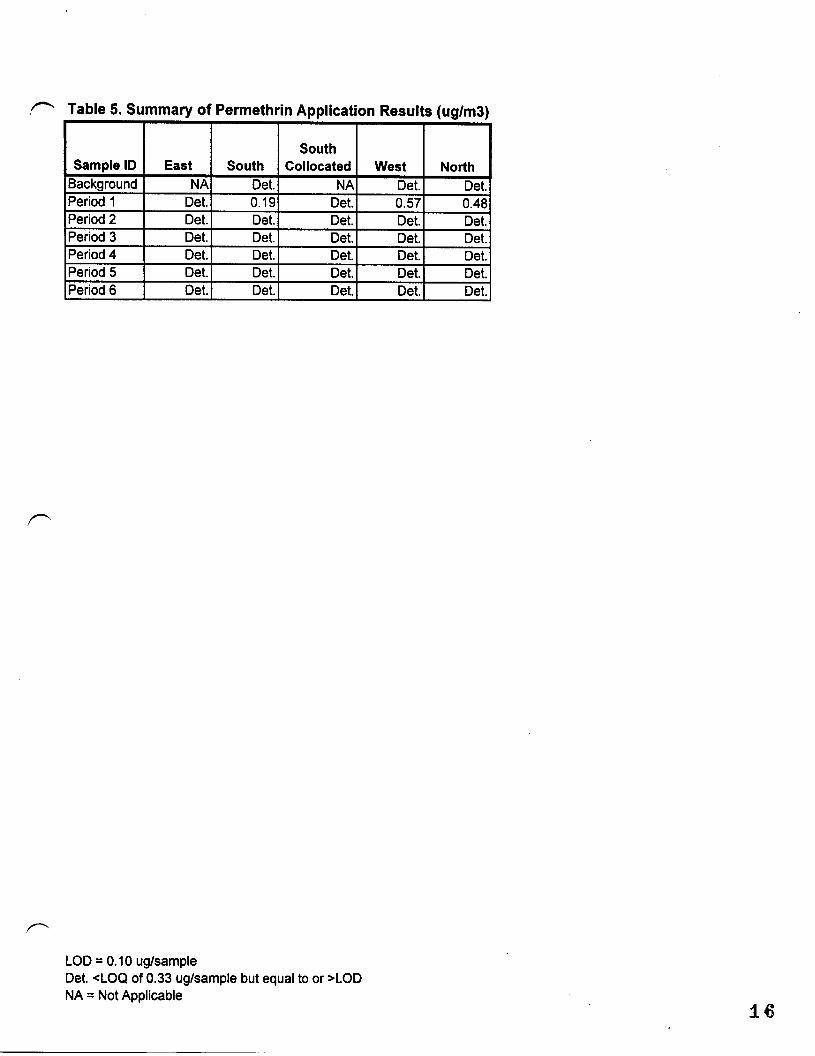
Table 5. Summary of Permethrin Application Results ~unlrn3~
I 1 South 1
Sample ID East South Collocated West North Background NA Det. NA Det. Det. Period 1 Det. 0.19 Det. 0.57 0.48 Period 2 Det. Det. Det. Det. Det. Period 3 Det. Det. Det. Det. Det. Period 4 Det. Det. Det. Det. Det. Period 5 Period 6
I Det. Det. Det. Det. Det. Det. Det. Det. Det. Det.
LOD = 0.10 ug/sample Det. <LOCI of 0.33 uglsample but equal to or >LOD NA = Not Applicable

Table 6. Permethrin Application Collocated Results
%RD = (Difference/Average)100
17
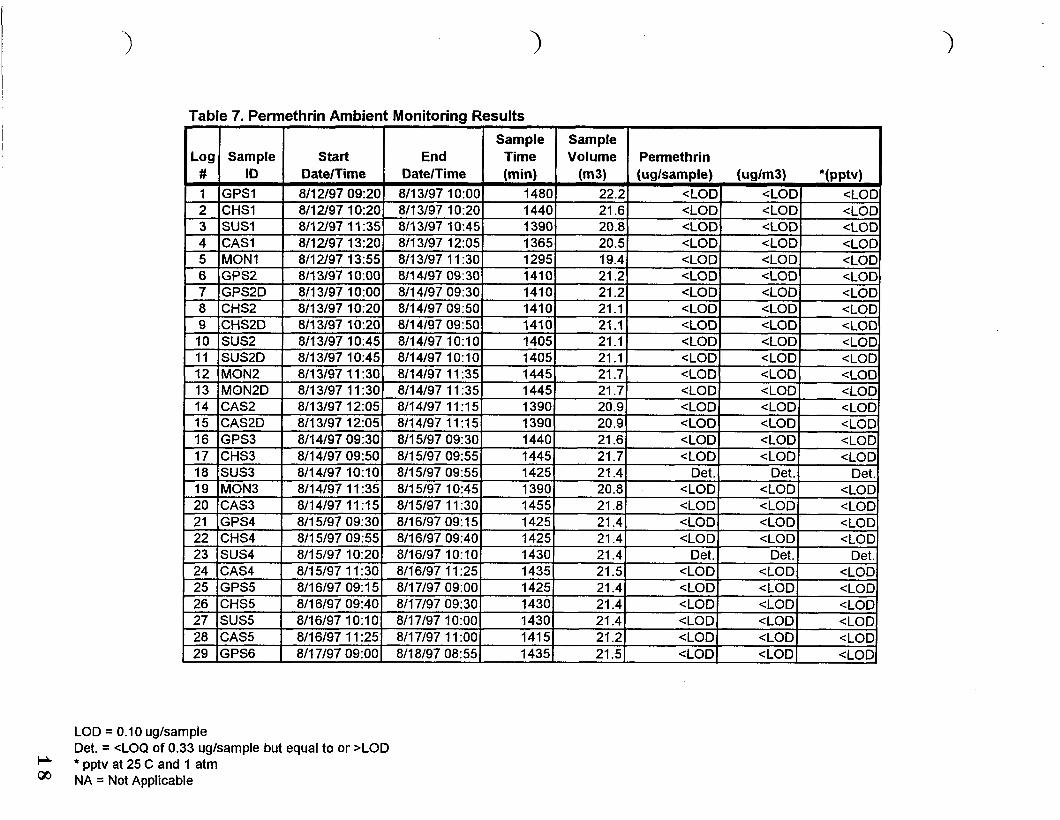
Table 7. Permethrin Ambient Monitoring Results
LOD = 0.10 uglsample Det. = <LOQ of 0.33 uglsample but equal to or >LOD
c1 03
* pptv at 25 C and 1 atm NA = Not Applicable

Table 7. Permethrin Ambient Monitorina Results
Sample Sample Log Sample Start End Time Volume Permethrin
# ID Date/Time Date/Time (min) (m3) lua/samPleI lualm3) *lDDtVj
14501 21.81 Det. 1 Det. I Det.1 . . . - - . - - ‘- 30 CHS6 8/l 7/97 09:30 8/l 8/97 09:20 14301 21.41 <LOD 1 <Lb01 ‘<LbD
31 SUS6 8/I 7197 10:00 8/I 8197 1O:i 0 32 CAS6 8/l 7197 11:00 8/I 8197 11:25 14651 22.01 CLODI CLOD] <LOD 33 GPS7 8/l 8197 08:55 8/l 9197 10:00 15051 22.61 Det. 1 Det. I 34 CHS7 8/l 8197 09:20 8/l
Det.j 9197 lo:25
35 sus7 8118197 IO:1 15051 22.61 <LODI <LODj CLOD
01 8/19/97 11:051 14951 22.41 Det. 1 Det.1 Det. 36 IMON7 1 8/l 8/97 1 1 :001 8/l 9/97 11:40) 14801 22.21 37 1CAS7
<LODJ <LODj <LODj 8/l 8/97 11:2 8/19/97 12:201 14951 22.4) CLOD CLOD CLOD
13751 20.61 CLODI <LODl <I on
t 45 IMON8D 1 8/19/97 11:401 8/20/97 lo:151 13551 I --- --- 20.31 CLOD] CLODI CLcm
46 ICAS~ 1 8/l 9/97 12:201 8/20/97 1l:OO 1 13601 20.41 CLOD1 <I onl cl nnl lCAS8D 1
1 --- --- -b-Y 47 8/l 9/97 12:20 8/20/97 1l:OO 1 13601 20.41 cLODI cLODI <LOD
;; FAY OIL3lY I I v;Lza OILOIYI I I;L3 13UUI LL.3) CLUUJ <LUlJ( CLOD 8125197 11:05 8126197 lo:30 14051 21.1) CLOD! CLODI CLOD
56 MONlO 8/25/97 11:35 8126197 10:00 13451 20.21 cLODI <LOD( CLOD 57 CASlO 8125197 12: 10 8126197 09:20 1270) 19.11 CLODI CLODI CLOD 58 CASIl 8126197 09:2( 31 8/27/97 08:50) 1410) 21.11 CLOD CLODI CLOD
LOD = 0.10 ug/sample + Det. = <LOQ of 0.33 uglsample but equal to or >LOD
W * pptv at 25 C and 1 atm NA = Not Applicable
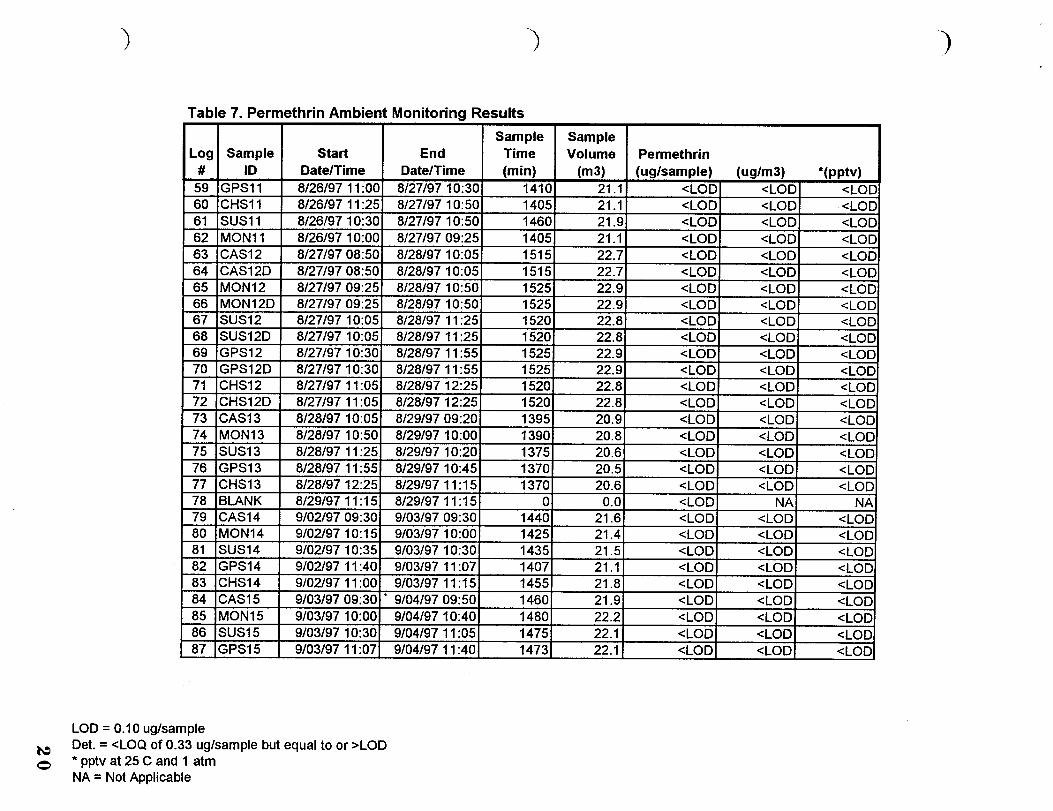
Table 7. Permethrin Ambient Monitorina Results
Sample Sample Log Sample Start End Time Volume Permethrin
# ID Date/Time Date/Time (min) (m3) (uglsample1 lualm31 *footvl I 59 GPSll 8126197 1l:OO 8127197 IO:30 1410 21.1 CLC 60 CHSll 8126197 II:25 61 SUSll 8/26/97 IO:30 62 MONll 8126197 IO:00 <
8128197 IO:05 1515 8128197 lo:50 1525 8128197 lo:50 1525 8128197 11125 1520 8128197 11125 1520
1 ---
69 1GPSl2 8/27/97 lo:301 8/28/97 11:551 15251 77 91 <I 0nl I <I nnl .d --- nn
1 84 1CASl5 9103197 09:301* 91041
LOD = 0.10 uglsample Det. = <LOQ of 0.33 uglsample but equal to or >LOD * pptv at 25 C and 1 atm NA = Not Applicable
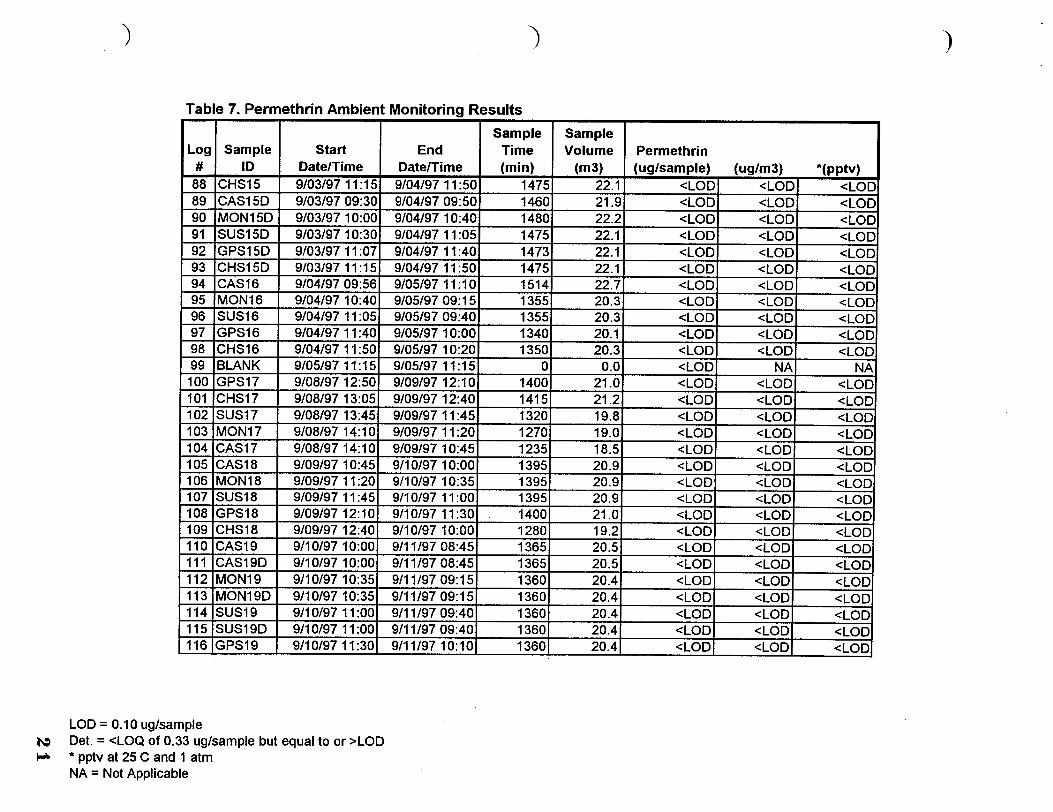
Table 7. Permethrin Ambient Monitoring Results
Sample Sample Log Sample Start End Time Volume Permethrin
LOD = 0.10 uglsample h3 Det. = <LOCI of 0.33 uglsample but equal to or >LOD c.r * pptv at 25 C and 1 atm
NA = Not Applicable
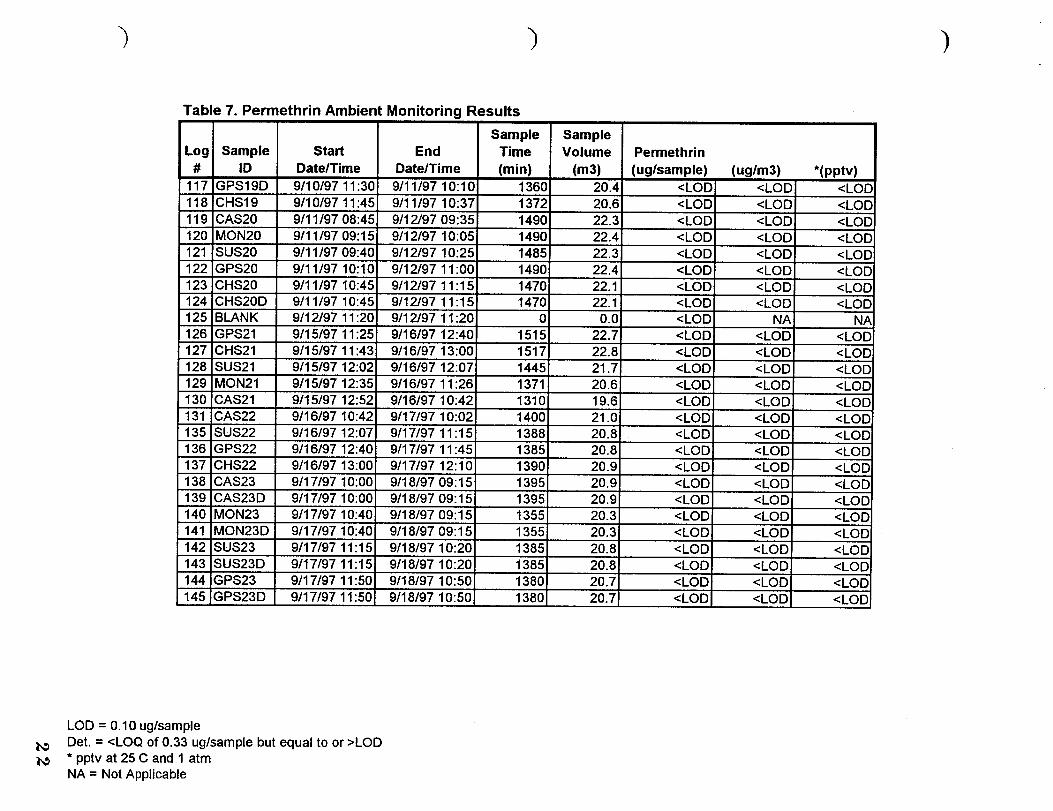
Table 7. Permethrin Ambient Monitorinca Results
LOD = 0.10 uglsample N Det. = <LOQ of 0.33 uglsample but equal to or >LOD N * pptv at 25 C and 1 atm
NA = Not Applicable

Table 7. Permethrin Ambient Monitoring Results
Sample Sample Log Sample Start End Time Volume Permethrin
LOD = 0.10 uglsample ae Det . CQ
= <LOCI of 0.33 ugkample but equal to or >LOD * pptv at 25 C and 1 atm NA = Not Applicable
~ Table 8. Permethrin Application La6 Spike Results
Sample Permethrin Expected Percent ID Mass (ug) Mass (ug) Recovery
LSI 0.37 0.50 74% LS2 0.38 0.50 76% LS3 0.42 0.50 84% LS4 0.39 0.50 78%
Table 9. Permethrin Application Trip Spike Results
Sample Permethrin Expected Percent ID Mass (ug) Mass (ug) Recovery
TSl 0.46 0.50 92% TS2 0.43 0.50 86% TS3 0.42 0.50 84% TS4 0.45 0.50 90%
Table IO. Permethrin Application Field Spike Results
LOD = 0.10 ug/sample *The mass of permethrin found in the collocated sample. l *EFS3 field spike did not have a collocated background sample (due to pump failure).
24
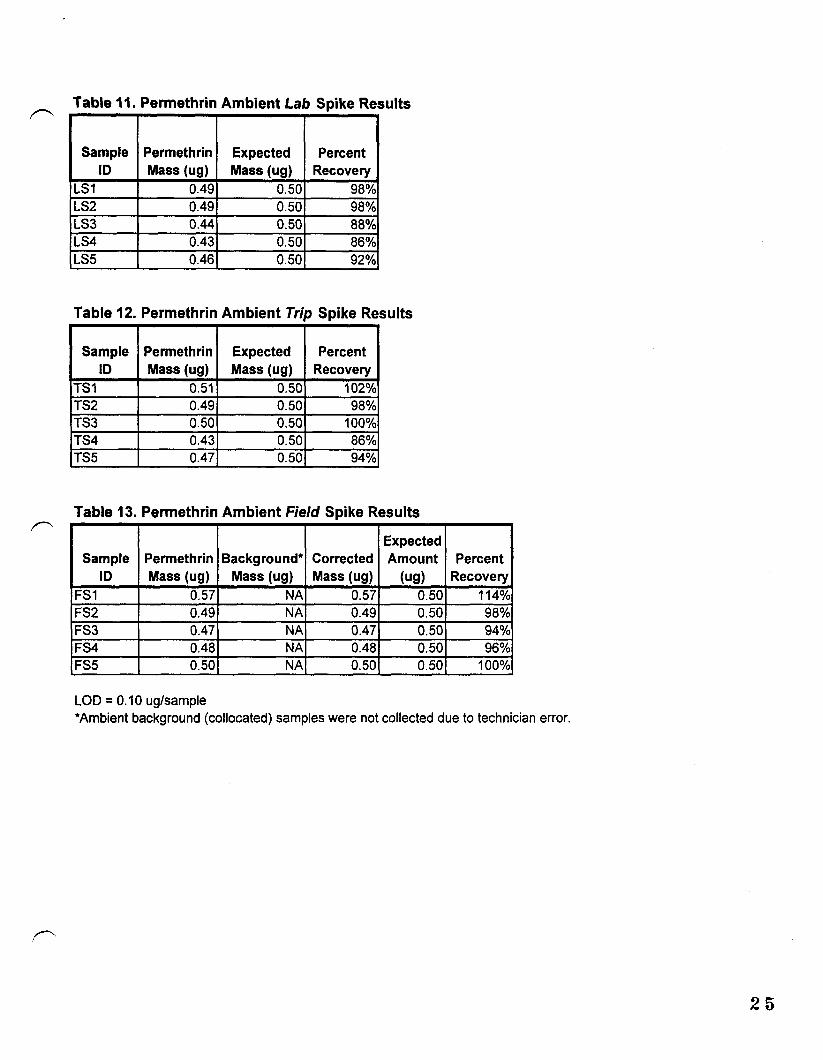
Table 11. Permethrin Ambient Lab Spike Results
Sample Permethrin Expected Percent ID Mass (ug) Mass (ug) Recovery
LSl 0.49 0.50 98% LS2 0.49 0.50 98% LS3 0.44 0.50 88% LS4 0.43 0.50 86% LS5 0.46 0.50 92%
Table 12. Permethrin Ambient Trip Spike Results
Table 13. Permethrin Ambient Field Spike Results /
Expected Sample Permethrin Background* Corrected Amount Percent
ID Mass (ug) Mass (ug) Mass (ug) Ml) Recovery FSI 0.57 NA 0.57 0.50 114% FS2 0.49 NA 0.49 0.50 98% FS3 0.47 NA 0.47 0.50 94?4 FS4 0.48 NA 0.48 0.50 96% FS5 0.50 NA 0.50 0.50 100%
LOD = 0.10 ug/sample *Ambient background (collocated) samples were not collected due to techn cian error.
25