Air Quality Annual Report 2020 - michigan.gov
112
AIR QUALIT Y ANNUAL REPORT 2020 Michigan Department of Environment, Great Lakes, and Energy Michigan.gov/EGLE | 800-662-9278
Transcript of Air Quality Annual Report 2020 - michigan.gov

AIR QUALIT Y ANNUAL REPORT
2020
Michigan Department of Environment, Great Lakes, and Energy Michigan.gov/EGLE | 800-662-9278

Air Quality Annual Report 2020 EXECUTIVE SUMMARY
This report gives an overview of the air quality for 2020. Current data for Michigan can be found on MIair (deqmiair.org) and Air Quality alerts can be delivered directly to email by signing up for the Michigan EnviroFlash program (http://miair.enviroflash.info/). Data in this report are collected by the Michigan Department of Environment, Great Lakes, and Energy (EGLE).
The federal Clean Air Act (CAA) requires the United States Environmental Protection Agency (USEPA) to establish National Ambient Air Quality Standards (NAAQS) for six criteria pollutants considered harmful to public health and the environment.
The six pollutants monitored by EGLE, Air Quality Division (AQD) are:
1. Carbon monoxide (CO)
2. Lead (Pb)
3. Nitrogen dioxide (NO2)
4. Ozone (O3)
5. Particulate matter smaller than 10 and 2.5 microns in diameter (PM10 and PM2.5, respectively)
6. Sulfur dioxide (SO2)
EGLE has established a network of more than 40 monitoring sites throughout the state that monitor for one or more of the criteria pollutants (Figure 1.1 and Table 1.2).
Congress passed the CAA in 1970; however, Michigan has had a long-standing history of environmental awareness well before the Act was established. In 1887, Detroit was the first city in Michigan to adopt an air quality ordinance, which declared that the dense smoke from burning coal was a public nuisance.
The USEPA reviews the criteria pollutant standards every five years. Over time, based upon health data, the standards have been tightened to better protect public health (see Appendix C). Areas that meet the NAAQS are considered in “attainment.” Locations where air pollution levels persistently exceed the NAAQS may be designated as “nonattainment.” The tightening standards are why some areas in the state may be designated to nonattainment from attainment even though monitoring shows that air quality continues to improve.

Air Quality Annual Report 2020
ii
Since EGLE began monitoring in the early 1970s, criteria pollutant levels have continually decreased (see Chap. 2-7). The air is much cleaner today than when the CAA began. The entire state of Michigan is in attainment for CO, Pb, NO2, and particulate matter. Although portions of the state are in nonattainment for SO2 and O3, as illustrated in the figure, levels of these pollutants are still decreasing. The NAAQS levels have also decreased recently, which prompted these nonattainment areas. EGLE is currently working on State Implementation Plans (SIPs) to reduce pollutants further and bring the entire state into attainment for SO2 and ozone.
Several changes to the monitoring network occurred during 2020.
• The TSPs were shut down at Allen Park andGrand Rapids since they were no longerrequired for NCore sites (Chap. 7).
• Several changes were made to the PM2.5 network, exchanging Federal Reference Method (FRM)manual filter-based monitors and/or non-regulatory continuous monitors for continuous, federalequivalent method (FEM) monitors due to funding changes. Sites that were affected were ElizaHowell-Near Road (Eliza Howell-NR), Bay City, Holland, Kalamazoo, Lansing, Port Huron, and NewHaven. Several of these changes occurred at the end of 2020 and data will not be available untilthe 2021 report (Chap. 7).
• PM2.5, PM10 and PM coarse measurements at Allen Park, Grand Rapids, and Jenison were switchedto T640X instruments that accomplish the same measurements with one instrument.
• The Livonia-Near Road (Livonia-NR) monitor is in the process of moving since site access was lost inJuly 2019.
• The NOx monitor at Detroit-E 7 Mile was switched to an NOy and a NOx monitor was added toJenison.
• Sampling continues for the Gordie Howe International Bridge (GHIB) project special study.
• The Detroit-W. Fort St. site name is being changed to Detroit-Southwest (Detroit-SW).
Attainment Status for the National Ambient Air Quality Standards

Air Quality Annual Report 2020
iii
TABLE OF CONTENTS
INTRODUCTION .................................................................................................................................................1
CHAPTER 1: BACKGROUND INFORMATION ......................................................................................................2 National Ambient Air Quality Standards (NAAQS) ..........................................................................................2 Michigan Air Sampling Network .....................................................................................................................3 Current Attainment Status ..............................................................................................................................8 MIair – Air Quality Information in Real-Time..................................................................................................9 Air Quality Index..............................................................................................................................................9 Air Quality Forecasts .....................................................................................................................................11 Air Quality Notification .................................................................................................................................13 AIRNow..........................................................................................................................................................13
CHAPTER 2: CARBON MONOXIDE (CO) ..........................................................................................................14
CHAPTER 3: LEAD (PB) ....................................................................................................................................18
CHAPTER 4: NITROGEN DIOXIDE (NO2) ..........................................................................................................23
CHAPTER 5: SULFUR DIOXIDE (SO2)................................................................................................................28
CHAPTER 6: OZONE (O3) .................................................................................................................................34
CHAPTER 7: PARTICULATE MATTER (PM10, PM10-2.5, PM2.5, PM2.5 .................................................................44
CHEMICAL SPECIATION AND TSP) ...................................................................................................................44 PM10 ..............................................................................................................................................................46 PM10-2.5 ..........................................................................................................................................................50 PM2.5 .............................................................................................................................................................50
CHAPTER 8: TOXIC AIR POLLUTANTS ..............................................................................................................60 National Monitoring Efforts and Data Analysis ............................................................................................62
CHAPTER 9: METEOROLOGICAL INFORMATION.............................................................................................64
CHAPTER 10: SPECIAL PROJECTS ....................................................................................................................65
APPENDIX A: CRITERIA POLLUTANT SUMMARY FOR 2020 ............................................................................ A1
APPENDIX B: 2020 AIR TOXICS MONITORING SUMMARY FOR METALS, VOCS, CARBONYL COMPOUNDS, PAHS, HEXAVALENT CHROMIUM & SPECIATED PM2.5 ................................................................................... B1
APPENDIX C - SUMMARY ................................................................................................................................ C1 National Ambient Air Quality Standards (NAAQS) ....................................................................................... C1 Types of Monitors ........................................................................................................................................ C4 Quality Assurance ........................................................................................................................................ C5 Historical NAAQS Changes ........................................................................................................................... C6
APPENDIX D: ACRONYMS AND THEIR DEFINITIONS ...................................................................................... D1
ACKNOWLEDGMENTS

Air Quality Annual Report 2020
1
INTRODUCTION
Air quality regulations in Michigan are based on National Ambient Air Quality Standards (NAAQS) established by United States Environmental Protection Agency (USEPA) based on the federal Clean Air Act (CAA). The NAAQS designates six criteria pollutants considered harmful to public health and the environment. The USEPA must describe the characteristics and potential health and welfare effects for these criteria pollutants. These standards define the maximum permissible concentration of criteria pollutants in the air (see Table 1.1).
The Michigan Department of Environment, Great Lakes, and Energy (EGLE), Air Quality Division (AQD) monitors the six criteria pollutants, which are:
• Carbon monoxide (CO);
• Lead (Pb);
• Nitrogen dioxide (NO2);
• Ozone (O3);
• Particulate matter smaller than 10 and 2.5 microns in diameter (PM10 and PM2.5, respectively); and
• Sulfur dioxide (SO2).
Chapters 2 through 7 provide information on each of the six criteria pollutants and include:
• Michigan’s monitoring requirements for 2020;
• Attainment / nonattainment status;
• Monitoring site locations (tables and maps show all the monitors active in 2020); and
• Air quality trends from 2015-2020 broken down by location.1
The 2020 data for each criteria pollutant is available in Appendix A. COVID-19 did not impact air quality data collection in Michigan.
The AQD also monitors air toxics. Air toxics are other hazardous air pollutants that can affect human health and the environment.2 This data can be found in Appendix B.
The purpose of this report is to provide a snapshot of Michigan’s 2020 air quality data, air quality trends, overview of the monitoring network (available in much greater detail in the 2020 Network Review),3 air toxics monitoring program, and other AQD programs, such as MIair and the Emissions Inventory.4
1 Air quality trends are based on actual statewide monitored readings, which are also listed in the USEPA’s Air Quality Subsystem Quick Look Report Data at www3.epa.gov/airtrends/ . 2 An Overview of Michigan Air Toxic Rules is available on the AQD website at www.michigan.gov/air (select “Permits,” then “Toxics Laws and Rules.”) 3 Available online at Michigan's 2020 Ambient Air Monitoring Network Review 4 Online information about criteria pollutants and air toxics, along with this and previous Annual Air Quality Reports, are available via the AQD’s website at www.michigan.gov/air (select “Monitoring.”)
https://www.michigan.gov/documents/egle/egle-aqd-amu-2020_air_monitoring_network_review_654930_7.pdf
https://www.michigan.gov/documents/egle/egle-aqd-amu-2020_air_monitoring_network_review_654930_7.pdf

Air Quality Annual Report 2020
2
CHAPTER 1: BACKGROUND INFORMATION This section summarizes the development of the NAAQS (see Appendix C for further details) and how compliance with these standards is determined. Also included is an overview of Michigan’s air sampling network, attainment status of the state, and information on MIair and the Air Quality Index (AQI).
National Ambient Air Quality Standards (NAAQS) Under the CAA, the USEPA established a primary and secondary NAAQS for each criteria pollutant. The primary standard is designed to protect public health with an adequate margin of safety, including the health of the most susceptible individuals in a population, such as children, the elderly, and those with chronic respiratory ailments. Secondary standards are chosen to protect public welfare (personal comfort and well-being) and the environment.
In addition, the NAAQS have various averaging times to address health impacts. Short averaging times reflect the potential for acute (immediate) effects, whereas long-term averaging times are designed to protect against chronic (long-term) effects.
NAAQS have been established for CO, Pb, NO2, PM, O3, and SO2. Table 1.1 lists the primary and secondary NAAQS, averaging time, and concentration level for each criteria pollutant in effect in 2020. The concentrations are listed as parts per million (ppm), micrograms per cubic meter (µg/m3), and/or milligrams per cubic meter (mg/m3).
Table 1.1: NAAQS in Effect during 2020 for Criteria Pollutants
Pollutant Primary (health) Level Primary Averaging Time
Secondary (welfare) Level
Secondary Averaging Time
CO 8-hour average
9 ppm (10 mg/m3)
8-hour average, not to be exceededmore than once per year (1971) None* None*
CO 1-hour average
35 ppm (40 mg/m3)
1-hour average, not to be exceededmore than once per year (1971) None* None*
Lead 0.15 µg/m3 Maximum rolling 3-month average (2008)
Same as Primary
Same as Primary
NO2 Annual mean
0.053 ppm (100 µg/m3) Annual mean (1971) Same as
Primary Same as Primary
NO2 1-hour average 0.100 ppm 98th percentile of 1-hour average,
averaged over 3 years (2010) Same as Annual
Same as Annual
PM10 150 µg/m3 24-hour average, not to be exceededmore than once per year over 3 years(1987)
Same as Primary
Same as Primary
PM2.5 Annual average 12.0 µg/m3 Annual mean averaged over 3 years
(2012) 15.0 µg/m3 Annual mean
PM2.5 24-hour average 35 µg/m3 98th percentile of 24-hour concentration,
averaged over 3 years (2006) Same as Primary
Same as Primary
Ozone 0.070 ppm Annual 4th highest 8-hour daily max averaged over 3 years (2015)
Same as Primary
Same as Primary
SO2 0.075 ppm 99th percentile of 1-hour daily max averaged over 3 years (2010) 0.5 ppm 3 hours
*In 1985, the USEPA revoked the secondary standard for CO (for public welfare) due to a lack of evidence of adverseeffects on public welfare at or near ambient concentrations.

Air Quality Annual Report 2020
3
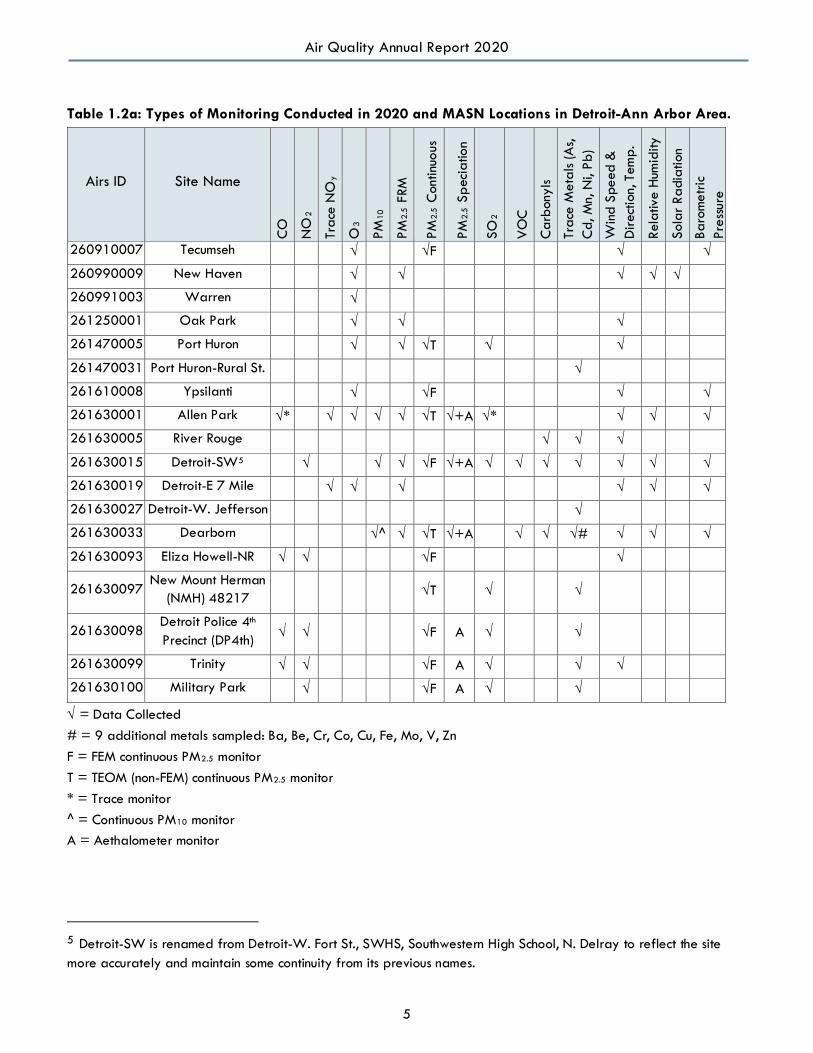
Michigan Air Sampling Network EGLE’s AQD operates the Michigan Air Sampling Network (MASN), along with other governmental agencies. For instance, the O3 and PM2.5 monitor in Manistee County is a tribal monitor operated by the Little River Band of Ottawa Indians. Figure 1.1 is a picture of the Lansing site. Figure 1.2 is a picture of the Military Park (GHIB) site. Figure 1.3 shows a map of the 2020 MASN monitoring sites.
The MASN consists of federal reference method (FRM) monitors that enable continuous monitoring for the gaseous pollutants CO, NO2, O3, and SO2 providing real-time hourly data. PM and Pb monitors measure concentrations over a 24-hour period. In addition, continuous PM2.5 and PM10 monitors provide real-time hourly data for PM. PM2.5 chemical speciation monitors determine the chemical composition of PM2.5. The MASN data is also used to provide timely reporting to EGLE’s air quality reporting web page (MIair, see later in this chapter). The types of monitoring conducted in 2020 and the MASN locations are shown in Table 1.2.
Figure 1.1: Lansing site Figure 1.2: Military Park site
The NCore network began January 1, 2011, as part of the USEPA’s 2006 amended air monitoring requirements. NCore is a multi-pollutant network that integrates several advance measurement systems for particles, pollutant gases, and meteorology. Michigan has two NCore sites, Allen Park and Grand Rapids. Further information on this network is provided in Chapters 2 through 7.
The Near-road Monitoring Network focuses on vehicle emissions and how they disperse near roadways. Data from these sites are presented in Chapters 2, 5, and 7.

Air Quality Annual Report 2020
4
Figure 1.3: 2020 MASN Monitoring Sites
Air Quality Annual Report 2020
5
Table 1.2a: Types of Monitoring Conducted in 2020 and MASN Locations in Detroit-Ann Arbor Area.
Airs ID Site Name
CO
NO
2
Trac
e N
Oy
O3
PM10
PM2.
5 F
RM
PM2.
5 C
ontin
uous
PM2.
5 S
peci
atio
n
SO2
VO
C
Car
bony
ls
Trac
e M
etal
s (A
s, C
d, M
n, N
i, Pb
)
Win
d Sp
eed
&
Dire
ctio
n, T
emp.
Rela
tive
Hum
idity
Sola
r Rad
iatio
n
Baro
met
ric
Pres
sure
260910007 Tecumseh √ √F √ √
260990009 New Haven √ √ √ √ √
260991003 Warren √
261250001 Oak Park √ √ √
261470005 Port Huron √ √ √T √ √
261470031 Port Huron-Rural St. √
261610008 Ypsilanti √ √F √ √
261630001 Allen Park √* √ √ √ √ √T √+A √* √ √ √
261630005 River Rouge √ √ √
261630015 Detroit-SW5 √ √ √ √F √+A √ √ √ √ √ √ √
261630019 Detroit-E 7 Mile √ √ √ √ √ √
261630027 Detroit-W. Jefferson √
261630033 Dearborn √^ √ √T √+A √ √ √# √ √ √
261630093 Eliza Howell-NR √ √ √F √
261630097 New Mount Herman
(NMH) 48217 √T √ √
261630098 Detroit Police 4th Precinct (DP4th) √ √ √F A √ √
261630099 Trinity √ √ √F A √ √ √
261630100 Military Park √ √F A √ √
√ = Data Collected # = 9 additional metals sampled: Ba, Be, Cr, Co, Cu, Fe, Mo, V, Zn F = FEM continuous PM2.5 monitor T = TEOM (non-FEM) continuous PM2.5 monitor * = Trace monitor ^ = Continuous PM10 monitor A = Aethalometer monitor
5 Detroit-SW is renamed from Detroit-W. Fort St., SWHS, Southwestern High School, N. Delray to reflect the site more accurately and maintain some continuity from its previous names.

Air Quality Annual Report 2020
6
Table 1.2b: Types of Monitoring Conducted in 2020 and MASN Locations in other Michigan CSAs.
Area (CSA)
Airs ID Site Name
CO
NO
2
Trac
e N
Oy
O3
PM10
PM2.
5 F
RM
PM2.
5 C
ontin
uous
PM2.
5 S
peci
atio
n
SO2
VO
C
Car
bony
ls
Trac
e M
etal
s (A
s, C
d, M
n, N
i, Pb
)
Win
d Sp
eed
&
Dire
ctio
n, T
emp.
Rela
tive
Hum
idity
Sola
r Rad
iatio
n
Baro
met
ric
Pres
sure
Flint 260490021 Flint √ √ √F √ √ Flint 260492001 Otisville √ √
Grand Rapids 261390005 Jenison √ √ √ √ √ Grand Rapids 261390011 West Olive √ √ Grand Rapids 260810020 Grand Rapids √* √ √ √ √ √T √ √* √ √ Grand Rapids 260810022 Evans √ √
Lansing/E. Lansing
260650018 Lansing √ √ √ √F √ √ √
Lansing/E. Lansing
260370002 Rose Lake √
√ = Data Collected F = FEM continuous PM2.5 monitor T = TEOM (non-FEM) continuous PM2.5 monitor * = Trace monitor

Air Quality Annual Report 2020
7
Table 1.2c: Types of Monitoring Conducted in 2020 and MASN Locations in Michigan Counties.
County Airs ID Site Name
CO
NO
2
Trac
e N
Oy
O3
PM10
PM2.
5 F
RM
PM2.
5 C
ontin
uous
PM2.
5 S
peci
atio
n
SO2
VO
C
Car
bony
ls
Trac
e M
etal
s (A
s, C
d, M
n, N
i, Pb
)
Win
d Sp
eed
&
Dire
ctio
n, T
emp.
Rela
tive
Hum
idity
Sola
r Rad
iatio
n
Baro
met
ric
Pres
sure
Monroe 261150006 Sterling State
Park √ √
Huron 260630007 Harbor Beach √ √
Bay 260170014 Bay City √F √
Missaukee 261130001 Houghton
Lake √ √ √F √ √
Allegan 260050003 Holland √ √F √ √ √ √
Benzie 260190003 Frankfort6 √
Berrien 260210014 Coloma √ √
Cass 260270003 Cassopolis √ √
Kalamazoo 260770008 Kalamazoo √ √ √T √
Manistee 261010922 Manistee (tribal) √ √ √ √ √
Mason 261050007 Scottville √ √
Muskegon 261210039 Muskegon √ √
Schoolcraft 261530001 Seney √ √F √ √ √ √
Ionia 260670002 Belding-Reed
St. √
Ionia 260670003 Belding-
Merrick St. √
√ = Data Collected F = FEM continuous PM2.5 monitor T = TEOM (non-FEM) continuous PM2.5 monitor
6 Also called Benzonia.

Air Quality Annual Report 2020
8
Current Attainment Sta tus Areas of the state that are below the NAAQS concentration level are called attainment areas. The entire state of Michigan is in attainment for the following pollutants:
• CO
• Pb
• NO2
• Particulate Matter
Nonattainment areas are those that have been classified by the USEPA as having concentrations over the NAAQS level. Portions of the state are in nonattainment for SO2 and O3 (see Figure 1.4). The SO2 nonattainment area includes a portion of Wayne County and a portion of St. Clair County. Ozone nonattainment areas include a portion of Allegan County, all of Berrien County, a portion of Muskegon County and the 7-county area of Southeast Michigan, which includes Livingston, Macomb, Monroe, Oakland, St. Clair, Washtenaw, and Wayne Counties. Nonattainment status for O3 was effective on August 3, 2019.
Figure 1.4: Attainment Status for the National Ambient Air Quality Standards

Air Quality Annual Report 2020
9
MIair – Air Quality Information in Real-Time MIair is the internet tool that provides real-time air quality information via EGLE’s web page. The deqmiair.org hotlink opens to the current Air Quality Index (AQI) map and displays air quality forecasts for “today” and “tomorrow.” MIair also hosts EnviroFlash, the automated air quality notification system.
Air Quality Index The Air Quality Index (AQI) is a simple tool developed to communicate current air quality information to the public. The current day’s color-coded AQI values, ranging from Good to Hazardous (see Table 1.3), are displayed in a forecast table and as dots on a Michigan map (see example below).
As can be seen from the AQI bar graphs for the Detroit-Warren-Dearborn area (Figure 1.5) and the Grand Rapids-Wyoming area (Figure 1.6), air quality in Michigan is generally in the Good or Moderate range. An area will occasionally fall into the Unhealthy for Sensitive Groups range, but rarely reaches Unhealthy levels.
In the Detroit area, only two days were in the Unhealthy range, both for PM2.5 on July 4 and 5, due to fireworks. In the Unhealthy for Sensitive Groups (USG), 15 days were due to ozone, five were due to PM2.5 and four were due to SO2. In Detroit area, PM2.5 leads the AQI 220 days, meaning that pollutant has the highest AQI value of all the pollutants measured per day.
In the Grand Rapids area, only one day was in the Unhealthy range, for PM2.5 on July 4, due to fireworks. In the Unhealthy for Sensitive Groups (USG), six days were due to ozone, one was due to PM2.5 (on July 5th). In Grand Rapids area, ozone leads the AQI 247 days, meaning that pollutant has the highest AQI value of all the pollutants measured per day.

Air Quality Annual Report 2020
10
Figure 1.5: 2020 AQI Days per Pollutant for Detroit-Warren-Dearborn MSA, numbers next to categories are for the Overall AQI Value (First Bar on Graph)
Figure 1.6: 2020 AQI Days Per Pollutant for Grand Rapids-Wyoming MSA, numbers next to categories are for the Overall AQI Value (First Bar on Graph)
MIair includes an “Air Quality Index Fact Sheet” link: michigan.gov/documents/deq/deq-aqd-aqifacts_273090_7.pdf, which contains activity recommendations based on the AQI levels (also Table 1.3).
0
50
100
150
200
250
300
350
OverallAQI Value
CO Ozone SO2 PM10 PM25 NO2
Num
ber o
f Day
s
Good-187 Moderate-153 USG-24 Unhealthy-2
0
50
100
150
200
250
300
350
OverallAQI Value
CO Ozone SO2 PM10 PM25 NO2
Num
ber o
f Day
s
Good-284 Moderate-73 USG-7 Unhealthy-1

Air Quality Annual Report 2020
11
Table 1.3: AQI Colors and Health Statements
AQI Color,
Category and Value
Particulate Matter (µg/m3) 24-hour
Ozone (ppm)
8-hour / 1-hour
Carbon Monoxide
(ppm) 8-hour
Sulfur Dioxide (ppm)
24-hour
Nitrogen Dioxide (ppm) 1-hour
GREEN: Good 1- 50
None None None None None
YELLOW: Moderate 51- 100
Unusually sensitive people should
consider reducing prolonged or heavy
exertion.
Unusually sensitive people should
consider reducing prolonged or heavy
exertion.
None None
Unusually sensitive people should
consider limiting prolonged outdoor
exertion
ORANGE: Unhealthy
for Sensitive Groups
101- 150
People with heart or lung disease,
children, teens, & older adults should
reduce prolonged or heavy exertion.
People with heart or lung disease, children, teens, & older adults, and people who are
active outdoors should reduce
prolonged or heavy exertion.
People with heart disease, such as angina, should reduce heavy
exertion & avoid sources of CO, such as heavy
traffic.
People with asthma should
consider reducing outdoor exertion.
People with lung disease, children, & older adults
should limit prolonged outdoor
exertion
RED: Unhealthy 151- 200
People with heart or lung disease,
children, teen, & older adults should avoid prolonged or
heavy exertion. Everyone should
reduce prolonged or heavy exertion.
People with heart or lung disease, children, teens & older adults, and people who are
active outdoors should avoid
prolonged or heavy exertion.
Everyone should reduce prolonged or
heavy exertion.
People with heart disease, such as angina, should
reduce moderate exertion & avoid sources of CO, such as heavy
traffic.
Children, asthmatics, & people with heart or lung
disease should reduce outdoor
exertion.
People with lung disease, children, & older adults should avoid
prolonged outdoor exertion.
Everyone should limit prolonged
outdoor exertion.
PURPLE:
Very Unhealthy 201- 300
People with heart or lung disease,
children, teens, & older adults should avoid all physical activity outdoors.
Everyone else should avoid prolonged or
heavy outdoor exertion.
People with heart or lung disease, children & older adults, and
people who are active outdoors should avoid all physical activity
outdoors. Everyone else should limit outdoor exertion.
People with heart disease, such as angina, should
avoid exertion & sources of CO, such as heavy
traffic.
Children, asthmatics, & people with heart or lung
disease should avoid outdoor
exertion. Everyone should reduce outdoor
exertion.
People with lung disease, children, & older adults
should avoid all outdoor exertion.
Everyone else should limit
prolonged outdoor exertion.
MAROON: Hazardous 301- 500
People with heart or lung disease,
children, teens, & older adults should
remain indoors. Everyone should
avoid all physical activity outdoors.
People with heart or lung disease, children,
and older adults should remain
indoors. Everyone should
avoid all physical activity outdoors.
People with heart disease, such as angina, should
avoid exertion & CO sources, such as heavy traffic. Everyone should
limit heavy exertion.
Children, asthmatics, & people with heart or lung
disease should remain indoors. Everyone should avoid outdoor
exertion.
Children and People with respiratory
disease, such as asthma, should avoid outdoor
exertion.

Air Quality Annual Report 2020
12
Air Quality Forecasts AQD meteorologists provide air pollution forecasts to alert the public when air pollution levels may become elevated. Action! Days are declared when levels are expected to reach or exceed the Unhealthy for Sensitive Groups AQI health indicator. On Action! Days, businesses, industry, government, and the public are encouraged to reduce air pollution levels by limiting vehicle use, refueling only after 6 PM, carpooling, walking, biking, or taking public transit, deferring the use of gasoline-powered lawn and recreation equipment, limiting the use of volatile chemicals, and curtailing all burning. More information on voluntary air pollution control measures can be found under the Action! Days tab on MIair.
The weather plays a significant role in air quality (see Chapter 9 for an annual weather summary) and can either help increase or decrease the amount of pollution in the air. High temperatures, sun, and longer days (i.e., more daylight hours) are conducive to ozone formation, whereas rain tends to wash pollutants out of the air. Action! Days are declared when meteorological conditions are conducive for the formation of elevated ground-level O3 or PM2.5 concentrations.
Table 1.4 shows that there were some Action! Days declared during the summer of 2020.
Table 1.4: Action! Days Declared During Summer 2020
Location Year Number Dates
Ann Arbor 2020 9 6/18, 6/19, 6/20, 7/5, 7/6, 7/7, 7/8, 7/9, 7/18
Benton Harbor 2020 10 6/18, 6/19, 6/20, 7/5, 7/6, 7/7, 7/8, 7/9, 7/18, 8/26
Detroit 2020 9 6/18, 6/19, 6/20, 7/5, 7/6, 7/7, 7/8, 7/9, 7/18
Flint 2020 2 6/19, 6/20
Grand Rapids 2020 10 6/18, 6/19, 6/20, 7/5, 7/6, 7/7, 7/8, 7/9, 7/18, 8/26
Kalamazoo 2020 2 6/19, 6/20
Ludington 2020 3 6/18, 6/19, 6/20
Traverse City 2020 2 6/19, 6/20

Air Quality Annual Report 2020
13
Air Quality Notifica tion EnviroFlash is a free service that provides automated air quality (AQI) and ultraviolet (UV) forecasts to subscribers. Those enrolled receive email or mobile phone text messages when the health level they select is predicted to occur. AIRNow iPhone and Android applications deliver ozone and fine particle air quality forecasts plus detailed real-time information that can be used to better protect health when planning daily activities. To learn more about this program, select the MIair button from Michigan’s Air Quality page Michigan.gov/air. To receive notices, choose the “Air Quality Notification” tab and click the “Enroll in AQI EnviroFlash” link. Michigan’s EnviroFlash network has the potential to reach up to 98 percent of the state’s population.
AIRNow EGLE supplies Michigan air monitoring data to AIRNow, the USEPA’s nationwide air quality mapping system. Information about AIRNow is available at AirNow.gov or you can select the AIRNow hot link at the bottom of each MIair web page.

Air Quality Annual Report 2020
14
CHAPTER 2: CARBON MONOXIDE (CO)
Carbon monoxide is a gas formed during incomplete burning of fuel. CO is colorless, odorless, and tasteless, and is lethal at elevated concentrations. Levels peak during colder months primarily due to cold temperatures that affect combustion efficiency of engines. The CO NAAQS is 9 ppm for the second highest 8-hour average and 35 ppm for the second highest 1-hour average. Its sources and effects are provided below.
Sources: CO is given off whenever fuel or other carbon-based materials are burned. Outdoor exposure sources include automobile exhaust, industrial processes (metal processing and chemical production), and non-vehicle fuel combustion. Natural sources include volcanos, forest fires, and photochemical reactions in the atmosphere. Indoor exposure sources include wood stoves and fireplaces, gas ranges with continuous pilot flame ignition, unvented gas or kerosene heaters, and cigarette smoke.
Effects: CO enters the bloodstream through the lungs, where it displaces oxygen delivered to the organs and tissues. Elevated levels can cause visual impairment, interfere with mental acuity by reducing learning ability and manual dexterity, and can decrease work performance in the completion of complex tasks. In extreme cases, unconsciousness and death can occur. CO also alters atmospheric photochemistry contributing to the formation of ground-level O3, which can trigger serious respiratory problems.
Population most at risk: Those who suffer from cardiovascular (heart and respiratory) disease, fetuses, infants, and the elderly are most at risk for exposure to elevated levels of CO. People with angina and peripheral vascular disease are especially at risk, as their circulatory systems are already compromised and less efficient at carrying oxygen; however, elevated CO levels can also affect healthy people.
Historical Trends: Southeast Michigan has been monitoring CO for 45 years. Figure 2.1 shows the CO trend at Allen Park to be well below the 1-hour standard of 35 ppm. This standard has not changed since 1971.
Figure 2.1: Historical 1-hour CO Averages at Allen Park
0
5
10
15
20
25
30
35
40
Carb
on M
onox
ide
Conc
entr
atio
n pp
m
Year
Allen Park CONAAQS Standard
NAAQS
Air Quality Annual Report 2020
15
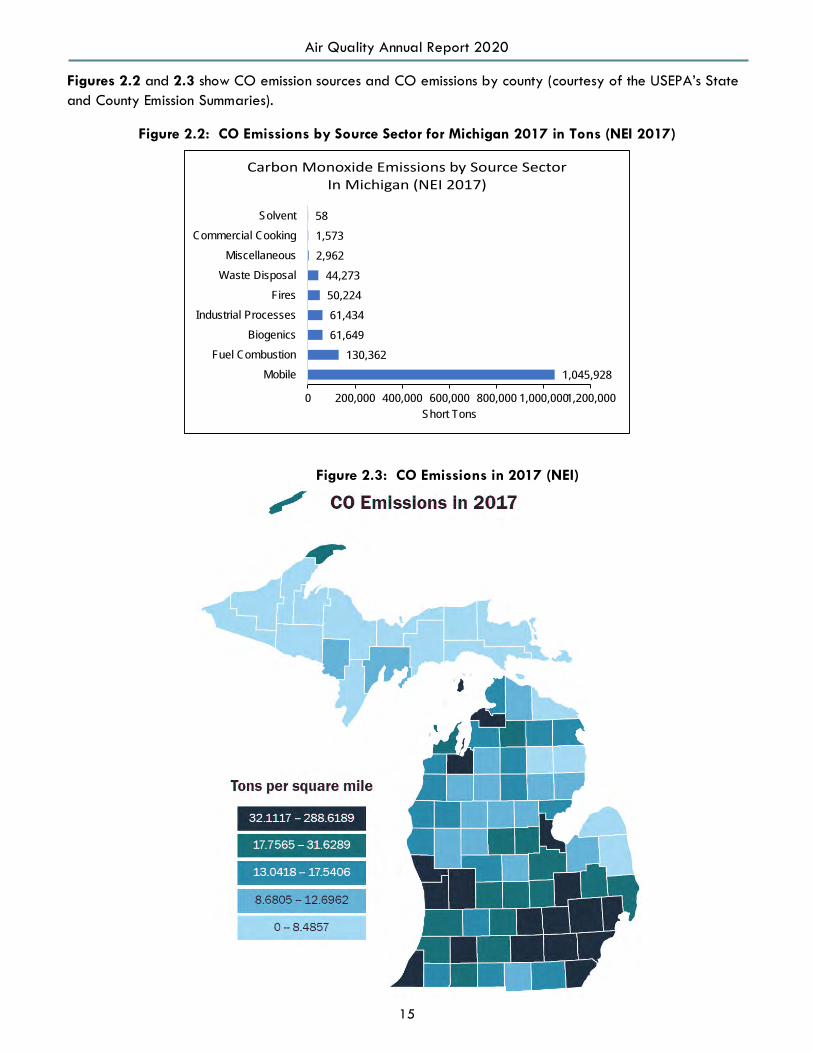
Figures 2.2 and 2.3 show CO emission sources and CO emissions by county (courtesy of the USEPA’s State and County Emission Summaries).
Figure 2.2: CO Emissions by Source Sector for Michigan 2017 in Tons (NEI 2017)
1,045,928
130,362
61,649
61,434
50,224
44,273
2,962
1,573
58
0 200,000 400,000 600,000 800,000 1,000,0001,200,000
Mobile
Fuel Combustion
Biogenics
Industrial Processes
Fires
Waste Disposal
Miscellaneous
Commercial Cooking
Solvent
Short Tons
Carbon Monoxide Emissions by Source SectorIn Michigan (NEI 2017)
Figure 2.3: CO Emissions in 2017 (NEI)

Air Quality Annual Report 2020
16
Figure 2.4 shows the location of each CO monitor that operated in 2020.
• Near-roadway network sites: Eliza Howell-NR.
• NCore Network: Grand Rapids and Allen Park measure trace CO (lower detection levels 1-50 ppm).
• GHIB project: DP4th and Trinity, started summer and fall 2018, respectively.
Figure 2.4: CO Monitors in 2020

Air Quality Annual Report 2020
17
Figure 2.5 shows the second highest 1-hour CO concentrations for Michigan from 2015-2020, which demonstrates there have not been any exceedances of the 1-hour CO NAAQS.
Figure 2.5: CO Levels in Michigan from 2015-2020 (2nd Highest 1-Hour Maximum Values)
Figure 2.6 shows the AQI values per day in counties where CO is monitored. All days were in the good AQI range.
Figure 2.6: 2020 AQI Days for CO in Michigan Counties
0
5
10
15
20
2015 2016 2017 2018 2019 2020
CON
CEN
TRAT
ION
= p
pm
YEAR
Grand RapidsAllen ParkEliza Howell-NREliza Howell-DWLivonia NRDP4thTrinity
35 NAAQS
050
100150200250300350400
Kent Wayne
Num
ber o
f Day
s
Good Moderate USG Unhealthy

Air Quality Annual Report 2020
18
CHAPTER 3: LEAD (PB)
Lead is a highly toxic metal found in coal, oil, and other fuels. It is also found in older paints, municipal solid waste, and sewage sludge, and may be released to the atmosphere during combustion. In 2008, the USEPA lowered the Pb NAAQS from a maximum quarterly average of 1.5 µg/m3 to a 3-month rolling average of 0.15 µg/m3. Its sources and effects are presented below.
Sources: With the phase-out of leaded gas in the 1970s, the major sources of Pb emissions have been due to ore and metals processing and piston-engine aircraft operating on leaded aviation fuel. Other industrial sources include Pb acid battery manufacturers, waste incinerators, and utilities. The highest air concentrations of Pb are usually found near lead smelters.
Effects: Exposure occurs through the inhalation or ingestion of Pb in food, water, soil, or dust particles. Pb primarily accumulates in the body’s blood, bones, and soft tissues, and adversely affects the nervous system as well as the cardiovascular system, reproductive system, blood, kidneys, and other organs.
Population most at risk: Fetuses and children are most at risk since low levels of Pb may cause central nervous system damage. Excessive Pb exposure during the early years of life is associated with lower IQ scores and neurological impairment (seizures, mental development, and behavioral disorders). Even at low doses, lead exposure is associated with changes in fundamental enzymatic, metabolic, and homeostatic mechanisms in the body, and Pb may be a factor in high blood pressure and subsequent heart disease.
Historical Trends: Southeast Michigan has been monitoring for lead for 40 years. Figure 3.1 shows the trend for lead at Dearborn. The largest decrease in Pb in the air is due to the removal of Pb in gasoline. By 1975, most newly manufactured vehicles no longer required leaded gasoline, and as a result, there was a dramatic decrease in ambient Pb levels. In 1996, the USEPA banned the sale of leaded fuel for use in on-road vehicles. The graph also shows the decrease in the Pb standard that occurred in 2008.

Air Quality Annual Report 2020
19
Figure 3.1: Historical Quarterly / 3-month Averages for Lead at Dearborn
Figures 3.2 and 3.3 show Pb emission sources and Pb emissions by county (courtesy of the USEPA’s State and County Emission Summaries).
Figure 3.2: Pb Emissions by Source Sector
0
0.2
0.4
0.6
0.8
1
1.2
1.4
1.6Le
ad c
once
ntra
tion
ug/m
3
Year
Dearborn LeadNAAQS Standard
1978 NAAQS
2008 NAAQS

Air Quality Annual Report 2020
20
Figure 3.3: Pb Emissions in 2017 (NEI)
Figure 3.4 shows the location of the Pb monitors in the MASN in 2020. When the Pb NAAQS was lowered in 2008, the monitoring network was modified to consist of source-oriented monitors and population-oriented monitors. As part of the 2008 Pb NAAQS, EGLE must monitor near stationary sources emitting more than 1/2 ton of Pb per year.
• Source-oriented sites: Port Huron-Rural St. and Belding-Merrick St. The second site, Belding-Reed St.was shut down on January 1, 2019, since lead levels are below the standard and both sites are nolonger necessary. The two sites in Belding previously were above the standard, but values for boththe sites have been below the NAAQS for the past five years. Belding was designated toattainment on July 31, 2018.
• National Air Toxics Trend Sites (NATTS): Dearborn lead and trace metals, both as total suspendedparticulate (TSP) and PM10. Lead measurements as PM2.5 are also made throughout the PM2.5
speciation network.
• NCore sites: Allen Park and Grand Rapids.
• Network consistency: River Rouge, Detroit-W. Jefferson, NMH 48217, and Detroit-SW. On January1, 2018, lead sampling was started at all the TSP metals sites to maintain consistency and to bemore protective of public health. Many older homes, which often contain lead-based paint, arebeing demolished in the Detroit area near these monitors.

Air Quality Annual Report 2020
21
• Secondary monitor: Port Huron-Rural St. to comply with the USEPA’s collocation regulations.
• Gordie Howe International Bridge (GHIB) project: DP4th, Trinity, and Military Park.
Figure 3.4: Lead (Pb) Monitors in 2020

Air Quality Annual Report 2020
22
Figure 3.5 shows the maximum 3-month rolling average values for Pb from 2015 to 2020. All Pb monitor sites in Michigan are below the standard.
Figure 3.5: Lead Levels in Michigan from 2015-2020 (Maximum 3-month Average Values)
0
0.05
0.1
0.15
0.2
0.25
0.3
0.35
0.4
2015 2016 2017 2018 2019 2020
CONC
ENTR
ATIO
N =
ug/m
3
YEAR
Grand Rapids Belding-Merrick StBelding-Reed St NMH 48217Allen Park River RougeDetroit-SW Detroit -W. JeffersonDearborn Port Huron-Rural St.DP4th TrinityMilitary Park
NAAQS Level

Air Quality Annual Report 2020
23
CHAPTER 4: NITROGEN DIOXIDE (NO2)
Nitrogen dioxide is a reddish-brown, highly reactive gas formed through oxidation of nitric oxide (NO). Upon dilution, it becomes yellow or invisible. High concentrations produce a pungent odor and lower levels have an odor like bleach. NOX is the term used to describe the sum of NO, NO2, and other nitrogen oxides. NOX can lead to the formation of O3 and NO2 and can react with other substances in the atmosphere to form particulate matter or acidic products that are deposited in rain (acid rain), fog, or snow. Since 1971, the primary and secondary standard for NO2 was an annual mean of 0.053 ppm. In January 2010, the USEPA added a 1-hour NO2 standard of 100 ppb, taking the form of the 98th percentile averaged over three years. The sources and effects of NO2 are as follows:
Sources: NOX compounds and their transformed products occur both naturally and because of human activities. Natural sources of NOX are lightning, forest fires, bacterial processes in soil, and stratospheric intrusion. Stratospheric intrusion is when the air upper atmosphere (stratosphere) descends towards the surface of the earth and mixes with the air at breathing level. Ammonia and other nitrogen compounds produced naturally are important in the cycling of nitrogen through the ecosystem. The major sources of man-made (anthropogenic) NOx emissions come from high-temperature combustion processes such as those occurring in automobiles and power plants. Home heaters and gas stoves produce substantial amounts of NO2 in indoor settings.
Effects: Exposure to NO2 occurs through the respiratory system, irritating the lungs. Short-term NO2 exposures (i.e., less than three hours) can produce coughing and changes in airway responsiveness and lung function. Evidence suggests that long-term exposures to NO2 may lead to increased susceptibility to respiratory infection and may cause structural changes in the lungs. Exercise increases the ventilation rate and hence exposure to NO2. Nitrate particles and NO2 can block the transmission of light, resulting in visibility impairment (i.e., smog or haze). Nitrogen deposition can lead to fertilization, excessive nutrient enrichment, or acidification of terrestrial, wetland, and aquatic systems that can upset the delicate balance in those ecosystems.
Population most at risk: Individuals with pre-existing respiratory illnesses and asthmatics are more sensitive to the effects of NO2 than the general population. Short-term NO2 exposure can increase respiratory illnesses in children.
Historical Trends: Southeast Michigan has been monitoring for NO2 for 40 years. Figure 4.1 shows the trend for NO2 at Detroit-E 7 Mile Road, which has been well below the annual standard of 53 ppb and shows a downward trend. In 2010, the USEPA added a 1-hour standard for NO2, which has also remained well below the standard in Michigan. Southeast Michigan is highly industrialized; therefore, it is a good indicator of the air quality improvement for the rest of the state.

Air Quality Annual Report 2020
24
Figure 4.1: Historical Annual and 1-hour NO2 at Detroit-E 7 Mile Road
Figures 4.2 and 4.3 show NO2 emission sources and NO2 emissions by county (courtesy of the USEPA’s State and County Emission Summaries).
Figure 4.2: Nitrogen Oxide Emissions by Source Sector
0
20
40
60
80
100
120
0
10
20
30
40
50
60
1-Hr
NAA
QS
ppb
Annu
al N
AAQ
S pp
b
Year
E. 7 Mile NO2 Annual Annual NAAQS StandardE. 7 Mile NO2 1-Hr 1-Hr NAAQS StandardAnnual
NAAQS 2010 1-hr NAAQS
147,486
90,181
36,613
18,192
3,474
670
86
70
0 40,000 80,000 120,000 160,000
Mobile
Fuel Combustion
Industrial Processes
Biogenics
Waste Disposal
Fires
Solvent
Miscellaneous
Short Tons
Nitrogen Oxides Emissions by Source SectorIn Michigan (NEI 2017)

Air Quality Annual Report 2020
25
Figure 4.3: Nitrogen Oxide Emissions in 2017 (NEI)
Figure 4.4 shows the location of all NO2 monitors that operated in 2020.
• Downwind urban scale site: Detroit-E 7 Mile in Detroit and Jenison for the Grand Rapids area.
• Near-roadway Network sites: Detroit Eliza Howell-NR site, the downwind site was shut down sinceit is not necessary for the near-road network. The Livonia roadway site needed to be moved sinceEGLE lost site access. A suitable replacement has not been found.
• NCore sites: Grand Rapids and Allen Park, monitor NOY, which includes NOX, nitric acid, andorganic and inorganic nitrates (not used for attainment / nonattainment purposes).
• Photochemical Assessment Monitoring Station (PAMS) Network: The NOX monitor at Detroit-E 7Mile was switched to a NOY for PAMS. Direct NO2 will also be monitored at Detroit-E 7 Milewhen the PAMS network is completely installed at this site.
• Background monitors for modeling: Lansing and Houghton Lake.
• GBIH project: Detroit-SW, DP4th, Trinity, and Military Park.

Air Quality Annual Report 2020
26
Figure 4.4: Nitrogen Dioxide (NO2) / NOy Monitors in 2020

Air Quality Annual Report 2020
27
Michigan’s ambient NO2 levels have always been well below the NAAQS. Since March 3, 1978, all areas in Michigan have been in attainment for the annual NO2 NAAQS. As shown in Figure 4.5, all monitoring sites have had an annual NO2 concentration at less than half of the 0.053 ppm NAAQS.
Even though there are no nonattainment areas for NO2 in Michigan and monitoring for attainment purposes is not required, monitors continue to operate to support photochemical model validation work.
Figure 4.5: NO2 Levels in MI from 2015-2020 (Annual Arithmetic Mean)**
*Indicates site was moved in 2018 and concentrations were averaged together for both locations.**Since Allen Park and Grand Rapids are monitoring NOY, those sites are not included in graph.
Figure 4.6 shows the AQI values per day in counties where NO2 is monitored. All days were in the good AQI range except for four days in Wayne County that were in the moderate AQI range.
Figure 4.6: 2020 AQI Days for NO2 in Michigan Counties
0
10
20
30
40
50
60
2015 2016 2017 2018 2019 2020
CO
NC
ENTR
ATIO
N =
ppb
YEAR
Detroit-E. 7 Mile Lansing* Houghton Lake
Eliza Howell-NR Eliza Howell-DW Livonia-RW
Detroit-SW DP4th Trinity
Military Park
NAAQS Level
050
100150200250300350400
Ingham Missaukee Ottawa Wayne
Num
ber o
f Day
s
Good Moderate USG Unhealthy

Air Quality Annual Report 2020
28
Sulfur dioxide is a gas formed by the burning of sulfur-containing material. Odorless at typical ambient concentrations, SO2 can react with other atmospheric chemicals to form sulfuric acid. At higher concentrations it has a pungent, irritating odor like a struck match. When sulfur-bearing fuel is burned, the sulfur is oxidized to form SO2, which then reacts with other pollutants to form aerosols. These aerosols can form particles in the air causing increases in PM2.5 levels. In liquid form, it is found in clouds, fog, rain, aerosol particles, and in surface films on these particles. In June 2010, the USEPA changed the primary SO2 standard to a 99th percentile of 1-hour concentrations not to exceed 0.075 ppm, averaged over a 3-year period. The secondary standard has not changed and is a 3-hour average that cannot exceed0.5 ppm once per year. Its sources and effects are presented below.
Sources: Coal-burning power plants are the largest source of SO2 emissions. Other sources include industrial processes such as extracting metal from ore, and non-road transportation sources, and natural sources such as volcanoes. SO2 and particulate matter are often emitted together.
Effects: Exposure to elevated levels can aggravate symptoms in asthmatics and cause respiratory problems in healthy groups. SO2 and NOx together are the major precursors to acid rain and are associated with the acidification of soils, lakes, and streams, as well as accelerated corrosion of buildings and monuments.
Population most at risk: Asthmatics, children, and the elderly are especially sensitive to SO2 exposure. Asthmatics receiving short-term exposures during moderate exertion may experience reduced lung function and symptoms, such as wheezing, chest tightness, or shortness of breath. Depending on the concentration, SO2 may also cause symptoms in people who do not have asthma.
Historical Trends: Southeast Michigan has been monitoring for SO2 for over 45 years. Figure 5.1 shows the SO2 trend for the old annual standard and the new 1-hour standard for Detroit-SW. Michigan had been in attainment for SO2 since 1982 with levels consistently well below the annual SO2 NAAQS. In 2010, when the USEPA changed the standard from an annual average to a 1-hour standard, a portion of Wayne County was designated nonattainment. In September 2016, a portion of St. Clair County was also designated as nonattainment by the USEPA based on emissions and modeling. Even though the areas are in nonattainment for the 1-hour SO2 standard, SO2 concentrations have decreased at these sites and are currently under the NAAQS, although modeling results are not below the NAAQS.
CHAPTER 5: SULFUR DIOXIDE (SO2)

Air Quality Annual Report 2020
29
Figure 5.1: Historical Annual and 1-hour SO2 Averages at Detroit-SW
Figures 5.2 and 5.3 show SO2 emission sources and SO2 emissions by county (courtesy of the USEPA’s State and County Emission Summaries).
Figure 5.2: SO2 Emissions by Source Sector
0
0.02
0.04
0.06
0.08
0.1
0.12
0.14
0
0.005
0.01
0.015
0.02
0.025
0.03
0.035
1 -H
r NAA
QS
ppm
Annu
al N
AAQ
S pp
m
Year
Detroit-SW SO2 Annual Annual NAAQS StandardDetroit-SW SO2 1-hr 1-Hr NAAQS Standard
Annual NAAQS
2010 1-hr NAAQS
70,909
10,552
1,229
775
371
0 20,000 40,000 60,000 80,000
Fuel Combustion
Industrial Processes
Mobile
Waste Disposal
Fires
Short Tons
Sulfur Dioxide Emissions by Source SectorIn Michigan (NEI 2017)

Air Quality Annual Report 2020
30
Figure 5.3: SO2 Emissions in 2017 (NEI)
Figure 5.4 shows the location of each SO2 monitor that operated in 2020.
• NCore sites: Allen Park and Grand Rapids have trace SO2 monitors that have lower detectionlimits than traditional SO2 monitors.
• Source-oriented sites: Lansing, Port Huron, Detroit-SW, Sterling State Park, West Olive.
• Community monitoring project: NMH 48217.
• GHIB project: DP4th, Trinity, and Military Park.

Air Quality Annual Report 2020
31
Figure 5.4: Sulfur Dioxide (SO2) Monitors in 2020

Air Quality Annual Report 2020
32
Figure 5.5 shows that all the SO2 sites in Michigan are below the standard even though there is a nonattainment area for SO2. The standard is a three-year average, therefore having one point above the NAAQS level line does not mean the monitor is over the standard. SO2 pollution is extremely variable and would require a large monitoring network to designate areas as attainment. Therefore, SO2 attainment depends on both emission modeling and monitoring data.
The NCore sites, Grand Rapids and Allen Park, monitor for trace SO2. For trend purposes, all SO2 data are graphed together in Figure 5.5.
Figure 5.5: SO2 Level in Michigan from 2015-2020 (1-Hour 99th Percentile)
0
10
20
30
40
50
60
70
80
90
2015 2016 2017 2018 2019 2020
CO
NC
ENTR
ATIO
N =
ppb
YEAR
Grand Rapids Allen Park Detroit-SWPort Huron Lansing Sterling State ParkWest Olive NMH 48217 DP4thTrinity Military Park
NAAQS Level
Air Quality Annual Report 2020
33
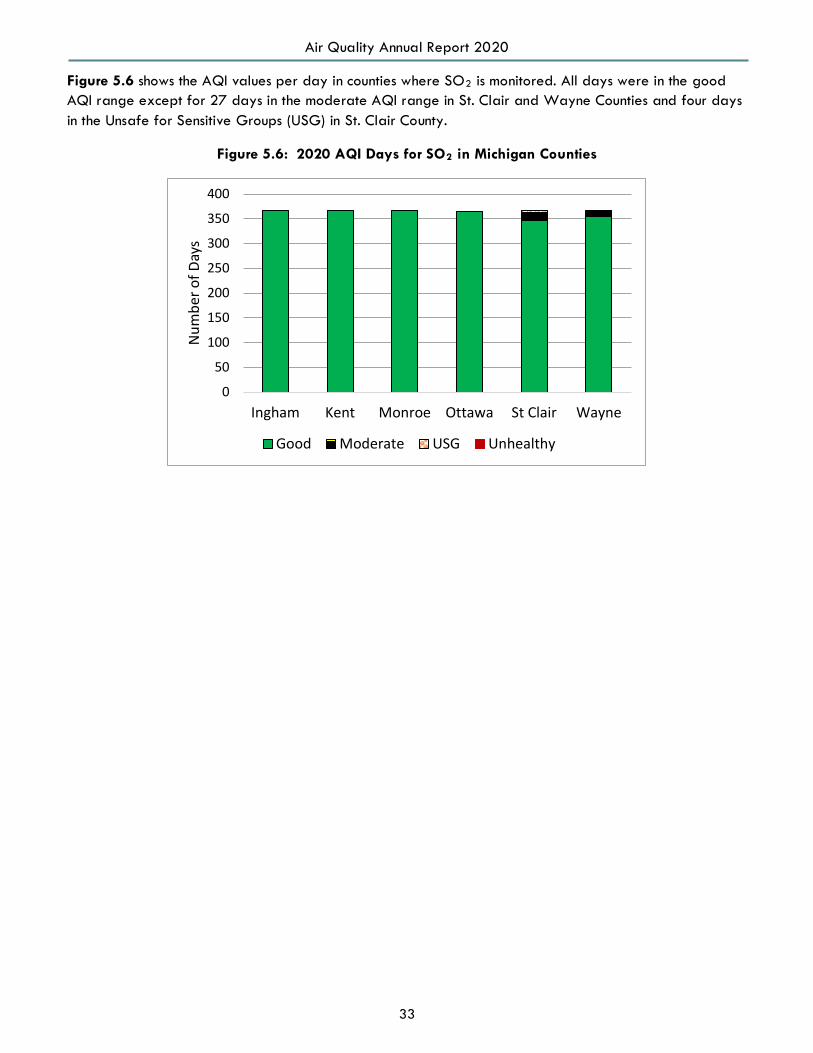
Figure 5.6 shows the AQI values per day in counties where SO2 is monitored. All days were in the good AQI range except for 27 days in the moderate AQI range in St. Clair and Wayne Counties and four days in the Unsafe for Sensitive Groups (USG) in St. Clair County.
Figure 5.6: 2020 AQI Days for SO2 in Michigan Counties
0
50
100
150
200
250
300
350
400
Ingham Kent Monroe Ottawa St Clair Wayne
Num
ber o
f Day
s
Good Moderate USG Unhealthy

Air Quality Annual Report 2020
34
CHAPTER 6: OZONE (O3)
Ground-level O3 is created by reactions involving nitrogen oxides (NOX) and volatile organic compounds (VOCs), or hydrocarbons, in the presence of sunlight as the illustration to the right depicts (image courtesy of the USEPA). These reactions usually occur during the hot summer months as ultraviolet radiation from the sun initiates a sequence of photochemical reactions. In Earth’s upper atmosphere (the stratosphere), O3 helps by absorbing much of the sun’s ultraviolet radiation, but in the lower atmosphere (the troposphere), ozone is an air pollutant. O3 is also a key ingredient of urban smog and can be transported hundreds of miles under certain meteorological conditions. Ozone levels are often higher in rural areas than in cities due to transport to regions downwind from the actual emissions of NOX and VOCs. Shoreline monitors along Lake Michigan often measure high ozone concentrations due to transport from upwind states. The ozone NAAQS was revised by the USEPA and became effective in November 2015. It is a 3-year average of the 4th highest daily maximum 8-hour average concentration that must not exceed 0.070 ppm. The sources and effects of ozone follow.
Sources: Major sources of NOX and VOCs are engine exhaust, emissions from industrial facilities, combustion from power plants, gasoline vapors, chemical solvents, and biogenic emissions from natural sources. Ground-level O3 can also be transported hundreds of miles under certain wind regimes. As a result, the long-range transport of air pollutants impacts the air quality of regions downwind from the actual area of formation.
Effects: Elevated O3 exposure can irritate airways, reduce lung function, aggravate asthma and chronic lung diseases like emphysema and bronchitis, and inflame and damage the cells lining the lungs. Other effects include increased respiratory related hospital admissions with symptoms such as chest pain, shortness of breath, throat irritation, and cough. O3 may also reduce the immune system’s ability to fight off bacterial infections in the respiratory system, and long-term, repeated exposure may cause permanent lung damage. O3 also impacts vegetation and forest ecosystems, including agricultural crop and forest yield reductions, diminished resistance to pests and pathogens, and reduced survivability of tree seedlings.
Population most at risk: Individuals most susceptible to the effects of O3 exposure include those with a pre-existing or chronic respiratory disease, children who are active outdoors and adults who actively exercise or work outdoors.
Historical Trends: Southeast Michigan has been monitoring for ozone for over 40 years. Figure 6.1 shows the ozone levels at the Detroit-E 7 Mile Road site. This graph shows how the standard changed from a 1-hour average of 0.120 ppm to an 8-hour average of 0.08 ppm in 1997. The standard was furtherlowered to 0.075 ppm in 2008 and to 0.070 ppm at the end of 2015. Ozone depends on weatherconditions, so ozone concentrations are more variable than other pollutants. Ozone is also monitoredprimarily in warmer months. In the 2015 NAAQS, the ozone season was extended to by two months toMarch 1 to October 31.

Air Quality Annual Report 2020
35
Figure 6.1: Historical 1-hour and 8-hour Ozone at Detroit-E 7 Mile
Figures 6.2 and 6.3 show VOC emission sources and VOC emissions by county (courtesy of the USEPA’s State and County Emission Summaries).
Figure 6.2: VOC Emissions by Source Sector
0
0.05
0.1
0.15
0.2
0.25
Ozo
ne C
once
ntra
tion
ppm
Year
E. 7 Mile 1-hr O3E. 7 Mile 8-hr O31-Hr NAAQS8-Hr NAAQs
1 hr 8 hr
1971 1-Hour NAAQS
1997 8-Hour NAAQS
2008 8-Hour NAAQS
2015 8-Hour NAAQS
359,645118,316
108,28427,264
14,79714,60711,807
5,6372,9772,6182,282577
0 100,000 200,000 300,000 400,000
BiogenicsSolventMobile
Industrial ProcessesFuel Combustion
Gas StationsFires
Waste DisposalBulk Gasoline…
AgricultureMiscellaneous
Commercial Cooking
Short Tons
Volatile Organic Emissions by Source SectorIn Michigan (NEI 2017)

Air Quality Annual Report 2020
36
Figure 6.3: VOC Emissions in 2017
Figure 6.4 shows all O3 air quality monitors active in Michigan at the beginning of the 2020 ozone season.
• Background site monitors: Houghton Lake, Scottville, Seney.
• Transport site monitors: Frankfort, Coloma, Harbor Beach, Holland, Muskegon, Tecumseh.
• Tribal site: Manistee
• Population-oriented monitors: All other sites.

Air Quality Annual Report 2020
37
Figure 6.4: Ozone Monitors in 2020

Air Quality Annual Report 2020
38
Table 6.1 shows the three-year averages of ozone. The USEPA uses these values (called design values) to determine attainment / nonattainment areas. The USEPA made their final designations for the 2015 standard on April 30, 2018 (effective August 3, 2018) based on 2014-2016 data. Livingston, Macomb, Monroe, Oakland, St. Clair, Washtenaw, and Wayne Counties were designated nonattainment in Southeast Michigan; and all of Berrien County, and portions of Allegan and Muskegon Counties were designated nonattainment in Western Michigan. In 2019 Berrien County was below the standard and a redesignation request was submitted to the USEPA in January 2020. Berrien County experienced elevated ozone in 2020. The USEPA has not yet acted on the submitted redesignation request.
The O3 monitoring season in Michigan is from March 1 through October 31. During this time O3 monitoring data is available for the public via the AQD’s website (discussed in Chapter 1). However, year-round O3 monitoring is conducted at the following four sites: Allen Park, Grand Rapids, Houghton Lake, and Lansing. This data helps in attainment designations, urban air quality and population exposure assessments.
Table 6.1: 3-Year Average of the 4th Highest 8-hour Ozone Values from 2016-2018, 2017-2019, and 2018-2020 (concentrations in ppm)
Areas County Monitor Sites 2016-2018 2017-2019 2018-2020
Detroit-Ann Arbor Lenawee Tecumseh 0.068 0.065 0.065 Detroit-Ann Arbor Macomb New Haven 0.072 0.068 0.071 Detroit-Ann Arbor Macomb Warren 0.069 0.066 0.068 Detroit-Ann Arbor Oakland Oak Park 0.073 0.070 0.072 Detroit-Ann Arbor St. Clair Port Huron 0.072 0.071 0.071 Detroit-Ann Arbor Washtenaw Ypsilanti 0.069 0.066 0.067 Detroit-Ann Arbor Wayne Allen Park 0.068 0.066 0.067 Detroit-Ann Arbor Wayne Detroit-E 7 Mile 0.074 0.072 0.071 Flint Genesee Flint 0.068 0.064 0.065 Flint Genesee Otisville 0.068 0.063 0.065 Grand Rapids Ottawa Jenison 0.070 0.067 0.071 Grand Rapids Kent Grand Rapids 0.070 0.066 0.071 Grand Rapids Kent Evans 0.068 0.064 0.065 Muskegon Co Muskegon Muskegon 0.076 0.074 0.076 Allegan Co Allegan Holland 0.073 0.072 0.073 Huron Huron Harbor Beach 0.068 0.064 0.068 Kalamazoo-Battle Creek Kalamazoo Kalamazoo 0.071 0.066 0.068
Lansing-East Lansing Ingham Lansing 0.068* 0.063 0.062 Lansing-East Lansing Clinton Rose Lake 0.069* 0.062 0.063 Benton Harbor Berrien Coloma 0.073 0.069 0.072 Benzie Co Benzie Frankfort 0.068 0.063 0.064 Cass Co Cass Cassopolis 0.074 0.070 0.071 Mason Co Mason Scottville 0.068 0.063 0.064 Missaukee Co Missaukee Houghton Lake 0.067 0.062 0.064 Manistee Co Manistee Manistee 0.066 0.064 0.059 Schoolcraft Co Schoolcraft Seney 0.064 0.059 0.063
Numbers in bold indicate 3-year averages over the 2015 ozone standard of 0.070 ppm. *The three-year average is using data averaged from sites that were moved.

Air Quality Annual Report 2020
39
Tables 6.2 and 6.3 highlight the number of days when two or more O3 monitors exceeded 0.070 ppm. It also specifies in which month they occurred and the temperature range.
Table 6.2: 2020 West Michigan Ozone Season
Daily High Temperature
Range Mar Days
Mar O3
Days Apr Days
Apr O3
Days May Days
May O3
Days Jun Days
Jun O3
Days Jul
Days
Jul O3
Days Aug Days
Aug O3
Days Sep
Days
Sep O3
Days Oct
Days
Oct O3
Days
≥ 95 0 0 0 0 0 0 0 0 0 0 0 0 0 0 0 0 90 ≤94 0 0 0 0 1 0 3 2 10 1 3 1 0 0 0 0 85 ≤ 89 0 0 0 0 2 0 10 4 5 1 11 0 1 0 0 0 80 ≤ 84 0 0 0 0 1 0 7 0 16 0 8 0 3 0 0 0 75 ≤ 79 0 0 1 0 2 0 5 0 0 0 8 0 9 0 1 0 70 ≤ 74 0 0 1 0 6 0 4 0 0 0 1 0 5 0 2 0 65 ≤ 69 0 0 2 0 5 0 1 0 0 0 0 0 4 0 8 0 60 ≤ 64 3 0 6 0 6 0 0 0 0 0 0 0 8 0 1 0 55 ≤ 59 3 0 5 0 4 0 0 0 0 0 0 0 0 0 5 0 50 ≤ 54 5 0 5 0 2 0 0 0 0 0 0 0 0 0 8 0
49 ≤ 20 0 10 0 2 0 0 0 0 0 0 0 0 0 6 0 Totals 31 0 30 0 31 0 30 6 31 2 31 1 30 0 31 0
Days: Number of days during month when the daily high temperature falls within the specified temperature range. O3 Days: Number of days, during specified temperature range, when two or more area monitors exceeded 70 ppb.
West Michigan had six O3 exceedance days in June; two in July and one in August when ozone exceeded 0.070 ppm at two or more ozone monitors. The temperatures on those days ranged between 85○F and 94○F.
Table 6.3: 2020 Southeast Michigan Ozone Season
Daily High Temperature
Range Mar Days
Mar O3
Days Apr
Days
Apr O3
Days May Days
May O3
Days Jun Days
Jun O3
Days Jul
Days
Jul O3
Days Aug Days
Aug O3
Days Sep
Days
Sep O3
Days Oct
Days
Oct O3
Days
≥ 95 0 0 0 0 0 0 0 0 1 1 0 0 0 0 0 0 0 ≤94 0 0 0 0 0 0 3 2 9 2 4 0 0 0 0 0
85 ≤ 89 0 0 0 0 3 0 9 2 13 0 10 0 1 0 0 0 80 ≤ 84 0 0 0 0 2 0 10 1 7 0 8 0 6 0 0 0 75 ≤ 79 0 0 0 0 1 0 4 0 1 0 9 0 7 0 3 0 70 ≤ 74 0 0 2 0 5 0 3 0 0 0 0 0 5 0 4 0 65 ≤ 69 1 0 3 0 8 0 1 0 0 0 0 0 7 0 4 0 60 ≤ 64 4 0 6 0 6 0 0 0 0 0 0 0 4 0 4 0 55 ≤ 59 1 0 8 0 2 0 0 0 0 0 0 0 0 0 7 0 50 ≤ 54 7 0 3 0 2 0 0 0 0 0 0 0 0 0 4 0
49 ≤ 18 0 8 0 2 0 0 0 0 0 0 0 0 0 5 0 Totals 31 0 30 0 31 0 30 5 31 3 31 0 30 0 31 0
Days: Number of days during month when the daily high temperature falls within the specified temperature range. O3 Days: Number of days, during specified temperature range, when two or more area monitors exceeded 70 ppb.

Air Quality Annual Report 2020
40
Southeast Michigan had five O3 exceedance days in June, and three in July when ozone exceeded 0.070 ppm at two or more ozone monitors. The temperature for those days ranged between 80○F and 95○F.
Table 6.4 gives a breakdown of the O3 days and the specific monitors that went over the standard in western, central/upper, and eastern Michigan in 2020.
Table 6.4: 8-Hour Exceedance Days (>0.070 ppm) and Locations Monitors with Exceedances of the Ozone Standard
Date Western Michigan Central/Upper Mich. Eastern Michigan Total
5/26/2020 Harbor Beach 1
6/2/2020 Coloma, Evans, Grand Rapids, Holland, Jenison, Kalamazoo, Muskegon
7
6/4/2020 New Haven 1
6/5/2020 Cassopolis, Coloma New Haven 3
6/9/2020 Houghton Lake Flint, New Haven, Oak Park, Tecumseh, Ypsilanti 6
6/17/2020 Coloma, Cassopolis, Grand Rapids, Jenison, Kalamazoo Seney New Haven, Ypsilanti 8
6/18/2020
Frankfort, Cassopolis, Coloma, Grand Rapids, Holland, Jenison, Kalamazoo, Muskegon, Scottville
Seney Harbor Beach, New Haven 12
6/19/2020
Frankfort, Cassopolis, Coloma, Evans, Grand Rapids, Holland, Jenison, Kalamazoo, Muskegon, Scottville
Seney Harbor Beach, Oak Park 13
6/20/2020 Coloma, Grand Rapids, Holland, Jenison, Muskegon
Detroit-E 7 Mile, Harbor Beach, New Haven, Oak Park, Port Huron, Warren, Ypsilanti
12
7/2/2020 Detroit-E 7 Mile 1
7/6/2020 Detroit-E 7 Mile, Harbor Beach, New Haven, Oak Park, Warren
5
7/7/2020 Cassopolis, Kalamazoo Allen Park, Detroit-E 7 Mile, New Haven, Oak Park, Tecumseh, Ypsilanti
8
7/9/2020 Allen Park, Harbor Beach, New Haven, Oak Park, Ypsilanti 5
7/15/2020 Harbor Beach 1
7/17/2020 New Haven 1
7/25/2020 Coloma, Holland 2
8/21/2020 New Haven 1
8/22/2020 New Haven 1
8/24/2020 Muskegon 1
8/26/2020 Grand Rapids, Holland, Jenison, Muskegon 4
TOTAL 93

Air Quality Annual Report 2020
41
On July 19, 2020, there were 13 monitors and on June 18 and June 20, 2020, there were 12 monitor readings that exceeded the level of the standard. The site with the most exceedances in the western region of Michigan was Coloma with seven. The central / upper Michigan sites had Seney with 3 exceedances. New Haven had 12 exceedances each in eastern Michigan.
Figure 6.5 shows the 4th highest 8-hour O3 values for Southeast Michigan monitoring sites from 2015-2020. Detroit-E 7 Mile, New Haven, Oak Park, and Port Huron site violated the 3-year standard.
Figure 6.6 shows the 4th highest 8-hour O3 values for Grand Rapids-Muskegon-Holland CSA. Muskegon. Holland, Grand Rapids, and Jenison violated the 3-year standard.
Figure 6.7 shows 4th highest 8-hour O3 values for mid-Michigan. Cassopolis and Coloma violated the 3-year standard.
Figure 6.8 shows 4th highest 8-hour O3 values for Northern Lower and Upper Peninsulas. No sites violated the 3-year standard.
Figure 6.5: O3 Levels in Detroit-Warren-Flint CSA from 2015-2020 - (4th Highest 8-Hour O3 Values).
0.040
0.055
0.070
0.085
0.100
2015 2016 2017 2018 2019 2020
CO
NC
ENTR
ATIO
N =
ppm
YEAR
Flint Otisville Ypsilanti TecumsehNew Haven Warren Oak Park Port HuronAllen Park Detroit-E. 7 Mile
NAAQS Level

Air Quality Annual Report 2020
42
Figure 6.6: O3 Levels in the Grand Rapids-Muskegon-Holland CSA from 2015-2020 (4th Highest 8-Hour O3 Values)
Figure 6.7: O3 Levels in the Kalamazoo-Portage MSA, Lansing-E. Lansing-Owosso CSA, Niles-Benton Harbor MSA, & South Bend-Mishawaka (IN-MI) MSAs from 2015-2020 (4th Highest 8-Hour O3 Values)
0.040
0.055
0.070
0.085
0.100
2015 2016 2017 2018 2019 2020
CO
NC
ENTR
ATIO
N =
ppm
YEAR
Holland Grand RapidsEvans MuskegonJenison
NAAQSLevel
0.01
0.025
0.04
0.055
0.07
0.085
0.1
0.115
2015 2016 2017 2018 2019 2020
CO
NC
ENTR
ATIO
N =
ppm
YEAR
Rose Lake LansingColoma CassopolisKalamazoo
NAAQSLevel

Air Quality Annual Report 2020
43
Figure 6.8: O3 Levels in MI’s Northern Lower and Upper Peninsula Areas from 2015-2020 (4th Highest 8-Hour O3 Values)
Figure 6.9 shows the AQI values per day in counties where ozone is monitored. Most days were in the good to moderate AQI range. Most counties had a few days in the USG range, Macomb County having the most USG days with 12 days. Two counties had one day each in the unhealthy AQI range: Benzie and Mason Counties.
Figure 6.9: 2020 AQI Days for Ozone in Michigan Counties
0.010
0.025
0.040
0.055
0.070
0.085
0.100
0.115
2015 2016 2017 2018 2019 2020
CO
NC
ENTR
ATIO
N =
ppm
YEAR
Frankfort Houghton LakeHarbor Beach ManisteeScottville SeneySault Ste. Marie
NAAQSLevel
050
100150200250300350400
Alle
gan
Benz
ieBe
rrie
nCa
ssCl
into
nGe
ness
eeHu
ron
Ingh
amKa
lam
azoo
Kent
Lene
wee
Mac
omb
Man
istee
Mas
onM
issau
kee
Mus
kego
nOa
kland
Otta
wa
St C
lair
Scho
olcr
aft
Was
hten
awW
ayne
Num
ber o
f Day
s
Good Moderate USG Unhealthy

Air Quality Annual Report 2020
44
CHAPTER 7: PARTICULATE MATTER (PM10, PM10-2.5, PM2.5, PM2.5 CHEMICAL SPECIATION AND TSP)
Particulate matter (PM) is a general term used for a mixture of solid particles and liquid droplets (aerosols) found in the air. These are further categorized according to size; larger particles with diameters of less than 50 micrometers (µm) are classified as total suspended particulates (TSP). PM10 consists of “coarse particles” less than 10 µm in diameter (about one-seventh the diameter of a human hair) and PM2.5 are much smaller “fine particles” equal to or less than 2.5 µm in diameter. PM10 has a 24-hour average standard of 150 µg/m3 not to be exceeded more than once per year over 3 years. PM2.5 has an annual average standard of 12 µg/m3, and a 98th percentile 24-hour concentration of 35 µg/m3 averaged over 3 years. The sources and effects of PM are as follows:
Sources: PM can be emitted directly (primary) or may form in the atmosphere (secondary). Most man-made particulate emissions are classified as TSP. PM10 consists of primary particles that can originate from power plants, various manufacturing processes, wood stoves and fireplaces, agriculture and forestry practices, fugitive dust sources (road dust and windblown soil), and forest fires. PM2.5 can come directly from primary particle emissions or through secondary reactions that include VOCs, SO2, and NOX emissions originating from power plants, motor vehicles (especially diesel trucks and buses), industrial facilities, and other types of combustion sources.
Effects: Exposure to PM can aggravate existing cardiovascular ailments and even cause death in susceptible populations. PM may affect breathing and the cellular defenses of the lungs and has been linked with heart and lung disease. Smaller particles (PM10 or smaller) pose the greatest problems, because they can penetrate deep in the lungs and possibly into the bloodstream. PM is the major cause of reduced visibility in many parts of the United States. PM2.5 is considered a primary visibility-reducing component of urban and regional haze. Airborne particles impact vegetation ecosystems and damage paints, building materials and surfaces. Deposition of acid aerosols and salts increases corrosion of metals and impacts plant tissue.
Population most at risk: People with heart or lung disease, the elderly, and children are at highest risk from exposure to PM.

Air Quality Annual Report 2020
45
Historical Trends: Southeast Michigan has been monitoring for particulate for over 40 years. Figure 7.1 shows the trends for particulate matter. In 1971, the USEPA promulgated an annual and 24-hour particulate standard based on total suspended particulates (TSP). In 1987, the USEPA changed the standard to PM10. Health studies indicated that particles smaller than 10 microns affect respiration. In 1997, the USEPA added additional NAAQS for a smaller particle fraction size, PM2.5, which can get deeper into the lungs and possibly into the blood stream. In 2006, the USEPA revoked the PM10 annual standard but kept the PM10 24-hour standard. The PM2.5 24-hour standard was also reduced from 65 µg/m3 to 35 µg/m3. In 2012, the USEPA reduced the annual standard from 15 µg/m3 to 12 µg/m3.
Particulate trends show that particulate concentrations have decreased, and the state is in compliance for all particulate NAAQS; however, Michigan has had past nonattainment issues in Southeast Michigan for TSP, PM10 and PM2.5.
Figure 7.1: Historical Annual Particulate Matter at Detroit-SW
0
50
100
150
200
250
1971
1973
1975
1977
1979
1981
1983
1985
1987
1989
1991
1993
1995
1997
1999
2001
2003
2005
2007
2009
2011
2013
2015
2017
2019
Part
icul
ate
Conc
entr
atio
n ug
/m3
Year
TSP, PM10 NAAQS Standard PM2.5 NAAQS StandardDetroit-SW TSP Detroit-SW PM2.5Detroit-SW PM10
TSP NAAQS
PM10 NAAQS
1997 PM2.5 NAAQS
2012 PM2.5 NAAQS

Air Quality Annual Report 2020
46
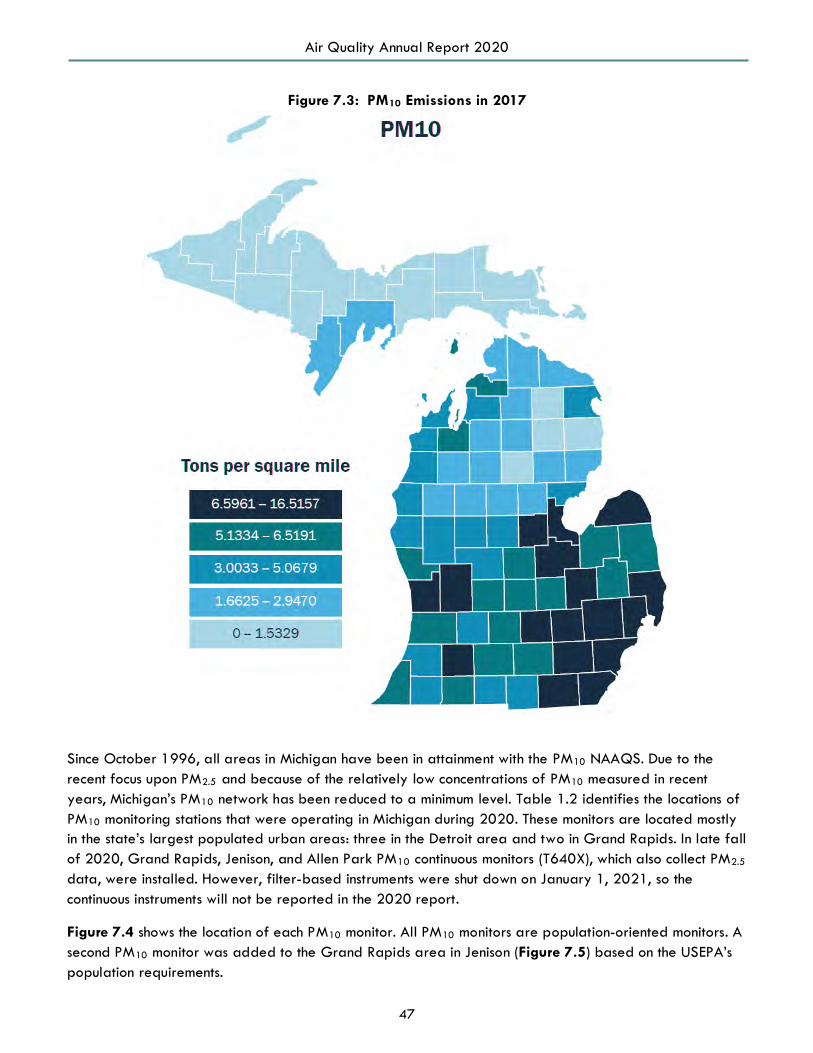
PM10
Figures 7.2 and 7.3 show PM10 emission sources and PM10 emissions by county (courtesy of the USEPA’s State and County Emission Summaries).
Figure 7.2: PM10 Emissions by Source Sector
119,36350,810
22,49510,76510,489
8,2955,1114,021
56892
0 40,000 80,000 120,000 160,000
DustAgriculture
Fuel CombustionMobile
Industrial ProcessesWaste Disposal
FiresCommercial Cooking
MiscellaneousSolvent
Short Tons
PM10 Emissions by Source SectorIn Michigan (NEI 2017)
Air Quality Annual Report 2020
47
Figure 7.3: PM10 Emissions in 2017
Since October 1996, all areas in Michigan have been in attainment with the PM10 NAAQS. Due to the recent focus upon PM2.5 and because of the relatively low concentrations of PM10 measured in recent years, Michigan’s PM10 network has been reduced to a minimum level. Table 1.2 identifies the locations of PM10 monitoring stations that were operating in Michigan during 2020. These monitors are located mostly in the state’s largest populated urban areas: three in the Detroit area and two in Grand Rapids. In late fall of 2020, Grand Rapids, Jenison, and Allen Park PM10 continuous monitors (T640X), which also collect PM2.5 data, were installed. However, filter-based instruments were shut down on January 1, 2021, so the continuous instruments will not be reported in the 2020 report.
Figure 7.4 shows the location of each PM10 monitor. All PM10 monitors are population-oriented monitors. A second PM10 monitor was added to the Grand Rapids area in Jenison (Figure 7.5) based on the USEPA’s population requirements.

Air Quality Annual Report 2020
48
Figure 7.4: PM10 Monitors in 2020

Air Quality Annual Report 2020
49
Figure 7.5 shows the PM10 levels in Michigan compared to the 24-hour average NAAQS of 150 µg/m3. This standard must not be exceeded on average more than once per year over a 3-year period. The design value is the 4th highest value over a 3-year period. The PM10 levels at all sites in Michigan are well below the national standard.
Figure 7.5: 24-Hour PM10 Design Value
Figure 7.6 shows the AQI values per day in counties where PM10 is monitored. All days were in the good AQI range except for 16 days in the moderate AQI range in Wayne County.
Figure 7.6: 2020 AQI Days for PM10 in Michigan Counties
0
20
40
60
80
100
120
140
160
Grand Rapids Jenison Allen Park Detroit-SW Dearborn
PM 1
0 (u
g/m
3)
2016-2018 2017-2019 2018-2020
NAAQS Level
050
100150200250300350400
Kent Ottawa Wayne
Num
ber o
f Day
s
Good Moderate USG Unhealthy

Air Quality Annual Report 2020
50
PM10-2. 5 The 2006 amended air monitoring regulations specified that measurements of PM course (PM10-2.5) needed to be added to the NCore sites.7 EGLE began PM course monitoring at Allen Park and Grand Rapids in 2010. Figure 7.7 shows the PM10-2.5 levels in Michigan.
Figure 7.7: PM Coarse Levels in Michigan from 2015-2020 (Annual Arithmetic Mean)
0
2
4
6
8
10
12
2015 2016 2017 2018 2019 2020
CON
CEN
TRAT
ION
= u
g/m
3
YEAR
Grand RapidsAllen Park
PM2. 5 In December 2012, the USEPA revised the annual primary standard to 12 µg/m3 while the annual secondary standard remained at 15 µg/m3. The primary and secondary 24-hour standard remained at 35 µg/m3. In December 2014, the USEPA determined that no area in Michigan violated the 2012 standard and the state was classified as unclassifiable/attainment.
Figures 7.8 and 7.9 show PM2.5 emission sources and PM2.5 emissions by county (from the USEPA’s State and County Emission Summaries).
7 Current information can be found at www3.epa.gov/ttn/amtic/ncoreguidance.html.

Air Quality Annual Report 2020
51
Figure 7.8: PM2.5 Emissions by Source Sector
Figure 7.9: PM2.5 Emissions in 2017
20,906
14,078
9,948
7,540
6,788
6,309
4,325
3,735
454
0 5,000 10,000 15,000 20,000 25,000
Fuel Combustion
Dust
Agriculture
Waste Disposal
Mobile
Industrial Processes
Fires
Commercial Cooking
Miscellaneous
Short Tons
PM2.5 Emissions by Source SectorIn Michigan (NEI 2017)

Air Quality Annual Report 2020
52
Fine particulate matter (PM2.5) is measured using three techniques: a filter-based FRM, Continuous Methods, and Chemical Speciation Methods. These methods are described in more detail in Appendix A.
Figure 7.10 shows the location of each PM2.5 monitor.
PM2.5 FRM Monitoring Network: PM2.5 FRM filter-based monitors are deployed to characterize background or regional PM2.5 transport collectively from upwind sources as well as population-oriented sites. Several changes occurred in the FRM network in 2020.
• Loss of site access shut down: Livonia Near-road will be relocated, but a suitable replacement sitehas not been found yet.
• Collocation sites: Five PM2.5 FRM monitoring sites are collocated with PM10 monitors to allow forPM2.5 and PM10 comparisons.8 Collocated PM10 and PM2.5 sites include Dearborn and Detroit-SW.Allen Park, Grand Rapids, and Jenison also have collocated PM10 and PM2.5 but monitors wereswitched from FRMs and TEOMs to continuous FEM T640X beginning January 1, 2021, whichmeasure PM10, PM2.5 and PM coarse. The T640X particulate instruments determine theconcentration of particulates in the air using a light scattering technique. The T640x is FEM for bothPM2.5 and PM10 and then it subtracts the two to get PM coarse.
• Switched FRM to BAMs: Holland, Bay City, and Ypsilanti (collocated with secondary FRM).
• Switched FRMs to T640s: Kalamazoo, New Haven, and Port Huron were switched to T640s in thefall, but FRMs were collocated at these sites until January 1, 2021. No T640 data is reported in2020 for these sites. The T640 particulate instruments determine the concentration of particulates inthe air using a light scattering technique, but the T640 primarily is used to measure PM2.5.
8 Requirements for PM2.5 FRM sites are obtained from the Revised Requirements for Designation of Reference and Equivalent Methods for PM2.5 and Ambient Air Quality Surveillance for PM [62 FR 38763]; Guidance for Using Continuous Monitors in PM2.5 Monitoring Networks [EPA-454/R-98-012, May 1998]; and Appendix N to Part 50 - Interpretation of the National Ambient Air Quality Standards for PM [40 CFR Part 50, July 1, 1998].

Air Quality Annual Report 2020
53
Figure 7.10: PM2.5 Monitors in 2020

Air Quality Annual Report 2020
54
Continuous PM2.5 Network: Short-term measurements of PM2.5 or PM10 are updated on an hourly basis using TEOM, BAM or T640 instruments. At least one continuous monitor is required at the NCore PM2.5 monitoring site in a metropolitan area with a population greater than one million. Both Detroit (Allen Park) and Grand Rapids meet this requirement.9 Under the revised 2006 air monitoring regulations, 50 percent of the FRM monitoring sites are now required to have a continuous PM2.5 monitor. For Michigan, there are 13 FRM monitoring sites, 7 of which also had TEOMs or BAMs.
• T640 replaced TEOMS: Lansing switched to a T640 monitor in September 2020 and is running acollocated filter-based FRM. The T640 data will not be reported until 2021.
• GHIB project: DP4th, Trinity, Military Park and Detroit-SW were switched from BAMs to T640s infall 2020. These T640 data are reported in the 2020 report.
Speciation Monitors: Speciation monitors consist of filter-based, 24-hour monitors and continuous speciation monitors, aethalometers. Continuous monitors are used to determine diurnal changes in PM2.5 composition.
• 24-hour speciation monitors: Allen Park and Grand Rapids (NCore sites), Dearborn (NATTS site),and Detroit-SW. The Tecumseh speciation monitor was shut down in 2019. These monitors areplaced in population-oriented stations in both urban and rural locations. PM2.5 chemical speciationsamples are collected over a 24-hour period and analyzed to determine various components ofPM2.5. The primary objectives of the chemical speciation monitoring sites are to provide data thatwill be used to determine sources of poor air quality and to support the development of attainmentstrategies. Historical speciation data for Michigan indicates that PM2.5 is made up of 30 percentnitrate compounds, 30 percent sulfate compounds, 30 percent organic carbon,10 and 10 percentunidentified or trace elements.
• Aethalometers: Allen Park, Dearborn, and the GHIB project (DP4th, Trinity, Military Park, andDetroit-SW started in 2018). These continuous monitors measure black carbon, a combustionby-product typical of transportation sources.
Table 1.2 in Chapter 1 shows all of Michigan’s PM2.5 FRM monitoring stations operating in 2020 and denotes which sites have TEOM, FEM, Speciation, or Aethalometer monitors in operation.
9 Under the Guidance for Using Continuous Monitors in PM2.5 Monitoring Networks [EPA-454/R-98-012, May 1998]. 10 To better understand the chemical composition of the organic carbon fraction, several studies have been conducted in Southeast Michigan to further investigate organic carbon. Information can be found in the Michigan 2012 Ambient Air Monitoring Network Review, available at http://www.michigan.gov/documents/deq/deq-aqd-aqe-2012-Air-Mon-Network-Review_357137_7.pdf

Air Quality Annual Report 2020
55
Table 7.1 provides the design value, the 3-year average of the annual mean PM2.5 concentrations for 2018-2020. Michigan’s levels are below the 12 μg/m3 primary standard.11
Table 7.1: 3-Year Average of the Annual Mean PM2.5 Concentrations for 2018-2020
Areas County Monitoring Sites 2018 2019 2020 2018-2020
Mean Detroit-Ann Arbor Lenawee Tecumseh 8.4 8.5 8.2 8.3 Detroit-Ann Arbor Macomb New Haven 7.8 7.3 6.0 7.0 Detroit-Ann Arbor Oakland Oak Park 8.3 7.7 7.4 7.8 Detroit-Ann Arbor St. Clair Port Huron 8.1 7.6 6.7 7.5 Detroit-Ann Arbor Washtenaw Ypsilanti 8.3 8.4 8.2 8.3 Detroit-Ann Arbor Wayne Allen Park 9.1 8.7 7.5 8.4 Detroit-Ann Arbor Wayne Detroit-Linwood 8.86 -- -- 8.9 Detroit-Ann Arbor Wayne Detroit-E 7 Mile 8.4 7.6 7.5 7.8 Detroit-Ann Arbor Wayne Detroit-SW 11.5 12.1 9.1 10.9 Detroit-Ann Arbor Wayne Detroit-W. Lafayette 8.9* -- -- 8.9 Detroit-Ann Arbor Wayne Wyandotte 8.0 -- -- 8.0 Detroit-Ann Arbor Wayne Dearborn 10.6 9.9 9.4 10.0 Detroit-Ann Arbor Wayne Livonia 7.4* -- -- 7.4 Detroit-Ann Arbor Wayne Livonia-Roadway 9.0 8.4* -- 8.7 Detroit-Ann Arbor Wayne Eliza Howell-NR -- -- 10.6 10.6 Flint Genesee Flint 7.4 7.2 6.0 6.9 Grand Rapids Ottawa Jenison 8.3* 8.3 7.4 8.0 Grand Rapids Kent Grand Rapids 8.2 8.00 7.7 8.0 Allegan Co Allegan Holland 7.6 7.2 6.0 6.9 Kalamazoo-Battle Creek Kalamazoo Kalamazoo 8.4 7.2 7.6 7.8 Lansing-East Lansing Ingham Lansing 7.7** 7.3 7.1 7.4 Bay Co Bay Bay City 7.1 6.8 4.7 6.2 Missaukee Co Missaukee Houghton Lake 5.4 5.8 8.0 6.4 Manistee Co Manistee Manistee 6.1 4.9* 5.1* 5.4 Schoolcraft Co Schoolcraft Seney 4.1* 4.2 4.6* 4.3
*Indicates site does not have a complete year of data.
**Indicates site was moved during the year and concentrations were averaged together for both locations.
11 For comparison to the standard, the average annual means is rounded to the nearest 0.1 μg/m3.

Air Quality Annual Report 2020
56
Table 7.2 provides the 24-hour 98th percentile PM2.5 concentrations for 2018-2020 showing Michigan’s levels are below the 35 μg/m3 standard (3-year average).12
Table 7.2: 24-Hour 98th Percentile PM2.5 Concentrations for 2018-2020
Areas County Monitoring Sites 2018 2019 2020 2018-2020
Mean Detroit-Ann Arbor Lenawee Tecumseh 24.2 22.1 18.7 22 Detroit-Ann Arbor Macomb New Haven 18.9 18.7 15.5 18 Detroit-Ann Arbor Oakland Oak Park 20.1 18.2 23.3 21 Detroit-Ann Arbor St. Clair Port Huron 19.6 20.3 16.6 19 Detroit-Ann Arbor Washtenaw Ypsilanti 21.3 22.0 19.8 21 Detroit-Ann Arbor Wayne Allen Park 22.8 22.0 26.3 24 Detroit-Ann Arbor Wayne Detroit-Linwood 18.6 -- -- 19 Detroit-Ann Arbor Wayne Detroit-E 7 Mile 21.5 19.6 17.7 20 Detroit-Ann Arbor Wayne Detroit-SW 28.1 30.6 24.1 28 Detroit-Ann Arbor Wayne Detroit-W. Lafayette 8.9* -- -- 8.9 Detroit-Ann Arbor Wayne Wyandotte 20.4 -- -- 20 Detroit-Ann Arbor Wayne Dearborn 26.1 24.0 21.0 24 Detroit-Ann Arbor Wayne Livonia 18.1* -- -- 18 Detroit-Ann Arbor Wayne Livonia-Roadway 22.8* 29.0 -- 26 Detroit-Ann Arbor Wayne Eliza Howell-NR -- -- 23.2 23 Flint Genesee Flint 22.2 18.9 14.5 19 Grand Rapids Ottawa Jenison 22.3* 24.4 17.9 22 Grand Rapids Kent Grand Rapids 18.9 23.2 17.6 20 Allegan Co Allegan Holland 21.2 18.2 13.1 18 Kalamazoo-Battle Creek Kalamazoo Kalamazoo 19.0 16.9 18.0 18 Lansing-East Lansing Ingham Lansing 23.5** 22.3* 21.6 22 Bay Co Bay Bay City 17.8 17.5 14.0 16 Missaukee Co Missaukee Houghton Lake 16.2 15.1 15.2 16 Manistee Co Manistee Manistee 16.9 14.9* 13.3* 15 Schoolcraft Co Schoolcraft Seney 19.0* 14.1 10.6* 15
*Indicates site does not have a complete year of data.
**Indicates site was moved during the year and concentrations were averaged together for both locations.
12 The 98th percentile value was obtained from the USEPA AQS. For comparing calculated values to the standard, the 3-year, 24-hour average is rounded to the nearest 1 μg/m3.

Air Quality Annual Report 2020
57
Figures 7.11 through 7.14 illustrate the current annual mean PM2.5 trend for each monitoring site in Michigan. For clarity, the monitoring sites within the Detroit-Warren-Flint CSA have been broken down into two graphs.
Figure 7.11 shows the 2020 levels in Wayne County remained below the PM2.5 NAAQS standard. Historically, Dearborn has had the highest concentrations in the state, but Detroit-SW now has the highest concentrations. All sites are below the annual PM2.5 NAAQS standard. The Gordie Howe International Bridge sites are included in these graphs.
Figure 7.12 contains the remainder of those sites in the Detroit-Warren-Flint CSA that are outside of Wayne County. These sites also show readings in 2020 are below the PM2.5 NAAQS.
Figure 7.13 combines the PM2.5 monitoring sites located in West Michigan-Grand Rapids-Muskegon-Holland CSA, Kalamazoo, and Benton Harbor MSAs. All sites are below the annual PM2.5 NAAQS.
Figure 7.14 displays the remaining monitoring sites in the Northern Lower and Upper Peninsulas. All sites are below the annual PM2.5 NAAQS standard.
Figure 7.11: Detroit-Warren-Flint CSA (Wayne County Only) Annual Arithmetic Means for PM2.5 from 2015-2020
0
2
4
6
8
10
12
14
16
18
20
2015 2016 2017 2018 2019 2020
CON
CEN
TRAT
ION
= u
g/m
3
YEAR
Allen Park Detroit-SW Detroit-Linwood
Detroit-E. 7 Mile Livonia Dearborn
Wyandotte Detroit-W. Lafayette Livonia-NR
DP4th Trinity Military Park
Eliza Howell-NR
NAAQS Level

Air Quality Annual Report 2020
58
Figure 7.12: Detroit-Warren-Flint CSA (without Wayne County) Annual Arithmetic Means for PM2.5 from 2015-2020
Figure 7.13: West MI - Grand Rapids-Muskegon-Holland CSA, Kalamazoo, and Benton Harbor MSAs Annual Arithmetic Means for PM2.5 from 2015-2020
0
2
4
6
8
10
12
14
16
18
20
2015 2016 2017 2018 2019 2020
CON
CEN
TRAT
ION
= u
g/m
3
YEAR
Ypsilanti TecumsehFlint New HavenSterling State Park Oak ParkPort Huron
NAAQS Level
0
2
4
6
8
10
12
14
16
18
20
2015 2016 2017 2018 2019 2020
CO
NC
ENTR
ATIO
N =
ug/
m3
YEAR
Kalamazoo Coloma
Holland Grand Rapids
Grand Rapids - Wealthy Manistee
NAAQS Level

Air Quality Annual Report 2020
59
Figure 7.14: Lansing-E. Lansing CSA, Saginaw-Bay City CSA, Cadillac MSA and Upper Peninsula Annual Arithmetic Means for PM2.5 from 2015-2020
Figure 7.15 shows the AQI values per day in counties where PM2.5 is monitored. Most days were in the good to moderate AQI range. Three counties had five days in the USG AQI range, Kalamazoo, and Kent County each had one day, and Wayne County had three days in the USG AQI range. Four counties had AQI values in the Unhealthy range; Ingham, Kent, and Washtenaw Counties had one day, and Wayne County had two days. All these days occurred on July 4th or 5th most likely due to fireworks.
Figure 7.15: 2020 AQI Days for PM2.5 in Michigan
0
2
4
6
8
10
12
14
16
18
20
2015 2016 2017 2018 2019 2020
CON
CEN
TRAT
ION
= u
g/m
3
YEAR
Lansing Bay CityHoughton Lake Sault Ste. MarieSeney
NAAQS Level
050
100150200250300350400
Alle
gan
Bay
Genn
esse
eIn
gham
Kala
maz
ooKe
ntKe
wan
awLe
new
eeM
acom
bM
anist
eeM
issau
kee
Oak
land
Ott
awa
St C
lair
Scho
olcr
aft
Was
hten
awW
ayne
Num
ber o
f Day
s
Good Moderate USG Unhealthy

Air Quality Annual Report 2020
60
CHAPTER 8: TOXIC AIR POLLUTANTS
In addition to the six criteria pollutants discussed in previous chapters, the AQD monitors for a wide variety of substances classified as toxic air pollutants, and/or Hazardous Air Pollutants (HAPs). Under the Clean Air Act, the USEPA specifically addresses a group of 187 HAPs. Under Michigan’s air regulations, Toxic Air Contaminants (TACs) are defined as all non-criteria pollutants that may be “…harmful to public health or the environment when present in the outdoor atmosphere in sufficient quantities and duration.” The definition of TACs lists 42 substances that are not TACs, indicating that all others are TACs. The sources and effects of toxics are as follows:
Sources: Air toxics come from a variety of mobile, stationary, and indoor man-made sources as well as outdoor natural sources. Mobile sources include motor vehicles, stationary sources include industrial factories and power plants, indoor sources include household cleaners, and natural sources include forest fires and eruptions from volcanoes.
Effects: Once air toxics enter the body, there is a wide range of potential health effects. They include: the aggravation of asthma; irritation to the eyes, nose, and throat; carcinogenicity; developmental toxicity (birth defects); nervous system effects; and various other effects on internal organs. Some effects appear after a shorter period of exposure, while others may appear after long-term exposure or after a long period of time has passed since the exposure ended. Most toxic effects are not unique to one substance, and some effects may be of concern only after the substance has deposited to the ground or to a water body (e.g., mercury, dioxin), followed by exposure through an oral pathway such as the eating of fish or produce. This further complicates the assessment of air toxics concerns due to the broad range of susceptibility that various people may have.
Population most at risk: People with asthma, children, and the elderly are generally at the highest risk for health effects from exposure to air toxics.
Air Toxics can be categorized as:
• Metals: Examples include aluminum, arsenic, beryllium, barium, cadmium, chromium, cobalt, copper,iron, mercury, manganese, molybdenum, nickel, lead, vanadium, and zinc.
• Organic Substances: Further divided into sub-categories that include –
o VOCs, include benzene (found in gasoline), perchloroethylene (emitted from some dry-cleaning facilities), and methylene chloride (a solvent and paint stripper used by industry);
o carbonyl compounds (formaldehyde, acetone, and acetaldehyde);
o semi-volatile compounds (SVOCs);
o polycyclic aromatic hydrocarbons (PAHs) / polynuclear aromatic hydrocarbons (PNAs);
o pesticides and;
o polychlorinated biphenyls (PCBs).
• Other substances: Asbestos, dioxin, and radionuclides such as radon.
Because air toxics are such a large and diverse group of substances, regulatory agencies sometimes further refine these classifications to address specific concerns.

Air Quality Annual Report 2020
61
For example:
• Some initiatives have targeted those substances that are persistent, bioaccumulative andtoxic (PBT), such as mercury, which accumulates in body tissues.
• The USEPA has developed an Integrated Urban Air Toxics Strategy with a focus on 30substances (the Urban HAPs List).13
The evaluation of air toxics levels is difficult due to several factors.
• There are no health-protective NAAQS. Instead, air quality assessments utilize various short- andlong-term screening levels and health-based levels estimated to be safe considering the criticaleffects of concern for specific substances.
• There is incomplete toxicity information for many substances. For some air toxics, the analyticaldetection limits are too high to consistently measure the amount present, and in some cases, the riskassessment-based levels are below the detection limits.
• Data gaps are present regarding the potential for interactive toxic effects for co-exposure tomultiple substances present in emissions and in ambient air. Air toxics also pose a challenge due tomonitoring and analytical methods that are either unavailable for some compounds or cost-prohibitive for others (e.g., dioxins).
These factors make it difficult to accurately assess the potential health concerns of all air toxics. Nevertheless, it is feasible and important to characterize the potential health hazards and risks associated with many air toxics.
Table 8.1 shows the monitoring stations and what air toxic was monitored at each station in 2020. This table can also be found in Appendix B with the Air Toxics Monitoring Summary.
13 USEPA’s Air Toxics website: Urban Strategy is located at www.epa.gov/urban-air-toxics.

Air Quality Annual Report 2020
62
Table 8.1: 2019 Toxics Sampling Sites
Site Name VOC Carbonyl PAHs Metals
TSP Metals PM10
Speciated PM2.5
Allen Park x x Dearborn x x x x x x Detroit-SW x x x x Detroit-W. Jefferson x Grand Rapids x x Belding-Merrick St. x NMH 48217 x Port Huron-Rural St. x River Rouge x x DP4th x Military Park x Trinity x
National Monitoring Effor ts and Data Analysis The USEPA administers national programs that identify air toxics levels, detect trends, and prioritize air toxics research. EGLE participates in these programs. In addition, the AQD operates a site in Dearborn that is part of the USEPA’s NATTS. The purpose of the NATTS network is to detect trends in high-risk air toxics such as benzene, formaldehyde, chromium, and 1,3-butadiene and to measure the progress of air toxics regulatory programs at the national level. Currently, the NATTS network contains 27 stations; 20 urban and 7 rural (see Figure 8.1). The USEPA requires that the NATTS sites measure VOCs, carbonyls, PAHs, and trace metals on a once-every-six-day sampling schedule. The Dearborn NATTS site measures trace metals as TSP, PM10, and PM2.5.

Air Quality Annual Report 2020
63
Figure 8.1: National Air Toxics Trends Sites
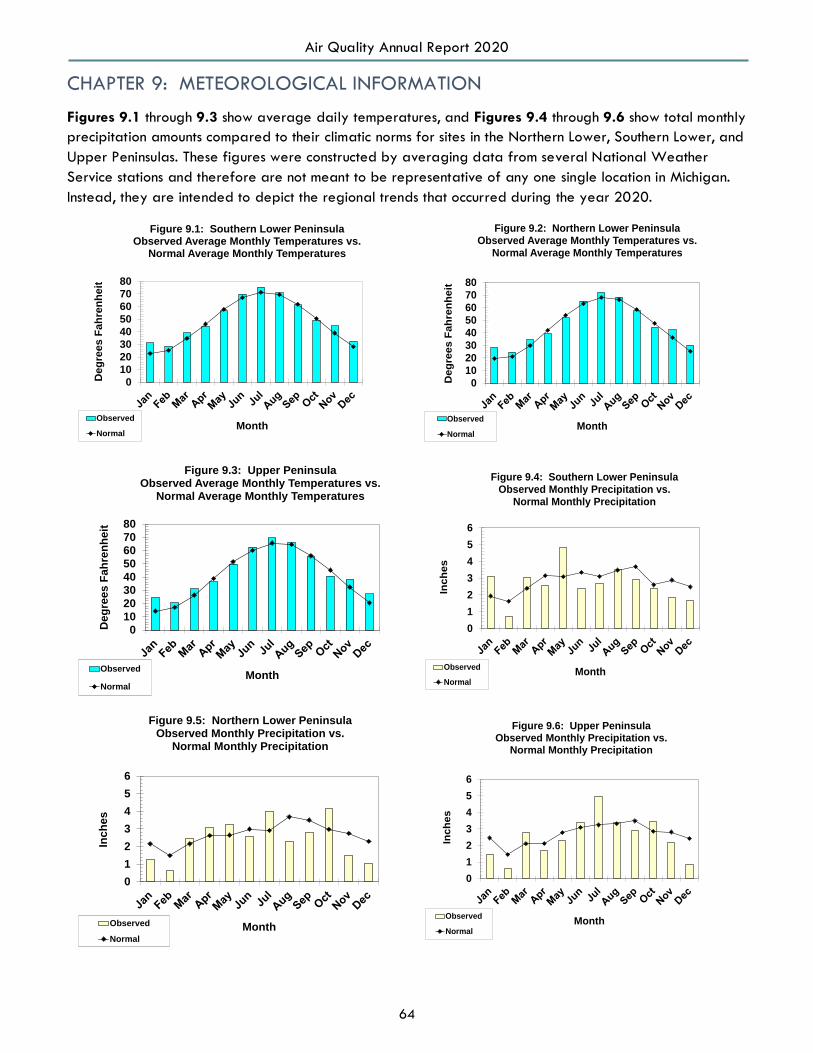
Air Quality Annual Report 2020
64
CHAPTER 9: METEOROLOGICAL INFORMATION
Figures 9.1 through 9.3 show average daily temperatures, and Figures 9.4 through 9.6 show total monthly precipitation amounts compared to their climatic norms for sites in the Northern Lower, Southern Lower, and Upper Peninsulas. These figures were constructed by averaging data from several National Weather Service stations and therefore are not meant to be representative of any one single location in Michigan. Instead, they are intended to depict the regional trends that occurred during the year 2020.
01020304050607080
Deg
rees
Fah
renh
eit
Month
Figure 9.1: Southern Lower Peninsula Observed Average Monthly Temperatures vs.
Normal Average Monthly Temperatures
Observed
Normal
01020304050607080
Deg
rees
Fah
renh
eit
Month
Figure 9.2: Northern Lower Peninsula Observed Average Monthly Temperatures vs.
Normal Average Monthly Temperatures
Observed
Normal
01020304050607080
Deg
rees
Fah
renh
eit
Month
Figure 9.3: Upper Peninsula Observed Average Monthly Temperatures vs.
Normal Average Monthly Temperatures
Observed
Normal
0123456
Inch
es
Month
Figure 9.4: Southern Lower Peninsula Observed Monthly Precipitation vs.
Normal Monthly Precipitation
Observed
Normal
0123456
Inch
es
Month
Figure 9.5: Northern Lower Peninsula Observed Monthly Precipitation vs.
Normal Monthly Precipitation
Observed
Normal
0123456
Inch
es
Month
Figure 9.6: Upper Peninsula Observed Monthly Precipitation vs.
Normal Monthly Precipitation
Observed
Normal

Air Quality Annual Report 2020
65
CHAPTER 10: SPECIAL PROJECTS
EGLE continues the sampling for the Gordie Howe International Bridge (GHIB). This project is a joint Canadian-American venture. The GHIB will be built linking Windsor, Ontario and Detroit, Michigan. Construction is slated to occur between 2018-2024. For additional information, go to: GordieHoweInternationalBridge.com.
EGLE is conducting ambient air quality monitoring in the Delray community to ascertain air pollution levels in the community. The three new sites will monitor air pollutants before, during, and after construction of the bridge. In addition, NOx, continuous PM2.5, and black carbon were added to the Detroit-SW (261630015) monitoring site for this project.
• Trinity (261630098): Meteorological parameters, NOx, SO2, CO, continuous PM2.5, black carbon, and five trace metals (Pb, Mn, As, Cd, and Ni).
• DP4TH (261630099): NOx, SO2, CO, continuous PM2.5, black carbon, and five trace metals (Pb, Mn, As, Cd, and Ni).
• Military Park (261630100): NOx, SO2, continuous PM2.5, black carbon, and five trace metals (Pb, Mn, As, Cd, and Ni).
• Detroit-SW (261630015): Meteorological parameters, NOx, SO2, continuous PM2.5, PM2.5 Speciated, PM10, black carbon, VOCs, carbonyls, and five trace metals (Pb, Mn, As, Cd, and Ni).
The data from these sites is reported along with the other sites in the previous chapters and in the following appendices.

Air Quality Annual Report 2020
66
Figure 10.1: Gordie Howe International Bridge Sites

Air Quality Annual Report 2020
A1
APPENDIX A: CRITERIA POLLUTANT SUMMARY FOR 2020
Appendix A utilizes the USEPA’s 2020 Air Quality System (AQS) Quick Look Report Data to present a summary of ambient air quality data collected for the criteria pollutants at monitoring locations throughout Michigan. Concentrations of non-gaseous pollutants are generally given in µg/m3 and in ppm for gaseous pollutants. The following define some of the terms listed in the Appendix A reports.
Site I.D.: The AQS site ID is the USEPA’s code number for these sites.
POC: The Parameter Occurrence Code or POC is used to assist in distinguishing different uses of monitors, i.e., under Pb, NO2, and SO2, POC #1-5 are used to help differentiate between individual monitors. For PM, the POC numbers are used more for the type of monitoring, such as:
1 – FRM or FEM;
2 - Typicaly collocated FRM;
3 - TEOM hourly PM10 and PM2.5 measurements; and
5 - PM2.5 speciation monitors (shown at right is a MetOne SASS – speciation air sampling system).
# OBS: For Pb, TSP, PM2.5, and PM10, the # OBS (number of observations) refers to the number of valid 24-hour values gathered.
For continuous monitors (CO, NO2, O3, PM2.5 TEOM, BAM and SO2), # OBS refers to the total valid hourly averages obtained from the analyzer.
Values: The value is listed for each criteria pollutant per its NAAQS (primary and secondary). The number of exceedances per site for the primary and secondary standards utilize running averages for continuous monitors (except for O3) and does not include averages considered invalid due to limited sampling times. For example, a particulate-mean based only on six months could not be considered as violating the annual standard. As noted, each site is allowed one short-term standard exceedance before a violation is determined.
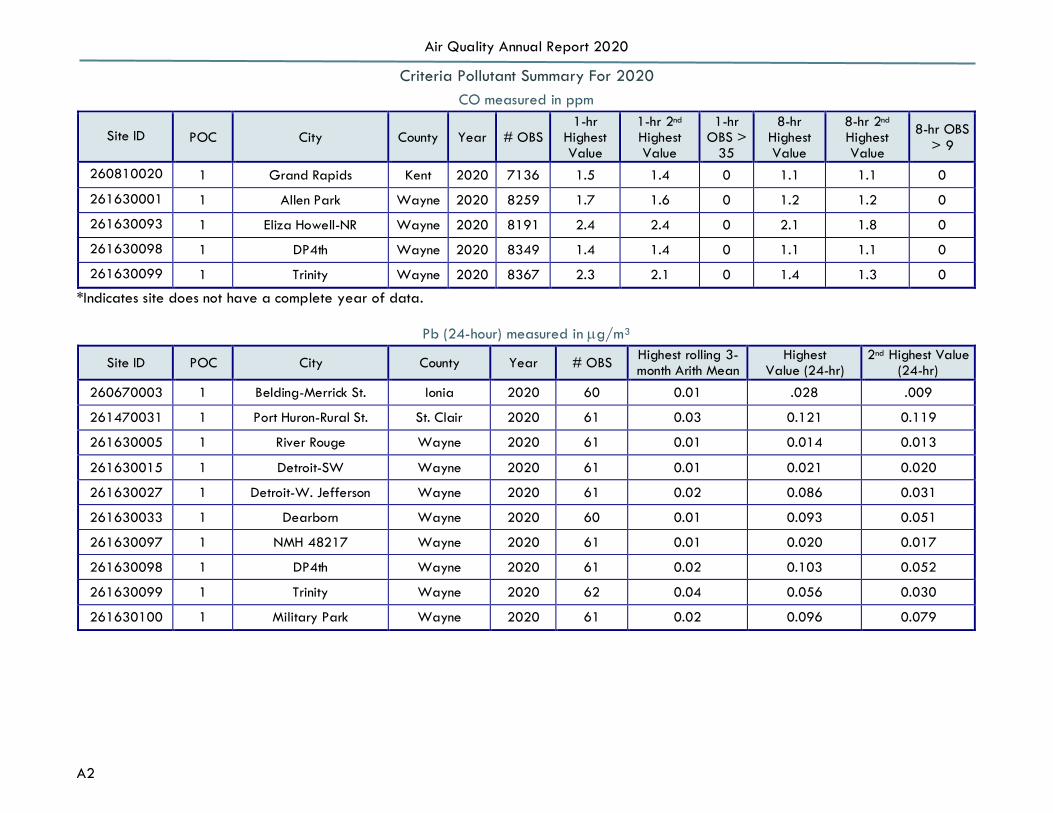
Air Quality Annual Report 2020
A2
Criteria Pollutant Summary For 2020 CO measured in ppm
Site ID POC City County Year # OBS 1-hr
Highest Value
1-hr 2nd
HighestValue
1-hrOBS >
35
8-hrHighest Value
8-hr 2nd
HighestValue
8-hr OBS> 9
260810020 1 Grand Rapids Kent 2020 7136 1.5 1.4 0 1.1 1.1 0
261630001 1 Allen Park Wayne 2020 8259 1.7 1.6 0 1.2 1.2 0
261630093 1 Eliza Howell-NR Wayne 2020 8191 2.4 2.4 0 2.1 1.8 0
261630098 1 DP4th Wayne 2020 8349 1.4 1.4 0 1.1 1.1 0
261630099 1 Trinity Wayne 2020 8367 2.3 2.1 0 1.4 1.3 0
*Indicates site does not have a complete year of data.
Pb (24-hour) measured in µg/m3
Site ID POC City County Year # OBS Highest rolling 3- month Arith Mean
Highest Value (24-hr)
2nd Highest Value (24-hr)
260670003 1 Belding-Merrick St. Ionia 2020 60 0.01 .028 .009
261470031 1 Port Huron-Rural St. St. Clair 2020 61 0.03 0.121 0.119
261630005 1 River Rouge Wayne 2020 61 0.01 0.014 0.013
261630015 1 Detroit-SW Wayne 2020 61 0.01 0.021 0.020
261630027 1 Detroit-W. Jefferson Wayne 2020 61 0.02 0.086 0.031
261630033 1 Dearborn Wayne 2020 60 0.01 0.093 0.051
261630097 1 NMH 48217 Wayne 2020 61 0.01 0.020 0.017
261630098 1 DP4th Wayne 2020 61 0.02 0.103 0.052
261630099 1 Trinity Wayne 2020 62 0.04 0.056 0.030
261630100 1 Military Park Wayne 2020 61 0.02 0.096 0.079

Air Quality Annual Report 2020
A3
NO2 measured in ppb
Site ID POC City County Year # OBS 1-Hr HighestValue
1-Hr 2nd
Highest Value 98th Percentile
1-hrAnnual Arith
Mean 260650018 1 Lansing Ingham 2020 8178 39.5 35.1 33.0 5.73
261130001 1 Houghton Lake Missaukee 2020 8327 13.7 11.1 3.4 1.02
261390005 1 Jenison Ottawa 2020 8318 29.7 29.7 28.2 4.71
261630015 1 Detroit-SW Wayne 2020 8094 47.1 45.6 38.2 11.23
261630093 1 Eliza Howell-NR Wayne 2020 8101 42.9 41.8 39.1 13.05
261630098 1 DP4th Wayne 2020 8278 80.0 47.1 43.6 12.25
261630099 1 Trinity Wayne 2020 7908 59.6 49.3 39.9 11.94
161630100 1 Military Park Wayne 2020 7847 75.4 70.4 43.3 11.14
*Indicates site does not have a complete year of data.
NOY measured in ppb
Site ID POC City County Year # OBS 1-Hr Highest Value 1-Hr 2nd Highest Value Annual Arith Mean
260810020 1 Grand Rapids Kent 2020 6392 181.5 154.6 10.29
261630001 1 Allen Park Wayne 2020 8270 206.4 202.1 12.55
261630019 1 Detroit-E 7 Mile Wayne 2020 7538 132.1 128.0 9.50

Air Quality Annual Report 2020
A4
O3 (1-hour) measured in ppm
Site ID POC City County Year Num Meas
Num Req
Highest Value
2nd
Highest Value
3rd
Highest Value
4th
Highest Value
Day Max >/=
0.125 Measured
Values >/=
0.125 Estimated
Missed Days
< 0.125 Standard
260050003 1 Holland Allegan 2020 245 245 0.092 0.090 0.083 0.081 0 0 0
260190003 1 Frankfort Benzie 2020 244 245 0.097 0.080 0.076 0.074 0 0 1
260210014 1 Coloma Berrien 2020 245 245 0.097 0.087 0.086 0.081 0 0 0
260270003 2 Cassopolis Cass 2020 236 245 0.080 0.080 0.079 0.079 0 0 2
260370002 2 Rose Lake Clinton 2020 239 245 0.076 0.073 0.071 0.068 0 0 0
260490021 1 Flint Genesee 2020 245 245 0.101 0.083 0.075 0.075 0 0 0
260492001 1 Otisville Genesee 2020 243 245 0.076 0.075 0.074 0.074 0 0 0
260630007 1 Harbor Beach Huron 2020 245 245 0.107 0.102 0.090 0.083 0 0 0
260650018 1 Lansing Ingham 2020 239 245 0.071 0.069 0.068 0.068 0 0 0
260770008 1 Kalamazoo Kalamazoo 2020 245 245 0.078 0.078 0.078 0.076 0 0 0
260810020 1 Grand Rapids Kent 2020 353 366 0.095 0.083 0.083 0.082 0 0 5
260810022 1 Evans Kent 2020 245 245 0.084 0.081 0.077 0.076 0 0 0
260910007 1 Tecumseh Lenawee 2020 245 245 0.082 0.073 0.072 0.072 0 0 0
260990009 1 New Haven Macomb 2020 245 245 0.089 0.088 0.088 0.086 0 0 0
260991003 1 Warren Macomb 2020 245 245 0.083 0.083 0.081 0.079 0 0 0
261010922 1 Manistee Manistee 2020 69 245 0.073 0.069 0.061 0.058 0 0 0
261050007 1 Scottville Mason 2020 238 245 0.092 0.077 0.076 0.075 0 0 0
261130001 1 Houghton Lake Missaukee 2020 232 245 0.079 0.074 0.072 0.071 0 0 2

Air Quality Annual Report 2020
A5
Site ID POC City County Year Num Meas
Num Req
Highest Value
2nd
Highest Value
3rd
Highest Value
4th
Highest Value
Day Max >/=
0.125 Measured
Values >/=
0.125 Estimated
Missed Days
< 0.125 Standard
261210039 1 Muskegon Muskegon 2020 243 245 0.098 0.097 0.090 0.085 0 0 2
261250001 2 Oak Park Oakland 2020 244 245 0.086 0.083 0.081 0.081 0 0 1
261390005 1 Jenison Ottawa 2020 245 245 0.090 0.090 0.083 0.083 0 0 0
261470005 1 Port Huron St. Clair 2020 245 245 0.085 0.083 0.081 0.077 0 0 0
261530001 1 Seney Schoolcraft 2020 244 245 0.082 0.080 0.077 0.072 0 0 1
261610008 1 Ypsilanti Washtenaw 2020 243 245 0.086 0.082 0.081 0.078 0 0 2
261630001 2 Allen Park Wayne 2020 342 366 0.106 0.084 0.081 0.080 0 0 2
261630019 2 Detroit-E 7 Mile Wayne 2020 239 245 0.086 0.083 0.081 0.080 0 0 4
* Indicates site was moved from Lansing (260650012) to Lansing on Filley St (260650018).

Air Quality Annual Report 2020
A6
O3 (8-hour) measured in ppm
Site ID POC City County Year %
OBS Valid Days Measured
Highest Value
2nd Highest Value
3rd Highest Value
4th Highest Value
Day Max > 0.070
260050003 1 Holland Allegan 2020 100 245 0.081 0.079 0.078 0.076 6
260190003 1 Frankfort Benzie 2020 100 245 0.091 0.078 0.069 0.068 2
260210014 1 Coloma Berrien 2020 100 245 0.085 0.082 0.079 0.078 7
260270003 2 Cassopolis Cass 2020 95 233 0.077 0.075 0.075 0.075 5
260370002 1 Rose Lake Clinton 2020 97 238 0.068 0.067 0.065 0.064 0
260490021 1 Flint Genesee 2020 100 245 0.078 0.069 0.068 0.067 1
260492001 1 Otisville Genesee 2020 100 244 0.070 0.069 0.068 0.068 0
260630007 1 Harbor Beach Huron 2020 100 245 0.085 0.083 0.078 0.075 7
260650018 1 Lansing Ingham 2020 97 238 0.064 0.063 0.062 0.062 0
260770008 1 Kalamazoo Kalamazoo 2020 100 244 0.075 0.074 0.073 0.072 5
260810020 1 Grand Rapids Kent 2020 96 353 0.083 0.080 0.079 0.078 6
260810022 1 Evans Kent 2020 100 244 0.076 0.071 0.070 0.070 2
260910007 1 Tecumseh Lenawee 2020 100 245 0.077 0.071 0.068 0.067 2
260990009 1 New Haven Macomb 2020 100 245 0.078 0.076 0.075 0.074 12
260991003 1 Warren Macomb 2020 100 245 0.077 0.071 0.070 0.070 2
261010922 1 Manistee Manistee 2020 69 245 0.064 0.061 0.059 0.051 0
261050007 1 Scottville Mason 2020 96 236 0.089 0.074 0.068 0.068 2
261130001 1 Houghton Lake Missaukee 2020 93 229 0.072 0.069 0.069 0.068 1
261210039 1 Muskegon Muskegon 2020 98 241 0.083 0.083 0.083 0.080 6
261250001 2 Oak Park Oakland 2020 98 241 0.078 0.077 0.076 0.074 6
261390005 1 Jenison Ottawa 2020 100 244 0.085 0.081 0.077 0.075 6
261470005 1 Port Huron St. Clair 2020 100 245 0.072 0.070 0.070 0.069 1
261530001 1 Seney Schoolcraft 2020 99 243 0.080 0.076 0.073 0.067 3
261610008 1 Ypsilanti Washtenaw 2020 99 243 0.074 0.073 0.072 0.072 5
261630001 2 Allen Park Wayne 2020 93 339 0.073 0.071 0.070 0.070 2
261630019 2 Detroit-E 7 Mile Wayne 2020 97 238 0.076 0.075 0.074 0.073 4

Air Quality Annual Report 2020
A7
PM2.5 (24-hour) FRM measured in µg/m3 at local conditions
Site ID POC Monitor City County Year # OBS
Highest Value
2nd Highest Value
3rd Highest Value
4th Highest Value 98% Wtd. Arith.
Mean
260490021 1 FRM Flint Genesee 2020 61 22.0 15.6 15.2 13.7 15.6 6.56
260650018 1 FRM Lansing Ingham 2020 60 31.8 21.6 16.9 16.5 21.6 7.06
260770008 1 FRM Kalamazoo Kalamazoo 2020 111 38.3 27.4 18.0 17.7 18.0 7.70
260770008 2 FRM Kalamazoo Kalamazoo 2020 61 26.0 17.4 15.3 14.3 17.4 7.11
260810020 1 FRM Grand Rapids Kent 2020 116 47.9 19.3 17.6 16.4 17.6 7.73
260990009 1 FRM New Haven Macomb 2020 119 16.7 16.5 15.5 15.1 15.5 6.00
261010922 1 FRM Manistee Manistee 2020 88 14.2 13.3 12.7 11.7 13.3 5.11*
261250001 1 FRM Oak Park Oakland 2020 112 29.0 25.3 23.3 17.7 23.3 7.42
261390005 1 FRM Jenison Ottawa 2020 114 33.2 17.9 17.9 16.8 17.9 7.39
261470005 1 FRM Port Huron St. Clair 2020 119 24.5 17.9 16.6 16.2 16.6 6.75
261610008 1 FRM Ypsilanti Washtenaw 2020 60 32.8 16.9 15.0 14.4 16.9 7.17
261630001 1 FRM Allen Park Wayne 2020 117 41.9 29.4 26.3 18.2 26.3 7.46
261630015 1 FRM Detroit-SW Wayne 2020 122 30.3 26.8 19.5 17.6 19.5 8.39
261630019 1 FRM Detroit-E 7 Mile Wayne 2020 116 28.4 17.9 17.7 17.0 17.7 7.50
261630033 1 FRM Dearborn Wayne 2020 120 37.6 30.4 21.0 21.0 21.0 9.40
261630033 2 FRM Dearborn Wayne 2020 57 30.8 21.4 20.9 19.8 21.4 9.08
*Indicates the site does not have a complete year of data.

Air Quality Annual Report 2020
A8
PM2.5 (24-hour) FEM measured in µg/m3 at local conditions
Site ID POC Monitor City County Year # OBS
Highest Value
2nd Highest Value
3rd Highest Value
4th Highest Value 98% Wtd. Arith.
Mean 260050003 3 BAM Holland Allegan 2020 359 30.4 21.7 15.8 14.7 13.1 5.96
260170014 3 BAM Bay City Bay 2020 365 23.1 15.6 14.7 14.3 14.0 4.75 260490021 3 BAM Flint Genesee 2020 366 33.3 21.4 19.1 17.4 14.5 6.01 260910007 3 BAM Tecumseh Lenawee 2020 366 30.4 30.4 29.0 28.9 18.7 8.19 261130001 3 BAM Houghton Lake Missaukee 2020 329 19.3 19.3 16.4 16.2 15.2 8.04*
261530001 3 BAM Seney Schoolcraft 2020 282 17.3 15.4 14.5 13.1 10.6 4.56* 261610008 3 BAM Ypsilanti Washtenaw 2020 365 67.8 34.2 31.8 27.9 19.8 8.22
261630015 3 BAM/ T640 Detroit-SW** Wayne 2020 289 38.5 35.6 34.1 30.2 25.9 9.57*
261630093 3 BAM Eliza Howell-NR Wayne 2020 356 108.9 45.8 40.7 34.2 23.2 10.59 * Indicates the site does not have a complete year of data.**TIECO BAMs were switched out to T640s in the fall of 2020.

Air Quality Annual Report 2020
A9
PM2.5 Continuous, Non-Regulatory (1-hour) measured in µg/m3
Site ID POC Monitor City County Year # OBS Highest Value
2nd Highest Value
3rd Highest Value
4th Highest Value
Wtd. Arith. Mean
260650012 3 TEOM Lansing Ingham 2020 6106 455.1 384.5 306.5 224.7 7.44
260770008 3 TEOM Kalamazoo Kalamazoo 2020 6907 169.0 162.9 144.5 126.9 7.38
260810020 3 TEOM Grand Rapids Kent 2020 6513 715.8 249.1 241.9 228.2 7.73
261470005 3 TEOM Port Huron St. Clair 2020 7373 122.7 56.6 45.6 44.3 7.22
261630001 3 TEOM Allen Park Wayne 2020 6400 216.0 208.0 174.0 144.0 8.34
261630015 3 BAM/T640 Detroit-SW** Wayne 2020 8345 270.6 227.9 188.8 183.8 12.60
261630033 3 TEOM Dearborn Wayne 2020 8284 342.0 217.1 165.7 100.9 9.19
261630097 3 TEOM NMH 48217 Wayne 2020 8495 450.7 343.8 319.9 88.9 8.33
261630098 3 BAM/T640 DP4th** Wayne 2020 8735 95.0 93.4 85.4 80.0 9.59
261630099 3 BAM/T640 Trinity** Wayne 2020 8308 270.6 162.3 120.9 101.3 10.75
261630100 3 BAM/T640 Military Park** Wayne 2020 7552 220.6 214.5 159.0 120.5 10.76
* Indicates the site does not have a complete year of data.**TIECO BAMs were switched out to T640s in the fall of 2020.
PM10 (24-hour) measured in µg /m3
Site ID POC Monitor City County Year # OBS # Req. Valid Days % OBS Highest Value
2nd
Highest Value
3rd Highest Value
4th
Highest Value
Wtd Arith Mean
260810020 1 GRAV Grand Rapids Kent 2020 59 61 58 95 28 27 26 24 8.6 261390005 1 GRAV Jenison Ottawa 2020 58 61 57 93 22 21 21 21 7.2 261630001 1 GRAV Allen Park Wayne 2020 62 61 59 97 34 27 26 23 9.6 261630015 1 GRAV Detroit-SW Wayne 2020 58 61 57 93 59 48 47 46 16.3 261630033 1 GRAV Dearborn Wayne 2020 60 61 59 97 53 49 48 47 22.9 261630033 9 GRAV Dearborn Wayne 2020 29 31 29 94 59 50 47 44 24.2

Air Quality Annual Report 2020
A10
PM10 TEOM (1-hour) measured in µg/m3
Site ID POC Monitor City County Year # OBS Highest Value
2nd Highest Value
3rd Highest Value
4th Highest Value
Wtd. Arith. Mean
261630033 3 TEOM Dearborn Wayne 2020 8086 57 50 49 44 16.9
PM10-2.5 (24-hour) measured in µg/m3
Site ID Monitor City County Year # OBS Highest Value 2nd Highest Value 3rd Highest Value 4th Highest Value Wtd. Arith. Mean
260810020 GRAV Grand Rapids Kent 2020 107 25.5 22.5 17.5 17.2 6.73
261630001 GRAV Allen Park Wayne 2020 102 21.3 20.9 19.9 19.2 7.15
SO2 measured in ppb
Site ID POC City County Year # OBS 1-hr
Highest Value
1-hr 2nd
HighestValue
99th %ile: 1-
hr
24-hrHighestValue
24-hr2nd
Highest Value
OBS >0.5
Arith Mean
260650018 1 Lansing Ingham 2020 8379 5.5 4.6 4.2 2.1 1.9 0 1.32
260810020 2 Grand Rapids Kent 2020 8409 11.0 3.0 2.7 1.4 1.2 0 0.49
261150006 1 Sterling State Park Monroe 2020 8302 8.7 7.0 6.9 2.4 2.3 0 0.59
261390011 1 West Olive Ottawa 2020 8278 18.6 16.7 15.2 10.5 5.8 0 0.69
261470005 1 Port Huron St. Clair 2020 8382 106.3 104.3 76.4 26.4 17.1 0 1.88
261630001 1 Allen Park Wayne 2020 8337 18.2 17.2 14.7 3.1 2.8 0 0.49
261630015 1 Detroit-SW Wayne 2020 8380 5437 45.3 43.3 27.0 14.6 0 2.34
261630097 1 NMH 48217 Wayne 2020 8251 24.8 21.7 17.0 3.7 3.7 0 0.60
261630098 1 DP4th Wayne 2020 8353 31.1 28.3 17.0 4.3 4.1 0 1.14
261630099 1 Trinity Wayne 2020 8258 21.4 18.8 16.1 9.0 6.2 0 0.71
261630100 1 Military Park Wayne 2020 8199 40.8 36.0 32.5 13.0 12.4 0 1.61

AIR QUALITY ANNUAL REPORT 2019
B1
APPENDIX B: 2020 AIR TOXICS MONITORING SUMMARY FOR METALS, VOCS, CARBONYL COMPOUNDS, PAHS, HEXAVALENT CHROMIUM & SPECIATED PM2.5
Appendix B provides summary statistics of ambient air concentrations of various substances monitored in Michigan during 2020. At each monitoring site, air samples were taken over a 24-hour period (midnight to midnight). These air samples represent the average air concentration during that 24-hour period. The frequency of air samples collected is typically done once every 6 or 12 days. Sometimes the sampled air concentration is lower than the laboratory’s analytical method detection level (MDL). When the concentration is lower than the MDL, two options are used to estimate the air concentration. The calculation of the minimum average (“Average (ND=0)”) uses 0.0 µg/m³ for a value less than the MDL. In the calculation of the maximum average (“Average (ND=MDL/2)”) the MDL divided by 2 (i.e., ½ the MDL) is substituted for air concentrations less than the MDL.
Table B shows the monitoring stations and what types of air toxics were monitored at each station in 2020. The following terms and acronyms are used in Appendix B-1 and B-2 data tables:
• Num Obs: Number of Observations (number of daily air samples taken during the year)
• Obs>MDL: Number of daily samples above the MDL
• Average (ND=0): average air concentration in 2020, assuming daily samples below MDL were equal to 0.0 µg/m³.
• Average (ND=MDL/2): average air concentration in 2020, assuming daily samples below MDL were equal to one half the MDL.
• MDL: Analytical MDL in units of µg/m³
• Max1: Highest daily air concentration during 2020
• Max2: Second highest daily air concentration during 2020
• Max3: Third highest daily air concentration during 2020
• µg/m³: Micrograms per cubic meter (1,000,000 µg = 1 g)

AIR QUALITY ANNUAL REPORT 2019
B2
Table B: 2019 Toxics Sampling Sites
SITE NAME VOC Carbonyl PAHs Metals TSP
Metals PM10
Speciated PM2.5
Allen Park x x x
Dearborn x x x x x x
Detroit-SW x x x x
Detroit-W. Jefferson x
Grand Rapids x x
Belding-Merrick St. x
NMH 48217 x
Port Huron-Rural St. x
River Rouge x x
DP4th x
Military Park x
Trinity x
VOC = volatile organic compound; PAHs = polycyclic aromatic hydrocarbon; TSP = total suspended particulate PM10 = particulate matter with aerodynamic diameter less than 10 µm; Mn = manganese.

AIR QUALITY ANNUAL REPORT 2019
B3
APPENDIX B-1 DATA TABLES
Dearborn (261630033) Concentrations in micrograms per cubic meter (µg/m3)
Chemical Name
Num Obs
Obs > MDL
Average (ND=0)
Average (ND=MDL/2) MDL Max 1 Max 2 Max 3
1,1,2,2-Tetrachloroethane 58 1 0.00102 0.059 0.118 0.059 0 0 1,1,2-Trichloro-1,2,2-Trifluoroethane 58 58 0.529 0.529 0.0649 0.716 0.614 0.598
1,1,2-Trichloroethane 58 1 9.41E-05 0.0257 0.0523 0.0055 0 0
1,1-Dichloroethane 58 0 0 0.0215 0.0429 0 0 0
1,1-Dichloroethylene 58 0 0 0.0305 0.061 0 0 0
1,2,4-Trichlorobenzene 58 6 0.00371 0.178 0.387 0.0668 0.0468 0.043
1,2,4-Trimethylbenzene 58 58 0.389 0.389 0.0519 2.37 2.34 1.72
1,2-Dichlorobenzene 58 5 0.000611 0.0389 0.084 0.0132 0.0084 0.0078
1,2-Dichloropropane 58 6 0.00163 0.0295 0.0616 0.0185 0.0176 0.0166
1,3,5-Trimethylbenzene 58 58 0.109 0.109 0.0255 0.654 0.551 0.472
1,3-Butadiene 58 58 0.0422 0.0422 0.026 0.158 0.122 0.11
1,3-Dichlorobenzene 58 2 0.000228 0.032 0.0653 0.0078 0.0054 0
1,4-Dichlorobenzene 58 45 0.025 0.0364 0.0782 0.142 0.114 0.092
Acenaphthene (Tsp) Stp 62 53 0.00568 0.0057 0.00017 0.0343 0.0233 0.0201
Acenaphthylene (Tsp) Stp 62 60 0.000728 0.000728 1.12E-05 0.0139 0.0117 0.006
Acetaldehyde 70 70 2.02 2.02 0.0374 5.13 4.75 4.66
Acetone 70 70 3.4 3.4 0.403 16.5 13 12.4
Acetonitrile 58 58 0.497 0.497 0.0745 2.64 1.31 1.27
Acetylene 58 58 0.342 0.342 0.248 1.18 1.1 0.975
Acrolein - Verified 56 0 0 0 0 0
Acrylonitrile 57 5 0.0103 0.0228 0.0279 0.247 0.103 0.102
Anthracene (Tsp) Stp 62 62 0.000429 0.000429 2.85E-05 0.0037 0.003 0.0014
Arsenic (Tsp) Stp 92 91 0.00186 0.00186 4.76E-05 0.0085 0.0061 0.0055
Arsenic Pm10 Lc 93 93 0.00164 0.00164 0.006 0.0052 0.0034

AIR QUALITY ANNUAL REPORT 2019
B4
Chemical Name
Num Obs
Obs > MDL
Average (ND=0)
Average (ND=MDL/2) MDL Max 1 Max 2 Max 3
Arsenic Pm10 Stp 93 93 0.00166 0.00166 7.41E-05 0.006 0.0053 0.0034
Barium (Tsp) Stp 92 91 0.0241 0.0241 0.00759 0.0892 0.0735 0.0721
Barium Pm10 Lc 93 93 0.0144 0.0144 0.0688 0.0661 0.0332
Barium Pm10 Stp 93 93 0.0146 0.0146 0.00066 0.0679 0.0652 0.0327
Benzaldehyde 70 70 0.407 0.407 0.043 4.6 4.02 3.35
Benzene 58 58 0.678 0.678 0.0324 6.71 1.28 1.13 Benzo[A]Anthracene (Tsp) Stp 62 62 0.000208 0.000208 1.18E-05 0.00232 0.00193 0.0016
Benzo[A]Pyrene (Tsp) Stp 62 62 0.000174 0.000174 1.43E-05 0.0017 0.0014 0.001 Benzo[B]Fluoranthene (Tsp) Stp 60 60 0.000549 0.000549 7.12E-06 0.00564 0.00375 0.0032
Benzo[E]Pyrene (Tsp) Stp 62 62 0.000288 0.000288 5.94E-06 0.00348 0.00162 0.0014 Benzo[G,H,I]Perylene (Tsp) Stp 62 61 0.000224 0.000224 5.71E-06 0.0012 0.00096 0.0009 Benzo[K]Fluoranthene (Tsp) Stp 61 59 0.000146 0.000146 1.26E-05 0.00131 0.00068 0.0006
Beryllium (Tsp) Stp 92 91 8.70E-05 8.70E-05 3.16E-05 0.00038 0.00025 0.0002
Beryllium Pm10 Lc 93 91 2.87E-05 2.93E-05 0.00011 0.00011 0.0001
Beryllium Pm10 Stp 93 93 2.92E-05 2.92E-05 9.69E-06 0.00011 0.00011 0.0001
Bromochloromethane 58 1 0.000228 0.0315 0.0636 0.0132 0 0
Bromodichloromethane 55 0 0 0.0386 0.0771 0 0 0
Bromoform 58 45 0.0116 0.0331 0.196 0.0279 0.0248 0.0217
Bromomethane 58 58 0.0392 0.0392 0.0677 0.205 0.144 0.118
Butyraldehyde 69 69 0.466 0.466 0.0522 1.83 1.81 1.7
Cadmium (Tsp) Stp 92 91 0.000264 0.000264 2.11E-05 0.00183 0.00095 0.0009
Cadmium Pm10 Lc 93 93 0.000194 0.000194 0.00096 0.00094 0.0008
Cadmium Pm10 Stp 93 93 0.000197 0.000197 2.08E-05 0.00098 0.00098 0.0009
Carbon Disulfide 58 58 0.0598 0.0598 0.118 0.299 0.274 0.164
Carbon Tetrachloride 58 58 0.577 0.577 0.103 0.749 0.73 0.723

AIR QUALITY ANNUAL REPORT 2019
B5
Chemical Name
Num Obs
Obs > MDL
Average (ND=0)
Average (ND=MDL/2) MDL Max 1 Max 2 Max 3
Chlorobenzene 58 52 0.0256 0.0282 0.05 0.423 0.0414 0.0373
Chloroethane 58 46 0.0237 0.0282 0.0438 0.29 0.0995 0.0712
Chloroform 58 58 0.627 0.627 0.0643 1.47 1.39 0.84
Chloromethane 58 58 0.98 0.98 0.0628 1.36 1.32 1.26
Chloroprene 58 0 0 0.0241 0.0483 0 0 0
Chromium (Tsp) Stp 92 91 0.00596 0.00596 0.00167 0.0215 0.0211 0.0203
Chromium Pm10 Lc 93 93 0.00335 0.00335 0.023 0.0216 0.007
Chromium Pm10 Stp 93 93 0.00341 0.00341 0.00225 0.0238 0.0223 0.0073
Chrysene (Tsp) Stp 23 23 0.000759 0.000759 7.69E-06 0.00448 0.00312 0.0027
Cis-1,2-Dichloroethene 58 0 0 0.0275 0.0551 0 0 0
Cis-1,3-Dichloropropene 58 0 0 0.0223 0.0446 0 0 0
Cobalt (Tsp) Stp 92 91 0.00026 0.00026 3.16E-05 0.00056 0.00053 0.0005
Cobalt Pm10 Lc 93 93 0.000158 0.000158 0.00049 0.00046 0.0004
Cobalt Pm10 Stp 93 93 0.00016 0.00016 3.15E-05 0.00051 0.00048 0.0004
Copper (Tsp) Stp 92 91 0.0198 0.0198 0.00168 0.0745 0.0719 0.0695
Copper Pm10 Lc 93 93 0.0205 0.0205 0.148 0.0947 0.0749
Copper Pm10 Stp 93 93 0.0209 0.0209 0.000799 0.151 0.0976 0.0771
Coronene (Tsp) Stp 62 62 0.000104 0.000104 3.68E-06 0.000462 0.000434 0.00043
Crotonaldehyde 42 42 0.278 0.278 0.00851 1.13 0.927 0.911 Dibenzo[A,H]Anthracene (Tsp) Stp 62 38 4.13E-05 4.40E-05 1.38E-05 0.000441 0.000365 0.00027
Dibromochloromethane 58 11 0.00109 0.0579 0.14 0.0111 0.00937 0.00767
Dichlorodifluoromethane 58 58 2.12 2.12 0.0827 2.55 2.54 2.51
Dichloromethane 58 58 2.71 2.71 0.0787 11 8.89 8.27
Ethyl Acrylate 58 0 0 0.0258 0.0516 0 0 0
Ethylbenzene 58 58 0.205 0.205 0.0468 1.11 0.521 0.512
Ethylene Dibromide 58 0 0 0.0517 0.103 0 0 0
Ethylene Dichloride 58 57 0.0725 0.0729 0.0418 0.118 0.117 0.106

AIR QUALITY ANNUAL REPORT 2019
B6
Chemical Name
Num Obs
Obs > MDL
Average (ND=0)
Average (ND=MDL/2) MDL Max 1 Max 2 Max 3
Ethylene Oxide 57 50 0.223 0.232 0.147 1.05 0.726 0.602
Fluoranthene (Tsp) Stp 62 62 0.00368 0.00368 4.20E-05 0.0183 0.0145 0.0136
Fluorene (Tsp) Stp 62 62 0.00537 0.00537 8.45E-05 0.0274 0.0212 0.0198
Formaldehyde 70 70 3.26 3.26 0.0524 9.15 8.85 8.82
Freon 114 58 58 0.103 0.103 0.101 0.132 0.122 0.121
Hexachlorobutadiene 58 4 0.000736 0.0767 0.167 0.0256 0.00746 0.00533
Hexanaldehyde 67 67 0.2 0.2 0.0109 1.69 1.59 1.28 Indeno[1,2,3-Cd]Pyrene (Tsp) Stp 62 62 0.000231 0.000231 1.15E-05 0.00132 0.00122 0.00104
Iron (Tsp) Stp 92 91 1.27 1.27 0.027 5.7 4.88 3
Iron Pm10 Lc 93 93 0.696 0.696 2.22 1.94 1.8
Iron Pm10 Stp 93 93 0.706 0.706 0.0109 2.32 1.91 1.81
Lead (Tsp) Lc Frm/Fem 92 92 0.0128 0.0128 0.0978 0.0939 0.0516
Lead Pm10 Lc 93 93 0.0108 0.0108 0.11 0.102 0.0539
M/P Xylene 58 58 0.618 0.618 0.0559 3.6 1.78 1.68
Manganese (Tsp) Stp 92 91 0.0774 0.0774 0.000926 0.407 0.324 0.24 Manganese Pm10 Lc 93 93 0.0346 0.0346 0.149 0.126 0.118 Manganese Pm10 Stp 93 93 0.0351 0.0351 0.00037 0.156 0.127 0.119 Methyl Chloroform 58 47 0.0134 0.0208 0.0782 0.0338 0.0284 0.024 Methyl Ethyl Ketone 61 61 0.372 0.372 0.0853 0.746 0.687 0.675 Methyl Isobutyl Ketone 53 52 0.207 0.207 0.0614 0.635 0.586 0.5 Methyl Methacrylate 58 10 0.00439 0.0964 0.228 0.0446 0.0377 0.0373 Methyl Tert-Butyl Ether 58 6 0.00117 0.0217 0.0457 0.0209 0.0126 0.0101 Molybdenum (Tsp) Stp 92 91 0.00413 0.00413 0.000164 0.136 0.128 0.00889 Molybdenum Pm10 Lc 93 93 0.00379 0.00379 0.131 0.122 0.00817 Molybdenum Pm10 Stp 93 93 0.0039 0.0039 0.000293 0.135 0.126 0.0085 Ethylene Oxide 57 50 0.223 0.232 0.147 1.05 0.726 0.602 Naphthalene (Tsp) Stp 62 62 0.0577 0.0577 0.00176 0.152 0.143 0.137

AIR QUALITY ANNUAL REPORT 2019
B7
Chemical Name
Num Obs
Obs > MDL
Average (ND=0)
Average (ND=MDL/2) MDL Max 1 Max 2 Max 3
Nickel (Tsp) Stp 92 91 0.00272 0.00272 0.000894 0.0268 0.0259 0.00688 Nickel Pm10 Lc 93 93 0.00215 0.00215 0.0298 0.0278 0.00718 Nickel Pm10 Stp 93 93 0.00219 0.00219 0.00144 0.0308 0.0288 0.00713 N-Octane 58 58 0.105 0.105 0.104 0.432 0.265 0.258 O-Xylene 58 58 0.234 0.234 0.069 0.947 0.76 0.677 Perylene (Tsp) Stp 62 38 2.31E-05 2.61E-05 1.56E-05 0.000216 0.000191 0.00015
Phenanthrene (Tsp) Stp 62 62 0.0109 0.0109 0.000176 0.0526 0.0431 0.0391 Propionaldehyde 70 70 0.419 0.419 0.101 1.41 1.35 1.04 Propylene 58 58 0.415 0.415 0.221 1.76 1.6 1.06 Pyrene (Tsp) Stp 62 62 0.00191 0.00191 3.86E-05 0.00861 0.00749 0.00613 Styrene 58 57 0.372 0.373 0.0756 1.98 1.18 1.02 Tert-Amyl Methyl Ether 58 0 0 0.0227 0.0453 0 0 0 Tert-Butyl Ethyl Ether 58 0 0 0.0179 0.0358 0 0 0 Tetrachloroethylene 58 58 0.664 0.664 0.0864 8.55 6.92 2.64 Toluene 58 58 1.01 1.01 0.0698 4.22 3.16 2.8 Trans-1,2-Dichloroethylene 58 15 0.0025 0.0208 0.0493 0.0174 0.0155 0.0139 Trans-1,3-Dichloropropene 58 1 0.000517 0.0333 0.0667 0.03 0 0 Trichloroethylene 58 51 0.0383 0.0414 0.0514 0.155 0.0811 0.0758 Trichlorofluoromethane 58 58 1.19 1.19 0.0728 1.48 1.47 1.47 Valeraldehyde 70 70 0.149 0.149 0.0041 0.768 0.756 0.653 Vanadium (Tsp) Stp 92 91 0.00322 0.00322 6.30E-05 0.0228 0.0226 0.0105 Vanadium Pm10 Lc 93 93 0.00184 0.00184 0.0192 0.0184 0.00349 Vanadium Pm10 Stp 93 93 0.00187 0.00187 4.58E-05 0.0198 0.019 0.00365 Vinyl Chloride 58 5 0.00078 0.0181 0.0371 0.0245 0.0128 0.00332 Zinc (Tsp) Stp 92 91 0.114 0.114 0.00535 1.07 1.04 0.452 Zinc Pm10 Lc 93 93 0.0856 0.0856 1.02 0.883 0.485 Zinc Pm10 Stp 93 93 0.0877 0.0877 0.00226 1.07 0.923 0.488
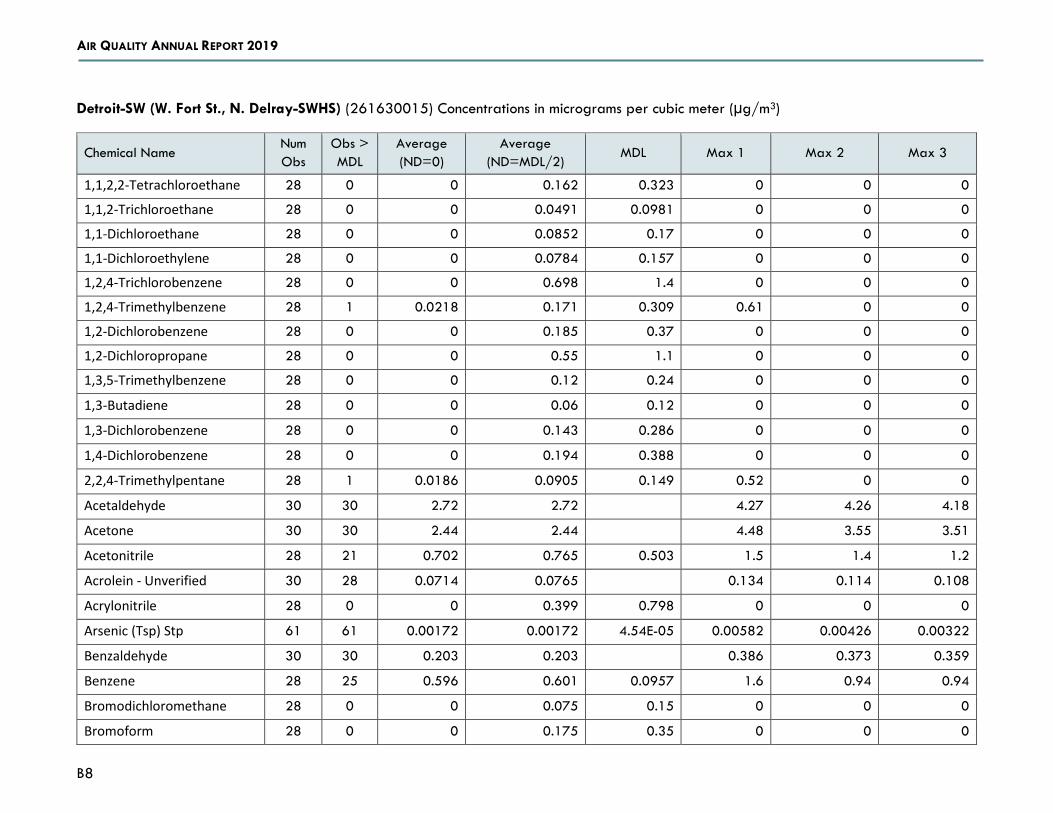
AIR QUALITY ANNUAL REPORT 2019
B8
Detroit-SW (W. Fort St., N. Delray-SWHS) (261630015) Concentrations in micrograms per cubic meter (µg/m3)
Chemical Name Num Obs
Obs > MDL
Average (ND=0)
Average (ND=MDL/2)
MDL Max 1 Max 2 Max 3
1,1,2,2-Tetrachloroethane 28 0 0 0.162 0.323 0 0 0
1,1,2-Trichloroethane 28 0 0 0.0491 0.0981 0 0 0
1,1-Dichloroethane 28 0 0 0.0852 0.17 0 0 0
1,1-Dichloroethylene 28 0 0 0.0784 0.157 0 0 0
1,2,4-Trichlorobenzene 28 0 0 0.698 1.4 0 0 0
1,2,4-Trimethylbenzene 28 1 0.0218 0.171 0.309 0.61 0 0
1,2-Dichlorobenzene 28 0 0 0.185 0.37 0 0 0
1,2-Dichloropropane 28 0 0 0.55 1.1 0 0 0
1,3,5-Trimethylbenzene 28 0 0 0.12 0.24 0 0 0
1,3-Butadiene 28 0 0 0.06 0.12 0 0 0
1,3-Dichlorobenzene 28 0 0 0.143 0.286 0 0 0
1,4-Dichlorobenzene 28 0 0 0.194 0.388 0 0 0
2,2,4-Trimethylpentane 28 1 0.0186 0.0905 0.149 0.52 0 0
Acetaldehyde 30 30 2.72 2.72 4.27 4.26 4.18
Acetone 30 30 2.44 2.44 4.48 3.55 3.51
Acetonitrile 28 21 0.702 0.765 0.503 1.5 1.4 1.2
Acrolein - Unverified 30 28 0.0714 0.0765 0.134 0.114 0.108
Acrylonitrile 28 0 0 0.399 0.798 0 0 0
Arsenic (Tsp) Stp 61 61 0.00172 0.00172 4.54E-05 0.00582 0.00426 0.00322
Benzaldehyde 30 30 0.203 0.203 0.386 0.373 0.359
Benzene 28 25 0.596 0.601 0.0957 1.6 0.94 0.94
Bromodichloromethane 28 0 0 0.075 0.15 0 0 0
Bromoform 28 0 0 0.175 0.35 0 0 0

AIR QUALITY ANNUAL REPORT 2019
B9
Chemical Name Num Obs
Obs > MDL
Average (ND=0)
Average (ND=MDL/2)
MDL Max 1 Max 2 Max 3
Bromomethane 28 0 0 0.11 0.22 0 0 0
Cadmium (Tsp) Stp 61 61 0.000151 0.000151 2.02E-05 0.00035 0.00034 0.00031
Carbon Tetrachloride 28 0 0 0.115 0.23 0 0 0
Chlorobenzene 28 0 0 0.105 0.209 0 0 0
Chloroethane 28 0 0 0.06 0.12 0 0 0
Chloroform 28 1 0.0204 0.0789 0.121 0.57 0 0
Chloromethane 28 28 1.29 1.29 0.159 1.6 1.5 1.5
Cis-1,2-Dichloroethene 28 0 0 0.0641 0.128 0 0 0
Cis-1,3-Dichloropropene 28 0 0 0.0679 0.136 0 0 0
Crotonaldehyde 30 0 0 0 0 0
Dibromochloromethane 28 0 0 0.148 0.296 0 0 0
Dibromochloromethane 28 0 0 0.148 0.296 0 0 0
Dichlorodifluoromethane 28 27 2.18 2.19 0.25 2.5 2.5 2.5
Dichloromethane 28 11 0.159 0.266 0.349 0.55 0.47 0.43
Ethylbenzene 28 0 0 0.147 0.293 0 0 0
Ethylene Dibromide 28 0 0 0.15 0.3 0 0 0
Ethylene Dichloride 28 0 0 0.0984 0.197 0 0 0
Formaldehyde 30 30 2.27 2.27 5.66 4.43 4.11
Hexanaldehyde 30 30 0.165 0.165 0.352 0.339 0.335
Lead (Tsp) Lc Frm/Fem 61 61 0.00784 0.00784 0.0216 0.0206 0.0205
M/P Xylene 28 6 0.201 0.492 0.739 1.3 1 0.93
Manganese (Tsp) Stp 61 61 0.0501 0.0501 0.000883 0.246 0.177 0.155
Methacrolein 30 30 0.124 0.124 0.442 0.231 0.203
Methyl Chloroform 28 0 0 0.105 0.211 0 0 0
Methyl Ethyl Ketone 28 7 0.386 0.798 1.1 2.5 1.9 1.6

AIR QUALITY ANNUAL REPORT 2019
B10
Chemical Name Num Obs
Obs > MDL
Average (ND=0)
Average (ND=MDL/2)
MDL Max 1 Max 2 Max 3
Methyl Isobutyl Ketone 28 0 0 0.434 0.868 0 0 0
Methyl Tert-Butyl Ether 28 0 0 0.095 0.19 0 0 0
N-Hexane 28 17 0.758 0.775 0.0872 4.5 2.5 2.5
Nickel (Tsp) Stp 61 61 0.00204 0.00204 0.000852 0.00495 0.00479 0.00468
O-Xylene 28 1 0.0179 0.178 0.332 0.5 0 0
Pm10 Total 0-10um Stp 58 40 16.9 24.5 59 48 47
Propionaldehyde 30 30 0.353 0.353 0.61 0.606 0.576
Styrene 28 3 0.0939 0.439 0.773 0.89 0.88 0.86
Tetrachloroethylene 28 0 0 0.117 0.235 0 0 0
Tolualdehydes 30 18 0.048 0.0801 0.115 0.107 0.105
Toluene 28 25 0.764 0.787 0.445 2.4 1.6 1.4
Trans-1,2-Dichloroethylene 28 0 0 0.075 0.15 0 0 0
Trans-1,3-Dichloropropene 28 0 0 0.0452 0.0905 0 0 0
Trichloroethylene 28 0 0 0.0848 0.17 0 0 0
Trichlorofluoromethane 28 28 1.29 1.29 0.232 1.4 1.4 1.4
Valeraldehyde 30 30 0.223 0.223 0.42 0.39 0.359
Vinyl Chloride 28 0 0 0.065 0.13 0 0 0

AIR QUALITY ANNUAL REPORT 2019
B11
Detroit-W. Jefferson, South Delray (261630027) Concentrations in micrograms per cubic meter (µg/m3)
Chemical Name Num Obs
Obs > MDL
Average (ND=0)
Average (ND=MDL/2)
MDL Max 1 Max 2 Max 3
Arsenic (Tsp) Stp 61 61 0.00196 0.00196 4.64E-05 0.00885 0.00454 0.00451
Cadmium (Tsp) Stp 61 61 0.000242 0.000242 2.00E-05 0.00141 0.00073 0.00063
Lead (Tsp) Lc Frm/Fem 61 61 0.0106 0.0106 0.0867 0.0318 0.0225
Manganese (Tsp) Stp 61 61 0.162 0.162 0.000893 0.896 0.584 0.527
Nickel (Tsp) Stp 61 61 0.00236 0.00236 0.000862 0.00848 0.00834 0.00797
Port Huron-Rural St. (261470031), Speciated PM2.5 (µg/m3)
Chemical Name Num Obs
Obs > MDL
Average (ND=0)
Average (ND=MDL/2)
MDL Max 1 Max 2 Max 3
Arsenic (Tsp) Stp 92 92 0.0014 0.0014 4.53E-05 0.00796 0.00607 0.00554 Cadmium (Tsp) Stp 92 92 0.000229 0.000229 2.00E-05 0.00141 0.00114 0.00113 Lead (Tsp) Lc Frm/Fem 92 92 0.0203 0.0203 0.146 0.122 0.120 Manganese (Tsp) Stp 92 92 0.00952 0.00952 0.000882 0.0313 0.0285 0.0276 Nickel (Tsp) Stp 92 92 0.000776 0.000776 0.00085 0.00224 0.00188 0.00187
River Rouge (261630005) Concentrations in micrograms per cubic meter (µg/m3)
Chemical Name Num Obs
Obs > MDL
Average (ND=0)
Average (ND=MDL/2) MDL Max 1 Max 2 Max 3
Acetaldehyde 31 31 2.58 2.58 6.58 4.61 3.71 Acetone 31 31 2.67 2.67 6.3 4.5 4.34 Acrolein - Unverified 31 30 0.0934 0.0965 0.252 0.196 0.179 Arsenic (Tsp) Stp 61 61 0.00163 0.00163 4.54E-05 0.00851 0.00517 0.00479 Benzaldehyde 31 30 0.175 0.181 0.661 0.318 0.308 Cadmium (Tsp) Stp 61 61 0.000191 0.000191 2.00E-05 0.00049 0.00042 0.00039 Crotonaldehyde 31 0 0 0 0 0 Formaldehyde 31 31 3.37 3.37 7.6 6.65 6.33 Hexanaldehyde 31 31 0.17 0.17 0.515 0.507 0.35

AIR QUALITY ANNUAL REPORT 2019
B12
Chemical Name Num Obs
Obs > MDL
Average (ND=0)
Average (ND=MDL/2) MDL Max 1 Max 2 Max 3
Lead (Tsp) Lc Frm/Fem 61 61 0.00592 0.00592 0.014995 0.013 0.0129 Manganese (Tsp) Stp 61 61 0.0318 0.0318 0.000877 0.0873 0.0871 0.0719 Methacrolein 31 31 0.154 0.154 0.444 0.437 0.337 Nickel (Tsp) Stp 61 61 0.00117 0.00117 0.000846 0.00484 0.00312 0.00237 Propionaldehyde 31 31 0.354 0.354 0.734 0.664 0.62 Tolualdehydes 31 20 0.0766 0.119 0.279 0.258 0.209 Valeraldehyde 31 30 0.174 0.18 0.419 0.364 0.355
Belding-Merrick St. (260670003) Concentrations in micrograms per cubic meter (µg/m3)
Chemical Name Num Obs
Obs > MDL
Average (ND=0)
Average (ND=MDL/2) MDL Max 1 Max 2 Max 3
Arsenic (Tsp) Stp 60 60 0.00159 0.00159 4.62E-05 0.0242 0.00412 0.00396 Cadmium (Tsp) Stp 60 60 9.05E-05 9.05E-05 2.00E-05 0.00071 0.00038 0.00016 Lead (Tsp) Lc Frm/Fem 60 60 0.00396 0.00396 0.0284 0.00929 0.00882 Manganese (Tsp) Stp 60 60 0.0084 0.0084 0.000886 0.0242 0.0227 0.02 Nickel (Tsp) Stp 60 60 0.000605 0.000605 0.000854 0.00152 0.00116 0.00113
NMH 48217 (261630097) Concentrations in micrograms per cubic meter (µg/m3)
Chemical Name Num Obs
Obs > MDL Average (ND=0)
Average (ND=MDL/2)
MDL Max 1 Max 2 Max 3
Arsenic (Tsp) Stp 61 61 0.00151 0.00151 4.46E-05 0.00867 0.00537 0.00529 Cadmium (Tsp) Stp 61 61 0.000133 0.000133 2.00E-05 0.00041 0.00031 0.00031 Lead (Tsp) Lc Frm/Fem 61 61 0.00509 0.00509 0.0207 0.0179 0.0135 Manganese (Tsp) Stp 61 61 0.0196 0.0196 0.000866 0.0611 0.0445 0.0415 Nickel (Tsp) Stp 61 61 0.00103 0.00103 0.000836 0.00271 0.00237 0.00205
DP4th (261630098) Concentrations in micrograms per cubic meter (µg/m3)
Chemical Name Num Obs Obs > MDL Average (ND=0) Average (ND=MDL/2)
MDL Max 1 Max 2 Max 3
Arsenic (Tsp) Stp 61 61 0.00141 0.00141 4.51E-05 0.00531 0.00304 0.00278

AIR QUALITY ANNUAL REPORT 2019
B13
Cadmium (Tsp) Stp 61 61 0.000145 0.000145 2.00E-05 0.00037 0.00034 0.00032 Lead (Tsp) Lc Frm/Fem 61 61 0.00978 0.00978 0.104 0.0525 0.029 Manganese (Tsp) Stp 61 61 0.0435 0.0435 0.000881 0.162 0.102 0.101 Nickel (Tsp) Stp 61 61 0.00193 0.00193 0.000849 0.00527 0.00433 0.00398
Military Park (261630100) Concentrations in micrograms per cubic meter (µg/m3)
Chemical Name Num Obs
Obs > MDL
Average (ND=0)
Average (ND=MDL/2)
MDL Max 1 Max 2 Max 3
Arsenic (Tsp) Stp 61 61 0.0019 0.0019 0.0000452 0.00828 0.00764 0.00587 Cadmium (Tsp) Stp 61 61 0.00021 0.00021 0.00002 0.00073 0.00055 0.00046 Lead (Tsp) Lc Frm/Fem 61 61 0.0156 0.0156 0.0962 0.0796 0.0687 Manganese (Tsp) Stp 61 61 0.0442 0.0442 0.000875 0.153 0.126 0.108 Nickel (Tsp) Stp 61 61 0.0016 0.0016 0.000843 0.00584 0.00344 0.00313
Trinity (261630099) Concentrations in micrograms per cubic meter (µg/m3)
Chemical Name Num Obs Obs > MDL Average (ND=0) Average (ND=MDL/2) MDL Max 1 Max 2 Max 3
Arsenic (Tsp) Stp 61 61 0.00194 0.00194 4.43E-05 0.00768 0.00575 0.00486 Cadmium (Tsp) Stp 61 61 0.000222 0.000222 2.00E-05 0.00104 0.00053 0.00047 Lead (Tsp) Lc Frm/Fem 61 61 0.0109 0.0109 0.0541 0.0301 0.0276 Manganese (Tsp) Stp 61 61 0.0655 0.0655 0.00087 0.177 0.164 0.14 Nickel (Tsp) Stp 61 61 0.00291 0.00291 0.000839 0.00985 0.00799 0.00717

AIR QUALITY ANNUAL REPORT 2019
B14
APPENDIX B-2 Data Tables
Allen Park (261630001), Speciated PM2.5 (µg/m3)
Chemical Name Num Obs
Obs > MDL
Average (ND=0)
Average (ND= MDL/2)
MDL Max 1 Max 2 Max 3
Aluminum Pm2.5 Lc 118 87 0.026 0.026 0.0229 0.533 0.135 0.112
Ammonium Ion Pm2.5 Lc 119 119 0.52 0.52 0.0129 3.73 3 2.18
Antimony Pm2.5 Lc 118 68 0.00529 0.00529 0.016 0.0313 0.0248 0.0241
Arsenic Pm2.5 Lc 118 37 2.52E-05 3.07E-05 0.0001 0.00028 0.00027 0.00026
Barium Pm2.5 Lc 118 73 0.0147 0.0148 0.0283 0.47 0.0795 0.0505
Bromine Pm2.5 Lc 118 38 0.000544 0.000589 0.000136 0.00708 0.00637 0.00555
Cadmium Pm2.5 Lc 118 68 0.00401 0.00407 0.0137 0.0274 0.0235 0.0198
Calcium Pm2.5 Lc 118 118 0.0616 0.0616 0.00981 0.377 0.301 0.299
Cerium Pm2.5 Lc 118 55 0.00766 0.00766 0.0361 0.0499 0.0463 0.0462
Cesium Pm2.5 Lc 118 58 0.00703 0.00703 0.0271 0.047 0.0396 0.0388
Chlorine Pm2.5 Lc 119 118 0.108 0.108 0.0251 2.53 0.652 0.635
Chromium Pm2.5 Lc 118 100 0.0232 0.0232 0.00394 1.96 0.0584 0.0442
Cobalt Pm2.5 Lc 118 90 0.00218 0.00218 0.00228 0.0164 0.0147 0.0106
Copper Pm2.5 Lc 118 32 0.000253 0.000253 0.00157 0.0033 0.00319 0.00186
Ec Csn_Rev Unadjusted Pm2.5 Lc Tot 118 97 0.00767 0.00767 0.00421 0.283 0.0257 0.0256
Indium Pm2.5 Lc 121 121 0.416 0.416 0.00032 2.25 1.58 1.17
Iron Pm2.5 Lc 118 71 0.00504 0.00504 0.0147 0.0296 0.0268 0.0268
Lead Pm2.5 Lc 118 118 0.0704 0.0704 0.00845 0.229 0.221 0.218
Magnesium Pm2.5 Lc 118 90 0.00407 0.00407 0.00659 0.0164 0.0162 0.0146
Manganese Pm2.5 Lc 118 62 0.0225 0.0265 0.045 0.81 0.106 0.101
Nickel Pm2.5 Lc 118 91 0.00254 0.00254 0.00296 0.0136 0.00949 0.00918
Oc Csn_Rev Unadjusted Pm2.5 Lc Tot 118 92 0.000894 0.000894 0.00122 0.00539 0.0042 0.00402

AIR QUALITY ANNUAL REPORT 2019
B15
Chemical Name Num Obs
Obs > MDL
Average (ND=0)
Average (ND= MDL/2)
MDL Max 1 Max 2 Max 3
Phosphorus Pm2.5 Lc 121 121 1.99 1.99 0.643 10.7 5.1 4.3
Potassium Ion Pm2.5 Lc 118 101 0.000149 0.000261 0.00196 0.00439 0.00306 0.00217
Potassium Pm2.5 Lc 119 118 0.109 0.109 0.0129 8.82 0.307 0.287
Rubidium Pm2.5 Lc 118 118 0.129 0.129 0.00539 8.59 0.404 0.332
Selenium Pm2.5 Lc 118 61 0.000944 0.000956 0.00315 0.00502 0.00499 0.00491
Silicon Pm2.5 Lc 118 75 0.00126 0.00126 0.00244 0.012 0.00633 0.00502
Silver Pm2.5 Lc 118 116 0.0582 0.0582 0.0136 0.301 0.252 0.248
Sodium Ion Pm2.5 Lc 119 119 0.035 0.035 0.014 0.466 0.406 0.221
Sodium Pm2.5 Lc 118 85 0.0355 0.0355 0.0801 0.223 0.158 0.134
Strontium Pm2.5 Lc 118 79 0.00307 0.0031 0.00292 0.205 0.0111 0.00886
Sulfate Pm2.5 Lc 119 118 1.01 1.01 0.0294 8.11 4.75 2.31
Sulfur Pm2.5 Lc 118 117 0.357 0.357 0.00104 2.5 1.65 0.908
Tin Pm2.5 Lc 118 69 0.00542 0.00542 0.0155 0.023 0.0222 0.022
Titanium Pm2.5 Lc 118 106 0.00337 0.00337 0.00291 0.0453 0.00961 0.00933
Total Nitrate Pm2.5 Lc 119 118 1.53 1.53 0.0383 11.7 9.05 6.89
Vanadium Pm2.5 Lc 118 43 0.000244 0.00048 0.000708 0.00273 0.00228 0.00212
Zinc Pm2.5 Lc 118 118 0.0138 0.0138 0.00172 0.0894 0.0473 0.0391
Zirconium Pm2.5 Lc 118 65 0.00436 0.00436 0.014 0.0306 0.0259 0.0231

AIR QUALITY ANNUAL REPORT 2019
B16
Dearborn (261630033), Speciated PM2.5 (µg/m3)
Chemical Name Num Obs
Obs > MDL
Average (ND=0)
Average (ND=MDL/2) MDL Max 1 Max 2 Max 3
Aluminum Pm2.5 Lc 60 40 0.0218 0.0218 0.0228 0.122 0.0904 0.0856
Ammonium Ion Pm2.5 Lc 60 60 0.53 0.53 0.0129 3.56 2.32 2.28
Antimony Pm2.5 Lc 60 28 0.00281 0.00281 0.016 0.0256 0.0192 0.0107
Arsenic Pm2.5 Lc 60 16 7.57E-05 8.15E-05 0.0001 0.00337 0.00033 0.00028
Barium Pm2.5 Lc 60 30 0.00856 0.00856 0.0283 0.0441 0.0382 0.0356
Bromine Pm2.5 Lc 60 20 0.000705 0.000752 0.000135 0.00614 0.00587 0.00444
Cadmium Pm2.5 Lc 60 27 0.00352 0.00352 0.0138 0.0218 0.0212 0.0149
Calcium Pm2.5 Lc 60 60 0.0936 0.0936 0.00978 0.369 0.355 0.286
Cerium Pm2.5 Lc 60 37 0.0118 0.0118 0.0363 0.0475 0.044 0.0433
Cesium Pm2.5 Lc 60 33 0.00668 0.00668 0.027 0.0376 0.0331 0.0264
Chlorine Pm2.5 Lc 60 60 0.179 0.179 0.0251 2.56 0.523 0.49
Chromium Pm2.5 Lc 60 54 0.0261 0.0261 0.00393 0.204 0.163 0.131
Cobalt Pm2.5 Lc 59 48 0.00483 0.00483 0.00228 0.122 0.0268 0.0183
Copper Pm2.5 Lc 59 22 0.000411 0.000411 0.00159 0.00422 0.00255 0.00217
Ec Csn_Rev Unadjusted Pm2.5 Lc Tot 59 58 0.0135 0.0135 0.00424 0.0838 0.0492 0.0479
Indium Pm2.5 Lc 61 60 0.55 0.55 0.00032 1.72 1.5 1.37
Iron Pm2.5 Lc 60 33 0.00415 0.00415 0.0148 0.0267 0.0207 0.017
Lead Pm2.5 Lc 59 58 0.285 0.285 0.00843 3.29 1.75 0.781
Magnesium Pm2.5 Lc 60 51 0.00777 0.00777 0.0066 0.116 0.0439 0.0159
Manganese Pm2.5 Lc 60 50 0.00576 0.00576 0.00297 0.0233 0.0222 0.0181
Nickel Pm2.5 Lc 59 47 0.00238 0.00238 0.00122 0.0587 0.00641 0.0059
Oc Csn_Rev Unadjusted Pm2.5 Lc Tot 61 61 2.32 2.32 0.643 4.87 4.59 4.17
Phosphorus Pm2.5 Lc 60 54 0.00049 0.000556 0.00196 0.00649 0.00473 0.00431
Potassium Ion Pm2.5 Lc 60 58 0.0445 0.0445 0.0129 0.221 0.18 0.174
Potassium Pm2.5 Lc 60 60 0.0611 0.0611 0.00544 0.207 0.194 0.192

AIR QUALITY ANNUAL REPORT 2019
B17
Chemical Name Num Obs
Obs > MDL
Average (ND=0)
Average (ND=MDL/2) MDL Max 1 Max 2 Max 3
Rubidium Pm2.5 Lc 60 25 0.00065 0.000699 0.00316 0.00385 0.00373 0.00356
Selenium Pm2.5 Lc 60 41 0.00124 0.00124 0.00243 0.0116 0.00523 0.00522
Silicon Pm2.5 Lc 60 59 0.0616 0.0616 0.0138 0.234 0.226 0.172
Silver Pm2.5 Lc 60 30 0.00463 0.00463 0.0129 0.0238 0.0214 0.0213
Sodium Ion Pm2.5 Lc 60 60 0.0492 0.0492 0.0141 0.25 0.218 0.168
Sodium Pm2.5 Lc 60 45 0.0618 0.0626 0.0805 0.488 0.223 0.173
Strontium Pm2.5 Lc 60 39 0.00105 0.00105 0.00291 0.00358 0.00358 0.00349
Sulfate Pm2.5 Lc 60 60 1.08 1.08 0.0294 2.94 2.22 2.19
Sulfur Pm2.5 Lc 60 59 0.37 0.37 0.00105 1.1 0.855 0.785
Tin Pm2.5 Lc 60 28 0.00488 0.00488 0.0155 0.0501 0.0253 0.0199
Titanium Pm2.5 Lc 60 49 0.00269 0.0027 0.00292 0.0112 0.00743 0.00734
Total Nitrate Pm2.5 Lc 60 59 1.43 1.43 0.0386 11.8 7.03 6.78
Vanadium Pm2.5 Lc 60 26 0.000628 0.000826 0.000713 0.0178 0.00211 0.00204
Zinc Pm2.5 Lc 60 59 0.0506 0.0506 0.00172 0.654 0.271 0.268
Zirconium Pm2.5 Lc 60 28 0.00352 0.00352 0.0139 0.0213 0.0181 0.0139

AIR QUALITY ANNUAL REPORT 2019
B18
Detroit-SW, (W Fort St., N. Delray-SWHS) (261630015), Speciated PM2.5 (µg/m3)
Chemical Name Num Obs Obs > MDL
Average (ND=0)
Average (ND=MDL/2) MDL Max 1 Max 2 Max 3
Aluminum Pm2.5 Lc 59 47 0.0402 0.0402 0.023 0.254 0.24 0.141
Ammonium Ion Pm2.5 Lc 59 59 0.552 0.552 0.0129 4.2 2.32 2.31
Antimony Pm2.5 Lc 59 38 0.0068 0.0068 0.0159 0.0329 0.0325 0.0323
Arsenic Pm2.5 Lc 59 18 1.42E-05 1.76E-05 0.0001 0.00022 0.00007 0.00006
Barium Pm2.5 Lc 59 38 0.0108 0.0108 0.0284 0.0572 0.0477 0.0373
Bromine Pm2.5 Lc 59 28 0.000913 0.000957 0.000136 0.00513 0.00448 0.00418
Cadmium Pm2.5 Lc 59 32 0.00382 0.00382 0.0137 0.0215 0.0187 0.0177
Calcium Pm2.5 Lc 59 59 0.204 0.204 0.00984 1.87 1.55 1.35
Cerium Pm2.5 Lc 59 32 0.00873 0.00873 0.0362 0.0527 0.0333 0.0321
Cesium Pm2.5 Lc 59 31 0.00816 0.00816 0.0271 0.0596 0.0355 0.032
Chloride Pm2.5 Lc 59 59 0.198 0.198 0.0254 1.48 1.04 0.928
Chlorine Pm2.5 Lc 59 54 0.0285 0.0285 0.00391 0.561 0.157 0.136
Chromium Pm2.5 Lc 59 42 0.00171 0.00173 0.00229 0.0139 0.00851 0.0078
Cobalt Pm2.5 Lc 59 18 0.000167 0.000178 0.00158 0.00136 0.00116 0.00113
Copper Pm2.5 Lc 59 59 0.0123 0.0123 0.00423 0.0658 0.0288 0.0277
Ec Csn_Rev Unadjusted Pm2.5 Lc Tot 58 58 0.526 0.526 0.00032 1.19 1.12 1.11
Indium Pm2.5 Lc 59 35 0.00463 0.00463 0.0148 0.0229 0.0163 0.0162
Iron Pm2.5 Lc 59 59 0.133 0.133 0.00846 0.627 0.535 0.411
Lead Pm2.5 Lc 59 49 0.00558 0.00558 0.0066 0.0255 0.0214 0.0203
Magnesium Pm2.5 Lc 59 37 0.0266 0.0295 0.045 0.223 0.223 0.12
Manganese Pm2.5 Lc 59 49 0.00476 0.00476 0.00298 0.0249 0.0245 0.0204
Nickel Pm2.5 Lc 59 44 0.000964 0.000964 0.00122 0.00654 0.00385 0.00286
Oc Csn_Rev Unadjusted Pm2.5 Lc Tot 58 58 2.26 2.26 0.644 4.92 4.38 4.32
Phosphorus Pm2.5 Lc 59 54 0.000357 0.000409 0.00196 0.00577 0.00375 0.00206

AIR QUALITY ANNUAL REPORT 2019
B19
Chemical Name Num Obs Obs > MDL
Average (ND=0)
Average (ND=MDL/2) MDL Max 1 Max 2 Max 3
Potassium Ion Pm2.5 Lc 59 59 0.0374 0.0374 0.0129 0.214 0.168 0.135
Potassium Pm2.5 Lc 59 59 0.0658 0.0658 0.00541 0.379 0.19 0.189
Rubidium Pm2.5 Lc 59 29 0.000877 0.000877 0.00316 0.00558 0.00504 0.00461
Selenium Pm2.5 Lc 59 39 0.00114 0.00114 0.00244 0.00553 0.00482 0.00453
Silicon Pm2.5 Lc 59 59 0.129 0.129 0.0136 0.92 0.916 0.522
Silver Pm2.5 Lc 59 29 0.00362 0.00362 0.0128 0.0216 0.0159 0.0146
Sodium Ion Pm2.5 Lc 59 59 0.0279 0.0279 0.0141 0.125 0.0839 0.0709
Sodium Pm2.5 Lc 59 42 0.0426 0.0426 0.0803 0.42 0.171 0.163
Strontium Pm2.5 Lc 59 37 0.00191 0.00191 0.00292 0.0109 0.00845 0.00778
Sulfate Pm2.5 Lc 59 59 1.11 1.11 0.0294 2.91 2.43 2.29
Sulfur Pm2.5 Lc 59 59 0.401 0.401 0.00105 1.01 0.988 0.925
Tin Pm2.5 Lc 59 35 0.00486 0.00486 0.0156 0.0311 0.0199 0.0192
Titanium Pm2.5 Lc 59 47 0.00399 0.00399 0.00292 0.0258 0.0209 0.0117
Total Nitrate Pm2.5 Lc 59 59 1.37 1.37 0.0385 11.6 6.67 6.18
Vanadium Pm2.5 Lc 59 29 0.000383 0.000573 0.000718 0.00234 0.00177 0.00151
Zinc Pm2.5 Lc 59 59 0.0201 0.0201 0.00172 0.0995 0.0646 0.0638
Zirconium Pm2.5 Lc 59 30 0.00324 0.00324 0.014 0.0172 0.0142 0.0141

AIR QUALITY ANNUAL REPORT 2019
B20
Grand Rapids (260810020), Speciated PM2.5 (µg/m3)
Chemical Name Num Obs
Obs > MDL
Average (ND=0)
Average (ND=MDL/2) MDL Max 1 Max 2 Max 3
Aluminum Pm2.5 Lc 121 66 0.0146 0.0146 0.0322 0.146 0.142 0.134
Ammonium Ion Pm2.5 Lc 121 120 0.686 0.686 0.00692 4.44 4.23 3.56
Antimony Pm2.5 Lc 121 69 0.00517 0.00517 0.0388 0.0333 0.0289 0.0256
Arsenic Pm2.5 Lc 121 56 0.0000193 0.000165 0.00186 0.00011 0.00011 0.00011
Barium Pm2.5 Lc 121 71 0.0111 0.0111 0.0801 0.132 0.0759 0.0643
Bromine Pm2.5 Lc 121 27 0.000379 0.00215 0.00454 0.00651 0.00518 0.00514
Cadmium Pm2.5 Lc 121 70 0.00465 0.00465 0.0158 0.0248 0.0246 0.0242
Calcium Pm2.5 Lc 121 121 0.0298 0.0298 0.00885 0.162 0.0926 0.0876
Cerium Pm2.5 Lc 121 61 0.0119 0.0119 0.0954 0.0644 0.0593 0.0583
Cesium Pm2.5 Lc 114 65 0.00807 0.00807 0.0271 0.053 0.0373 0.0369
Chloride Pm2.5 Lc 113 113 0.116 0.116 0.0249 4.3 0.279 0.267
Chlorine Pm2.5 Lc 114 89 0.0319 0.0319 0.00389 3.04 0.242 0.0271
Chromium Pm2.5 Lc 111 81 0.00167 0.00167 0.00229 0.0172 0.0106 0.00803
Cobalt Pm2.5 Lc 111 35 0.000269 0.000269 0.00158 0.00383 0.00309 0.0024
Copper Pm2.5 Lc 111 91 0.00706 0.00706 0.0041 0.366 0.0705 0.0195
Ec Csn_Rev Unadjusted Pm2.5 Lc Tot 111 111 0.386 0.386 0.00032 1.55 1.53 1.15
Indium Pm2.5 Lc 114 64 0.00533 0.00541 0.0146 0.0237 0.0228 0.0222
Iron Pm2.5 Lc 111 111 0.0553 0.0553 0.00839 0.191 0.172 0.15
Lead Pm2.5 Lc 114 70 0.00356 0.00356 0.00659 0.0334 0.0169 0.0149
Magnesium Pm2.5 Lc 114 61 0.0275 0.0322 0.0452 1.21 0.108 0.0932
Manganese Pm2.5 Lc 114 86 0.00221 0.00221 0.00296 0.0127 0.00965 0.00842
Nickel Pm2.5 Lc 111 86 0.000768 0.000773 0.00121 0.00411 0.00348 0.00288
Oc Csn_Rev Unadjusted Pm2.5 Lc Tot 111 111 2.17 2.17 0.638 8.59 5.98 5.75
Phosphorus Pm2.5 Lc 114 101 0.000265 0.000338 0.00203 0.00679 0.00611 0.0046

AIR QUALITY ANNUAL REPORT 2019
B21
Chemical Name Num Obs
Obs > MDL
Average (ND=0)
Average (ND=MDL/2) MDL Max 1 Max 2 Max 3
Potassium Ion Pm2.5 Lc 113 113 0.173 0.173 0.0129 14.4 0.776 0.284
Potassium Pm2.5 Lc 114 114 0.166 0.166 0.00544 11.9 0.747 0.357
Rubidium Pm2.5 Lc 114 65 0.00117 0.00117 0.00317 0.00874 0.00854 0.00628
Selenium Pm2.5 Lc 114 70 0.00088 0.00088 0.00247 0.00495 0.00454 0.00406
Silicon Pm2.5 Lc 114 101 0.0376 0.0376 0.0139 0.231 0.221 0.131
Silver Pm2.5 Lc 114 69 0.00419 0.00419 0.0128 0.0259 0.0225 0.0221
Sodium Ion Pm2.5 Lc 113 112 0.0193 0.0193 0.014 0.0892 0.0844 0.0754
Sodium Pm2.5 Lc 114 82 0.0362 0.0362 0.0791 0.29 0.213 0.143
Strontium Pm2.5 Lc 114 76 0.00346 0.00346 0.00292 0.244 0.00847 0.00608
Sulfate Pm2.5 Lc 113 113 0.982 0.982 0.0292 13.1 3.57 2.5
Sulfur Pm2.5 Lc 114 114 0.331 0.331 0.00102 3.63 1.23 0.95
Tin Pm2.5 Lc 114 58 0.00498 0.00498 0.0155 0.029 0.0249 0.0236
Titanium Pm2.5 Lc 114 98 0.00387 0.00387 0.00292 0.0572 0.0199 0.0172
Total Nitrate Pm2.5 Lc 113 113 1.44 1.44 0.0388 7.89 6.65 6.26
Vanadium Pm2.5 Lc 114 25 0.000113 0.000382 0.000697 0.00346 0.00144 0.00102
Zinc Pm2.5 Lc 114 114 0.0153 0.0153 0.00173 0.416 0.0414 0.0359
Zirconium Pm2.5 Lc 114 64 0.00401 0.00401 0.014 0.027 0.0227 0.0165

AIR QUALITY ANNUAL REPORT 2020
C1
APPENDIX C - SUMMARY
Appendix C summarizes the development of the NAAQS and how compliance with these standards is determined. Also included is the variety of monitoring techniques, requirements used to ensure quality data is obtained, and a history of NAAQS changes that have occurred since the inceptions of the CAA.
National Ambient Air Quality Standards (NAAQS) Under Section 109 of the CAA, the USEPA established a primary and secondary NAAQS for each pollutant for which air quality criteria have been issued. The primary standard is designed to protect the public health with an adequate margin of safety, including the health of the most susceptible individuals in a population, such as children, the elderly, and those with chronic respiratory ailments. Factors in selecting the margin of safety for the primary standard include the nature and severity of the health effects involved and the size of the sensitive population at risk. Secondary standards are chosen to protect public welfare (personal comfort and well-being) and the environment by limiting economic damage, impacts on visibility and climate, and harmful effects on soil, water, crops, vegetation, wildlife, and buildings.
In addition, the NAAQS have various averaging times to address health impacts. Short averaging times reflect the potential for acute (immediate) effects, whereas long-term averaging times are designed to protect against chronic (long-term) effects.
NAAQS have been established for CO, Pb, NO2, PM, O3, and SO2. Table C1.1 lists the primary and secondary NAAQS, averaging time and concentration level for each criteria pollutant in effect in 2018. The concentrations are listed as parts per million (ppm), micrograms per cubic meter (µg/m3), and/or milligrams per cubic meter (mg/m3).
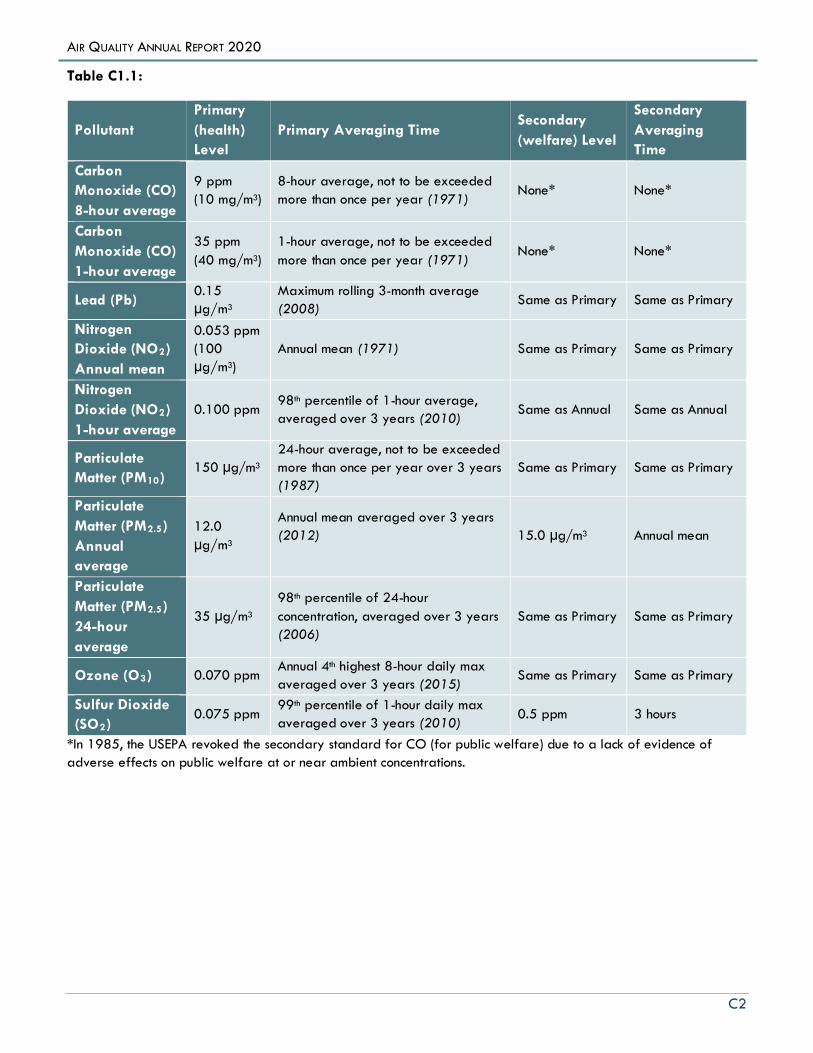
AIR QUALITY ANNUAL REPORT 2020
C2
Table C1.1:
Pollutant Primary (health) Level
Primary Averaging Time Secondary (welfare) Level
Secondary Averaging Time
Carbon Monoxide (CO) 8-hour average
9 ppm (10 mg/m3)
8-hour average, not to be exceededmore than once per year (1971)
None* None*
Carbon Monoxide (CO) 1-hour average
35 ppm (40 mg/m3)
1-hour average, not to be exceededmore than once per year (1971)
None* None*
Lead (Pb) 0.15 µg/m3
Maximum rolling 3-month average (2008)
Same as Primary Same as Primary
Nitrogen Dioxide (NO2) Annual mean
0.053 ppm (100 µg/m3)
Annual mean (1971) Same as Primary Same as Primary
Nitrogen Dioxide (NO2) 1-hour average
0.100 ppm 98th percentile of 1-hour average, averaged over 3 years (2010)
Same as Annual Same as Annual
Particulate Matter (PM10)
150 µg/m3 24-hour average, not to be exceededmore than once per year over 3 years(1987)
Same as Primary Same as Primary
Particulate Matter (PM2.5) Annual average
12.0 µg/m3
Annual mean averaged over 3 years (2012) 15.0 µg/m3 Annual mean
Particulate Matter (PM2.5) 24-houraverage
35 µg/m3 98th percentile of 24-hour concentration, averaged over 3 years (2006)
Same as Primary Same as Primary
Ozone (O3) 0.070 ppm Annual 4th highest 8-hour daily max averaged over 3 years (2015)
Same as Primary Same as Primary
Sulfur Dioxide (SO2)
0.075 ppm 99th percentile of 1-hour daily max averaged over 3 years (2010)
0.5 ppm 3 hours
*In 1985, the USEPA revoked the secondary standard for CO (for public welfare) due to a lack of evidence ofadverse effects on public welfare at or near ambient concentrations.

AIR QUALITY ANNUAL REPORT 2020
C3
To demonstrate compliance with the NAAQS, the USEPA has defined specific criteria for each pollutant, which are summarized in Table C1.2.
Table C1.2: Criteria for the Determination of Compliance with the NAAQS
Pollutant Criteria for Compliance
CO Compliance with the CO standard is met when the second highest, non-overlapping, 35 ppm, 1-hour average standard and/or the 9 ppm, 8-hour average standard is not exceeded more than once per year.
Pb Compliance with the Pb standard is met when daily values collected for three consecutive months are averaged and do not exceed the 0.15 μg/m3 standard.
NO2 Compliance is met when the annual arithmetic mean concentration does not exceed the 0.053 ppm standard and the 98th percentile* of the daily maximum 1-hour concentration averaged over 3 years does not exceed 100 ppb.
PM10 The 24-hour PM10 primary and secondary standards are met when 150 μg/m3 is not exceeded more than once per year on average over 3 years.
PM2.5
The annual PM2.5 primary and secondary standards are met when the annual arithmetic mean concentration is less than or equal to 12 μg/m3 and 15 μg/m3, respectively. The 24-hour PM2.5 primary and secondary standards are met when the 3-year average ofthe 98th percentile** 24-hour concentration is less than or equal to 35 μg/m3.
O3 The 8-hour O3 primary and secondary standards are met when the 3-year average of the 4th highest daily maximum 8-hour average concentration is less than or equal to 0.070 ppm.
SO2 To determine compliance, the 99th percentile*** 1-hour concentration averaged over a 3-year period does not exceed 0.075 ppm, and the 3-hour average concentration shallnot exceed 0.5 ppm more than once per calendar year.
*98th percentile daily maximum 1-hour value is the value below which nominally 98 percent of all daily maximum 1-hour concentration values fall, using the ranking and selection method specified in section 5.2 of appendix S of CFRPart 50.** 98th percentile is the daily value out of a year of PM2.5 monitoring data below which 98 percent of all dailyvalues fall using the ranking and selection method specified in section 4.5(a) of appendix N of CFR Part 50.*** 99th percentile daily maximum 1-hour value is the value below which nominally 99 percent of all daily maximum1-hour concentration values fall, using the ranking and selection method specified in section 5 of appendix T of CFRPart 50.As part of the USEPA’s grant to EGLE, the AQD provides an annual Network Review document14 of all monitoringdata collected from the previous year and recommendations on any network changes. These recommendations arebased on each monitor’s exceedance history, changes in population distribution, and modifications to federalmonitoring requirements under the CAA. Under the amended air monitoring regulations that began in 2007, statesare required to solicit public comment (in May of each year) on their future air monitoring network design prior tosubmitting the annual review to the USEPA in July.
14 Most recent Network Reviews

AIR QUALITY ANNUAL REPORT 2020
C4
Types of Monitors
Federal Reference Method (FRM): method of sampling and analyzing the ambient air for an air pollutant that USEPA uses as the “gold standard” for measuring that pollutant. FRM monitors are used to designate attainment/nonattainment areas. The gaseous pollutants CO, NO2, O3, and SO2 are measured with continuous FRM monitors that provide real-time hourly data. The FRM for PM and Pb requires a filter that measure concentrations over a 24-hour period. These filters must be further analyzed in a laboratory; therefore, the samples results are delayed.
Rural background monitors: measure background air quality in non-urban areas
Aethalometers: measure carbon black, a combustion by-product typical of transportation sources, by concentrating particulate on a filter tape and measuring changes in optical transmissivity and absorption.
EC/OC instruments measure elemental carbon using pyrolysis coupled with a nondispersive infrared detector to separate the elemental and organic carbon fractions.
Federal Equivalent Method (FEM): method for measuring the concentration of an air pollutant in the ambient air that has been designated as equivalent to the FRM.
Continuous Monitors: measure data in real-time, meaning concentrations of the air pollutant are usually available within an hour on the MIair website.
TEOM: tapered element oscillating monitors (TEOMs) are continuous PM monitor that is used only for real-time data indications since they are not FEMs and cannot be used for attainment/nonattainment designations.
BAM: Beta attenuation monitors (BAMs) are real-time, continuous PM2.5 monitor that is FEM, thus can be used for attainment/nonattainment designation.
T640: A continuous PM2.5 monitor that uses a light scattering technique to measure particulates. This FEM method can be used for attainment/nonattainment designation.
T640X: A continuous monitor that measures PM2.5, PM10 and PM coarse that uses a light scattering technique to measure particulates. This FEM method can be used for attainment/nonattainment designation.
PM2.5 FRM Monitoring: The concentrations of PM2.5 measured over a 24-hour time period are determined using the filter-based gravimetric FRM. Data generated by the FRM monitors are used for comparisons to the NAAQS in Michigan. The sites are located in urban, commercial, and residential areas where people are exposed to PM2.5.
Chemical Speciation Monitoring: Speciated monitoring provides a better understanding of the chemical composition of PM2.5 material and better characterizes background levels. Single event Met-One Speciation Air Sampling System (SASS) monitors are used throughout Michigan’s speciation network.
National Air Toxics Trend Station (NATTS): Network developed to fulfill the need for long-term hazardous air pollutants (HAPs) monitoring data of consistent quality. Among the principal objectives are assessing trends and emission reduction program effectiveness, assessing and verifying air quality models.
NCore Network: Began January 1, 2011, as part of the USEPA’s 2006 amended air monitoring requirements. National Core (NCore) sites provide a full suite of measurements at one location. NCore

AIR QUALITY ANNUAL REPORT 2020
C5
stations collect the following measurements: ozone, SO2 (trace), CO (trace), NOY (reactive oxides of nitrogen), PM2.5 FRM, continuous PM2.5, speciated PM2.5, wind speed, wind direction, relative humidity, and ambient temperature. In addition, filter-based measurements are required for PM coarse (PM10-2.5) on a once every three-day sampling frequency. This information will support scientific studies ranging across technological, health, and atmospheric process disciplines. Michigan has two NCore sites; Allen Park and Grand Rapids.
Near-road Monitoring Network: Focuses on vehicle emissions and how they disperse near-roadways, was approved by USEPA in 2011. This network, now referred to as the near-roadway network, is focused on high traffic urban roads in Core-Based Statistical Areas (CBSAs) with more than one million people.
Population-Oriented Monitors: Monitors that are located in an area where many people live, also considered ambient air.
Transport monitors: Measure air pollutants that that have travelled a distance from the emission sources and are formed in the atmosphere when certain pollutants are present, like ozone.
Source-Oriented/Point-Source Monitors: Monitors that are located near a specific emissions source (e.g., factory) of a pollutant.
Primary Monitor: Data from these monitors are used to compare to the NAAQS and must meet quality assurance criteria.
Secondary/Precision/Collocated Monitor: Two or more air samplers, analyzers, or other instruments that are operated simultaneously while located side by side. These are used for quality assurance purposes.
Urban Scale Monitors: Measures air pollution concentrations in more populated urban areas.
Quality Assurance The AQD’s Air Monitoring Unit (AMU) ensures that all data collected and reported is of high quality and meets federal requirements. The AMU has a quality system in place that includes a Quality Assurance Project Plan (QAPP), standard operating procedures (SOPs), standardized forms and documentation policies, and a robust audit and assessment program.
The monitoring network adheres to the requirements in Title 40 of the Code of Federal Regulations (CFR), Parts 50, 53, and 58. This ensures that the monitors are correctly sited, operated in accordance with the Federal Reference Methods, and adhere to the quality assurance requirements.
Quality assurance checks are conducted by site operators at the frequencies required in the regulations and unit procedures. Independent audits are conducted by the AMU’s Quality Assurance (QA) Team, which has a separate reporting line of supervision. The quality assurance checks and audits are reported to the USEPA each quarter.
External audits are conducted annually by the USEPA. The USEPA conducts Performance Evaluation Program (PEP) audits for PM2.5 samplers and the National Performance Audit Program (NPAP) checks for the gaseous monitors. The USEPA also conducts program-wide Technical Systems Audits (TSAs) every three years to evaluate overall program operations and assess adequacy of documentation and records retention. External audits are also conducted on the laboratory operations for certain analytical techniques using performance evaluation samples.

AIR QUALITY ANNUAL REPORT 2020
C6
Historical NAAQS Changes
CO 1971 1-hour: Second highest average does not exceed 35 in a year
8-hour: Second highest average does not exceed 9 ppm in a year.
Lead 1978 Calendar quarter values averaged does not exceed 1.5 µg/m3
2008 3-month values averaged does not exceed 0.15 µg/m3
NO2 1971 Annual average of 53 ppb or less 2010 98th percentile of the 1-hour concentration averaged over 3 yrs. is 100 ppb or less
Ozone 1971 Total photochemical oxidants: 1-hour max of 0.08 ppm not exceeded once per yr 1979 1-hour: 1-hour maximum concentration is 0.12 ppm one or less hour per yr 1997 8-hour: 4th highest daily maximum 8-hour concentration averaged over 3 yrs. is 0.08 ppm or less 2008 8-hour: 4th highest daily maximum 8-hour concentration averaged over 3 yrs. is 0.075 ppm or less 2015 8-hour: 4th highest daily maximum 8-hour concentration averaged over 3 yrs. is 0.070 ppm or less
PM 1971 TSP: 24-hour average not to exceed 260 µg/m3 more than once per yr
Annual geometric mean of 75 µg/m3
1987 PM10: Indicator for PM changed from TSP to PM10 24-hour average not to exceed 150 µg/m3 more than once per yr over a 3-yr periodAnnual mean of 50 µg/m3 or less average over 3 yrs.
1997 PM2.5: Annual mean of 15.0 µg/m3 or less average over 3 yrs. 98th percentile of 24-hour average of 65 µg/m3 or less averaged over 3 yrs.
2006 PM10: Annual average revoked 24-hour average retained
PM2.5: Annual mean retained 98th percentile of 24-hour average of 35 µg/m3 or less averaged over 3 yrs.
2012 PM2.5: Annual mean of 12.0 µg/m3 or less average over 3 yrs.
SO2
1971 24-Hour concentration of 0.14 ppm not exceeded more than once per year Annual average of 0.03 ppm or less.
2010 1-hour average of 99th percentile is 75 ppb or less, averaged over 3 yrs. Previous standards revoked

AIR QUALITY ANNUAL REPORT 2020
D1
APPENDIX D: ACRONYMS AND THEIR DEFINITIONS
> ........................ Greater than < ........................ Less than ≥ ........................ Greater than or equal to ≤ ........................ Less than or equal to %........................ Percent µg/m3 ............... Micrograms per cubic meter µm ...................... Micrometer AIRS ID .............. Aerometric Information Retrieval System Identification Number AMU .................. Air Monitoring Unit AQD .................. Air Quality Division AQES................. Air Quality Evaluation Section AQI .................... Air Quality Index AQS ................... Air Quality System (EPA air monitoring data archive) As ....................... Arsenic BAM ................... Beta Attenuation Monitor (hourly PM2.5 measurement monitor) BC ...................... Black Carbon BTEX .................. Benzene, Toluene, Ethylbenzene and Xylene CAA ................... Clean Air Act CBSA ................. Core-Based Statistical Area Cd ...................... Cadmium CFR .................... Code of Federal Regulations CO ..................... Carbon monoxide CSA ................... Consolidated Statistical Area DW .................... Downwind EC/OC .............. Elemental carbon/Organic carbon EGLE .................. Michigan Department of Environment, Great Lakes and Energy FDMS................. Filter Dynamic Measurement System FEM .................... Federal Equivalent Method FIA...................... Family Independence Agency FR ....................... Federal Register FRM ................... Federal Reference Method GHIB.................. Gordie Howe International Bridge HAP ................... Hazardous Air Pollutant hr ........................ Hour Lc ........................ Local Conditions

AIR QUALITY ANNUAL REPORT 2020
D2
MASN ............... Michigan Air Sampling Network MDL ................... Method Detection Limit mg/m3 .............. Milligrams per meter cubed MI ....................... Michigan MiSA.................. Micropolitan Statistical Area Mn ...................... Manganese MSA ................... Metropolitan Statistical Area NAAQS............. National Ambient Air Quality Standard NAMS ............... National Air Monitoring Station NATTS ............... National Air Toxics Trend Sites NCore ............... National Core Monitoring Sites ND...................... Non-detect NEI ..................... National Emission Inventory Ni ....................... Nickel NMH 48217 ... New Mount Hermon 48217 ZIP code monitoring site NO ..................... Nitric Oxide NO2................... Nitrogen Dioxide NOX................... Oxides of Nitrogen NOY................... Oxides of Nitrogen + nitric acid + organic and inorganic nitrates NPAP ................. National Performance Audit Program NR ...................... Near Road O3 ...................... Ozone Obs/OBS ......... Observations PAMS ................ Photochemical Assessment Monitoring Station PAH ................... Polynuclear Aromatic Hydrocarbon Pb....................... Lead PBT ..................... Persistent, Bioaccumulative and Toxic PCB .................... Polychlorinated Biphenyls PEP ..................... Performance Evaluation Program PM...................... Particulate Matter PM2.5 ................. Particulate Matter with an aerodynamic diameter less than or equal to 2.5 microns PM10.................. Particulate Matter with a diameter of 10 microns or less PM10-2.5 ............ Coarse PM equal to the concentration difference between PM10 and PM2.5 PNA ................... Polynuclear Aromatic Hydrocarbons POC ................... Parameter Occurrence Code ppb .................... Parts Per Billion ppm ................... Parts Per Million = mg/kg, mg/L, µg/g (1 ppm = 1,000 ppb) QA ..................... Quality Assurance QAPP ................ Quality Assurance Project Plan

AIR QUALITY ANNUAL REPORT 2020
D3
SASS.................. Speciation Air Sampling System (PM2.5 Speciation Sampler) SO2 ................... Sulfur Dioxide SOP ................... Standard Operating Procedures STN .................... Speciation Trend Network (PM2.5) Stp ..................... Standard Temperature and Pressure SVOC ................ Semi-Volatile Compound SW .................... Southwest SWHS ............... Southwestern High School TAC .................... Toxic Air Contaminant TEOM ................ Tapered element oscillating microbalance (hourly PM2.5 measurement monitor) tpy ..................... Ton per year TRI ...................... Toxic Release Inventory TSA .................... Technical Systems Audit TSP ..................... Total Suspended Particulate US ...................... United States USEPA ............... United States Environmental Protection Agency UV ...................... Ultra-violet VOC .................. Volatile Organic Compounds

AIR QUALITY ANNUAL REPORT 2020
ACKNOWLEDGMENTS
This publication was prepared utilizing information provided by the Air Quality Evaluation Section (AQES) and other staff of the Michigan Department of Environment, Great Lakes, and Energy; Air Quality Division. Copies can be obtained online at: Michigan.gov/Air, under “Monitoring,” then “Annual Air Quality Reports,” or call 517-284-6747 to request a hard copy.
AQES Manager: Tom Shanley AQES Secretary: Lorraine Hickman
Air Monitoring Unit Staff: Susan Kilmer, Supervisor Peter DeHart Steve Irrer Jason Duncan Dan Ling Marc Foreman Bryan Lomerson Eric Gafner Mark Lotoszinski Tom Gauthier Rachel Eagen Navnit Ghuman Matt Riselay David Gregory Rebecca Robak Eric Hansen Amy Robinson Cynthia Hodges, Editor
Other units within the AQES: Strategy Development Unit, BioWatch Unit, Toxics Unit, and the Emissions Reporting & Assessment Unit.
Other units in EGLE: The Environmental Support Division
The Air Quality Division also wishes to acknowledge the many significant contributions of Mitch Toonstra of the City of Grand Rapids, Air Pollution Control Division, which operates and maintains air monitoring equipment in West Michigan.
EGLE does not discriminate on the basis of race, sex, religion, age, national origin, color, marital status, disability, political beliefs, height, weight, genetic information, or sexual orientation in the administration of any of its programs or activities, and prohibits intimidation and retaliation, as required by applicable laws and regulations.
Persons with disabilities may request this material in an alternative format by contacting EGLE’s ADA Accessibility Coordinator. Please visit Michigan.gov/ADA for a list of state Coordinators.”
Michigan.gov/air

AIR QUALITY ANNUAL REPORT 2020
Air Quality Division District Office Contact Information
Cadillac District – Cadillac Office (Northwest Lower Peninsula) 120 W Chapin Street Cadillac, MI 49601-2158 231-775-3960 Fax: 231-775-4050 Counties: Benzie, Grand Traverse, Kalkaska, Lake, Leelanau, Manistee, Mason, Missaukee, Osceola, and Wexford
Cadillac District - Gaylord Office (Northeast Lower Peninsula) 2100 West M-32 Gaylord, MI 49735-9282 989-731-4920 Fax: 989-731-6181
Counties: Alcona, Alpena, Antrim, Charlevoix, Cheboygan, Crawford, Emmet, Montmorency, Oscoda, Otsego, Presque Isle, and Roscommon
Detroit District (Wayne County) Cadillac Place, Suite 2-300 3058 West Grand Blvd. Detroit, MI 48202-6058 313-456-4700 Fax: 313-456-4692
Counties: Wayne
Grand Rapids District (Central West Michigan) 350 Ottawa Avenue, NW Unit 10 Grand Rapids, MI 49503 616-356-0500 Fax: 616-356-0201
Counties: Barry, Ionia, Kent, Mecosta, Montcalm, Muskegon, Newaygo, Oceana, and Ottawa
Jackson District (South Central Michigan) State Office Building, 4th Floor 301 E Louis B Glick Highway Jackson, MI 49201-1556 517-780-7690 Fax: 517-780-7855
Counties: Hillsdale, Jackson, Lenawee, Monroe, and Washtenaw
Kalamazoo District (Southwest Michigan) 7953 Adobe Road Kalamazoo, MI 49009-5026 269-567-3500 Fax: 269-567-3555 Counties: Allegan, Berrien, Branch, Calhoun, Cass, Kalamazoo, St. Joseph, and Van Buren
Lansing District (Central Michigan) P.O. Box 30242 Constitution Hall, 525 W. Allegan St., 1 South Lansing, MI 48909-7760 517-284-6651 Fax: 517-241-3571
Counties: Clinton, Eaton, Genesee, Gratiot, Ingham, Lapeer, Livingston, and Shiawassee
Bay City District (Central East Michigan) 401 Ketchum Street, Suite B Bay City, MI 48708 989-894-6200 Fax: 989-891-9237
Counties: Arenac, Bay, Clare, Gladwin, Huron, Iosco, Isabella, Midland, Ogemaw, Saginaw, Sanilac, and Tuscola
Warren District (Southeast Michigan) 27700 Donald Court Warren, MI 48092-2793 586-753-3700 Fax: 586-753-3731
Counties: Macomb, Oakland, and St. Clair
Marquette District (Entire Upper Peninsula) 1504 West Washington Street Marquette, MI 49855 906-228-4853 Fax: 906-228-4940
Counties: All counties in the Upper Peninsula