Air Pollution Sensor Technology- US EPA Activities Maine tribes and DEP 2014.pdfAir Pollution Sensor...
37
Air Pollution Sensor Technology- US EPA Activities Maine Tribes and Maine DEP Air Monitoring Meeting Augusta, ME March 26, 2014 Bob Judge US EPA- New England 1 “Mention of trade names or commercial products does not constitute endorsement recommendation for use”
Transcript of Air Pollution Sensor Technology- US EPA Activities Maine tribes and DEP 2014.pdfAir Pollution Sensor...
Air Pollution Sensor Technology-
US EPA ActivitiesMaine Tribes and Maine DEP Air Monitoring Meeting
Augusta, ME
March 26, 2014
Bob Judge
US EPA- New England
1
“Mention of trade names or commercial
products does not constitute endorsement
recommendation for use”

Current Air Monitoring
2
In the Ambient Air for
Regulatory Compliance, to Track Trends, and for Public
Information
Personal
Exposure and Health
Monitoring
In Communities to Assess
Exposure
Expensive instruments
Specialized training requiredLarge physical footprint
Large power draw
Why
How
Near or within Sources
for Regulatory Compliance
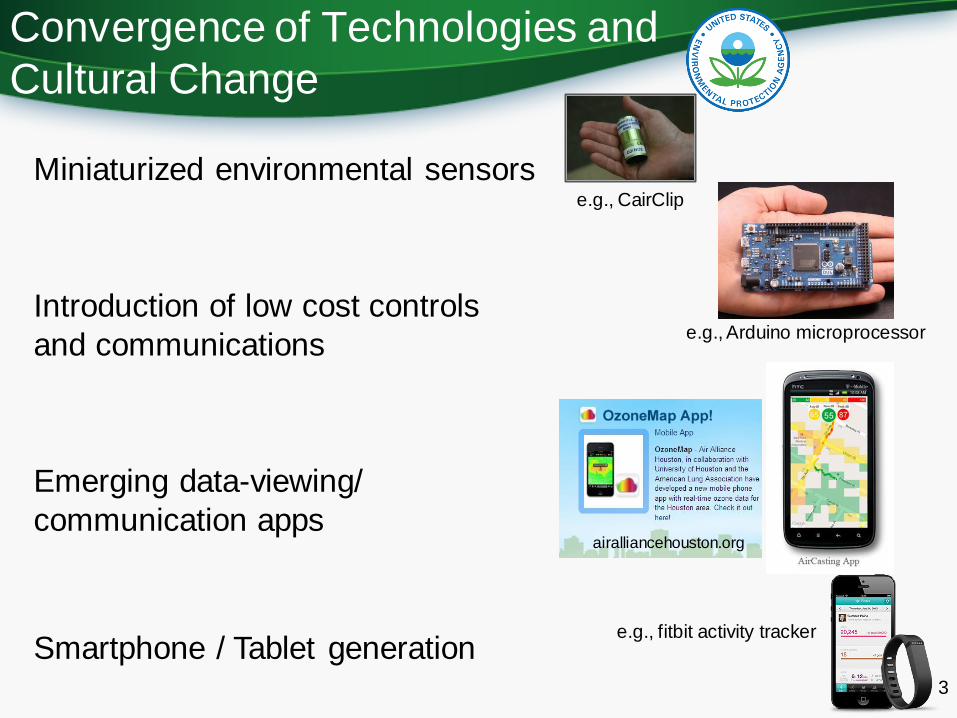
Convergence of Technologies and
Cultural Change
3
Smartphone / Tablet generation
Miniaturized environmental sensors
e.g., fitbit activity tracker
Introduction of low cost controls
and communicationse.g., Arduino microprocessor
Emerging data-viewing/
communication apps airalliancehouston.org
e.g., CairClip

The Changing
Paradigm of Air
Monitoring
Snyder et al, ES&T, 2013
Accepted
4

The Role of Sensor Technology in
the Changing Paradigm
5
How data is
collected?
Who
Collects the data?
How data is
accessed?
Limited Mostly to
Governments,
Industry, and
Researchers
Government
Websites, Permit
Records, Research
Databases
Compliance
Monitoring,
Enforcement,
Trends, Research
Why data is
collected?
Expanded Use by
Communities and
Individuals
Increased Data
Availability and
Access
New Applications
and Enhancement
of Existing
Applications
Sensor
Technology
Snyder et al., 2013

Next Generation Air Monitoring (NGAM):
A Challenge and an Opportunity
• Federal/State/Local governments need to prepare for data deluge and
responses to concerned citizens
– What’s the quality of the data?
– How to interpret data from sensors’ short term measurements from
a public health perspective?
• Federal/State/Local governments will also have new sources of data to
better manage air quality and protect public health
• EPA is engaging with the early adopters and developers of these
sensors to help ensure this technology is used in a fashion that is
appropriate and most useful to us as regulators and to communities and the public.
• EPA ORD is very active is this area.
EPA- New England is engaged with ORD.6

Next Generation Air Monitoring
Research at EPA
• Community Monitoring Applications
• Source Monitoring Applications
– Facility Fence Line and Sensor Networks
– Geospatial Mapping of Air Pollution (GMAP)
• Evaluating Sensor Technology and Regulatory Considerations
– Ozone, NO2, PM, and VOCs
7
CairClip(O3 & NO2)
Community Monitoring
Applications
8
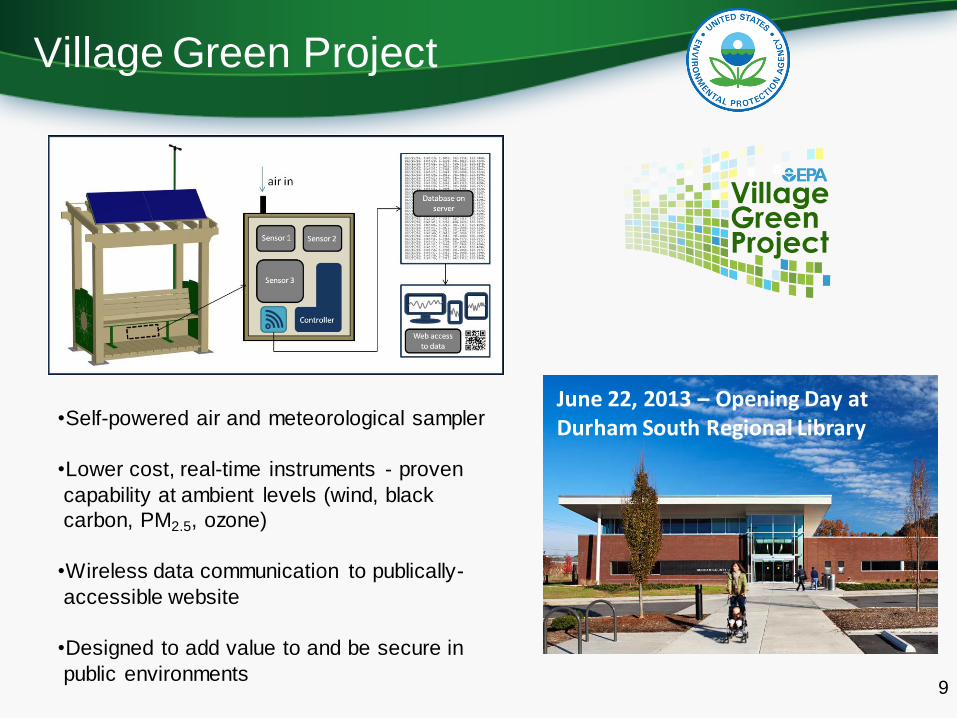
Village Green Project
9
•Self-powered air and meteorological sampler
•Lower cost, real-time instruments - proven
capability at ambient levels (wind, black
carbon, PM2.5, ozone)
•Wireless data communication to publically-
accessible website
•Designed to add value to and be secure in
public environments
June 22, 2013 – Opening Day at Durham South Regional Library

Website – minute-by-minute updates
villagegreen.epa.gov
Educational and
community outreach
opportunity

Source Monitoring Applications
11

New Opportunities for Source Oriented
Monitoring
12
Mid-range Sensors and Remote Measurements
Facility Fenceline Monitoring
Mobile inspection approaches
3 units in the field
SECONDARY
MIRROR
PRIMARY
MIRROR
SEALED UV
WINDOW
BEAM
SPLITTER
DETECTORS
FOCUSING
LENS
Low cost remote sensing
Advanced LDAR and fugitive strategies • In-plant sensor networks• IR camera protocols• Passive samplers

Monitoring Fugitive and Area
Sources
13Source: Microsoft Bing Maps (© Microsoft Corporation Pictometry Bird’s Eye ©
2010 Pictometry International Corp )
Agricultural operations, industrial fugitives, coal mining, waste water, oil and gas production, landfills,
and more
• spatially variable
• temporally variable
• large spatial extent

Open-path Instruments
14
0.2 0.5 2 5 10 (µm)0.2 0.5 2 5 10 (µm)
UV DOAS FTIRTDL FLIR
UV Diff. Optical Absorption Spectroscopy
Tunable Diode Laser (scanning)
Forward-Looking InfraRed(leak imaging)
Fourier Transform
InfraRed
(scanning)
Open-path optical
systems
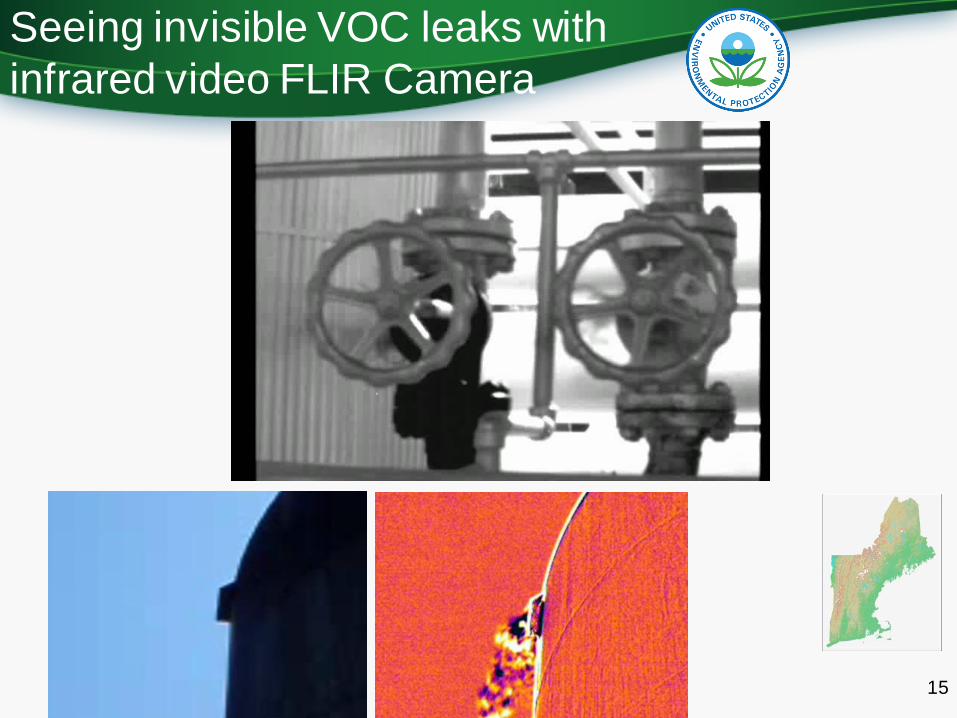
Seeing invisible VOC leaks with
infrared video FLIR Camera
15

Sensor Networks In-plant and Along
Facility Fence Line
16
Passive SamplingLow-cost sensors• Open path• Fixed monitors
Low cost Sensor
Networks

Open-path optical systems
Open-path fenceline systems to
detect emissions and direct quick
response leak detection and repair
Wind
17

Off-site assessment with GMAP-REQ(Geospatial Measurement of Air Pollution – Remote Emissions Quantification)
driving path
wind direction
Spike in CH4 indicates emission
CH4
Mobile Inspection
systems
18

Evaluating Lower Cost Sensor
Technology and Regulatory
Considerations
19

Current work
• Under EPA’s Air Sensors Evaluation Project the following are being determined for lower-cost O3and NO2 sensors: – Linearity (range)
– Precision of measurements
– Lower detectable limit
– Resolution (noise)
– Response time (lag and rise time)
– RH and temperature influence
– Interference equivalent
CairClip electrochemical
sensor evaluated under the
Air Sensors Project
-Findings for ozone and NO2 will
be released late summer.

Evaluating Personal Sensors
21
CairClip electrochemical
sensor evaluated under the
Air Sensors Project
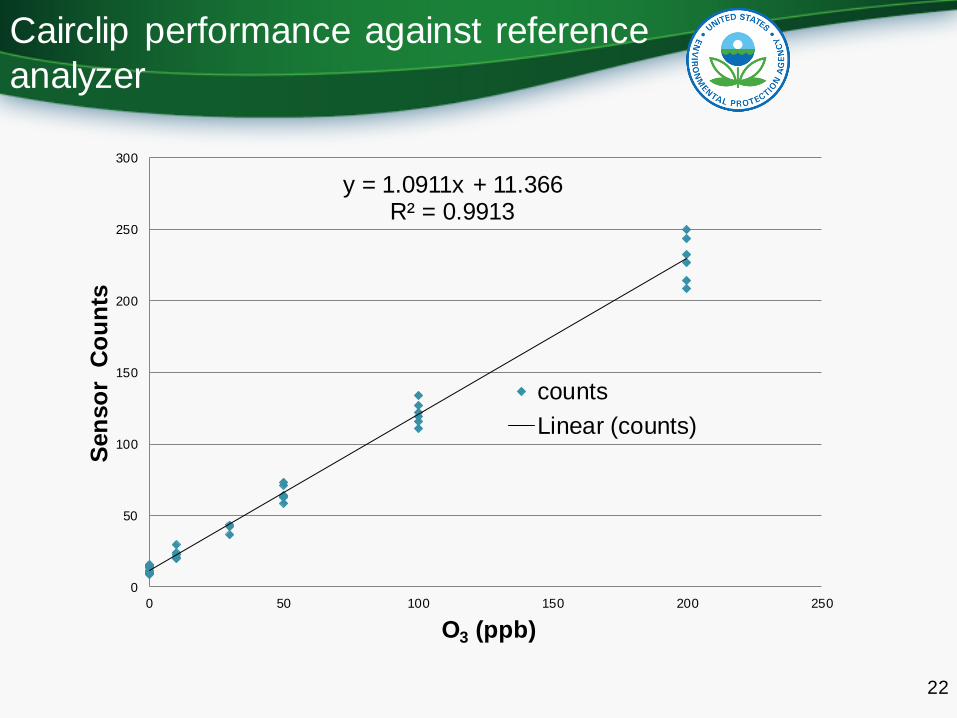
y = 1.0911x + 11.366R² = 0.9913
0
50
100
150
200
250
300
0 50 100 150 200 250
Sen
so
r C
ou
nts
O3 (ppb)
counts
Linear (counts)
Cairclip performance against reference
analyzer
22

New Sensor Research in EPA ORD
• A host of low cost (<$2500) PM2.5 and VOC sensors purchased or acquired
for laboratory and/or field evaluation by EPA- ORD
• PM Sensors include: RTI µPEM, Dylos, Met One 831, Carnegie-Mellon
Speck, Carpol PM; AirBase; EcoPM
• VOC Sensors include: AirBase; Sensaris EcoSense; Cairpol VOC, Unitec,
APPCD, Sensotran, ToxRAE
• Research involves collaborations with NRMRL (Triple Oaks site) and
OAQPS (AIRS) to leverage reference monitor collocation. Field work still
being completed for VOC.

Sensor Evaluation in Collaboration with
NASA (Houston, TX Sept 2013)
• EPA deploying sensor technology (CairClip)
for NO2 and O3 that performed well during
the EPA Sensor Evaluation Open House.
• NASA deploying sensor technology
(Geotech AQMesh-5) to measure O3, NO,
NO2, CO, SO2.
• Sampling with sensors will be used to evaluate air craft and remote measurements
as well as air quality models.
• Provides EPA with additional insights and
experience with the use of sensor technologies in the field for future
applications.24
CairClip
Geotech AQMesh-5

Ongoing and Future EPA Sensor
Evaluation Activities
• Results for ozone and NO2 sensors will be
released late summer.
• PM and VOC Sensor Evaluations
– A host of low cost (<$2500) PM2.5 and VOC sensors
purchased or acquired for laboratory and/or field evaluation
– Field work to be completed soon.
– Results available fall, 2014
• Advanced sensor related project in EPA Region 4
comparing some of these lower cost sensors to
NCore (FRM/ FEM) site
25
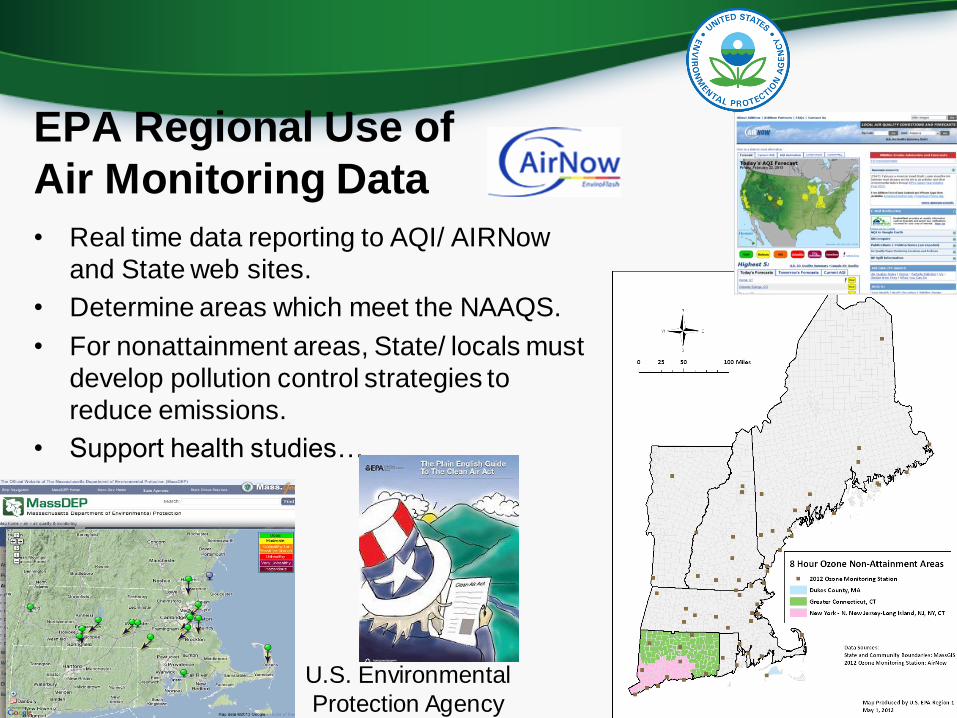
EPA Regional Use of
Air Monitoring Data
• Real time data reporting to AQI/ AIRNow
and State web sites.
• Determine areas which meet the NAAQS.
• For nonattainment areas, State/ locals must
develop pollution control strategies to
reduce emissions.
• Support health studies…
3/20/2014 U.S. Environmental
Protection Agency26

So why not use the “egg”?
• Could we use a
simpler, less
expensive device
than we currently
use to measure
pollutants to
make decisions?
3/20/2014 U.S. Environmental Protection Agency27
“The Air Quality Egg is a sensor system designed to allow anyone to collect very high
resolution readings of NO2 and CO concentrations outside of their home. These two gases
are the most indicative elements related to urban air pollution that are sense-able by
inexpensive, DIY sensors”– Air Quality Egg Website

The concept of cheaper, simplified air
quality measurements is not “new”
• Depicted is a
1940’s vintage
ozone monitor-
with its “detector”
- a rubber band…
3/20/2014 U.S. Environmental Protection Agency28

So why did we develop more
complicated measurement devices?
• Quality Assurance/
Quality Control
• DQOs (data quality
objectives)
• Data completeness,
precision, bias and
overall accuracy
• Audits
3/20/201429

We need unbiased and precise
measurements…
3/20/2014 U.S. Environmental Protection Agency30

This is where we’d like to be….accurate!
• EPA established
FRMs and FEMs
to ensure
consistency…
3/20/2014 U.S. Environmental
Protection Agency31

Monitoring in New England
32Narragansett, RI
McFarland Hill, Acadia
NP Bar Harbor, ME
Bridgeport, CT
How does
your monitor
compare to
other
measurements?

What can be done to make these low cost monitors useful to the regulatory community?
• EPA- ORD “evaluation” of reliability of measurement. Is it…
– FEM/ FRM quality? http://www.twobtech.com/model_202.htm
– Very good, but not FEM?
– Adequate for “personal exposure” assessment (+/- 30%, or better/lower? )?
– “Junk”?
• How prone is it to operator error, especially with multiple operators?
• Operation and maintenance (SOPs)
• Instrument calibration needs
• QA/ QC issues and questions- what type of quality procedures do you need
to have in place?
3/20/2014 U.S. Environmental Protection Agency33

How can data* from these low cost monitors be useful to the regulatory
community?
3/20/2014 U.S. Environmental Protection Agency34
• A screening tool, to identify a problem area/ “hot spots”
• Personal exposure, health risks
• General environmental awareness
• Emergency planning for air toxics/ superfund
• Helping S/L with siting new monitors?
*Monitor must be operated consistent within its limitations,
and in accordance with its operating manual.
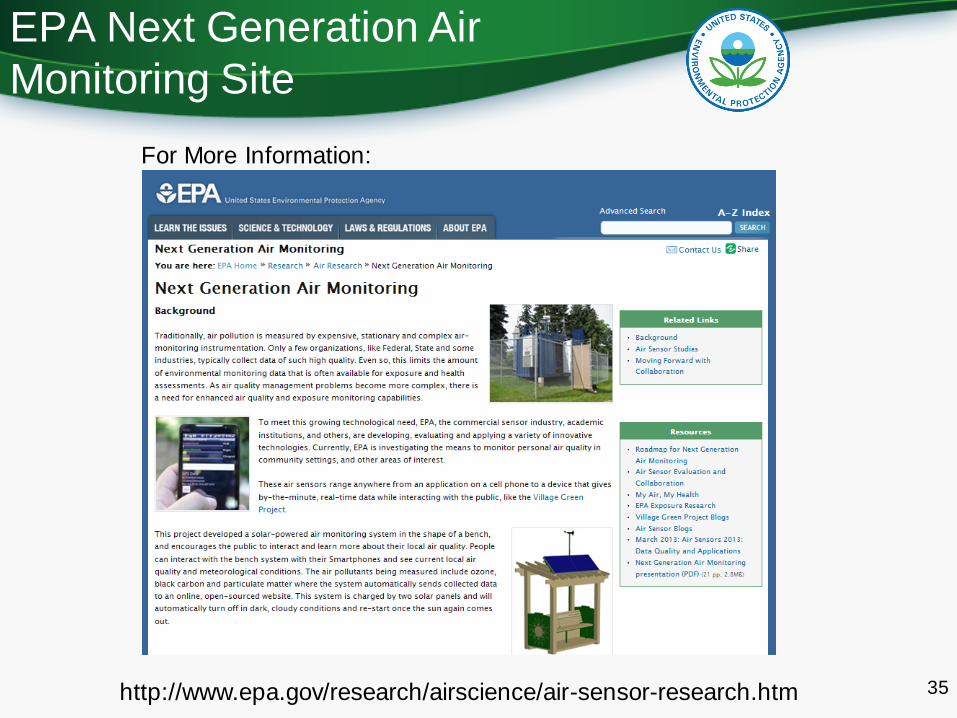
EPA Next Generation Air
Monitoring Site
35http://www.epa.gov/research/airscience/air-sensor-research.htm
For More Information:

Acknowledgements
36
EPA Office of Research and Development: Ron Williams, Russell
Long, Emily Snyder, Eben Thoma, Bill Mitchell, Brian Gullett, Stacey Katz,
Gail Robarge, Rachel Duvall, Tim Watkins
EPA Office of Air Quality Planning and Standards: David Shelow