Types of pollution are- 1.Air Pollution. 2.Water Pollution. 3.Noise Pollution. 4.Land Pollution.
Upload
ayush-dixitCategory
view
222download
0
8/3/2019 Air Pollution Noise (1)Fgsdffdsfdfsdds
http://slidepdf.com/reader/full/air-pollution-noise-1fgsdffdsfdfsdds 1/15
POLLUTION
Pollution is the introduction of contaminants into a natural environment that causes
instability, disorder, harm or discomfort to the ecosystem i.e. physical systems or livingorganisms. Pollution can take the form of chemical substances or energy, such as noise,heat or light. Pollutants, the components of pollution, can be either foreign
substances/energies or naturally occurring contaminants. Pollution is often classed
as point source or nonpoint source pollution. The Blacksmith Institute issues an annuallist of the world's worst polluted places. In the 2007 issues the ten top nominees are
located in Azerbaijan, China, India, Peru, Russia, Ukraine andZambia.

8/3/2019 Air Pollution Noise (1)Fgsdffdsfdfsdds
http://slidepdf.com/reader/full/air-pollution-noise-1fgsdffdsfdfsdds 2/15
Types of PollutionThere are many types of pollution that exists; some of them have been covered in the text
below:
Air Pollution:
When the presence of one or more contaminants in the atmosphere is of such quality and
duration as it is injurious to human, animal and plant health or welfare, it is termed as Air
pollution. Air pollution can lead to health problems and at the same time damage the
environment and get property into losses. One of the worst effects of Air pollution is that
it has led to thinning of the ozone layer of the atmosphere, which is leading to an adverse
climate change that we see today.
As urbanization increases, construction work takes shape on a wider scale; illegaldumping and air pollution is a consequence of it. Industries and commercial units
evacuate harmful gases in the air and so does the ever increasing traffic. On top of it, dust
storms and smoke from accidents like forest or oil refineries fires contribute to air
pollution too.
Waste and Water pollution:
When illegal dumps that are toxic in nature enter lakes, streams, rivers, oceans, and other
water bodies, they either get dissolved or lie hovering in water or get deposited on the
bed. This results in water pollution deteriorating the quality of the water and affecting our
aquatic ecosystems. Lots of industrial units and factories today dump their garbage intostreams, lakes and river thus making all these water bodies the final destination of cans,
bottles and plastics.
Most of today’s cleaning products are synthetic detergents and are an extract of the
petrochemical industry. These impact the health of all forms of life in the water. Polluted
water is a hazard, unsafe and also a poison for drinking, recreation and agriculture. More
fatally, unhygienic water destroys water life and diminishes its reproductive ability.
Sound Pollution:
Any unwanted sound is Noise pollution. However, Man made noises that occur from
machines, trains, planes, firecrackers etc are extremely litigious. All these kind of noises
affect are mental being, peace, sleep, hearing, communication and our overall mental and
physical health. The noise levels are increasing with increasing urbanization and
development. Noise from construction work, industries, factories, traffic jams are all
leading to noise pollution at uncontrollable levels. Noise pollution is not only a source of
irritation, frustration and infuriation but also tightens our arteries and increases the flow

8/3/2019 Air Pollution Noise (1)Fgsdffdsfdfsdds
http://slidepdf.com/reader/full/air-pollution-noise-1fgsdffdsfdfsdds 3/15
of adrenaline forcing the heart to work faster making one prone to heart attacks and
strokes. In extreme circumstances, it may also lead to Neurosis and Nervous breakdown.
Chemical Pollution:
There are several sources of chemical pollution like sewage and run off from domestic
households, discharges from industrial units, accidents and spills at sea, discharges from
mining and oil rigs and discharges from agricultural lands and units. Constant pollutants
include pesticides, such as DDT, and industrial chemicals, most notably the PCBs.
Land Pollution:
It is the pollution of the Earth’s natural land surface by industrial, commercial, domestic
and other agricultural activities. Some of the common sources of land pollution are
Chemical and Nuclear plants, Industrial factories, Oil refineries, Human sewage, Mining,
Littering, debris from construction work and Deforestation. One of the ways to stop land
pollution is to recycle almost everything that you can.

8/3/2019 Air Pollution Noise (1)Fgsdffdsfdfsdds
http://slidepdf.com/reader/full/air-pollution-noise-1fgsdffdsfdfsdds 4/15
AIR POLLUTION & NOISE
Preamble:
To systematically address the air quality impacts of potential projects or activities,
it is necessary to be familiar with basic information regarding air pollution. Accordingly,
this section includes a definition of air pollution and information on the types and effects
of specific air pollutants, along with summary information on air pollution sources. “ Air
Pollution “ can be defined as the presence in the outdoor atmosphere of one or more
contaminants in such quantities and of such duration as may be injurious to human, plant,
or animal life, or to materials, or which may unreasonably interfere with the comfortable
enjoyment of life or property, or the conduct of business.
Sources of air Pollutants:
Air pollutant sources can be categorized from several perspectives, including the
type of source, their frequency of occurrence and spatial distribution, and the types of
emissions. Characterization by source type can be delineated as arising from naturalsources or from man-made sources. ‘ Natural Sources ‘ include plant pollens, windblown
dust, volcanic eruptions and lightning generated forest fires. ‘Man-made source’ can
include transportation vehicles, industrial processes, power plants, construction activities
and military training activities.
Source characterization according to number and spatial distribution can include such
categories as single or point sources (stationary), area or multiple sources (stationary or
mobile) and line sources. ‘Point sources’ are characteristic of pollutant emissions from
industrial process stacks, as well as fuel-combustion facility stacks. ‘Area sources’
include vehicular traffic, fugitive-dust emissions from resource material stockpiles or
construction, or military training activities over large geographical areas.

8/3/2019 Air Pollution Noise (1)Fgsdffdsfdfsdds
http://slidepdf.com/reader/full/air-pollution-noise-1fgsdffdsfdfsdds 5/15
Effects of Air Pollutants:
Air pollution effects may also be divided into several categories, with such effects
encompassing those that are health-related as well as those associated with damage to
materials or which cause decreases in atmospheric aesthetic features. Examples of
effects on human health include eye irritation, headaches and aggravation of respiratory
difficulties. Plants and crops have been subjected to undesirable consequences of air
pollution, including abnormal growth patterns, leaf discoloration or spotting and death.
Property damage include property devaluation because of odors, deterioration of
materials such as concrete statutory, discoloration of painted surfaces. The aesthetic
effects include reductions in visibility, discoloration of air, photochemical smog- related
traffic disruptions at airports and the general nuisance aspects of odors and duct.
Identification of The Types and Quantities of Air Pollutants and of
Their Impacts:
An appropriate initial step when analyzing any proposed project activity is to
consider what types of air pollutants might be emitted during construction or operational
phases of the proposed project activity, and the quantities in which such air pollutants are
expected to occur. Use of emission-factor information organized according to project
type or activity is a suggested approach. An ‘emission factor’ is the average rate at which
a pollutant is released into the atmosphere as a result of some activity, such as
combustion or industrial production, divided by the level of that activity (U.S.EPA,
1973). “Emission factors” relate the type and quantities of pollutants emitted to indicators
such as production capacity, quantity of fuel burned, or vehicle miles traveled by an
automobile.

8/3/2019 Air Pollution Noise (1)Fgsdffdsfdfsdds
http://slidepdf.com/reader/full/air-pollution-noise-1fgsdffdsfdfsdds 6/15
Description of Existing Air Quality Conditions:
Existing air quality conditions can be described in terms of ambient air quality
data, emission inventories and meteorological information, which relates to atmospheric
dispersion. For a quick assessment and prediction of any air quality survey study data on
immediate atmospheric environment, meteorological details such as temperature,
humidity, wind speed and directions are very essential, since they play an
important role in transport, dilution and dispersion of air pollutants.
Frequency and Method of Air Quality Measurements:
The present study of air quality measurement in terms air pollution concentration
has been obtained by continuous monitoring for a period of eight hours at all directions
and at the proposed project site. The annual mean wind direction pattern has been
compiled from the long-term data made available from meteorological department. The
sampling directions around the project site has been selected so as to reflect the impact of
anthropogenic activities such as emissions from transportation, generation of dust with
movement of vehicles, emissions from industrial and domestic activities. Considering
the facilities and significant impact on air quality we have selected Suspended Particulate
Matter (SPM), Sulphur dioxide (SO2), Nitrogen Oxides (Nox) and Carbon monoxide
(CO).

8/3/2019 Air Pollution Noise (1)Fgsdffdsfdfsdds
http://slidepdf.com/reader/full/air-pollution-noise-1fgsdffdsfdfsdds 7/15
OBSERVTION OF AIR POLLUTANTS AT THE PROJECT SITE
Date Direction Observation of Parameters
SO2 NOx SPM CO
25.11.2005 Core Site 1.8 4.5 43 62
26.11.2005 North 2.2 4.8 21 53
28.11.2005 South 2.1 5.1 32 45
29.11.2005 East 2.5 6.2 28 71
01.12.2005 West 1.9 6.7 35 77
03.12.2005 North East 2.0 5.4 23 68
04.12.2005 North West 2.4 5.5 27 57
06.12.2005 South East 1.8 3.8 36 49
08.12.2005 South West 2.9 4.9 38 55
17.12.2005 Core site 2.7 4.8 40 73

8/3/2019 Air Pollution Noise (1)Fgsdffdsfdfsdds
http://slidepdf.com/reader/full/air-pollution-noise-1fgsdffdsfdfsdds 8/15
OBSERVED LEVEL OF POLLUTANTS AROUND THE SITE
Date LocationParameters
SO2 NOx SPM CO
09.12.200
5
Ariyur 6.1 12.6 62 650
11.12.205 Vadamangalam 7.9 12.7 84 678
12.12.200
5
Koodapakkam 3.7 10.5 33 284
14.12.200
5
Uruvaiyar 3.0 9.8 21 198
METEOROLOGY
Effect of pollution on receptors, animate and inanimate depends on atmospheric
conditions. Therefore knowledge of meteorological characteristics in a study area is
important. Wind speed and wind direction are called primary meteorological parameters
because the dispersion and dilution of the pollutants depends mainly on these.
Wind speed determines the rate of dilution and travel time of air pollutant. Travel time is
the time required by the pollutant to reach a given receptor. Wind direction is important
in air pollution problems since it determine the direction of transport of air pollutants.
The mean wind direction over a period of time will identify the receptors which will be
affected by a particular source during that time period. In other words, the mean wind
direction will be indicative of the direction of travel of the pollutant.Wind rose are the
diagramtics representation of wind speed and wind direction for quick understands. The
windrose are drawn on the basis of three hourly data collected by the meteorological
office.

8/3/2019 Air Pollution Noise (1)Fgsdffdsfdfsdds
http://slidepdf.com/reader/full/air-pollution-noise-1fgsdffdsfdfsdds 9/15
METEOROLOGICAL OBSERVATIONS
Annual Climatological Data For Villianur
Year Temperature Relative Humidity Rainfall
Maximum Minimum 8 am 20 pm
1980
1981
1982
1983
1984
1985
1986
1987
1988
1989
1990
35.1
34
33
32.3
32.2
32.4
32.6
33.3
32.8
31.9
32.9
23.4
22.5
24.4
24.4
24.3
24.3
24.8
25
25
24.5
24.7
77.2
76.9
73.3
76.3
79.1
80.8
79.2
78.3
80.3
78.9
80.3
77
79.7
72.9
73.4
75.3
77.1
77.8
78.4
76.9
76.8
76.4
916
990
845
1902
1182
1986
684
1223
962
1103
1392

8/3/2019 Air Pollution Noise (1)Fgsdffdsfdfsdds
http://slidepdf.com/reader/full/air-pollution-noise-1fgsdffdsfdfsdds 10/15
Month-wise Climatological Data For Villianur
Month Temperature Relative Humidity Mean wind speed
Maximum Minimum 8 am 20 pm
January
February
March
April
May
June
July
August
September
October
November
December
29.3
31
22.2
33.8
34.8
37.4
35.4
33.6
34.4
31.6
30.7
30.3
21.9
23
25.1
26.9
26.3
26.7
25.4
25.7
24.1
24
24
22.8
88
82
79
75
77
80
77
79
79
81
83
84
80
79
78
73
74
70
75
78
74
77
80
79
5.7
6.2
6.6
6.2
8.8
7.6
7.5
6
4.9
5.2
5.2
8.6
PRESCRIBED STANDARDS
S.NoParameter
s
Standards (μg/cu.m)
Industrial
Residential
/
commercial
Sensitive
Area

8/3/2019 Air Pollution Noise (1)Fgsdffdsfdfsdds
http://slidepdf.com/reader/full/air-pollution-noise-1fgsdffdsfdfsdds 11/15
1 SO2 500 120 120
2 NOx 200 80 80
3 SPM 100 30 30
4 CO 10000 4000 2000
Ambient air quality monitoring refers to appropriate sampling and analysis to
establish the ambient concentrations of specific pollutants. Targeted monitoring might be
desirable in order to verify the experienced changes in air quality concentrations for those
pollutants determined to be of concern. The primary sources of information on air
quality standards, criteria and policies will be the relevant local, state and federalagencies which have a mandate for overseeing the air resources of the geographical area.
Documentation of this information will allow the determination of the significance of air
quality impacts incurred during projects or activities and will aid in deciding between
alternative actions or in assessing the need for mitigating measures for a given
alternative.
Air quality impact prediction can be based on several approaches including mass-
balances, the use of mathematical models and other considerations. Air pollutant
emissions from the construction or operational phase of a project activity can be
considered in relation to the existing emission inventory for the study area. Particular
attention should be given to releases of air toxics and the resultant comparison of
maximum ground level concentrations to appropriate ambient air quality guidelines or
standards. In conjunction with these analyses, it is important to identify prevention,
control and mitigation measures for releases of air toxics. This chapter address potential
air quality impacts identified for the project activity, the existing characteristics of the air
environment, the emission inventory and meteorological characteristics of the study area,
the applicable air quality standards and regulations, the quantification of the anticipated
air impacts due to the activity and the rationale impacts and mitigation measures.

8/3/2019 Air Pollution Noise (1)Fgsdffdsfdfsdds
http://slidepdf.com/reader/full/air-pollution-noise-1fgsdffdsfdfsdds 12/15
NOISE
Noise can be defined as unwanted sound or sound in the wrong place at wrong time. It
can also be defined as any sound that is undesirable because it interferes with speech and
hearing, is intense enough to damage hearing. The definition of noise as unwanted sound
implies that it has an adverse effect on human beings and their environment including
land, structures and domestic animals. Noise can also disturb natural wildlife and
ecological systems. The number of compressions and rarefactions of the air molecules in
a unit of time is described as its frequency and is expressed in hertz. Humans can detect
sounds with frequencies ranging about 16 to 20,000 Hz. In most noise considerations,
the “A-weighted-sound level” scale is used and the units are weighted decibels (dBA).
The weighted sound level or noise level meters have an A-weighting network, thus
yielding A-weighted dB or dBA readings.
To provide a basis for addressing noise environment impacts, the following methodology
is suggested for the planning and conduction of impact studies.
1. The first step is to determine the potential impacts of the proposed project on the
noise environment, which requires the identification of the noise levels associated
with the project.
2. In analyzing the potential impacts of a project, it is necessary to consider the
study area or region of influence associated with the noise emissions. The
delineation of a study area can be made based upon the boundaries of the land
associated with the project or by also considering the area of noise influence
within the vicinity of the project.
3. Predicting the propagation of noise from a source and determining the type of
affected land uses with the help of noise standards / policies by the state and
federal agencies which have a mandate overseeing the noise environment of the
study area.

8/3/2019 Air Pollution Noise (1)Fgsdffdsfdfsdds
http://slidepdf.com/reader/full/air-pollution-noise-1fgsdffdsfdfsdds 13/15
4. The final step is the assessment of impact significance with the identification and
incorporation of mitigation measures. Assessment refers to the interpretation of
the significance of anticipated changes related to the proposed project.
5. The important sources of noise presently in the study area are transportation,
industry like sugar, detergent etc., The Central Pollution Control Board has
notified the standards in respect of noise.
Noise Level Standard
Area Category of Area Limits in day (dB) Limits in Night
A Industrial 75 70

8/3/2019 Air Pollution Noise (1)Fgsdffdsfdfsdds
http://slidepdf.com/reader/full/air-pollution-noise-1fgsdffdsfdfsdds 14/15
B
C
D
Commercial
Residential
Silence Zone
65
55
50
55
45
40
The ambient noise level has been monitored at the project site and around the project site
at four stations namely, Ariyur, Vadamangalam, Koodapakkam and Uruvaiyaru and the
observations are given in the table which indicates that noise level are below the
standards prescribed by CPCB.
Sl.No Station Day (dB) Night (dB)
Project site
Ariyur
Vadamangalam
Tiruvandarkoil
Uruvaiyaru
Project site
Ariyur
Vadamangalam
Tiruvandarkoil
Uruvaiyaru
52
53
55
47
43
45
48
50
42
41
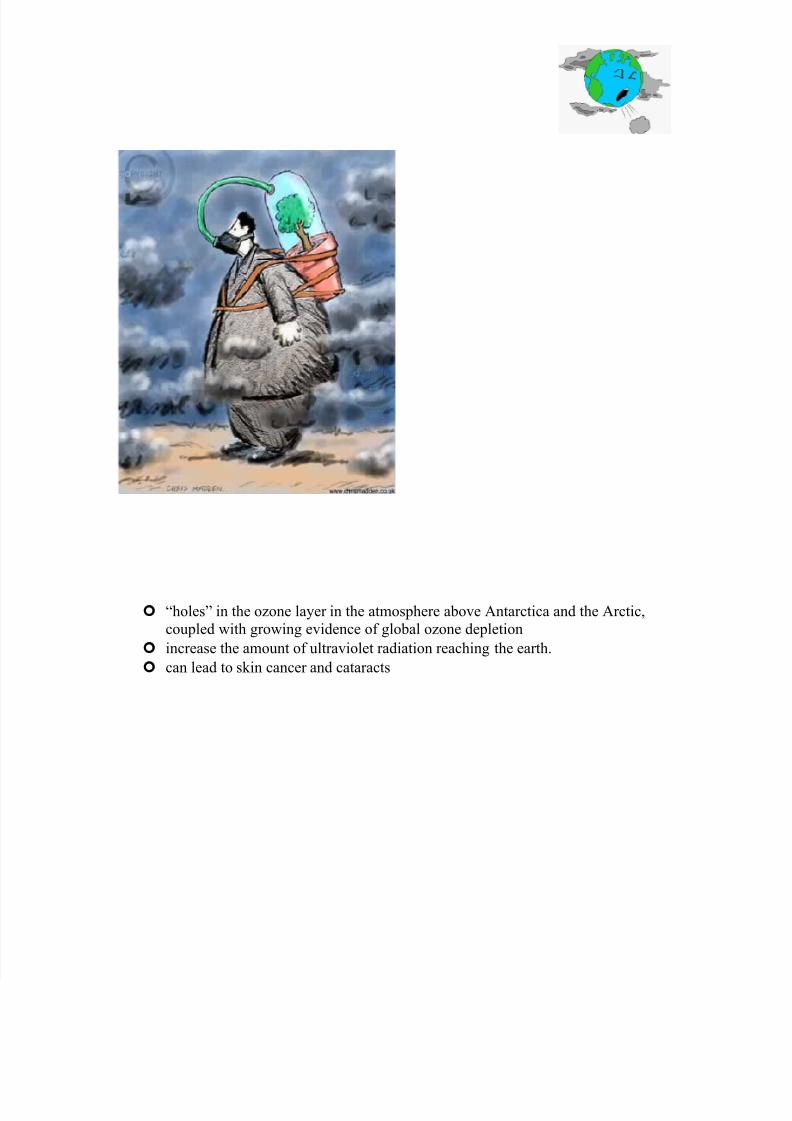
AIR POLLUTION CONCECUENCES
8/3/2019 Air Pollution Noise (1)Fgsdffdsfdfsdds
http://slidepdf.com/reader/full/air-pollution-noise-1fgsdffdsfdfsdds 15/15
“holes” in the ozone layer in the atmosphere above Antarctica and the Arctic,
coupled with growing evidence of global ozone depletion
increase the amount of ultraviolet radiation reaching the earth.
can lead to skin cancer and cataracts