AIR POLLUTION FROM GROUND TRANSPORTATION AN ...
194
AIR POLLUTION FROM GROUND TRANSPORTATION AN ASSESSMENT OF CAUSES, STRATEGIES AND TACTICS, AND PROPOSED ACTIONS FOR THE INTERNATIONAL COMMUNITY by Roger Gorham The Global Initiative on Transport Emissions A Partnership of the United Nations and the World Bank Division for Sustainable Development Department of Economic and Social Affairs United Nations 2002
Transcript of AIR POLLUTION FROM GROUND TRANSPORTATION AN ...

AIR POLLUTION FROM GROUND
TRANSPORTATION AN ASSESSMENT OF CAUSES, STRATEGIES
AND TACTICS, AND PROPOSED ACTIONS FOR THE INTERNATIONAL COMMUNITY
by Roger Gorham
The Global Initiative on Transport Emissions
A Partnership of the United Nations and the World Bank
Division for Sustainable Development Department of Economic and Social Affairs
United Nations
2002
ii
The designations employed and the presentation of the material in this publication do not imply the expression of any opinion whatsoever on the part of the Secretariat of the United Nations concerning the status of any country, territory, city or area, or of its authorities, or concerning the delimitation of its frontiers or boundaries. The views expressed in this document are those of the author and do not necessarily reflect those of the United Nations.
Mention of firm names and commercial products does not imply the endorsement of the United Nations. References have, wherever possible, been verified. Reference to dollars ($) are to United States dollars, unless otherwise stated.

AIR POLLUTION FROM GROUND TRANSPORTATION
AN ASSESSMENT OF CAUSES, STRATEGIES AND TACTICS, AND PROPOSED ACTIONS FOR THE INTERNATIONAL COMMUNITY


v
CONTENTS
Page Foreword………………………………………………………………………………….. ix Acknowledgements ................................................................ ..................................... x Abbreviations ................................................................................................ ............. xi Chapter EXECUTIVE SUMMARY……………………………………………………… 1 I. TRANSPORT AND SUSTAINABILITY........................................................ 12 II. TRANSPORT AND AIR POLLUTION.......................................................... 2 Introduction ................................................................ ..................................... 2 A. Motor vehicle emissions and local ambient air quality............................. 5 B. Regional and migratory pollution........................................................... 8 C. Energy consumption and greenhouse gases ............................................ 9 III. CAUSES OF AIR POLLUTION FROM TRANSPORTATION..................... 13 Introduction ................................................................ ..................................... 13 A. Excessive vehicle use in urban areas ................................ ...................... 14 B. Age of fleet and technology used ........................................................... 20 C. Poor maintenance of vehicles ................................................................ 22 D. Unavailability or improper use of appropriate fuels ................................ . 22 E. Atmospheric, topological and climatic conditions ................................... 23 IV. STRATEGIES TO ADDRESS AIR POLLUTION FROM TRANSPORT...... 23 A. Technical strategies ................................ .............................................. 23 B. Systemic strategies ............................................................................... 31 C. Behavioural strategies ................................ ........................................... 32 D. Balancing global and local concerns ................................ ...................... 40 V. TOOLS AND TACTICS FOR IMPLEMENTATION ................................ .... 41 Introduction ................................................................ ..................................... 41 A. Targeting fuel consumers: pricing fuels ................................................. 42 B. Targeting motor vehicle users: pricing other variable costs of motor vehicle use ................................ ..................................... 43 C. Targeting motor vehicle operators: changing driving conditions and managing traffic ............................................................. 43 D. Targeting travellers and shippers: influencing travel choices ................... 44 E. Targeting vehicle purchasers: influencing vehicle fleet demand and turnover................................................................ ......................... 45 F. Targeting motor vehicle manufacturers and importers: influencing vehicle fleet supply ............................................................. 46
CONTENTS (continued) Page
vi
G. Targeting vehicle owners and fleet managers: improving in-fleet vehicle maintenance.................................................. 47 H. Targeting fuel refiners and importers: influencing the fuel supply........... 47 I. Targeting developers and planners: influencing the built environment ..... 48 J. Targeting households and firms: influencing location choices ................. 49 K. Targeting the general public: influencing public attitudes towards transportation................................ ........................................... 49 VI. THE INTERNATIONAL AGENDA................................ ............................... 49 A. Ongoing mechanisms of international cooperation .................................. 50 B. Further support from the international community .................................. 56
LIST OF TABLES
II.1 Share of fossil fuel combustion by the transport sector for selected cities.............. 4 II.2 Proportion of emissions due to vehicles in selected cities and regions................... 7 II.3 Increases and growth rates of transport sector carbon dioxide (CO2) emissions...... 10 IV.1 Areas of application of vehicle technology for internal combustion engine (ICE) vehicles ................................ ......................... 26
LIST OF FIGURES
II.1 Level of population’s exposure to pollution by world region and per capita energy consumption by world region ............................................................................ 3 II.2 Pathway from transport emission to health effect ................................ ................ 6 II.3 Past and projected emissions of carbon dioxide (CO2) from the transport sector .... 10 II.4 The transport sector’s past and projected share of carbon dioxide (CO2) emissions by region .......................................................... 11 II.5 Regional proportions of total transport carbon dioxide (CO2 ) emissions................ 12 III.1 ASIF decomposition for Sweden ................................................................ ....... 15 III.2 ASIF decomposition for the United States .......................................................... 16 III.3 Car penetration levels at given levels of per capita wealth................................... 17 III.4 Relation between vehicle ownership and income in the economies in transition compared with Western Europe ......................................................................... 18 III.5 Annual car use at given levels of per capita wealth.............................................. 18 III.6 Pathways to excessive car use............................................................................ 21
LIST OF BOXES
IV.1 Economic considerations in strategic evaluation ................................................. 24 IV.2 Energy efficiency and aggregate demand: the “rebound” effect ........................... 25 IV.3 Best practice in transport/land-use planning........................................................ 38
LIST OF ANNEXES
I. Primary and secondary pollutants from the transport sector ................................ . 65 II. Excessive vehicle use........................................................................................ 75 III. Conventional vehicle technology improvements ................................................. 79
CONTENTS (continued) Page
vii
IV. Alternative vehicle technology ................................................................ .......... 83 V. Addressing the in-use fleet ................................................................ ................ 96 VI. Fuel specification and quality............................................................................ 101 VII. Network effects: speed, flow, and induced travel ................................ ................ 106 VIII. Economic analysis in urban air quality management ........................................... 113 IX. Fuel pricing for environmental purposes............................................................. 116 X. Menu of tactical options................................ .................................................... 120
LIST OF ANNEX TABLES
A.1 Tolerated levels of lead use in gasoline specifications, by world region ................ 66 A.2 Estimates of external costs of road transport as a percentage of national/regional GDP................................................................ ................... 78 A.3 Areas of application of vehicle technology for ICE vehicles ................................ 79 A.4 GREET assessment of reduction in emissions from CNG relative to conventional gasoline ICE automobiles .............................................. 89 A.5 GREET assessment of reduction in emissions from LPG relative to conventional gasoline ICE automobiles .............................................. 90 A.6 GREET assessment of reduction in emissions from ethanol and methanol relative to conventional gasoline ICE automobiles ......................... 91 A.7 GREET assessment of reduction in emissions from electric propulsion cars relative to conventional gasoline ICE automobiles....................... 94 A.8 GREET assessment of reduction in emissions from synthetic fuels relative to conventional gasoline ICE automobiles ...................................... 95 A.9 Cost-effectiveness of different incentives in the Vancouver scrappage scheme ............................................................................ 100 A.10 Various estimates of vehicular travel elasticities with respect to travel time................................................................ ......................... 111 A.11 Various estimates of vehicular travel elasticities with respect to lane capacity ..................................................................................... 111 A.12 Various estimates of the share of vehicular travel attributable to induced demand................................................................ ............................ 111 A.13 Comparative prices of gasoline and diesel in countries of the former Soviet Union and Eastern Europe, as well as France, Germany, the United Kingdom and the United States ................................ .......... 118 A.14 Transport emission reduction measures: tactical targets and strategies supported................................ .................................................... 121

CONTENTS (continued) Page
viii
A.15 Price comparison of car-sharing and taxis in Santiago ......................................... 125 A.16 Feebate options evaluated in Europe and North America ..................................... 130 A.17 Schematic of proposed feebate structure in Japan................................ ................ 130
LIST OF ANNEX FIGURES
A.I Proportion of population living in a country with leaded gasoline, by region ......... 66 A.II Relative problem of particulate matter in world megacities .................................. 70 A.III Relative problem of ozone in world megacities ................................ ................... 71 A.IV Relative problem of NO2 in world megacities ..................................................... 72 A.V Relative problem of CO in world megacities ................................ ...................... 73 A.VI Relative problem of SO2 in world megacities ................................ ...................... 73 A.VII Isopleth of NOx and VOC contribution to ozone formation .................................. 74 A.VIII Proportion of infrastructure and external costs recovered by European rail and road sectors ................................ ........................................... 76 A.IX GHG emissions of various fuels from different points of the energy cycle............ 84 A.X Alternative production pathways for various fuels............................................... 84 A.XI Deterioration of NMHC emissions factors for tier I light-duty vehicles ................ 97 A.XII Octane enhancements versus lead concentration for some typical gasolines .......... 102 A.XIII Speed correction factor for VOC emissions from light-duty vehicles.................... 106 A.XIV Speed correction factor for fuel efficiency for light-duty vehicles ........................ 107 A.XV Time-speed emissions traces for carbon monoxide for an “average” driver and an aggressive driver in an 11-km trip from downtown......................... 108 A.XVI Time-speed emissions traces for volatile organic compounds for an “average” driver and an aggressive driver in an 11-km trip from downtown.......... 109 A.XVII Elements of air quality management system ....................................................... 114 A.XVIIICar emission standards in Japan, the European Union and the United States, 1990-2000................................................................ ............. 132
References ................................ ............................................................................ 142
ix
Foreword
There is a growing awareness of the importance of the transport sector to efforts aimed at achieving sustainable development and it was considered in detail at the ninth session of the Commission on Sustainable Development held in April, 2001.
Transport poses a dilemma in that it is necessary for economic and social development, yet it is associated with environmental degradation, especially with regard to atmospheric pollution. The transport sector accounts for about 25 per cent of total commercial energy consumed worldwide, and consumes approximately one-half of total oil produced. Its emissions include GreenHouse Gases, most notably CO2, as well as particulate matter, lead, nitrogen oxides, sulfur oxides and volatile organic compounds all of which have negative impacts at local and often at regional levels. In addition, it is associated with adverse noise and land use impacts.
Demand for transport services is expected to grow considerably as economic growth occurs in developing countries, incomes rise, the trend toward urbanization continues and as the process of globalization moves forward with expected increases in world trade. Between now and 2020, demand is forecasted to grow by 3.6 percent per year in developing countries and by 1.5 percent per year in industrialized countries. Decisions taken to meet this demand are often long-term in nature and those today will affect our ability to achieve sustainable future in years to come. Transport remains an important area of consideration as the international community prepares for its tenth year review of progress made to achieve sustainable development at the World Summit on Sustainable Development (Johannesburg, 2002).
This report was prepared as an input to deliberations on transport-related issues by the international community and as part of the activities of the joint United Nations/World Bank project entitled Global Initiative on Transport Emissions (GITE). An earlier version of this report was presented at the ninth session of the Commission on Sustainable Development, and the report presented here reflects comments and inputs received during that session.
We would like to express our appreciation to the author of the report for his considerable time and effort, to the World Bank for its continued cooperation and support, and to those who participated in the review process. It is hoped that this report contributes to efforts to achieve sustainable development in the transport sector by the international community and provides information and guidance to policy makers in both developed and developing countries.
JoAnne DiSano Director
Division for Sustainable Development Department of Economic and Social Affairs
United Nations

x
ACKNOWLEDGEMENTS
The author wishes to thank the many individuals have who offered assistance and advice during the preparation of this report, including: Byron Bunker of the United States Environmental Protection Agency, Ed Dotson, Gunnar Eskeland, Ken Gwilliam, Masami Kojima, Zmarak Shalizi, George Tharakan, and Chris Willoughby, all of the World Bank, and Mike Walsh, independent consultant. Special thanks are due Chris Weaver of Engines, Fuels and Emissions Engineering, Inc., for being a patient fount of information. Ken Gwilliam and Masami Kojima reviewed the entire document and their efforts are especially appreciated. The author also thanks Jessica and Tim Rockwood for their solid moral support.

xi
ABBREVIATIONS ACEA Association of European Motor Vehicle Manufacturers AIJ activities implemented jointly ALS Area Licensing Scheme AQMS air quality management system ASIF activity, structure, intensity and fuel BAU business as usual BRT bus rapid transit CAFE corporate average fuel efficiency (United States) CAP Compliance Assurance Program CBD central business district CDM Clean Development Mechanism CERs Certified Emissions Reductions CH4 methane CNG compressed natural gas CO carbon monoxide CO2 carbon dioxide CONCAWE European oil industry organization for environment, health and safety CONPET National Programme for Rationalization of the Use of Petroleum Derivatives and Natural Gas (Brazil) CVT continuously variable transmission DME di-methyl ether DOT Department of Transportation ECE Economic Commission for Europe ECMT European Conference of Ministers of Transport ECU European currency unit EEA European Environment Agency EIT economies in transition EPA Environmental Protection Agency (United States) ERP electronic road pricing ETBE ethyl tertiary butyl ether EU European Union EV electric vehicle FCC fluid catalytic cracking FFV flexible fuel vehicle FSU former Soviet Union FT Fischer-Tröpsch GEF Global Environment Facility GEMS Global Environment Monitoring System GHG greenhouse gas GITE Global Initiative on Transport Emissions GREET Greenhouse Gas, Regulated Emissions, and Energy Use in Transportation H2O water H2SO4 sulphuric acid HNO3 nitric acid HC hydrocarbon HOV high-occupancy vehicle I and M inspection and maintenance ITS intelligent transportation systems IADB Inter-American Development Bank

xii
ICE internal combustion engine IBRD International Bank for Reconstruction and Development IEA International Energy Agency ILMC International Lead Management Center IPCC Intergovernmental Panel on Climate Change JAMA Japan Automobile Manufacturers Association JI joint implementation km kilometres KAMA Korean Automobile Manufacturers Association LBNL Lawrence Berkeley National Laboratory LEM location efficient mortgage LEV low emission vehicle LNG liquefied natural gas LPG liquefied petroleum gas MBI market-based incentive mg milligrams µg/dL micrograms per decilitre µg/m3 micrograms per cubic metre MM mobility management MMT methylcyclopentadienyl manganese tricarbonyl MPH miles per hour MTBE methyl tertiary butyl ether N2 molecular nitrogen N2O nitrous oxide NRDC National Resources Defense Council NG natural gas NGO non-governmental organization NH3 ammonia NLEV National Low Emission Vehicle project (United States) NMHCs non-methane hydrocarbons NMT non-motorized transport NO nitric oxide NO2 nitrogen dioxide NOx oxides of nitrogen O2 oxygen molecules O3 ozone OECD Organisation for Economic Cooperation and Development OP Operational Policy PAH polycyclic aromatic hydrocarbons PAN peroxyacetyl nitrate PCF Prototype Carbon Fund PM particulate matter ppm particles per million PPP purchasing power parity PVFTM Partnership for Vehicle and Fuel Technology Modernization R and D research and development RME rapemethylester RPG reactive organic compounds RON research octane number RVP Reid vapour pressure SACTRA Standing Advisory Committee on Trunk Road Assessment

xiii
SIC Small Initiatives Clearinghouse SMSE Sustainable Markets for Sustainable Energy SO2 sulphur dioxide SO3 sulphate SO3
+ sulphate ions SOF soluble organic fraction SOx oxides of sulphur SUV sports utility vehicle TAME tertiary -amyl methyl ether TCA ton of carbon avoided TCMs traffic control measures TDM travel demand management TEKI Transport Emissions Knowledge Initiative TERI Tata Energy Research Institute TRB Transportation Research Board TSP total suspended particulates UNEP United Nations Environment Programme UNFCCC United Nations Framework Convention on Climate Change USAID United States Agency for International Development VKT vehicle kilometres travelled VMT vehicle miles travelled VOCs volatile organic compounds WEC World Energy Council WHO World Health Organization WRI World Resources Institute

1
EXECUTIVE SUMMARY
Accessibility is a key ingredient of well-being and prosperity in contemporary societies. The ability of individuals, families, entrepreneurs and firms to exchange goods and services, to be where activities are being carried out, and to interact with people on a regular basis is crucial not only to economic life but also to the quality of life. With the growth of economic and social networks over the course of the past two centuries and the spatial dispersion of activities, transportation has become the backbone of accessibility systems. It is also a crucial part of economic growth and social interaction in most countries.
Unfortunately, the adverse effects of transportation have a greater impact on the natural and human environment than two other important mechanisms for providing access: proximity and telecommunications. The fossil fuel combustion associated with transportation results in emissions of pollutants that cause damage to human health, agriculture and sensitive ecosystems, and contribute to global climate change. Transportation can also contribute to the degradation of urban environments, with loss of quality of life and economic productivity from the delays and frustration caused by congestion and stress from traffic noise. Changes in the distribution of activities and location of opportunities in response to transportation investments can also contribute to the physical and social isolation of certain vulnerable segments of society, such as the poor, children and the elderly.
The report summarized in this paper is intended as a review of the transportation sector’s contribution to local and global air pollution, and the strategic and tactical options available for combating the problem in an environment of sustainable development and economic growth. The report examines the origins of, and the damages caused by, air pollution from transport; it assesses the underlying causes, surveys the principal strategic approaches applied to solving the problem, and examines the various mechanisms of intervention available. While the report refrains from making specific policy recommendations, it reiterates a theme that needs to be borne in mind during policy formulation: transportation policy is made within a complex framework of differing jurisdictions, differing goals, and substantial interactions with other sectors and various aspects of economic and social life. A “policy” to address the negative environmental impact of transport-related air pollution should therefore not focus exclusively on mitigation measures; it also needs to address long-term, proactive measures in a range of areas not normally perceived as being within the purview of “air quality” policy–including pricing, land use and urban development –in order to prevent, as well as mitigate, increased emissions of various pollutants. Within this context, the report surveys the activities of the international community with regard to transport-related pollution, and identifies critical support needs that are not being met.
A. DAMAGE FROM TRANSPORT-RELATED AIR POLLUTION

2
Transportation involves the combustion of fossil fuels to produce energy translated into motion. Pollution is created from incomplete carbon reactions, unburned hydrocarbons or other elements present in the fuel or air during combustion. These processes produce pollutants of various species, including carbon monoxide, soot, various gaseous and liquid vapour hydrocarbons, oxides of sulphur and nitrogen, sulphate and nitrate particulates, ash and lead. These primary pollutants can, in turn, react in the atmosphere to form ozone, secondary particulates, and other damaging secondary pollutants. Combustion also produces carbon dioxide, the primary greenhouse gas.
The share of fossil fuel used in the transport sector varies widely from region to region and city to city. A recent study of six cities in developing countries found that the share of fossil fuel consumption in the transport sector ranged from 4 to 35 per cent. The amount of pollution in these cities may be thought to correspond roughly (but not exactly) to these proportions, although the relative damage cost attributable to transport may not have any bearing on these proportions.
Fossil fuel combustion for transportation contributes to air pollution, and air pollution degrades human health. However, the path from transportation to human health costs is anything but straightforward. Which pollutants are produced in which proportions depend on a number of factors, including the vehicle and fuel used and the driving conditions of a particular trip. These emissions are dispersed into the ambient air according to atmospheric conditions, which also influence the extent to which they react to form secondary pollutants. The degree to which people may be exposed to these primary or secondary pollutants depends on what kinds of activities they engage in, and where the highest concentrations of pollutants tend to be in a metropolitan area. The relative dose of the pollutants individuals receive depends on their own physiological conditions during exposure, and responses to doses can vary from person to person. This complex process is summarized in the figure below.
The principal pollutants from the transport sector responsible for adverse health effects include lead, various types of particulate matter, ozone (formed from atmospheric reactions of oxides of nitrogen [Nox] and volatile organic compounds [VOCs]), various toxic VOCs, nitrogen dioxide, carbon monoxide, ammonia and sulphur dioxide. However, the proportion of these various pollutants attributable to the transport sector varies significantly across different cities, as indicated by the table below. Pollution from transportation also causes damage to crops, farmland, forests, lakes, rivers, streams, coastal waters and swampy biosystems. This damage is mainly due to the effects of acidification (from nitrates and sulphuric acid), eutrophication (from excessive nitrate levels) and migratory ozone.
Transportation is also a major source of global pollutants, that is, those responsible for the greenhouse effect. While the United Nations Framework Convention on Climate Change formally identifies six gases as greenhouse gases (GHGs), only three are of particular concern to the transport sector: carbon dioxide, methane and nitrous oxide. Transportation accounts for about 21 per cent of greenhouse gas emissions worldwide; it is projected that this proportion will rise significantly for certain regions such as Europe and Latin America. The International Energy Agency (IEA) forecasts that transport sector emissions of carbon dioxide (CO2) will increase by 92 per cent between 1990 and 2020 (International Energy Agency). Methane and nitrous oxide (N20) are also of concern for the transport sector, not because it is currently a large source of these greenhouse gases, but because certain technologies that may be adopted into widespread use

3
in vehicles to address local pollutant emissions (namely NOx control technologies and natural gas fuel systems) may increase emissions of these GHGs in the future.
B. CAUSES OF AIR POLLUTION FROM TRANSPORTATION A number of factors can be identified as influencing the amount of emissions attributable
to the transport sector, and an effective strategy will need to take all these factors into account. They include: (a) the amount that vehicles are used in a given country or metropolitan area, including the extent to which this use can be called “excessive”; (b) the age of the vehicle fleet and the technology used within it; (c) the extent to which vehicles are properly maintained; (d) the availability of appropriate fuels and the extent to which they are used properly; and (e) atmospheric, climatological and topological conditions. Four of these factors can be influenced through policy.
(a) Excessive vehicle use. Level of activity or vehicle use is an important factor to take into account in the overall analysis of transportation emissions, particularly in those cases where long-run solutions are envisioned to help avoid the development of a problem. In a number of developed countries (where data and information are more readily available), studies have shown that growth in activity has either significantly increased the amount of CO2 emitted in the sector or substantially dampened the reduction of CO2 emissions that would have occurred, the latter because of efficiency improvements during the last three decades of the twentieth century. In the absence of a policy to address vehicle use, growth in vehicle kilometres travelled in developing countries is projected to average between 2.5 and 4 per cent per year between 1990 and 2030.
It follows that a central question for policy makers is whether avoiding this growth is possible or desirable. A number of unknown but controversial factors affect this question, including whether growth rates of car use and those of car ownership are necessarily the same, and the extent to which transport activity drives economic growth, rather than being an indicator of it. On a macroeconomic scale, transport activity can be described as “excessive” if there are more vehicle kilometres travelled than are necessary to achieve and maintain an aspired-to quality of life for a given income or level of wealth. In micro-economic terms, it is linked to the mispricing of the transport system, excessive transport activity being the difference between actual activity and that which would occur if all marginal social costs were included in the costs seen by travellers and shippers.
Excessive car use is a particular and likely manifestation of excessive travel under conditions where a cultural phenomenon of car (or motorcycle) dependence develops, in combination with a number of potential price distortions that favour car use. These might include: fuel subsidies to other sectors with unintended but predictable effects on the transport sector; general subsidies to road users built into the financing of how roads are constructed and maintained, and ancillary services delivered; hidden and fixed costs in road infrastructure and land-use provision, which send unclear price signals to potential travellers; and secondary price distortions in land values that incorporat e or capitalize these other (primary) distortions.
(b) Age of fleet and technology used. Older vehicles are associated with higher emissions of both global and local pollutants than newer vehicles, both because performance deteriorates as a function of age and because older vehicles are more likely to use obsolete, higher emitting technology.

4
(c) Poor maintenance of vehicles. Deterioration of emissions characteristics is linked to maintenance practices of owners, particularly for local pollutants, where catalytic exhaust after-treatment technology is used. Misfuelling of catalyst-equipped gasoline vehicles with leaded fuel, even once or twice, can seriously damage the ability of the catalyst to operate properly, and these catalysts can also degrade over time because of other natural contaminants in fuels. Without an effective system in place to ensure that these systems are well maintained, emissions due to neglecting exhaust after-treatment maintenance are likely to increase.
(d) Unavailability or improper use of appropriate fuels. Fuel is a factor for a number of reasons. Regulatory authorities may inappropriately specify fuel types for a given area’s conditions, leading to unnecessary emissions of certain kinds of pollutants. Vehicle owners may misfuel, out of ignorance or in response to a poorly established price signal. Finally, dishonest retailers might adulterate or substitute fuels, again often in response to an unfortunate price signal.
C. STRATEGIC APPROACHES TO REDUCING
EMISSIONS FROM TRANSPORT
The development of a strategy involves the selection of a coherent set of measures which, taken together, will reduce the emissions of transport pollutants. These measures can be technology-oriented, targeting the vehicles and fuels used and maintenance practices within the sector, or they can be behavioural, seeking to reduce (or prevent increases in) the amount of activity of the most polluting vehicles. They may also focus on systemic aspects of the transport system–ways in which the transport network influences either the aggregate amount of vehicle use or the emissions intensity of individual vehicles.
Emission control strategies for the transport sector should be determined in the broader context of improving outdoor air quality in an urban region. This involves important economic technical analysis in the context of an air quality management programme. These programmes, such as the World Bank’s Air Quality Management System, are useful in identifying the most efficient use of scarce resources to address an air quality problem. However, the process of carrying out such an assessment tends to be quantitative; interventions whose costs or benefits are not easily quantified tend to be discounted. The assessment also tends to be static in its analytical approach, not taking into account potential changes in demand over time. Consequently, it often does not take into account systemic changes that can influence this change in demand. These limitations should be borne in mind in devising an effective emissions strategy with regard to transport.

5
1. TECHNICAL STRATEGIES Technical approaches seek to reduce the emissions produced by road vehicles using the
transport system by intervening with the vehicles being used and the fuels they are burning. By definition, these approaches address per unit emissions rather than the amount of activity causing the emissions. An exclusively technological approach may be insufficient to address the growth in emissions, for a number of reasons. First, growt h in activity continuously puts pressure on technology gains. Secondly, technological improvements can exacerbate the growth in activity through the much-debated “rebound” effect. Thirdly, an exclusively technological approach to addressing the problem of emissions may result in significant over-investment in technology compared with a socially optimum solution (that is, one which would result if a pure tax on emissions were implemented).
2. VEHICLE TECHNOLOGY
Changing or improving technology. Technologi cal improvements to vehicles are limited
by local capacity to absorb the technology, which includes both turnover rates and capabilities for servicing and maintenance, and by the availability of fuel appropriate for the technology. Consequently, vehicle technology strategies need to be developed in response to particular local circumstances and in concert with fuel strategies. These strategies may involve improvements in conventional technologies already in widespread use–such as improvements to engine and fuel systems, better or more widespread use of gasoline or diesel exhaust aftertreatments, changes and improvements to transmission systems (to increase efficiency and reduce CO2 emissions), treatment for fuel supply and crankcase systems (to reduce evaporative emissions), or improvements to overall vehicle or tyre design to reduce friction.
Technological improvements might also involve the adoption and use of alternative fuel or
alternative propulsion vehicles. In developing countries, the most commonly discussed alternative vehicle strategies include compressed natural gas (CNG), liquefied petroleum gas (LPG), alcohol-based fuels, and electric propulsion or hybrid-electric vehicles in certain applications. Other alternative fuels showing potential long-term promise in the transport sector include hydrogen fuel cells and various synthetic fuels for use in compression-ignition engines.
Rate of change of technology in the vehicle fleet. An extensive review of appropriate technologies in the emissions-reduction literature and at conferences can often mask the underlying importance of the rate of change of technology. Over the short and medium term, the rate of change is more important than the technology itself for reducing transport emissions, particularly for fleets where baseline emissions control mechanisms are minimal or non-existent. In assessing any technology, therefore, the analysis of technological options needs to move beyond a narrow assessment of the relative emissions and energy consumption capabilities of each technology; rather, the analysis should focus on how rapidly the different technologies can be deployed and widely used in the fleet.
The rate of change of technology can be influenced by encouraging vehicle turnover, ideally through well-designed adjustments to the fiscal regime under which cars are taxed over their lifetimes, or through vehicle retrofitting programmes, which allow older vehicles to benefit from more recent technology. The organizational and technical logistics of retrofit programmes are substantially different, depending on whether gasoline or diesel vehicles and individual or fleet owners are targeted.

6
Vehicle maintenance. Vehicle maintenance is a crucial part of any technical strategy to reduce per kilometre emissions of pollutants, both because the proportion of in-use vehicles is substantial compared with new vehicles in any given year, and because of the vigilance required to ensure that exhaust after-treatment technology is well maintained and remains functional. The principal logistical problem is designing cost-effective measures that ensure that the vehicles most in need of maintenance actually receive it. Programmes tend to be most cost-effective when they target “gross-emitters”, those 20 per cent of vehicles that tend to produce 80 per cent of the pollution, according to the rule of thumb that applies to cities in developed as well as developing countries.
Effective strategies focusing on vehicle maintenance have three key elements: (a) Emissions testing, which provides a mechanism to identify vehicles that are not
performing according to regulations; (b) Driver and fleet manager education and training, which is important in
facilitating the acceptance of emissions testing components, such as inspection and maintenance programmes, and because such training can specifically target high-kilometrage drivers;
(c) A programme of ongoing product liability, for either manufacturers or importers,
which might also help to ensure better maintenance by creating a market incentive for suppliers to follow up on their products.
3. FUEL TECHNOLOGY
Improvements to the specifications of fuels are as important as improvements to vehicles. Fuel improvements can affect emissions in three ways. First, changes to fuel content can directly bring about a reduction in emissions of certain pollutants, such as lead, sulphates, oxides of sulphur (SOx), or VOCs. Unlike changes to vehicle technology, the effects of these types of fuel content changes are immediate. Secondly, changes in fuel content can facilitate the use of certain exhaust after-treatment technologies–particularly those using platinum -based catalysts–which would not have been usable before. Thirdly, the costs of these improvements are passed on to the consumer but, unlike the costs for technical improvements to vehicles, these costs are passed on as variable rather than fixed costs. This is compatible with a strategy aimed at variabilizing costs as much as possible.
4. SYSTEMIC STRATEGIES
Systemic approaches to air quality focus on the transport network, seeking to adjust driving
conditions so as to enable vehicles to operate in the least emissions-intensive manner possible. Such a goal can involve increasing average speeds to an optimal level (ordinarily between 65 and 90 kilometres per hour for most pollutants, including CO2), or “smoothing” flow, so as to reduce the variability of speeds and eliminate the need to accelerate or decelerate. In practice, smoothing flow and increasing average speeds are often inseparable practical outcomes of the same engineering interventions.
Increasing average speeds on a road network, however, is also associated with the phenomenon of induced traffic, that is, an increase in motor vehicle use occurring in response to an improvement in motor vehicle traffic conditions. Induced traffic means that, at the very least, the emissions-rate reductions from smoother flow need to be weighed against an increase in

7
overall emissions from more traffic. This balancing suggests two potentially different systemic strategies for air quality purposes: smoothing flow on the one hand, and restraining traffic on the other hand. In this context, the market, through congestion pricing, would be more able to “choose” between these competing and conflicting strategic approaches than could any engineering assessment.
5. BEHAVIOURAL STRATEGIES
Behavioural approaches seek to reduce the amount of vehicular travel undertaken, either by substituting alternative modes, changing the structure of accessibility for large segments of society so as to reduce the need to travel, or changing the costs associated with travel. Behavioural strategies are most effective when they focus on the future adaptive behaviour of travellers rather than on current patterns.
Modal shifts. Strategies involving mode shifts usually focus on displacing car, shared taxi, or micro-bus trips with either conventional public transport or non-motorized modes. Several conditions affect how successful this strategy can be:
• The travel on the alternative mode must be a shift (substitution), and not a new trip (addition).
• Policy must support the separability of vehicle ownership growth rates from vehicle
use growth rates. The link between car ownership and use is not unbreakable, and careful attention to pricing can reinforce this.
• Individual measures will be ineffective. The synergies created by combinations of
measures are significantly more effective than any of the measures on their own.
Public transport. As an air quality strategy, a primary goal of a public transport intervention involves the targeting of service improvements and enhancements in corridors and for socio-economic groups that would otherwise be expected to adopt widespread car use. Since these groups tend to be more price- than time-sensitive, service enhancements are more effective than fare restraint or fare subsidies. For many jurisdictions, this strategy may conflict with another fundamental goal of public transport policy: providing low-cost transport services to the poor. Secondary air quality goals would involve reducing the number of vehicles required to service a given market for a given level of service reliability, and improving the cash flow of vehicle operators to enable them to invest in better equipment. These goals all point to the need to commercialize public transport service delivery and establish functioning regulatory frameworks.
Non-motorized modes. An effective non-motorized strategy for developing countries needs to be oriented towards the gradual substitution of non-motorized transport (NMT) choices based on value-of-time with those based on accessibility, as overall income and productivity of urban populations increase. This strategy would involve careful attention to the provision of adequate facilities (including the legal, regulatory and traffic-code aspects involved), and thorough consideration of land use, both in terms of urban form and the location of commercial and administrative facilities that different populations need to access.
Accessibility planning. Transport is a demand derived from the need for access. By better addressing directly the accessibility needs of populations, the need for transportation might

8
be reduced. This could involve better attention to land-use planning and urban development, or better application of telecommunications technology as a strategic substitute for particular trips. A number of best-practice principles in land-use/urban planning to improve accessibility can be identified as follows:
• Recognize that the designation of primary rights of way and movement corridors will
have an impact on location, land-use and building-pattern decisions for decades, and take this impact into account in the early planning stages.
• Recognize the cumulative impact of land-use and transport decisions.
• Correct pricing distortions in the transportation system before they are “capitalized”
into land through particular urban forms or densities.
• Ensure the inclusion of full infrastructural costs in land prices through the development process.
• Increase the liquidity and transparency of real estate to allow markets to respond adequately and fairly to public policy signals and accelerate demand-driven changes in land use.
• Avoid inappropriate regulations and excessive reliance on regulatory measures to influence land use without commensurate, compatible and supportive infrastructural investments and transportation policy, but enforce appropriately scaled and applied regulations with vigour.
• Foster amenity and access in urban design as counterweights to the demand for space as incomes grow.
• Experiment on a small scale with new or innovative ideas.
Shifting the costs associated with travel. Innovations in a number of transport delivery
options in developed countries–including car-sharing, road or congestion pricing, variable-priced insurance, cash-out of free parking–are coalescing around an increasingly recognized element of transport pricing: shifting the overall lifetime cost burden associated with automobility from fixed to variable costs. A policy goal of variabilization of costs associated with motorization can help better align the costs and the benefits of individual trips, leading to a more efficient allocation of trip-making, chaining (combining or sequencing trips throughout the day), and mode choices.
D. TACTICAL APPROACHES TO REDUCING
EMISSIONS FROM TRANSPORT In theory, it is desirable to have an economic assessment of each potential intervention in a
transport strategy. In practice, however, the wide range of actors playing a role in transport

9
activity, as well as the complexity of competing goals in transport policy–including alleviating congestion, influencing migration and settlement patterns, or linking accessibility to economic growth, poverty alleviation, and quality of life improvements–all mean that air quality policy in transport needs to be somewhat opportunistic. The tactical approach looks at potential interventions with a view to determining who can be influenced. In an ideal context, however, tactical measures to address transport emissions would support strategic approaches identified through rigorous technical and economic analysis.
Targeting fuel consumers: pricing fuels. Fuel consumers may respond to changes in fuel prices by changing the types of vehicles they own and drive, the types of fuel these vehicles burn, how much they drive them, or some combination of these choices. These changes, in turn, might affect the choices made by fuel refiners and vehicle manufacturers. Fuel pricing policies might take the form of an energy tax, a Pigouvian levy on specific fuel content, fuel-specific differential taxes, or carbon taxes.
Targeting motor vehicle users: pricing other variable costs of motor vehicle use. Changing other costs of motor vehicle use may cause individuals and firms to change where, when, why and—ultimately—how much cars are used, but will not induce an equipment response (change of vehicle or fuel).
Targeting motor vehicle operators: changing driving conditions and managing traffic. Improving driving conditions and managing traffic can have an important positive effect on emission rates and operational characteristics, particularly when these measures are oriented towards public transport networks, through mechanisms such as busways, contraflow lanes and signal priority. These mechanisms also help to ensure speed and reliability, thus helping to maintain high ridership levels.
Targeting travellers and shippers: influencing travel choices. Measures commonly referred to as travel demand management (TDM) target the day-to-day travel choices of travellers, including when, where and how they travel. TDMs can involve incentives to use public transport, incentives to change patterns of trip-making (through, for example, carpooling or different working hours), and disincentives with regard to car use.
Targeting vehicle purchasers: influencing vehicle fleet demand and turnover. Measures targeting vehicle purchasers affect the kinds of vehicle choices made and the speed with which vehicles are cycled out of the in-use fleet. They might include “feebate” schemes to give an incentive to purchase more environmentally benign vehicles in the context of a fiscal regime, or voluntary accelerated vehicle retirement programmes, often called “scrappage” or “cash-for-clunker” programmes.
Targeting motor vehicle manufacturers and importers: influencing vehicle fleet supply. Policies targeting vehicle suppliers involve either transfers and subsidies to undertake research, development and deployment, or the establishment of vehicle emissions and/or fuel economy standards. Most developing countries do not develop their own sets of standards but rather pick and choose “off-the-shelf” standards from previous or current regulatory regimes in the United States of America, Europe or Japan. These standards need to take into account a number of factors, including whether the standards should force the development of new technology (as opposed to simply ensuring the use of a given standard of available technology), product cycle and development time, the mechanism for enforcement, the availability of fuel compatible with the vehicle technology contemplated by the standard, the macro effects of

10
binning or segmenting of vehicles to target standards on the overall market, and the perceptions of industry about the overall burden of a particular set of standards.
Targeting vehicle owners and fleet managers: improving in-fleet vehicle maintenance. Measures to improve in-fleet vehicle maintenance by changing the behaviour of vehicle owners and fleet managers generally centre on the development of an inspection and maintenance (I and M) programme. These measures have taken on different forms in different jurisdictions (centralized or decentralized, public or private) and use different testing equipment, techniques and drive cycles. I and M can be supplemented or phased in through a programme of mobile enforcement. Finally, changes in the mechanisms of fleet-vehicle procurement and maintenance–specifically to abandon the sharp distinction between capital and operations expenditures in this regard–may allow for better life-cycle costing of vehicles at procurement, thereby allowing for the establishment of more efficient (and commercial) maintenance regimes.
Targeting fuel refiners and importers: influencing fuel supply. Measures to influence fuel supply might involve subsidies and transfers for research, development and deployment, or regulations and standards for fuel quality. Such standards are most effective when they regulate performance criteria, rather than fuel composition per se.
Targeting developers and planners: influencing the built environment. Urban form and design can influence how long average trips taken in urban areas need to be, and what modes of transport are viable. While formal land-use control or planning/zoning regulations are often the most immediately obvious way to influence the built environment, in practice, the most effective means for developing countries to influence urban form and growth is through the provision (or non-provision) of infrastructure, particularly transportation infrastructure. Proactive planning of infrastructure can be facilitated by the new methodologies for full-cost accounting of infrastructure supply and maintenance, and supplemented with diligent efforts to recover costs.
Targeting households and firms: influencing location choices. The demand side of balanced urban development involves measures to influence where households and firms choose to locate in an urban area. Although they are not yet well established, particularly in the developing countries, policies to influence location choices have led to some interesting experiments, including a “reverse” zoning scheme in the Netherlands (the “ABC” policy) and a mortgage instrument based on “location efficiency” in the United States.
Targeting the general public: influencing public attitudes towards transportation. Public acceptance of policy-making on both local pollutant and greenhouse gas emissions reductions requires, at a minimum, a basic understanding of the issues and stakes involved. Motorists and non-motorists need to develop an understanding of how the sum of their individual decisions affects the quality of life they live on a day-to-day basis. The need for this understanding suggests that public education and awareness are prerequisites–not afterthoughts–to sound policy-making and implementation.
E. THE ROLE OF THE INTERNATIONAL COMMUNITY
The international community, through various arms of the United Nations, the multilateral
development banks, and bilateral aid agencies, has helped cities in developing countries to address transportation emissions through a number of different programmes. This aid has been successful to a varying ext ent, although not always cohesive, and not necessarily comprehensive. Much of the substantive work in regions with particularly alarming air quality has focused on assistance with assessment and economic evaluation of the problem, including prioritization of

11
investments for air quality mitigation. A number of crucial needs, however, are still under-served by the international community. In general, these needs involve institutional development, integration of environmental criteria into transport and urban planning, and support for long-run assessments of alternative investment scenarios. Specifically, a number of needs have been identified. These include the following:
• Concerted and consistent support to eliminate the use of lead as a fuel additive by a specific target date.
• Harmonization of transport activity and emissions data tracking and reporting. • Development and elaboration of methodologies for assessing “co-benefits” or
“ancillary” benefits of local or greenhouse transport interventions, as well as support for negotiators to clarify the status of different transport sector interventions under the flexibility mechanisms of the Kyoto Protocol.
• Preventing fragmentation of markets in the development of emissions and fuel quality
standards/regulations. • Development of innovative strategies to address “motorization” and better
identification and targeting of technological solutions for developing country contexts. • Capacity-building for integration of environmental criteria into major investment
decisions and long-term planning. • Knowledge sharing and analytical support.
The Global Initiative on Transport Emissions (GITE) was created as a partnership between
the United Nations and the World Bank to help the international community meet some of the above needs. The GITE projects and programmes are being developed in three clusters of activities. The Partnership for Vehicle and Fuel Technology Modernization (PVFTM) is intended to create a structured forum to investigate the reasons that more appropriate technologies are not used in particular regions, and what can be done to overcome the barriers to their use. The Transport Emissions Knowledge Initiative (TEKI) is a programme to focus on the development of transportation emission statistical capacity in developing countries, both as an advocate for such capacity and a diffuser of knowledge. The Small Initiatives Clearinghouse (SIC) is geared to providing access to information on financing for small initiatives in transport, as well as disseminating the lessons learned from various initiatives.
As a partnership between the World Bank, the United Nations and the private sector, GITE can be an important institution to help address some of the unmet needs of developing countries in “growing” their transport sectors in a more sustainable direction; it can also help to reduce the harmful emissions of local and global pollutants. At the same time, GITE can assist the citizens of developing countries in attaining the economic rewards and quality of life that are created by accessibility.

12
I. TRANSPORT AND SUSTAINABILITY
Accessibility is a key ingredient of well-being and prosperity in contemporary societies. The ability of individuals, families, entrepreneurs and firms to exchange goods and services, to be where activities are being carried out, and to interact with people on a regular basis is crucial not only to economic life but also to the quality of life. With the growth of economic and social networks over the course of the past two centuries, and the spatial dispersion of activities, transportation has become a vital part of the systems providing access to those activities. It is also a crucial factor in economic growth and social interaction in most countries.
Transportation is likely to remain the key element of accessibility for the foreseeable future. Telecommunications, which is playing an increasingly important role in making certain activities accessible to people, will no doubt take over some transport functions to meet the accessibility needs of certain populations. However, telecommunications is equally as likely to increase transport needs in other populations, or to shift the transport function from one of moving people to moving goods. The use of spatial proximity as an alternative to transportation in providing access to activities is becoming more difficult as economies diversify, activities are dispersed, and larger incomes drive up demand for space. While such an alternative is possible and even desirable for certain small population segments, the viability of spatial proximity as a societal solution to meeting the need for accessibility is probably quite limited.
Unfortunately, the adverse effects of transportation have a greater impact on the natural
and human environment than either spatial proximity or telecommunications. The basic technology used in transportation causes emissions of pollutants which have been proved, or are believed, to damage human health and plant life and to upset sensitive ecosystem balances. As a result of transport’s contribution to local pollution–which, worldwide, is responsible for about 1.1 per cent of all deaths annually, and has recently been estimated as responsible for up to 6 per cent of all deaths annually in Europe (Künzli and others 2000)–social costs for health care, reparation of damaged agriculture, and additional costs of educating children whose learning ability has been impaired by pollutants are somewhat higher than they would otherwise be. Transportation also emits gases that are thought to contribute to the greenhouse effect–a change in the radiative balance of the earth’s energy that is expected to cause unpredictable changes in the global climate. Worldwide, transportation accounts for about 21 per cent of emissions from carbon dioxide–the principal greenhouse gas–and this percentage is expected to increase in the first several decades of the twenty-first century. Transportation also contributes to acidification and eutrophication of certain ecosystems.
In addition to affecting air quality and natural environmental degradation, transportation can also play a key role in the degradation of urban environments. The delays and frustrations caused by urban traffic congestion can reduce human productivity and quality of life, thus possibly reducing the potential gross domestic or gross regional product. The noise produced by various types of motor vehicles, as well as the excessive use of horns–a fact of life in cities in many developing countries–raises the level of ambient noise, increases stress and reduces the quality of life. Transportation can also contribute to the physical and social isolation of certain vulnerable segments of society, such as the poor, children and the elderly. Collective decisions by government, or the combined effect of individual decisions made in an environment of poor policy guidance, can limit the economic viability or affordability of proximity or collective transport as an option for these groups.

13
The problem of reconciling environmental protection with economic and social viability was a key concern of the United Nations Conference on Environment and Development, held in Rio de Janiero, Brazil, in 1992. The Conference, known as the Earth Summit, led to the establishment of the United Nations Commission on Sustainable Development. The Commission is responsible for monitoring the implementation of the Conference programme of action, Agenda 21, at the local, national, regional and international levels. The Commission also formulates policy guideli nes and future activities of the Conference, and facilitates cross-cutting partnerships to enhance and promote sustainable development. The meetings of the Commission on Sustainable Development and related organizations, as well as sub-conferences on an expert level, generate a flow of information and best practices that serve as a means to achieving viable and sound environmental policies. The 2001 meeting, marking the ninth session of the Commission on Sustainable Development, will focus on the roles of energy and transport in sustainable development. The present report is submitted as a background paper, focusing on the challenges to sustainability posed by the transport sector.
This report is intended as a review of the transport sector’s contribution to local and global air pollution, and presents strategic and tactical methods of combating the problem in an environment of sustainable development and economic growth. The report examines the origins of–and damages due to–air pollution from transport, assesses the underlying causes, surveys the principal strategic approaches that are being applied to the problem, and examines the various mechanisms of intervention available. Finally, the report surveys the principal activities of the international community with regard to pollution from the transport sector, and identifies critical support needs not currently being met by international activities. This report is built largely on previous and ongoing work on the subject at the World Bank, and has been subjected to a review process by a panel of World Bank experts.
Because transport is a complex sector, the scope of the present report cannot be totally comprehensive. So many factors influence the transport sector and the behaviour of the various actors within it–including vehicle and fuel producers, drivers, passengers, policy makers and mechanics–that an exhaustive study may not be possible, certainly not in a single volume.
II. TRANSPORT AND AIR POLLUTION
Introduction
Almost all motorized transportation today involves the combustion of fossil fuels, which produces energy to be transformed into motion. This combustion is the reaction of the hydrogen and carbon present in the fuels with oxygen in the air to produce–in the ideal world–water vapour (H2O) and carbon dioxide (CO2). Neither of these products is damaging to human health. However, CO2 is the principal gas responsible for the “greenhouse” effect, an increase in the average temperature of the planet resulting from the trapping of solar energy, with which the increased presence of this gas in the atmosphere is associated. The more energy consumed for transportation, the more CO2 emitted. Increases in the average temperature of the planet are believed to lead to unpredictable changes in the global climate, potentially creating, exacerbating or increasing the frequency of natural disasters.
The combustion of hydrocarbons produces a number of other by-products more directly damaging to human health than water vapour and CO2. These other pollutants have three possible origins: (a) the carbon present in the fuel does not adequately react with the oxygen during combustion, for a variety of complex reasons, producing either carbon monoxide (CO) or

14
condensing to form solid carbonaceous particles (soot), a basic component of particulate matter; (b) the hydrocarbons do not combust completely (or evaporate prior to combustion), being released as gaseous hydrocarbons called volatile organic compounds (VOCs) or adsorbing onto carbonaceous particles, thereby increasing the particulate mass; and (c) other elements present in the fuel and air (including sulphur, lead, nitrogen, zinc and magnesium) also become involved in the combustion process, producing various oxides of sulphur (SOx), oxides of nitrogen (NOx), sulphate (SO3) aerosols and ash–also important components of particulate matter–and lead aerosols. These by-products directly damage human health, but they can also react in the atmosphere, producing “secondary” transport pollutants such as sulphuric acid, sulphates and ozone, which also damage human health. The type and extent of secondary-pollutant production is heavily dependent on local atmospheric and climate conditions. Atmosphere and climate, together with urban form, population densities and street densities, also influence the extent to which populations are exposed to primary and secondary pollutants.
The known particular effects of each of these local pollutants are reviewed briefly in section A below, and in more detail in annex I to the present report. In this report, both the global and local by -product pollutants of fossil-fuel combustion will be referred to simply as “emissions”, except when there is a need to distinguish between them. Conceptually they share a trait that simplifies policy discussions somewhat: “less is better”. The amount of transport -sector emissions is roughly correlated with the amount of fossil fuel used in combustion in the sector, but the correlation is significantly more straightforward for global pollutants–particularly CO2–than for local ones.
Transport is not the only sector that uses fossil fuels in combustion. The manufacturing, power generation, and household sectors all involve fossil-fuel combustion, to such differing degrees that the contribution of each to the global and local pollution described in chapter I can differ widely across regions. A recent study by the World Bank found that the transport sector’s share of fossil fuel consumption in six cities in developing countries varied between 4 and 35 per cent, as shown in table II.1 below. These shares can be loosely interpreted to reflect, very roughly, the proportion of air pollution attributable to the transport sector (although not necessarily the transport sector’s share of costs associated with these emissions). Shanghai and Krakow show particularly low shares of transport fossil fuel consumption; these cities still have large amounts of energy use, mostly coal burning for industrial uses, located within their perimeters.
Table II.1. Share of fossil fuel combustion by the transport sector for selected cities
(Percentage) Mumbai 10 Shanghai 4 Manila 16 Bangkok 25 Krakow 7 Santiago 35
Source : Derived from Kesiniya Lvovsky and others, Environmental Costs of Fossil Fuels: A Rapid Assessment Method with Application to Six Cities, Environmental Department Paper 78 (Washington, D.C., World Bank, 2000).
Using total suspended particulates (TSP) as an indicator, the above-mentioned World
Bank study also compared the level of population exposure to pollution in different regions of the world, set against income.

15
Figure II.1 suggests that exposure to pollution is roughly inversely proportional to energy used. This result can be deceiving, however, since the impact is not direct; countries that use large amounts of energy tend to be high-income countries, which can generally afford better emission control technology and which have more dispersed populations in urban areas. Because many pollutants are more concentrated in areas immediately near their emission sources (10 per cent of lead discharged by motor vehicles is deposited within 100 metres of roadways, for example(Wijetilleke and Karunaratne)), exposure to local emissions from transport is largely a function not only of the amount of activity, but also of population densities near large transportation corridors and the number of people who regularly work along these roadsides, such as street merchants and construction crews. Both of these factors are more significant in developing countries. A study of pollution exposure in Metropolitan Manila in 1994, for example, found that children between 7 and 14 who worked as street vendors had 10 per cent higher levels of particulate matter (PM) exposure, and 26 per cent higher levels of measured lead in the bloodstream than children who attended school, and levels of both pollutants for schoolchildren already exceeded World Health Organization (WHO) guidelines by a factor of 2.6 and 1.4 respectively (Mage and Walsh 1999). A similar study in Budapest found mean blood lead levels in children to be over three times higher in the city centre than in the suburbs (Rudnai and others 1990, as cited in Lovei 1996).
Figure II.1. Level of population’s exposure to pollution by world region and per
capita energy consumption by world region
China
WorldHigh income
countries
IndiaOther
low&middle income
countries
0
50
100
150
200
250
300
350
400
An
nu
al m
ean
exp
osu
re t
o
TS
P in
larg
est
citi
es, u
g/m
3
0
1000
2000
3000
4000
5000
6000
En
erg
y co
nsu
mp
tio
n p
er
cap
ita,
kg
of
oil
equ
ival
ent
per
per
son
Monitored levels of pollution Energy consumption per capitaPre-1997 WHO guideline
Source: Derived from Kesiniya Lvovsky and others, Environmental Costs of Fossil Fuels: A Rapid
Assessment Method with Application to Six Cities, Environmental Department Paper 78 (Washington, D.C., World Bank, 2000).
Notes: ug/m3 stands for µg/m3 (micrograms per cubic metre); TSP stands for total suspended particulates.
A. MOTOR VEHICLE EMISSIONS AND LOCAL AMBIENT AIR QUALITY

16
Human health is degraded by air pollution, and transportation contributes to air pollution. However, the link between transportation and human health costs is anything but straightforward. Fossil fuel use in transportation produces “local” pollutant emissions–lead, PM, NOx, SOx, VOCs, CO and toxins–but exactly what kinds of pollutants are produced in what proportions varies significantly based on a number of factors, including the vehicle and fuel used and the driving conditions of a particular trip. These emissions are dispersed into the ambient air according to atmospheric conditions, which also influence the extent to which they react to form secondary pollutants. People may be exposed to these primary or secondary pollutants depending on what kinds of activities they engage in and where, and also where the highest concentrations of pollutants tend to be in a metropolitan area. The relative dose of the pollutants that individuals receive depends on their own physiological conditions during exposure, and responses to doses can vary from person to person. This complex process is summarized below in figure II.2.
Many different pollutants are capable of causing damage to human health, but only some
of these are regulated, usually as a category or species. These pollutants, also sometimes called “criteria” pollutants in that monitored levels can constitute criteria that trigger regulatory responses, are reviewed briefly below. A more extensive review of these pollutants is provided in annex I to this report. For many of these pollutant categories, certain variants of the pollutant species can be more damaging to human health than others; in the scientific community, there is a lively debate as to whether and which particular variants of pollutant species should be regulated more stringently than the category as a whole.
(a) Lead. Petroleum refiners have historically added tetraethyl lead to gasoline
blends to avoid more costly methods of raising octane ratings. However, the costs to society in terms of negative health effects from lead are clear and well-documented. These include cardiovascular disease, premature death, and behavioural and development problems in children. The social costs of lead to megacities in developing countries have been estimated to be over 10 times higher than would be the cost to refiners to remove lead from their products. Nevertheless, many parts of the developing world, particularly in Africa, continue to use leaded gasoline.
(b) Particulate matter. Particulate matter is perhaps the most critical transport -sector
pollutant for developing countries in the early part of the twenty-first century, because its effects on human health are significant, costly and well-documented, while technical mechanisms to control particulate matter are also costly and require careful monitoring to put in place. The science of particulate matter–both how PM is produced and the mechanism behind how it adversely affects the human body–is complex, controversial and relatively poorly understood at present. In most urban areas, fine PM–particles that are smaller than 2.5 microns and responsible for the bulk of the health impacts of PM –consists primarily of carbon-based and sulphate-based particles, with small amounts of nitrate-based particles and soil dust. Carbon-based, sulphate-based, and nitrate-based particles are all produced during combustion, in subsequent atmospheric reactions, and sometimes in catalytic reactions as well. Most of the authorities responsible for regulating pollution regulate particulate matter by size. Monitoring triggers and emission caps are set for particulates under 10 microns in diameter, with little attention paid to the actual chemical composition (including the proportion of soot, sulphates and polycyclic aromatic hydrocarbons [PAH]) of PM; however, some researchers speculate that the extent of health side-effects depend on this composition. In addition, there is increasing evidence that smaller particles cause more damage to human health than large particles. As a result of this evidence, California and the United States Environmental Protection Agency (EPA) have enacted emission restrictions on both PM2.5 and PM10. Fine particulates interfere with respiratory function, but, unlike that associated with ozone or certain VOCs, this respiratory degradation is not a temporary phenomenon limited to the period of exposure.

17
Figure II.2. Pathway from transport emission to health effect
Note: VKT = vehicle kilometres travelled.
(c) Volatile organic compounds (VOCs). The term volatile organic compounds refers
to a range of non-methane hydrocarbons (NMHCs) which evaporate at normal surface temperatures. NMHCs are released during combustion because of incomplete burning of the fuel, usually because the flame temperature is too low or the residence time in the combustion chamber is too short. Changes in engine calibration that increase temperatures and residence times will therefore decrease hydrocarbon emissions. VOCs are usually regulated as a class because of their contribution to ozone formation. Ozone seems to impair respiratory function as a short-run response to exposure, but the longer-term effects are less clear; some evidence suggests “reason for concern” (Romieu 1999). The production of ozone in the atmosphere occurs through complex reactions in sunlight of VOCs and oxides of nitrogen (also produced in combustion). Some

18
VOCs also contribute to particulate formation, by coagulating onto soot and other particles, increasing their size and mass. In addition, some VOCs are in and of themselves toxic and hazardous to human healt h; they include benzene, polycyclic aromatic hydrocarbons, 1,3-butadiene, aldehydes and, through groundwater seepage, methyl tertiary butyl ether (MTBE).
(d) Oxides of nitrogen (NOx). Like VOCs, NOx are of concern both because of their
direct effects on human health, and because they react in the atmosphere (with VOCs) to produce photochemical ozone. Nitric oxide (NO) and nitrogen dioxide (NO2) are released in combustion because molecular nitrogen (N2) present in the air/fuel mixture splits and is oxidized. The higher the flame temperature or longer the residence time, the more nitrogen available to produce NOx ; consequently, the same technical interventions in engine calibration that might reduce VOCs will increase NOx (annex I to this report provides more details). In addition to contributing to ozone formation, NOx, in particular NO2, is toxic, impairs respiratory function, and can damage lung tissue.
(e) Carbon monoxide (CO). CO emissions are often highly correlated with
hydrocarbon (HC) emissions. In the human body, CO can cause oxygen deprivation (hypoxia), displacing oxygen in bonding with hemoglobin, causing cardiovascular and coronary problems, increasing risk of stroke, and impairing learning ability, dexterity and sleep. CO is mostly hazardous in relatively confined areas such as tunnels under bridges and overpasses, and in dense urban settings. In unconfined areas or away from population centres, it will stabilize into CO2 before damage to human health is likely. Carbon monoxide also is involved in intermediate reactions in the production of ozone from VOCs and NOx; elevated concentrations of CO may therefore help contribute to ground-level ozone formation, and retard the decomposition of ozone into oxygen.
(f) Oxides of sulphur (SOx). Sulphur present in fuel will be released as either
sulphate particles (an important component of PM), sulphur dioxide (SO2), or sulphuric acid (H2SO4). SO2 is a major health concern because of its effects on bronchial function, but in metropolitan regions with high concentrations of ambient SO2 , the contribution of the transport sector tends to be secondary to that of manufacturing and/or electricity production. For this reason, concern about sulphur in transport fuels tends to be driven more out of concern about particulates rather than SOx.
Relative sources of pollutants (excluding lead)
In urban areas, manufacturing, electric power generation, household heating and cooking,
and refuse burning can all contribute to pollution emissions through combustion, and the use of various petrochemicals in these sectors can also contribute to VOC emissions. The proportion of transport’s contribution with regard to various pollutants can vary widely, as shown in table II.2 below. By and large, transport tends to be the predominant emitter of carbon monoxide, and often a significant emitter of VOCs, but its contribution to NOx, SO2 and particulates is much more variable across urban airsheds. For example, transport is responsible for 3 per cent of SO2 emissions in Kathmandu, and 86 per cent in São Paulo.

19
Table II.2. Proportion of emissions due to vehicles in selected cities and regions
(Percentage)
City/region Carbon
monoxide
Volatile organic
compounds Oxides of nitrogen
Sulphur dioxide Particles
Beijing 39 75 46 n.a. n.a. Budapest 81 75 57 12 n.a. Cochin 70 95 77 n.a. n.a. Colombo 100 100 82 94 88 New Delhi 90 85 59 13 37 Kathmandu n.a. n.a. n.a. 3 12 Lagos 91 20 62 27 69 Mexico City 100 54 70 27 4 Organisation for Economic Cooperation and Development 70 31 52 4 14 Santiago 92 81 82 25 10 São Paulo 97 89 96 86 42
Sources: Dietrich Schwela and Olivier Zali, eds., “Motor vehicles and air pollution,” in Urban Traffic Pollution (London, E & FN Spon, 1999); Bekir Onursal and Surhid P. Gautam, Vehicular Air Pollution: Experiences from Seven Latin American Urban Centers, World Bank Technical Paper 373 (Washington, DC, World Bank, 1997); and Christopher Zegras and others, Modeling Urban Transportation Emissions and Energy Use: Lessons for the Developing World (Washington, DC, International Institute for Energy Conservation, 1995).
Note: n.a. means figure not available.
B. REGIONAL AND MIGRATORY POLLUTION Many of the pollutants reviewed above, in addition to having an immediate, localized
impact on human health, contribute to regional environmental degradation. These environmental side effects are thought to be associated with long-range transport of air pollutants via ozone, peroxyacetyl nitrate (PAN), sulphuric acid, and other compounds. The effects include acidification, eutrophication, and forest and crop damage from exposure to ozone.
(a) Acidification. Acidification is a reduction in the pH balance of precipitation,
affecting surface freshwater bodies, forests and crops. In freshwater bodies, such as lakes and streams, acidification can increase the concentrations of aluminium, reducing the viability of the water environment to support life. In Europe and the United States of America, this has led to the extinction of a number of species of fish and other freshwater fauna. Acid deposits from rainfall have also been implicated in forest degradation, both by directly injuring certain species of trees, such as high-elevation spruces, and through long-term changes in soil chemistry. There may be similar effects on agriculture, potentially reducing crop yields. Acidification is caused by complex atmospheric reactions from nitrogen and sulphur compounds, in particular nitrogen dioxide, sulphur dioxide, nitric acid (HNO3 ) and sulphuric acid.
(b) Eutrophication. Nitrate run-off from soil depositions can cause biological
“hyperproductivity” in fresh and salt water bodies. This hyperproductivity can stimulate the development of algae, to the detriment of other flora and fauna through complex changes in the

20
ecosystem balance. Eutrophication has traditionally been associated with sewage and fertilizers as the primary source of nitrates. However, recent attention, particularly in Europe, has begun to identify NOx formed during fossil fuel combustion as another potential culprit. NOx can react photochemically with tropospheric ozone and hydrocarbons to form PAN, a relatively stable compound at higher altitudes of the troposphere. PAN, then, is thought to serve as a conduit for delivering nitrogen across large distances–nitrogen that may subsequently decompose into NO2 or nitric acid (contributing to acidification) or precipitate as nitrates onto soils. Ammonia (NH3), which might play an important part in transport applications of certain exhaust after-treatment technologies for NOx control and has been shown to be a significant by-product of catalytic technology in prevalent use (Kean and others 2000), has also been identified as playing a key role in eutrophication. Eutrophication affects predominantly freshwater aquatic and coastal marine systems.
(c) Ozone. In addition to the effects on human health highlighted in annex I to this
report, ozone can cause considerable damage to forests, wetlands and agricultural land. It has been shown to interfere with the process of photosynthesis, by which plants create and store food, creating ripple effects down the food chain and rendering many plants more susceptible to disease, insects and weather. Ozone damage in the United States through lost agricultural productivity is estimated at US$ 500 million per year.
C. ENERGY CONSUMPTION AN D GREENHOUSE GASES
The above sections of this report describe local and regional pollutants associated with
fossil fuel use in transportation–that is, those effects that have an impact on human populations through direct or indirect contact with the pollutant. Transport emissions are also of concern, however, because of the global climate-changing effects they are suspected of causing. While the United Nations Framework Convention on Climate Change (UNFCCC) formally identifies six gases as greenhouse gases, only three are of particular concern to the transport sector: carbon dioxide, methane and nitrous oxide.
1. Carbon dioxide
Carbon dioxide is the most important of the greenhouse gas es, accounting for half of the
annual increase in average global temperatures. It is also the predominant greenhouse gas emitted by motor vehicles. As shown in figure II.3 below, CO2 emissions from transportation have grown steadily since 1970 in all regions of the world, except the economies in transition during the period between 1990 and 1995. Figure II.3 shows that, throughout the world, transport emissions are projected to increase the most in Europe and North America between 1990 and 2020, but that all regions will show substantial increases. The largest increases in transport emissions between 1990 and 2020 are projected to come from Europe, East Asia (excluding China), and North America; however, the fastest rates of growth in CO2 emissions are expected in South and East Asia, including China, as shown in table II.3. Worldwide, between 1990 and 2020, it is anticipated that global emissions from transport will grow by 92 per cent, a figure unmatched by any other sector except power generation.
Globally, transport accounts for about 21 per cent of CO2 emissions and, according to the International Energy Agency (IEA), will remain at about that proportion through 2020. However, this share differs substantially from region to region, as figure II.4 shows. The share of transport sector emissions is highest in Latin America, followed by North America. This proportion is not expected to decrease substantially between 1990 and 2020 in any regions except the Middle East and Africa and, even there, will only drop by a few percentage points. In European Organisation

21
for Economic Cooperation and Development (OECD) countries, the proportion of CO2 emissions attributable to transport is expected to increase sharply, rising from 23 to 33 per cent in 30 years. In 2010, despite increases in emissions from many developing countries, especially in East Asia (including China) and Latin America, the lion’s share of CO2 emissions from transport will come from OECD Europe and North America, as shown in figure II.5.
Figure II.3. Past and projected emissions of carbon dioxide from the transport sector
Source : International Energy Agency, World Energy Outlook (Paris, International Energy Agency/
Organisation for Economic Cooperation and Development, 1998). Note: Bold line representing total should be read with reference to right X axis; individual countries should
be read with reference to left X axis.
0
500
1000
1500
2000
2500
1971 1990 1995 2010 2020
MT
CO
2
0
1000
2000
3000
4000
5000
6000
7000
8000
9000
MT
CO
2
Middle EastAfrica
Latin AmericaSouth Asia
East Asia (excl. China)ChinaEIT
OECD PacificOECD EuropeOECD North America
Total

22
Table II.3. Increases and growth rates of transport carbon dioxide (CO2) emissions
1990-2010 increase
in CO2 emissions from transport (in
MT CO2)
Ranking
1990-2010 percentage growth in CO2 emissions from
transport
Ranking Middle East 126 8 104 5 Africa 90 9 83 7 Latin America 462 4 146 4 South Asia 326 6 323 2 East Asia (excl. China) 746 2 403 1 China 422 5 297 3 Economies in transition 8 10 2 10 OECD Pacific 168 7 58 8 OECD Europe 785 1 94 6 OECD North America 667 3 42 9 Total 3800 92 Notes : MT = megatons; OECD = Organisation for Economic Cooperation and Development.
Figure II.4. The transport sector’s past and projected share of carbon dioxide (CO2) emissions by region
Source : International Energy Agency, World Energy Outlook (Paris, International Energy Agency/ Organisation for Economic Cooperation and Development, 1998).
0%
5%
10%
15%
20%
25%
30%
35%
40%
1971 1990 1995 2010 2020
Middle East
AfricaLatin AmericaSouth AsiaEast Asia (excl. China)China
EITOECD PacificOECD EuropeOECD North AmericaTotal

23
2. Methane
The transport sector is not a large source of anthroprogenic methane, a highly stable, usually non-reactive hydrocarbon. Gasoline, diesel and jet fuel contain minimal amounts of methane. Of concern, however, is the growing use of natural gas in the transport sector; gas consists mostly of methane, and its behaviour over time in distribution systems and refuelling operations, and susceptibility to leakage in road accidents is largely untested. If these systems prove to be vulnerable to leakage over time, methane emissions attributed to the transport sector may increase as use of gas increases. Nevertheless, although uncombusted methane gas is 21 times more potent as a greenhouse gas than CO2 over 100 years, the lower carbon content of natural gas generally offsets any methane emissions, assuming the applications using the gas were optimized for efficiency.
Natural gas is often present in petroleum fields, and in places where there are no energy
markets for this gas, it is often more cost-effective to burn or “flare” it–or worse, simply release it into the atmosphere–than to capture it or inject it back into the ground, thereby needlessly releasing carbon dioxide or methane gas into the atmosphere. Recently, natural gas markets have become robust enough to make flaring increasingly uneconomical; however, the potential for such flaring remains where market demand for natural gas is thin. The use of natural gas in the transport sector could be part of a broader strategy to find market uses for otherwise flared gas in these instances, and help to alleviate methane or CO2 emissions from petroleum-extracting activities.
Figure II.5. Regional proportions of total transport carbon dioxide (CO2) emissions
Source : International Energy Agency, World Energy Outlook (Paris, International Energy
Agency/Organisation for Economic Cooperation and Development, 1998).
0%
10%
20%
30%
40%
50%
60%
1971 1990 1995 2010 2020
Middle EastAfricaLatin America
South AsiaEast Asia (excl. China)ChinaEITOECD Pacific
OECD EuropeOECD North America

24
3. Nitrous oxide
Nitrous oxide (N2O) is the most potent of the greenhouse gases emitted by the transport sector (outside of potential emissions of fluorocarbons in specialized refrigeration applications during transport). The Intergovernmental Panel on Climate Change (IPCC) estimates that, over 100 years, nitrous oxide is 310 times as potent as carbon dioxide. N2O is one of a number of NOx -related compounds both released during combustion and formed subsequently during complex photochemical reactions in the air. Consequently, it is difficult to determine what portion of atmospheric N2O is attributable to which anthroprogenic sources, because, unlike carbon, not all the nitrogen released in combustion ends up as a greenhouse gas; much of it eventually reforms into molecular nitrogen (N2), the basic component of air. N2O is not measured for the purpose of regulating NOx emissions, however, because of its relatively benign direct effects on human health. By definition, efforts to reduce NOx from motor vehicle engines–for example, by adjusting engine stoichiometry, or improving fuel injection–will reduce N2O emissions. However, some exhaust after-treatment NOx control technologies may actually increase N2O emissions as a by-product in reducing NO and NO2 emissions.

25
III. CAUSES OF AIR POLLUTION FROM TRANSPORTATION
Introduction
Though complex in details, the causes of pollutant emissions from transport are simple in
concept: motor vehicles are being used too much, and they are not “clean” enough when they are used.
Solutions, therefore, can conceptually focus on reducing the amount of transport or
ensuring that each unit of transport is cleaner. The status quo is the result of what economists would refer to as a general market failure in transportation: the costs to society of transport’s side effects (such as local and global pollution as well as congestion) are external to the transactions involved in transportation. None of the people involved in various parts of transportation as a whole–vehicle owners, operators, passengers, manufacturers and mechanics–have much inherent incentive to change the behaviour that causes the problems, because the marginal individual benefit of doing so is significantly lower than the marginal individual cost.
In theory, a “polluter” tax, equal to the marginal cost of environmental and social damage
caused by transportation and applied to it (for example, a per-unit-of-emission or per-person-second-of-delay-caused charge) would find the ideal balance between reducing the polluting activity and cleaning up the specific units, with little need for policy analysis or strategizing; market mechanisms would find optimal solutions, because marginal individual costs would be more closely associated with marginal social costs. However, the logistics of both determining the level of such charges and implementing them are complex and fraught with difficulty; in most cases, such polluter taxes, referred to by economists as “Pigouvian” taxes, are not practicable (Eskeland and Devarajan 1996).1 Second-best solutions therefore must be sought, and for these, a more detailed understanding of the sources of vehicular pollution is needed. In a sense, the remainder of this paper constitutes an examination of these second-best solutions. It is important to remember, however, that even though true Pigouvian pricing may be practically or politically infeasible in most instances, understanding how markets might behave were they to be implemented is an important analytical goal, because it can provide a benchmark as to how real world policies are performing.
This paper identifies five principal causes of air pollution from motor vehicles that are
responsible for the range of problems highlighted in chapter II above. These include: (a) excessive vehicle use (especially in urban areas); (b) the persistence of old and outdated technology in the vehicle fleet; (c) poor maintenance of the vehicles in use; (d) unavailability or improper use of appropriate fuels; and (e) the atmospheric, topographic and climatological aspects of metropolitan areas where pollution is concentrated. These categories imply to some degree normative judgements such as “excessive”, “poor”, “too” and “not enough”, judgements that beg the question of how the appropriate levels are determined. In practice, public opinion and consensus determine the range (upper and lower bounds) of these normative debates, with the specific line-drawing exercise being the outcome of political struggles between particular interests. Within that context, it is possible to talk conceptually about the “causes” of
1 Pigouvian taxes are most appropriate where health and monetary costs are well quantified and a clear association between an upstream source and a downstream affected group can be established. Removing lead from gasoline, for example, might be an ideal opportunity for a Pigouvian policy approach.

26
environmental problems of transport, but allocation of “blame” or specification of “correct” policies is a cultural and political process.
A. EXCESSIVE VEHICLE USE IN URBAN AREAS
1. Growth in activity
Schipper and others (2000) break down CO2 emissions from transport into four
component parts: activity, structure, intensity and fuel mix, which constitute the ASIF model and methodology for policy assessment. A refers to the amount of transportation being undertaken, S to the relative shares of different modes and vehicles, I to the fuel economy of vehicles and the degree to which they are used to capacity, and F to the carbon composition of fuels used. The A and S components provide useful, if incomplete, illustrations of why excessive vehicle use is important.
Figures III.1 and III.2 below show ASIF decomposition for the travel sectors of Sweden
and the United States.2 They show the evolution of actual emissions in the transport sector between 1970 and 1995, as well as the evolution of emissions which hypothetically would have occurred if only one of the components had actually evolved during the same period–that is, if the other three components were frozen at their 1990 levels throughout the entire 25-year period. In Sweden, for example, overall emissions increased sharply through 1989, driven somewhat by an increase in the energy intensity of the vehicles and how they were used, but more significantly by an increase in the overall amount of transportation activity. Figure III.1 shows how closely the shapes of the actual emissions and the activity effect lines conform to one another. For the United States (figure III.2), overall emissions also increased throughout the period, although not as sharply as in Sweden, because they were offset somewhat by declining energy intensity, driven in part by the United States corporate average fuel efficiency (CAFE) standards. These standards levelled off in the mid-1980s; as a result, overall emissions of carbon increased at a sharper rate in the 1990s, again driven by growth in activity. Structural effects of these two examples are minimal because of the relative maturity of the transport systems; in developing countries, structural effects would likely exacerbate the trends set in motion by increases in activity.
These figures provide developed country examples of an important phenomenon: in spite
of the public policy focus on technical measures to reduce specific emissions (I or F), the growth in emissions is driven overwhelmingly by growth in transport activity. A similar decomposition, though more complex, can be done for any individual local pollutant–the I and F terms would need to be transformed to represent parameters of interest, but the A and S terms would remain unchanged. Because of activity growth, the effects of technical improvements on overall emissions would always be significantly muted and would cease to be significant once the rate of technical improvement slowed or stopped.
In the developing world, growth in aggregate vehicle usage is expected to vary significantly by region. Walsh has made projections of vehicle usage through 2030 (Walsh 1993). Sharp increases in car and light truck use are expected in a number of developing countries, although most of the car vehicle kilometres travelled by 2030 are still projected to be in North America and the European Union, and North American light truck vehicle kilometres will still be 80 per cent higher than in the OECD Pacific, the next highest region for light truck use.
2 These are shown for illustrative purposes. Lack of adequate, high-quality statistical sources make such an analysis difficult for the equivalent sectors in many developing countries.

27
Walsh projects that the strongest growth in developing countries will be in heavy truck and motorcycle use. Between 1990 and 2030, he projects that motorcycle use will increase at an average of 2½ to 4 per cent per year in several developing country regions, most of this growth concentrated in the megacities of Asia and Africa. Given that production costs for two-wheelers have been declining sharply for over a decade, these projections may be conservative. Heavy truck use is also projected to grow most precipitously in developing countries–at between 3 and 4 per cent per year on average for the period 1990 to 2030. The rate of decrease of energy intensity that would be needed to counteract this increase in activity and maintain parity with current emission levels would have to be extremely precipitous.
Figure III.1. ASIF decomposition for Sweden
50%
60%
70%
80%
90%
100%
110%
1970 1975 1980 1985 1990 1995
Em
issi
on
s re
lativ
e to
199
0
Actual EmissionsActivity Effect (A)Structure (S)Energy Intensity (I)Fuel Mix (F)
Understanding this growth in transport activity, driven largely by the widespread
adoption and use of private motor vehicles in developed as well as developing countries, is crucial. Motor vehicle use is extensive in the developed countries and is increasing rapidly in the developing countries. This use is linked to, but not synonymous with, vehicle ownership. The nature of this relationship is not straightforward, even though distinctions between car ownership and car use are often not clearly drawn in discussions of motorization.
Figure III.3 shows car ownership levels at different incomes for a number of OECD
countries. Conventional wisdom has held that vehicle ownership is a logistical function of income (Dargay and Gately 1999), that is, that vehicle ownership rates can be predicted if income is known, with a reasonable estimate of saturation. However, growth of motorization during the 1990s in certain economies in transition showed that car ownership can increase independently of income, as shown in figure III.4.3
3 In these economies in transition, the expectation of income growth may have been more compelling than income growth per se. In any case, tastes and preferences changed independently of income, which suggests that conventional wisdom may not be entirely accurate.

28
Figure III.2. ASIF decomposition for the United States of America
50%
60%
70%
80%
90%
100%
110%
120%
130%
140%
1 9 7 0 1 9 7 5 1980 1 9 8 5 1 9 9 0 1 9 9 5
Em
issi
ons
rela
tive
to 1
990
Ac tua l Emiss ionsAct iv i ty Ef fect (A)Structure (S)Energy Intensity (I)Fue l M ix (F )
A strong relationship between car use and income has also been observed, but, as figure
III.5 shows, other factors play a role both in the base level of car use and in rates of growth observed relative to rate of growth of income.
At equivalent levels of per capita wealth, Europe, North America and Japan showed
markedly different amounts of per capita car use. These differences in the amount of per capita travel do not reflect fundamental differences in the amount of trip -making; rather, they result from differences in average distances of trips taken (Ewing and others 1996). Such differences in trip distance are accounted for by density of urban development, degree of land-use mixing, and overall size of urban agglomerations. What influences these factors has been the subject of speculation and research for some time. Some believe that particular public policy choices can influence–and have influenced–the rate of growth of both motorization and private car use (Pucher 1995), while others believe the ability of policy to do so to be very limited in this respect (Dunn 1998).
Crucial to the debates around the ability of policy to influence both vehicle ownership
and use rates is the question of the role of motorization in development. To what extent is motorization (acquisition and use of motor vehicles) a necessary component, rather than merely an indicator (or perceived as an indicator), of economic development? And, if motorization is an important component of economic development, is there a Pareto-optimal rate of motorization, or is more always better? These questions have never been formally or rigorously studied,4 even 4 A related question focusing on the causal relationship between infrastructure development (transport and otherwise) and economic growth has been the subject of considerable debate in the literature, but no consensus has been reached. See, for example, D.A. Aschauer, Public Investment and Private Sector Growth: the Economic Benefits of Reducing America’s “Third Deficit” (Washington, DC, Economic Policy Institute, 1990); D. A. Aschauer, Transportation Spending and Economic Growth: the Effects of Transit and Highway Expenditures, report for the American Public Transit Association (Washington, DC, 1991); D.A. Aschauer, “Is public expenditure productive?” in Journal of Monetary Economics 23: 177-200, 1989; R. Barro and X. Sala-i-Martin, Economic Growth (New York, McGraw-Hill, 1995); M.E. Bell, T.J. McGuire, J.B. Crihfield, D.R. Dalenberg, R.W. Eberts, T. Garcia-Mila and J.Z. Man, Macroeconomic Analysis of the Linkages between Transportation Investments and Economic Performance

29
though not hindering the adoption and use of motor vehicles has proven to be a compelling imperative for many policy makers in developing countries. To the extent that either a given rate of motorization is not contributing to economic development, or is an inappropriate indicator of development, vehicle use in a country might be excessive.
Figure III.3. Car penetration levels at given levels of per capita wealth (per 1,000 persons)
0
100
200
300
400
500
600
0 5000 10000 15000 20000 25000
Per Capita GDP, 1990 USD Converted at Purchasing Power Parity
Cars/1000 people
U.S.
Japan
France
W. Germany
Italy
G.Britain/UK
Sweden
Denmark
Australia
Netherlands
Canada
Source : Lawrence Berkeley National Laboratory, Database of Transportation and Energy, Berkeley,
California, 1998.
Note: W. Germany refers to the Federal Republic of Germany (which became part of Germany with the country’s unification in 1990).
(Washington, DC: Transportation Research Board and National Research Council, 1997); M.G. Boarnet, Highways and Economic Productivity: Interpreting Recent Evidence, UCTC Working Paper, No. 291 (Berkeley, University of California Transportation Center, 1995); E. Gramlich, “Infrastructure investment: a review essay,” in Journal of Economic Literature.XXXII: 1176-1196, September 1994; D. Holtz-Eakin, Private Output, Government Capital, and the Infrastructure Crisis, Discussion Paper No. 394 (New York, Columbia University, 1988); and W.W. Rostow, The Stages of Economic Growth (Cambridge, Cambridge University Press, 1971).

30
Figure III.4. Relation between vehicle ownership and income in the economies in transition
compared with Western Europe
Russia
Uzbek.
Slovakia
Estonia
Czech Rep.
Slovenia
Ukraine
0
100
200
300
400
500
600
0 5000 10000 15000 20000 25000
GDP per Capita (1990 US$ PPP)
Num
bers
of p
asse
nger
car
s p
er 1
000
inha
bita
nts
Romania (1991-95)
Poland (1980, 85, 90-95)
Bulgaria (1980, 85, 90-95)
Hungary (1980, 85, 90-92)
W. Germany (1980, 85, 90, 94)
France (1980, 85, 90, 95)
UK (1980, 85, 90, 95)
Sweden (1980, 85, 90, 95)
as labelled (1993)
Source : Lawrence Berkeley National Laboratory, Database of Transportation and Energy, Berkeley,
California, 1998.. Note: W. Germany refers to the Federal Republic of Germany, which became part of Germany with the
country’s unification in 1990; however, separate data continued to be collected for that part of the country for several years following 1990.
Figure III.5. Annual car use at given levels of per capita wealth
(Cars and light trucks)
0
2000
4000
6000
8000
10000
12000
14000
8000 10000 12000 14000 16000 18000 20000 22000 24000
Per Capita GDP, 1990 USD Converted at Purchasing Power Parity
Vehicle Km (cars and household light trucks)/Capita
U.S.
JapanW. Germany
G.Britain/UKSweden
Denmark
AustraliaNetherlands
Canada
Source : Lawrence Berkeley National Laboratory, Database of Transportation and Energy, Berkeley,
California, 1998. Note: Data for “W. Germany” refer to what was the Federal Republic of Germany.

31
2. Distortions leading to excessive vehicle use
The term “excessive vehicle use” is fraught with normative judgements about some ideal
level of car use; in the present context, it is intended to describe the situation in which there are more vehicle kilometres travelled than necessary to achieve and maintain an aspired-to quality of life for a given income or level of wealth. In micro-economic terms, it is linked to the mispricing of the road transport system, excessive car-use being the difference between actual car use and that which would occur were all marginal social costs included in t hose costs perceived and paid for by vehicle users. Conceptually, private vehicle use is a composite of both the number of times that private vehicles are used relative to other transport modes, and the distances they are driven when they are used. These phenomena have been well studied in the United States and Europe, but are poorly understood in most developing countries. Developing a stronger understanding of when and how private vehicles are used in the developing world is therefore an important research priority.
The factors underlying excessive private vehicle use result from the complex interaction
of a cultural phenomenon with an economic one. The cultural phenomenon has been the development of car dependence, understood as a reduction in the elasticity of demand for car travel; this trend seems to increase with motorization, but not equally so across different cultures. The economic phenomenon involves price distortions favouring private motor vehicle use. Both of these phenomena are discussed in more detail in annex II to this report. Price distortions that favour car use are complex, but might include the following:
(a) Fuel subsidies. Many countries, particularly in the developing world, maintain
fuel subsidies which keep out-of-pocket costs lower than border prices. In many cases, these subsidies are not intended as subsidies to the transport sector, but rather to the agricultural or household sectors in the form of price supports to diesel and kerosene, or propane, respectively; nevertheless, vehicle users can and do take advantage of them.
(b) General subsidies to road users. A number of studies suggest or show conclusively that road users do not pay the full amount of the costs they incur, particularly when external costs such as pollution are taken into account (Delucchi 1997; EPA 1999; Willoughby 2000a). Since the costs are paid by society at large, the transaction involves a net transfer of wealth from non-motorists to motorists.
(c) Unseen costs. A number of costs associated with vehicle use are either “fixed” or hidden, and as such are “unseen” by motor vehicle users. Fixed or “sunk” costs are those paid by vehicle operators no matter how much they use their vehicles, and can include the purchase cost of the vehicle, registration fees and taxes. Hidden costs are cost increments that are actually buried in the price of other goods in order to recover costs for infrastructure services provided (such as free parking at a shopping centre). Unseen costs might be taken into account in the decision to purchase a vehicle, but tend not to be taken into account in the decision to use one. This, in turn, leads to an “average cost” rather than a “marginal cost” mentality for car users in determining whether, when and how to make a trip. This can contribute to excessive private motor vehicle use because average costs can always be reduced by more vehicle trips.
(d) Inducement subsidy. The concept of induced traffic and travel is receiving increased attention from transport researchers (annex II to this report reviews this subject in more detail). Induced traffic refers to “increases in motor vehicle use occurring in response to improvements in motor vehicle travel conditions” (Hunt). It refers specifically to that portion of

32
vehicle use that is not attributable to natural growth from population or economic factors. To the extent that improvements in motor vehicle travel conditions are financed either by the public sector or past users of the system (as opposed to future users), the overall effect may be a net transfer of resources from the public as a whole or past system users to “new” users of the road system. The specification and measurement of induced travel is undergoing significant refinement in the transport profession; the further development of these techniques should facilitate study into the question of whether induced demand constitutes a subsidy.
(e) Secondary distortions: capitalization of primary distortions into land values. Over time, the distortions noted above can be capitalized into the relative distribution of land values and real estate prices. This capitalization occurs partially because markets react to demand created by the distortions, and partially because changes in car use induce investment, the anticipation of which can be capitalized into land values.
These distortions can create a snowballing effect, particularly as they interact with the social phenomenon of growing dependence on cars. These interactions are shown graphically in figure III.6 below. Price distortions contribute directly to excessive car use, but they also contribute to longer-term changes in land use and lifestyles, which in turn contribute to the development of inelastic car dependence.
B. AGE OF FLEET AND TECHNOLOGY USED
The prevalence of old vehicles and old technology is a significant contributing factor to
overall emissions of local and global pollutants in developing countries. Average age of vehicles in operation in many developing countries is often greater than 10 years. In Cairo, Egypt, for example, 66 per cent of vehicles are more than 10 years old, and 30 per cent are more than 20 years old. (World Bank 2000). The excessive age of vehicles in developing countries is related to the economics of motorization: as their incomes rise, households purchase newer vehicles and pass on their cars to lower-income households acquiring vehicles for the first time.
For a number of complex reasons, older vehicles are more closely associated with higher
emissions of both global and local pollutants. First, performance deteriorates as a function of age. Catalyst function can deteriorate because of a build-up of trace contaminants, poor maintenance or misfuelling, all of which are a function of age. Vehicles themselves lose energy efficiency through ageing, and the depreciation of vehicles increases the likelihood of neglect and poor maintenance. Secondly, older vehicles are more likely to use obsolete technology, with poor carburetion, inefficient engine design and outdated use of heavy materials. In some countries, particularly those with a highly protected automobile industry, this obsolete technology may even be used in newly built or assembled vehicles. In addition, poor design or absence of adequate regulatory requirements may induce manufacturers or importers simply to choose not to use available emissions control technology (see annex V to this report for a more detailed review).

33
Figure III.6. Pathways to excessive car use

34
C. POOR MAINTENANCE OF VEHICLES
The deterioration in the performance of older vehicles in terms of emissions and
efficiency can be partly attributed to poor maintenance practices. Studies have documented the effect of proper maintenance on reducing emissions. The results from a 1992 pilot repair programme in British Columbia show a marked improvement in emission characteristics of cars over 11 years old after they underwent repair. The programme resulted in a 46 per cent reduction in hydrocarbon emissions, a 48 per cent reduction in CO emissions, and a 58 per cent reduction in NOx emissions.5 (The figure in annex V to this paper is a graphic illustration of the marked difference in deterioration rates for tier 1 vehicles in the United States with and without an inspection and maintenance programme to ensure adequate maintenance.)
Exhaust aftertreatment systems are particularly vulnerable to degradation of actual
emission performance, particularly since many are precious-metal-based catalyst systems susceptible to contaminant poisoning. Misfuelling of catalyst-equipped cars with leaded gasoline, even once or twice, can seriously damage the ability of the catalyst to operate properly. This is particularly likely where leaded fuel is prevalent and significantly less expensive than unleaded fuel. Even if misfuelling does not occur, natural contaminants in the fuel will degrade the operation of the catalyst over time, as will repeated operation under high-speed, high-load conditions. Finally, where exhaust aftertreatment systems are used without corresponding changes in engine technology, such as direct injection technology, there can be a noticeable degradation of fuel economy; vehicle owners and operators, therefore, may often have an incentive to tamper with or disable the aftertreatment system.
In most cases, poor vehicle emission performance due to poor maintenance is associated
with a degradation of vehicle operating characteristics, including fuel efficiency. There is therefore a natural economic incentive for vehicle owners to ensure adequate maintenance of their vehicles. However, in many developing countries, this incentive is often offset by two important economic factors. The first is the availability of capital for repairs. Many vehicle owners in developing countries simply do not have the resources to undertake extensive repairs, other than to keep their vehicles operational. In some instances, they may have the capital, but judge that other investments (such as purchasing additional vehicles for their fleets) are more economically interesting than investing in maintenance that may increase fuel economy. The second factor is the perceived return on vehicle utilization–either in terms of revenue received or utility from vehicle usage–which is often considered higher than the return on fuel savings from efficiency gains through repairs. In economic terms, the perceived payback period for efficiency gains is too long compared with losses from vehicle non-utilization under prevalent implicit discount rates. In areas where this perception is false, a programme of publicity and education might be effective in effecting “win-win” repairs to vehicles.
D. UNAVAILABILITY OR IMPROPER USE OF APPROPRIATE FUELS
The availability of appropriate fuels, or the improper use of fuel in transport sector
applications, is another important factor contributing to air pollution from transport emissions. Fuel is a factor in transport emissions for a number of reasons. First, regulatory authorities may
5 Organisation for Economic Cooperation and Development and United Nations Environment Programme. 1999. Older Gasoline Vehicles in Developing Countries and Economies in Transition: Their Importance and the Policy Options for Addressing Them. United Nations publication, ISBN: 92-807-1796-9.

35
inappropriately specify the fuel. In hot climates, for example, the authorities’ adoption of fuel specifications from colder climates may result in gasoline with higher light hydrocarbon content than necessary for local needs, resulting in excessive and unnecessary evaporative emissions. Secondly, vehicle operators may misfuel or use a fuel inappropriately. A common example is the use of leaded gasoline in vehicles with catalytic exhaust aftertreatment mechanisms. Thirdly, dishonest retailers may substitute or adulterate a fuel. In some instances, gasoline is adulterated with diesel, or both are adulterated with kerosene. Adulteration is often prevalent when there are significant price differences between different fuels.
Different aspects of fuel composition affect the level and types of different emissions, as
noted in more detail in annex VI to this report. Local pollutant emissions are greatly affected by lead and sulphur content, fuel volatility, and the proportion of oxygen, olefins and aromatics in the fuel. The performance of catalytic technology to reduce local pollutants can also be affected by lead, sulphur and other contaminants. Greenhouse gas emissions are indirectly influenced by octane rating of available gasoline; use of higher engine compression ratios (for example, to reduce CO2 emissions rates) requires use of higher octane fuels. Finally, the quality and quantity of lubricant additive to gasoline for use in two-stroke engines can affect emissions of hydrocarbons and particulates.
E. ATMOSPHERIC, TOPOLOGICAL AND CLIMATIC CONDITIONS
The physical conditions related to a metropolitan area–its altitude and topography,
proximity to sea or mountains, prevailing winds, and relative position of an atmospheric inversion layer–can all influence both the amount and speed of dispersion of pollutants, as well as the resulting exposure of the population thereto, and the opportunity for atmospheric chemical reactions. Heat, sunlight and humidity can influence the amount and type of atmospheric reactions that occur, as well as the amount of evaporative (VOC) emissions from vehicles (hot soak) and refuelling systems.
IV. STRATEGIES TO ADDRES S AIR POLLUTION FROM TRANSPORT
This chapter reviews the various logical, strategic choices available to address the causes
of pollution examined in chapter III. The elements of any particular transport-related emissions strategy can be combined through three broad approaches–technical, systemic and behavioural–to produce a strategy tailored to local conditions. In a crude sense, technical approaches seek to reduce the amount of pollution per unit of transport activity, behavioural approaches seek to reduce the amount of activity, and systemic approaches are caught between the two. These categories are somewhat artificial, since it is difficult to discuss one approach without involving the other two, and interactions are so strong that no policy measure is ever based on any one strategy alone.
A. TECHNICAL STRATEGIES
Technical approaches focus on reducing the emissions produced by road vehicles using
the transport system. These approaches involve intervening with the vehicles being used and the fuels they are burning. By definition, these approaches address per unit emissions rather than the amount of activity causing the emissions. Around the world, and particularly in North America, strategic approaches to emissions reduction have focused heavily on technical approaches.

36
For economic as well as practical reasons, overemphasis on technical measures may be inadequate. First, as figures III.1 and III.2 suggested, growth in activity continuously puts pressure on technology gains. In general, the most cost-effective technologies tend to be adopted first. As transportation activity increases, increasingly expensive technological innovations and applications are needed simply to break even with current emissions or energy consumption levels. Some analysts believe that, over time, the prices of technologies inevitably come down so that technology can keep pace with activity growth. Even if such a prescription were valid for developed countries, however, it is not clear that at foreseeable costs, technology alone can reduce the effects of anticipated activity gains in many developing countries. Secondly, technological improvements can exacerbate the growth in activity, through the much-debated “rebound” effect (see box IV.2. for a detailed review). This effect is most often associated with improvements in vehicle energy efficiency, but may also result from improvements in local pollutant emission characteristics, if these improvements lull policy makers into not enacting or prematurely relaxing other (non-technical) measures to address activity. Thirdly, a heavily technological approach to addressing the problem of emissions may result in significant over-investment in technology compared with a socially optimum solution (that is, one that would result if a pure tax on emissions were implemented). For example, to obtain a given level of emissions reduction, car owners may prefer to abstain from a certain amount of car use (for example, for less important trips, or trips of lower marginal utility) rather than pay an incremental cost for emissions control technology. A policy strategy that emphasizes only technology will not allow car owners and users the ability to express these preferences, resulting in a loss of social welfare (Eskeland and Devarajan 1996). The risk of this misinvestment may be fairly minimal in places where vehicle penetration levels are already high, but in the case of developing countries, where car ownership levels are still in the tens per 1,000 persons, the welfare loss caused by such misinvestment could be substantial.
Box IV.1. Economic considerations in strategic evaluation
Economic analysis seeks to determine which of a number of possible interventions will produce
the greatest reduction of the most harmful emissions for a given amount of resources to invest. By definition, this behavioural analysis needs to be multisectoral; it may be cheaper to reduce emissions by inducing behavioural change in another sector besides transport. The World Bank has developed a comprehensive system for urban airshed analysis that has been applied in a number of cities in Asia and Latin America. The experience gained from this air quality management system (AQMS) is reviewed in annex VIII to this report.
Airshed analyses such as the World Bank’s AQMS provide invaluable input into determining how
to spend scarce resources. However, because of the nature of the tools available and perhaps the process itself, the options evaluated are almost exclusively technical ones; systemic and behavioural (demand) interventions have generally not been subject to the same level of rigorous analysis, nor is it immediately clear that they can be. The importance of rigorous economic analysis in cr afting an overall, balanced approach to air quality management, therefore, should not be overstated. Cities are complex places, with numerous overlapping jurisdictions, political interests and simultaneous policy-making activities. The decisions affecting air quality are made by a multitude of actors in different agencies, with different charges and different sets of resources available; in addition, these agencies often have different objectives. Since opportunities for interventions that affect air quality, energy consumption, greenhouse gas emissions and quality of life present themselves every day, focusing solely on a formalized strategy of economically evaluated options can lead to missed opportunities. For all the above reasons, an effective air quality approach must combine tactical fluidity with rigorous strategic economic analysis.
In the context of the above considerations, the remainder of this section is devoted to a
brief review of vehicle- and fuel-based strategies.
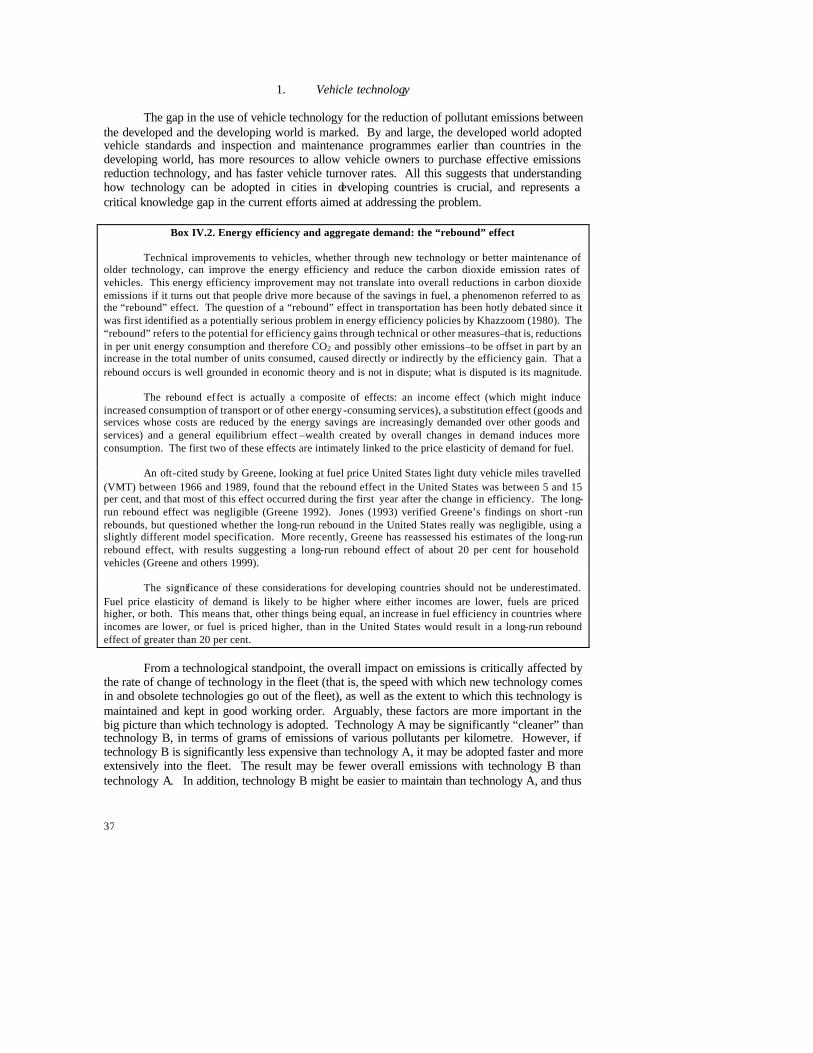
37
1. Vehicle technology The gap in the use of vehicle technology for the reduction of pollutant emissions between
the developed and the developing world is marked. By and large, the developed world adopted vehicle standards and inspection and maintenance programmes earlier than countries in the developing world, has more resources to allow vehicle owners to purchase effective emissions reduction technology, and has faster vehicle turnover rates. All this suggests that understanding how technology can be adopted in cities in developing countries is crucial, and represents a critical knowledge gap in the current efforts aimed at addressing the problem.
Box IV.2. Energy efficiency and aggregate demand: the “rebound” effect
Technical improvements to vehicles, whether through new technology or better maintenance of older technology, can improve the energy efficiency and reduce the carbon dioxide emission rates of vehicles. This energy efficiency improvement may not translate into overall reductions in carbon dioxide emissions if it turns out that people drive more because of the savings in fuel, a phenomenon referred to as the “rebound” effect. The question of a “rebound” effect in transportation has been hotly debated since it was first identified as a potentially serious problem in energy efficiency policies by Khazzoom (1980). The “rebound” refers to the potential for efficiency gains through technical or other measures–that is, reductions in per unit energy consumption and therefore CO2 and possibly other emissions–to be offset in part by an increase in the total number of units consumed, caused directly or indirectly by the efficiency gain. That a rebound occurs is well grounded in economic theory and is not in dispute; what is disputed is its magnitude.
The rebound effect is actually a composite of effects: an income effect (which might induce
increased consumption of transport or of other energy-consuming services), a substitution effect (goods and services whose costs are reduced by the energy savings are increasingly demanded over other goods and services) and a general equilibrium effect –wealth created by overall changes in demand induces more consumption. The first two of these effects are intimately linked to the price elasticity of demand for fuel.
An oft-cited study by Greene, looking at fuel price United States light duty vehicle miles travelled
(VMT) between 1966 and 1989, found that the rebound effect in the United States was between 5 and 15 per cent, and that most of this effect occurred during the first year after the change in efficiency. The long-run rebound effect was negligible (Greene 1992). Jones (1993) verified Greene’s findings on short -run rebounds, but questioned whether the long-run rebound in the United States really was negligible, using a slightly different model specification. More recently, Greene has reassessed his estimates of the long-run rebound effect, with results suggesting a long-run rebound effect of about 20 per cent for household vehicles (Greene and others 1999).
The significance of these considerations for developing countries should not be underestimated.
Fuel price elasticity of demand is likely to be higher where either incomes are lower, fuels are priced higher, or both. This means that, other things being equal, an increase in fuel efficiency in countries where incomes are lower, or fuel is priced higher, than in the United States would result in a long-run rebound effect of greater than 20 per cent.
From a technological standpoint, the overall impact on emissions is critically affected by
the rate of change of technology in the fleet (that is, the speed with which new technology comes in and obsolete technologies go out of the fleet), as well as the extent to which this technology is maintained and kept in good working order. Arguably, these factors are more important in the big picture than which technology is adopted. Technology A may be significantly “cleaner” than technology B, in terms of grams of emissions of various pollutants per kilometre. However, if technology B is significantly less expensive than technology A, it may be adopted faster and more extensively into the fleet. The result may be fewer overall emissions with technology B than technology A. In addition, technology B might be easier to maintain than technology A, and thus

38
less susceptible to in-use deterioration. For these reasons, understanding costs and a willingness to adopt are crucial elements in a technology strategy. This section briefly examines vehicle technologies available, crucial factors affecting rate of change of technology in the fleet, and modalities of affecting in-use fleet maintenance.
(a) Changing/improving vehicle technology
Changes in vehicle technology involve a combination of introducing technology into new
vehicles brought into a country’s vehicle fleet (incremental changes) and altering vehicles currently in use with newer technologies to reduce emissions and/or enhance efficiency (retrofitting). Both types of changes can either upgrade the performance of current gasoline and diesel-based internal combustion technology or effect a shift to an alternative fuel.
Improvements to gasoline and diesel-based internal combustion engine (ICE) technology.
Technological upgrades of current technology are inherently attractive because the marginal costs are relatively low: supply and distribution infrastructures for the fuels are already in place (both physically and institutionally), the technical know-how to keep such technology operational is widespread, and the baseline costs of these technologies form a benchmark against which other technologies and fuels are judged. Technological changes can affect tailpipe emissions of “local” pollutants (NMHC, CO, NOx and PM), evaporative emissions (mostly NMHC), engine energy intensity, vehicle energy intensity, and emissions of greenhouse gases. The distinction between engine energy intensity and vehicle energy intensity is an important one; the former refers to the amount of energy required to produce a given amount of work at the engine crankshaft, while the latter refers to the overall amount of energy required to move the vehicle a given distance. In developed countries over the past 20 years, engine energy intensity has been reduced significantly through technology; at the same time, however, largely because of changes in consumer demand for types and features of vehicles, vehicle energy intensity has stagnated (Schipper and others 2000).
A range of technical improvements to vehicles can be combined to yield significant
improvements in the emission performance and efficiency of ICE engines. These improvements usually operate on one of five aspects of the vehicle, as shown in table IV.1.
Table IV.1. Areas of application of vehicle technology for
internal combustion engine (ICE) vehicles Technology applied to: Affects Engine and fuel system Tailpipe emissions of local pollutants, engine energy
intensity (moderate evaporative reduction possible) Transmission system Vehicle energy intensity and GHG emissions Aftertreatment of exhaust Tailpipe emissions of local pollutants (can cause moderate
increases in vehicle energy intensity) Fuel-supply and crankcase treatment
Evaporative emissions
Vehicle/tyre design for friction reduction
Vehicle energy intensity and GHG emissions
These interventions are reviewed in more detail in annex III to this report. Alternative fuels and propulsion. Various fuels and alternative propulsion systems may
be used as alternatives to conventional gasoline and diesel. The alternative options most

39
discussed for implementation in the transport sector are compressed natural gas (CNG); liquefied petroleum gas (LPG); electric vehicle technology using either batteries, fuel cells or flywheels; alcohol-based fuels produced from different organic and inorganic feedstocks; and various synthetic fuels for heavy -duty engines (such as Fischer-Tröpsch diesel, di-methyl ether [DME], or bio-diesel). These fuels have been proposed both as stand-alone alternative fuels, and as part of hybrid applications with conventional gasoline and diesel and with each other.
The appropriateness of any of these technologies in both the near and long term is highly
context -specific; an alternative fuel technology that makes sense in one location may not make sense in another. The factors that determine this appropriateness are the long-term goal and objective of the contemplated use of alternative vehicles, the availability of feedstock sources and the international markets and fluctuations to which they are susceptible, the realistic long-run potential for alternative vehicle penetration, and the institutional realities associated with technology adoption as well as their impact on the rate of that adoption. Decisions regarding alternative fuels and alternative propulsion vehicles need to be based on a number of complex factors, including: (a) a full life-cycle estimate of emissions from the various fuels, including the range of different pollutants and, for non-GHG emissions, locations where emissions occur; (b) a dynamic assessment of competing technologies (including conventional gasoline and diesel) factoring in the cyclical nature of product development and scaling the baseline to resources and an appropriate time frame; and (c) a clear understanding of what the appropriate role of the public sector should be with regard to any particular technology. These considerations are reviewed in detail in annex IV to this report.
(b) Rate of change of vehicle technology in the fleet
The extensive review of appropriate technologies in the emissions-reduction literature
and at conferences can often mask the underlying importance of the rate of change of technology. Over the short and medium term, the rate of change is more important than the technology itself for reducing transport emissions, particularly for fleets where baseline emission control mechanisms are minimal or non-existent. In assessing any technology, therefore, the analysis of technological options needs to be focused on how rapidly the different technologies can be deployed and widely used in the fleet, rather than being limited to the relative emissions and energy consumption capability of each technology. The need to assess the rate of change is often put in terms of evolutionary versus leapfrogging strategies for technology adoption, although such a dichotomy can be deceiving. In some applications, conventional technology (for example, installing catalytic converters in a retrofit strategy for gasoline vehicles) might be prohibitively expensive, while a leapfrog alternative (such as conversion to CNG or LPG) might be more cost-effective and bring about more rapid change in in-use technology. In other applications, an evolutionary approach might be more effective in bringing about rapid implementation of technology change. (For example, for an investment of US$ 15 million, a bus operator might be able to purchase 50 CNG buses, not including related investments needed for refuelling, or 75 “clean” diesel buses with two-way catalysts and particle traps.)
These factors need to be taken into account in devising a particular strategy. The strategy
can also proactively target the rate of change of in-use technology to try to induce the technology to turn over faster. As noted above, this can be accomplished by encouraging vehicle turnover, or by targeted vehicle retrofitting.
Encouraging vehicle turnover. Vehicle turnover refers to the rate at which older, poorly
performing vehicles are retired from use and replaced by newer ones. It is largely an economic decision by vehicle owners, and requires economic incentives to make an impact. High

40
acquisition taxes, as well as poorly designed policies that inadvertently constrain supply, are two examples of public policy that can discourage vehicle turnover. At a minimum, strategic assessments of government policy on air pollution from transport need to review the range of government policies that might be unnecessarily making the turnover of vehicles uneconomical. Some of these policies might be the result of a deliberate decision to restrain vehicle ownership. Policies that allow vehicle owners to acquire replacement vehicles while exempting them from the same pricing burdens borne by those acquiring new cars might help in this respect; such policies have been developed successfully in Singapore. An alternative policy would be to have recurring vehicle ownership fees, such as registration, linked to age-related characteristics of the vehicle, such as emissions or fuel efficiency, or to the age of the vehicle itself. Rethinking the strategic logic of restraining vehicle ownership in favour of a strategy to variabilize the lifetime costs associated with vehicle ownership and use might be a more conceptually and administratively simple approach, however. Reducing the direct costs of vehicle ownership, while increasing those of using the vehicle, may be just as effective, in the long run, at restraining vehicle ownership 6 while minimizing the economic incentives to hold on to poorly functioning vehicles.
Vehicle retrofitting. Retrofitting of in-use vehicles is another strategy to accelerate the
turnover of technology in the fleet. Logistically, retrofitting is easier to accomplish on fleet vehicles than on individually owned vehicles, so retrofit strategies often target public transport, urban freight delivery and corporate fleets first. For both gasoline and diesel vehicles, retrofits often involve the addition or replacement of fuel supply in order to facilitate the use of an alternative fuel such as CNG, LPG or an alcohol fuel, either fully dedicated or in “bi-fuel” application (the operator can choose which fuel to use). Such retrofits also allow for the addition of exhaust aftertreatment technologies such as catalytic converters. Diesel vehicles can be fitted with these exhaust aftertreatments, even without changes in the fuel supply, at a reasonable cost; retrofitting (previously uncontrolled) gasoline vehicles with exhaust aftertreatment technologies without a change in fuel supply, however, tends to be cost-prohibitive. Upgrading in-use catalytic control equipment for gasoline vehicles (for example, replacing a two-way with a three-way catalyst or adding a close-loop air/fuel control system) is potentially cost-effective, but may not be particularly relevant to those cities in developing countries with the worst air pollution problems.
Not surprisingly, there are few examples of successful gasoline-to-gasoline retrofits
involving the installation of exhaust aftertreatment technology. In Germany in the late 1980s and early 1990s, 7 a voluntary retrofit programme using tax credits as incentives provided for the installation of three-way catalysts with catalyst models in use in production models at the time the retrofit occurred. In addition to the tax credit incentives, general road-tax measures based on the emission performance of cars provided a further incentive for owners of older vehicles to participate in the programme.
(c) Vehicle maintenance
Vehicle maintenance is a crucial part of any technical strategy to reduce per kilometre
emissions of pollutants, both because of the proportion of in-use vehicles compared with new
6 Facing a stream of high lifetime costs because of the costs of using a vehicle, combined with the costs of vehicle storage, some individuals and households may choose not to acquire one in the first place. 7 The German Democratic Republic and the Federal Republic of Germany were unified into one country, Germany, in October 1990.

41
ones in any given year, and because of the vigilance required to ensure that exhaust aftertreatment technology is well maintained. Although emission and fuel-efficiency performance deteriorate with age, good maintenance practices can greatly reduce the rate of this deterioration. Often, this maintenance involves simple, inexpensive periodic attention to aspects of motor vehicle operation that can significantly affect vehicle performance, such as oil and filter cleaning and replacement, spark plug replacement, spot checks for leaks in the fuel and other fluid delivery systems, and maintenance of correct tyre pressure.
The principal logistical problem is designing cost-effective measures that ensure that the
vehicles most in need of maintenance actually receive it. Numerous studies on cities in both developed and developing countries show that a minority of vehicles in urban areas are usually responsible for a majority of the vehicular emissions; a recent World Bank strategy review suggested a rough rule-of-thumb ratio of 20:80 (20 per cent of vehicles produce 80 per cent of emissions). Consequently, it has been frequently noted that programmes seeking to increase maintenance practices of in-use vehicles will be most cost-effective if targeted, at least initially, at this minority. These “gross emitters” are not necessarily only the vehicles with the worst per kilometre emission rates; they may also be vehicles that have moderately poor emission performance, but are heavily used.
The objectives of a vehicle maintenance strategy would therefore be to increase both the
number of cars being maintained–initially perhaps focusing on gross-emitter/high mileage vehicles–and the frequency with which maintenance is carried out on those vehicles that already receive some maintenance. A survey of vehicle maintenance strategies in both developing and developed countries suggests that there are three key elements in this approach: emissions testing; driver education and training; and ongoing manufacturer liability.
Emissions testing. There are a wide variety of emissions-testing programmes in operation
around the world, distinguished by how vehicles for tests are identified, where the tests are performed, which pollutants are tested and how the tests are carried out, and what obligations vehicle owners have following the tests. The most inexpensive programmes involve small-scale, roadside tests for black smoke, carbon monoxide and hydrocarbons. Vehicles are usually identified for testing by simple visual checks. Such a programme can be a rapid and inexpensive means of targeting the worst of the worst vehicles, but more elaborate testing and enforcement mechanisms are needed for such a strategy to have a more profound impact. Many jurisdictions have implemented standardized inspection and maintenance (I and M) programmes, in which vehicles must undergo routine and periodic testing for emissions. Some jurisdictions have tested or are considering using remote sensors for CO and HC emissions and, in developing countries, on-board diagnostics of emissions control systems are increasingly used to alert drivers instantaneously to failures. Some of these measures are reviewed in more detail in chapter V.
The effectiveness of emissions testing as a strategy is linked to institutional arrangements
for both standard-setting and the mechanism for enforcement. The former requires some statistical baseline on emissions prior to programme design in order to determine the threshold for a politically acceptable failure rate. The latter requires, at a minimum, a means to track which vehicles are registered to whom, and to account for vehicles taken out of service. In many countries, particularly in Africa, the statistical and institutional infrastructures to meet these minimal requirements are inadequate and in need of development.
Driver/fleet manager education and training. The importance of training and education
for professional drivers and fleet managers is becoming increasingly recognized, because of the high annual kilometrage for which these actors are responsible. For truck drivers, awareness of

42
the effects of various aspects of vehicle use, such as poor (non-aerodynamic) loading of cargo, poor tyre pressure, and water infiltration into the fuel tank, can make significant differences in vehicle efficiency and pollutant emissions, and can reduce costs for the driver/owner as well. For urban professional drivers such as taxi or micro-bus drivers, education and training can help to identify aggressive driving behaviour responsible for increased congestion from accidents, increased emissions and higher vehicle operating costs. Preliminary results from such programmes in Brazil have been promising.
Ongoing manufacturer liability. In the United States, vehicle manufacturers are held
liable for the emissions performance of vehicles in use for a period of 10 years after first use. While the purpose of such a liability is to improve the quality of new vehicles being sold, the practical effect is that vehicles can be recalled if tests of sample in-use vehicles do not meet standards. This, in turn, shifts some of the risks, and thus costs, of in-use vehicle performance maintenance from vehicle owners to the original manufacturer. There may be mechanisms to adapt the ongoing manufacturer liability framework in the United States to developing countries in order to reduce costs of I and M programmes.
2. Fuel technology
Improvements in the specification of available fuels can benefit the cause of emissions
reduction in three ways. One of these is a fairly direct reduction in emissions of certain pollutants. With regard to lead and sulphur, reducing their content in fuels can directly reduce emissions of pollutants associated with them, such as lead aerosols or sulphate-based particulates (typically less than 40 per cent of PM mass). For other pollutants, such as carbon monoxide and non-methane hydrocarbons, oxygenation of fuels can alter the combustion environment in which they are produced and thereby reduce emissions. Unlike technical changes to vehicles, the positive impact of these fuel changes is immediate; no time is needed for the technology to “cycle” into widespread use. In spite of this time benefit, however, the changes to fuel supply that have a direct impact tend to be less cost-effective than many vehicle-based measures (Nevin and Barrett).
The second benefit resulting from improvement in the specification of available fuels is
that it facilitates the use of various exhaust aftertreatment technologies (see subsection 1 above on vehicle technology). Lead can poison platinum catalysts, permanently neutralizing them. In addition, the presence of sulphur in the fuel and exhaust stream can disable sensitive, advanced catalytic technologies–such as those used in particulate trap regeneration or de-NOx technologies for use with lean-burn or compression-ignition engines. In some diesel applications, use of these devices where very low sulphur diesel is not available may even result in higher particulate emissions than if the devices were not used at all. For these reasons, it is difficult to assess fuel and vehicle strategies separately; the cost-effectiveness of a range of measures in the one is heavily dependent on simultaneous measures taken in the other.
This interdependence has been reflected in the design of research programmes to assess
the cost-effectiveness of various fuel and vehicle measures in the United States, Europe and Japan. The first Auto/Oil programme in Europe was notable in that it resulted in a significant dispute between the petroleum and automobile industries; the implication of the cost-effectiveness ranking of measures was that, in the optimized plan, 85 per cent of the costs would be borne by the automobile industry, while 15 per cent would be borne by the petroleum industry. A system of tradable permits might help to negotiate this difference in costs, but no such mechanism was in place for the first Auto/Oil programme. In response, the Association of European Motor Vehicle Manufacturers (ACEA) formulated a set of fuel improvement measures

43
that eventually became the World-Wide Fuel Charter (ACEA and others 2000), to which the petroleum industry remains generally opposed.
A third benefit of technological improvements to fuels is that, like technical
improvements to vehicles, the costs are ultimately passed on to consumers but, unlike the costs for vehicles, they are passed on as variable rather than up-front costs. Variable costs lead to a more efficient allocation of trip-making behaviour than do up-front or fixed costs.
The principal specification options available to improve the quality of available fuels
include reducing lead content, increasing oxygen content, increasing generally available octane ratings to international norms (generally between 87 and 93 research octane number [RON]), reducing sulphur content, reducing fuel volatility, otherwise altering the hydrocarbon blend to respond to particular local environmental needs, and pre-mixing of lubricant with gasoline for two-stroke vehicles. These options are reviewed in more detail in annex VI to this paper. It is crucial to consider all of these specification options comprehensively, because particular solutions to any one problem–for example, removing lead from gasoline–have implications for other aspects of fuel quality, such as oxygen content, fuel volatility and prevalence of toxic emissions.
B. S YSTEMIC STRATEGIES
A systemic strategy to influence transportation emissions focuses neither on the
technology of the vehicles using the transport network, nor on the choice behaviour of individuals using that technology. Rather, it addresses the network itself in order to change the conditions of traffic flow so that vehicles can operate at their technical optima in terms of both pollutant emissions and energy efficiency. This strategy is thus linked with broader strategies to combat congestion.
The overall impact of system or network approaches to air quality is controversial,
largely because the arguments for the use of systemic interventions as a means to reduce transport sector emissions are often based on observed heuristic relations between traffic speed, flow and emission rates, ignoring behavioural feedbacks that can reduce or eliminate the aggregate effect of these reductions.
1. Activity/structure/intensity conflicts in systemic approaches
In general, systemic interventions act to increase or decrease the capacity of transport
networks. Changes made to the capacity of a network can help to increase average speeds of vehicles running along a network, as well as reduce the amount of stop -and-go traffic. Both of these changes are associated with increased operating efficiency of vehicles –that is, a reduction in energy intensity–as well as a reduction in pollutant emission rates. Increasing capacity, however, is also associated with induced demand for travel, that is, an increase in overall levels of activity and, in some cases, structural shifts to modes benefiting from a capacity increase. The dynamics of these effects are reviewed in more detail in annex VII to this report. In the case of road facilities for private vehicles, it is not possible to generalize out of context whether the net effect of a particular systemic intervention will increase or decrease overall emissions. For public transport, however, network enhancements can allow structural and intensity changes to work in synergy; improvements to flow along transit networks can give public transport a structural advantage over private vehicles while also decreasing vehicle energy intensity and emission rates.

44
2. Smoothing flow versus restraining traffic The above review suggests that systemic strategies might try to smooth traffic flow and
eliminate the stop-and-go nature of urban traffic, and in the process perhaps increase average travel speeds, or they might try to restrain travel demand using systemic impediments to deter vehicle use. These objectives are not necessarily mutually exclusive but, if they are not carefully designed, they frequently are. The first objective does not necessarily have to be implemented through a physical expansion of facilities; traffic management, even inexpensively implemented with basics such as improvements in signalization, channelization and on-street parking control, can have a significant impact on smoothness of flow by increasing operational capacity. Similarly, pavement management to eliminate potholes and ensure separation of slower moving traffic, such as animal transport, can also effectively increase capacity and smooth traffic flow.
A different systemic approach can be attempted by working to restrain vehicular travel
demand through traffic restrictions, using techniques often grouped together under the heading traffic control measures (TCMs). These restrictions are accomplished either by restricting where traffic can go, or by using physical or design features to slow traffic down (traffic “calming”). Experience with TCMs in developing countries is summarized in annex X to this report.
3. Congestion pricing
In practice, a strategy that increases traffic flow and a strategy that restrains it both affect
the costs of travel: the former reduces it, the latter increases it. Congestion pricing is a hybrid of the two, and represents an efficient market allocation of these two objectives since, if properly implemented, it shifts aggregate costs from time-delay to out -of-pocket expenses. Congestion pricing involves charging each vehicle the marginal cost for the delay it imposes on other vehicles. The cost charged is by definition variable, because it depends on the number of other vehicles using the roadway. Road space can therefore be better allocated according to the rules of supply and demand. Because of this flexibility, congestion pricing is more effective at balancing the intensity/activity dichotomy than are physical measures.
4. Conclusion: are systemic strategies effective?
To date, there is little empirical evidence to show that air quality can be improved simply
by increasing traffic flow. The lack of evidence is partly related to the conflicting effects of smoothing traffic flow and induced demand, but also because the time and spatial scales involved are so large that “controlled” experiments to test such a hypothesis are not feasible. The current simulation and modelling tools are inadequate to shed light on the question, because models with adequate feedback mechanisms for land-use change, trip generation, destination choice, and route assignment are still not in widespread use, even in developed countries. Absent the ability to use pricing interventions in conjunction with changes to road network capacity, the most appropriate air quality strategies in most instances will therefore involve technical or behavioural approaches.
C. BEHAVIOURAL STRATEGIES
Although technical and systemic approaches to transport emissions reduction clearly have
behavioural elements to them, the term “behavioural strategies” as used here encompasses policy approaches that seek to influence the amount people travel and the means by which they choose to travel. These strategies generally involve either the substitution of alternative travel modes to

45
reduce the use of a pollution-intensive vehicle,8 or substituting another means of access (for example, obtaining goods and services, participating in activities) for transportation.
1. Substituting alternative modes to reduce car use
(a) General considerations
Substituting travel by car with public transport, non-motorized modes (including
walking) or certain two-wheelers will often result in a reduction in energy use and emissions, as will the use of carpools. Modal substitution is therefore often suggested as one of the principal behavioural strategies to reduce the deleterious impact of the car. This section contains a review of certain aspects of the strategies involved in each of these modal substitutes, prefaced by some general considerations about a mode-substitution strategy.
Occupancy and vehicle maintenance. The substitution of alternative modes of travel can
potentially help to reduce transport emissions in two particular ways. First, the “alternative” mode might allow for higher vehicle occupancy than the car. Consequently, the emissions associated with each individual trip may be reduced, even if the individual vehicles used produce more pollutant emissions and use more energy than individual cars. Secondly, the alternative mode might have inherently better emissions characteristics than the car, as is certainly the case with non-motorized transport (NMT) but might also be the case for well-managed public transport fleets, for which professional fleet management may result in better maintained vehicles than private cars.
Substituted v. additional trips. Making a trip by an alternative mode helps to reduce
emissions only if it substitutes for a trip that would have otherwise been made by car. The difficulty of gauging trip substitution by modes is a perennial problem in transport planning, and one that is even trickier in developing countries because of the frequent lack of adequate statistics on travel behaviour in these countries. In the United States, for example, a detailed analysis of modal choi ce based on disaggregate household data suggests that most walking trips do not substitute for other trips, but rather are made in addition to these trips. Understanding whether trips are additional or substitutional requires disaggregate information about households, their activity patterns and the trips they make as part of their regular work week.
The concept of induced demand, as reviewed in annex VII to this report, is as viable for
public transport as it is for new roadways. Only a portion of riders observed on a new metro or light rail service may be substituting the service for a trip that would have been made by car; some may be substituting the metro trip for one formerly taken by bus, and others may be making new trips because of reduced time or added convenience. The second order effects of these new trips may be so complex that, over time, they can actually induce more car trips. For example, the metro might dramatically increase the incidence of trip-making between two nodes along the metro, and a portion of these trips would be made by car; such has been the experience of some high-speed rail links in Europe (Plassard 1998). In addition, if the metro opens up new areas of the metropolitan region for development, and these areas are developed with low densities for wealthy households, local trips within these outlying areas would probably be made by car. The attraction of making non-discretionary trips (such as the journey to work) by public transport might therefore induce a significant amount of discretionary trip-making by car (Noland and Cowart 2000).
8 This includes encouraging car travel as a passenger, rather than as a driver.

46
The distinction between substituted and induced trips must take into account changes
over time, particularly in developing countries. Alternative modes do not appear overnight–they must be investigated, planned and constructed. In the intervening time, changes will have occurred to underlying travel patterns and modal choices. Consequently, in planning for public transport, for example, the concept of substitution involves examining two hypothetical future cases, and not a comparison of already established patterns.
Separability of vehicle ownership from vehicle use. Vehicle use is often assumed to be
immutably linked to vehicle ownership. However, there are many examples of places with high rates of motor vehicle ownership, but also high rates of public transport usage. Zurich and Frankfurt, for example, both have very high rates of car ownership by world standards, even though fewer than 40 per cent of trips are made by car in those cities9 (GTZ 2001). Places that have been successful at inducing trip substitution (such as Curitiba, Brazil; Switzerland; and the Netherlands) have recognized that the link between car ownership and use is not frozen. Crucial to this separability is careful attention to land-use policy and concerted policy choices to locate commercial and administrative amenities in close proximity to public transport. In addition, encouraging variabilization of costs, as is done in the Netherlands, can greatly encourage the use of public transport modes (Willoughby 2000a). In general, high sunk costs in transport are associated with greater car use than more variable costs. Throughout the 1980s and 1990s, for example, Denmark imposed particularly high car acquisition and registration taxes as a means of discouraging car ownership. In 1994, Danish car ownership (cars per 1,000 persons) was 30 per cent lower than the European average. However, annual car kilometrage per person in Denmark was roughly on a par with the European average. This means that the average car is driven significantly more in Denmark than in other European countries: in 1994, the average Danish car was driven 43 per cent more than the average European car (LBNL 1998). The relatively high fixed costs of cars in Denmark are probably a factor in this high average kilometrage.
Individual measures will be ineffective. Studies of different cities frequently propose any
number of conventional and innovative measures to shift mode choices towards public transport and non-motorized modes. These might include: expansion of service or subsidies for public transport, increasing costs of motor vehicle use, cash incentives to lure potential drivers to alternative modes, land use measures to make public transport access less costly or car use more costly. Some measures are more appropriate in particular metropolitan areas than others. Almost ubiquitously, however, the synergies created by combinations of measures are significantly more effective than any of the measures on their own. Areas that have higher levels of modal mixing, sometimes even despite fairly high car ownership levels (such as Switzerland; Curitiba, Brazil; Singapore; and Stockholm), have pursued different measures to entice their populations to reduce car use, the measures depending on income of the population and other attributes of the area. What these strategies have in common, however, is a multi-pronged strategy of synergistic measures (Ang 1996). In various contexts, conjoint, willingness-t o-change, and discrete choice studies looking at any one measure repeatedly show that there is significant reluctance to reduce car use in favour of an alternate mode when respondents are presented with only a single carrot or stick (Swait and Eskeland 1995; Baldassare and others 1998).
9 Zurich has a car ownership rate of over 450 cars per 1,000 persons, yet the car accounts for only 28 per cent of all trips. Frankfurt has an even higher rate of car ownership (nearly 525 cars per 1,000 persons) and still maintains a respectable 39 per cent car mode share, with a quarter of all trips made by public transport.

47
(b) Specific strategies
((ii)) PPuubblliicc ttrraannsspp oorrtt For developing countries, an explicit strategy of using public transport to alleviate air
quality would involve trying to restrain the rate of growth of car use by improving public transport services precisely in corridors and for socio-economic groups that would otherwise be expected to adopt widespread car usage. These improvements in public transport services would need to be sufficiently attractive to hold back the rate of switching to car use. If properly planned and implemented, such a strategy could be very effective, and might address problems of congestion as well as air quality. It might be accomplished equally as well with buses (for example, Quito or Curitiba) as with heavy or light rail (Tunis, for example).
However, for many jurisdictions, this strategy would conflict with another fundamental
goal of public transport policy: providing low-cost transport services to the poor. Reconciling the two goals of alleviating air quality by providing high-quality service for choice riders, and providing low-cost transport services to “captive” riders is particularly difficult in metropolitan areas dominated by traditional, State-owned, monopolistic public transport operators. Often, these operators are dependent on public funding to cover their operating expenses and have little ability, either legally or practically, to raise revenue via fare boxes. In heavily congested cities such as Cairo and Bangkok, public operators have attempted to segment their operations by market by developing premium services for higher-income, “choice” riders, while continuing to provide basic service to lower income riders. A practical consequence, however, is not the cross-subsidization of services for lower-income riders, but rather the diversion of resources (for investment and maintenance, for example) from services oriented to lower income riders, to services oriented to higher income riders.
The result can be a rapid deterioration of service–both in frequency and reliability–for
low-income riders, creating a vacuum that unregulated, informal sector transport providers rush to fill. The growth of these services has huge implications for air quality in cities in developing countries, as well as for urban congestion. In many metropolitan areas, the vehicles used by these operators are old, overused and poorly maintained. Because of their limited seating capacity, more of them are required to provide a given level of service than with traditional bus transport. In addition, they tend to idle excessively because of the need to find, as well as load, passengers. Finally, the hyper-competitive nature of the sector is associated with aggressive driver behaviour, including excessive speeds in order to reach potential customers first, and stopping to collect potential customers in ways that aggravate congestion. Such behaviour is associated with rapid accelerations and decelerations, a driving style that can exacerbate already bad particulate emissions for diesel vehicles, which most micro-buses are. In addition, in congested areas of East Asia, unregulated activity of the informal sector is associated with the use of two-stroke, two- and three-wheelers, which intensify air quality probl ems because of the poor emissions characteristics of the technology used.
Strategies that do try to target “choice” riders–those riders who might otherwise use
private automobiles–should recognize that, in most developing country contexts, these riders may be more time-sensitive than cost-sensitive. This means that they are more likely to respond to changes in average speeds and frequencies than to reductions in prices. Changes in out-of-pocket costs could rarely come close to the value-of-time for choice riders. In Cairo, for example, metro use by the inhabitants of a wealthy neighbourhood with good metro access accounts for 44 per cent of all trips, an even higher percentage than for private automobiles (Metge 2000). The speed

48
and frequency of this service attracts these riders, despite high levels of car ownership in this area.
For surface vehicles in many cities in developing countries, vehicle overloading is a
particularly significant safety and traffic management problem, and frequently has implications for gender access and equity as well. The potential solutions to this problem, however, have implications for air quality and energy use. The solutions may involve using more vehicles to better distribute passengers which, all else being equal, will increase emissions. However, because of the income levels of both riders and vehicle operators in those routes that tend to be overcrowded, the overcrowded vehicles currently used also tend to be high emitters of pollutants; solutions geared to replacing (for example, with larger vehicles) rather than supplementing these vehicles may address both problems.
((iiii)) NNoonn--mmoottoorrii zzeedd ttrraannssppoorrtt De facto, non-motorized transport (NMT)–walking, bicycling and animal transport–plays
a significant role in many cities in the developing world, even if this role is not always acknowledged by the formal planning system. A survey of eight Asian cities shows that non-motorized modes constitute between 38 per cent (Kuala Lumpur) and 66 per cent (Shanghai) of all trips (Servaas 2000). While most bicycle use in cities in developing countries is for commuting (as high as 72 per cent of bicycle use in New Delhi, for example), in some countries, such as China, it is also extensively used for personal and household business.
In cities in developing countries, out-of-pocket costs tend to drive non-motorized mode
choices, particularly walking and use of animal transport (Servaas 2000). Out-of-pocket costs may be dominant where individual values-of-time are so low that time itself is not perceived as a significant cost–in other words, in particularly poor communities. This reflects a fundamental difference in non-motorized mode choices, particularly for pedestrians, between the developed and developing worlds. In the former, value-of-time, which is income driven, is generally high enough that a choice to take a non-motorized mode of transport reflects a relatively high level of accessibility to goods, services and activities. In developing countries, the choice to walk or use animal transport may instead reflect inherently low values-of-time, and accessibility may in fact be poor.
This reflection of low value-of-time has stigmatized walking in many developing
countries. It is associated with underdevelopment and poverty, so even where accessibility is high, there may be significant cultural and social pressures for wealthier groups to avoid walking and instead favour motorized transport. The resulting conflict of values is played out in many cities in developing countries. Transport decisions that favour private car trips over non-motorized modes are endemic, often justified on the systemic grounds that they are needed to smooth traffic flow. In reality, such decisions may be based more on planners’ perceptions and biases than analysis of the most cost-effective means of reducing emissions.
An effective non-motorized strategy for developing countries needs to be oriented towards the gradual substitution of accessibility-based NMT choices for value-of-time-based transport choices as the overall income and productivity of urban populations increase. The strategic goal of such a policy would be to avoid as much modal switching as possible, because it is difficult to effect a switch back to non-motorized modes once motorization occurs. Two elements would be particularly important in such a strategy:

49
(a) Provision of adequate facilities for non-motorized modes. This does not necessarily mean the construction of separate facilities for NMT; rather, it might also involve clarification of the rights of NMT users and the responsibilities of other traffic to them (Servaas 2000). Perception of safety is a particularly critical factor in managing this transition from value-of-time-based to accessibility-based NMT choices.
(b) Careful thought about land use, both in terms of urban form and location of commercial and administrative facilities that different populations need to access. This will be reviewed in more detail in subsection 2 below.
((iiiiii)) TTwwoo--wwhheeeell eerrss ffoorr uurrbbaann uussee
Publ ic transport and non-motorized modes are most frequently evoked in discussions of
alternative modes of transport. For cities in developing countries, however, motorized two-wheelers can and do play an important role, both because of their low costs and their agility in heavy traffic. In other regions of the world, such as the Middle East and North Africa, urban use of two-wheelers has been markedly restrained. In places where motorized two-wheelers have played a particularly important role (for example, in India, Pakistan, Bangladesh and Thailand), the use of these vehicles has grown organically. At any rate, around the world, public policy has generally been neutral towards two-wheelers, neither encouraging nor discouraging their use, with the notable exception of China.
One possible reason is that the role of two-wheelers in the process of motorization is poorly understood. Some see two-wheelers as an interim step in the process of motorization–the acquisition and use of cars. Others see two-wheelers as a potential alternative to car adoption and use. It is therefore unclear whether a public policy to promote two-wheelers would accelerate or postpone the process of motorization. Both the role of two-wheelers in the motorization of developing countries, and the process of household adoption of two-wheelers need to be studied more extensively.
((iivv)) CCaarr--ppoooolliinngg//hhiigghh--ooccccuuppaann ccyy vveehhii ccll ee
Strategies to increase car-pooling and ride-sharing have figured with increasing
prominence in European and North American transport planning over the past 15 years. The increased attention is driven by low observed car occupancy rates, the relative political difficulty of other travel demand management (TDM) measures, and the relative ease of financing new infrastructure for high-occupancy vehicles. In the United States, measures focused on high-occupancy vehicles (HOV) have generally proved ineffective. Because of the relatively higher rate of vehicle occupancy in many developing countries, car-pooling/HOV strategies may not be particularly effective or applicable in the short term. However, it is likely that vehicle occupancy rates will decline in developing countries as incomes grow.
2. Substituting alternative accessibility systems to reduce transportation demand (a) Land-use/urban planning
The ultimate aim of land use and urban planning measures as they relate to reduction of
transport emissions is either to reduce the overall need to travel or to increase the attractiveness of travel by alternative modes while not inhibiting the amount of economic exchange and activity participation possible. However, the relation between land-use, urban form (types of uses, mixing, density and urban design) and people’s transport decisions is neither heuristic nor

50
unidirectional; people make both travel and lifestyle choices based on the land-use and transport options available to them. In economic terms, these choices represent an expression of personal, household or firm utility subject to a set of constraints. Urban planning and land-use policy address the constraints on these lifestyle and travel choices, and not the choices themselves. Understanding this distinction is crucial for a successful and defensible transport / land-use strategy.
Formalized planning, through the creation of structure or regional plans, land-use plans
and transport or circulation plans, has historically been the mechanism by which land-use policy has been defined and established in many metropolitan regions around the world, and the formal means by which transport and land-use “planning” have been coordinated. In developed and developing countries alike, however, a lack of continuity between land-use planning and actual implementation has been observed, leading to increasing concerns that policy makers have less actual control over land use than they had previously believed. The result has been a de-emphasis of the role of formalized planning in the work of the World Bank and others in recent years. The ability of policy makers to influence land use is still substantial, but the cooperation and diligent coordination of various transportation and land-use institutions is needed for policy to be cohesive and influential in the marketplace.
For developing countries, policy on both transport and land-use interactions is further
hindered by a lack of good information on land use and travel behaviour. Untangling the connections between these two factors, lifestyle changes and motor vehicle adoption requires significantly more technical work than has been carried out thus far. Current thinking on best practice in this field is reviewed in box IV.3 below.
Box IV.3. Best practice in transport/land-use planning How to both influence and coordinate land use effectively with transport planning is a complex
and controversial subject. Few good examples exist, but there are enough that some observations about good policy practice can be made. What follows are priorities that have begun to emerge in the recent work of the European Conference of Ministers of Transport (Gorham 1998) and the World Bank (Willoughby 2000a). They are largely based on observation of successful and unsuccessful transport/land-use coordinating efforts in Curitiba, Brazil; Singapore; Switzerland; the Netherlands; California; and elsewhere. (a) Recognize that designation of primary rights of way and movement corridors will have an impact on location, land-use and building-pattern decisions for decades, and take these impacts into account. In many countries, transport infrastructure is often planned in response to particular needs–corridors or parts of cities are congested, a bottleneck exists, or an established or planned facility needs better access. In these instances, there is a danger that transportation infrastructure may be planned in a single-minded effort to address a particular problem, without adequate consideration of how that infrastructure will affect land-use and building-pattern changes in the vicinity. (b) Recognize the cumulative impact of land-use and transport decisions. The combined effect of numerous projects–whether a road facility, a shopping centre or a housing development–will have a significantly greater impact on the amount of transport by car than the sum of the effects of the individual projects. The reason is that individually, a given project may generate a certain number of car trips; taken together, however, the form created by these individual projects can also affect the elasticity of demand for car trips–the willingness of travellers to change behaviour in response to a change in price. These cumulative effects need to be taken into account during the strategic or structural planning phase, because environmental impact assessments at the individual project level will probably not be capable of capturing these effects adequately. (c) Correct pricing distortions in the transportation systems before they get “capitalized” into land through particular urban forms or densities. It is generally difficult to put economically efficient transport pricing schemes into place, but it is even more difficult to do so once

51
significant long-term capital has been invested in property as a result of “value” created by the price of transport. The earlier in the process of motorization a regime of efficient pricing can be put into place (see annex X to this report), the easier it will be. (d) Ensure the inclusion of full infrastructural costs into land price through the development process. Infrastructural costs generally include neighbourhood infrastructure and incremental costs of more regional or metropolitan infrastructure. However, particularly low (or particularly high) density developments might entail additional operational costs of some public services, such as fire, police, postal service, schools and public transport, costs that might also be assessed into the development process. The inclusion of infrastructural costs through the development process, however, should not replace sound planning and rigorous enforcement of land-use regulations. (e) Increase liquidity and transparency of real estate to allow markets to respond adequately and fairly to public policy signals and accelerate demand-driven land-use change. This involves clarification of property rights, titling and recording, and development of transparent implementation mechanisms for land-use plans. Zoning plans should be brought into conformity with higher level plans and, to the extent possible, as-of-right rather than conditional land-use designations should be used, both to minimize development costs and to avoid opportunities for corruption (Jacobs 1993). (f) Avoid inappropriate regulations and excessive reliance on regulatory measures to influence land use without commensurate, compatible and supportive infrastructure investments and transportation policy. Expecting land-use regulations to correct misguided transportation or other infrastructure investments is unrealistic. Infrastructure investments have a more long- lasting and permanent impact on land markets than do regulations because, at best, regulations can be changed and, in many places, they can be ignored. In addition, regulations–through the planning, zoning and permit process–need to be scaled to the resources and capabilities of target populations, as well as to the land development objectives. Requirements for excessive street widths, plot sizes and parking space drive up the costs of development (thereby limiting affordability) and impose higher lifestyle costs on those occupants without motorized vehicles. Of course, when land-use regulations are appropriately scaled and applied, they need to be enforced with vigour. (g) Foster amenity and access in urban design as counterweights to the demand for space as incomes grow. The observed link between income and vehicle ownership is affected by an additional factor, which is difficult to disentangle: demand for living and recreational space. This demand for space reduces residential densities, which, in turn, can increase the demand–or need–for motorization. However, as incomes increase, households also seek better access (proximity to goods, services and/or high-quality transportation services) as well as amenities (facilities that contribute to the quality of life, such as parks, recreational facilities, landscaping and public art). Clever and strategic use of access and amenities as attributes of new housing, urban design and city development planning can therefore be useful tools in offsetting demands for space. (h) Experiment on a small scale with new or innovative ideas. Trying to study an idea so extensively as to eliminate any uncertainty may be unrealistic, and may not shed insight into how the idea may work on the ground. The well -known and often cited bus system of Curitiba was not planned in one sitting; it developed organically over decades, through creativity and regular, small-scale experimentation. Such willingness to experiment, however, takes courage and commitment. (b) Telecommunications
Using technology to provide access to goods and services, to allow participation in
activities and to enable interaction between people is often suggested as a means to reduce the need to travel. As with modal substitution, such a strategy as a means to reduce global and local pollution and other externalities associated with transport will be successful only if telecommunications replace existing trips. However, changes in lifestyle and transport patterns as a result of telecommunications can be so complex that it is not clear whether or not, in the aggregate, telecommunications actually induces more transportation activity than it prevents (see, for example, Lund and Mokhtarian 1994). In developed countries, telecommunications seem to replace some trips in certain instances but induce trips in others (Mokhtarian 1997). In

52
developing countries, the potential of telecommunications to help to achieve a wide variety of social development, equity and gender goals is significant; in the light of North American and European experience, however, claims that telecommunications is a tool to alleviate congestion or improve air quality should be examined with scepticism.
3. Variabilizing the lifetime costs associated with motor vehicle ownership and use
The costs associated with owning and using motor vehicles throughout their lifetimes can
be divided into one-time, recurring and variable costs. In general, one-time costs involve the actual cost of the vehicle, acquisition taxes, import duties, where applicable, and, frequently, a luxury tax on certain kinds of cars. Recurring costs refer to registration, insurance and any other permits that may be necessary–such as commercial licences, I and M programme fees and motorway access stickers. Together, one-time and recurring costs are called “fixed” costs because the amount paid is based on time-dependent, “fixed” decisions; the amount the vehicle is driven does not affect these costs. Variable costs include gasoline and lubricants, tyres and maintenance–that is, those costs that depend on how much the vehicle is driven. Strictly speaking, depreciation is also a variable cost. However, because studies have shown that motorists do not include depreciation in their calculation of variable costs for particular trips–and often do not even include the fuel costs–travel behaviour experts generally believe that accounting for vehicle purchase price once as a fixed cost more closely approximates motorists’ perceived costs.
These perceptions create the “sunk cost” logic referred to in subsection 1 above. Under
sunk-cost logic, individual trips are evaluated on average, rather than marginal cost bases. Consequently, motorists can reason that they need to use their cars as much as possible in order to reduce the average cost of each trip. A strategy of variabilization then seeks to shift the overall cost-burden of owning and using a car from sunk costs to variable costs. The logic is that, over the lifetime of the car, owners may spend as much on the car in a “variabilized” policy climate as in a “fixed” one, but motorists will apply marginal cost, rather than average cost logic to each trip decision. Since the trip -making benefits to travellers are generally perceived on the margin (particularly for non-commute trips), forcing the evaluation of costs marginally will better associate costs with benefits, supply with demand, and excessive car use with excessive expenditures. The economic arguments for variabilization of costs are the same as those for general road pricing, which can be thought of as a special case of cost variabilization. (See Button 1982.)
In practice, variabilization of costs is not well advanced in either developing or developed
countries. Some widely practised policies, such as parking charges or motor fuel taxes, have the effect of variabilizing some costs but, by and large, efforts to shift costs from fixed to variable have not been well developed. Ideas discussed frequently include pay-as-you-drive automobile insurance, cash-out of free parking (for example at the workplace), road pricing and car-sharing schemes, all of which are reviewed in detail in annex X to this report.
D. BALANCING GLOBAL AND LOCAL CONCERNS
In the above review of technical, systemic and behavioural strategies, there was no
explicit consideration of the distinction between global and local emissions. This chapter began, however, with a rather simple formulation for the reduction of emissions–any emissions–from the transport sector: either reduce the amount of pollution per unit of transport activity or reduce the amount of activity. Strategies that focus on the former may be forced into a trade-off between

53
global and local pollutants–and often a trade-off between different species of local pollutants. The trade-off between global and local pollutants may not always strictly be technical, but rather one of costs. Solutions that address global as well as local pollutant reduction may cost more, and the problem then becomes one of who pays these incremental costs. These considerations suggest that any analysis of potential transport sector solutions to local air quality problems should be comprehensive enough that the marginal costs of solutions that also help to reduce global pollutants can be clearly understood.
One potential solution is to find a way to have the global communi ty “purchase” global
emission reduction services from localities in the process of implementing reduction strategies for local pollutants, by paying for the incremental cost between a purely local and a local/global pollutant emission strategy (Schipper and others 2000; Eskeland and Xie 1998). What form this “global community” takes is the subject of considerable discussion. It can be a kind of global “super fund”, like the Global Environment Facility (GEF), or a result of the flexibility mechanisms created by the Kyoto Protocol to the United Nations Framework Convention on Climate Change. To date, neither GEF nor AIJ (activities implemented jointly)–the pilot instrument for the flexibility mechanisms–has had much experience with transport sector projects.
Another potential solution is to try to link explicitly, in the formulation of policy, the two goals of reducing local pollution and reducing greenhouse gas emissions. Carbon monoxide, VOCs and soluble organic fractions (SOFs) are formed out of carbon present in fuels burned during combustion; therefore, in principle, measures that address vehicle energy intensity to reduce fuel consumption may also reduce overall CO, VOCs and PM emissions per kilometre, other things being equal. However, the relation between these emissions and fuel efficiency (as a proxy for carbon dioxide) is complex, and the ability of fuel economy standards to reduce HC and CO emissions is highly uncertain (Delucchi and others 1994). It has been suggested that this uncertainty can be reduced by regulating HC, CO and PM emissions in units of grams of emissions per fuel consumed, rather than per mile or kilometre of vehicle travel or unit of engine power output (Espey 1997), but so far, fuel economy and emissions remain unlinked in all regulatory regimes.
V. TOOLS AND TACTICS FO R IMPLEMENTATION
Introduction Transportation is a complex sector for policy-making because, unlike transactions in
other sectors, individual transactions in transportation occur over space and time and involve a myriad of producers and consumers. Consequently, a solid economic analysis of potential measures and the adoption of a strategy, as noted in chapter IV, are necessary–but not sufficient–conditions to reduce transportation emissions. In order to be implementable, the measures undertaken need to reflect other transport -related policy goals, including: (a) alleviating congestion; (b) influencing migration and settlement patterns; (c) linking accessibility to economic growth; (d) poverty alleviation; and (e) improvements in quality of life. In other words, implementation requires as much thought and planning as strategy, if not more. The need for tactics and synergy is particularly evident in greenhouse gas mitigation efforts, and this need is receiving increasing attention in policy documents (see Schipper and others 2000). Policy makers confronted with the severe problems associated with transport–congestion, local pollution, urban sprawl, noise and underdevelopment –rarely choose to tackle greenhouse gas emissions head on, because these other problems are more pressing. It is possible to take greenhouse gas issues into

54
account, however, in formulating solutions to other problems (Schipper and others 2000). The same concept applies even to local pollution; other issues may appear more pressing to policy makers, but reducing pollution–or preventing an increase in pollution–might be able to be taken into account in devising solutions to these other issues.
Tactics are therefore a key element in any approach to transport emissions. It is vital to
consider who is susceptible to changing their behaviour if a given measure–emission-oriented or not–is adopted, including vehicle owners, operators, manufacturers, fuel producers, importers and developers; whether that behavioural change would be likely to increase or decrease emissions is as important as the desired outcome. A tactical approach, determined through extensive study and discussion, as reviewed in chapter IV, can be used to implement a strategy. Such an approach may also stand on its own, either in an interim period while strategic decisions are being made or in the unfortunate absence of a guiding policy. Whether strategically based or not, a tactical approach focusing on who is asked to change behaviour should be evaluated against both realistic assessments of political influence and willingness to accept the measure, as well as other policy objectives that are being targeted for the group.
This chapter draws on sources including Schipper and others (2000) to identify specific
tactical groupings of policy measures based on target groups. These groups include: fuel consumers, motor vehicle users, travellers and shippers, vehicle operators, vehicle suppliers, vehicle purchasers, vehicle owners and fleet managers, fuel suppliers, planners and developers, property “consumers” and the general public. Of course, individuals can simultaneously be in more than one of these groups; a car user is by definition a traveller, and likely to be a purchaser, owner and operator as well. The types of choices he is facing in each of these roles, however, is different, and policy can be most effective if it recognizeds these shifting roles. Each of these policy groups is reviewed in turn.
A. TARGETING FUEL CONSUMERS: PRICING FUELS
Fuel pricing as reviewed in this paper constitutes a set of measures designed to change
the behaviour of transport sector fuel consumers. They may respond to changes in fuel prices by changing the types of vehicles they own and drive, the types of fuel these vehicles burn, the amount they drive them, or some combination of these. Fuel consumers are the immediate target of fuel pricing, but their behaviour will have strong secondary effects on the choices made by fuel refiners and vehicle manufacturers. The subject is reviewed in more detail in annex IX to this paper.
Taken as a cross section, countries with high fuel taxes tend to have fleets with higher
fuel efficiency (World Energy Council [WEC] 1998). However, fuel taxes have not historically been used in a Pigouvian sense to encourage or discourage car buying or usage behaviour; rather, they have been used more to raise general revenue for the government (for example, as in most European countries), to build a reserve of funds for road network development (the Federal portion of fuel taxes in the United States, for example), or, as the World Bank advocates, to stabilize the source of funds available for road maintenance (Heggie and Vickers 1998).
Several countries, all in Europe, however, have recently begun to put into place
Pigouvian taxes on fuel in an effort to increase fuel efficiency and influence car-buying behaviour.10 As Eskeland and Devarajan (1996) have shown in Mexico City, Pigouvian taxes also 10 Reactions to the oil price spike of summer and fall 2000, however, have put the future of these endeavours in jeopardy.

55
help to reduce the costs and increase the effectiveness of other measures. Thus, fuel pricing can be seen as a support policy that national governments can use to assist local initiatives.
Environment-driven rather than revenue-driven fuel taxes can take a number of different
forms, depending on the policy goal. An energy tax is perhaps the simplest, promoting fuel efficiency and reducing consumption, but a fuel’s energy content is only tangentially related to local emissions. A Pigouvian tax on fuel content might be a way to implement a strategy of cleaner fuels, by taxing, for example, the lead, sulphur or non-oxygenate content of a fuel. These kinds of taxes can also be used to encourage refiners to increase their octane outputs for countries with very low octane fuel. Fuel-specific differential tax rates can be used to encourage switching or retrofitting to alternative fuels. Many countries already maintain an artificial price distinction between gasoline and diesel, the implications of which are reviewed in annex IX to this paper. Finally, carbon taxes can be used to influence fuel choice and aggregate amount of driving.
B. TARGETING MOTOR VEHICLE USERS: PRICING OTHER VARIABLE
COSTS OF MOTOR VEHICLE USE Because vehicle users are also fuel consumers, the effects of changi ng the costs of motor
vehicle use may be similar to those of pricing fuels, but need not be. Fuel consumers have a long-run response alternative of changing vehicles in order to avoid a fuel cost increase; vehicle users generally cannot change vehicles in order to avoid non-fuel variable costs.
The logic of pricing motor vehicle use is that individuals may change where, when, why
and, ultimately, how much cars are used. Pricing naturally causes vehicle users to assess the marginal costs of a trip against the expected marginal benefits, so not only might overall trip-making by car be affected, but users may also adjust their vehicle use to trip purposes of higher marginal value. If pricing is used strategically to alter the relative costs of trips to particular locations, within certain zones, or at certain times, vehicle users might also be influenced to change where and when they drive.
A number of policies that increase variable costs also represent good practice in the
transport sector, irrespective of the ability of these policies to variabilize costs. These include effective parking management, which puts a premium on on-street parking spaces in congested areas during business hours and reduces over-zoning of parking requirements in trip-attractor zones. Often discussed as good policy as well, but rarely implemented, is generalized road pricing, whereby vehicles are charged for using different roads, differentiated perhaps by the time of day. These and other cost-variabilization measures are reviewed in more detail in annex X to this paper. In addition, measures to reduce fixed costs of motor vehicle use, such as acquisition taxes or registration fees, can also help to variabilize costs.
C. TARGETING MOTOR VEHICLE OPERATORS : CHANGING DRIVING
CONDITIONS AND MANAGING TRAFFIC As noted in chapter IV, changes in traffic networks can work at cross purposes;
individuals, as motor vehicle operators or drivers, may be more able to operate their vehicles in a less energy -intensive manner, or in a way that reduces the rate of pollutant emissions–for example, by not needing to accelerate or decelerate rapidly. However, individuals may choose to travel more by car or motorcycle if such changes are made to the traffic network as a whole. Targeted infrastructure investment that seeks to minimize the impact of traffic delays specifically on public transport does not face this potential conflict of policy goals. Dedicated busways can reduce the overall energy intensity and specific emissions of buses by reducing conflict with other

56
vehicles, and influence an environmentally beneficial structural shift to public transport by reducing vehicle delay and improving reliability.
A number of cities have implemented or are actively looking into developing busway
systems, including Curitiba, Quito and Manila. The concept has appeal for cities in developing countries, since buses are significantly less expensive to operate and the network can be developed more incrementally than a rail system; for this reason, however, busways are beginning to attract interest even among the relatively wealthy cities of the United States and Canada, under the bus rapid transit (BRT) concept. Increasingly, delegations from American cities are making their way to Curitiba to see the operation of that city’s extensive busways in person.
The potential for dedicated busways to influence public transport operations goes beyond
simply reducing in-use emission rates and energy intensity. By reducing in-use operational costs, as well as wear and tear on buses, the effective life of the buses themselves is probably longer than those operating on ordinary streets, although better research and information are needed to verify and quantify such a benefit. If busways can extend the effective life of buses in operation, the economics of bus procurement might be somewhat different for operations with, versus operations without, busways. It is possible that these changes will alter the affordability of buses with more advanced technology, such as those buses using advanced diesel NOx and particulate controls, or those running on CNG. In other words, the busway could facilitate the financing of cleaner bus technology, particularly when such technology had previously been considered unaffordable.
D. TARGETING TRAVELLERS AND SHIPPERS: INFLUENCING TRAVEL CHOICES
Policy measures can be targeted to influence the travel choices of travellers on a day-to-
day basis. These measures, referred to in the literature collectively as travel demand management, are often discussed in the context of alleviating traffic congestion, but they can also be effective air quality improvement measures. These measures fall into three categories: incentives to use public transportation, incentives to change particular patterns of t rip-making, and disincentives to private car use.
A number of measures can be implemented to create an incentive for individuals to use
public transport. Providing enhancements to service is probably the most straightforward way, but the least straightforward in terms of engaging passenger reaction to a particular intervention. Enhancing service could involve improving on-board or waiting area comfort, providing better information, providing more frequent (and/or more reliable) headways, or extending the geographic coverage of service. In some cases, changes to fare structure–such as integrating the payment system of previously separated (competing) services–can provide a de facto enhancement of service with little immediate investment. The provision of separate infrastructure such as busways, reviewed in section C above, can also amount to a service enhancement by providing greater reliability.
Public transport use can also be incentivized through other means. Travellers might be
paid to use public transport through vouchers distributed in association with a particular activity (for example, as an employee benefit). Alternatively, public transport fares might be reduced–or, more likely, fare increases restrained–in order to encourage public transport use. As reviewed in more detail in annex X, how to incentivize public transport depends on local circumstances, but requires a knowledge of how travellers are making their transport choices. In many locations, riders tend to be price inelastic; in this case, trying to incentivize public transport through direct

57
or indirect subsidies to riders might be ineffective and costly. For price-insensitive but time-sensitive travellers, enhancing public transport provision is a more effective strategy of influencing choices.
Travel demand management measures may also try to influence when and where
individuals choose to travel, in addition to influencing how they travel. Examples of such measures include encouraging employers to adopt flexible work schedules for their employees and developing telework centres.
E. TARGETING VEHICLE PURCHASERS: INFLUENCING
VEHICLE FLEET DEMAND AND TURNOVER This policy group consists of a set of measures that can be adopted to influence the
behaviour of purchasers of individual vehicles or of vehicle fleets. The policies focus on measures that affect the kinds of vehicle choices made and the speed with which vehicles are cycled out of the in-use fleet.
Most countries impose fees to register vehicles, often based on characteristics such as
engine size and displacement or gross vehicle weight. A number of developed countries have looked into differentiating these charges according to the environmental criteria of the vehicle, including emission levels and fuel economy. The effect of such policies might provide a rebate to purchasers of environmentally friendly vehicles and impose a fee on purchasers of vehicles with a particularly poor performance record from an environmental perspective. Such a policy is called a “feebate” regime and has been considered in Europe, the United States and Japan (see annex X to this report for details). The policy was successfully implemented in Germany to assist in the adoption of catalytic converters.
Accelerated retirement is another measure to influence vehicle fleet demand and
turnover. Under these programmes, often called “scrappage” schemes, high-emitting vehicles are purchased by the State to take them off the road. Such programmes face conceptual and logistical problems, however, as reviewed in detail in annex V to this paper. Use of feebates and other pricing mechanisms may be a more effective, if unpopular, means of dealing with old vehicles. For fleet vehicles, influencing the way new vehicles are procured and maintained may be another important policy measure to ensure both maintenance and renewal of the fleet. Specifically, taking into account the full lifecycle cost of vehicles, rather than just the purchase price, in procurement decisions can lead to a more sustainable practice. Budgets for procurement and maintenance are often separate, leading not only to perverse incentives regarding environmental performance, but also arguably higher costs for the owner. Finally, vehicle ownership in general might be restrained through pricing measures or quotas. If poorly conceived and implemented, however, such a policy risks discouraging vehicle turnover, encouraging excess vehicle use, and fostering development of a black market. Singapore is an example of a country that has established a successful quota programme (see annex X to this report).
F. TARGETING MOTOR VEHICLE MANUFACTURERS AND IMPORTERS :
INFLUENCING VEHICLE FLEET SUPPLY This policy group includes measures that influence the behaviour of suppliers of vehicles
(manufacturers and importers), generally by either providing subsidies or contributions to research and development or by setting pollutant emissions and/or energy efficiency standards for vehicles put into circulation in a country.

58
1. Transfers and subsidies Transfers and subsidies to undertake research and development are widely used in the
industrialized world to coax manufacturers into producing and marketing less polluting vehicles. The public sectors in the United States, Europe and Japan have contributed substantial public money to developing lower-emitting vehicles through a myriad of large and small programmes for research, development and pilot applications of new technology. While developing countries can benefit from the spillover effects–since the technologies that are developed because of these programmes are then available for application in developing countries–the needs of developing countries do not drive these research and development (R and D) agendas. Developing countries, particularly those without domestic automobile manufacturing capacity, rarely have an opportunity to establish R and D agendas based on their own needs.
2. Emissions and fuel economy standards
Emissions standards are a widely employed mechanism for reducing emission rates of
motor vehicles. Europe, North America, Japan and many countries in developing regions of the world utilize emission standards to improve the emission technology used in vehicles sold in the country. Fuel economy standards are less ubiquitous; only the United States maintains an enforceable fuel economy standard, although not on all classes of private vehicles in household use.
A number of factors need to be taken into account in developing a programme of
emissions and/or fuel economy standards, including a determination whether the standards should force the development of new technology (as opposed to simply ensuring the use of a given standard of available technology), product cycle and development time, the mechanism for enforcement, the availability of fuel compatible with the vehicle technology contemplated by the standard, the macro effects of binning or segmenting of vehicles for the sake of targeting standards on the overall market, and the perception of industry about the overall burden of a particular set of standards. These factors are reviewed in greater detail in annex X to this paper.
Setting standards and implementing them are two different activities. Implementation
can be complex, because any number of combinations of compliance criteria can be adopted. For example, standards may be implemented through traditional command-and-control measures, market-based incentives, or a mixture of the two. They may also be sales-weighted, production- or import-weighted or, again, a mixture of the two. The complexity of the implementation regime affects the complexity of enforcement, but also can allow an industry significant flexibility in complying. The implementation regimes are also reviewed in greater detail in annex X to this paper.
3. Fleet supply measures and variable costs
Supply-driven measures that seek to change the emission characteristics of vehicles
through research and development, command and control regulations or market-based-incentives tend to increase the costs of vehicle production or importation somewhat, which in turn increases the cost of vehicle acquisition and ownership. Other things being equal, these increases will translate into a relative increase in lifetime fixed costs (compared with variable costs). These sunk costs are associated with a demarginalization of the costs of individual trips, and may therefore encourage more car use. Consequently, a strategic goal of variabilizing costs may not be entirely consistent with a tactical approach focusing heavily on supply measures. In economic terms, the

59
true preferences of consumers in the trade-off between more emissions control and less travel at the margin may not have adequate room for expression (Eskeland and Devarajan 1996).
G. TARGETING VEHICLE OWNERS AND FLEET MANAGERS:
IMPROVING IN-FLEET VEHICLE MAINTENANCE The measures to improve in-fleet vehicle maintenance focus on changing the attitudes
and behaviour of vehicle owners, drivers and fleet managers vis-à-vis the day-t o-day management of their vehicles. Of all possible measures to reduce pollution-causing emissions, those that are geared to improving in-fleet maintenance can have some of the highest return on investment. A number of measures are available to improve the maintenance of vehicles in use. Inspection and maintenance programmes are the most commonly used implementation measures. The strong potential for exhaust aftertreatment systems to deteriorate in in-use vehicles makes I and M programmes a necessary part of the success of this technology. These progr ammes have taken on different forms in different jurisdictions, but substantial worldwide experience with them has generated significant knowledge and expertise, to the point that jurisdictions seeking to establish new I and M programmes can learn from and avoid earlier mistakes.
I and M efforts can be supplemented or facilitated through well-designed mobile
enforcement programmes. Mobile enforcement can also be used in an interim period while an I and M programme is being established. Mobile enforcement involves roadside testing of vehicles, either selected at random because of visible tailpipe smoke emissions or, in some developed country contexts, based on remote sensing of emissions.
Changes to procurement methods to allow for full vehicle cycle analysis and contracting
can also help to improve in-use fleet vehicle maintenance, as well as help with appropriate fleet turnover decisions by giving a market incentive to the supplier in order to ensure adequate emissions performance and/or fuel efficiency throughout the life of the vehicle. Finally, the importance of training and education for vehicle operators and fleet managers should not be underestimated. The combined impact of transferring even a basic knowledge of freight aerodynamic loading methods, proper surveillance of fuel for adulteration, and proper maintenance of vehicles and techniques for more economic and efficient driving can mean significant energy efficiency gains in heavy -duty vehicles. These methods are reviewed in annex X to this report.
H. TARGETING FUEL REFINE RS AND IMPORTERS : INFLUENCING THE FUEL SUPPLY
As noted in section A above, fuel taxes influence the fuel supply indirectly by changing
the nature of transport demand. However, measures can be implemented to address fuel suppliers directly. These measures have parallels to the policies aimed at influencing vehicle supply (see annex X to this report). As with vehicle supply, the measures to affect fuel supply can also involve subsidies and transfers for R and D, refinery modification, and changes to fuel supply and distribution needed to support fuel improvements (for example, separation in storage and distribution of high-sulphur and low-sulphur diesel fuels).
The most straightforward measure to influence fuel supply, however, is the establishment
of fuel standards. These standards can regulate refinery output, imports or the point of sale. They are effective, however, only insofar as the fuel distribution system in a country is formalized and regulable. Relative fuel availability and prices in surrounding countries or jurisdictions, as well as in other sectors, can have an impact on the effectiveness of any regulation by influencing the tendency of motorists and truck drivers to seek fuel from informal sources. Education and

60
training on the effects of fuel adulteration on vehicle performance, as well as proper monitoring and enforcement, can help to alleviate this problem, but fuel standards must be set appropriately in context, and must be properly phased to avoid the price shocks that drive vehicle operators to the informal market. Like vehicle standards, fuel standards are most effective when they specify performance criteria rather than fuel composition or technology per se. Fuel standards might also be more enforceable through market -based incentives such as an emissions trading scheme (see annex XI to this paper).
I. TARGETING DEVELOPERS AND PLANNERS : INFLUENCING THE BUILT ENVIRONMENT
Over the long run, urban form and design can influence how long average trips taken in
urban areas need to be, and what modes of transport are viable. Both of these considerations have significant influence on the amount and type of pollutant emissions from urban transport. They can also influence how price-responsive motorists are to other potential emission-reduction measures, such as changes in fuel costs or cost-variabilization. Consequently, measures that influence who builds what, where and how are crucial in influencing the long-term evolution of pollution and CO2 emissions in urban areas.
Formal land-use control and regulation is the most obvious example of a policy that can
influence urban development but, in practical terms, the provision (or non-provision) of infrastructure–particularly transport infrastructure–is for most developing countries the predominant means by which urban growth is influenced. Transport infrastructure influences accessibility, which has enormous influence on land values. In many countries, transport infrastructure is planned reactively in response to particular problems, such as congestion or the need to provide access to a particular facility. In developing countries, transport infrastructure is rarely planned and implemented proactively to influence development patterns–Curitiba in Brazil being a notable exception. Part of the reason is that different levels of government are frequently responsible for different parts of the transportation network, and those levels with the most capability to do proactive transport planning (that is, the national government) are the least sensitive to the urban growth needs of the local community. Proactive planning of infrastructure to influence urban development can be aided with new methodologies for full-cost accounting of infrastructure supply and maintenance. These methodologies compare long-run costs of provision, maintenance and operations of infrastructure services (including transportation) according to different scenarios of land development.
The proactive provision of infrastructure should be supplemented with diligent efforts to
recover costs. Not recovering costs can result in significant distortion of land markets, leading, in the most extreme cases, to the potential for official corruption. In order to avoid such corruption and provide accuracy in the cost recovery, officials need to ensure that land markets are fully functional and transparent. This means there must be adequate capacity for the cadastral, land-titling, impartial dispute resolution, professional appraisal, and market brokerage or clearing services. Methods for long-term control of land development are reviewed in annex X to this paper.
J. TARGETING HOUSEHOLDS AND FIRMS: INFLUENCING LOCATION CHOICES
Balanced urban development has supply and demand components. The methods reviewed
above deal with the supply side; the demand component of urban development, however, is frequently overlooked. Most formalized urban planning policy seeks to influence where household and firms locate through supply mechanisms: what housing, office, retail and factory space is provided where. Recently, however, a number of innovative demand-side policy options

61
have emerged, for the most part in developed country contexts. These mechanisms have had limited success so far.
One of the more comprehensive efforts has been a “reverse” zoning scheme developed in
the Netherlands, known as the ABC policy. This scheme turns zoning on its head by specifying the kind of parcel on which a particular use can locate, rather than specifying the kind of use that can locate on a particular parcel. The effectiveness of the policy has been compromised by ineffective enforcement mechanisms, however. In the United States, efforts are under way to reward household locational choices based on “location efficiency”, the idea that certain locations allow for more car-independence than others. In pilot cities, households are eligible to borrow at greater proportions of their annual household income than they would normally be allowed if they purchase homes in “efficient” locations. These and other "demand-side" approaches are reviewed in more detail in annex X.
K. TARGETING THE GENERAL PUBLIC: INFLUENCING PUBLIC
ATTITUDES TOWARDS TRANSPORTATION Public acceptance of policy-making for both local pollutant and greenhouse gas
emissions reductions requires, at a minimum, a basic understanding of the issues and stakes involved. Motorists and non-motorists need to develop an understanding of how the sum of their individual decisions affects the quality of the life they live on a day-to-day basis. The need for this understanding suggests that public education and awareness are prerequisites–not afterthoughts–to sound policy-making and implementation. Public support for policies that may be perceived to raise costs or impose burdens on individuals in the short run can only be expected if citizens have a clear idea of what benefits can be expected in the long run.
VI. THE INTERNATIONAL AGENDA
Local and national authorities around the world are grappling with the environmental and social issues that increased demand for motorized access has created; many are facing the same aggregate problems, although the combination of specific causes is unique to each region as is, consequently, the necessary solution. In the past decade and a half, the United States and the European Union have developed institutions which, in addition to having regulatory functions linked to multi-State powers, have taken on the role of information clearing-houses and disseminators of good practice to States and localities within their jurisdiction.11
For many developing countries, the international community has carried out this function
through various arms of the United Nations system and the multilateral development banks, but it has done so with less coherence, and perhaps less success, than the American and European institutions. This chapter reviews briefly the mechanisms of policy support that have been available to developing countries in dealing with transport emissions, and then reviews addi tional potential mechanisms for support from international institutions in the development of a global public policy framework on transport emissions.
11 In the United States, the Department of Transportation, the Environmental Protection Agency and the Department of Energy play this role. In Europe, the role has been taken on by various European Union Directorates General, in particular VII (Transport) and XI (Environment, Nuclear Safety and Civil Protection), as well as the European Environment Agency.
62
A. ONGOING MECHANISMS OF INTERNATIONAL COOPERATION
1. Global agreements on the environment (a) Agenda 21
Agenda 21 states that “promoting efficient and environmentally sound urban transport systems in all countries should be a comprehensive approach to urban-transport planning and management”(United Nations). Agenda 21’s prescription for action is set contextually in the chapter on “Promoting Sustainable Human Settlement Development.” This context in and of itself is significant; transport was not seen as an end in itself, or as a stand-alone human activity, but rather as a tool to be used for the development of sustainable settlements. Agenda 21 calls on international organizations and bilateral donors to do the following:
“(a) Integrate land-use and transportation planning to encourage development patterns
that reduce transport demand;
“(b) Adopt urban-transport programmes favouring high-occupancy public transport in countries, as appropriate;
“(c) Encourage non-motorized modes of transport by providing safe cycleways and footways in urban and suburban centres in countries, as appropriate;
“(d) Devote particular attention to effective traffic management, efficient operation of public transport and maintenance of transport infrastructure;
“(e) Promote the exchange of information among countries and representatives of local and metropolitan areas;
“(f) Re-evaluate the present consumption and production patterns in order to reduce the use of energy and national resources.” (United Nations)
Agenda 21 also called on local authorities to implement and monitor sustainability programs (Local Agenda 21). In response, the participants in the European Conference on Sustainable Cities and Towns, held in Aalborg, Denmark, in May 1994, issued the Charter of European Cities and Towns towards Sustainability (the Aalborg Charter). The Charter calls for, inter alia, improving accessibility and sustaining social welfare with less transport; seeking a mix of functions so as to reduce the need for mobility; and taking advantage of the scope for providing efficient public transport and energy which higher densities offer, while maintaining the human scale of development.
(b) Technology transfer and flexibility mechanisms under the Kyoto Protocol
One of the primary areas of international activity in the transport sector is in greenhouse gas emissions control, primarily through the United Nations Framework Convention on Climate Change, adopted in 1992. The Convention’s 1997 Kyoto Protocol identified two mechanisms in particular that might have a significant impact on the transport sector: joint implementation (JI), and the Clean Development Mechanism (CDM).
((ii)) AAccttiivv iitt iieess iimmpplleemmeenntt eedd jj ooiinnttllyy// jj ooiinntt iimmppll eemmeennttaattiioonn

63
The concept of joint implementation emerged soon after the 1992 Earth Summit as a mechanism to allow two (or more) countries to undertake projects jointly and share in the emissions “credit” towards meeting their reduction targets as specified under the United Nations Framework Convention on Climate Change and later by the Kyoto Protocol. The intent was to find a means to allow “annex I” countries–those countries for which binding targets were specified–to meet those targets through investments in non-annex I countries, most of which are developing countries. A pilot programme was established in 1993 to allow countries to begin experimenting with cooperative projects, but annex I countries could not claim emissions credit for projects under the programme, called “Activities implemented jointly ” (AIJ). Of some 141 pilot projects implemented under AIJ, only one was a transport sector project, involving the development of CNG engines by a Hungarian company for retrofitting in Ikarus buses in operation in various cities in Hungary.
Joint implementation was controversial from the outset, because non-annex I countries were not subject to binding targets under the Framework Convention. This subsequently gave rise to concerns that annex I countries would frontload the easiest and cheapest potential CO2 reduction projects as joint implementation projects, leaving the developing countries with more difficult–and more expensive–CO2-reduction options if and when they signed on to binding commitments in future rounds of negotiations under the Convention. As a result, under the Kyoto Protocol, joint implementation was redefined as applying only to projects implemented jointly and exclusively by annex I countries. A new mechanism, the Clean Development Mechanism, was identified to address the concerns raised about joint implementation.
((iiii)) CCll eeaann DDeevveelloo ppmmeenntt MM eecchh aannii ssmm
The CDM was identified under the Kyoto Protocol to address the general development
needs of emerging economies, as well as the needs of annex I countries to comply with the targets for emissions reduction. The idea behind the CDM is that annex I countries can invest in projects that are of general interest to non-annex I countries for economic development, but that where those investments can be shown to reduce CO2 emissions, some or all of those Certified Emissions Reductions (CERs) can be credited to the annex I country in meeting its reduction target s under the Kyoto Protocol or any subsequent agreement under the Framework Convention. Simple in concept, the CDM is complex in details and implementation, because of the need to identify viable types of projects that do not inappropriately raise the costs of emissions abatement for developing countries when and if binding targets are adopted for them, and because of the complexity involved in the carbon accounting. Negotiators have remained unable to agree on the technical details to implement the CDM, so it is still not operational. In principle, CERs will be a marketable commodity under the Kyoto Protocol’s second flexibility mechanism: a system of emissions trading. So while non-annex I countries do not need the CER to demonstrate compliance with Kyoto targets, they (presumably) may still want to receive some CERs for any CDM project.
The CDM can be described as a hybrid approach between the joint implementation concept and an undifferentiated system of carbon trading. For the transport sector, the marriage of these concepts may prove significant because it is likely that, on their own, joint implementation and emissions trading will result in a de-emphasis of the transport sector (at least initially) because of the difficulty of working in the sector, and probably also because of the high cost of carbon abatement compared with other sectors. The one AIJ pilot project concerning transport –the above-mentioned Hungarian bus CNG conversion project–was projected to produce carbon dioxide abatement at a cost of about US$ 100-US$ 250 per ton (compared with the Prototype Carbon Fund target of about US$ 5 per ton). Because the CDM is intended to take into

64
account the development needs of emerging economies, and because transport development is integral among these, the CDM opens greater possibilities for immediate investment in the transport sector than either of the other two mechanisms.
However, several questions about the CDM must be resolved if the transport sector is
going to play a role in it. One of these concerns whether policy initiatives, in addition to specific projects, will be accepted for the CDM. Policy is particularly important for certain aspects of urban transport planning. For example, if international development assistance leads to the development of a transport plan favouring land-use options (high density, mixed primary-use corridors and nodes) and public transport, as opposed to road-building, it is unclear at present whether the countries or institutions that provide such assistance will be able to claim carbon credits.
A second, and related, question involves the issue of baselines. In places where local
environmental impacts are of significant concern, some type of transport sector intervention is likely to be on the agenda anyway, regardless of the impact on greenhouse gases. These interventions may receive assistance from multilateral or bilateral agencies. Carbon reductions from these efforts are ancillary. The subject of “co-benefits” has received significant attention recently, focused primarily on assessment methodologies. Whether and how to allocate carbon credits for these types of investments–that is, against what baseline–is a normative question facing the negotiators of the Framework Convention, and it has yet to be addressed. The Kyoto Protocol states that carbon credits should be “additional” to those that would have occurred “otherwise” but, with regard to co-benefits, the meaning of these terms is not clear. Because of these philosophical and methodological issues, it may be appropriate for the transport sector to elaborate a distinct methodology for inventories and a baseline definition under the auspices of the Intergovernmental Panel on Climate Change.
((iiiiii)) EEmmiissssiioonnss ttrraaddiinngg aanndd tthhee PPrroottoott yyppee CCaarrbboonn FFuunndd
Carbon emissions trading schemes have been proposed internally for a number of
countries or country groupings, such as the United States and the European Union, in the form of "cap-and-trade" schemes, but it is unclear how or the extent to which the transport sector would participate. The CERs issued for particular projects under Article 6 of the Kyoto Protocol would be viable international "currency" under an international, open-trading regime, but they may also play a role in national cap-and-trade schemes as well. If fuel and/or vehicle suppliers constitute a point of regulation in either system, the transport sector would absorb the costs of carbon reductions, even though the reductions per se may not come from the sector itself.
In a mature, functioning open-trading system, it is likely that investment in carbon abatement projects as well as trade in CERs will be facilitated by hedging products or funds. However, as long as the operational details of both the flexibility mechanisms (CDM and emissions trading) are unclear, hedging institutions are unlikely to develop. The World Bank, therefore, recently established the Prototype Carbon Fund (PCF), an experimental hedging instrument financed initially by a combination of (Canadian, Japanese and European) private and public sector entities. The actual functioning of the PCF will evolve as the operational characteristics of the JI and CDM programmes become better defined, but in general the PCF uses the pool of funds provided by investors to promote carbon-reducing activities, and then distributes the CERs back to investors in proportion to their initial capitalization. Since the PCF is intended to be experimental and provide practical experience to Framework Convention negotiators, helping them to define the evolution of the JI and CDM programmes, it began operation with a pre-set sunset date of 2012 (hence the term “prototype”). Actual hedge funds

65
will probably participate in emissions trading, but the PCF has committed to staying outside of emerging emissions trading markets (although CERs generated by the PCF may eventually find their way into these markets).
The PCF hopes to attract potential investors through a competitive price per ton of carbon avoided (TCA)–between US$ 20 and US$ 30 (US$ 5 to US$ 8 per ton of CO2).
12 It is unclear whether transport -related projects are competitive within this price range; experience with AIJ and the Global Environment Facility suggests they may not be. In the end, however, the price per ton of carbon avoided in the transport sector may depend heavily on how carbon abatement generated through projects with significant co-benefits is allocated to project baselines. Drawn too narrowly, rules of carbon allocation and criteria for investment decisions may put at risk the potential to benefit from synergies between local and global objectives in transport sector interventions. (c) Global Environment Facility
The Global Environmental Facility was established in 1991 and restructured following the 1992 Earth Summit t o act as a financing instrument for concerted action on biodiversity loss, degradation of international waters, ozone depletion and climate change. To date, it has had little experience with transport sector projects; its experience with respect to climate change has focused almost exclusively on the power sector. One transport sector project has been formally approved by the GEF board–a pilot project for hydrogen fuel cell buses in several Brazilian cities–and several more are in the pipeline, but none of the transport projects are currently operational.
Part of the reason for this limited experience has been the absence of clear policy guidance in the transport sector. Policy guidelines on climate change have emphasized long-term options to mitigate the effects of climate change. Recently, however, the GEF Council issued an Operational Policy (OP) on transport, OP11. This Policy emphasizes a limited number of potential activities:
• Modal shifts to more efficient and less polluting forms of public and freight transport
through measures such as traffic management and avoidance and increased use of cleaner fuels;
• Non-motorized transport;
• Fuel-cell or battery operated two- and three-wheelers designed to carry more than
one person;
• Hydrogen-powered fuel cell or battery-operated vehicles for public transport and goods delivery;
• Internal combustion engine-electric hybrid buses;
• Advanced technologies for converting biomass feedstock to liquid fuels.
12 The marketing literature for the Prototype Carbon Fund cites a number of studies suggesting that individual investments in carbon-abating projects should be between US$ 21 and US$ 265 per TCA.
66
The specific activities financed by the GEF under the Operational Policy are: strategic urban, land-use and transportation planning, targeted research, training, capacity-building and technical assistance, demonstration projects, investment in technology application, market transformations to achieve full commercialization, and dissemination. In order to minimize risks, the Operational Policy places particular emphasis on technologies with applications in multiple systems.
It remains to be seen whether the transport sector will increase its viability within the
GEF programme structure as a result of this policy guidance. Funding from GEF needs to work in concert with local development needs; in many cases, these needs go well beyond the climate change focus of GEF. Consequently, the GEF needs to find a way to synthesize its agenda, as spelled out in the above-mentioned OP11, with the needs of the countries in which it hopes to operate.
2. Transport/environment-focused activities of international institutions
A number of coordinated activities, under the guidance of different international and
regional development agencies, are under way in the area of transport pollutant emissions and energy consumption. These include the following:
(a) OECD: Environmentally Sustainable Transport. This programme was one of
the first formal “backcasting” exercises undertaken by an international organization. Its purpose was to identify the measures that would be necessary to attain a goal of “Environmentally Sustainable Transport” by the year 2030 within OECD countries.
(b) ECMT: Urban Travel and Sustainable Development Programme. Initiated
in 1995, the ECMT (European Conference of Ministers of Transport) has pursued, in conjunction with its partners in the OECD, a series of related activities centred around the theme of sustainable urban travel, including a survey of urban travel in different cities in the OECD member countries, and country policies. The centre-piece, however, has been a series of workshops on the themes of transport and land-use coordination, improving public transport, managing car use in cities, evaluating infrastructure investment impact on urban sprawl, and overcoming barriers to implementation. The project proved innovative and has introduced a new way of thinking on these issues.
(c) Economic Commission for Europe (ECE): Programme of Joint Action on
Transport and the Environment. This programme is effectively a division of labour among ECE, OECD and ECMT in addressing some of the important research and policy framework challenges facing greater Europe, touching on topics such as transport/land-use integration, internalization of costs and refining the definition of sustainable transport. The programme maintains a joint Ad Hoc Expert Group on Transport and the Environment.
(d) WHO-ECE: Programme on Transport, Environment and Health. This
ongoing programme is a collaboration between the World Health Organization Regional Office for Europe, and the Economic Commission for Europe. It recently produced a report for the Economic and Social Council entitled, Overview of Instruments Relevant to Transport, Environment, and Health and Recommendations for Further Steps.
(e) ECE: World Forum for Harmonization of Vehicle Regulations. This forum
(WP29) works towards the harmonization of vehicle regulations having a bearing on road safety, protection of the environment and energy saving. WP29 administers two agreements, one from

67
1958 involving European countries only, and a second which went into force in August of 2000, which also includes the United States, Canada, the Republic of Korea, China, the European Union, the Russian Federation, South Africa and Japan among the signatories. The Working Party on Pollution and Energy meets twice yearly to discuss the progress made in harmonizing regulatory activities in these areas. Recent activity has included the harmonization of test cycles, the harmonization of regulations concerning CNG vehicles, and the development of a motorcycle test cycle.
(f) UNEP: Auto Manufacturers’ Forum. UNEP has held preliminary discussions
with automobile manufacturers from around the world about developing a global manufacturers’ forum for organized discussion of particular issues, such as reliable and comparable reporting, dialoguing with stakeholders, addressing the transport-related environmental problems of mega-cities, and preparing for the flexibility mechanisms of the Kyoto Protocol. Early dialogue has focused primarily on environmental aspects of vehicle production.
(g) IEA: Implementing agreements affecting transport. The IEA maintains a
number of implementing agreements–coordinated programmes of research by different countries–with direct relevancy to the transport sector. These include implementing agreements on advanced fuel cells, advanced motor fuels, and hybrid and electric vehicles. In addition, a number of other IEA implementing agreements may have indirect impacts on transportation.
(h) World Bank: regional Clean Air Initiatives. Beginning with the Clean Air
Initiative for Latin America in 1998, the World Bank has developed a programme of institutional support, training, and distance learning. The programme helps local officials in cities in developing countries to deal with problems associated with indoor and outdoor pollution. A large focus of the programme has been on ambient outdoor air quality, of which a significant component is transportation. This programme has placed particular emphasis on training and support for economic analysis in addressing air quality problems.
(i) World Bank: URBAIR programme. The World Bank’s URBAIR programme
involved the development of a guidebook on urban air quality management, and assessments of four cities in Asia: Mumbai (Bombay), Jakarta, Kathmandu and Metro Manila. The project, begun in 1992, has involved the development of a detailed methodology for urban airshed analysis, a methodology that was applied under the programme to the above cities. The World Bank’s Urban Air Quality Management Strategy in Asia: Guidebook is an important resource for cities beginning to undertake air quality management.
(j) World Bank: Two-stroke initiative. A World Bank initiative in South Asia
examined the acute problem in that region caused by the prevalence of two-stroke engines in use on two- and three-wheeled vehicles. Measures recommended include replacement of two-stroke with four-stroke engine vehicles at vehicle retirement, and pre-mixing of lubricants with fuels at the point-of-sale. The focus and attention this initiative placed on the two-stroke problem is being pursued in individual Bank projects.
(k) Asian Development Bank: Vehicle Emission Action Plans for the Asia-
Pacific Region. The Asian Development Bank recently initiated a new programme of technical support, knowledge-sharing, and training in actions that can be taken at the national level to reduce the impact of transport emissions. These actions include workshops on fuel policy and alternative fuels, emissions regulation for new and in-use vehicles, transport planning and traffic management, and action plans for national emissions reduction.

68
(l) Inter-American Development Bank: Sustainable Markets for Sustainable Energy Programme. A number of projects under the Bank’s Sustainable Markets for Sustainable Energy programme are transport-oriented, including a programme of support for the Government of the State of Paraná (Brazil), replicating the sustainable transport lessons from Curitiba, Brazil, in other municipalities, and a programme of support for a number of municipalities in Ecuador. These efforts are particularly interesting, because they involve looking broadly at urban development as well as transport issues. However, as of late 2001, this future of this program is unclear.
B. FURTHER SUPPORT FROM THE INTERNATIONAL COMMUNITY
Despite the various int erventions, policy makers in developing countries still lack access
to many kinds of coordinated support functions available to policy makers in the United States and the European Union–that is, those functions often taken on by federal or European Union agencies respectively. These needs stem from considerations in this report, and include:
• Concerted and consistent support to eliminate the use of lead as a fuel additive by a specific target date;
• Harmonization of transport activity and emissions data tracking and reporting;
• Development and elaboration of methodologies for assessing “co-benefits” or “ancillary” benefits of local or greenhouse transport interventions, as well as support for negotiators to clarify the status of different transport sector int erventions under the Kyoto Protocol flexibility mechanisms;
• Preventing fragmentation of markets in development of emissions and fuel quality standards/regulations;
• Development of innovative strategies to address motorization, and better identification and targeting of technological solutions for developing country contexts;
• Capacity-building for integration of environmental criteria in major investment decisions and long-term planning;
• Knowledge-sharing and analytical support;
• Global Initiative on Transport Emissions (GITE).
Larger developing countries, particularly those with more or less federated structures,
domestic vehicle manufacturing capability, and well-trained and capable technical and policy expertise, might be well positioned to develop institut ions capable of taking on some of these functions, but only to the extent that the political will to address air quality and transport emissions issues continues to develop. In New Delhi, India, for example, the agenda to reduce transportation emissions has been driven largely by the courts, because the State and Federal legislatures have thus far been unable to muster the political initiative to address the issue. However, the ability of judicially driven transport emissions policy to lead to the development of effective institutions to undertake long-range policy making, without political will expressed through the legislative or executive authorities, is subject to question.

69
Most developing countries, however, will continue to look to the international
community (the United Nations and the development banks) to provide these support functions. Given the multitude of development, environmental and transport-related institutions involved, the response of this community, for the foreseeable future, risks remaining fragmented.
1. Institutional and resource support for elimination of lead
In spite of the clear dangers that lead in fuels poses to human health, the costs these
dangers impose on society, the relative straightforwardness of measures to eliminate lead from fuels, and the widespread dissemination of information on best practices (EPA 1999), an alarmingly high number of countries continue to use lead as an octane enhancer, with rather long timetables for the transition to unleaded fuel. Not all are in the developing world. While international aid institutions such as the World Bank and the United States Agency for International Development (USAID) continue to pressure for the elimination of lead in developing countries, misperceptions regarding the costs and benefits of doing so continue to abound in countries where lead use is prevalent. However, the path to lead elimination is well understood and documented; the challenge facing the international community vis-à-vis lead is dissemination of infor mation.
2. Harmonization of transport activity and emissions data tracking and reporting
This report has highlighted the need for accurate, high-quality information and data in
evaluating and implementing policy measures for transport emissions reduction. The design and assessment of policies such as sales standards, import restrictions, road pricing, public transport development, and fuel taxes all depend on the availability of information, which allows analysts to identify the optimal price, the appropriate standard, or the needed level of investment to obtain the greatest emissions savings for the marginal dollar. Unfortunately, too many countries not only do not have this type of information available, but do not even recognize the need or value of having such information and do not have the institutional capability of generating it even if they wanted to do so. In the past, the generation of this information tended to be opportunistic: a particular multilateral or bilateral development agency agreed to participate in a particular programme, for which a given set of information was needed, resulting in the financing of a single study. Such an approach is not sustainable, since it does not help to develop the necessary institutional know-how, does not provide for an ongoing stream of information that can be used in policy assessment, and frequently does not facilitate broader use of the information generated than the particular project at hand. A recent position paper by the Tata Energy Research Institute in India identified 10 significant challenges to vehicle emission control strategies in India: five of these related to the unavailability of data or the unsatisfactory nature of available data.
An international initiative on transport emissions data and knowledge might provide the
needed support and training for, first, making policy makers recognize the need for and potential uses of such valuable information and, subsequently, building up the institutional capacity within developing countries to generate it. The initiative could also help to facilitate the harmonization of practices in this area, which will become increasingly important to ensure that transport markets do not become fragmented as emissions and fuel standards become increasingly widespread.
3. Capacity-building in “co-benefits” assessment, and support to negotiators to
clarify the status of transport sector interventions under the Kyoto Protocol

70
There are a great many technical and normative questions on the interaction of “global” and “local” benefits and costs of transport sector interventions. Capacity-building to address these questions involves a number of dimensions: (a) developing the appropriate analytical methodologies–both for annex I and non-annex I countries; (b) developing data collection and analytical capacity in non-annex I countries to utilize these methodologies, as noted in subsection 2 above; (c) providing support to negotiators to agree on appropriate baselines in the sector, from which carbon credits could be allocated;13 and (d) enabling adequate monitoring of projects and programmes to help analysts to gauge actual reduction of emissions of carbon and other pollutants.
4. Preventing fragmentation of markets in development of emissions
and fuel quality standards/regulations
Many developing countries have moved to adopt emissions standards in recent years, and moves to adopt fuel standards are following closely. For smaller developing countries, however, the size of the vehicle market may be too insignificant for unilateral action to be meaningful; a given set of standards in these circumstances may simply constrain supply, thereby discouraging vehicle turnover and potentially exacerbating, rather than relieving, air quality. For motor vehicle manufacturers, elevated production costs from highly fragmented markets are also a significant concern. Both producers and consumers, therefore, have a strong interest in ensuring that the adoption of vehicle and fuel standards does not entail significant market fragmentation.
In the United States and the European Union, high-level institutions have played the role
of honest broker between vehicle manufacturers on the one hand, and geographically smaller jurisdictions looking to impose more stringent regulations on the other hand. In the United States, the National Low Emission Vehicle (NLEV) project was developed by the Environmental Protection Agency, in consultation with industry, as an alternative to the adoption by individual States of stricter emissions regulations. In an international context, a similar partnership for vehicle and fuel technology modernization and harmonization might help to ensure that, region by region, markets remain sufficiently free from fragmentation to allow both country policy makers and vehicle manufacturers to meet their objectives effectively.
5. Development of innovative strategies to address motorization, and better
identification and targeting of technological solutions for developing countries
Advances in emissions control and energy -efficiency technology have been driven by two somewhat countervailing forces. On the one hand are the various technology -forcing standards that have been implemented in the United States and Japan. On the other hand is the overwhelming impact of consumer expectations for automotive technology. These forces have pushed the automobile industry, and related emissions control industries, for which the automotive industry is the primary client, to research and develop particular kinds of technologies.
This R and D activity, therefore, has been predominantly focused on meeting market and
regulatory expectations in industrialized countries. The technologies developed and the applications to which they are put reflect cultural values specific to developed countries, and may
13 This is particularly important for the transport sector because the determination of baselines can, de facto, affect whether Certified Emissions Reductions generated from the transport sector can be competitive with those from other sectors.

71
not always be appropriate in developing country contexts. The adoption of developed country automotive technology–including organizational patterns of ownership and use–into developing countries, with subsequent concern about how these societies can restructure themselves (for example, through massive infrastructure investments and changes to land-uses) to make the technologies more usable, may represent an inappropriate overall approach to the use of automotive technology for economic development.
By contrast, technologies which may be appropriate for developing countries may be
either developed only to prototype stage (not made production-ready), or overlooked entirely, by manufacturers looking primarily to developed country markets. For example, the decline of research into battery-electric cars has been driven largely by the high costs associated with extending the range of existing battery technology. This range is considered too limiting for market viability in most developed countries; it may, however, be appropriate in certain developing country situations.
Creative and innovative approaches to transportation and economic development
problems appropriate to a particular country will need to be developed in specific contexts, by individuals and groups most familiar with those contexts. The international community can play an important role in information exchange, dissemination of best practice information, and financing of think-tanks concerned with innovative approaches to developing country transport problems and pilot projects (eventually, possibly within the context of the CDM).
6. Capacity-building for integration of environmental criteria into major
investment decisions and long-term planning
A number of countries and lending institutions mandate the use of environmental impact assessment in the evaluation of major investments and adoption of planning policies. However, the integration of environmental criteria into the planning process itself is not always practiced, meaning that the environmental assessment is used mainly as a tool to define mitigation measures on a course of action already determined, rather than to choose a course of action with the least amount of environmental impact for a desired outcome. Methodologies designed for the functional integration of environmental criteria into decision-making processes, particularly as they affect the transportation sector, are under development if not widespread use in the United States and Europe. These include methods to evaluate the actual and environmental costs of different investment scenarios corresponding to different patterns of urban development, and methods to take into account the effects of induced travel from infrastructure. Such methods are most useful in rapidly urbanizing regions, such as those found throughout the developing world. The international community can play a pivotal role in helping to develop these evaluation techniques further, and in bringing them to the urban areas that most need them.
7. Knowledge-sharing and analytical support Between the activities of individual countries, the current international initiatives by
numerous international and bilateral development institutions, including those noted above, the research and development activities of the automotive and fuel industries, and the various pilot projects of different foundations and non-governmental organizations (NGOs), there is a tremendous amount of activity and innovation occurring in the field of sustainable transport. Access to the knowledge gained by this innovation is haphazard at best. Unlike other sectors, such as energy, there are few institutional mechanisms to pool the information and knowledge generated by this tremendous body of activity. Furthermore, as the flexibility mechanisms in the Kyoto Protocol are refined, and institutions and markets begin to participate in them, the amount

72
of activity–as well as lessons learned–is likely to increase significantly. Developing a mechanism to pool information, as well as provide information about access to resources for countries and cities with little practical experience in this field, is an important unmet need that the international community can address.
8. The Global Initiative on Transport Emissions
In preparation for the ninth session of the Commission on Sustainable Development, the
United Nations and the World Bank pooled resources and knowledge in a partnership focusing on some of the needs highlighted above. The GITE undertook a number of activities in preparation for the ninth session on transport and energy. These activities included an Expert Group Meeting on Transport and Sustainable Development held in New York in October 2000. The Meeting focused on providing input into the session preparations, as well as ensuring the participation of other organizations through transport and energy -related activities, and the funding of a background report on worldwide issues relating to pollutant emissions from transport (the present report). In addition, GITE is developing projects and longer-term cooperative programmes with the Brazilian National Programme for Rationalization of the Use of Petroleum Derivatives and Natural Gas (CONPET), the Japanese Automobile Research Institute and the International Energy Agency, among others. These projects and programmes are being developed in three clusters of activities.
Partnership for Vehicle and Fuel Technology Modernization (PVFTM). As this
report has emphasized, the technology divide that characterizes developed and developing countries with respect to transport is not technological, but rather economic and institutional. Bringing technologies into vehicle fleets and fuel supply that can help to reduce emissions of local pollutants and greenhouse gases requires a concerted and well-intentioned effort of all parties involved, including transport ministries, finance ministries, automobile manufacturers and dealers, fuel refiners and retailers, and transport consumers. Often, the difficulty may not be one of deciding which technology is most appropriate, but rather figuring out why more appropriate technologies are not being used. PVFTM is aimed at creating a structured forum in which these stakeholders can discuss these issues and forge regional solutions that enable manufacturers and fuel producers to cut costs while enhancing the use of environmentally friendly automotive and fuel technology. This forum could become a key element in the regional harmonization of technological and environmental standards or benchmarks.
Transport Emissions Knowledge Initiative (TEKI). This component targets the need,
highlighted above, for international support for institutional development in the area of transport statistics and data gathering, management and use. Drawing on statistical expertise from different public and private institutions working with transport issues, and the World Bank’s expertise in institution-building and capacity development, TEKI will synthesize a unique programme of training in, and promotion of, transport statistics in developing countries. This know-how, in turn, will be used to refine and develop efficient transport emissions reduction policies and measures. TEKI will also focus on the dissemination of knowledge as a potential tool in its own right to help to reduce transport emissions.
Small Initiatives Clearinghouse (SIC). There is another important cluster of activities
in which GITE is working to address the unmet needs outlined above, by providing access to information on financing for small initiatives in transport and disseminating the lessons learned from all the various initiatives. This function involves not only the constant monitoring of activities by various public, quasi-public, and private actors in transport projects, but also periodic synthesis of the state of the art and best practices.

73
As a partnership between the World Bank, the United Nations and the private sector,
GITE can become an important institution for addressing some of the unmet needs of developing countries. GITE can assist these countries in building up their transport sectors and orienting that growth towards a more sustainable path. GITE can also help to reduce the harmful emissions of local and global pollutants, while ensuring for the citizens of these countries the economic rewards and quality of life that are created by accessibility.

74
ANNEXES

75

76
Annex I
PRIMARY AND SECONDARY POLLUTANTS FROM THE TRANSPORT SECTOR
Lead
The negative effects of lead are clear and well documented. Ingestion of lead aerosols
has been linked to cardiovascular disease, brain and kidney failure in adults and children at 100 micrograms per decilitre (µg/dL) and 80 µg/dL respectively, premature death at 125 µg/dL, and gastrointestinal symptoms. Chronic effects include behavi oural and developmental problems among children, elevated blood pressure, problems with metabolizing vitamin D, and anaemia (EPA 2000). Exposure to lead has also been associated with decreased sperm count in men, and increased likelihood of spontaneous abortion among pregnant women. Within the transport sector, lead has also been linked to hidden maintenance costs of automobiles, such as frequency of spark plug, oil and filter, muffler, and exhaust pipe replacements. In the United States, the marginal costs to the economy of each 10 mg of lead per litre of gasoline have been estimated at about US$ 17 million per year (Schwartz 1994).
The lead industry projects that by 2005, lead will be completely phased out of the gasoline supply in 28 per cent of all countries, representing 68 per cent of the world’s population (International Lead Management Center [ILMC] 2000). Nevertheless, after 2005, the burden on populations still living in countries with leaded gasoline will fall disproportionately on developing countries—particularly those in Africa and the Middle East—as shown in figure A.I below. This figure shows the proportion of population, for each world region, living in a country that has not phased out leaded gasoline by 2001 and 2005. The burden for Africa and the Middle East is even more marked than the figure implies, however, because allowable lead levels are significantly higher there than elsewhere, as table A.1 shows. Even where countries have not completely phased out lead, those with relatively low levels of permissible lead (under 15 mg per litre) tend to be medium- or high-income countries. The situation in sub-Saharan Africa is of particular concern, not only because no country in that region has completely phased out the use of leaded gasoline, but also because high lead levels in gasoline are tolerated; over one quarter of the countries there tolerate a standard of .84 grams per litre, and the median allowed lead content is .64, over four times higher than the world median.
Studies carried out by the World Health Organization have shown that children in developing countries have three times as much body lead content than children in the United States, Japan and the EU (Wijetilleke and Karunaratne 1995). The EPA (1999) has estimated that health damages from using lead in gasoline in a typical megacity in a developing country are approximately US$ 0.24 per gram of lead used, which is more than 10 times the savings to refiners from using lead as opposed to other octane-enhancing methods.
Particulate matter
Although quite harmful, lead is largely considered a highly manageable pollutant, because emitted lead is directly proportional to the amount of lead in the fuel, and technical and policy mechanisms for reducing lead content are well understood and documented. Among the
Comment [O1]: This is this: http://www.epa.gov/t tnuatw1/hlthef/lead.html
Comment [RG2]: Schwartz, J. (1994) "Societal Benefits of Reducing Lead Exposure", in Environmental Research No. 66. pp. 105-124
Comment [O3]: This: International Lead Management Center http://www.ilmc.org/

77
various pollutants emitted by the transport sector, therefore, particulate matter, small solid or liquid particles or aerosols suspended in air, is the most daunting because the direct impacts on human health as far as they are understood today appear to be significant, and because reducing these emissions is tricky. Unfortunately, while the adverse effects on human health are well established, the precise chemical, biological, and physical mechanisms responsible for these effects are poorly understood.
Figure A.I. Proportion of population living in a country with leaded gasoline, by region
Source : Author’s calculations based on statistics from the International Lead Management Center. Notes: Regional definitions correspond to those used by the International Energy Agency, World Energy
Outlook (Paris, 1998). Data for China include Hong Kong Special Administrative Region of China, Macao Special Administrative Region of China and Taiwan Province of China. EIT = economies in transition.
0%
10%
20%
30%
40%
50%
60%
70%
80%
90%
100%
Middle E
ast Africa
Latin A
merica
South
Asia
East A
sia (e
xcl. C
hina) Chin
a EIT
OECD Pa
cific
OECD E
urope
OECD N
orth Am
erica W
orld
2001
Beyond2005
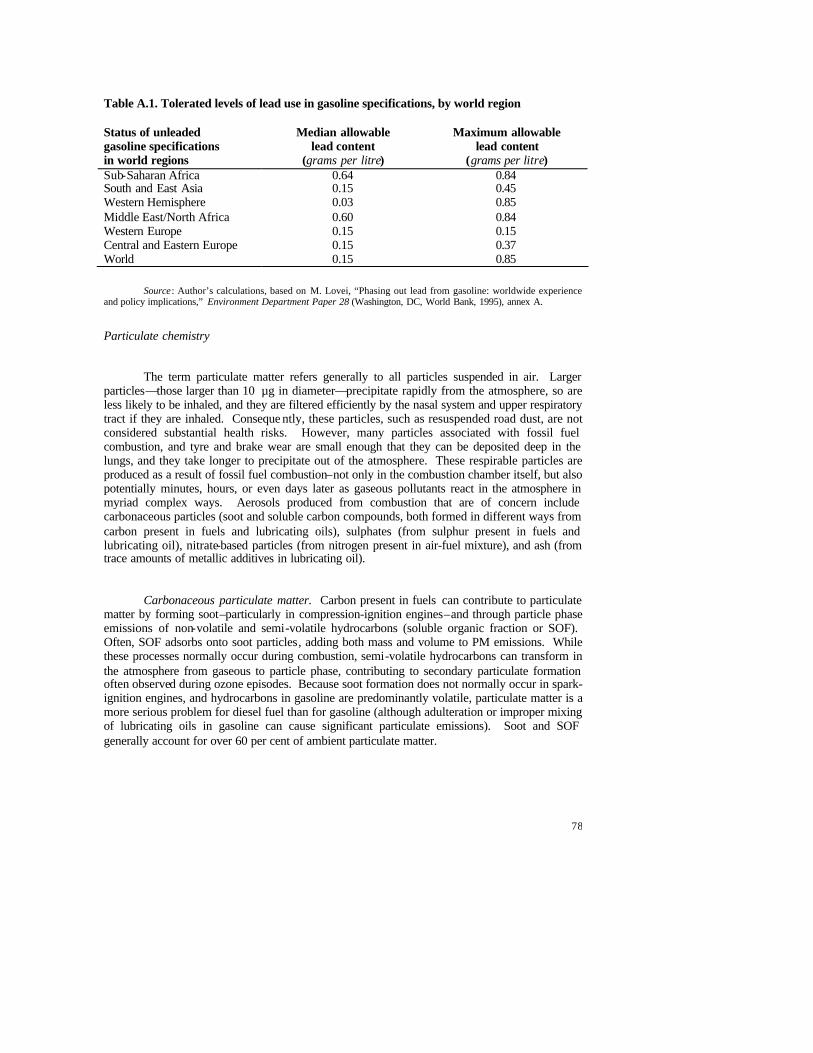
78
Table A.1. Tolerated levels of lead use in gasoline specifications, by world region
Status of unleaded gasoline specifications in world regions
Median allowable lead content
(grams per litre)
Maximum allowable lead content
(grams per litre) Sub-Saharan Africa 0.64 0.84 South and East Asia 0.15 0.45 Western Hemisphere 0.03 0.85 Middle East/North Africa 0.60 0.84 Western Europe 0.15 0.15 Central and Eastern Europe 0.15 0.37 World 0.15 0.85
Source : Author’s calculations, based on M. Lovei, “Phasing out lead from gasoline: worldwide experience and policy implications,” Environment Department Paper 28 (Washington, DC, World Bank, 1995), annex A.
Particulate chemistry
The term particulate matter refers generally to all particles suspended in air. Larger particles—those larger than 10 µg in diameter—precipitate rapidly from the atmosphere, so are less likely to be inhaled, and they are filtered efficiently by the nasal system and upper respiratory tract if they are inhaled. Conseque ntly, these particles, such as resuspended road dust, are not considered substantial health risks. However, many particles associated with fossil fuel combustion, and tyre and brake wear are small enough that they can be deposited deep in the lungs, and they take longer to precipitate out of the atmosphere. These respirable particles are produced as a result of fossil fuel combustion–not only in the combustion chamber itself, but also potentially minutes, hours, or even days later as gaseous pollutants react in the atmosphere in myriad complex ways. Aerosols produced from combustion that are of concern include carbonaceous particles (soot and soluble carbon compounds, both formed in different ways from carbon present in fuels and lubricating oils), sulphates (from sulphur present in fuels and lubricating oil), nitrate-based particles (from nitrogen present in air-fuel mixture), and ash (from trace amounts of metallic additives in lubricating oil).
Carbonaceous particulate matter. Carbon present in fuels can contribute to particulate matter by forming soot–particularly in compression-ignition engines–and through particle phase emissions of non-volatile and semi-volatile hydrocarbons (soluble organic fraction or SOF). Often, SOF adsorbs onto soot particles, adding both mass and volume to PM emissions. While these processes normally occur during combustion, semi-volatile hydrocarbons can transform in the atmosphere from gaseous to particle phase, contributing to secondary particulate formation often observed during ozone episodes. Because soot formation does not normally occur in spark-ignition engines, and hydrocarbons in gasoline are predominantly volatile, particulate matter is a more serious problem for diesel fuel than for gasoline (although adulteration or improper mixing of lubricating oils in gasoline can cause significant particulate emissions). Soot and SOF generally account for over 60 per cent of ambient particulate matter.

79
Sulphates. Sulphur is another important component of petroleum-based transport fuels that contributes to particulate matter, in the form of hydrated sulphates (for example, sulphuric acid or ammonium sulphate). Sulphur dioxide (SO2), produced during combustion, will oxidize to form sulphate ions (SO3
+), which, in turn, will hydrate to produce sulphuric acid. The oxidation may occur in or near the combustion chamber (normally about 2-5 per cent of SO2 emissions), in the exhaust stream, or in subsequent atmospheric reactions. In particular, platinum catalysts used in exhaust aftertreatment systems can greatly increase the rate of SO2 oxidation. Therefore, catalytic devices to reduce emissions of pollutants such as carbon monoxide, hydrocarbons (including SOF), carbonaceous particulates–for example, with particulate traps that regenerate the filter with catalytic technology –may exacerbate sulphate particulates. Ammonia-related compounds used in certain NOx control technologies, such as selective catalytic reduction, may also exacerbate ammonium sulfate emissions.
Because sulphur tends to remain in the heavier petroleum distillates during the distillation process, sulfur is generally more prevalent in diesel than in gasoline. What sulphur does come into gasoline, therefore, results from fluid catalytic cracking processes. Sulphate composition of ambient particulate matter can vary significantly, but is generally under 40 per cent.
Nitrates and ash. Sulphur and carbon compounds are the predominant constituents of atmospheric particulates, but nitrates and ash also tend to be present in urban particulate matter. Nitrates, formed from the reaction of nitric acid with alkaline minerals or ammonia, are of particular concern, because they generally are in the ultra-fine or nano-size range. Ash consists of primarily metallic or mixed particles from trace substances found in fuels, which are of some concern because they can absorb SOF particles, providing a conduit for potential human toxins.
Health impact of particulate matter
Particulate matter has been associated epidemiologically with cardiopulmonary disease, cardiovascular disease, respiratory disease, lung cancer, and other cancers (Krewski and others 2000). The precise nature of the mechanism for these diseases, however, is unclear. It is suspected that both particle size and particle composition play a role in these diseases.
Particle size. The size of particles is of increasing concern in the assessment of the impact of particulates on human health. Worldwide, most ambient air quality and emission regulations focus on particulates smaller than 10 microns in diameter. However, fine particles (below 2.5 microns) are increasingly identified as a potentially more serious source of health deterioration problems than larger ones. Most fine particulates are actually smaller than 1 micron, allowing them to penetrate deep in the lung. Regulations focusing on PM 10 may therefore be relatively ineffective at, and insufficient for, protecting human health. These uncertainties, as well as the uncertainties concerning the number, rather than the mass, of SOF particulates produced by the different fuels reviewed above, leave open the possibility that excessive focus on diesel vehicles as the transport sector’s primary culprit in particulate-related human health deterioration may prove to be misplaced.
It is believed that 60 per cent of all suspended particulate matter are fine particles (Lvovsky and others 2000). Direct combustion sources are typically 50-60 per cent, but including
Comment [O4]: Good resource for this stuff: http://www.neosoft.com/~ghasp/toxics_report/phtp.htm
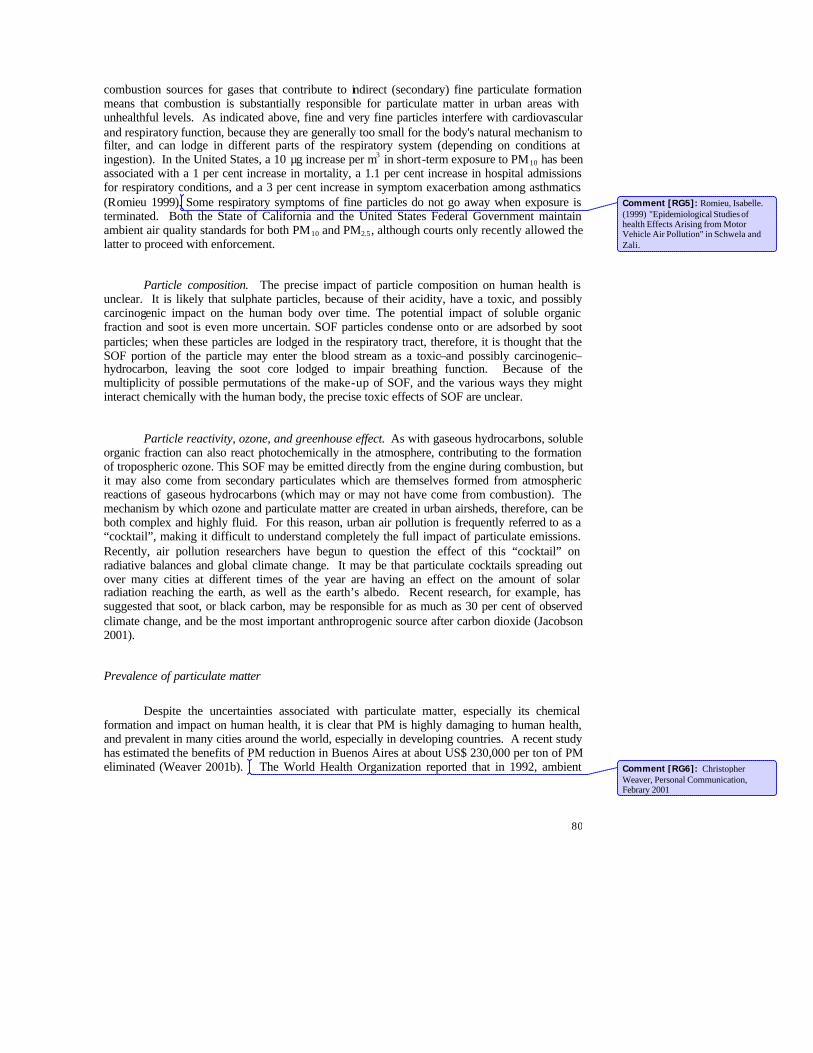
80
combustion sources for gases that contribute to indirect (secondary) fine particulate formation means that combustion is substantially responsible for particulate matter in urban areas with unhealthful levels. As indicated above, fine and very fine particles interfere with cardiovascular and respiratory function, because they are generally too small for the body's natural mechanism to filter, and can lodge in different parts of the respiratory system (depending on conditions at ingestion). In the United States, a 10 µg increase per m3 in short-term exposure to PM10 has been associated with a 1 per cent increase in mortality, a 1.1 per cent increase in hospital admissions for respiratory conditions, and a 3 per cent increase in symptom exacerbation among asthmatics (Romieu 1999). Some respiratory symptoms of fine particles do not go away when exposure is terminated. Both the State of California and the United States Federal Government maintain ambient air quality standards for both PM10 and PM2.5, although courts only recently allowed the latter to proceed with enforcement.
Particle composition. The precise impact of particle composition on human health is unclear. It is likely that sulphate particles, because of their acidity, have a toxic, and possibly carcinogenic impact on the human body over time. The potential impact of soluble organic fraction and soot is even more uncertain. SOF particles condense onto or are adsorbed by soot particles; when these particles are lodged in the respiratory tract, therefore, it is thought that the SOF portion of the particle may enter the blood stream as a toxic–and possibly carcinogenic–hydrocarbon, leaving the soot core lodged to impair breathing function. Because of the multiplicity of possible permutations of the make-up of SOF, and the various ways they might interact chemically with the human body, the precise toxic effects of SOF are unclear.
Particle reactivity, ozone, and greenhouse effect. As with gaseous hydrocarbons, soluble organic fraction can also react photochemically in the atmosphere, contributing to the formation of tropospheric ozone. This SOF may be emitted directly from the engine during combustion, but it may also come from secondary particulates which are themselves formed from atmospheric reactions of gaseous hydrocarbons (which may or may not have come from combustion). The mechanism by which ozone and particulate matter are created in urban airsheds, therefore, can be both complex and highly fluid. For this reason, urban air pollution is frequently referred to as a “cocktail”, making it difficult to understand completely the full impact of particulate emissions. Recently, air pollution researchers have begun to question the effect of this “cocktail” on radiative balances and global climate change. It may be that particulate cocktails spreading out over many cities at different times of the year are having an effect on the amount of solar radiation reaching the earth, as well as the earth’s albedo. Recent research, for example, has suggested that soot, or black carbon, may be responsible for as much as 30 per cent of observed climate change, and be the most important anthroprogenic source after carbon dioxide (Jacobson 2001).
Prevalence of particulate matter
Despite the uncertainties associated with particulate matter, especially its chemical formation and impact on human health, it is clear that PM is highly damaging to human health, and prevalent in many cities around the world, especially in developing countries. A recent study has estimated the benefits of PM reduction in Buenos Aires at about US$ 230,000 per ton of PM eliminated (Weaver 2001b). The World Health Organization reported that in 1992, ambient
Comment [RG5]: Romieu, Isabelle. (1999) "Epidemiological Studies of health Effects Arising from Motor Vehicle Air Pollution" in Schwela and Zali.
Comment [RG6]: Christopher Weaver, Personal Communication, Febrary 2001

81
concentrations of particulate matter were very high for many cities, in both developing and developed countries, as shown in figure A.II below.
Volatile organic compounds
Volatile organic compounds are usually regulated collectively as a group in emissions
standards. The term refers to those hydrocarbons susceptible to evaporation, and in common usage excludes methane, which is relatively unreactive. Lighter petroleum distillates tend to have higher volatility content, but reformulation and blending can reduce this somewhat. VOCs are released either directly from unburned portions of gasoline (either during combustion or immediately after combustion in the case of two-stroke engines or through evaporation at any time during the fuel delivery chain) or indirectly, as intermediate products of incomplete combustion. Higher flame temperatures, longer residence times, or greater oxygen content in the combustion chamber will reduce the chance of incomplete combustion, thereby reducing hydrocarbon emissions in the exhaust stream.
VOCs represent an air quality concern for two reasons. First, they are an important precursor to ozone formation. Secondly, many VOCs are themselves toxic.
Ozone-forming potential
Hydrocarbons react with NOx in sunlight to form ozone (O3) through complex atmospheric reactions. Because ozone is an unstable molecule, it requires energy to form and remain intact, and can break down easily into normal oxygen molecules (O2). For this reason, ozone is dangerous to human health; it interferes with respiratory function, leads to reduced lung capacity and increases the intensity of lung infections. An increase of 80 µg per m3 of ozone over a one-hour exposure, or 30 µg per m3 in an eight-hour exposure, has been associated with a 100 per cent increase in respiratory symptoms. An increase of 12 µg per m3 over an eight-hour exposure has also been associated with a 20 per cent increase in hospital admissions for respiratory conditions (Romieu 1999). The impact of long-term and chronic exposure to ozone is unclear, but some evidence suggests reason for concern (Romieu 1999).

82
Figure A.II. Relative problem of particulate matter in world megacities
Serious Problem: WHOguidelines exceeded by more thana factor of two
Moderate to heavy pollution:WHO guidelines exceeded by upto a factor of two (short-termguidelines exceeded on a regularbasis at certain locations)
Low pollution, WHO guidelinesare normally met (short-termguidelines may be exceededoccasionally)
No data available or insufficientdata for assessment
Source : WHO/UNEP (United Nations Environment Programme, Urban Air Pollution in Megacities of the
World (Oxford [United Kingdom], Blackwell, 1992). Unlike other pollutants, oz one is a problem associated with cities in wealthy and poor
countries alike, as figure A.III shows.
In the formation of ozone, some hydrocarbons are more reactive than others, depending on the complexity of molecular structure and the strength of the molecular bonds. For example, complex aromatics and olefins tend to be more reactive than straight chain paraffins. For this reason, some jurisdictions have moved towards emission restrictions targeting the more reactive VOCs, as opposed to simply non-methane hydrocarbons (NMHCs). California’s NLEV regulations, for example, target a “reactivity adjusted” non-methane organic gas standard, under which different VOC species are weighted by photochemical reactivity.
VOC toxicity
Many hydrocarbons are known or suspected to have significant toxic effects on human health, as well as vegetation and animal life. Finding an effective mechanism to enact policy regarding these effects, however, has been tricky, because dose-response relationships are specific to particular hydrocarbons, while the relative content of any particular hydrocarbon in exhaust or evaporative emissions is highly variable. The toxic chemicals of most concern from the transport sector include benzene, 1,3 butadiene, various polycyclic aromatic hydrocarbons (PAH), and various aldehydes.
Benzene, the simplest and most basic component of gasoline, has been shown to have harmful effects on the immune system, the neural network, and hemoglobin. It is also a known carcinogen (Romieu 1999). Weaver and Balam (1999) estimate that benzene represents about 4 per cent of gasoline VOC exhaust, and about 6 per cent of diesel VOC exhaust in Mexico City. PAH are complex molecules based on simple aromatic rings such as benzene, and tend to be particularly prevalent in diesel fuel. The potential permutations of PAH are enormous, each with its own potential particular impact on human health. The most prevalent in diesel are toluene and

83
various xylenes, although in toxicology studies, benzo[a]pyrene is often used as an index compound. PAH, which have been shown to be mutagenic and carcinogenic, can bind to soot particles, and be delivered deep into lung tissue. Figure A.III. Relative problem of ozone in world megacities
Serious Problem: WHOguidelines exceeded by more thana factor of two
Moderate to heavy pollution:WHO guidelines exceeded by upto a factor of two (short-termguidelines exceeded on a regularbasis at certain locations)
Low pollution, WHO guidelinesare normally met (short-termguidelines may be exceededoccasionally)
No data available or insufficientdata for assessment
Source : WHO/UNEP, Urban Air Pollution in Megacities of the World (Oxford [United Kingdom],
Blackwell, 1992).
1,3 butadiene and aldehydes (acetaldehyde and formaldehyde) are all products of incomplete combustion of fossil fuels and subsequent atmospheric reactions. It has been estimated that 1,3 butadiene constitutes about 2.4 per cent of gasoline, and 1 per cent of diesel VOC emissions in Mexico City (Weaver and Balam 1999), but these emissions are highly dependent on the gasoline blends used. Aldehydes are particularly prevalent as a by-product from alcohol (methanol or ethanol) combustion, either when used as directly as a fuel, or as an additive, oxygenate, or octane enhancer (such as ETBE [ethyl tertiary butyl ether] or MTBE). 1,3 butadiene is a known carcinogen and mutagen. It has been shown to cause defects in fetal development, but these effects have been proven only on laboratory animals. Sensory irritation in humans, however, particularly to eyes, has been proven (Calabrese and Kenyon 1991). Acetaldehyde and formaldehyde are known irritants and are suspected of being carcinogenic to humans.
In addition to its contribution to aldehyde formation, MTBE has also recently been the subject of some concern as a water toxic, from groundwater contamination through seepage. In tests near refilling stations in California and Mexico City, MTBE contamination of groundwater has been found, raising fears about the impact on human health. California has banned the use of MTBE as a fuel additive—not without controversy—and the United States En vironmental Protection Agency is currently considering such a ban.
NOx
Comment [RG7]: Calabrese, Edward J. and Elaina M. Kenyon. (1991) Air Toxics and Risk Assessment. Chelsea (Michigan): Lewis Publishers, Inc. 1991.

84
Oxides of nitrogen constitute another important category of regulated pollutants. Like VOCs, these pollutants are of concern both because of their direct effects on human health, and because they react in the atmosphere (with VOCs) to produce ozone. Nitric oxide (NO) and nitrogen dioxide (NO2) are released in combustion because molecular nitrogen (N2) present in the air/fuel mixture splits and is oxidized. Because molecular nitrogen is relatively stable, the proportion that splits and becomes involved in the combustion reaction is directly related to the flame temperature and duration of the combustion (residence time). Consequently, high flame temperatures and/or long residence times–precisely the kinds of engine changes that might reduce VOC or PM emissions–will increase NOx emissions.
NO2 has been shown to have toxic effects on human health, including altered lung function, respiratory illness, and lung tissue damage (Shah and others 1997). NO2 has also been shown to exacerbate asthmatic symptoms. At the tailpipe, the volume of NOx is about nine parts NO to one part NO2. While NO is considered more benign to human health, it frequently oxidizes in atmospheric reactions to NO2. This reaction is a key component of ozone formation, so reduction of NOx emissions is a crucial element in resolving ozone problems. A WHO/UNEP survey of megacities throughout the world, conducted in the early 1990s, found NO2 a prevalent problem in cities in both developed and developing countries, as shown in figure A.IV.
Figure A.IV. Relative problem of NO2 in world megacities
Serious Problem: WHOguidelines exceeded by more thana factor of two
Moderate to heavy pollution:WHO guidelines exceeded by upto a factor of two (short-termguidelines exceeded on a regularbasis at certain locations)
Low pollution, WHO guidelinesare normally met (short-termguidelines may be exceededoccasionally)
No data available or insufficientdata for assessment
Source : WHO/UNEP, Urban Air Pollution in Megacities of the World (Oxford [United Kingdom],
Blackwell, 1992).
CO
Carbon monoxide is an interim gas in combustion, resulting from incomplete combustion–meaning the flame temperature is too low, the residence time too short, or oxygen too scarce (fuel-rich condition). Consequently, CO emissions are often highly correlated with HC emissions. In the human body, CO can cause oxygen deprivation (hypoxia) displacing oxygen in bonding with hemoglobin. This can cause cardiovascular and coronary problems, increase risk of

85
stroke, and impair learning ability, dexterity and sleep. The above-mentioned WHO/UNEP survey of megacities found CO a problem in a wide range of cities, but a serious problem only in Mexico City, as shown in figure A.V; CO levels in that city have fallen since the WHO/UNEP survey in the early 1990s, however.
SOx
Although particulate sulphates are released in fossil fuel combustion, most of the sulphur
tends to be released in gaseous form (sulphur dioxide or sulphuric acid). Because of the quantities of sulphur found in heavy oil and coal, as opposed to gasoline or diesel, the transport sector’s relative contribution to SOx in many areas, especially coal-burning areas, is actually quite low. In general, the lower the measured ambient concentrations of SOx, the higher the proportion from transport is likely to be. For this reason, concern about sulphur in transport fuels has tended to focus much more on sulphur’s contribution to particulate matter concentrations, as noted above, than on SO2. In metropolitan regions where SO2 is a major health concern, it may often be more cost-effective to address the non-transport sources of ambient concentrations. SO2 is associated with various bronchial conditions, which can be acute even at relatively low levels of exposure for children or asthmatics. Sulphuric acid has also been shown to have respiratory effects. As figure A.VI indicates, SO2 is a serious problem in Beijing, Mexico City, and Seoul.
Figure A.V. Relative problem of CO in world megacities
Serious Problem: WHOguidelines exceeded by more thana factor of two
Moderate to heavy pollution:WHO guidelines exceeded by upto a factor of two (short-termguidelines exceeded on a regularbasis at certain locations)
Low pollution, WHO guidelinesare normally met (short-termguidelines may be exceededoccasionally)
No data available or insufficientdata for assessment
Source : WHO/UNEP, Urban Air Pollution in Megacities of the World (Oxford [United Kingdom],
Blackwell, 1992).

86
Figure A.VI. Relative problem of SO2 in world megacities
Serious Problem: WHOguidelines exceeded by more thana factor of two
Moderate to heavy pollution:WHO guidelines exceeded by upto a factor of two (short-termguidelines exceeded on a regularbasis at certain locations)
Low pollution, WHO guidelinesare normally met (short-termguidelines may be exceededoccasionally)
No data available or insufficientdata for assessment
Source : WHO/UNEP, Urban Air Pollution in Megacities of the World (Oxford [United Kingdom],
Blackwell, 1992).
NOx and VOC standards Because NOx and VOCs both contribute to ozone formation, but respond differently to
different technological interventions, early emissions regulation focusing on ozone reduction often established a combined NOx/VOC standard, particularly for diesel vehicles. The difficulty of any strategy targeting ozone reduction is in knowing precisely what the NOx/VOC composition of ozone for a given urban airshed actually is. Figure A.VII shows a typical NOx/VOC isopleth for an urban area. Points A and B both reflect the same level of ozone pollution produced by different amounts of NOx and VOCs. A strategy of reducing NOx if the initial NOx/VOC concentrations are represented by point B will be ineffective and, in this example, would actually increase ozone concentrations. Similarly, reducing VOC concentrations if the NOx/VOC concentrations are represented by point A will also be ineffective. Consequently, no single ozone reduction strategy is appropriate for all urban airsheds. In practice, most urban airsheds tend to be located toward the lower right portion of the diagram, where NOx strategies would be more effective than VOC strategies (Weaver 2001b). However, without local information, an inappropriately targeted strategy could prove costly.

87
Figure A.VII. Isopleth of NOx and VOC contribution to ozone formation
Source : D. Daescu, A Generalized Reaction Mechanism for Photochemical Smog, University of Iowa,
http://www.math.uiowa.edu/~ddaescu/task3.html

88
Annex II
EXCESSIVE VEHICLE USE
For any given level of economic development or aspired-to quality of life, a certain amount of travel by motorized vehicle can be considered necessary simply to achieve that aspiration or level of development. Above this amount, vehicle use can be considered to be “excessive”. In microeconomic terms, it can be thought of as the difference between actual car use, and that which would occur if all marginal social costs were included in the costs seen by users. The phenomenon of excessive car use is linked to two important and interrelated factors: the controversial concept of “car dependence”1 and the prevalence of price distortions favouring car use.
Despite its prevalence in recent policy discussions, the concept of car dependence remains poorly defined in the literature (Gorham forthcoming). Gorham (forthcoming) characterizes car dependence in developed economies as afflicting households for whom “sustained abstinence from regular car use would impose so high a social or economic burden on itself that such abstinence either is considered intolerable, or is inconceivable in the first place.” The factors contributing to such a condition of car dependence are rarely adequately enumerated. Land-use and urban settlement patterns are frequently cited (Litman 1999; Newman and Kenworthy 1989; Newman and Kenworthy 1999), but there are a number of other factors contributing to this sense of powerlessness in the absence of car transportation. Gorham (forthcoming) suggests two other categories of factors: (a) psycho-social factors, in which the car and the transportation it provides take on psychological and social meanings that reflect deficits in individual lives; and (b) circumstantial factors, in which whole lifestyles change in response to a car, changes which cannot easily be undone once made.
The second factor creating conditions of excessive car use is pricing (and land-use) policy that creates price distortions favouring car use over other forms of accessibility. These distortions might include subsidies to road users through the road financing mechanism, unperceived costs through land-use policies that “hide” certain costs or taxing policy that masks the relationship of fixed to variable costs, a possible subsidy hidden embedded within the concept of induced travel, and secondary or feedback loops, through the capitalization of existing subsidies into land values.
Fuel subsidies. Many countries, particularly in the developing world, maintain fuel subsidies that keep out-of-pocket costs lower than border prices. In many cases, these subsidies are not intended for the transport sector, but rather for the agricultural or household sectors in the form of price supports to diesel and kerosene, or propane, respectively. The perverse effect of such subsidies is that these subsidies may artificially create demand from the transport sector—demand that drives up prices for the very sectors for which they are intended.
General subsidies to road users. A number of studies in the United States and Europe suggest that road users are not exposed to the full range of costs they impose. A well-known and
1 For example, as reviewed in Litman 1999 or Newman and Kenworthy 1999.

89
highly regarded study of transport cost recovery in the United States found that, in 1991, users paid only between 43 and 60 per cent (depending on certain assumptions) of the total costs of road use, including externalities such as congestion, pollution and traffic accidents (Delucchi 1997). A similar analysis of 15 European countries for the same year concluded that road users there on average pay only about 30 per cent of total costs, although with considerable variation between European Union (EU) States, as shown in figure A.VIII (EEA 1999). (Belgians covered only 7 per cent, while Danes covered 52 per cent of total road costs.)
Figure A.VIII. Proportion of infrastructure and external costs recovered by European rail and road sectors
0% 10% 20% 30% 40% 50% 60%
Austria
Belgium
Denmark
Finland
France
Germany
Greece
Ireland
Italy
Luxembourg
Netherlands
Portugal
Spain
Sweden
United Kingdom
EU15
RailRoad
Source : European Environment Agency, Are We Moving in the Right Direction? TERM 2000 (Copenhagen,
1999) (http://reports.eea.eu.int/ENVISSUENo12/en/page025.html).
Willoughby (2000a) has compiled estimates of the net road transport costs as a percentage of GDP, including infrastructure and land costs, externality costs such as congestion, pollution and accidents, and receipts, from a number of different studies and sources. These are shown in table A.2. Willoughby’s numbers suggest that in developing countries, as in developed ones, road users pay little of the total costs they incur; in Buenos Aires, only between 14 and 18 per cent of costs are recovered by road users, and in Santiago, only about 20 per cent of costs are recovered.
Comment [RG8]: http://themes.eea.eu.int/showpage.php/activities/transport?pg=40710

90
If externalities such as costs of congestion, air pollution, noise and accidents are ignored, road users still generally do not pay the full costs they incur, although the cost-recovery proportion is quite high. Delucchi (1997) shows that users in the United States covered between 89 and 95 per cent of monetary costs for road use (again, depending on assumptions), with the remainder paid by taxpayers.
Unperceived costs. A second factor constituting a distortion in prices favouring
excessive car use is the extent to which unperceived costs are built into the urban and pricing policy. Unperceived costs include “fixed” or “sunk” costs, as well as hidden costs inherent in many aspects of automobile ownership and use. A sun k cost is one which vehicle owners pay regardless of the amount they use their vehicles. This can include one-time and periodic, time-dependent costs. Examples include the purchase cost of the vehicle, registration fees, taxes and, conventionally, insurance premiums. Technically, depreciation of a vehicle is not a fixed cost, but most vehicle users perceive it as one.
Hidden costs are incremental costs of other goods that are, in fact, used to pay for
transportation or infrastructure services provided. The classic example is “free” parking at a retail establishment or a site of employment. The hidden cost increment may be a slightly higher price for goods or services purchased, or income forgone because of the parking benefit (Shoup and Breinholt 1997). These costs may, of course, be borne by vehicle users, often unknowingly, but non-vehicle-users may also have to bear these costs as well. In the case of both fixed and hidden costs, the ability of motorists to express the true marginal value of using their vehicle for a given particular trip is suppressed, resulting in “excess” consumption, and an inefficient allocation of resources.
Inducement subsidy. Expansion of infrastructure capacity is associated with “induced”
demand for transportation–that is, an increase in volume of transport demand that would not have occurred in the absence of the capacity expansion (DeCorla-Souza and Cohen 1999; Lee and others 1999). Annex VII to this report reviews this phenomenon in detail. It is also noted briefly here, in that induced travel may constitute a subsidy leading to excessive car use. Unfortunately, most of the theoretical work on the subject to date has focused on trying to identify and describe it adequately, while the empirical work has tried to identify how significant induced demand actually is. Relatively little attention has focused on evaluating the distributional implications of induced demand.
The portion of overall demand increase that can be attributed to facility expansion occurs because of a real or perceived time savings as a result of the change, the economic value of which translates into an income or substitution effect for the traveller. In the absence of facility-specific pricing to offset these price effects, the mechanism to finance the infrastructure facility can be thought of as a transfer of resources, from those paying for the new infrastructure (general taxpayers or current road users, depending on the finance mechanism) to motor vehicle users undertaking the new, incremental vehicle kilometres. In other words, potential travellers are subsidized by the system to undertake new travel by car. The actual assessment of the size of this subsidy is probably quite complex, because it is difficult to know which travellers would otherwise be willing to pay for induced trips. For infrastructure provision, therefore, the most efficient allocation of resources is effected through facility-specific pricing regimes, such as tolls or electronic road pricing (ERP). The real world trade-offs between optimal social-cost pricing and pricing for cost-recovery probably means that, in practical terms, an inducement subsidy can never be completely eliminated, but it can be substantially reduced.
Feedbacks: capitalization of subsidies into land values. Fuel subsidies, general subsidies
to road users, unperceived costs, and inducement subsidies can create conditions in which motor vehicle users do not pay for the full costs they impose on society, particularly when externalities

91
such as air quality deterioration and noise are taken into account. These implicit subsidies can become absorbed and capitalized into the relative distribution of land values and real estate prices (Willoughby 2000a; Lee 1997). Because of the price distortions, travellers perceive the use of private motor vehicles to be relatively less expensive than if they were facing the true costs. Consequently, other modes, and other forms of accessibility (for example, proximity) become relatively costly. These assessments of relative costs are taken into account in medium- and long-term decisions about location, lifestyle, and building patterns, which in turn are reflected in land values in a competitive market. Thus, underpricing of the transport system, in the long run, distorts land markets. This distortion of land markets towards car-intensive lifestyles becomes an important feedback factor in inducing further car dependence, potentially triggering a vicious circle of ever-escalating excessive car use.

92
Table A.2. Estimates of external costs of road transport as a percentage of national/regional GDP
Country/City Year Source Road costs
Land and parking Congestion
Accidents, net of
insurance Noise
pollution Local air pollution GHG a/ Other Subtotal
Revenue from road
users Net
subtotal Others
(i) (ii) (iii) (iv) (v) (vi) (vii) (viii) (ix) (x) (xi) (xii) (xiii) (xiv) (xv)
USA1 1989 WRI 1.64 b/ 1.56 - 1 0.16 0.18 0.5 - 5.04 b/ 5.04 0.46
USA2 c/ 1990 NRDC 1.25 b/ 0.43-1.74 0.19 1.71 0.05 2.09-3.83 0.07 5.69-8.84 b/ 5.69-8.84 0.7 8-2.61
USA3 1991 Lee 1.76 2.41 - 0.24 0.19 0.73 0.26 5.59 0.88 4.71 0.87
EU1 Early 1990s ECMT 1.75 - 0.75 2.4 0.3 0.6 0.5 - 6.3 1.67 4.63 -
EU2 Early 2000s ECMT 1.49 - 0.75 1.2 0.3 0.15 0.47 - 4.36 1.67 2.69 -
UK 1993 CSERGE 0.24 - 3.03 0.46-1.49 0.41-0.49 3.12 0.02 - 7.28-8.39 2.6 4.68-5.79 -
Poland 1995 ISD 1.14 - 0.3 1.6 0.1 0.3 - - 3.44 2.81 0.63 -
São Paulo 1990 IBRD - - 2.43 1.11 - 1.55-3.18 - - - - 5.09-6.72 -
Buenos Aires 1995 FIEL -.73 - 3.42
0.5-2.00 d/ - 0.97 - - 5.62-7.12 1.01 4.61-6.11 -
Bangkok 1995 Misc. - - 1.00-6.00 2.33 2.56 - - 5.89-10.89 -
5.89-10.89 -
Santiago 1994 Zegras 1.37 1.92 1.38 0.94 0.15 2.58 - - 8.35 1.64 6.71 -
Dakar 1996 Tractebel - - 3.37 0.16-4.12 - 5.12 - - 8.65-12.61 - - -
Sources: C. Willoughby, Managing Motorization, TWU Working Paper No. 42 (Washington, DC, World Bank, 2000), based on the following: (a) J.J. Mackenzie, R.C. Dower, and D.D.T. Chen, The Going Rate: What It Really Costs to Drive (Washington, DC, World Resources Institute, 1992); (b) P. Miller and J. Moffet, The Price of Mobility: Uncovering the Hidden Costs of Transportation (New York [New York], Natural Resources Defense Council, 1993); (c) D.B. Lee, “Uses and meanings of full social cost estimates” in D.L. Greene, D.W. Jones, and M.A. Delucchi, The Full Costs and Benefits of Transportation (Heidelberg, Springer, 1997); (d) European Conference of Ministers of Transport, Efficient Transport for Europe: Policies for Internalization of External Costs (Paris, OECD/ECMT, 1998); (e) D. Maddison, D. Pearce, O. Johansson, E. Calthrop, T. Litman, and E. Verhoef, The True Costs of Road Transport, Blueprint No. 5 (London, Earthscan for CSERGE, 1996); (f) Institute for Sustainable Development, Information Package No. 2 on Alternative Transport Policy in Poland (Warsaw, ISD, 1997); (g) World Bank, Draft Staff Appraisal Report for Brazil: São Paulo Integrated Urban Transport Project (Washington, DC, 1994); (h) Fundación de Investigaciones Económicas Latinoamericanas, Financiamiento del Sector Transporte de la Región Metropolitana de Buenos Aires (Buenos Aires, FIEL, 1995); (i) K. Lvovsky, G. Hughes, D. Maddison, B. Ostro, and D. Pearce, Environmental Costs of Fossil Fuels: a Rapid Assessment Method with Application to Six Cities (draft) (Washington, DC, Worl d Bank, 1999); (j) Swedish National Road Consulting AB (SweRoad) and Asian Engineering Consultants Corporation, Consulting Services for Developing a Road Safety Master Plan and a Road Traffic Accident Information System for the Ministry of Transport and Communications, Kingdom of Thailand (1997); (k) V.S. Pendakur, “A tale of two cities: Bangkok and Mexico” in OECD, Towards Clean Transport (Paris, OECD, 1996); (l) D.E. Dowall, Making Urban Land Markets Work: Issues and Policy Options, Working Paper 702 (Berkeley, Institute of Urban and Regional Development, University of California, 1998); (m) C. Zegras, “The

93
costs of transportation in Santiago de Chile: analysis and policy implications,” Transport Policy 5, 1998; and (n) SSATP (World Bank Sub-Saharan Africa Transport Program), Transport en Afrique—Note Technique, SSATP note 19 (1999).
Notes: For USA1, see source (a); for USA2, see source (b); for USA3, see source (c); and for EU1 and EU2, see source (d). a/ GHG = greenhouse gases.
b/ Road costs given net of revenues from road users. c/ Car only. d/ Calculation for nation as a whole and gross of insurance compensation.

94
Annex III
Conventional vehicle technology improvements Technological improvements to internal combustion engine (ICE) vehicles–whether
gasoline, diesel, or CNG–address one of five areas of vehicle operation, as shown in table A.3.
Table A.3. Areas of application of vehicle technology for ICE vehicles Focus
AAffffeeccttss Engine and fuel system Tailpipe emissions of local pollutants, engine energy
intensity (moderate evaporative reduction possible)
Transmission system Vehicle energy intensity and GHG emissions
Aftertreatment of exhaust Tailpipe emissions of local pollutants (can cause moderate increases in vehicle energy intensity)
Fuel-supply and crankcase treatment Evaporative emissions
Vehicle/tyre design for friction reductiona/ Vehicle energy intensity and GHG emissions
a/ Can include improvements to transmission system, aerodynamic design, tyre design, reduction in weight of vehicle, and reduction in power loading of the engine.
Engine and fuel system
Pollutant emissions can be substantially reduced by carefully controlling the characteristics of engine operation, particularly combustion. A number of parameters affecting engine performance can influence the amount of emissions:
• The air-fuel ratio;
• Rate of air-fuel mixing;
• Flame temperature;
• Combustion lag;
• Residence time.
These, in turn, can be strongly influenced by the following:
• The fuel delivery system (including carbureted versus injected and sophistication of injection/carburetion technology);
• The size and shape of the cylinders and pistons;

95
• The nature of the exhaust gas path (direct versus recirculated).
In addition, high compression ratios in the cylinders can increase fuel efficiency, decreasing directly the amount of CO2 emissions and, indirectly, HC and CO emissions.
Applying technologies that affect the above features in order to reduce tailpipe emissions of local pollutants, however, is tricky, because of an inherent trade-off between CO, NMHC, and PM1 0 (in the case of diesel and two-stroke gasoline engines) on the one hand, and NOx and engine performance on the other hand. Car and truck manufacturers in industrialized countries have developed sophisticated technical mechanisms for balancing these trade-offs to minimize overall emissions over a range of pollutants, while maintaining engine performance to meet both consumer needs and fuel-efficiency or carbon-dioxide emissions standards. These technical mechanisms involve “lean-burn” combustion, in which the combustion occurs in an oxygen-rich environment. The state of the art uses sophisticated computer controls on a range of engine functions, controls that can be expensive to install and maintain. Given the limited resources, trying to bring these technologies to developing countries may be of limited value; only a relatively small number of vehicles could be fitted with them and properly maintained.
However, a number of intermediate engine technologies are available to help improve various factors of engine design and move towards lean-burn combustion in developing country contexts, including the use, design and timing of fuel-injection systems, the physical design of the combustion chamber and pistons (particularly important for diesel emissions reduction), and exhaust-gas recirculation techniques. This last technique, which is particularly important for two-stroke engines, where unburned hydrocarbons can be plentiful in the exhaust, contributing to both VOC and PM emissions, also helps to boost overall energy efficiency. For diesel engines, turbocharging and aftercooling are also effective ways of increasing oxygen content in the air-fuel mix, especially at steady-state conditions. Improvements in emissions performance can be achieved with even more basic improvements to engine design, including modification of carburetor design to optimize air/fuel mixture while controlling NOx through retarding ignition timing and recirculating exhaust gas. It is estimated that even these modest changes can reduce NMHC and CO emissions by about two thirds, and NOx emissions by about 10 per cent over unregulated emissions, assuming proper maintenance (Faiz and others 1996).
Exhaust aftertreatment
Aftertreatment of exhaust applies additional technology to engine exhaust to reduce the
amount of pollutants, usually through thermal oxidation (uncatalysed), catalytic conversion (oxidation or oxidation and reduction catalysts), and/or filtration (in the case of diesel particulates). Thermal oxidation involves injecting air into the exhaust gases while they are still very hot (over 600°C) immediately after they leave the combustion chamber. With enough exposure to oxygen, the carbon monoxide and hydrocarbons will continue reacting under these conditions. While it is possible to use the exhaust manifold to pump the requisite air, it is more effective to use an external pump. Air injection as a retrofit strategy must use an external pump, which can be relatively expensive (between $60 and $100 per car).
For gasoline vehicles, three-way (oxidation-reduction) catalysts are effective in reducing NMHCs, CO and NOx. Costing between $250 and $300 per catalyst, their use with closed-loop carburetion or, even better, direct injection technology can reduce NMHC and CO emissions by

96
over 95 per cent of unregulated emissions, and NOx by over 70 per cent.1 A number of logistical problems render the use of catalysts problematic in many developing countries though. The first problem is cost. Although the catalyst itself costs less than US$ 300, other changes required in manufactured cars can push costs to over US$ 650 per vehicle. For retrofits, these required changes usually render the installation of a catalyst on previously uncontrolled gasoline cars economically infeasible.
The second problem is that, in many developing countries, fuel specifications remain incompatible with catalyst use. Sulphur and lead in fuels can degrade or neutralize the catalyst, and the latter can destroy it completely. Even in countries where unleaded fuel is available, if leaded fuel is still available, motorists may misfuel. A single tank of leaded fuel could permanently disable the catalyst. Therefore, mechanisms need to be in place to ensure that such misfuelling, intentional or otherwise, does not occur. The third problem is that, without the use of additional technology such as fuel injection, catalysts will generally degrade the fuel-efficiency of gasoline vehicles. Consequently, vehicle owners will have an economic incentive to disable the catalyst, absent adequate monitoring and controlling facilities. In addition, for lean-NOx catalytic devices, higher levels of sulphur in the fuel can induce more frequent regeneration, further degrading fuel-economy (and increasing CO2 emissions).2
For diesel vehicles, a number of exhaust aftertreatment techniques have been developed, but their effectiveness is less straightforward than those developed for gasoline vehicles, because of the inherently lean conditions of compression-ignition and the relatively higher prevalence of sulphur in diesel fuel than in gasoline. Two-way catalysts are being used with increasing frequency in light and heavy-duty vehicles, but deployment is limited by sulphur quantities in fuel. These catalysts do oxidize hydrocarbons, including the SOF portion of particulate mass. However, these SOF reductions may be offset by increased sulphate emissions caused by catalyst oxidation of SO2 to SO3 (Weaver and Chan 1999). In addition, some research has suggested that oxidation catalysts may limit SOF mass, but not the number of SOF particles emitted, suggesting that oxidation of hydrocarbons in diesel aftertreatment may merely reduce the size of emitted particles (Bagley and others 1996). The aggregate effects on human health of such a treatment are poorly understood at present.
Particle traps have been increasingly and more effectively used in diesel vehicle applications, but it is difficult to regenerate filters once they have become saturated with particulates. Various solutions exist, mostly involving oxidizing the soot particles, but, as with oxidation catalysts, the effectiveness of the process may be compromised by the presence of
1 Two-way (oxidation) catalysts are no longer cost-effective compared with three-way catalysts for use in four-stroke gasoline engines under stoichiometric conditions. Three-way catalysts are only about US$ 50 to US$ 75 more than two-way, and few metropolitan areas with excessive ozone can afford to forgo the NOx controls. However, two-way catalysts have been, and continue to be, used with moderate success in two-stroke applications (where NMHC and CO emissions overwhelm NOx output). Three-way catalysts cannot be used with gasoline engines calibrated for lean-burn, but new “lean-NOx” catalyst technology developed for NOx control of diesel engines might be used for lean-burn gasoline applications.
2 This fuel-economy degradation is the driving force behind current efforts in the United States and the EU to reduce sulphur content to 10 particles per million (ppm), even though lean-NOx technologies will still be operable at up to 50 parts per million (ppm) (CONCAWE [European oil industry organization for environment, health and safety] 2000).
Comment [RG9]: This: Weaver, Christopher S. and Lit -Mian Chan (1999). Economic Analysis of Diesel Aftertreatment System Changes Made Possible By Reduction Of Diesel Fuel Sulfur Content. Report to Environmental Protection Agency, 1999

97
sulphur in the fuels, and the benefit offset by increasing emissions of sulphates. In addition, sulphuric acid vapour may escape the filter, only to condense later to form sulphate particulate. Some advanced solutions, such as continuously regenerating filters, are not even feasible at present sulphur levels, even in developed countries (Weaver and Chan 1999).
Three-way catalysts cannot be used in diesel vehicles because, as for lean-burn gasoline vehicles, oxygen in the air/fuel mixture reduces the effectiveness of the reductant. A number of de-NOx catalytic technologies have emerged recently, however, to address NOx emissions. Lean-NOx catalysts use hydrocarbons as a reductant; since these are not available in sufficient quantities for diesel engines, it is expected that these catalysts, still under development, will involve the injection of fuel into the exhaust stream, degrading fuel efficiency somewhat and increasing hydrocarbon emissions. NOx traps convert NOx emissions into barium nitrate, which is periodically catalysed under rich conditions to release the nitrogen as N2. This would require use of a diesel burner system distinct from the (normally lean) engine, entailing significant technical and economic costs. The catalyst for the conversion of barium nitrate would also be sensitive to the presence of sulphur in the fuel. Like particulate aftertreatment technologies, both of these de-NOx techniques are highly sensitive to the amount of sulphur in the fuel. They require sulphur content under 50 particles per million (ppm), the purpose of a late Clinton administration rule on diesel fuel, and one tenth the current United States standard for sulphur (Weaver and Chan 1999).
A third de-NOx catalytic technique, selective catalytic reduction, involves the injection of ammonia or ammonia-related compounds into the exhaust. Depending on the particular catalyst used, use of very low sulphur fuels may not be required. Low sulphur fuels, however, may allow certain catalytic materials to be used which also oxidize particulates and hydrocarbons, enhancing the effectiveness of the entire system (Weaver and Chan 1999).
Many of the exhaust aftertreatment technologies reviewed here are still under development, and many of those that are available are too cost-prohibitive for immediate implementation in many developing countries. Nevertheless, they must be taken into account in a strategic assessment of possible technologies, because they may become cost-feasible during the working life of an investment made in the near future.
Transmission system
Improvements to transmissions systems are primarily technical measures to improve fuel efficiency of vehicles and reduce CO2 emissions, but they can also help to reduce VOC, CO and PM emissions somewhat, by helping to reduce engine loads in actual drive cycles, and also through reduction in fuel consumption, with which these pollutants are correlated. Advanced techniques include optimized transmission control, for both manual and automatic transmissions, five-speed automatic or other increases in gearing, and continuously variable transmission (CVT). Most of these are state-of-the-art technologies that may not work their way into general use in developing countries for some time. A more viable short-term “transmission” approach to improving fuel economy in developing countries may simply be better education for drivers about how to use their existing transmissions more efficiently (for example, by upshifting earlier).
Fuel supply/crankcase treatment

98
A number of other system-wide improvements to vehicles can affect evaporative hydrocarbon emissions. On-board vapour recovery systems involve specific improvements to the fuel tank, pipework and connectors. Treatment of crankcase sealers can also help with evaporative emissions. For developing countries with a source of vehicle supply primarily from second-hand European or North American markets, however, the ability to undertake aftermarket retrofits or treatments that address evaporative emissions is limited. Because of climate considerations in many developing countries, evaporative hydrocarbon emissions may be a significantly greater problem than in the countries where the vehicles originated. Consequently, changes to fuel specifications, introduction of vapour recovery systems in refuelling stations, and shaded parking areas may be even more important in cities in developing countries than they are in cities in developed countries with significant ozone problems.

99
Annex IV
ALTERNATIVE VEHICLE TECHNOLOGY Alternative vehicle (fuels and propulsion) strategi es generally involve the use of
alternative combustible by -products of petroleum extraction and refining (such as LPG or CNG), alcohol-based fuels, electric propulsion (either fully dedicated or as a hybrid with another fuel), or synthetically produced fuel from various types of feedstocks. The potential for these fuels and propulsion systems to reduce emissions relative to conventional fuels, however, is dependent on much more than mere technical relationships of observed tailpipe emissions rates with current patterns of travel. Different alternative vehicles are likely to be used differently, depending on fuel prices and performance characteristics of the vehicle. In addition, not all alternative fuels are equally effective at reducing all regulated and greenhouse pollutants; some may decrease emissions of some pollutants, while increasing others. Some, such as alcohol-based fuels, may exacerbate emissions of unregulated pollutants like aldehydes. Consequently, the potential of alternative vehicles to contribute to an environmental objective depends on local circumstances, and must be analysed in context. The present annex reviews some of the most important factors that need to be taken into account in a contextual assessment of alternative fuels, and then surveys some of the most commonly discussed alternative vehicle strategies.
Factors affecting appropriateness of an alternative vehicle strategy
Objective of alternative vehicle strategy. Alternative vehicle strategies can have multiple objectives, but the extent to which emissions reductions can be expected will probably be linked to the importance attached to emissions reduction as an objective. Other objectives might be to reduce dependency on foreign petroleum, utilize a particular national resource (for example, natural gas reserves or surplus corn production), or incubate a particular industry. Each of these objectives may be legitimate, and each will have its constituents in an advocacy role. The important part of policy formulation is to understand the emissions implications of a particular strategy independently of any other objectives of such a programme. Advocates of alternative vehicle strategies whose primary motivation is one of these other objectives may be inclined to overstate the emissions reduction potential of a particular alternative vehicle strategy.
Availability and reliability of feedstock sources. Fuels that are loaded into the fuel tanks of alternative fuel vehicles can have their ultimate origin from any number of primary feedstocks, and be derived from them through a multiplicity of means, as figure A.X below shows. Each of these pathways represents a different set of costs of production of the ultimate fuel, and the initial input costs of the primary fuel stock constitute a significant part of these costs. Unlike petroleum, many of these alternative feedstocks (particularly corn, biomass, sugar, and soybeans) compete not only in energy markets, but also on other world markets, such as food or pharmaceutical feedstocks. In some cases, these markets could create long-term volatility in prices that might make some investors reluctant to put resources into development of the needed technology or infrastructure. In others, even short-term volatility in prices might destabilize an alternative fuels programme, if it entails large-scale shortages of fuel supply.3
3 In this regard, the Proalcohol programme in Brazil was brought down by volatility in world sugar prices.

100
Consequently, a successful alternative-fuel strategy needs to look not only at the emissions reduction potential of the use of a particular fuel, but also the likelihood that such a fuel would be produced and made available in significant amounts as to not constrain the penetration of the vehicle fleet using the fuel, and allow for enough of a penetration to make an impact on overall emissions levels.
Figure A.IX. GHG emissions of various fuels
from different points of the energy cycle
0
100
200
300
400
500
600
Gasoline CNG LPG Methanol Diesel Ethanol Electric Hydrogen Fuel Cell
Gra
ms/
mile
of C
O2
equi
vale
nt
Vehicles FC Upstream V. Operation
Source : Argonne National Laboratory, Transportation Fuel -cycle Model, ANL/ESD-39, vols. 1 and 2 (Argonne [Illinois], 1999).
Figure A.X. Alternative production pathways for various fuels
Source : M.Q. Wang, Development and Use of GREET (Greenhouse Gas, Regulated Emissions, and Energy
Use in Transportation) 1.6 Fuel-cycle Model for Transportation Fuels and Vehicle Technologies, Working Paper ANL/ESD/TM-163 of the Center for Transportation Research (Argonne [Illinois], Argonne National Laboratory, 2001).

101
The long-run potential for alternative vehicle penetration. Widespread alternative fuel or propulsion system use in developing countries will depend on the ability of the vehicles built or altered to use those fuels or propulsion systems to compete with ICE vehicles running on conventional gasoline or diesel fuel, both in terms of price and performance, over the service life of the vehicle. Future costs of both conventional and alternative fuels, the ability of alternative vehicles to perform according to the needs and expectations of consumers, the costs of acquisition and maintenance of alternative vehicles, and the ability of alternative vehicles to hold resale value at vehicle turnover are all important factors in the success of a strategy. The latter is particularly important for acquisition financing. In large urban transport fleets of many countries, new vehicle procurement hinges on the ability of the transit company to resell the vehicles to smaller markets part -way through the useful life of the bus. Alternative fuel vehicles may not be as competitive as conventional (diesel) buses in these markets, because of the absence of refuelling infrastructure in smaller-sized cities.
Perfect or imperfect substitution of alternative vehicles for conventional ones. An
underlying assumption of many alternative vehicle strategies is that a kilometre driven by an alternative vehicle replaces a kilometre that would have been driven by a conventional vehicle. How different vehicle owners and operators actually use their vehicles may frame the choice set of alternative vehicles. For example, urban niche vehicles may be more adaptable to certain limited-range technologies (such as battery-electric or CNG) than vehicles used for longer distances. Long-range choices for technological development (for example, on-board or off-board reformulation for hydrogen production in fuel cells) may be similarly influenced. Perhaps more important than how vehicle owners actually use their vehicles, however, may be how they think they will use them. In developed countries, for example, particularly in the United States, there is evidence that a mismatch exists between car buying and car usage behaviour; consumers purchase cars using criteria for the occasional, long-distance trip, even though, for the United States and at least six European countries, 90 per cent of all car trips are under 30 kilometres (Schipper and others 1995). However irrational the expectations of consumers in developed countries, these expectations drive the product development strategies of the major car companies, including their alternative vehicle product development approaches. Car-purchasing criteria, as well as expected vehicle usage patterns, in developing countries may be quite different from those in developed countries, and these differences need to be taken into account in defining particular alternative vehicle approaches to specific countries.
Speed and nature of technology adoption. The speed with which alternative vehicles replace conventional ones, or conventional vehicles are converted to alternative fuel use is another important consideration. As with conventional vehicles, this is affected not only by the speed with which vehicles are converted or purchased, but also by the rate at which old vehicles are retired from the fleet, which affects aggregate demand. For this reason, demonstration projects of alternative vehicle technology in developing countries may be of little consequence in terms of overall emissions.
Supply-side constraints can also significantly affect the speed of technology adoption; the lag time between development of a roadworthy prototype and economically competitive assembly-line productive capability can be five years or more (Sperling 1995). The length of the product cycle needs to be taken into account in the adoption of standards or other specific measures designed to encourage alternative vehicle use.

102
How alternative or new technology is incorporated into the vehicle fleet is another important consideration. Retrofits of existing vehicles may not maximize the potential of a given technology. For example, newly built engines using CNG can take full advantage of the fuel's properties by using high compression ratios and lean-burn stoichiometry; retrofits generally cannot take full advantage of the fuel’s property in the same way, resulting in significantly less energy and emissions advantage over conventional fuels. CNG retrofits of diesel vehicles, furthermore, must continue to use small amounts of diesel fuel in the air-fuel mixture to ensure combustion, resulting in particulate and NOx emissions significantly higher than standard CNG emissions.
Full-fuel (and vehicle) cycle comparisons. Emissions of local and global pollutants occur at the point of combustion, but they can also occur during fuel extraction/production, refinement, transportation, and storage, as well as during vehicle production, disposal and recycling. Any comparison of fuel emissions among fuel and vehicle mixes, therefore, must take this full fuel-cycle into account, particularly for global pollutants. Figure A.IX above shows greenhouse gas emissions per mile from various alternative vehicles, allocated by point of emissions in the energy cycle, as calculated by the Argonne National Laboratory for the United States under a given set of assumptions (Argonne National Laboratory 1999). Under this set of assumptions, (corn) ethanol emits about 76 per cent less greenhouse gases than diesel when only in-use emissions are taken into account. However, if full energy cycle emissions are taken into account, ethanol emits only 9 per cent less GHG than diesel. In addition, where emissions occur might be an important motivation for a particular alternative ve hicle policy, because a ton of non-greenhouse pollutants emitted near population centres may be more costly than the same amount emitted elsewhere. Full fuel-cycle comparisons, therefore, need to not only quantify lifecycle emissions, but also to identify how much are produced where.
Dynamic assessment of competing technologies and scaling of baseline to resources and timeframe. Product cycle is also an important factor strategically because conventional technologies are (or could be) evolving in the meantime. Fuels could be reformulated to include higher oxygen content and lower sulphur content, vehicles can adopt multi-pollutant catalytic technology, direct-injection or more sophisticated air/fuel metering technology, sophisticated engine design, or any number of other innovations. An evaluation of an alternative vehicle strategy, therefore, needs to be made against this baseline of technological innovation. Since public and private resources will be channelled as a result of policy actions taken by local and/or national governments, an assessment should be made of how conventional gasoline and diesel would perform if similar resources were devoted to improving them and the vehicles that use them. This assessment needs to be evaluated in the context of the market penetration of alternative vehicles reviewed above. Relatively modest gains in emissions characteristics of conventional vehicles may in the long run be more cost-effective than dramatic improvements by alternative-fuelled vehicles, if the rate of market penetration of the latter is slow or if the ultimate penetration level is likely to be limited. Similarly, alternative fuel and propulsion technologies are developing at different paces, and require different amounts of up-front investment—in storage facilities, fuel handling and reformation facilities, distribution networks and refilling stations. Extensive investments in one technology may preclude or hinder the development of another.
Appropriate role for the public sector. In an ideal context, competition between technologies should be natural and healthy. The extent to which the public sector is insulated from potential losses resulting from technology competition, however, depends on how wisely

103
alternative fuel strategies are devised and carried out. Experience worldwide in the transport, as well as other sectors, such as telecommunications, suggests that governments and large monopolies are ill-equipped to select from among competing technologies; a wise alternative-fuel strategy, therefore, may be for the government not to have one, but rather simply to send clear signals to the market about the kinds of emissions performance to be expected. To be sure, public actors can be highly influential in the adoption of one technology over another, but at the risk of rendering the sector or domestic industry uncompetitive in the international marketplace—thereby raising overall costs—if it guesses wrong. The approach in California, and more recently, at the Federal level in the United States with respect to cars and light trucks, has been to establish performance expectations—albeit with a clear sense of what is technically possible with different technologies —and let the private sector figure out how to meet those expectations, with whatever combination of vehicles and fuels that manufacturers believe is the most competitive.
Survey of alternative vehicle technology
While the best option for policy makers may be to favour no technology in particular, understanding the feasible near- and long-term options is crucial. Near-term alternative vehicle technologies include CNG (in certain applications), LPG, hybrid-electric and, in some countries, ethanol and methanol. Longer-term options include CNG in more general applications, battery and fuel-cell electric vehicles, and various synthetic diesel and diesel-substitute fuels. These technologies are reviewed below. In the very long term, solar-powered—or, more likely, fuel-cell—vehicles fuelled by hydrogen electrolysed by solar energy, are also envisioned. This section makes reference to the output from Argonne National Laboratory’s GREET (Greenhouse Gas, Regulated Emissions, and Energy Use in Transportation) model to indicate the orders of magnitude of the expected reductions. These results are based on Wang’s assumptions in the GREET model (Argonne National Laboratory 1999) and should not be taken as indicative of any inherent emissions reduction potential of the fuels themselves. As noted above, many local, context -based factors need to be taken into account in assessing the reduction potential of a particular fuel applied in a particular context with particular technology.4
CNG
Natural gas can be compressed or liquefied for use in transport applications, but compression has proved to be the better method in terms of practicality and performance. CNG engines, when factory-built, generally have good performance characteristics, with energy efficiencies comparable to diesel engines, and low emissions of NMHCs, NOx, and PM10 compared with both gasoline and diesel. Emissions characteristics for retrofits, however, are not as good in terms of performance, for a number of reasons that are examined below.
Three variants of natural gas (NG) engines have been developed: spark-ignition stoichiometric, spark-ignition lean-burn, and compression-ignition. Spark-ignition stoichiometric 4 The GREET assessment reports indicate emissions rates in terms of relative reduction from a BAU technology–standard, spark-ignition car running on conventional gasoline, or a standard compression-ignition truck running on conventional diesel fuel. Pollutants evaluated include local pollutants (VOCs, CO, NOx, SOx, PM10), and global pollutants (CH4 [methane], N2O, CO2, and total GHGs–using IPCC weights). For the local pollutants, emissions are reported as both lifecycle and tailpipe (urban) differentials in per kilometre emissions rates. In addition, it should be noted that the GREET model provides heuristic relationships between fuel and vehicle combinations based on observed baselines of vehicle use. Consequently, it is not an economic assessment of the “best” (most cost -effective) alternative vehicle strategies.

104
engines are the easiest to convert from existing gasoline engines. Because CNG has excellent anti-knocking characteristics, factory-built spark-ignition CNG engines tolerate a much higher compression ratio than equivalent gasoline engines, and are consequently more fuel-efficient. Most retrofits, however, cannot economically effect an increase in compression ratio; in practice, therefore, retrofitting of gasoline vehicles to CNG may result in no efficiency improvement whatsoever, or even a loss. Consequently, different CNG strategies have different implications for CO2 emissions.
Lean-burn CNG engines with high compression ratios, turbocharging and aftercooling produce performance and efficiency characteristics similar to diesel in heavy-duty applications, but with significantly reduced particulate emissions. A number of problems, however, limit the attractiveness and viability of lean-burn CNG applications, in developed as well as developing countries. If poorly calibrated, lean-burn engines can emit significant amounts of unburned fuel—largely methane—a greenhouse gas significantly more potent than CO2. In addition, lean-burn calibration for CNG, as with gasoline, requires sophisticated anti-NOx technology, such as de-NOx or selective catalytic reduction to limit NOx emissions. These technologies are not widely available even in the developed world, and are unlikely to be widely available in developing countries in the near future, limiting the potential of lean-burn CNG applications in these locations for the foreseeable future.
Finally, compression-ignition CNG engines are primarily used for dual fuel applications, where availability of CNG is uncertain, or in retrofits of existing diesel vehicles. Instead of a spark, the gas/air mixture is ignited by a small amount of injected diesel, which combusts from pressure. Because of the rapid burn-rate of diesel fuel, there is some concern that a significant portion of the NG in the mixture may remain uncombusted at the end of the cycle, potentially resulting in methane emissions.
As a nearly sulphur-free, spark-ignited fuel, CNG in fully dedicated heavy-duty applications produces significantly lower PM1 0 emissions than diesel. A number of uncertainties, however, call into question what had generally been perceived as the clear advantages of CNG over gasoline and diesel. Some evidence suggests, for example, that the number of SOF particles below 1 micron produced by CNG combustion is similar to that of diesel and gasoline; as epidemiological research concentrates on the health impact of these fine particles, it may turn out that the PM advantage of CNG may be somewhat less than is currently believed. In addition, the use of natural gas in the transport system has also raised concern about methane emissions, a greenhouse gas between 25 and 50 times as potent as carbon dioxide, depending on the period of evaluation. Emissions from individual, well-maintained vehicles have been well documented (Wang 2001; International Energy Agency 1999), but the unknown factors are leakage in the storage, distribution, and refuelling system, and emissions from poor maintenance or calibration. Finally, the process of compressing natural gas may also be associated with NOx emissions in certain circumstances (Wang 2001).
The success of a CNG strategy naturally depends on access to a reliable, inexpensive supply of natural gas. This inexpensive access implies either proximity to a natural gas source, or the existence of an extensive (pipeline) distribution network. Application of natural gas to a CNG programme alone would probably not economically justify the development of such a network, so, for practical purposes, CNG is only realistic where other (non-transport) uses of natural gas is

105
or will be demanded. Even then, the opportunity cost of using natural gas in the transport sector, rather than in other sectors or as an export commodity, needs to be fully evaluated.
CNG has been recommended as a strategy and is being implemented in a wide range of contexts; in the early stages, however, it is most applicable in urban contexts where access to CNG refuelling stations is not constrained by distance. Egypt has aggressively pursued a policy of CNG for the Greater Cairo region, targeting first taxicabs, and then micro-buses. The vehicle conversions are provided by the private sector –natural gas distributors–who are licensed by the government (currently, there are two licensees) on certain conditions, not least of which is that they maintain a strict limit on the number of vehicles they convert relative to the amount of refuelling capacity distributed around the city. Thus, a natural profit motive increases the pace of conversion, and limits the need for public resources. This strategy has been particularly well-suited to Cairo, since a relatively large supply of nearby gas–at the Red Sea–would otherwise be flared.
GREET assessment. In both the near and the long term, CNG shows good across-the-board reductions in all assessed pollutants, with the notable exceptions of NOx and methane (CH4), as shown in table A.4. NOx emissions from CNG might be significantly higher than those of gasoline cars, because of NOx production during natural gas compression. Because such an assessment is based on the expectation of relatively low NOx emissions levels from the United States gasoline fleet in the future, it is possible that the NOx performance of CNG in other countries would be substantially better.
Table A.4. GREET assessment of reduction in emissions from CNG relative
to conventional gasoline ICE automobiles (range of percentages)
VOC C O NO x SOx PM1 0 C O2 CH4 N2O GHGs Short term 49-71 43-35
19-27 increase 37-40 36-38 14-17
205-211 increase 19-38 8-11
Long term 56-63 2-18
26-68 increase 34-77 3-34 27
84 increase 48 24
LPG
LPG has similar combustion characteristics to CNG, apart from a lower octane rating. In combustion, it produces significantly lower emissions of local pollutants than gasoline and diesel vehicles. Like CNG, LPG engines can be built stoichiometric or lean-burn, but because of its high-knocking characteristics, LPG cannot be used in high-compression ratio spark engines (so the potential for energy efficiency gains is minimized). As a result, emissions of greenhouse gases, therefore, are only slightly lower than gasoline, and not as low as diesel. As with CNG, retrofits with LPG are more likely to be stoichiometric than lean-burn, so the HC and CO emissions of retrofits tend to be somewhat higher than for factory-built models. LPG is modestly compressed for use as a liquid in transport applications and, like all other transport fuels, is consequently, sold and metered by weight rather than volume. Handling LPG is significantly easier and cheaper than CNG.
LPG consists predominantly of propane and butane, mostly produced during petroleum distillation, as the lightest petroleum product. Consequently, it is a low -sulphur fuel with low

106
particulate emissions. LPG can also be distilled from natural gas containing high amounts of ethane. Because of supply constraints associated with these two sources, widespread transport-sector adoption of LPG in the long run–that is, significant enough to displace gasoline sales–is generally not feasible. Recently, however, supplies of LPG have exceeded demand in petroleum-refining countries, suggesting room for growth in LPG use (OECD/UNEP 1999). It is well suited in urban areas for niche applications, such as taxis, urban delivery vehicles, or paratransit. Italy, the Netherlands and Japan have significant experience with such applications. Until very recent model years in the United States and Europe, no manufacturer has produced LPG vehicles on a commercial basis; consequently, almost all LPG vehicles on the road are retrofits. It should be noted that many countries are reluctant to introduce LPG into the transport sector, for fear that it would destabilize the supply of propane and butane to the household sectors. Propane and butane are subsidized in many developing countries as a cooking and heating fuel, in order to assist the poor; introducing LPG vehicles might deplete the source of this fuel for the very groups the subsidy is intended to benefit.
GREET assessment. For most pollutants, emissions characteristics for LPG are roughly in the same range as those for CNG, as shown in table A.5, except that NOx and CH4 emissions are significantly lower. In the short run, methane emissions for LPG may increase slightly if LPG is reformed from natural gas, rather than being distilled from petroleum.
Table A.5. GREET assessment of reduction in emissions from LPG relative to conventional gasoline ICE automobiles
(range of percentages) VOC CO NOx SOx PM10 CO2 CH4 N2O GHGs
Short term 58-64 40 18-22 57-77 34-43 13-14
6 decrease
3 increase 2 12-14
Long term 49-56 21 32-40 72-91 31-39 21-23 22-29 2-3 21-22 Alcohol-based fuels
Vehicles can be built or altered to run on alcohol -based fuels, namely ethanol or methanol, although in practice these remain limited to light-duty applications. Alcohol fuels have poor starting characteristics in cold weather–not a problem in Brazil, where their use is most widespread, but in colder climates, they must be mixed with up to 15 per cent gasoline. Vehicles developed to run on these fuels are generally “flexible fuel vehicles” (FFV), since they can run on any mix of alcohol/gasoline, from 0 to 85 per cent. Production of a (methanol) FFV has been estimated to add an increment of US$ 300-US$ 400 to the cost of mass production per vehicle in the United States, while the conversion of an existing vehicle to an ethanol FFV costs about US$ 500 (Faiz and others 1996).
Ethanol is produced from fermentation of grains or sugar, and is consequently attractive to countries with surplus stocks of one or both of these resources. Costs of production can be high, however, particularly when competition for stock use is high, as it was in Brazil in the early 1990s. Countries that have maintained ethanol production programmes–notably Brazil and the United States–have needed to do so with substantial subsidies to production at predominant world

107
oil prices. Methanol is produced from natural gas in a controlled oxidation process. It can also be produced from any number of other feedstocks, including crude oil, biomass or coal, but it is most economically produced from natural gas in remote sources with no natural markets (Faiz and others 1996). Because of the differing feedstock sources, methanol strategies have been pursued as a response to regulatory pressure to reduce emissions, while ethanol strategies have been favoured in order to reduce dependence on foreign oil.
The most extensive experience to date with alcohol fuels–indeed, with any alternative fuel–is the Proalcohol programme in Brazil, which was in effect from 1975 until the end of 1998. Under this programme, farmers received a premium for producing sugar, and private ethanol distillers received fixed prices and guarantees of purchases from Petrobras, the national petroleum company. Roughly two thirds of the cane produced in Brazil was used for production of ethanol, first as an additive to gasohol mixtures and then, beginning in the early 1980s, for use in 100 per cent ethanol vehicles. At the height of the programme, 95 per cent of all new light-duty vehicles in Brazil were ethanol vehicles. The large subsidy needed to maintain the programme, however, as well as the pressure to guarantee adequate supply of the fuel, came to be an increasing burden on the financially strapped Brazilian Government. In 1990, the government relaxed the 95 per cent requirement and, several years later, began limiting the subsidy to producers in the northern and north-eastern parts of the country, and shifted ethanol use back towards gasohol blends to provide budget relief. The resulting large stocks of ethanol occurred at a time of rising world prices for refined sugar, and the devaluation of the Brazilian real in early 1999. As a result, sugar producers began selling their sugar on the raw sugar market in large numbers. The outcome of all of these changes has been sharp spot shortages of 100 per cent ethanol in many regions, and an overall loss of credibility for the programme.
In the United States, too, alcohol fuels are no longer as viable as previously believed. Major manufacturers—which in the early 1990s were actively researching, producing and marketing methanol FFVs for the California market in response to low-emission vehicle sales mandates there—are now pursuing other strategies; current model year productions do not include any methanol vehicles. 5 However, a number of manufacturers are actively engaging in R and D on methanol as a fuel for on-board reformulation of hydrogen for use in fuel cells. Whether or not current high petroleum prices will create new niche markets for alcohol, particularly ethanol, remains to be seen.
GREET assessment. More than any other alternative fuel, the overall emissions performance of alcohol-based fuels depends crucially on the feedstock and the fuel path, as shown in table A.6. For example, the emissions characteristics of ethanol can vary substantially depending on whether it is produced from corn, herbaceous biomass, woody biomass or sugar cane. In general, methanol’s local emissions characteristics are better than those of ethanol, and are comparable with reductions expected from CNG and LPG (indeed, better for NOx), particularly when land-fill gases are used in the production of methanol. Ethanol and land-fill methanol also reduce methane and carbon dioxide emissions substantially.
5 California’s emission mandates allow individual companies to decide how best to meet the proportional fleet sale requirements. Presumably, the manufacturers have decided that methanol is not an economically productive way to meet those requirements.
Comment [RG10]: http://151.121.66.126/briefing/Brazil/sugaralcohol.htm
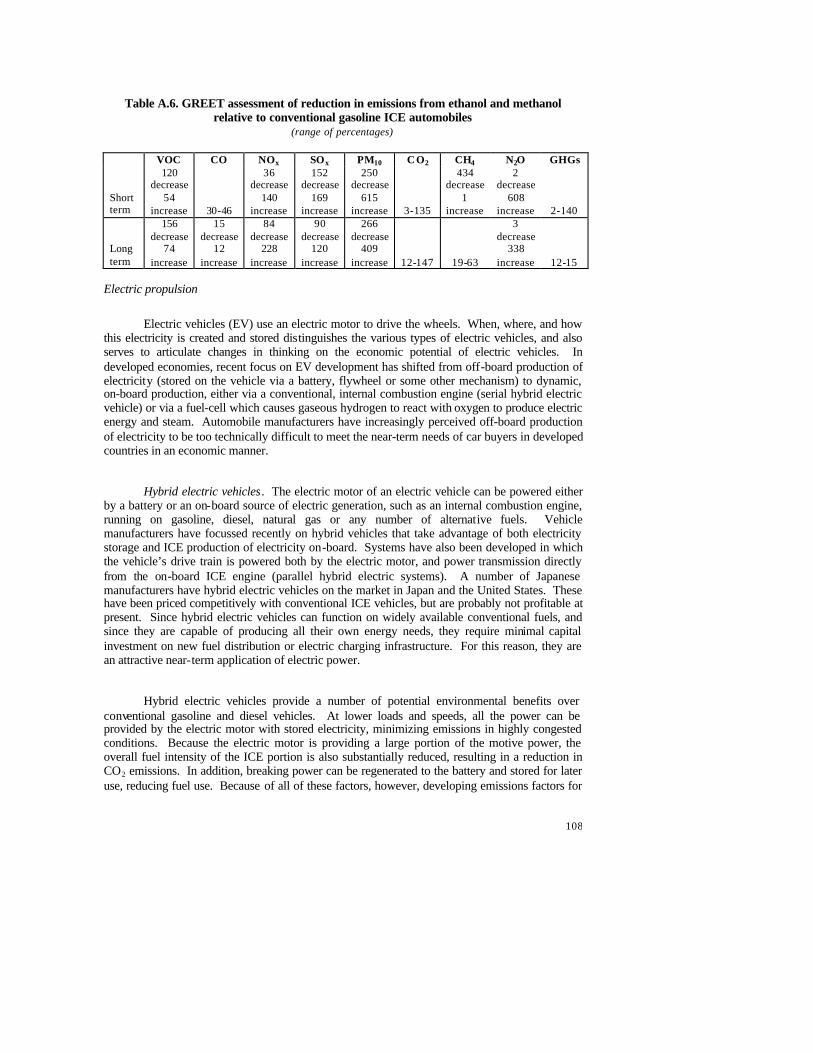
108
Table A.6. GREET assessment of reduction in emissions from ethanol and methanol
relative to conventional gasoline ICE automobiles (range of percentages)
VOC CO NOx SOx PM10 C O2 CH4 N2O GHGs
Short term
120 decrease
54 increase 30-46
36 decrease
140 increase
152 decrease
169 increase
250 decrease
615 increase 3-135
434 decrease
1 increase
2 decrease
608 increase 2-140
Long term
156 decrease
74 increase
15 decrease
12 increase
84 decrease
228 increase
90 decrease
120 increase
266 decrease
409 increase 12-147 19-63
3 decrease
338 increase 12-15
Electric propulsion
Electric vehicles (EV) use an electric motor to drive the wheels. When, where, and how this electricity is created and stored distinguishes the various types of electric vehicles, and also serves to articulate changes in thinking on the economic potential of electric vehicles. In developed economies, recent focus on EV development has shifted from off-board production of electricity (stored on the vehicle via a battery, flywheel or some other mechanism) to dynamic, on-board production, either via a conventional, internal combustion engine (serial hybrid electric vehicle) or via a fuel-cell which causes gaseous hydrogen to react with oxygen to produce electric energy and steam. Automobile manufacturers have increasingly perceived off-board production of electricity to be too technically difficult to meet the near-term needs of car buyers in developed countries in an economic manner.
Hybrid electric vehicles. The electric motor of an electric vehicle can be powered either by a battery or an on-board source of electric generation, such as an internal combustion engine, running on gasoline, diesel, natural gas or any number of alternative fuels. Vehicle manufacturers have focussed recently on hybrid vehicles that take advantage of both electricity storage and ICE production of electricity on-board. Systems have also been developed in which the vehicle’s drive train is powered both by the electric motor, and power transmission directly from the on-board ICE engine (parallel hybrid electric systems). A number of Japanese manufacturers have hybrid electric vehicles on the market in Japan and the United States. These have been priced competitively with conventional ICE vehicles, but are probably not profitable at present. Since hybrid electric vehicles can function on widely available conventional fuels, and since they are capable of producing all their own energy needs, they require minimal capital investment on new fuel distribution or electric charging infrastructure. For this reason, they are an attractive near-term application of electric power.
Hybrid electric vehicles provide a number of potential environmental benefits over conventional gasoline and diesel vehicles. At lower loads and speeds, all the power can be provided by the electric motor with stored electricity, minimizing emissions in highly congested conditions. Because the electric motor is providing a large portion of the motive power, the overall fuel intensity of the ICE portion is also substantially reduced, resulting in a reduction in CO2 emissions. In addition, breaking power can be regenerated to the battery and stored for later use, reducing fuel use. Because of all of these factors, however, developing emissions factors for

109
hybrid vehicles is particularly tricky, since such factors are strongly dependent on local driving conditions and how the vehicles are put to use.
As market penetration of hybrid electric technology in developed countries is still unclear, even at industry-subsidized prices, applicability of hybrid electric technology to developing country contexts is probably some years off. Their role in developing countries, however, is important and immediate, in that they can serve as a benchmark technology against which to evaluate other alternative vehicle strategies, particularly those involving significant capital investments. As experience with hybrids in developed countries grows, costs will come down, and the anticipated level of those costs can be a criterion against which the costs of other investments need to be justified.
Fuel cells. Another benchmark technology for policy makers in developing countries is hydrogen fuel cells. Fuel cells combine hydrogen and oxygen dynamically to produce the electricity that powers an electric motor. The three biggest technical challenges to fuel cell development have been the development of an affordable catalytic membrane, the identification of cheap and practicable sources of hydrogen, and the development of a practicable system to store hydrogen on board. Recent advances in the Proton Exchange Membrane have significantly advanced a solution to the first of these challenges, but the latter two remain daunting. Storing of hydrogen in tanks is challenging, expensive and potentially dangerous. In addition, refuelling of storage tanks is time-consuming (although, with urban fleet vehicles, like delivery trucks or public transport vehicles, this may not be a problem), and storage tanks do not have much storage capacity in terms of energy density. Hydrogen-absorbing materials have recently emerged as a potentially more effective and economic means of storing hydrogen, but these are still under development.
Car manufacturers actively pursuing fuel cell vehicles are most actively looking into some kind of on-board reformulation of liquid fuel into hydrogen as an interim solution to the problem of both hydrogen source and storage. Under these systems, hydrogen would not be stored; rather it would be produced as needed from a hydrocarbon fuel such as gasoline or methanol. Daimler/Chrysler and Ford are both working to develop low-cost fuel reformers that can extract hydrogen from conventional fuels. Because of the high energy density of extracted hydrogen, and because these reformers will operate using recycled heat from the fuel-cell itself, it is anticipated that fossil-fuel-based fuel-cell vehicles would be significantly less energy -intensive than ICE vehicles running on an equivalent fuel.
The focus on on-board reformulation techniques is arguably a response of the industry to one of its prime potential markets: North American consumers. However, prototypes for urban fleet vehicles, using compressed hydrogen in storage tanks on the roof, will be put into urban service in the near future in several cities around the Americas, including Chicago, Vancouver, Oakland and São Paulo. In many cases, however, the source of the hydrogen is still unclear (Peeples 2000). Ballard/Daimler have developed a fuel cell bus based on a standard diesel chassis at about six times the cost of a conventional diesel bus, but sources in the industry estimate that production costs of this vehicle in the near term would be about two and a half times the cost of a conventional diesel bus6 (Peeples 2000).
6 In comparison, a CNG bus based on the same standard diesel chassis was estimated to be about one and a half times the cost of a diesel bus.
Comment [RG11]: This is: Chris Peeples, personal communication

110
The specific emissions benefit of fuel cell vehicles depends both on the primary fuel used, and where the fuel is reformed. In principle, a fuel cell using stored hydrogen produced during electrolysis from solar, wind or hydropower would produce no in-use emissions, and virtually no fuel-cycle emissions, depending on location of hydrogen production and means of transport. Other sources of hydrogen, however, would produce both local and global emissions, although potentially minimizing human exposure, and at lower rates per vehicle kilometre.
Battery-electric cars. The future of battery-electric vehicles is uncertain at present. Although more than 25 years of research have been carried out since the energy crisis of the early 1970s initiated a flurry of interest in electric vehicles, no economically significant breakthroughs on battery storage capacity and size reduction have been made, except, perhaps, the realization that other means of delivering energy to an electric motor on a vehicle may be more viable–hence the interest in hybrid and fuel-cell technology. Even if significant long-range capacity is developed for batteries, it is unclear whether they can be made small and lightweight enough to compete, given the anticipated sizes of fuel cells for in-vehicle use.
Electric two- and three-wheelers. One potential niche for battery-electric technology is in two- and three-wheeler applications in countries where these modes are particularly important, for example, in South and East Asia. A recent assessment found the annualized cost of electric three-wheelers in Dhaka to be about 12 per cent more than that of traditional three-wheelers. The unit costs of reduction of particulates were actually found to be higher than other, more incremental measures on existing vehicles and technology. The primary advantage of electric two- and three-wheelers in these applications, therefore, is a displacement in the source of particulate emissions from dense, centre city environments, to more remote areas where coal-based power plants generate electricity. It is unclear, however, whether electric two- and three-wheelers are cost-effective relative to other technologies such as CNG or four-stroke ICE engines. A more promising application of electric technology, therefore, may be the battery -assisted bicycle. This uses a low -level electric generator to assist an otherwise human-powered vehicle. The primary niche advantage of such technology would be to provide a low-cost alternative to motorization for bicycle users who need more power to carry heavier loads, go farther distances, or climb hills.
GREET assessment. The potential for electric vehicles to reduce transport emissions depends on a number of complex factors: whether the vehicle is a hybrid, and whether the hybrid is of serial or parallel construction; what the ultimate energy source for the electricity is, whether fuel cell, grid-connected hybrid, or grid-independent hybrid; and what the energy source for the non-electrical components of the vehicle is, if there are any. Table A.7 shows the short-term and long-term changes that can be expected in automobile applications of various electric propulsion technologies in the United States. For countries still using a significant amount of coal or petroleum in electricity production, emissions of SO x, PM10, and perhaps NOx might be significantly worse than other alternative fuel choices.
Table A.7. GREET assessment of reduction in emissions from electric propulsion cars relative to conventional gasoline ICE automobiles
(range of percentages)
VOC C O NOx SOx PM10 CO2 C H4 N 2O GHGs

111
Short term 34-95 36-99
51 decrease
65 increase
63 decrease
463 increase
32 decrease
148 increase 24-71 15-58 2-93 25-70
Long term
155 decrease
47 increase
99 decrease
22 increase
70-83 (99 if pure
methanol)
102 decrease
377 increase
171 decrease
350 increase
46-113
177 decrease
33 increase
99 decrease
206 increase 45-136
Synthetic fuels
A number of synthetic fuels with potential application in compression-ignition engines have been shown to have significant emissions performance advantages over conventional diesel, while maintaining the performance and efficiency characteristics associated with diesel. These include various bio-diesels, Fischer-Tröpsch (FT) diesel, and di-methyl ether (DME). They are most commonly considered for heavy-duty applications, but they might also have potential light-duty applications. They can be produced from various feedstocks, contain virtually no sulphur, and have high cetane numbers. Consequently, they emit substantially lower particulate emissions than conventional diesel without loss of performance or increase in greenhouse gas emissions. In addition, many of these synthetic fuels are usable directly in existing diesel engines, reducing the need for significant up-front investment, and producing a more immediate impact on the environment.
Bio-diesel can be produced from a range of vegetable oils, including canola, sunflow er, sesame, peanut, rapeseed and other oils. Handling problems prevent these oils from being used directly for combustion in engines, but reacting them with methanol or ethanol produces a fuel with diesel-like qualities. The potential availability of feedstocks can be an attraction for small-scale applications but, on larger scales, price, availability and competing resource use might lead to unacceptable levels of volatility for long-term investments. Diesel fuel can also be synthetically produced from natural gas or coal, through a process known as Fischer-Tröpsch. FT diesel is currently prohibitively expensive, but it has the advantage of having handling qualities superior to bio-diesel, more immediate, abundant and consistent feedstocks, and only trace amounts of sulphur. Some energy is lost in the transformation process, however, making life-cycle FT diesel less energy -efficient than direct use of natural gas in other applications.
DME is a synthetic fuel that can also be produced from renewable raw materials or methanol, but is more commonly produced directly from natural gas. Because it is a gas at room temperature, DME would require a modified storage and injection design, and is thus a synthetic “diesel” fuel that could not be used on existing vehicles without modification. It is anticipated that heavy-duty vehicles could be retrofitted for DME much in the way that gasoline vehicles have been retrofitted for LPG, at moderate cost. Nevertheless, like LPG or CNG, widespread DME use would require significant investment in refuelling infrastructure, which is its primary drawback. Fuel advantages of DME include not only lower tailpipe emissions compared with diesel, but also potential for large-scale production at costs competitive with diesel, and with lower life-cycle (production and distribution, as well as use) emissions and intensity than conventional diesel. A number of manufacturers are considering DME as part of a strategy to meet Euro IV standards (the European regulations for new heavy-duty diesel engines), which come into effect in 2004-2005.

112
Table A.8. GREET assessment of reduction in emissions from synthetic fuels relative to
conventional gasoline ICE automobiles (range of percentages)
VOC C O NOx SOx PM10 CO2 C H4 N 2O GHGs Long term 38-193 0-3 23-90 36-48 33-83 50-54 35-47 32-95 33-92

113
Annex V
ADDRESSING THE IN-USE FLEET
The prevalence of old vehicle technology is a significant contributing factor to overall emissions of local and global pollutants, particularly in developing countries. This excessive age is, to some degree, due to the slowness of new vehicles to replace old ones in the fleet, but primarily because old vehicles are held for a long time, for economic reasons. Consequently, new, relatively low -emission, high-efficiency cars do not replace high-emission, old ones, but rather supplement them. The prevalence of old cars and technology has two particular effects that lead to high emissions: (a) the deterioration of performance of ageing technology and componentry in in-use vehicles; and (b) the obsolescence of the technology (since more advanced technology is not used.) In the terminology of the ASIF framework (Schipper and others 2000), old technology tends to increase the emissions intensity of vehicles–the grams of pollutant emitted per kilometre driven. These impacts are magnified in locations where, for economic reasons, drivers of old vehicles tend to make more extensive use of their vehicles than drivers of new vehicles, and where old vehicles tend to be concentrated in city centres. Such high mileage and concentrated use of older vehicles is frequently the case with the taxi and informal transport sectors in many cities in developing countries. Emissions of pollutants and poor fuel economy performance are affected by fleet age because of performance deterioration and the continuation of the use of obsolete technology.
Performance deterioration
Emissions characteristics and fuel economy of a vehicle deteriorate with age. As a result, older vehicles tend to contribute a disproportionate amount of transport-sector-originating pollution than newer ones. For example, a study in Bangkok found that vehicles over 10 years old contributed about 70 per cent of all HC and CO emissions, and about 55 per cent of all NOx emissions, even though these vehicles were only driven for 50 per cent of all the vehicle kilometres travelled (OECD 1999).
The causes of age-related emissions performance deterioration are varied. For local pollutants such as VOCs, CO, and NOx, age affects catalytic technology more than the emissions performance of engines. Catalysts can lose efficiency as they age from exposure to high temperatures and gradual poisoning by oil additives; they are also susceptible to malfunction because of poor maintenance and misfuelling, the probability of which increases with age. Effective inspection and maintenance (I and M) programmes, such as those described below, can reduce the rate of this deterioration. In addition, fuel economy generally deteriorates with age as various elements of the fuel and engine system wear out, increasing CO2 emissions.
Figure A.XI, from the EPA MOBILE6 model, shows the deterioration in NMHC emissions factors for tier I light-duty vehicles as they age. MOBILE6 emissions factors, derived from laboratory tests on actual vehicles, show an average deterioration of about 5.5 per cent per 10,000 vehicle miles travelled (VMT) for tier I vehicles with no inspection and maintenance programme, and about 4 per cent per 10,000 VMT with such a programme. For “tier 0” vehicles, that is, older vehicles more similar to fleets in developed countries, the rate of deterioration averages about 3 per cent per 10,000 VMT. Deterioration of NOx is even more marked–7 per cent for I and M tier I vehicles, 8 per cent for non-I and M tier I vehicles, and about 5 per cent for older (tier 0) vehicles (EPA 1999).
Comment [RG12]: Older Gasoline vehicles
Comment [RG13]: This is: Determination of NOx and HC Basic Emission Rates, OBD and I/M Effects for Tier 1 and Later LDVs and LDTs EPA report No. EPA420-P-99-009, 1999. At http://www.epa.gov/otaq/m6 -iud.htm

114

115
Figure A.XI. Deterioration of NMHC emissions factors for tier I light-duty vehicles
0.0 0.1 0.2 0.3 0.4 0.5 0.6 0.7 0.8 0.9 1.0
0.0 2.5 5.0 7.5 10.0 12.5 15.0 17.5 20.0 Mileage/10000
FT
P gr
ams/
mile
No OBD / No IM OBD / No IM OBD / IM Notes : FTP stands for Federal Test Procedure; and OBD stands for on-board diagnostics.
Obsolete technology
In many developing countries, both the vehicle fleets and the technology in use are old
and obsolete from the point of view of air pollutant reduction. In many parts of the world, the prevalence of vehicles with no emission control equipment whatsoever and relatively rudimentary carburetion systems is still common, even among newly registered vehicles in national fleets. The obsolescence of the equipment used is in part simply a function of the age of the cars; in most developing countries, cars are kept in useful life on average longer than in developed countries. In some countries, however, particularly those with a highly protected automobile manufacturing industry, old technology may still be used in the production or assembly of new vehicles. These assembly or manufacturing operations may use “knock downs” of energy -intensive, obsolete models from North American, European, Japanese, or Soviet manufacturers which have long since been abandoned by their manufacturers. In addition, in the absence of adequate regulatory requirements and emissions control monitoring, many manufacturers may simply choose to not use available emissions control technology.
Inspection and maintenance
Inspection and maintenance (I and M) programmes are critical components of a metropolitan air quality control programme where the transportation sector is an important contributor to pollution and catalytic technology of some kind is in widespread use. I and M programmes are in widespread use in North and South America, Europe and Asia, although the specifics can vary significantly between programmes. In general, a mature I and M programme involves periodic (annual or biannual) testing of vehicles at a testing centre, usually using a chassis dynamometer (a device that allows the wheels on the drive axis to rotate) and exhaust analysers of varying sophistication. Vehicles of different sizes and model years are usually held to different standards, but those not passing must be repaired and retested.
116
A critical function of an I and M programme is to ensure that sensitive catalytic technology is maintained in working order. Catalytic converters can deteriorate or fail through negligence–for example, improper fuelling with leaded fuel–or through deliberate tampering, a temptation because catalytic converters can degrade efficiency, power, or both. It should be noted that the precious metals used in many catalytic converters can have significant resale value.
Much of the literature on I and M programmes has focused on the following debate in the United States between the (Federal) Environmental Protection Agency and the (California) Department of Consumer Affairs: whether a “centralized” or “decentralized” structure for an I and M programme is more effective. In a centralized structure, motorists bring their vehicles to relatively few, high-volume test centres, usually run on behalf of the public or regulatory authority by a private contractor. A de-centralized programme involves tests at private garages, which undergo a periodic certification process. A decentralized programme can involve lower start-up costs, greater convenience for the motorist, and reduced risk of carbon monoxide “hot spots” from a large volume of idling cars. However, the disadvantages of a decentralized system are significant. Having the same establishment both carry out the tests and undertake repairs can create an incentive for fraud, which seems to be borne out by empirical evidence (Glazer and others 1993). In addition, decentralized facilities cannot generate the throughput and economies of scale needed to purchase the most sophisticated testing equipment–advanced exhaust analysers and chassis dynamometers. Consequently, decentralized structures generally cannot subject cars to the standardized testing procedures based on those used to certify new car emissions in the first place.
Accelerated retirement (scrappage) incentives
A second strategy often suggested to address emissions from in-use vehicles is voluntary accelerated retirement, or “scrappage” schemes, which target the most polluting vehicles, in an effort to take them out of regular use. The logic of the approach stems from the evidence that a small minority of vehicles is responsible for a substantial portion of vehicle emissions. In the United States, for example, studies have found that 20 per cent of vehicles emit roughly 80 per cent of vehicle emissions. For these “gross emitters,” removing them from service may be cheaper than trying to repair them.
Moving from this simple observation to successful scrappage programmes, however, has proved to be complex. An effective accelerated retirement programme needs to avoid certain pitfalls:
(a) It should not create an inappropriate market demand for older vehicles that would cause a flood of those vehicles to the programme target area;
(b) It should target only those vehicles actually being used;
(c) It should not pay to scrap vehicles that would have been scrapped even without the programme.
Comment [RG14]: Glazer, Amihai. Clean for a day : troubles with California's smog check / Amihai Glazer, Daniel Klein, Charles Lave. Berkeley, Calif. : University of California Transportation Center, [1993]. Series title: Working paper (University of California (System). Transportation Center) ; no. 163.

117
Creating effective programmes that avoid these pitfalls has proved elusive. The risk of inappropriate demand creation is particularly troublesome, because if increased demand causes a rise in vehicle prices, owners may be discouraged from replacing their vehicles. In addition, an unwanted effect of such demand creation could be a flow of vehicles from rural to urban areas. In guidelines published in 1993, the EPA recommended a number of requirements to be included in programme design to ensure against this, including: (a) that vehicles should be registered in the area where the programme is being implemented for a certain amount of time (two years); (b) that they be able to be driven to the scrappage site; and (c) that the owner present a fairly recent I/M certificate, if such programmes exist in the target area. Even with such restrictions in place, there remains a risk that the market created by former owners of newly scrapped vehicles might still lead to an influx of older, high-emitting vehicles to urban areas.
In the United States, vehicle scrappage pilot programmes have had mixed results in terms of cost-effectiveness for reducing HC and CO emissions. Cost per ton of pollutant emissions avoided in several pilot programmes in different States throughout the 1990s have ranged from about US$ 1,000 per ton in California, to about US$ 8,300 per ton in Illinois (combined HC and CO). The lower end of this range implies some degree of cost-effectiveness, but the upper end suggests that other measures, such as vehicle repair and upgrading emissions control systems, may be more cost-effective. Consequently, American experience so far is inconclusive.
In Europe, as well, a number of car scrappage programmes were implemented throughout the 1990s, with mixed success. Denmark initiated an 18-month scheme in January 1994. Owners were given about US$ 1,000 for cars over 10 years old. Within the first six months, slightly more than 6 per cent of the fleet (about 100,000 cars) were traded in, but about 19 per cent of these owners subsequently repurchased a vehicle that was older than 10 years old, compared with only about 11 per cent who subsequently purchased new vehicles.
France also initiated a scrappage scheme similar to Denmark’s, at about the same time, but followed this up with a second, more generous scheme. This second scheme, implemented from October 1995 to September 1996, offered about US$ 1,300 for cars over eight years old. These two schemes were estimated to have netted about 700,000 scrapped vehicles. Ireland initiated a scrappage scheme in 1995, under which payment for the scrapped vehicle was linked to reimbursement for registration taxes of a new car. In this way, the programme ensured that old cars were replaced with new ones; unfortunately, it also provided little incentive to reduce car ownership. None the less, the scheme succeeded in scrapping about 5 per cent of the fleet, the majority of which were between 10 and 12 years old. Norway, Italy, and Spain have also had experience with car sharing schemes (Beg 1999).
Perhaps the most successful design of a car scrappage scheme has been in British Columbia. A voluntary and still ongoing programme initiated there in 1996 involved variable amounts of compensation. Depending on the action taken by the vehicle owner, he or she could opt for 750 Canadian dollars (Can$) for a new car or Can$ 500 for a used car, or receive a free transit pass for a year (at a value of roughly Can$ 1,400). Table A.9 shows the cost-effectiveness of these different compensation schemes, as well as a blended cost-effectiveness for all the compensations, for a number of pollutants, in 1998 Canadian dollars. About 52 per cent of programme participants in the Vancouver metro area opted for a transit pass, suggesting the

118
importance of tying vehicle scrappage to alternative transport options.7 The tie-in to public transport also helps to alleviate the problem of revolving-door demand for inexpensive, high-emitting vehicles. It should be noted that each 1,000 vehicles removed also reduced CO2 emissions by about 4,300 tons, at an average cost of Can$ 130 per ton. Had this been evaluated on its own, scrappage would not have been considered cost-effective as a CO2 measure. By explicitly tying the scrappage scheme to a public transport option, the programme has created ancillary benefits for global emissions, even though it was intended as a local pollution control measure.
7 Scrappage schemes may also be linked to car-sharing schemes.

119
Table A.9. Cost-effectiveness of different incentives in the Vancouver scrappage scheme
(Canadian dollars)
Pollutant New car Used car Transit pass Programme average HC 4,574 3,581 5,247 4,798 CO 704 563 786 729 NOx 16.543 16,640 19,835 18,255 HC + NOx 3,579 2,947 4,146 3,796 HC + NO + CO/7 2,073 1,686 2,364 2,177
Source : OECD/UNEP, Older Gasoline Vehicles in Developing Countries and Economies in Transition: Their Importance and the Policy Options for Addressing Them (Paris, 1999).
These North American and West European experiences need to be understood in context; because of the relatively advanced state of emissions control, the marginal cost of emissions reduction per ton tends to be higher than it would likely be for similar scrappage schemes in developing countries. Poorer countries tend to have significant numbers of completely uncontrolled vehicles operating in regular use. The cost-effectiveness of removing these vehicles through well-designed accelerated retirement programmes are probably significantly better than in developed countries and relatively better than maintenance or retrofit options (compared with developed countries), because of the technical difficulties of improving uncontrolled gasoline vehicles in a cost-effective manner. These relative differences, however, do not imply that car scrappage schemes are necessarily more advantageous than maintenance or retrofit options; such a conclusion can only be made by examining local circumstances, taking into account the risk of creating an attraction pole in urban areas for high-emitting cars.
Perhaps the most extensive experiment with car scrappage in a developing country or economy in transition was the programme set up in Budapest in the middle 1990s to replace two-stroke Trabants and Wartburgs–highly polluting products of cold-war-era production from the former German Democratic Republic. The programme offered four- or six-year transit passes, depending on the car turned in, or coupons towards the purchase of a SEAT Marbella, an Opel Corsa, a Suzuki Swift, a Volkswagen Polo, or a Renault. As of mid-1995, about 2000 Trabants and Wartburgs had been taken off the streets of Budapest, less than 2 per cent of those in operation.

120
Annex VI
FUEL SPECIFICATION AND QUALITY
A number of aspects of fuel specification and quality can influence the overall levels of emissions, and quality and specification problems are prevalent in many regions of the developing world. In developing a fuel specification policy, none of these aspects should be considered in isolation, because the response of refiners to changes in requirements for any one specification will inevitably affect the others.
Lead
Tetra-ethyl lead is added to gasoline to raise octane ratings of otherwise low-octane fuels cheaply. Octane is an indicator of how easily the fuel combusts; higher octane fuels are more resistant to premature combustion (knocking). Catalytic reforming of naphtha can yield gasoline feedstocks of higher octane value than unreformed naphtha, but overall yield is reduced substantially. Refiners, therefore, have historically found the use of lead a more economic choice, although the health cost to society is over 10 times that of the cost to refiners. In addition to increasing health costs, lead can irreversibly poison platinum catalysts used in exhaust aftertreatment of fuel to reduce CO, VOC and NOx emissions, rendering these devices ineffective. Lead is also associated with increased operating costs of even uncatalysed motor vehicles, and some studies suggest that savings from these operating costs alone economically justify the reduction in lead content (EPA 1999; Walsh and Shah 1997).
Technically, removing lead from gasoline is straightforward. A number of options exist to boost gasoline octane in the absence of lead: use of alternative additives (such as ethers), changes in naphtha reforming output at refineries, or use of different crude oil inputs. Which technical measures are adopted will depend on characteristics of fuel refining or fuel supply in a particular country or region, the specification of other public policy goals with respect to fuel content and air quality, and costs. Procedural methods to weigh these various considerations are well established (see, for example, EPA 1999). In many respects, addressing the problem of lead in gasoline is one of the most straightforward and easy to solve environmental challenges facing the transport sector.
In countries where catalytic technology use is extremely limited or non-existent, and an intransigent petroleum refining industry is reluctant to switch to unleaded fuel production, an effective interim strategy may be to limit the amount of lead used in gasoline, rather than eliminate it entirely (Walsh and Shah 1997). The impact of lead on octane rating is not linear; as figure XII shows, the initial 25 per cent of tetra-ethyl lead addition is responsible for 50 per cent of the octane enhancement for a 93 octane fuel. Reducing this excess portion of lead additive would yield benefits far in excess of costs.
One of the more important aspects of any lead strategy is addressing some of the common myths surrounding unleaded fuel. One of these is that older, uncatalysed cars are not able to use unleaded fuel, because of valve seat recession in engine cylinders. Another is that gasoline without lead necessarily produces higher levels of benzene emissions than leaded

121
gasoline. While both are potential problems if left unaddressed, relatively simple technical measures can address both of them at minimal cost (Lovei 1996).

122
Figure A.XII. Octane enhancements versus lead concentration for some typical gasolines
Source : ECMT, Traffic Congestion in Europe, European Conference of Ministers of Transport, Report of the
110th Round Table, 12-13 March 1998 (Paris, OECD, 1999). Note: Ocatine should read Octane.
Sulphur
The sulphur content of fuel is another important area of concern for fuel refining and specification. Like lead, sulphur in fuels is both a source of pollutants (sulphur dioxide and sulphate particulates) and a poisoner of cat alytic devices that normally reduce other pollutants. For conventional two- and three-way catalytic converters, however, the effects of sulphur are temporary (unlike those of lead); once low-sulphur fuel is used in the vehicle, the catalytic system recovers. Whether such recovery occurs with more state-of-the-art catalytic technologies, such as de-NOx systems or continuously regenerating particulate filters, is unclear at present. Where sulphur is present in fuels in significant amounts, catalytic devices can actually exacerbate sulphate particulate emissions by causing the oxidation of SO 2 to SO3
+, which reacts with hydrogen to produce sulphuric acid and other sulphates.
Sulphur is present in varying quantities in different crude petroleum stocks. It tends to remain concentrated in heavier products of the distillation process–for example, heavy oil, diesel and gasoline-blended predominantly from reformed (rather than straight run) naphthas. Refining processes can remove sulphur from fuel, but doing so significantly raises production costs, because the capital investment needed can be enormous. Such investment may be economic only for high-capacity facilities. For non-refining countries, low-sulphur diesel is available on international markets. However, as a result of emissions regulations enacted in many countries–

123
primarily in the industrialized world–the demand for low-sulphur fuels is growing faster than the supply. Consequently, low-sulphur fuels remain relatively costly, and enforcement may be problematic.
Because of these costs, a policy of low-sulphur diesel may be relatively expensive per gram of pollutant avoided compared with other interventions. Conventional wisdom suggests it should be considered (in conjunction with the exhaust aftertreatment technologies it enables) only after other, lower cost abatement measures have been implemented, as is the case in Europe and North America. Nevertheless, reducing sulphur content in diesel (and gasoline) has the advantage that the impact on particulate emissions reduction is immediate (for sulphates) as well as long-term (for carbonaceous particulates, if aftertreatment technology is adopted as a result), and that its cost increment would be variable, rather than fixed, for the motorist.
Technically, the simplest option for producing low-sulphur fuels is to use a low-sulphur crude stock. Even so, even the lowest sulphur crudes start with a minimum sulphur content of 1,000 ppm (Faiz and others 1996). Diesel from Middle Eastern crude, for example, has about 15,000 ppm sulphur prior to treatment (CONCAWE 2000). For gasoline, most of the sulphur makes its way into fuel via fluid catalytic cracking (FCC), so desulphurization technology focuses on this step. Because FCC boosts high-octane olefin output, the petroleum industry argues that desulphurization would require additional energy consumption in refining in order to maintain octane parity, and that the CO2 emissions associated with this increased consumption would counteract any energy -efficiency improvements from reduced catalytic regeneration frequency (CONCAWE 2000).
The equipment for desulphurization processes, as noted, can be prohibitively expensive for all but the highest volume refineries. Most of these are located in industrialized countries, but high volume, low -sulphur refineries are operational in Mexico and India. For most developing countries, however, access to low-sulphur diesel will come through imports. The costs of reducing sulphur from gasoline in the United States to acceptable levels to use lean-NOx catalytic technology was estimated to be between 1.2 and 1.3 cents per litre. Reduction of sulphur in diesel in an Asian refinery to 200 ppm was estimated to increase costs between 1.6 and 1.9 cents per litre. Reduction of sulphur in diesel to acceptable levels for advanced exhaust aftertreatment is likely to cost significantly more (Faiz and others 1996). It should be noted that actual costs are very dependent on throughput.
Fuel volatility
Evaporative emissions are responsible for a significant amount of non-methane hydro-carbon emissions in hot climates. A recent inventory in Buenos Aires found that evaporative emissions accounted for about 44 per cent of total hydrocarbon emissions; of these, about 70 per cent came from vehicle “hot-soak”, with the remaining 30 per cent coming from service stations, tank trucks and bulk terminals (Weaver 2001b). The tendency of gasoline to evaporate is measured by Reid vapour pressure (RVP), which is correlated with the paraffin and aromatic content of gasoline. Studies suggest that a 33 per cent increase in RVP can roughly double the average evaporative emissions from a fuel (Faiz and others 1996). Where evaporative emissions are not reflected in fuel specifications, refiners often increase light paraffin content, particularly butane, in order to ensure adequate starting of vehicle engines in colder climates. Consequently,

124
fuel specifications need to be tailored to local climate; adoption of inappropriate standards from another climate can lead to substantial and needless NMHC emissions.
In addition to lowering paraffin and aromatic content from gasoline during warm, summer months through appropriate fuel specifications and enforcement, other less technically sophisticated methods for reducing evaporative emissions can also be adopted. Mandating exhaust gas recapture equipment at refuelling stations can be quite effective in reducing evaporative emissions, as can simply providing shade for parked vehicles, particularly in hot, sunny climates.
Oxygen content and octane rating
The ability of a gasoline to avoid combustion from compression prior to the spark-ignition in the engine (knocking) is measured by its octane rating, a scale derived from the proportion of octane in an octane/n-heptane comparator mix that produces the same level of knocking as the gasoline blend being tested. The higher the compression ratio of an engine, the higher the octane rating of gasoline it must use. High-octane fuels are crucial for high performance or high efficiency vehicles, but all vehicles require at least minimal octane fuels. Countries with relatively large numbers of cars from the mid-1990s and later model years from Europe generally need higher octane gasolines. While very low octane fuels (below 85 RON) are generally not produced for international trade, smaller, independent refineries in highly protected markets in the developing world still produce low-octane (frequently leaded) fuels for domestic consumption, often inexpensively from straight-run naphtha. Efforts to remove lead from these fuels need to work to raise octane levels of production.
Technical options to enhance octane characteristics without lead include:
• Use of crude feedstocks with lower concentrations of paraffins, and higher concentration of aromatics and naphthenes;
• Use of higher octane naphthas in gasoline blends, produced, perhaps, from catalytic reforming of naphtha; 8
• Fluid catalytic cracking (FCC) to boost olefin-rich blendstocks;
• Use of oxygenate additives, such as ethers or alcohols.
The last alternative has an added benefit of increasing the oxygen content of the gasoline, which helps to reduce CO and hydrocarbon emissions by ensuring more complete combustion. Brazil, for example, effectively eliminated the use of lead as an additive through the widespread adoption of ethanol as a gasoline additive (gasohol). In the United States and Mexico, methyl tertiary butyl ether (MTBE) has been used as an additive to gasoline, initially as an octane-enhancing replacement for lead, and later in greater quantities to increase oxygen content of the 8 Some high octane products may increase emissions of certain air toxics, such as 1,3 butadiene, or the reactivity of VOCs in the atmosphere (increasing risk of ozone formation). These issues need to be taken into account in strategy development.

125
fuel. While these additives are preferable to lead, both have subsequently proved somewhat problematic because of increased emissions of aldehydes (particularly acetaldehyde) and 1,3 butadiene, both significant toxics. In addition, concern has been growing about MTBE contamination of groundwater in the United States.
Benzene and aromatic content
Benzene is one of the more toxic substances in gasoline, and emitted from motor vehicle tailpipes. It is also associated with emissions of 1,3 butadiene (Walsh and Shah 1997). Catalytic cracking techniques which have become commonplace in refineries to boost yield of naphthas, kerosene and gas oils have the unfortunate side effect of increasing benzene and other aromatic content. In diesel vehicles, polycyclic aromatic hydrocarbon (PAH) content is strongly correlated with SOF formation. A number of jurisdictions, consequently, have moved to limit PAH content in diesel fuels (Faiz and others 1996).
Lubricant additive to gasoline in two-stroke engines
Small gasoline engines, using cheaper, two-stroke rather than four-stroke mechanical design, are in widespread use in the transport sectors of certain developing countries, particularly in South and East Asia, parts of the Middle East, and urban areas. These engines have much poorer pollution emission characteristics than the equivalent-sized four -stroke engines. Two-stroke engines are lubricated by the addition of lubricant to gasoline. Since a relatively large portion of the air-fuel mixture of two-stroke engines remains uncombusted after the full cycle, much of the lubricant additive is also released uncombusted, as white smoke.
Only a 2 per cent mixture is needed to provide adequate lubricating capability, but, because of poor information and technical understanding, widespread misconceptions persist in many South Asian cities that more lubricant is better. As a result, a number of jurisdictions have mandated the sale of pre-mixed “kits” of gasoline/lubricant mixture. New Delhi, for example, implemented a programme in 1996 to sell pre-mixed fuels; in 1997, roughly 30 per cent of all retail outlets supplied pre-mixtures (Government of India 1997). A World Bank assessment estimated that such a policy, if fully implemented, would reduce particulate emissions from two-stoke three-wheelers by 30 per cent (Xie and others 1998).
Fuel adulteration and cross-border smuggling
Adulteration of fuels or cross-border smuggling of cheaper, lower-grade fuels can be a significant problem in countries and regions where there are either significant geographic variations in prices or significant differences in the quality of fuel availability. In certain parts of the world, it is not uncommon to mix kerosene into gasoline or diesel fuels, because of the relative difference in costs. Kerosene has excellent combustion characteristics in compression-ignition engines, but in spark-ignition engines, can produce crusty carbon coatings along different parts of the engine, which increase hydrocarbon and particulate emissions, as well as degrade engine performance. As a jet fuel, and abundantly available all-purpose fuel for cooking and
Comment [RG15]: Xie, Jian, Jitendra J. Shah and Carter J. Brandon. Fighting Urban Transport Air Pollution for Local and Global Good: The Case of Two-Stroke Engine Three-Wheelers in Delhi. WB GET FULL CITE

126
heating, kerosene is generally untaxed. All else equal, therefore, increases in taxation rates on gasoline and diesel would thus probably lead to increases in the incidence of fuel adulteration. Black market sales of cheaper fuels constitute a potentially serious problem when the emissions control technology in extensive use relies on a supply of good-quality, unleaded or low-sulphur fuel.

127
Annex VII
NETWORK EFFECTS: SPEED, FLOW, AND INDUCED TRAVEL
Influence of speed, flow and congestion on emissions rates from vehicles
The behaviour of traffic on a road system can have important effects on specific energy consumption and pollutant emissions of vehicles. There are two such effects. Average speeds influence both aggregate pollutant emissions from any individual vehicle and the total amount of energy consumed for a given vehicle trip. The figures below show some of these relationships for selected pollutants and energy consumption, averaged across vehicles representing the American automobile fleet. For urban settings, where the effects of pollution are the most concentrated, these graphs suggest that the specific emissions of VOCs (and also of CO and Nox, not shown) can be collectively minimized at speeds between 25 and 45 miles per hour (40 to 75 kilometres [km] per hour), and that fuel economy is equally maximized around this range. Urban traffic congestion that reduces speeds below this level will therefore cause vehicles to emit more grams of pollutants and burn more fuel per kilometre than they otherwise would at such a level.
Figure A.XIII. Speed correction factor for VOC emissions from light-duty vehicles
Source : Transportation Research Board, Expanding Metropolitan Highways: Implications for Air Quality
and Energy Use, Special Report 245, National Research Council (Washington, DC, National Academy Press, 1995). A second, perhaps more important effect, is the impact on overall emissions of frequent
and violent accelerations, the kind associated with both aggressive urban driving and highly congested traffic conditions. Different average speeds on paper can be associated with very different observed stops, starts and accelerations in practice. Figures A.XV and A.XVI show emissions of CO and VOCs during the same trip, made by two drivers: a “normal” driver and an “aggressive” driver.

128

129
Figure A.XIV. Speed correction factor for fuel efficiency from light-duty vehicles
Source : S.C. Davis, Transportation and Energy Data Book (Oak Ridge [Tennessee], Oak Ridge National
Laboratory, 1994). The aggressive driver emits over 14 and 15 times as much CO and VOCs respectively per
kilometre as the normal driver, even though, as the figures show, cruising speeds after acceleration are similar. These considerations suggest that the emissions of individual vehicles can be reduced or minimized by using traffic management techniques that both ensure the smooth flow of traffic (by minimizing stops and starts) and maintain an average speed of traffic between 40 and 75 kilometres per hour.
Induced demand
One of the most intuitively obvious ways to improve the flow along a link in a transport
network is to increase the effective capacity of that link. For this reason, capacity improvements are often touted as having air quality and congestion relief benefits. Heuristic, engineering relationships (see chap. IV, sect. B of this study) are often used as the justification. Capacity improvements to improve flow may involve physical additions to infrastructure, such as expanding or widening roadways, but they may also involve traffic management, better signal timing, or other enhancements in order to increase the performance of existing roadways. Whether physical or managerial in nature, any increase in roadway capacity will be associated with a certain amount of induced demand, defined as an increase in vehicular travel that occurs as a result of any increase in the capacity of the transportation system, that is, that would not have otherwise occurred in the absence of the capacity increase (Noland and Cowart 2000; Lee and others 1999; DeCorla-Souza and Cohen 1999). For this reason, the actual improvement to air quality and energy efficiency resulting from a change in capacity is significantly more complex than the above heuristic relationships would suggest.

130
Figure A.XV. Time-speed emissions traces for carbon monoxide for an “average”driver and an aggressive driver in an 11-km trip from downtown
Source : Transportation Research Board, Expanding Metropolitan Highways: Implications for Air Quality
and Energy Use, Special Report 245, National Research Council (Washington, National Academy Press, 1995).

131
Figure A. XVI. Time-speed emissions traces for volatile organic compounds for an “average” driver and aggressive driver in an 11-km trip from downtown
Source : Transportation Research Board, Expanding Metropolitan Highways: Implications for Air Quality
and Energy Use, Special Report 245, National Research Council (Washington, DC, National Academy Press, 1995).

132
Mechanism behind induced travel. All else equal, the effect of a capacity increase in a stretch of roadway is to reduce the amount of time needed to travel along the link, assuming the link was operating under congested conditions before the improvement. Since time is a cost having monetary value (people are willing to pay money to save time), any reduction in time amounts to a reduction in the cost of travel. Basic economics suggests that a reduction in costs is associated with an increase in demand, and this increase is the amount of demand “induced” by the capacity change. Quantifying this effect has been a challenge for researchers, however, because controlled experiments to determine how much traffic is baseline and how much induced are not possible. (DeCorla-Souza and Cohen 1999). In addition, there is significant theoretical discussion and disagreement about the distinction between short-run and long-run induced demand (Lee and others 1999).
In both the short and long run, induced travel reflects changes in consumer and business decisions. Over the short run, a change in roadway capacit y may cause travellers to change their departure times (resulting in no direct VKT increase, but there may be ripple effects as capacity is released at different times of the day), their routes, their travel mode, their destinations, and the number of trips they make in a day (trip generation). Over the long run, however, additional changes resulting from roadway capacity increases may also occur, including increases in household car ownership or driver licensing rates, changes in residential location (shift of time-savings benefit into real estate values), employee changes in work locations, employer changes in business location, changes in land-development location and patterns, and changes in aggregate amount of economic activity in a region. All of these changes can be reflected in increased vehicle kilometres travelled–that is, increases that would not have occurred in the absence of the capacity expansion.
A common assumption is that induced travel necessarily implies increased economic activity, a clear benefit for the region. While this assumption may be true for predominantly rural areas whose accessibility may be greatly enhanced through transport capacity enhancement, the above enumeration of potential changes in travel behaviour for residents of urbanized areas suggests that net increases in economic activity may be only a small component of overall induced demand. Rather, much of the change in activity may simply be the result of a transfer of resources–in the form of time-savings–from society at large, to motorists. In this sense, induced travel may be a reflection of a hidden subsidy for car users.
Measuring induced travel. Recent research has begun to suggest that the effects of induced travel demand may be quite strong. In the United States-based literature, induced travel is often reported as either an elasticity (for VMT) with respect to either lane-miles or travel-time savings, or as the proportion of observed overall VMT growth which is attributable to capacity expansion (as opposed to socio-demographic or economic factors driving VMT growth).
Studies in the United States suggest that long-run lane-mile elasticities for vehicle miles travelled (VMT) are on the order of .8 to 1.1, controlling for population, income, fuel cost, and other variables such as density (Noland and Lem 2000).9 Short-run elasticities tend to be somewhat lower (between .3 and .6 according to Noland and Lem 2000). Significantly for developing countries, this research is also suggesting that lane-mile elasticity is sensitive to the
9 It should be noted that the finding that lane-mile elasticities might be greater than 1 has been the subject of a fair amount of debate and even consternation among induced-travel experts.

133
base amount of transport network–the fewer the lane-kilometres per resident in the base case, the more the induced effect of capacity expansion observed (Noland and Cowart 2000). In the United States, it is estimated that, on average, about 15 per cent of annual increases in VMT is attributed to an induced demand effect from capacity expansion, although considerable variation is observed between metropolitan areas (Noland and Cowart 2000). This figure is likely to be higher in developing countries because of lower baseline levels. In the United Kingdom, an important study there suggested not only that new capacity increases induced new demand, but also that, in certain instances, eliminating capacity might help reduce demand (SACTRA 1994). A range of data from various studies on induced travel are presented in tables A.10, A.11 and A.12. Table A.10 shows various estimates of vehicular travel (VMT or VKT) elasticities with respect to travel time. Table A.11 shows the same elasticities with respect to road capacity (lane miles or lane kilometres). Table A.12 shows various estimates of the proportion of the share of vehicular travel attributable to induced, as opposed to natural, demand.
Table A.10. Various estimates of vehicular travel elasticities with respect to travel time Author(s) Study area Elasticities Domencich (1968) Boston -0.82/-1.02 (work/shopping) Chan and Ou (1978) Louisville -0.4 (work) SACTRA (1994) for UK DOT European Synthesis -0.5 to –1.0 Dowling (1995) Synthesis 0.0 to -1.0 NRC/TRB (1995) Based upon Dowling (1995) 0.0 to –1.0 Goodwin (1996) Synthesis -0.28 to –0.57 USDOT (1999) report to Congress United States modeling -0.8 to 1.0 (generalized user
cost) Lee (1999) Based upon Hansen et al (1993) -1.05
Table A.11. Various estimates of vehicular travel elasticities with respect to lane capacity Author(s) Study area Short run Long run Goodwin (1996) United Kingdom synthesis 1.00 Hansen and Huang (1997) California counties 0.28-0.75 0.62 Hansen and Huang (1997) California metro areas 0.43-0.91 0.94 Noland (2001) 50 States 0.23-0.51 0.71-1.22 Noland and Cowart (2000) 70 Metropolitan areas 0.28 0.81-1.02 Fulton and others (2000) Mid-Atlantic countries 0.13-0.43 0.47-0.81
Table A.12. Various estimates of the share of vehicular travel attributable to induced demand
Source Study area
Percentage share
VMT from induced travel
Heanue (1998) Milwaukee, 1962-1992 6- 22 USDOT (calculated from unpublished data) National forecasts to 2015 8- 11 USDOT (calculated from unpublished data) Urban areas forecast to 2015 10-14 Noland (2001) Average State forecast to 2010 20-28 Noland and Cowart (2000) Average metro forecasts to 2010 15-45

134
Accounting for induced travel. Transportation planners and travel forecasters acknowledge that induced travel is a real phenomenon, and that forecasting efforts in the past have not adequately accounted for it. There is, however, a fair amount of disagreement on the degree to which existing travel demand forecasting methodologies actually do take induced travel into account. Some of the behavioural change factors enumerated above are adequately captured by standard travel demand forecasting techniques, while others are not. For example, Michael Replogle, in an annex published together with a special report of the Transportation Research Board (TRB 1995), argues that current knowledge is too rudimentary to be able to determine if a given capacity expansion will result in a net improvement or deterioration, with respect to air quality.
While it may not be possible to characterize or quantify accurately the extent of induced demand from a given capacity change with the current state of knowledge, a number of short-term improvements to travel demand forecasting techniques can help to ensure more accurate accounting of this phenomenon. First, in the economic assessment of a given project or programme that is expected to increase the functional capacity of an urban transportation system, analysts might include as a standard part of their evaluation methodology an assessment of critical inducement loads–that is, back calculate the implied rate of induced demand (as measured by elasticity) at which a given project would be rendered uneconomical (for example, where the economic rate of return–including air quality benefits–drops below 12 per cent). Analysts can then make judgements as to whether such an elasticity is possible, likely, or inevitable, and assess the project accordingly. Secondly, analysts could apply sensitivity tests to various parts of four-step transportation models to approximate different aspects of induced travel behaviour, and similarly make judgements about project risk. In the long run, increased data and information from around the world will help to refine the methodologies and calibrations of techniques to predict actual levels of induced travel.
Balancing speed and flow considerations with induced travel
Improving flow and maintaining speeds within the optimal range in a transportation network may to help reduce energy consumption and pollutant emissions of individual vehicles using the system, but if the flow and speed improvements increase effective capacity, they may also induce additional vehicle travel that might not have occurred had the intervention not been undertaken. The actual effects of traffic flow interventions on air quality and energy use, therefore, must be examined on a case-by-case basis.1 0 A clear pitfall in air quality analysis would be to use an air quality model–such as the EPA MOBILE6 model–to assess the impact of a policy or investment decision that increases the effective capacity of the road network, without taking into account appropriate vehicle travel data from a well-calibrated travel demand forecasting system that accounts for induced travel as much as possible.11
10 This was the final recommendation of a Transportation Research Board panel convened to look into the question (TRB 1995). 11 One frequently cited shortcoming of travel demand forecasting methods is that they often do not adequately account for land-use changes resulting from changes in transportation capacity. Consequently, even models that do account fairly well for induced travel effects may still be missing these land-use “knock-on” effects (Hunt 2001).
Comment [RG16]: Transportation Research Board, 1995, Expanding metropolitan highways: implications for air quality and energy use, Special report 245, National Research Council, National Academy Press, Washington, DC.

135
Annex VIII
ECONOMIC ANALYSIS IN URBAN AIR QUALITY MANAGEMENT The art and science of urban air quality management is well established, if still in need of
refinement, and expertise in cities in developing countries as well as in the developed world is growing. The World Bank has developed an Air Quality Management System that has been used extensively in Asia, under the auspices of the URBAIR programme, in Latin America, under the Clean Air Initiative and other Bank-sponsored efforts, and in Teheran. This process is data-intensive, as it requires several years for the collection and evaluation of information, but it can be of significant help in better directing scarce resources to those measures that will yield the greatest results. The present annex provides an overview of the process, highlighting strengths and weaknesses.
The formal system of analysis involves a number of evaluation “modules”, including:
(a) An emissions module, to determine sources of pollutants (emissions inventory);
(b) A dispersion module, to determine photochemical reactions and ambient
concentrations; (c) An exposure module, to determine population exposure risks;
(d) A damage assessment module, including dose-response relationships (which may
be supplemented to include non-human-health costs);
(e) A cost-ranking analysis module, to evaluate least-cost damage abatement measures.
Under ideal conditions, these evaluation modules are carried out against a background of rigorous ambient air quality monitoring in the urban airshed. The emissions inventory and dispersion module associate economic activity in various sectors with measured ambient air quality, to apportion the source of pollutants to different sectors. The inventory of emissions applies measured emissions factors to observed sectoral activity, to determine the sectoral emissions, which the dispersion module models atmospheric, local climactic, and topological features that determine how pollution disperses from sources to measured ambient concentrations. The exposure and damage assessment modules should quantify the health and other costs of pollution exposure, and the cost-ranking module evaluates potential interventions. For the transport sector, interventions most often analysed include:
• Introduction of unleaded gasoline;
• Implementation or improvement of inspection and maintenance programmes;
• Addressing excessively polluting vehicles through scrappage or retrofitting programmes;
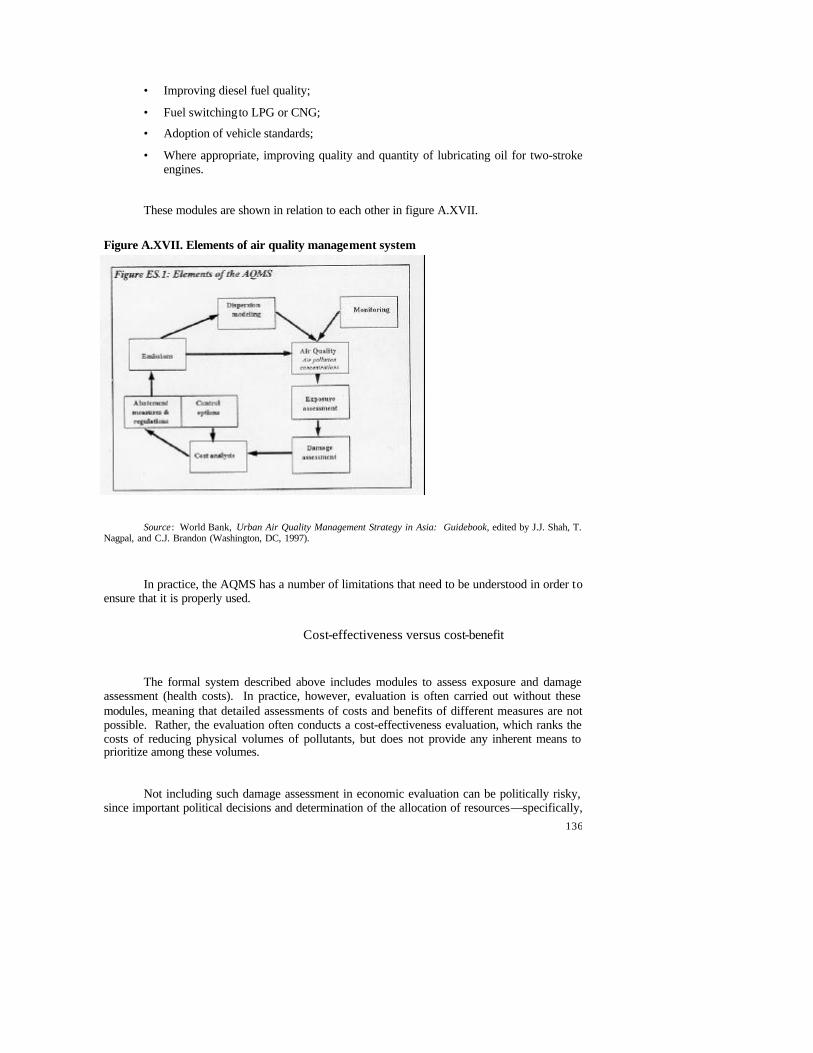
136
• Improving diesel fuel quality;
• Fuel switching to LPG or CNG;
• Adoption of vehicle standards;
• Where appropriate, improving quality and quantity of lubricating oil for two-stroke engines.
These modules are shown in relation to each other in figure A.XVII.
Figure A.XVII. Elements of air quality management system
Source : World Bank, Urban Air Quality Management Strategy in Asia: Guidebook, edited by J.J. Shah, T.
Nagpal, and C.J. Brandon (Washington, DC, 1997).
In practice, the AQMS has a number of limitations that need to be understood in order to
ensure that it is properly used.
Cost-effectiveness versus cost-benefit
The formal system described above includes modules to assess exposure and damage assessment (health costs). In practice, however, evaluation is often carried out without these modules, meaning that detailed assessments of costs and benefits of different measures are not possible. Rather, the evaluation often conducts a cost-effectiveness evaluation, which ranks the costs of reducing physical volumes of pollutants, but does not provide any inherent means to prioritize among these volumes.
Not including such damage assessment in economic evaluation can be politically risky, since important political decisions and determination of the allocation of resources—specifically,

137
with regard to what level of investment is justified—are left undecided. In Europe, the costly first Auto-Oil Programme collapsed around this point; once abatement measures were ranked and marginal cost curves established, different constituents (the automobile and petroleum industries, the European Commission and members of the European Parliament) could not agree on appropriate levels of abatement, and the analysis did not provide them with a means to move beyond the log jam. A more rigorous inclusion of abatement benefits in the analysis programme might have allowed these political and value decisions to be more openly discussed and negotiated (Nevin and Barrett 1999). An important, and often overlooked, role of rigorous economic analysis, therefore, can be to provide a structured forum in which values and political interests would be discussed and negotiated, but this role can only be carried out if cost-benefit, rather than cost-effectiveness, criteria are used.
Technical bias
The focus on quantitative assessments of specific interventions has led in practice to a predominance of technical rather than behavioural or systemic solutions–such as traffic management, travel demand restraint, or public transport enhancement –as the subject of analysis. In most cases, these types of interventions do find their way back into the set of final recommendations, but there is little quantitative support for these actions; they therefore do not have the same weight among policy makers as the more technical interventions, even though, over the long run, systemic or behavioural measures may be more effective.
Static evaluation methodology
With regard to the above criticism, the evaluation methodology of the air quality management system is not dynamic; it involves a static view of traffic with little demand-side or systemic evaluation to assess how pollution is likely to change over time. In particular, it ignores the effects of planned infrastructure on overall levels of activity. For Manila, Mumbai, and Jakarta, for example, all the assessments of the URBAIR programme recommended that short- to medium-term measures should be implemented to improve the capacity of the existing road network and to improve/eliminate bottlenecks. In a static analysis, such recommendations may make sense; in a closed system, eliminating bottlenecks reduces stop and go traffic, thereby reducing emissions from high-load conditions. In a dynamic framework, however, such recommendations are ill-conceived, absent better analysis.

138
Annex IX
FUEL PRICING FOR ENVIRONMENTAL PURPOSES
Fuel taxes as generalized proxy for Pigouvian tax
Pigouvian taxes tax an offensive or deleterious outcome of a market transaction, for which neither the buyer nor the seller bears the cost (a negative externality). Classical economics suggest that a tax on a pollutant equal to the marginal damage it causes would cause the market to correct the problem automatically. Formally, fuel taxes levied for this purpose are an imperfect example of a Pigouvian tax, because the input–fuel–is taxed, rather than the damaging output–emissions. Nevertheless, because of the relative administrative simplicity of the tax, and the strong correlation between content of the input and observed pollution, especially for greenhouse gases, it is an attractive implementation measure (Eskeland and Devarajan 1996). As an input tax, fuel taxes can be combined with regulatory measures to mimic the market responses that would be expected were a true Pigouvian tax to be assessed (Eskeland and Devarajan 1996).
Until very recently, fuel taxes were not used as a policy instrument explicitly to change behaviour; rather, they were used for revenue raising, in three contexts. In the United States, they have been the primary mechanism of financing for road infrastructure development and subsequent maintenance. Consequently, they have been hypothecated within the sector, and taken off budget. In Europe, Japan, and many developing countries, fuel taxes are a primary means of raising general revenue. The share of funds “returned” to the transport sector varies from budget to budget, and is generally unrelated to the revenue raised from the sector. In some developing countries, fuel taxes are used to finance road maintenance funds (Heggie and Vickers 1998) in which supplemental revenue raised via a fuel tax is allocated to a road fund maintained off-budget, for the purpose of maintenance of facilities.
Explicit use of fuel taxes in a Pigouvian sense—that is, to change behaviour —is recent, with experience limited, for the most part, to Western Europe. Between 1995 and 2000, the United Kingdom imposed regular fuel tax increases at a rate of 5 per cent (6 per cent for diesel) per year over the rate of inflation. Not surprisingly, the measure was unpopular with motorists, and became increasingly so after large increases in world petroleum prices in late 1999. The programme, which was intended to “sunset” in 2003, was abruptly cut off in 2000. In addition to the United Kingdom, eight countries have instituted some kind of CO2 tax or increased fuel taxes in response to environmental pressures, although in some cases, gasoline and other transport-related taxes are either exempted or receive special treatment (ECMT 1997). It is difficult to know the extent to which these new environmental taxes have affected behaviour thus far, but countries with high fuel taxes tend to have fleets with higher fuel efficiency (World Energy Council 1998).
Types of fuel taxes
Different types of fuel taxes can be mixed and matched to target different types of
pollution; doing so, however, requires a rather sophisticated mechanism for setting, implementing and monitoring the taxes. In order for Pigouvian taxes to work, it is crucial for the structure of the taxes to be transparent and well understood by consumers. Otherwise, it will be difficult for consumers to understand what changes in their behaviour they need to make in order to reduce their costs, and the intended price signal will be muddled.
Comment [RG17]: WEC, Energy Efficiency Policies and Indicators. 1998

139
Energy tax. A tax on energy content of fuel is primarily intended as an incentive for transport fuel consumers to reduce aggregate amounts of fuel used, either by choosing more fuel-efficient vehicles, or by reducing the amount of motor vehicle use they undertake. The advantage of an energy tax is that it is easy to administer—the energy content of fuels is well known—and that it constitutes a rough proxy for damage caused by local and global pollutants. The disadvantage is that, as a proxy, its relationship to local pollutants is only a rough one.
Specific Pigouvian levies on fuel content. A generalized fuel tax as reviewed above constitutes an easy-t o-administer proxy for a Pigouvian tax on environmental externalities (Eskeland and Devarajan 1996). Alternatively, specific attributes of the fuel, associated empirically with emissions of particular species of pollutants, could be taxed directly. A Pigouvian tax is particularly suited to the problem of lead, since lead is added for economic, not technical, reasons. Such a tax need not be equal to the actual amount of damage caused per weight of lead present in fuel; even a modest tax could serve as a strong incentive to reduce lead use by refiners (EPA 1999). Other attributes of fuels—such as sulphur, oxygen content or octane rating—might also be taxed (or negatively taxed) in order to create demand incentives for changes in fuel content.
Fuel-specific differential tax rates. Fuel taxation has been used extensively in many countries as a means of favouring one technology over another, for example, diesel over gasoline. Many countries maintain an artificial price distinction between diesel and gasoline much greater than international prices would warrant, as shown in table A.13 below. In some cases, these price distinctions are made in order to favour diesel vehicles over gasoline; in most countries, however, they are maintained primarily as a general subsidy to agriculture and other industries dependent on diesel fuel.
Whatever the intention of the policy, economic theory suggests, and empirical evidence shows, that switching to diesel would be accompanied by an increase in vehicle use, all else equal (the so-called “rebound” effect of fuel economy savings) (Hivert 1996). The reason is that diesel vehicles enjoy an inherent fuel economy advantage over gasoline vehicles. That fuel economy advantage means that at a certain anticipated annual mileage, the additional ownership and maintenance costs of diesel vehicles are offset by a reduction in operational costs. The effect of diesel price incentives is to lower that barrier for prospective buyers. Their costs to travel a given amount are therefore lower than they would otherwise be, creating an income effect, some of which translates into greater vehicle use.
Adjusting the relative costs of gasoline and diesel involve a review of the mechanisms for implementing intended subsidies for certain industries and agriculture. For example, targeted subsidies, through vouchers issued to certain industrial and agricultural users of diesel fuel entitling them to rebates on diesel purchases, might be more effective than artificial price controls. Targeted subsidies may also help to limit overall demand for diesel fuel, helping to restrain underlying prices better than price controls, resulting in a more efficient and, ultimately, less costly means of delivering subsidies to target populations.
Carbon taxes. Carbon taxes are a particular Pigouvian levy on a pollutant species—
carbon dioxide—which has the long-term effect of influencing both the desirability of particular fuels (diesel versus gasoline and alternative versus conventional) and the aggregate amount

140
demanded (vehicle energy -intensity and the amount of vehicular activity). Unlike energy taxes, carbon taxes can influence the fuel choice based on carbon content, as well as energy efficiency (Schipper and others 2000) and, unlike specific levies on other types of fuel content, such as sulphur or aromatics, carbon taxes more directly influence aggregate amounts of fuel consumed.

141
Table A.13. Comparative prices of gasoline and diesel in countries of the former Soviet Union and Central and Eastern Europe, with reference
to prices in select OECD countries
Gasoline Diesel Country (US$ per litre) Diesel/gasoline ratio Albania 0.90 0.40 0.44 Armenia 0.34 0.28 0.82 Azerbaijan 0.37 0.21 0.57 Belarus 0.35 0.18 0.51 Bulgaria 0.50 0.32 0.64 Croatia 0.77 0.64 0.83 Czech Republic (1997) 0.76 0.67 0.88 Estonia 0.45 0.39 0.87 Hungary 0.85 0.69 0.81 Kazakhstan 0.29 0.15 0.52 Kyrgyzstan 0.45 0.20 0.44 Latvia 0.56 0.35 0.63 Lithuania 0.49 0.38 0.78 Former Yugoslav Republic of Macedonia (1997) 0.86 0.49 0.57 Poland 0.57 0.44 0.77 Romania (1997) 0.45 0.32 0.71 Russian Federation 0.34 0.22 0.65 Slovakia (1997) 0.67 0.62 0.93 Slovenia (1997) 0.53 0.50 0.94 Tajikistan 0.41 0.38 0.93 Turkmenistan 0.10 0.07 0.70 Ukraine 0.48 0.24 0.50 Uzbekistan 0.63 0.33 0.52 France 1.18 0.82 0.69 Germany 1.20 0.82 0.68 United Kingdom 0.97 0.91 0.94 United States 0.38 0.37 0.97
Source : European Bank for Reconstruction and Development, Transport Operations Policy (London, n.d.),
http://www.ebrd.org/english/opera/sector/top_fin.pdf. Note: Prices refer to 1996 unless otherwise stated; premium unleaded gasoline, where available.
Estimates of the value of carbon emissions taxes vary significantly, from as low as US$ 14 per ton to as high as US$ 265 (Prototype Carbon Fund 2000). The reasons for such variation have to do with the assessment methodology, assumptions about the expected costs of climate change and discount rates, and the anticipated time when carbon emissions actually occur (a ton of carbon emitted in 2010 is considered to do more marginal damage than one emitted in 1990, for example.) The World Bank’s rapid assessment methodology recommends using US$ 20 per ton of carbon abated, but figures in this range generally do not reflect an equity adjustment for the marginal value of a dollar, and are probably therefore somewhat biased against damage in poorer countries (Tol 1999). Tol (1999) estimates marginal values of carbon abatement at between US$ 26 and US$ 60 per ton (depending on discount rate) if equity adjustments are made. This range is

142
closer to those that were discussed in the European Union immediately following the Kyoto Protocol.
Political and economic implications of fuel taxes
Fuel taxes to encourage or discourage behaviour are difficult to implement because they are politically unpopular and because of conc ern about the overall impact on the economy. They are politically unpopular not because most people oppose them or the goals they are trying to attain, but rather because those whose behaviour they are intended to modify have strong motivation to take political action to prevent that modification, while those who benefit from such modification (the public at large) receive too diffuse a benefit to engage in active efforts to influence the policy (Olson 1965). Concern about the economic effects of the tax relate to possible depressive effects on the economy, increased unemployment, and reduction in economic output resulting from the ripple effects from reduction in demand for cars, and possibly reduced economic exchange from reduced car use. These effects need to be weighed against increased availability of funds for expenditure by the entity (government) collecting the funds. It is likely that such effects would be a relatively short-term adjustment, but how much of an adjustment a political economy can tolerate depends on local conditions. Long-run economic efficiency, and consequently productivity, is likely to be significantly increased, but the uncertainty about the transition period and the rarity of such policy in practice suggests that the implied discount rates for such long-run efficiency are minuscule. A number of offsetting policies, however, have been proposed with regard to the specific uses of the revenues raised and a reduction on tax rates of capital investments (Office of Technology Assessment 1994).
Comment [RG18]: Tol, Richard. (1999) "The Marginal Costs of Greenhouse Gas Emissions" in The Energy Journal , Vol. 20 No. 1, pp 61-81. Prototype Carbon Fund (PCF 2000). Price Signals in the Emerging Carbon Market. Information circular from the Prototype Carbon Fund (World Bank).
Comment [RG19]: Olson, Mancur. The Logic of Collective Action . Get full cite

143
Annex X
MENU OF TACTICAL OPTIONS The present annex is intended to provide a more detailed description of specific measures
that might be considered under the tactical framework outlined in chapter IV of this study. As fuel pricing and I and M programmes have been reviewed extensively elsewhere, they are not included here, but both can be integral components of a tactical approach to reducing emissions. All the measures are summarized in table A.14.
Variabilizing costs
Variable costs, other than the cost of fuel, are the most perceptible costs to the individual trip maker of the cost of a trip, and therefore the easiest to equate with the value of a particular trip for the trip maker. For this reason, policies to variabilize costs—that is, transfer the overall life-cycle burden of car-based mobility from vehicle ownership to use—constitute one of the most effective means of addressing excessive vehicle use. This section reviews four such measures for variabilization: parking policy; road pricing; variable-priced insurance and financing payments; and car-sharing.
Parking policy
Of the measures considered for variabilization of costs, parking policy has the most chance for short-term success; it is already familiar to motorists, good practice is well grounded in experience, it is clear-cut to implement, and it is an intervention using the legal authority that most municipalities already possess, even if they do not have the institutional capacity. In addition, implementation of effective parking policy should be self-financing in a relatively short period, or amount to a revenue earner for the municipality.
The basis for using parking policy to influence vehicle use stems from the observation that, for those who own vehicles, ease and cost of parking at the destination is often the strongest determinant of whether a car will be used for a particular trip or trip chain (Cervero 1994). In many developed countries–and in a growing number of out-of-town employment centres in developing countries as well–employer provision of free parking provides a strong incentive to drive to work. Similarly, poor pricing or poor enforcement of on-street parking, particularly in the central business district (CBD)—as is the case in many cities in developing countries—can have a similar effect (see, for example, World Bank 2000.) Poor management of on-street parking can also greatly hinder traffic flow.
For cities with no existing on-street parking management, implementation of such a programme can be one of the most cost-effective measures to discourage excessive use of private vehicles, while enhancing smoothness of flow on urban streets. On-street parking management programmes usually favour short-term parking (under one-hour), using fees and meters to discourage parking for long periods, or all day. All-day parkers must find off-street space to avoid a hefty fine—a service for which they usually need to pay a fee, thereby increasing their marginal costs—or find some other means to come to the central business district. In situations in which employers provide free parking for employees, techniques such as employer cash-out of
Comment [RG20]: Transit-supportive development in the United States : experiences and prospects / Robert Cervero. Berkeley : University of California at Berkeley, Institute of Urban and Regional Development, [1994]. Series title: Monograph (University of California, Berkeley. Institute of Urban & Regional Development).
Comment [RG21]: This is: World Bank, Cairo Urban Transport Note.

144
parking benefits might also be used to help variabilize costs (see chapt. IV, sect. C, for a more detailed review of measures to influence mode choices).

145
Table A.14. Transport emission reduction measures: tactical targets and strategies supported
Menu of measures Tactic Group targeted
Primary strategy supported
Level of government for implementation
Examples Fuel pricing policy Variable cost pricing Fuel users Behavioural National Fuel tax, energy tax, CO2 tax
Parking policy Variable cost pricing Motor vehicle users Behavioural Local On-street parking management to favour short -term parking in intense-use zones; zoning provisions for parking minima in trip-production zones; zoning provisions for parking maxima in trip-attraction zones; taxing parking benefits as ordinary income; parking “cash-out” for employer-provided parking
Road pricing Variable cost pricing Motor vehicle users Behavioural Provincial or national Area (cordon) pricing; distance (odometer) charges; electronic road pricing
Variable insurance and financing Variable cost pricing Motor vehicle users Behavioural National Pay-at-the-pump insurance; odometer -based insurance
Car sharing Variable cost pricing Motor vehicle users Behavioural Local Station-cars; car-sharing organization
Public transport fare/service integration Influencing mode choice Travellers Behavioural Local or provincial System transfers; “Smart” card technology; feeder/trunk structure
Public transport enhancement Influencing mode choice Travellers Behavioural All Dedicated busways; increasing frequencies; increasing geographic coverage
Targeted subsidies for public transport Influencing mode choice Travellers Behavioural Any Vouchers for public transport users; employer-provided subsidies; related discounts or privileges for PT users
Work schedule and location policies Influencing travel choice Travellers Behavioural Any Work-at-home programmes; staggered work schedules; flexible working hours
Traffic management and flow control Changing traffic conditions Motor vehicle operators
Systemic Local or provincial Traffic “calming” to reduce aggressive driving; time-of-day traffic patterns to smooth flow; congestion pricing (pricing roads by time -of-day and location); dedicated busways
Adjustment to vehicle acquisition and registration costs
Influencing fleet demand / turnover
Vehicle purchasers Technical National Emissions or efficiency criteria for vehicle registration fees or purchase taxes; “feebates”; tax credits
Full lifecycle costing Influencing fleet demand / turnover; improving in-fleet
maintenance
Fleet managers Technical Any Lifecycle costing to account for stream of maintenance expendit ures during purchase decisions
Price restraints or quotas on vehicle Influencing fleet demand / Vehicle purchasers Technical Any Ownership “entitlement” auctions; high purchase fees

146
Menu of measures Tactic Group targeted
Primary strategy supported
Level of government for implementation
Examples ownership turnover
Adoption of vehicle emissions standards Influencing fleet supply Vehicle suppliers Technical National Sales-based standards implementation; import-based standards implementation; certification and compliance for implementation burden on after-market
Inspection and maintenance programmes Improving in-fleet maintenance
Vehicle owners / fleet managers
Technical Local or provincial
Mobile enforcement to support inspection and maintenance programmes
Improving in-fleet maintenance
Vehicle owners / fleet managers
Technical Local or provincial Random roadside testing; roadside testing of visually emitting vehicles; remote sensing
Training and education for drivers and fleet managers
Improving in-fleet maintenance
Drivers / fleet managers
Technical Any
Explicit policy to determine what infrastructure is allowed t o go where
Influencing the built environment
Planners / developers
Behavioural All Smart growth; analysis of alternative scenarios of infrastructure investment
Improve functioning and transparency of land-markets
Influencing the built environment
Planners / developers
Behavioural National Cost recovery of infrastructure capital through development fees or in-kind requirements; betterment charges to recoup ordinance-created value; better institutions for land-markets, including cadastral services, land titl ing/deed recording, and impartial adjudication of disputes; development of private sector institutions
Full cost accounting of infrastructure supply and maintenance
Influencing the built environment
Planners / developers
Behavioural Local or provincial Full cost analysis of infrastructure investment, including stream of maintenance payments
Influence household location choices Influencing location choices Households Behavioural Any Tax incentives; location efficient mortgages (LEM); corrections to distortions in housing finance system; location decisions of public services and institutions
Influence firm location choices Influencing location choices Firms Behavioural Any “Reverse” zoning (for example, Dutch ABC policy); tax incentives with "Location Efficiency Zones"; location choices of public services and institutions
Educate the public on transportation, air quality, and lifestyle choices
Influencing public attitudes General public Behavioural All Public awareness campaigns, children's education

147
In practice, off-street parking policy is often set by zoning and land-use policy, rather than as a specific transport demand or emission control measure. Here, the goal has historically been to avoid overloading surrounding streets with excess demand for parking created by vehicle trips “generated” by a new building, by ensuring that the building itself incorporates on-site parking. Zoning codes, therefore, often specify parking minima. For land uses that are trip-attractors, however, not only can such a policy encourage excess vehicle usage, but it can also make walking and using public transport less attractive. For example, if people are obliged to walk from their bus stop on through a sea of parking spaces in order to enter a building, this will discourage the use of public transport. In North America and Western Europe, however, a growing number of jurisdictions are adopting parking maximums, that is, limiting the amount of parking that can be provided in a location, under the assumption that parking induces vehicle trips.
Road pricing
Parking policy helps to variabilize costs by placing a charge on vehicle use; road pricing similarly variabilizes costs by charging for distance driven. Conceptually, the simplest form of road pricing is an odometer tax, charging per kilometre driven. An odometer tax, however, does not adjust for where and when vehicles travel; instead it averages incremental vehicle costs over time and space. Road or facility specific charges are possible through tolls or, in urban areas, increasingly through advanced technology.
In practice, road pricing has been implemented in few places, and rarely as a pure demand management measure to shift cost structure. In Norway, the central portions of Oslo and Trondheim have been “cordoned” off for about 20 years, so that motorists entering the central city must pay a toll, which today is collected electronically from “smart” cards. These cordons, however, were implemented initially not as demand restraints, but rather as a revenue-raising measure to finance the completion of the respective urban roadway networks. Singapore has developed a rather comprehensive scheme of road pricing, in which smart cards mounted in an in-vehicle unit automatically deduct a price when the vehicle crosses an electronic cordon. This electronic road-pricing (ERP) scheme is better described as a generalized road charge than a congestion-pricing scheme per se, because charges are not adjusted to stochastic changes in traffic volumes, although they are periodically reviewed to adjust for traffic congestion trends. A number of cities in the United Kingdom, including Cambridge and London, are also actively considering implementing road-pricing schemes in order to encourage greater use of public transport.
Variable-priced insurance
Another proposed method of cost variabilization is to transform recurring costs—that is, those that are traditionally time-dependent (paid periodically)—into variable costs—that is, those that are use-dependent. The most frequently discussed of these transformation methods, and also the most commercially viable in the near term, is variable-priced insurance. Variabilizing insurance costs by transforming them from a pay-as-you-own to a pay-as-you-drive basis has intuitive logic, since risk of accidents, damage to the car, and damage to people and other property increases the more the car is driven. The most frequently discussed form that variable-priced insurance might take is either a distance-based (odometer) periodic insurance premium, or

148
pay-at-the-fuel-pump insurance. The latter form, however, is incompatible with traditional, fault-based systems of insurance.
Car-sharing
The most extreme form of cost variabilization for motor vehicle use is car-sharing. Car-sharing is an organizational structure for pooled vehicle ownership allowing members access to a range of vehicles for short-term use. Members pay only for the time they use the car, and for distance driven.1 All costs related to the vehicle, including acquisition, financing, maintenance, cleaning and even fuel, are covered by the car-sharing organization itself. In the short run, car-sharing may serve to delay decisions to motorize—that is, to acquire a car for households that have marginal need for one, but would otherwise need to acquire one in the absence of a car-sharing programme. In the longer run, some households may begin to “shed” cars as their vehicles begin to age and break down, or as they approach a critical lifestyle choice, such as marriage, divorce, the birth of a child, or a change of job.
The anticipated air quality benefits of car-sharing stem partially from cost-variabilization—because travellers are confronted with a total set of costs for each and every trip, they may choose to make a number of trips by public transport or by walking—and partially from the potential for better and more appropriate vehicle loading. Car-sharing participants choose the particular vehicle for each and every trip (rather than trying to select one vehicle that can meet the needs of a stream of trips); they can therefore select the most appropriate-sized vehicle for the needs of an individual trip or chain of trips.
To date, car-sharing has been implemented only in certain cities in Europe and North America, as well as Singapore. These experiences are too new to assess the long-term impact, but the short-term effects have been assessed. These assessments show that, as intuition suggests, previously non-motorized households increase their total amount of annual vehicle kilometres travelled by car, and previously motorized households reduce their annual vehicle kilometres. In European car-sharing programmes, these changes have resulted in a net loss in total vehicle kilometres travelled of between 50 and 75 per cent (Zegras and Gakenheimer 1999).
The applicability of car-sharing to developing country contexts is unclear. On the one hand, car-sharing seems to be a promising potential strategy to help stem the rapid growth of vehicle ownership in cities in developing countries. Combined with a well- conceived strategy of two-wheeler adoption or public transport development, car-sharing might be able to play a role in retarding or otherwise offsetting the motorization that would have occurred for a given income level.
On the other hand, a number of factors suggest that car-sharing may not be entirely feasible in cities in developing countries. First, wage rates in many developing country contexts may be sufficiently low that price structures that meet costs may not be competitive with basic
1 In some instances, members may pay an annual membership fee, which, at any rate, is significantly lower than the annual fixed costs they would likely otherwise pay for car ownership.

149
taxi service. This is particularly true where taxi fleets consist largely of very old, poorly maintained vehicles. Secondly, decisions to motorize in many developing countries may be made more with a view to facilitating the productivity of small enterprises linked to households, rather than to expanding household mobility per se. It is not clear whether car-sharing would be a viable option in these cases.
Zegras and Gakenheimer (1999) have analysed the costs of a hypothetical car-sharing programme for Santiago, Chile. Based on assumptions of varying degrees of demand, car utilization, and vehicle-to-member ratios, they develop a matrix matching revenues with costs from a break-even paradigm. They then apply these costs to potential real-world trips in Santiago, and compare them with alternatives such as private car ownership, rentals and taxi trips. Based on their optimality assumptions, they estimate that car-sharing is economically competitive with the private car at 8,250 kilometres per year or lower. These numbers are somewhat lower than those found in Switzerland and Germany (Shaheen and others 1999). Zegras and Gakenheimer (1999) also compare car-sharing with taxi trips. For different trip durations, they estimate distance break-even points for car-sharing against taxi trips, as shown in table A.15.
Table A.15. Price comparison of car-sharing and taxis in Santiago (in dollars)
Trip time (hours) Distance (km) Taxi Car-share
1 4 2.40 2.37 2 7 4.50 4.46 3 10 6.60 6.55 4 13 8.70 8.64 5 16 10.80 10.73
These results do not in and of themselves demonstrate the viability of car-sharing in
developing countries, but they do suggest the strength of the concept, even for emerging countries; they also indicate that car-sharing merits focused experimentation.
Influencing (day-to-day) trip choices Any number of measures can indirectly influence travellers’ choices, by influencing the
context in which those choices are made. For example, policies that affect lifestyle and location choices of households and firms will indirectly influence traveller choices. This section, however, reviews only those measures intended to influence directly the choices travellers make—when, where and how they travel—on a day-to-day basis. The longer-term influences of these decisions—changes in city form and locations of activities—are reviewed below in this annex. Measures to influence the choices travellers make on a day-to-day basis are often grouped under the heading Travel Demand Management, and fall loosely into three categories: incentives to use alternative modes, incentives to change patterns of trip-making, and disincentives to use private cars. Incentives to use public (collective) transportation
Convincing travellers to use publ ic transport is important in markets where most riders are not “captive”—that is, where they have a choice about how to move around. In developed
150
countries, “captive” public transport riders have traditionally been defined as those who do not own a car or have a driver’s licence. In many developing countries, with the growth of informal sector transport operations, such a definition does not apply. Even relatively poor riders with no access to private transportation are not captives of the public transport system.
Well-designed incentives to encourage public transport use can be tricky. While they can involve a combination of enhancing public transport services, “paying” travellers to use alternative modes, or reducing public transport fares (for example, by restraining increases lower than inflation), actual effectiveness will depend on local circumstances. Where baseline fares are low to begin with, for example, demand for public transport services—even among the poor —tends to be more time- than price-elastic. In Cairo, for example, the growth in popularity of informal, micro-bus services at the expense of traditional public buses—despite the fact that the latter are nearly a third less expensive—shows that time sensitivity is an important element, even among the poor; among the poorest two quintiles, micro-bus mode shares are 10 per cent higher than those of conventional buses (Metge 2000). A reduction in fares would be less effective than an increase in service to attract new or retain existing riders. Adequate knowledge of travel behaviour and mode-choice behaviour—through revealed or stated preference methods—is therefore important to identify where public transport resources need to be invested to create effective ridership incentives.2
Fare integration
Instead of reducing fares, authorities may seek to integrate fares (and services), which often amounts to a de facto fare reduction. In fare and service integration, numerous operators and responsible agencies or companies provide services in a metropolitan area for a single fare, often coordinating schedules. Integration allows travellers to pay a single fare for a trip made on several public transport vehicles, regardless of the operator. It is effective in that it amounts to an actual enhancement of service, in addition to being a fare reduction, by allowing some users to take advantage of services they would not have been willing to pay for otherwise.
In developed countries, fare and service integration forms the core of an emerging concept known as mobility management (MM). MM focuses on facilitating multimodal trips in a “seamless” manner. Information technology and intelligent transportation systems (ITS) applications are used so that the traveller finds a multimodal trip almost as convenient as a car. In New York City, introduction of the MetroCard, an electronic swipe card that is usable on the subway, buses, and certain ferries, made free subway-to-bus and bus-to-subway transfers available that had not been available previously. Not only did ridership increase following introduction of the MetroCard but so did revenue for the New York City Transit Authority. As the cost of this technology comes down, applications should become more practicable in developing country contexts as well.
2 Where fare restraint policies lead to resource constraints, maintenance tends to be forgone, breakdowns occur more frequently, and service frequency and reliability suffer. Average time spent travelling increases, generally at faster rates than prices have decreased, resulting in significantly reduced ridership and revenues.

151
In many developing countries, however, institutional arrangements and cooperation among different agencies, operators, and regulators may be more of an impediment to effective fare integration than technology. A sense of competition between operators may limit their willingness to cooperate. In addition, poor data on ridership patterns inhibit the development of revenue-sharing schemes. Nevertheless, there have been numerous successes with fare integration in developing countries, predominantly in Latin America. Curitiba, Brazil, has accomplished effective fare integration without reliance on ITS technology, with a seamless bus transit system for which passengers pay a standardized fare for the whole system, even though it is actually run by nine different private companies. Mendoza, Argentina, and São Paulo, Brazil, have also integrated fares among a number of bus operators.
Enhancing public transport service
Fare integration can be a relatively inexpensive means of producing a service enhancement effect, in some cases increasing both ridership and revenues with minimal expense. Other methods of enhancing service involve adding new public transport routes or increasing the frequency of service on existing routes. Advanced traffic management controls can help with both, if public transport services are to be run on streets in mixed traffic. Bus priority, both as a legal concept inscribed in the highway code and as a strategic choice in traffic management decisions, can also help, but only to the extent that enforcement mechanisms are functional.
Separating public transport from the rest of traffic might be a more effective way of increasing the relative speed, frequency and reliability of public transport. It is also an important signal to land markets that the accessibility created by public transport services is fairly permanent, which can help to encourage land development conducive to public transport use (Cervero 1994). Traditionally, this separation has been accomplished using heavy rail and, more recently, light rail in its own right-of-way. Dedicated busways are not new as a concept, but are considered with increasing frequency in both developed and developing countries, largely because of the prohibitive costs and relative inflexibility of rail investments. Busways are also advantageous because they make buses more competitive with private automobiles (or informal transport), while decreasing costs for operators.
Targeted subsidies for public transport users
Financial incentives are another means of encouraging public transport use. Vouchers could be used, either as an employment benefit, or as a means for compensating the poor. Indeed, vouchers, combined with a cost-recovery fare policy, are a more efficient means of delivering public transport services to the poor than simply restraining fare increases, since the public transport operators would have less of an incentive to cut service because of the perception that certain lines are non-remunerative. In urban areas of Western Europe, North America, and Japan, vouchers or subsidies for public transport use are an increasingly standard part of company compensation packages. Many companies offer these packages because of tax advantages offered by the government if they do.
Incentives to change trip-making patterns

152
How to travel is but one of the day-to-day decisions taken by travellers. When and where to travel are equally as important. Public policy can influence these decisions. For example, policy can encourage employers to use flexible work schedules for their employees: some developing countries in Asia, the Middle East, and North Africa maintain six-day work weeks for public sector employees, in which employees work only half days. Changing official working times in these countries might reduce the overall need to travel. Policy might also encourage employers to develop work-at-home programmes where the technology permits, or to develop neighbourhood “telecommute” or “telework” centres. These centres might be tied directly into vocational training and/or administrative centres, such as Curitiba’s well-known Citizen Streets.
Experience with policies to change trip-making patterns in industrialized countries has been mixed, but the impact has generally been marginal. On aggregate, it is unclear whether such policies have a behavioural effect of reducing the amount of travel by car, although they do seem to have some beneficial effect on car travel during congested periods. In developing countries, experience has been minimal.
Disincentives to private car use
Incentives to use public transport or change patterns of trip-making are most effective when coupled with disincentives to private automobile use. Measures to provide disincentives to private car use, while not popular, can be compatible with efforts to variabilize the costs of motor vehicle ownership and use. In California and other parts of the United States, where on-site parking has traditionally been provided at the workplace, many employers receive tax incentives to offer a parking “cash-out” to employees, whereby employees give up the use of the space in return for an annual cash payment. Taxing the market value of employer-provided parking as ordinary income might help to expand the demand for a parking cash-out option (Shoup and Breinholt 1997).3 As noted above, the development and implementation of an effective on-street parking management programme can also provide an important disincentive to private car use for trips to the city centre or other business locations.
Controlling the flow of traffic
As noted in annex VII above, controlling the flow of traffic can affect air quality, but not
always in predictable ways. Smoothing flow or increasing speeds of traffic along a link can induce more travel. A narrowly drawn policy goal can produce unintended consequences, but even identifying measures to accomplish a stated policy goal can be elusive in the area of traffic flow and congestion. A number of different types of measures can be applied to control the flow of traffic, but their success depends mainly on local conditions and how wisely they are devised.
A well-known example of a poorly designed policy is the “Hoy no circula” programme in Mexico City. Under this programme, vehicle access to central Mexico City is rationed by licence plate number, with permission alternating between odd and even plates on bad air days. The policy effectively encouraged relatively wealthier households to purchase a second car in order to 3 Currently, in the United States, parking of a value up to US$ 155 per month is not considered “remuneration” and is therefore untaxed. While the Clinton administration considered, but rejected, a proposal to change this tax exemption, it did agree to extend a similar tax exemption to public transport benefits paid by the employer, although the taxing threshold is significantly lower.
153
circumvent the restriction. This led to a net increase in the car stock in Mexico City, and probably an increase in off-peak driving because of the increased availability. In addition, Mexico City became a net importer of second-hand cars from the countryside (Eskeland and Feyzioglu 1995). Finally, the policy was regressive, because it penalized only those households unable to purchase a second car, while generating no additional revenue to support or enhance their accessibility by other means.
Successful traffic flow policies are feasible, but may not be intuitively clear to the average motorist, and thus may be subject to strong opposition at first. Traffic calming or slowing, as well as congestion pricing, can all be effective mechanisms to improve flow, but the mechanisms need to be clearly explained. Traffic calming involves physical mechanisms to restrain the speed at which vehicles can travel along a link. These can reduce accident risk—reducing stochastic variability in congestion—as well as reduce the amount of stop and start traffic along the link. In addition, they can make a street more inviting to pedestrians and bicyclists. Traffic-calming measures can include narrowing rights of way, raising and installing more frequent crosswalks, shifting the through lane in the right-of-way, installing street trees, and altering the flow of traffic so that vehicles are forced to turn periodically.
Congestion pricing is also a feasible means of smoothing traffic flow changes, as noted in chapter IV of this study. Congestion pricing involves charging each motorist the marginal cost of the amount of delay he or she imposes on other motorists during congested conditions. Numerous applied and theoretical schemes exist to implement these charges (see World Bank 2001 and Button 1982 for more details).
Influencing vehicle fleet demand and turnover
Public policy can influence fleet demand with regard to the kinds of vehicles preferred, the speed with which they are turned over, and the rate at which private motor vehicles penetrate the population. Policies that are most often discussed include changing the structure of vehicle acquisition and registration fees to favour more environmentally benign vehicles, changing the way fleet vehicles are procured and maintained for public and large private fleets and, for better or worse, pricing or quotas to restrain car ownership. Tax incentives, “feebates” and other adjustments to vehicle registration costs
Most countries maintain fees to register vehicles, and these fees are often based on characteristics of the vehicle such as engine size and displacement or gross vehicle weight. The inclusion of emissions or energy-efficiency criteria in these registration fees has been proposed and studied extensively in a number of developed countries. These may be simple tax incentives, as proposed recently in the United States for purchasers of hybrid electric and other energy -efficient technology, or complex changes to the structure of acquisition taxes and registration fees to provide a strong incentive to purchase cleaner or more efficient vehicles. The “feebate” has been studied extensively for the United States, and proposed for a number of countries in the OECD, including Japan, and applied in a select number of cases. Feebates adjust registration fees from an average baseline, so that they impose a “fee” on high-emitting or energy -intensive vehicles, and provide a “rebate” to purchasers of low-emitting or energy efficient vehicles. Feebates may be particularly conducive to strategies favouring alternative fuels. Table A.16, from

154
the OECD (1997), shows a number of different feebate schemes for various countries in the OECD.
A feebate scheme has also been proposed for Japan. Under this scheme, a “neutral” point is established for each class of car, as categorized according to engine displacement. Actual fees paid then would be a function of the fuel economy in relation to the “neutral” point, so that average fees collected for the car class would remain unchanged. This feebate structure is shown schematically in table A.17.
Variants of feebates have been applied in the Netherlands, Germany, the United Kingdom, Austria, and some Scandinavian countries. In Germany, feebates were used as a means to implement a strategy of catalytic converter adoption, alongside subsidies to convert uncatalysed cars and changes in fuel tax to disfavour leaded gasoline. A number of countries (including France, the United States and Canada) provide special tax discounts or exemptions for purchasers of particular types of vehicles, such as those using CNG or electronic vehicles. The author is unaware of any examples of feebates in developing countries.
Full life-cycle costing for fleet vehicles
Fleet vehicles, such as those owned by large companies (for own-account transportation), trucking concerns, governments, and public transport operators, are traditionally procured with an outlay from a capital budget, following price competition on an initial capital asset, which depreciates over a useful life (usually 12 to 15 years for an urban fleet vehicle). Funds for maintenance of the vehicle, which may be handled in-house or procured separately, are accounted for and allocated from a separate operating or maintenance budget. In extreme cases, the staff who procure vehicles may have no contact with those who maintain them.
Table A.16. Feebate options evaluated in Europe and North America
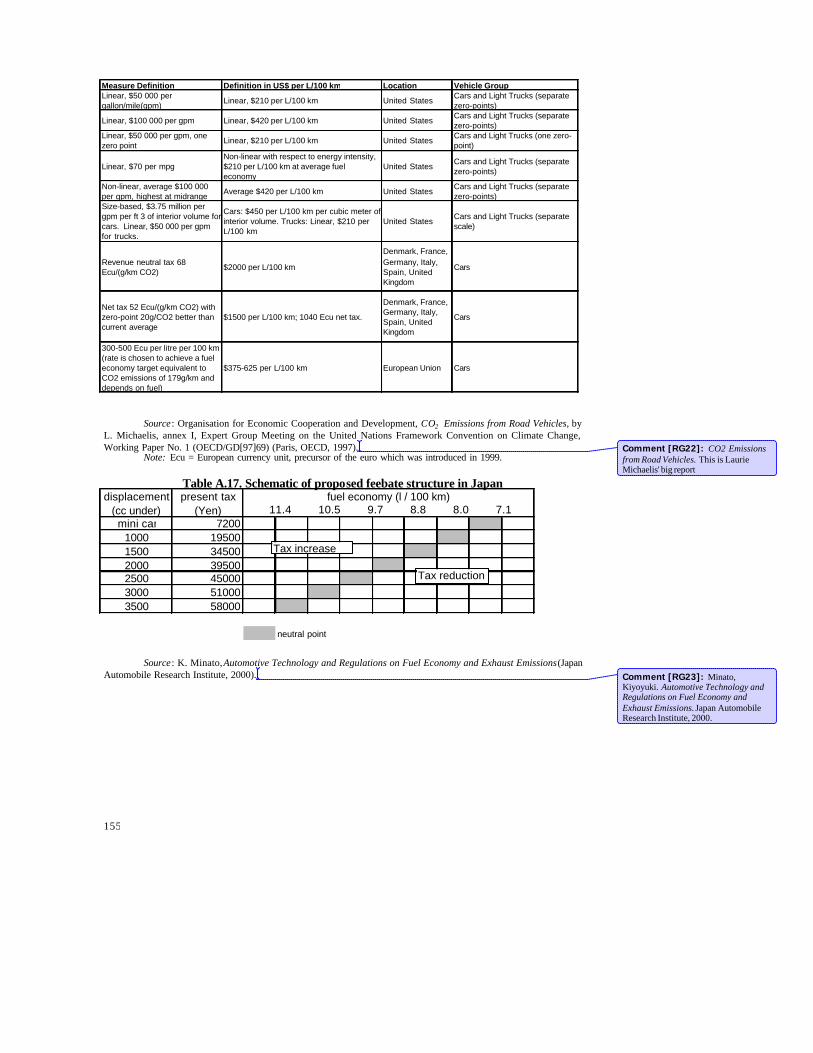
155
Source : Organisation for Economic Cooperation and Development, CO2 Emissions from Road Vehicles, by
L. Michaelis, annex I, Expert Group Meeting on the United Nations Framework Convention on Climate Change, Working Paper No. 1 (OECD/GD[97]69) (Paris, OECD, 1997).
Note: Ecu = European currency unit, precursor of the euro which was introduced in 1999.
Table A.17. Schematic of proposed feebate structure in Japan
Source : K. Minato, Automotive Technology and Regulations on Fuel Economy and Exhaust Emissions (Japan
Automobile Research Institute, 2000).
Measure Definition Definition in US$ per L/100 km Location Vehicle GroupLinear, $50 000 per gallon/mile(gpm)
Linear, $210 per L/100 km United StatesCars and Light Trucks (separate zero-points)
Linear, $100 000 per gpm Linear, $420 per L/100 km United StatesCars and Light Trucks (separate zero-points)
Linear, $50 000 per gpm, one zero point
Linear, $210 per L/100 km United StatesCars and Light Trucks (one zero-point)
Linear, $70 per mpgNon-linear with respect to energy intensity, $210 per L/100 km at average fuel economy
United StatesCars and Light Trucks (separate zero-points)
Non-linear, average $100 000 per gpm, highest at midrange
Average $420 per L/100 km United StatesCars and Light Trucks (separate zero-points)
Size-based, $3.75 million per gpm per ft 3 of interior volume for cars. Linear, $50 000 per gpm for trucks.
Cars: $450 per L/100 km per cubic meter of interior volume. Trucks: Linear, $210 per L/100 km
United StatesCars and Light Trucks (separate scale)
Revenue neutral tax 68 Ecu/(g/km CO2)
$2000 per L/100 km
Denmark, France, Germany, Italy, Spain, United Kingdom
Cars
Net tax 52 Ecu/(g/km CO2) with zero-point 20g/CO2 better than current average
$1500 per L/100 km; 1040 Ecu net tax.
Denmark, France, Germany, Italy, Spain, United Kingdom
Cars
300-500 Ecu per litre per 100 km (rate is chosen to achieve a fuel economy target equivalent to CO2 emissions of 179g/km and depends on fuel)
$375-625 per L/100 km European Union Cars
displacement (cc under)
present tax (Yen)
mini car 72001000 195001500 345002000 395002500 450003000 510003500 58000
neutral point
fuel economy (l / 100 km) 11.4 10.5 9.7 8.8 8.0 7.1
Tax increase
Tax reduction
Comment [RG22]: CO2 Emissions from Road Vehicles. This is Laurie Michaelis' big report
Comment [RG23]: Minato, Kiyoyuki. Automotive Technology and Regulations on Fuel Economy and Exhaust Emissions. Japan Automobile Research Institute, 2000.

156
This dichotomy between acquisition and maintenance can have perverse effects on both
maintenance schedules and/or replacement strategies. Neither vehicle procurers nor maintenance managers have any incentive to find the optimal combination of repairs and replacement that minimizes costs while meeting a standard of operational and environmental performance. Each pursues his or her mandate in isolation.
Changing the way fleet vehicles are procured, therefore, can be an important practical measure both to ensure adequate fleet turnover as well as in-fleet maintenance. Own-maintain leasing arrangements, for example, combine ownership and maintenance functions in one entity, and separate it from the operator. Under these arrangements, a fleet operator, like a public transport agency, leases a set of vehicles from a supplier for a set period of time (for example, 10 years). The supplier undertakes a performance contract under the lease to guarantee that the vehicle remains functional to an agreed level of performance. In other words, the operator leases a vehicle service from the supplier, who has a built-in incentive to find the right combination of vehicle maintenance and replacement so as to minimize costs while contractually meeting his service obligations. In effect, this structure forces the operator to take into account the stream of maintenance payments expected over the life of the vehicle, as well as the amortized purchase price, providing a more realistic assessment of its expected costs. Since environmental performance, such as emissions, can be included, this structure of procurement might facilitate better maintenance of the in-use fleet. Restraining vehicle ownership through pricing/quotas
Trying to limit vehicle ownership through either taxation or mandates is a potential minefield of unintended consequences due to poor conception, poor implementation, or both. If poorly conceived and implemented, such a policy might discourage vehicle turnover, encourage excess vehicle use, or foster development of a black market. Nevertheless, in some instances, notably in Singapore, wise and well-targeted measures have proved effective. Since 1990, Singapore has auctioned “entitlements” to own a car, which are valid for 10 years. The price for any given round of entitlement auctioning, which is rationed according to the amount of road space constructed on the island, is set at the lowest of the accepted bids.4 Motorization rates in Singapore remain very low—about 125 cars per 1,000 persons—despite a per capita GDP of over US$ 26,000.5
Setting and enforcing standards for vehicle emissions and fuel economy
Existing standards
Because of the rich and varied experience in developing and implementing standards in the United States, Europe and Japan, developing countries need not develop completely new vehicle emissions standards; most developing countries with standards choose to adapt them from either the United States or Europe (or, in many cases, both). Standards are generally established for different types or classes of vehicles (for example, cars, light-duty trucks, medium-duty
4 Bids are accepted, according to amount, until all available entitlements have been allocated. 5 See Statistics Singapore (http://www.singstat.gov.sg/FACT/SIF/sif.html).

157
trucks, and heavy -duty trucks), with limits specified in grams of a pollutant emitted per unit vehicle distance travelled, or per unit of engine power output in the case of medium- and heavy-duty trucks. For cars and light-duty vehicles, diesel and gasoline emissions standards are usually specified separately. European regulation through the 1980s also distinguished between engine sizes, in an effort to support ongoing energy efficiency incentives. Comparative European, United States and Japanese standards are shown in figure A.XVIII.
Figure A.XVIII. Car emission standards in Japan, the European Union and the United States, 1990-2000
Source: Cited in M. Nevin and M. Barrett, Global Vehicle Emissions: Commercial Opportunities from
Emissions Regulations (London, Financial Times Automotive, 1999). Factors in selecting standards
A number of factors need to be considered in choosing a set of standards. First, and most
important, is the question of whether the standards are intended to lead (or force) technological change (technology -forcing), or whether they simply are intended to ensure that the best available technology is used (technology -following) (Faiz and others 1996). Historically, European standards, initially through the Economic Commision for Europe and then the European Union directives, have been technology -following, while standards set in California, and to some degree the United States as a whole, have been technology -forcing. Whether forcing or following, technical standards should be developed and phased-in so as to allow the most cost-effective solutions to be implemented first (Eskeland and Derevejan 1996). Secondly, product cycle and development time have a crucial impact on the responsiveness of car suppliers; all else equal, the more lead time, the more willingly they would accept any given set of standards. Even for countries with little domestic production of vehicles, manufacturers and importers may still require significant lead-time to make adjustments to their regional or international distribution strategies.
Thirdly, an effective testing and certification programme needs to be in place in order to
give teeth to the enforcement of standards. Testing and certification procedures in the United States and European Union are complicated, and constantly undergoing refinement. In both regions, prototype vehicles provided by manufacturers wishing to sell cars within the jurisdiction are tested in a standardized setting (such as the Federal Test Procedure). The results are then assigned to the entire class of vehicle, and these emissions “ratings” are then used to determine compliance to the implementation standards as reviewed below. The European Union requires
158
only that new vehicles undergo certification testing; by contrast, the United States mandates ongoing in-use surveillance of vehicles through random sampling and threat of vehicle recalls. Recently, the EPA proposed a substantial modification of the system of compliance, by relaxing certification test requirements for new vehicles in return for more after-market surveillance of vehicle emissions, and greater company liability for these results (through the proposed Compliance Assurance Program (CAP 2000).
Fourthly, vehicle emissions standards must recognize the actual and potential availability of fuel of sufficient quality to enable those standards to be met. In practice, this means that vehicle standards must be set in concert with realistic fuel standards and specifications. For example, NMHC and CO levels might be set so as to force the adoption of catalytic converters; without the availability of lead-free fuel, however, such standards may be unattainable. Some vehicle emissions standards may also be able to be met in large part by changing fuel composition (for example, oxygenation of fuels to reduce hydrocarbon emissions). Creative emissions permitting and trading solutions might permit the vehicle manufacturers, in concert with fuel refiners via a market mechanism, to select the least expensive means of meeting these standards.
Fifthly, an important lesson learned from industrialized country experience is that how vehicles are classified or “binned” can be as important as the standards set for each bin themselves. In the United States, Japan, and Western Europe, regulation of light-duty vehicles has tended to either be more lax or several years behind that of cars. In Japan, car-buying behaviour shifted away from the standard, small-family vehicle, to medium- and light-duty vehicles (supplemented with a “mini” car for the household’s second driver) throughout the 1990s. While these shifts in part reflect changes in consumer tastes and technological improvements that make medium- and light-duty vehicles in Japan more practicable (and affordable), the differences in applicable emissions standards have affected the relative costs of the vehicles, depressing the income threshold at which consumers would have jumped categories in the absence of these differential standards. In the United Stat es, too, sales of sports utility vehicles (SUVs), regulated as light trucks rather than as cars, were particularly strong throughout the 1990s, so that light trucks as a class, which constituted about 20 per cent of new vehicle sales in the 1970s, currently account for nearly 50 per cent of new car sales.6 As in Japan, it is likely that the differently applied regulations change the relative costs of the two classes of vehicles for consumers looking for certain attributes, such as power, performance, or size. It is also likely that the threshold criteria for shifts to SUVs have been shifted as a result of changes in costs. Thus, the binning of vehicles into different categories and the phasing-in of standards for them need to be harmonized in order to avoid inappropriate market signals.
Sixthly, because industry is likely to argue that standards will impose enormous compliance costs (costs borne ultimately by the consumer), standards should be adopted only with rigorous and thorough economic evaluation of different scenarios of standard-setting, and in comparison with other possible measures (Lovei and Kojima 2000). Industry acceptance will be much more likely, however, if the standards proposed help companies to build regional strategies. Thus, to the extent that standards can be harmonized regionally, so that individual countries’ standards are not incompatible with others, the more industry will support them.
6 The United States has moved recently to tighten emissions regulations for sport utility vehicles, but these vehicles remain exempt from fuel economy standards under CAFE (corporate average fuel efficiency).

159
Implementation of standards
The implementation of standards can be complex, because any number of combinations of compliance criteria can be adopted. In addition, if there are multiple jurisdictions (for example, a metropolitan area with substantially worse ambient air problems than the rest of the country), different compliance standards might be made applicable to different areas. In general, standards can be implemented through command-and-control measures, market-based incentives (MBIs), or some mixture of the two. Command-and-control measures impose fines on firms or manufacturers not in compliance with a given standard. They are administratively straight-forward, but can impose significant costs on smaller firms with less ability to transfer resources internally. For this reason, some jurisdictions actually exempt small manufacturers from compliance with regulations for a period of time. Alternatively, standards may be enforced through MBIs, usually understood as a system of tradable permits under a cap-and-trade regime. Under these schemes, firms that exceed the standards or performance criteria can sell credits to firms that do not, producing a net (industry-wide) effect at the level of the original performance criteria. While much has been written on MBIs, worldwide, nearly all standards are enforced via traditional regulatory means.
Whether command-and-control or MBI, emissions standards are implemented on sales standards based on fleet minima, averages, or both. Minima require a certain proportion of the fleet sold by any single commercial entity to match a given standard or set of standards. Examples include implementation of the tier I standards in the United States, or the Euro II standards in Europe. Differentiated standards across fleets according to certification bins, increasingly becoming the norm in the United States, were originally intended to be implemented in California according to fleet minimum requirements as well (the so-called “LEV [low emission vehicle] mandates” of the early 1990s).
Fleet averaging schemes are more complex, but more flexible, in that manufacturers need to ensure only that the average performance of new vehicles sold in a country or other geographic unit meets a given standard. The manufacturer, therefore, has some room to manoeuvre in determining how to meet such standards. CAFE standards in the United States, and the European Union’s voluntary agreement with ACEA, JAMA (Japanese Automobile Manufacturers Association), and KAMA (Korean Automobile Manufacturers Association) have been set in this manner. Implementation of the new low-emission ve hicle standards (LEV and NLEV) in the United States, however, involves a hybrid of fleet minima and averaging criteria.7
For developing countries, several adaptations to sales-based criteria might make sense. First, an MBI approach might help eliminate some of the regulatory complexity associated with sales-based criteria, and thus make them easier to implement by resource-constrained regulatory agencies. Secondly, because of the market importance of second-hand cars, even among those that are entering the developing country market for the first time, sales-based criteria that focus
7 At certification, vehicles are assigned to an emissions bin (transitional-, low-, ultra-low-, and zero-emissions vehicle). Fleet averages must conform to the appropriate non-methane organic gases (NMOG) standard (Federal or California, depending on the programme), but manufacturers are free to choose the blend of different bin classes they try to sell in order to conform to the fleet average standard.

160
only on newly manufactured cars may be too limiting. Fleet minima or averaging standards may need to be applied to vehicle importers, rather than to manufacturers per se. Effective certification and compliance as well as inspection and maintenance would, of course, be necessary for enforcement.
Other import-based measures might also be considered as alternative, if less comprehensive, means of implementing standards or otherwise influencing vehicle supply. These might include an outright ban on importation of vehicles not meeting standards (or those of an excessive age) or using tariff incentives and disincentives to affect the price according to emission characteristics. An important factor in the cost-effectiveness of any such programme is the screening method used. One approach—similar to the sales-based approach reviewed above—is to screen only representative vehicles of particular models and model years, and to set proportional or averaging standards based on those results. A second approach would be to use manufacturers’ estimates of the deterioration rates of emissions. Both of these rely on I and M programmes and market forces to ensure that every vehicle is in com pliance. A third approach would be to reduce the burden of certification testing for the importer, but to require him or her to demonstrate, through follow-up tests of on-road vehicles, compliance with import standards. Poland adopted a variant of this approach in 1995 in response to a large influx of used vehicles from Western Europe. Used vehicles were not subject to type approval, but were required to undergo a pre-registration inspection as part of a broader I and M programme. Vehicles could be registered only if they met particular standards for idle CO, NMHC, and air-fuel equivalence ratio (?) for gasoline-fuelled cars, and smoke level for diesel. While not explicitly an import-based measure, the policy amounted to a de facto control of used vehicles (OECD/UNEP 1999).
The stringency of any import restrictions needs to be weighed against the quality of the vehicle fleet already in a country. All else equal, encouraging turnover of the vehicle fleet is desirable, and stringent restrictions on imports may discourage vehicle retirement. Eight-year-old vehicles may not be ideal, but if restrict ing their importation effectively means keeping more 15-year-old vehicles on the road longer, the restriction may not make sense. Import-based measures, therefore, need to be constructed carefully with regard to the actual emissions characteristics of the on-road fleet. This, in turn, implies the need for information about existing fleet characteristics.
Improving maintenance of in-use vehicles
The core of any policy to ensure adequate maintenance and upkeep of the existing vehicle stock is the inspection and maintenance programme. Because it is so integral to any air quality policy in the transport sector, it is reviewed separately in annex V to this study. The present section focuses on additional policies that governments may adopt to help ensure adequate maintenance of in-use fleets. These include mobile enforcement, and training for drivers and fleet managers. In addition, full life-cycle costing during vehicle procurement, as noted above, can also be effective in ensuring better maintenance practices for larger fleets.

161
Mobile enforcement
Mobile enforcement of tailpipe emissions can be implemented either as an interim strategy in setting up an I and M programme, or as a supplemental enforcement mechanism to an established I and M programme. Both applications involve some form of roadside testing, in which vehicle exhaust is rapidly analysed for carbon monoxide, hydrocarbons, and opacity (black smoke)—an indicator of particulate matter present in exhaust. How vehicles are identified for such tests can vary. In some instances, such as mobile enforcement programmes in Brazil, trained police in specially equipped vehicles can pull over vehicles that appear (visually) to have excessive emissions (such as black smoke from the tailpipe), and then test those emissions. Roadside testing stations have also been established, and either visually offensive vehicles or a random sample are pulled over and tested. In many instances, results from these tests may not have the force of law, because the test cycle is not standardized. However, they can provide an indication that the vehicle is not up to code, and can be used as a means for determining which vehicles need to undergo a more thorough I and M test.
Remote sensing of tailpipe emissions, in particular CO and HCs, is another, less intrusive, means of mobile enforcement. The technology is still being developed and improved, and has not been implemented in widespread application as yet. The technology uses infrared light to analyse the exhaust gases of a vehicle as it passes the checkpoint. Its licence plate is photographed, so the owners can be contacted in the event of failure. These owners would then need to have their vehicles properly tested at an I and M testing station. Because remote sensing technology cannot determine whether a vehicle engine is under heavy load at any particular instance, it is susceptible to a high “false positive” rate, potentially undermining the credibility of the mobile enforcement system. Technical development and refinement of remote sensing systems, however, may be undermined by the proliferation of on-board diagnostics, which has been mandatory for new vehicles in the United States since 1996.
Training and education for drivers and managers
Training programmes for drivers and fleet managers can help to improve on-road energy efficiency of trucks and buses, improve maintenance practices, and cut costs for operators. Programmes to help drivers to learn about aerodynamic loading, proper maintenance of tyre pressure, protecting their vehicles from adulterated or lower grade fuels, and better driving patterns can substantially improve vehicle performance and cut down on risk of accidents. For many developing countries, driver and fleet manager training might be the most cost-effective and rapid means of effecting fuel efficiency improvements and reducing emissions from the heavy-vehicle sector.
Brazil has undertaken two such programmes, under the auspices of the National Programme for Rationalization of the Use of Petroleum (CONPET), which are oriented specifically towards efficiency improvements. The Siga Bem programme, targeted at individual driver/owners, involves training programmes and voluntary vehicle testing at about 100 filling stations of Petrobras, the Brazilian national petroleum company. Drivers can receive training on vehicle aerodynamics, economic driving behaviour, avoiding fuel contamination, daily and periodic maintenance, and keeping track of fuel consumption. A second programme,

162
ECONOMIZAR, offers similar training to fleet managers, such as bus dispatchers, through the National Transportation Confederation. While quantitative assessments of these programmes have not been carried out, demand for expansion of these programmes has been strong, suggesting that they create significant economic benefit to recipients in the form of fuel and other operating cost reductions (Touma 2000).
Influencing urban development
This section reviews three particular policy strategies for influencing the supply side of urban development: the location of infrastructure; traditional land-use planning and regulation; and cost-recovery in infrastructure provision.
Location and amount of infrastructure provision
One of the most straightforward ways that public policy can influence the built-environment is through the choice of public infrastructure provision: what infrastructure will be provided where. Even in institutional environments where the enforcement of regulations—traffic as well as land use—is highly uncertain, provision of infrastructure, in terms of roadways, electricity, sewerage and water services, is a highly influential sculptor of built form, because it influences underlying land values. In a classic urban system, land consumers trade off accessibility (for example, to the city centre) with costs of rent (Alonso 1964), and other features, such as space or amenities. Since transport infrastructure can significantly influence accessibility, it is an important determinant of land values and, consequently, the kinds of land uses and building forms that are viable in different locations. This influence is particularly important in new or fast growing parts of metropolitan regions.
In many cities in developing countries and transition economies, transport infrastructure
is proposed, and occasionally provided, in response to perceived transport needs (for example, a given part of a city is perceived to be too congested, or a particular facility is too isolated). Assessments of the proposed infrastructure solution too often narrowly consider the goals of a given project without adequate consideration of the kinds of land-value and land-use changes such infrastructure would bring about. In other words, in carrying out transport planning in order to respond to particular perceived needs, policy makers and authorities often fail to understand the powerful influence that transport infrastructure has on the built environment—that which is not yet even planned—for decades.
Some examples of infrastructure planning as an instrument of urban and land-use planning do exist, however. In Singapore, policy makers have limited the amount of investment in transport infrastructure as part of a deliberate public policy, seeking a target of about 12 per cent of the land area to be devoted to road transport (Willoughby 2000b). In Curitiba, Brazil, planners used the development of bus corridors as a focus for commercial land uses, while using the overall structure to strengthen the position of the city centre.
In many countries, decisions about different types of urban infrastructure investment are made by different levels of government. While infrastructure decisions may be made at the local as well as national levels of government, higher levels of government can provide a policy framework for coherent infrastructure investment. The “smart growth” movement in the United
Comment [RG24]: This is Touma, Joao Eudes, personal communication.

163
States is based upon the development of supportive policy frameworks at higher levels of government. The State of Maryland’s smart growth policy requires counties and cities to designate growth and non-growth areas according to strict criteria. Subsequently, State agencies are prohibited from helping to finance infrastructure investments, or themselves from making infrastructure investments, in areas not previously designated. Localities are not prevented from making their own investments wherever they wish—if they were, the sense of encroachment on local prerogative might have led to a political struggle. The State, however, provides a strong incentive for localities to respect their own designated areas of growth, through the power of the purse.
Land-use planning and regulation
Traditional land-use regulation is another useful tool to influence the built environment in a manner that might favour more sustainable forms of transportation. This includes a range of instruments, including “structure” or general plans, local plans, and zoning codes. The effectiveness of these land-use regulatory instruments in developing countries, however, has been mixed. In many instances, enforcement mechanisms are weak; in others, regulations have been too ambitious for income levels of target populations to be able to afford (Dowall 1995). Both lead to widespread disregard of formal codes. In addition, if regulatory codes are too stringent relative to the actual use-value of property in the absence of regulations (affected largely by transportation and other public investments), local policy makers will be under significant, long-term pressure to change them, pressure to which they may eventually yield. In most political environments, therefore, land-use regulation cannot compensate for poor infrastructure investment decisions over the long run.
Cost recovery in infrastructure provision
Infrastructure adds value to surrounding property; decisions about where to locate infrastructure facilities thus have a significant impact on the distribution of land values in a sub-region of a metropolitan area. Public investment in transport and other infrastructure can amount to a transfer of resources from public to private hands if no mechanism is in place to recoup, at least somewhat, the cost of the investment. These transfers can be distortionary, in that they encourage land development in locations and build-out patterns that contribute to excessive vehicle use.
Recovering these costs, therefore, can help reduce such distortions. Two such recovery mechanisms are development fees and in-kind requirements. Development fees are fees charged to developers for the relative burden the proposed development is anticipated to place on existing or planned infrastructure. In-kind requirements are conditions placed on the issuance of a building permit, requiring the developer himself to make infrastructure investments in relation to a given development. These in-kind investments usually refer to secondary, or, in some cases, primary infrastructure. Tertiary, or on-site, infrastructure is usually considered to be the responsibility of the developer anyway.
Development fees and in-kind requirements are highly imperfect mechanisms. They may
not sufficiently internalize the cumulative (collective) burdens on infrastructure caused by development. For example, the effects on traffic in a particular analysis zone caused by a single
164
development may be easily quantifiable, and an appropriate impact fee or in-kind requirement assessed. However, the cumulative effects of many developments may be significantly greater than the sum of the individual effects, and these cumulative effects would remain unpriced. Some distortions may remain, therefore, even with infrastructure cost-recovery mechanisms in place, which could contribute to excessive vehicle use.
The risk of uninternalized cumulative effects distorting the transport/land-use system is
heightened if the use of development fees and in-kind requirements is substituted for sound planning and infrastructure development decisions, rather than used as a mechanism to help finance these. In some jurisdictions making extensive use of these mechanisms, fees and in-kind requirements are understood as “mitigation” measures: developers may proactively use offers of in-kind services or payment of impact fees as mechanisms to ensure the approval of individual projects, even though such projects may not make sense in the larger framework of a longer-term structural plan. (See Gorham 1998 for more detail on land-use control mechanisms.) Function of and transparency in land markets
Tightly interwoven with the ability of transport infrastructure to influence the built
environment and the ability of government to assess appropriate cost-recovery mechanisms is the question of transparency in land-market transactions (Dowall 1995). These aspects of the land market have been identified as serious problems in the context of facilitating housing and property markets (World Bank 1995), but it should be recognized that poor functioning of land markets often has potentially very damaging, long-lasting effects on the provision of transport infrastructure and on air quality. Around the world, local corruption frequently centres around land transactions, the value of which is strongly influenced by the provision of transport infrastructure. Landowners and speculators have strong financial interest in influencing the location of different types of transport facilities; similarly, officials charged with making transport decisions can be strongly tempted to make unethical investments in affected land markets. This corruption is facilitated by lack of transparency in the land markets.
Transparency in land markets is ensured by a number of institutions, both public and
private, which help ensure the smooth functioning of transactions. The functions served by public institutions include cadastral services (surveying and official designation of property boundaries), land titling and deed recording/registration, and impartial adjudication of disputes. Functions served by the private sector include title insurance, appraisal, and market brokerage, facilitation, and clearing services. Full-cost accounting of infrastructure supply and maintenance
An emerging technique for the assessment of land-development patterns is full-cost
accounting of infrastructure supply and maintenance, particularly for hypothetical alternative patterns or location of development. The origins of this technique are contained in a famous study carried out in the United States in the 1970s. “The Costs of Sprawl” by Anthony Downs (RERC 1974) described techniques to apply a full-cost accounting framework. The United States Federal Highway Administration, in conjunction with an update of the costs-of-sprawl study, has begun to investigate these techniques (FHWA 1998). The framework uses unit costs associated with particular patterns of development, mixes of building types by residential and non-residential sectors, projections of land consumption, projected water and sewer consumption, and projected transport costs, projected out over 25 years, to compare the net present value of different forms of land development patterns. The framework was developed for the United States, but could easily be adopted for application in rapidly growing metropolitan regions in developing countries. A refinement of the framework would be to account for additional infrastructure needed because of air quality degradation (for example, additional hospital beds needed to meet projected demand).

165
Influencing location choices
Location-efficient mortgages
In many housing finance systems, banks and other mortgage lenders are constrained by
rules established by institutions governing the secondary mortgage market. In the United States and elsewhere, these rules have traditionally been applied equally and universally, without regard to urban context. Thus, the underwriting criteria for a mortgage in a central city are the same as those for one in a suburban location, even though the distribution of household expenditures may be quite different. Specifically, households in locations where automobility is a necessity may have additional transportation expenditures greater than those in dense, mixed-use neighbourhoods with proximity to public transport. The Institute for Location Efficiency argues that household expenditures on transport, however, are lower in “location-efficient” suburbs than in traditional suburban locations. This savings is available to pay down the mortgage, but conventional rules do not recognize it. Consequently, a two-year experiment is under way in selected cities in the United States (Chicago, Se attle and San Francisco) to offer a special location efficient mortgage (LEM) for purchasers of houses in the city centres close to public transport, sponsored by the largest purchaser of mortgages on the secondary market.
For developing countries, the LEM is an intriguing concept in instances where the mortgage finance system is relatively well developed, household expenditures can be quantified and localized with reasonable accuracy, and decentralization is a problem affecting predominantly the formal sector. It is too early, however, to gauge how effective it will be in the context of the United States; it is possible that if it generates too much demand for public transport accessible locations, increasing housing prices may wipe out any gain created by the programme. Reverse zoning
Conventional (supply-side) zoning as a land-use control is parcel-specific: it regulates the
kinds of uses that can locate on any particular parcel. Demand-side zoning would reverse this relationship, regulating the kinds of parcels that can host different types of uses. In other words, the regulation is tied to the activity, not (or not exclusively) the land. A form of this type of regulation has been applied, with limited success, in the Netherlands. Under a policy known as ABC, businesses and development parcels are assigned into one of three categories (A, B or C), depending, in the former case, on the type of business and aspects of its operation and, in the latter, the location of the parcel relative to regional transportation infrastructure. Activities that do not require substantial car- or truck-based access as part of their core business (“A” activities) can only locate on parcels that are easily accessible by public transport (“A” parcels).
Extensions and elaborations of reverse zoning schemes are also envisionable. For
example, a system of market-based incentives built on the reverse-zoning concept might be feasible. Companies locating in a “location-efficient” site might receive marketable emission credits. Similarly, location fees or corporate taxes could be adjusted to reflect the marginal costs imposed by a location choice for an “A” firm on the rest of society. Location choices in provision of public services
Location-efficient mortgages and reverse zoning try to influence, respectively, where
households and firms locate. The public sector, however, also makes decisions about where to provide services and locate facilities, from the national or federal down to the very local levels. An important measure, therefore, is self-monitoring of location choices by public entities.

166
In Curitiba, Brazil, the authorities have developed an innovative method for focusing
public sector location choices in a manner that supports public transport use and the overall need for travel reduction. The “Citizen Street” is an enclosed structure, generally designed along a central axis, like a mall, except with a civic, rather than commercial focus. Federal, State, and city agencies that regularly need to interact with citizens are located there, providing a one-stop destination for conducting official business, including getting permits, applying for housing, registering for public schools, making tax payments, applying for a driver's licence, making inquiries with public utilities, visiting the municipal library or post office, and even filing a claim in small claims court. They also contain some (small-scale) commercial facilities, community meeting rooms (for example, for civic associations) and neighbourhood recreation centres.
Because Citizen Streets are decentralized (seven of them are planned around Curitiba)
and are integrated into Curitiba’s well-known bus system, they effectively allow government services to be decentralized from the city centre, yet be recentralized in outlying areas in order to minimize the need to travel and allow public transport to be used.

167
REFERENCES
ACEA (European Automobile Manufacturers Association), Alliance of Automobile Manufacturers, Engine Manufacturers Association (EMA), and Japan Automobile Manufacturers Association (JAMA). 2000. World-Wide Fuel Charter. Brussels, European Automobile Manufacturers Association.
Alonso, W. 1964. Location and Land Use: Toward a General Theory of Land Rent. Cambridge (Massachusetts), Harvard University Press.
Argonne National Laboratory. 1999. Transportation Fuel-cycle Model. ANL/ESD-39, vols. 1 and 2. Argonne (Illinois).
Ang, B.W. 1996. Urban transportation management and energy savings: the case of Singapore. In International Journal of Vehicle Design, vol. 17, No. 1 (1996).
Aschauer, D.A. 1989. Is public expenditure productive? In Journal of Monetary Economics 23: 177-200.
———. 1990. Public Investment and Private Sector Growth: the Economic Benefits of Reducing America’s “Third Deficit”. Washington, DC, Economic Policy Institute.
———. 1991. Transportation Spending and Economic Growth: the Effects of Transit and Highway Expenditures. Washington, DC, American Public Transit Association.
Bagley, S.T., K.J. Baumgard, L.D. Gratz, J.J. Johnson, and D.G. Leddy. 1996. Effects of fuel modification and emission control devices on heavy -duty diesel engine emissions. Research Report 76. Cambridge, MA: Health Effects Institute.
Baldassare, M., S. Ryan, and C. Katz. 1998. Suburban attitudes toward policies aimed at reducing solo driving. Transportation 25 (1) (February).
Banaszak, S., U. Chakravorty, and P. Leung. 1999. Demand for ground transportation fuel and pricing policy in Asian tigers: a comparative study of Korea and Taiwan. Energy Journal 20(2): 145-165.
Barro, R., and X. Sala-i-Martin. 1995. Economic Growth. New York: McGraw-Hill.
168
Beg, N. 1999. Scrappage programs. Annex to Thailand: Motorcycle Fleet Upgrade: Reducing Local and Global Emissions in Bangkok.
Bell, M.E., T.J. McGuire, J.B. Crihfield, D.R. Dalenberg, R.W. Eberts, T. Garcia-Mila and J.Z. Man. 1997. Macroeconomic Analysis of the Linkages between Transportation Investments and Economic Performance. Washington, DC: Transportation Research Board and National Research Council.
Boarnet, M.G.. 1995. Highways and Economic Productivity: Interpreting Recent Evidence. UCTC Working Paper, No. 291. Berkeley, University of California Transportation Center.
Bose, R.K. 1998. Automotive energy use and emissions control: a simulation model to analyse transport strategies for Indian metropolises. Energy Policy 26(13) (November): 1001-1016.
Button, K.J.. 1982. Transport Economics. London, Heinemann.
Calabrese, E.J., and E.M. Kenyon. 1991. Air Toxics and Risk Assessment. Toxicology and
Environmental Health Series. Chelsea (Michigan), Lewis Publishers.
Cervero, R. 1994. Transit-supportive Development in the United States: Experiences and Prospects. Institute of Urban and Regional Development, University of California at Berkeley.
Chan, Y., and F.L. Ou. 1978. Tabulating demand elasticities for urban travel forecasting. In Transportation Research Record 673, TRB, pp. 40-46. Washington, DC, National Research Council.
Cohen, H.S. 1995. Review of empirical studies of induced traffic. In Expanding Metropolitan Highways: Implications for Air Quality and Energy Use. Transportation Research Board Special Report 245, pp. 295-309. Washington, DC, National Research Council.
CONCAWE (European oil industry organization for environment, health and safety). 2000. EU Commission “Call for Evidence” on Ultra-low-sulphur (ULS) Fuels: CONCAWE Response. Brussels, CONCAWE, 31 July.
Daescu, D. 1997. A Generalized Reaction Mechanism for Photochemical Smog. University of Iowa: http://www.math.uiowa.edu/~ddaescu/task3.html.

169
Dargay, J., and D. Gately. 1997. The demand for transportation fuels: imperfect price-reversibility? Transportation Research Part B, Methodological 31 B(1) February.
———. 1999. Income's effect on car and vehicle ownership, worldwide: 1960-2015. Transportation Research Part A, Policy and Practice. 33 A(2) February.
Davis, S.C. 1994. Transportation and Energy Data Book. Oak Ridge (Tennessee), Oak Ridge National Laboratory.
DeCorla-Souza, P., and H. Cohen. 1999. Estimating induced travel for evaluation of metropolitan highway expansion. Transportation 26(3) (August).
Delucchi, M.A. 1997. The annualized social cost of motor-vehicle use in the U.S., 1990-1991: summary of theory, data, methods and results. Institute of Transportation Studies, University of California at Davis.
Delucchi, M.A., D.L. Greene, and M. Quanlu. 1994. Motor-vehicle fuel economy: the forgotten hydrocarbon control strategy? Transportation Research Part A, Policy and Practice 28(A) (May).
Domencich, T.A., G. Kraft, and J.P. Vallette. 1968. Estimation of urban passenger travel behavior: an economic demand model. In Highway Research Record 238, HRF, pp. 64-78. Washington, DC, National Research Council.
Dowall, D.E. 1995. The Land Market Assessment, a New Tool for Urban Management. Washington, DC, World Bank.
———. 1998. Making Urban Land Markets Work: Issues and Policy Options. Working Paper 702. Berkeley, Institute of Urban and Regional Development, University of California.
Dowling, R. 1995. Effects of increased highway capacity: results of household travel behavior survey. In Transportation Research Record, No. 1493, July.
Dunn, J.A. 1998. Driving Forces: the Automobile, its Enemies and the Politics of Mobility. Washington, DC, Brookings Institution Press.
Earthwatch, Global Environment Monitoring System. 1992. Urban Air Pollution in Megacities of the World. Published on behalf of the World Health Organization and the United Nations

170
ECMT (European Conference of Ministers of Transport). 1997. CO2 emissions from Transport. Organisation for Economic Cooperation and Development, 1997.
———. 1998. Efficient Transport for Europe; Policies for Internalization of External Costs. Paris, OECD/ECMT. Environment Programme by Blackwell Reference, Oxford (United Kingdom).
———. 1999. European Conference of Ministers of Transport. Traffic Congestion in Europe. Report of the 110th Round Table, 12-13 March 1998. Paris, OECD.
———. 2000. Strategic Environmental Assessment for Transport. Paris, OECD.
Environmental Protection Agency. 1999. Determination of NOx and HC basic emission rates, OBD (on-board diagnostics) and I and M effects for tier I and later LDVs (light-duty vehicles) and LDTs (light-duty trucks)(http://www.epa.gov/otaq/m6-iud.htm).
———. 2000. EPA Health Effects Notebook for Hazardous Air Pollutants-Draft. EPA-452/D-95-00, PB95-503579, December 1994. Leads and compounds. Fact sheet at web site of the United States Environmental Protection Agency (available at: http://www.epa.gov/ttn/atw/hlthef/lead.html).
Eskeland, G., and E. Jimenez. 1991. Choosing policy instruments for pollution control: a review. Policy, Research, and External Affairs Working Paper 624. Country Economic Department. Washington, DC, World Bank.
Eskeland, G. 1994. A presumptive Pigouvian tax: complementing regulation to mimic an emission fee. World Bank Economic Review 8(3): 373-94.
Eskeland, G., and T. Feyzioglu. 1995. Rationing can backfire: the “day without a car” in Mexico City. Policy Research Working Paper 1554. Washington, DC, World Bank.
Eskeland, G., and S. Devarajan. 1996. Taxing bads by taxing goods: pollution control with presumptive charges. Directions in Development. Washington, DC, World Bank.
Eskeland, G., and J. Xie. 1998. Acting Globally While Thinking Locally: Is the Global Environment Protected by Transport Emission Control Programs? Development Research Group, Public Economics and Environment Department, Global Environment Unit. Washington, DC, World Bank.

171
Espey, M. 1997. Pollution control and energy conservation: complements or antagonists? A study of gasoline taxes and automobile fuel economy standards. Energy Journal 18(2). 23-38.
European Bank for Reconstruction and Development. Transport Operations Policy. London, n.d. (http://www.ebrd.org/english/opera/sector/top_fin.pdf).
European Environment Agency. 1999. Are We Moving in the Right Direction? Term 2000. Copenhagen, http://reports.eea.eu.int/ENVISSUENo12/en/page 025.html.
Ewing, R., M.B. DeAnna, and S.C. Li. 1996. Land use impacts on trip generation rates. In Transportation Research Record, No. 15 (July).
Faiz and others. 1990. Automotive Air Pollution: Issues and Options for Developing Countries. Policy, Research, and External Affairs Working Paper 492. Infrastructure and Urban Development Department. Washington, DC, World Bank.
Faiz, A., C.S. Weaver, and M.P. Walsh, with contributions by S. Gautam and L.M. Chan. 1996. Air Pollution from Motor Vehicles: Standards and Technologies for Controlling Emissions. Washington, DC, World Bank.
Federal Highway Administration (FHWA). 1998. Social Costs of Alternative Land Development Scenarios (SCALDS). Transportation and land-use planning tool, available at http://www.fhwa.dot.gov/scalds/scalds.html.
Flora, J. 1998. Keynote address at the Conference on Transportation in Developing Countries, Berkeley, California, 17-18 April.
Fulton, L.M., D.J. Meszler, R.B. Noland, and J.V. Thomas. 2000. A statistical analysis of induced travel effects in the US mid-Atlantic region. Journal of Transportation and Statistics, 3(1): 1-14.
Fundación de Investigaciones Económicas Latinoamericanas. 1995. Financiamiento del Sector Transporte de la Región Metropolitana de Buenos Aires. Buenos Aires, FIEL.
Glazer, A., D. Klein, and C. Lave. 1993. Clean for a day: troubles with California’s smog check. Working Paper 163. University of California Transportation Center. Berkeley.
Goodwin, P.B. 1996. Empirical evidence on induced traffic, a review and synthesis. Transportation, 23: 35-54.

172
Gordon P., and H. Richardson. Are Compact Cities a Desirable Goal? In Journal of the American Planning Association. 63(1): 95-106
Gorham, R. 1998. Land-Use Planning and Sustainable Urban Travel: Overcoming Barriers to Effective Coordination. Paris: European Conference of Ministers of Transport.
———. Forthcoming 2002. Car dependence as a social problem. In Black, W.R. and P. Nijkamp (eds.), Social Change and Sustainable Transport. Bloomington (Indiana), Indiana University Press.
Government of India. 1997. White Paper on Pollution in Delhi with an Action Plan. New Delhi, Ministry of Environment and Forests.
Gramlich, E. 1994. Infrastructure investment: a review essay. In Journal of Economic Literature. XXXII: 1176-1196, September.
Greene, D.L. 1992. Vehicle use and fuel economy: how big is the “rebound” effect? The Energy Journal 13(1).
Greene, D.L., J.R. Kahn, and R.C. Gibson. 1999. Fuel economy rebound effect for U.S. household vehicles. The Energy Journal 20(3).
GTZ (Deutsche Gesellschaft für Technische Zusammenarbeit). 2001. Urban Transport Strategy Review: Experiences from Germany and Zurich, by F. Schley. Edited by M. Breithaupt and S. Opitz. GmbH Division 44, Environmental Management, Water, Energy, Transport. Eschborn (Germany).
Hansen, M., and Y. Huang. 1997. Road supply and traffic in California urban areas. Transportation Research A, 31: 205-218.
Heanue, K. 1998. Highway Capacity and Induced Travel: Issues, Evidence and Implications. Transportation Research Circular, No. 481. Transportation Research Board, National Research Council.
Heggie. I., and P. Vickers. 1998. Commercial Management and Financing of Roads. Washington, DC, World Bank Technical Paper, No. WTP 409.
Hivert, L. 1996. Le comportement des nouveaux diesélistes. Paris (Arceuil), Institut National de Recherche sur les Transports et leur Sécurité (INRETS), Report No. N.690-9501/03.

173
Holtz-Eakin, D. 1988. Private Output, Government Capital, and the Infrastructure Crisis. Discussion Paper No. 394. New York, Columbia Universit y.
Humphrey Institute. 2000. Congestion Pricing Pilot Programs: Overview and Status Report. Value pricing homepage of the State and Local Policy Program of the Hubert H. Humphrey Institute of Public Affairs
(http://www.hhh.umn.edu/centers/slp/conpric/ovstat.htm).
Hunt, J.D. 2001. Induced demand in transportation demand models. Paper presented at the conference Working Together to Address Induced Demand. Washington, DC, Eno Transportation Foundation.
Institute for Sustainable Development. 1997. Information Package No. 2 on Alternative Transport Policy in Poland. Warsaw, ISD.
International Energy Agency. 1998. World Energy Outlook. Paris, International Energy Agency/ Organisation for Economic Cooperation and Development.
———. 1999. Automotive Fuels for the Future: the Search for Alternatives. Paris.
International Lead Management Center. 2000. Lead in Gasoline Phase-out Report Card. www.ilmc.org.
Jacobs, A. 1993. Personal communication, during land-use studio. University of California,
Berkeley.
Jacobson, Mark. 2001. Strong radiative heating due to the mixing state of black carbon in atmospheric aerosols. In Nature 409, 8 February.
Jian Xie, C.J. Brandon, and J.J. Shah. Fighting Urban Transport Air Pollution for Local and Global Good: the Case of Two-stroke Engine Three-wheelers in Dhaka. Washington, DC, World Bank.
Jones, C.T. 1993. Another look at U.S. passenger vehicle use and the “rebound” effect from improved fuel efficiency. The Energy Journal 14(4).
Kean, A.J., R.A. Harley, D. Littlejohn, and G.R. Kendall. 2000. On-road measurement of ammonia and other motor vehicle exhaust emissions. In Environmental Science & Technology, vol. 34, No. 17, 1 September.

174
Khazzoom, J.D. 1980. Economic implications of mandated efficiency in standards for appliances, The Energy Journal 1(4).
Krewski, D., R.T. Burnett, M.S. Goldberg, K. Hoover, J. Siemiatycki, M. Abrahamowicz, and W.H. White. 2000. Reanalysis of the Harvard Six Cities Study and American Cancer Society Study of Particulate Air Pollution and Mortality: a Special Report of the Institute’s Particle Epidemiology Reanalysis Project. Cambridge (Massachusetts), Health Effects Institute Report.
Künzli, N., R. Kaiser, S. Medina, M. Studnicka, O. Chanel, P. Filliger, M. Herry, F. Horak Jr., V. Puybonnieux-Texier, P. Quénel, J. Schneider, R. Seethaler, J.C. Vergnaud, and H. Sommer. 2000. Public-health impact of outdoor and traffic-related air pollution: a European assessment. The Lancet, vol. 356, No. 9232, 2 September.
LBNL (Lawrence Berkeley National Laboratory). 1998. Database of Transportation and Energy, Berkeley, California.
Lee, D.B., Jr. 1997. Uses and meanings of full social cost estimates. In Greene, D.L., D.W. Jones, and M.A. Delucchi, The Full Costs and Benefits of Transportation. Heidelberg, Springer.
———. 2000. Methods for evaluation of transportation projects in the USA. Transport Policy 7(1) (January).
Lee, D.B., L.A. Klein, and G. Camus. 1999. Induced traffic and induced demand. Transportation Research Record 1659.
Levine, J. 1999. Access to choice. Access: Research at the University of California Transportation Center 14 (spring).
Litman, T. 1999. The Costs of Automobile Dependency and the Benefits of Balanced Transportation. Victoria, Victoria Transport Policy Institute (www.vtpi.org).
Lovei, M. 1995. Financing pollution abatement: theory and practice. Environment Department Paper 28. Washington, DC, World Bank.
———. 1996. Phasing out lead from gasoline: worldwide experience and policy implications. Environment Department Paper 40. Washington, DC.

175
——— (ed.). 1997. Phasing out lead from gasoline in central and Eastern Europe: health issues, feasibility and policies. Implementing the Environmental Action Programme for Central and Eastern Europe. Washington, DC, World Bank.
Lovei, M. and M. Kojima. 2000. Urban Air Quality Management: the Transport-Environment-Energy Nexus. Washington, DC, World Bank.
Lund, J.R., and P.L. Mokhtarian. 1994. Telecommuting and residential location: theory and implications for commute travel in the monocentric metropolis. Transportation Research Record 1463.
Lvovsky, K., G. Hughes, D. Maddison, B. Ostro, and D. Pearce. 1999. Environmental Costs of Fossil Fuels: a Rapid Assessment Method with Application to Six Cities, draft. Washington, DC, World Bank.
Lvovsky, K., and others. 2000. Environmental costs of fossil fuels: a rapid assessment method with application to six cities. Environment Department Paper 78. Washington, DC, World Bank.
MacKenzie, J.J., R.C. Dower, and D.D.T. Chen. 1992. The Going Rate: What it Really Costs to Drive. Washington, DC, World Resources Institute.
Maddison, D., D. Pearce, O. Johansson, E. Calthrop, T. Litman, and E. Verhoef. 1996. The True Costs of Road Transport. Blueprint No. 5. London, Earthscan for CSERGE.
Mage, D., and M.P. Walsh. 1999. Case studies from cities around the world. Urban Traffic Pollution. Edited by D. Schwela and O. Zali. London, World Health Organization, E & FN Spon Publishers.
Metge, H. 2000. Relationship between Urban Land Use Planning, Land Markets, Transport Provisions and the Welfare of the Poor: the Case of Cairo, Egypt. Background paper in World Bank series on World Bank Strategy Review. Washington, DC, World Bank (available at: http://wbln0018.worldbank.org/transport/utsr.nsf).
Michaelis, L. 1995. The abatement of air pollution from motor vehicles: the role of alternative fuels. Journal of Transport Economics and Policy 29(1) (January).
Miller, P., and J. Moffet. 1993. The Price of Mobility: Uncovering the Hidden Costs of Transportation. New York, Natural Resources Defense Council.

176
Minato, K. 2000. Automotive Technology and Regulations on Fuel Economy and Exhaust Emissions. Japan Automobile Research Institute.
Mokhtarian, P.L. 1997. The transportation impacts of telecommuting: recent empirical findings. In P.R. Stopher and M. Lee-Gosselin (eds.), Understanding Travel Behaviour in an Era of Change. Oxford (United Kingdom), Pergamon Press.
National Research Council, Transportation Research Board (NRC/TRB). 1995. Expanding Metropolitan Highways: Implications for Air Quality and Energy Use. Transportation Research Board Special Report 245. Washington, DC, National Research Council.
Nevin, M., and M. Barrett. 1999. Global Vehicle Emissions: Commercial Opportunities from Emissions Regulation for Vehicle Manufacturers and Component Suppliers. London, Financial Times Automotive.
Newman, P., and J. Kenworthy. 1989. Cities and Automobile Dependence: a Sourcebook. Brookfield (Vermont), Gower Technical.
———. 1999. Sustainability and Cities: Overcoming Automobile Dependence. Washington, DC, Island Press.
Noland, R.B. 2001. Relationships between highway capacity and induced vehicle travel. Transportation Research A, 35(1): 47-72.
Noland, R., and W. Cowart. 2000. Analysis of metropolitan highway capacity and the growth in vehicle miles of travel. Transportation, vol. 27, No. 4, 363-390.
Noland, R., and L.L. Lem. 2000. Induced travel: a review of recent literature and the implications for transportation and environmental policy. In European Transport Conference. Cambridge (United Kingdom).
Office of Technology Assessment, Congress of the United States. 1994. Saving Energy in U.S. Transportation. Washington, DC.
Olson, M. 1965. The Logic of Collective Action: Public Goods and the Theory of Groups. Cambridge, Harvard University Press.
Onursal, B., and S.P. Gautam. 1997. Vehicular air pollution: experiences from seven Latin American urban centres. World Bank Technical Paper 373. Washington, DC, World Bank.

177
Organisation for Economic Cooperation and Development. 1997. CO2 Emissions from Road Vehicles. By L. Michaelis. Annex I, Expert Group Meeting on the United Nations Framework Convention on Climate Change, Working Paper No. 1, OECD/GD(97)69, Paris.
Organisation for Economic Cooperation and Development and United Nations Environment Programme. 1999. Older Gasoline Vehicles in Developing Countries and Economies in Transition: Their Importance and the Policy Options for Addressing Them. United Nations publication, ISBN: 92-807-1796-9.
Peake, S. 1997. Transport, energy and climate change. Energy and Environment Policy Analysis Series. Paris, International Energy Agency.
Peeples, C. 2000. Personal communication.
Pendakur, V.S. 1996. A tale of two cities: Bangkok and Mexico. In OECD, Towards Clean Transport. Paris, Organisation for Economic Cooperation and Development.
Plassard, F. 1998. French experience. In Infrastructure-induced-mobility. Paris, European Conference of Ministers of Transport, Round Table 105.
Prototype Carbon Fund. 2000. Price signals in the emerging carbon market. Circular of the Prototype Carbon Fund. Washington, DC, World Bank.
Pucher, J. 1995. Urban passenger transport in the United States and Europe: a comparative analysis of public policies. Part 1: travel behaviour, urban development and automobile use. Transport Reviews 15(2) (April-June).
Puller, S.L., and L.A. Greening. 1999. Household adjustment to gasoline price change: an analysis using nine years of US survey data. Energy Economics 21(1) (February).
Real Estate Research Corporation (RERC). 1974. The Costs of Sprawl. Washington, DC, Council on Environmental Quality.
Romieu, I. 1999. Epidemiological studies of health effects arising from motor vehicle air pollution. In Urban Traffic Pollution, edited by D. Schwela and O. Zali. London, World Health Organization, E. & FN Spon Publishers.
Rostow, W.W. 1971. The Stages of Economic Growth. Cambridge: Cambridge University Press.

178
Rudnai and others. 1990. A survey of blood lead levels in Budapest. Egeszsegtudomany 34.
SACTRA (Standing Advisory Committee on Trunk Road Assessment). 1994. Trunk Roads and the Generation of Traffic. United Kingdom Ministry of Environment, Transport, and the Regions. London, HMSO, 1994.
Schipper, L.J., M.J. Figueroa, and R. Gorham. 1995. People on the Move: A Comparison of Travel Patterns in OECD Countries. Berkeley (California), Institute of Urban and Regional Development, University of California. Sponsored by the United States Department of Transportation through a grant to IURD.
Schipper, L., C. Marie-Lilliu, and R. Gorham. 2000. Flexing the link between Transport and Greenhouse Gas Emissions: a Path for the World Bank. Washington, DC, World Bank, June.
Schwartz, J. 1994. Societal benefits of reducing lead exposure. Environmental Research.
Schwela, D., and O. Zali. 1999. Motor vehicles and air pollution. In Urban Traffic Pollution. Edited by D. Schwela and O. Zali. London, E. & F. Spon.
Servaas, M. 2000. The Significance of non-Motorised Transport for Developing Countries: Strategies for Policy Development. Washington, DC, World Bank. Background report for World Bank Urban Transport Strategy Review, December.
Shah, J.J., and T. Nagpal, eds. 1997. Urban air quality management strategy in Asia, Greater Mumbai report. World Bank Technical Paper 381. Washington, DC, World Bank.
Shah, J.J., T. Nagpal, and C.J. Brandon, eds. 1997. Urban air quality management strategy in Asia: Guidebook. Washington, DC, World Bank.
Shaheen, S., D. Sperling, and C. Wagner. 1999. Car-sharing and partnership management: an international perspective. Paper No. 99-0826 in Transportation Research Record No. 1666: Transit Bus; Rural, Intercity and Paratransit; New Technology, Capacity, and Quality of Service; Public Transit. Washington, DC, National Academy Press.
Sharma, A., and A. Roychowdhury. 1996. Slow murder: the deadly story of vehicular pollution in India. Study directed by A. Agarwal, State of the Environment Series 3, Centre for Science and Environment, New Delhi.

179
Shoup, D., and M.J. Breinholt. 1997. Employer-paid parking: a nationwide survey of employers’ parking subsidy policies. In The Full Costs and Benefits of Transportation: Contributions to Theory, Method and Measurement. Edited by D.L. Greene, D.W. Jones, and M.A. Delucchi. New York, Springer Press.
Sperling, D. 1995. Future Drive: Electric Vehicles and Sustainable Transportation. Washington, DC, Island Press.
Sub-Saharan Africa Transport Program, World Bank (SSATP). 1999. Transport en Afrique—Note Technique. SSATP note 19.
Swait, J.D., and G.S. Eskeland. 1995. Travel mode substitution in São Paulo: estimates and implications for air pollution control. Policy Research Working Paper 1437. Public Economics Division, Policy Research Department, World Bank. Washington, DC.
Swedish National Road Consulting AB (SweRoad) and Asian Engineering Consultants Corporation. 1997. Consulting Services for Developing a Road Safety Master Plan and a Road Traffic Accident Information System for the Ministry of Transportation and Communications, Kingdom of Thailand.
Theakston, F., ed. 1992. Acute effects on health of smog episodes: report on a WHO meeting, Hertogenbosch, Netherlands, 30 October-2 November 1990. WHO Regional Publication, Europe 39. Copenhagen, WHO Regional Office for Europe.
Tol, R. 1999. The marginal costs of greenhouse gas emissions. The Energy Journal 20(1).
Touma, J.E. 2000. Personal communication. 29 September.
TRB (Transportation Research Board). 1995. Expanding Metropolitan Highways: Implications for Air Quality and Energy Use. Special report 245. National Research Council. Washington, DC, National Academy Press.
United Nations. 1993. Earth Summit, Agenda 21, the United Nations Programme of Action from Rio. United Nations publication, Sales No. E.93.I.11.
US DOT (United States Department of Transportation). 1999. Status of the Nation’s Highways, Bridges and Transit: Conditions and Performance, Report to Congress.
———. Calculated from unpublished data, n.d. Personal communication from R. Crichton of DOT.

180
Van Wee, B., H.C. Moll, and J. Dirks. 2000. Environmental impact of scrapping old cars. Transportation Research 5D(2) (March).
Walsh, M. 1993. Highway vehicle activity trends and their implications for global warming: the United States in an international context. In Transportation and Global Climate Change. Edited by D. Greene and D. Santini,. Washington, American Council for an Energy Efficient Economy.
Walsh, M., and J.J. Shah. 1997. Clean fuels for Asia: technical options for moving toward unleaded gasoline and low-sulfur diesel. World Bank Technical Paper 377. Washington, DC, World Bank.
Wang, M.Q. 2001. Development and Use of GREET 1.6 Fuel-cycle Model for Transportation Fuels and Vehicle Technologies. Working Paper ANL/ESD/TM-163 of the Center for Transportation Research. Argonne (Illinois), Argonne National Laboratory.
Weaver, C.S. 1999. Implementer’s Guide to Phasing Out Lead in Gasoline. United States Environmental Protection Agency, Office of International Activities. Washington, DC.
———. 2001a. Personal communication. 26 January.
———. 2001b. Personal communication, 2 February.
Weaver, C.S., and M.J. Balam. 1999. Air Pollutant Weightings for Mexico City. Technical Memorandum to World Bank, 21 September.
Weaver, C.S., and L.M. Chan. 1999. Economic Analysis of Diesel Aftertreatment System Changes Made Possible by Reduction of Diesel Fuel Sulfur Content. Report of Environmental Protection Agency.
Wijetilleke, L., and S. Karunaratne. 1995. Air quality management: considerations for developing countries. World Bank Technical Paper 278. Washington, DC, World Bank.
Willoughby, D. 2000a. Managing Motorization. TWU Working Paper No. 42. Washington, DC, World Bank.
———. 2000b. Singapore’s Experience in Managing Motorization and its Relevance to Other Countries. TWU Working Paper No. 43. Washington, DC, World Bank.

181
Winkelman, S., T. Hargrave, and C. Vanderlan. 2000. Transportation and Domestic Greenhouse Gas Emissions Trading. Washington, DC, Center for Clean Air Policy.
World Bank. 1994. Draft staff appraisal report for Brazil: São Paulo Integrated Urban Transport Project. Washington, DC.
———. 1995. Reforming Urban Land Policies and Institutions in Developing Countries, by C. Farvacque-Vitkovic and P. McAuslan. Urban Management Pr ogram Series, No. 5. Washington, DC.
———. 2000. Cairo urban transport note. Middle East Private Sector Finance and Infrastructure Department. Washington, DC.
———. 2001. Experience in urban traffic management and demand management in developing countries. Background paper for Urban Transport Strategy Review. Washington, DC.
World Energy Council. 1998. Energy Efficiency Policies and Indicators.
World Health Organization and United Nations Environment Programme. 1992. Urban Air Pollution in Megacities of the World. Oxford (United Kingdom), Blackwell.
Xie, J., J.J. Shah, and C.J. Brandon. 1998. Fighting Urban Transport Air Pollution for Local and Global Good: The Case of Two-Stroke Engine Three-Wheelers in Delhi. Energy Sector Management Assistance Program working paper. Washington, DC, World Bank.
Zegras, C., D. Guruswamy, E. Miller, and A. Tomazinis. 1995. Modeling Urban Transportation
Emissions and Energy Use: Lessons for the Developing World. Washington, DC, International Institute for Energy Conservation.
Zegras, C. 1998. The costs of transportation in Santiago de Chile: analysis and policy
implications. Transport Policy 5. Zegras, C. and R. Gakenheimer. 1999. Car sharing organizations in Latin America: examining
prospects for Santiago. Massachusetts Institute of Technology, Cooperative Mobility Program, Working Paper 99-4-1, May 1999.