Air Lease Corporation · ALC is one of the premier aircraft lessors in the marketplace ... plus...
33
Air Lease Corporation Q2 2017 Investor Presentation
-
Upload
truongdang -
Category
Documents
-
view
215 -
download
0
Transcript of Air Lease Corporation · ALC is one of the premier aircraft lessors in the marketplace ... plus...

Air Lease Corporation
Q2 2017 Investor Presentation
Forward Looking Statements & Non-GAAP Measures
Statements in this presentation that are not historical facts are hereby identified as “forward-looking statements,” including any statements about our expectations, beliefs, plans, predictions, forecasts, objectives, assumptions or future events or performance that are not historical facts and may be forward-looking. These statements are often, but not always, made through the use of words or phrases such as “anticipate,” “believes,” “can,” “could,” “may,” “predicts,” “potential,” “should,” “will,” “estimate,” “plans,” “projects,” “continuing,” “ongoing,” “expects,” “intends” and similar words or phrases. Accordingly, these statements are only predictions and involve estimates, known and unknown risks, assumptions and uncertainties that could cause actual results to differ materially from those expressed in them. We wish to caution you that our actual results could differ materially from those anticipated in such forward-looking statements as a result of several factors, including the following:
• our inability to make acquisitions of, or lease, aircraft on favorable terms; • our inability to sell aircraft on favorable terms; • our inability to obtain additional financing on favorable terms, if required, to complete the acquisition of sufficient aircraft as currently contemplated or to
fund the operations and growth of our business; • our inability to obtain refinancing prior to the time our debt matures; • impaired financial condition and liquidity of our lessees; • deterioration of economic conditions in the commercial aviation industry generally; • increased maintenance, operating or other expenses or changes in the timing thereof; • changes in the regulatory environment; and • potential natural disasters and terrorist attacks and the amount of our insurance coverage, if any, relating thereto. We also refer you to the documents the Company files from time to time with the Securities and Exchange Commission (“SEC”), specifically the Company’s
Annual Report on Form 10-K for the year ended December 31, 2016, which contains and identifies important factors that could cause the actual results for the Company on a consolidated basis to differ materially from expectations and any subsequent documents the Company files with the SEC. All forward-looking statements are necessarily only estimates of future results, and there can be no assurance that actual results will not differ materially from expectations, and, therefore, you are cautioned not to place undue reliance on such statements. Further, any forward-looking statement speaks only as of the date on which it is made, and we undertake no obligation to update any forward-looking statement to reflect events or circumstances after the date on which the statement is made or to reflect the occurrence of unanticipated events. If any such risks or uncertainties develop, our business, results of operation and financial condition could be adversely affected. You may obtain copies of the Company’s most recent Annual Report on Form 10-K and the other documents it files with the SEC for free by visiting EDGAR on the SEC website at www.sec.gov.
In addition to financial results prepared in accordance with U.S. generally accepted accounting principles, or GAAP, this presentation contains certain non-GAAP financial measures. Management believes that in addition to using GAAP results in evaluating our business, it can also be useful to measure results using certain non-GAAP financial measures. Investors and potential investors are encouraged to review the reconciliation of non-GAAP financial measures with their most direct comparable GAAP financial results set forth in the Appendix section.
2

ALC is one of the premier aircraft lessors in the marketplace
One of the world’s largest customers for new commercial jet aircraft
Globally diversified customer base
Positive long term industry fundamentals for growth and replacement of aging aircraft
Strong funding profile and credit metrics
Highest rated standalone aircraft lessor
Executive Summary
3

Ended the second quarter with $12.7 billion1 in aircraft after adding 14 aircraft with a cost of $637 million
• Young aircraft (3.6 years2) on long leases (6.9 years2) with a stable lease yield3
• Minimum future contracted rentals for our current and future fleet are $23.9 billion
• 90% of our order book placed on long-term leases for aircraft delivering through 2019
Expanded management business from 31 to 48 aircraft with the sale of 17 aircraft into Thunderbolt and Blackbird Capital I
• Also announced launch of Blackbird Capital II in August 2017
Entered into agreements with Boeing and Airbus to purchase 28 additional aircraft
Issued a total of $600 million senior unsecured notes at 2.625% in June 2017
Highlights for 2Q17
AIRCRAFT FLEET4
$12.7 billion1
240 owned / 48 managed
2Q17 REVENUES $381 million
+8.8% vs. 2Q16
2Q17 PRE-TAX PROFIT MARGIN
40.9%
PRE-TAX ROE5
17.3%
4
1 Aggregate fleet net book value
2 Weighted average age based on net book value of ALC owned fleet 3 Calculated as rental of flight equipment revenue, excluding overhaul revenue, divided by average net book value 4 As of June 30, 2017 5TTM ended June 30, 2017

Industry Update Industry Update
Air Lease Update
Portfolio Detail
Capital Structure
Summary
Appendix

Airline Productivity Measures
6
Growing, efficient and profitable utilization of fleets and capacity
Traffic: +7.9% 1st half of 2017
Load factors: ~81% globally
Aircraft utilization at ten year high
Stable aircraft demand environment
Profits: $36 billion in 2016
Parked fleet: ~3%1
Source: IATA June 2017, Boeing 2017 and Deutsche Bank Securities Inc. Research July 2017
1. Aircraft less than 20 years old

Historically, global airline traffic has doubled every 15 years and is projected to grow 5% annually over the next 5 years
Large airline fleet replacement cycle will benefit ALC’s business strategy
More than 95% of ALC’s customer base is outside of the United States1
North America Europe Asia/Pacific Latin America Middle East Africa World
3.5% 4.1%
6.4%
4.2%
5.7%
7.9%
4.9%
7
Global Market Outlook
Forecasted Passenger Volume CAGR by Major Region 2015-2020
Source: IATA October 2016 Economic Report 1 Based on each airline’s principal place of business

0.0
1.0
2.0
3.0
4.0
5.0
6.0
7.0
1980
1981
1982
1983
1984
1985
1986
1987
1988
1989
1990
1991
1992
1993
1994
1995
1996
1997
1998
1999
2000
2001
2002
2003
2004
2005
2006
2007
2008
2009
2010
2011
2012
2013
2014
2015
2016
Airline passenger traffic is the ultimate underlying demand for our aircraft
As long as passenger traffic is healthy, we believe there will be demand for the broadly operated aircraft models in our fleet
Resilient, Growing Market Expected to Continue
RPKs (trillions)
Gulf Crisis
Asian Crisis 9/11 SARS
Financial Crisis
4 Recessions
2 Financial crises
2 Gulf wars
1 Oil shock
1 Near pandemic (SARS)
9/11 Attack
Trend
Source: Boeing and ICAO scheduled traffic (September 2015) & IATA Jan 2017 Note: RPKs = Revenue Passenger Kilometers 8
2x
2x

Replacement Market Continues to Grow
ALC’s Target Replacement Market World’s Aging Fleet (Aircraft between 10-25 years over the next decade)
Airc
raft
9 Source: Ascend as of March 2017 and OEM literature
More than 40% of the world’s fleet is between 10-25 years of age
ALC’s target replacement market is aircraft over 10 years of age
0
2,000
4,000
6,000
8,000
10,000
12,000
14,000
16,000
18,000
20,000
Current 2018 2019 2020 2021 2022 2023 2024 2025 2026 2027 2028
8,307 9,045
9,738 10,510
11,378 12,221
12,958 13,555
14,220 15,327
16,471
Less than 10 10-25 25+

ALC estimates an industry capital requirement of $790 billion for new aircraft delivering between 2017 and 2021
10
Increasing Role of Leasing
Less Cash & Financing Required
Fleet Flexibility
Key Delivery Positions
Eliminate Residual Value Risk
Why Lease? Lessor Fleet Ownership
Source: Boeing; Data as of December 31, 2016
1970 1980 1990 2000 2016
17 leased
100 leased
9,771 leased
1,343 leased
3,715 leased
3,722 aircraft 6,037 aircraft 9,160 aircraft 15,032 aircraft 25,122 aircraft
14.7% 24.7%
~39%
1.7% 0.5%

Air Lease Update Industry Update
Air Lease Update
Portfolio Detail
Capital Structure
Summary
Appendix

2012 2013 2014 2015 2016 Q1 2017
$7.3
$9.2
$10.7
$12.4
$14.0$14.9
Consistent Asset Growth ($ in billions)
Fleet Count: 155 193 213
Solid Balance Sheet growth has supported consistent revenue growth
240
2012 2013 2014 2015
12
Q2 2017
240 237
2016

2012 2013 2014 2015 2016 Q2 2017
$4.3
$6.5
$8.6
$10.6
$12.3$13.3
Consistent Unencumbered Asset Growth ($ in billions)
We have focused on financing the business on an unsecured basis
We have grown our unencumbered assets1 to $13.3 billion, providing a solid foundation for our investment grade credit ratings
1 Comprised of unrestricted cash plus unencumbered flight equipment (calculated as flight equipment subject to operating leases less accumulated depreciation less net book value of aircraft pledged as collateral) plus deposits on flight equipment purchases plus certain other assets. 13
2012 2013 2014 2015 Q2 2017
2016

2012 2013 2014 2015 2016 Q2 2016 Q2 2017
$656
$859
$1,050
$1,223
$1,419
$350 $381
Consistent Revenue Growth ($ in millions)
The expansion of our fleet has driven consistent revenue growth and cash generation
Portfolio lease rates have remained consistent during this period
14
2012 2013 2014 2015 2016 Q2 2016 Q2 2017

2012 2013 2014 2015 2016 Q2 2016 Q2 2017
$253
$339
$439
$508
$623
$152 $167
Adjusted Net Income Before Income Taxes ($ in millions)
38.5
2.40
39.4
3.16
41.8
4.03
Reinvesting our earnings has built shareholders’ equity and strengthened our high quality balance sheet
Adj. margin before income taxes (%):
Adj. diluted EPS before income taxes ($):
15
41.7
4.64
2012 2013 2014 2015 2016
44.1
5.67
Adjusted Net Income Before Income Taxes, Adjusted Margin Before Income Taxes, and Adjusted Diluted Earnings Per Share Before Income Taxes are non-GAAP financial measures. See appendix for reconciliations to their most directly comparable GAAP measures.
Q2 2016 Q2 2017
43.9
1.51
43.7
1.39

2012 2013 2014 2015 2016 Q2 2017 LTM
11.2%
13.9%
16.6%17.5%
19.5%18.7%
Adjusted Return on Equity Before Income Taxes1
Strong adjusted ROE generated by the steady execution of our business strategy
16
2012 2013 2014 2015 2016
1 Adjusted Return on Equity Before Income Taxes is calculated as the trailing twelve month Adjusted Net Income Before Income Taxes divided by average shareholders’ equity. Adjusted Net Income Before Income Taxes is a non-GAAP financial measure. See appendix for a reconciliation to its most directly comparable GAAP measure.
Q2 2017 LTM

Portfolio Detail Industry Update
Air Lease Update
Portfolio Detail
Capital Structure
Summary
Appendix

ALC seeks to hold an aircraft for the first 1/3 of its useful life
ALC has a balanced asset mix
• Airframe manufacturers including Airbus and Boeing
• Engine manufacturers including General Electric, CFM, Pratt & Whitney, Rolls Royce, and
International Aero Engines
• Twin-aisle and single-aisle aircraft
ALC has a diversified global customer base with 88 airlines across 54 countries as of June 30, 2017
ALC closely monitors customer receivables to assure problems are proactively addressed
Staggered and balanced lease maturities by year
Flexibility in airframe purchase agreements
Portfolio Risk Management
18
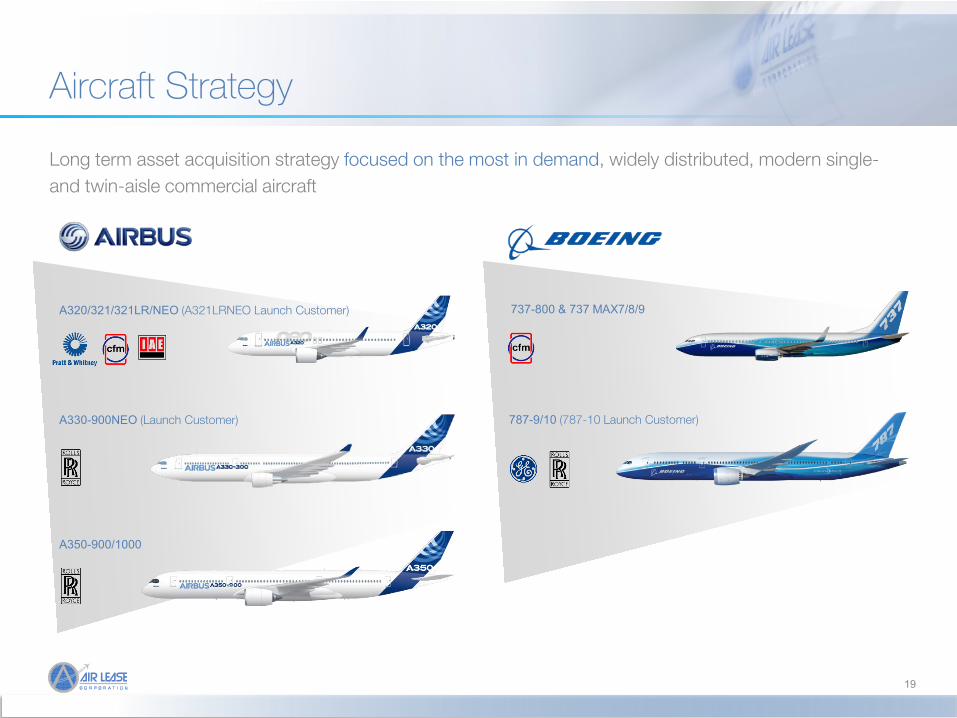
Long term asset acquisition strategy focused on the most in demand, widely distributed, modern single- and twin-aisle commercial aircraft
19
Aircraft Strategy
737-800 & 737 MAX7/8/9
787-9/10 (787-10 Launch Customer)
A330-900NEO (Launch Customer)
A320/321/321LR/NEO (A321LRNEO Launch Customer)
A350-900/1000

The broad installed operator base of our aircraft assets are the basis of our asset liquidity
The lengthy manufacturer backlog increases the value of ALC’s order book
ALC Invests in the Most Liquid Aircraft Types
8.8 years 8.9 years 9.0 years
4.9 years
Bac
klog
2 O
pera
tors
1
343 482 42 70
A320 Family 737 Family A350 Family 787 Family
# To
tal I
n S
ervi
ce1
6,972 7,127 780* 1,069*
20
5.0 years
118
A330 Family
1,223
Source: 1 Ascend as of May 2017. 2 Airbus and Boeing published data 2017 (calculated as backlog divided by production rate). A320 and A350 backlog calculated using average of current and planned production rates. *In service and on order.
ALC’s management team has helped launch a number of aircraft types and associated engine designs
ALC is able to drive cost advantages by negotiating with manufacturers for high quality products and competitive pricing
Strength in Manufacturer Relationships
21
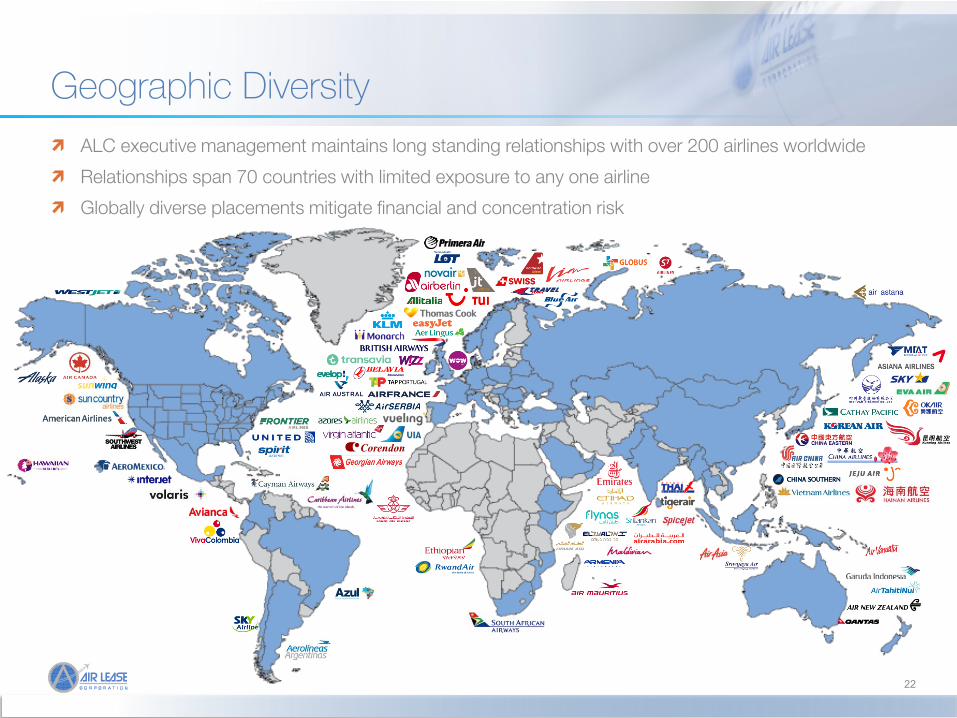
ALC executive management maintains long standing relationships with over 200 airlines worldwide
Relationships span 70 countries with limited exposure to any one airline
Globally diverse placements mitigate financial and concentration risk
Geographic Diversity
22

Europe, 33%
China, 21% Asia (ex. China),
21%
Middle East and Africa, 8%
Latin America, 8%
Pacific, Australia, New Zealand, 4% U.S. and
Canada, 5%
Boeing, 58% Airbus, 42%
Embraer, <1%
Single-Aisle, 78%
Twin-Aisle, 22%
Fleet Overview
240 owned aircraft and 48 managed aircraft
$12.7 billion aggregate fleet net book value
3.6 years weighted average fleet age2
6.9 years weighted average remaining lease term2
$23.9 billion in contracted minimum rentals
Diversified customer base with 88 airlines in 54
countries
1 As of June 30, 2017, except otherwise noted 2 Weighted average based on net book value of ALC’s owned fleet 3 Shown by net book value as of June 30, 2017, may not total to 100% due to rounding 4 Shown by number of aircraft as of June 30, 2017, may not total to 100% due to rounding
Region3
Manufacturers4 Aircraft Size4
23
Fleet Metrics1

2017 2018 2019 2020 2021 Therafter
5 17
32 26 22
44 7
5 5
5
5
2
4
2 7
9
2
12
26 28 35
27
3
7
12 9 7
8
Boeing 787-9/10
Boeing 737 Family
Airbus A350-900/1000
Airbus A330 Family
Airbus A320 Family
Order Book Provides Flexible Growth and a Strategic Advantage
We believe the order book is a source of value and provides visibility into the future and the opportunity to
double in size in 5 years
We believe our coveted delivery positions give us a competitive advantage with current and potential customers
ALC can exercise flexibility with delivery position commitments and timing
We typically place aircraft 18-36 months prior to delivery and currently are 90% placed through 2019
Scheduled Aircraft Deliveries1
46
Total Commitments
130
24
27
146
24 1 As of June 30, 2017
12
47
77 75 78
84
Capital Structure Industry Update
Air Lease Update
Portfolio Detail
Capital Structure
Summary
Appendix

Capital Structure & Financing Strategy
2
26
Capitalization – June 30, 2017
1
1 Calculated as: Contracted Minimum Lease Payments / Debt, as of June 30, 2017 2 Calculated as: (Net Flight Equipment – Undiscounted Contracted Minimum Lease Payments) / Equity, as of June 30, 2017
($mm) % of capitalizationUnrestricted cash $240 2%Total assets 14,861 116%
Unsecured debtSenior notes 6,920 54%Revolving credit facility 1,477 11%Term financings 214 2%Convertible senior notes 200 2%
Total unsecured debt 8,811 69%
Secured debtTerm financings 539 4%Export credit financing 48 0%
Total secured debt 588 5%
Less: debt discount (95)Total debt 9,303 72%
Shareholder's equity 3,558 28%
Total capitalization $12,862 100%
Selected credit metricsDebt/Equity 2.61xContracted Cash Flows/Debt1 105%Residual Fleet Value / Equity2 0.83xSecured Debt/Total Assets 4.0%Fixed Rate Debt/Debt 77.5%
Debt to Equity ratio
of 2.5:1
80/20 Fixed to Floating
debt ratio
90/10 Unsecured to Secured debt ratio
Balanced debt
maturity profile
Key Debt Portfolio Targets

Fleet comprised of young, high demand, technologically advanced aircraft with an average age of 3.6 years
Long weighted average remaining lease term of 6.9 years across the fleet
Diversified customer base of 88 airlines in 54 countries
Minimal lease expirations over the next few years $9.8 billion contracted minimum future rentals on our existing fleet
$14.1 billion committed rentals on our order book, for a total of $23.9 billion committed cash flows
Debt : Equity ratio of 2.6 : 1 Conservative debt maturity schedule 77.5% fixed rate debt Strong contracted cash flow coverage relative to debt outstanding at 105%1
Low residual value risk relative to equity at 0.83x2 Highly profitable – 43.9% adjusted margin before income taxes for Q2 20173
ALC Credit Highlights
Conservative Capital Structure
27
Data as of June 30, 2017, unless otherwise noted 1 Calculated as: Contracted Minimum Lease Payments / Debt, as of June 30, 2017 2Calculated as: (Net Flight Equipment – Undiscounted Minimum Lease Payments) / Equity, as of June 30, 2017 3Adjusted margin before income taxes is calculated as adjusted net income before income taxes divided by total revenues, excluding insurance recoveries. Adjusted
margin before income taxes is a non-GAAP financial measure. See appendix for reconciliation to its most directly comparable GAAP measure.
Strong Asset Base
A- Stable
BBB Stable
BBB Stable

Summary Industry Update
Air Lease Update
Portfolio Detail
Capital Structure
Summary
Appendix

Air Lease growth continues while maintaining a conservative capital structure and delivering strong returns to our shareholders
Air Lease Investment Highlights
Contracted Growth
Strong ROE
Conservative Capital
Structure
We believe our order book is a source of value and provides visibility into the future and the opportunity to double in size in 5 years
We have substantial forward cash flow visibility through our lease placements
We are 90% placed through 2019, and currently have $23.9 billion in committed rentals1
We have minimal lease expiries through the next several years, further enhancing visibility
We are focused on risk with no single customer greater than 10% of our revenue
We expect further benefits from operating leverage as our fleet grows
We expect to benefit through the refinancing of our remaining high yield debt with investment grade bonds
We expect additional profits from the growth of our management business
We have a strong balance sheet, with substantial liquidity of $2.5 billion
Low Debt/Equity target of 2.5x
Large unencumbered asset base $13.3 billion
77.5% fixed rate debt
Investment grade ratings from three agencies
29 1 Placements and committed rentals as of June 30, 2017 2 Values as of June 30, 2017
2

Appendix Industry Update
Air Lease Update
Portfolio Detail
Capital Structure
Summary
Appendix

Appendix – Non-GAAP Reconciliations
31
(in thousands, except share and per share data) Q2 2017 Q2 2016 2016 2015 2014 2013 2012
Reconciliation of net income to adjusted net incomebefore income taxes:
Net income 100,925$ 91,803$ 374,925$ 253,391$ 255,998$ 190,411$ 131,919$
Amortization of debt discounts and issuance costs 6,437 7,388 30,942 30,507 27,772 23,627 16,994
Stock-based compensation 5,304 4,501 16,941 17,022 16,048 21,614 31,688
Settlement - - - 72,000 - - -
Insurance recovery on settlement (950) (2,000) (5,250) (4,500) - - -
Provision for income taxes 54,944 50,468 205,313 139,562 138,778 103,031 72,054
Adjusted net income before income taxes 166,660$ 152,160$ 622,871$ 507,982$ 438,596$ 338,683$ 252,655$
Assumed conversion of convertible senior notes 1,431 1,455 5,780 5,806 5,811 5,783 5,627
Adjusted net income before income taxes plus assumed conversions 168,091$ 153,615$ 628,651$ 513,788$ 444,407$ 344,466$ 258,282$
Total revenues 380,957$ 350,139$ 1,419,055$ 1,222,840$ 1,050,493$ 858,675$ 655,746$
Weighted-average diluted shares outstanding 111,564,483 110,839,180 110,798,727 110,628,865 110,192,771 108,963,550 107,656,463
Adjusted margin before income taxes1 43.9% 43.7% 44.1% 41.7% 41.8% 39.4% 38.5%
Adjusted diluted earnings per share before income taxes 1.51$ 1.39$ 5.67$ 4.64$ 4.03$ 3.16$ 2.40$
Year Ended December 31,Three Months Ended
1 Adjusted margin before income taxes is adjusted net income before income taxes divided by total revenues, excluding insurance recoveries

Appendix – Non-GAAP Reconciliations
32
(in thousands, except share and per share data) Q2 2017 LTM 2016 2015 2014 2013 2012
Reconciliation of net income to adjusted net incomebefore income taxes:
Net income 376,126$ 374,925$ 253,391$ 255,998$ 190,411$ 131,919$
Amortization of debt discounts and issuance costs 31,822 30,942 30,507 27,772 23,627 16,994
Stock-based compensation 18,278 16,941 17,022 16,048 21,614 31,688
Settlement - - 72,000 - - -
Insurance recovery on settlement (950) (5,250) (4,500) - - -
Provision for income taxes 207,597 205,313 139,562 138,778 103,031 72,054
Adjusted net income before income taxes 632,873$ 622,871$ 507,982$ 438,596$ 338,683$ 252,655$
Average shareholders' equity 3,376,867$ 3,201,050$ 2,895,987$ 2,647,748$ 2,428,028$ 2,254,452$
Adjusted return on equity before income taxes 18.7% 19.5% 17.5% 16.6% 13.9% 11.2%
Year Ended December 31,

Appendix – Cash Flow Coverage Calculations
33
($ in billions) JUNE 30, 2017
Net Book Value of Aircraft A 12,743$
Minimum Future Lease Rentals from Operating Leases B 9,807$
Residual Exposure A - B 2,936$
Shareholders Equity C 3,558$
Residual Value Risk (A-B) / C 0.83x
Total Debt D 9,303$
Contracted Cash Flows / Debt B / D 105%