AIR FORCE INSTITUTE OF TECHNOLOGYMODELING OF BACILLUS SPORES: INACTIVATION AND OUTGROWTH THESIS...
98
MODELING OF BACILLUS SPORES: INACTIVATION AND OUTGROWTH THESIS Alexis X. Hurst AFIT/GAM/ENC/11-01 DEPARTMENT OF THE AIR FORCE AIR UNIVERSITY AIR FORCE INSTITUTE OF TECHNOLOGY Wright-Patterson Air Force Base, Ohio APPROVED FOR PUBLIC RELEASE; DISTRIBUTION UNLIMITED
Transcript of AIR FORCE INSTITUTE OF TECHNOLOGYMODELING OF BACILLUS SPORES: INACTIVATION AND OUTGROWTH THESIS...

MODELING OF BACILLUS SPORES: INACTIVATION AND OUTGROWTH
THESIS
Alexis X. Hurst
AFIT/GAM/ENC/11-01
DEPARTMENT OF THE AIR FORCE AIR UNIVERSITY
AIR FORCE INSTITUTE OF TECHNOLOGY
Wright-Patterson Air Force Base, Ohio
APPROVED FOR PUBLIC RELEASE; DISTRIBUTION UNLIMITED

The views expressed in this thesis are those of the author and do not reflect the official
policy or position of the United States Air Force, the Department of Defense, or the
United States Government. This material is declared a work of the U.S. Government and
is not subject to copyright protection in the United States.

AFIT/GAM/ENC/11-01
MODELING OF BACILLUS SPORES: INACTIVATION AND OUTGROWTH
THESIS
Presented to the Faculty
Department of Mathematics and Statistics
Graduate School of Engineering and Management
Air Force Institute of Technology
Air University
Air Education and Training Command
In Partial Fulfillment of the Requirements for the
Degree of Master of Science in Applied Mathematics
Alexis X. Hurst, BS
March 2011
APPROVED FOR PUBLIC RELEASE; DISTRIBUTION UNLIMITED

AFIT/GAM/ENC/11-01
MODELING OF BACILLUS SPORES: INACTIVATION AND OUTGROWTH
Alexis X. Hurst, BS
Approved:
___________________________________ ________
Dr. William P. Baker (Chairman) Date
___________________________________ ________
Dr. Larry W. Burggraf (Member) Date
___________________________________ ________
Dr. Christine M. Schubert Kabban (Member) Date

iv
AFIT/GAM/ENC/11-01
Abstract
This research models and analyzes the thermochemical damage produced in
Bacillus spores by short, high-temperature exposures as well the repair process within
damaged Bacillus spores. Thermochemical damage in spores is significantly due to
reaction with water, hydrolysis reactions. Applying heat to the spore causes absorbed and
chemically bound water molecules become mobile within the spore. These mobile water
molecules react by hydrolysis reactions to degrade DNA and enzyme molecules in the
spore. In order to survive the thermal inactivation, the spore must repair the damaged
DNA during spore germination. The DNA repair process, as well as other germination
functions, is dependent on reactions catalyzed by enzymes that are viable after the
thermal exposure. Increased damage to the enzymes during thermal inactivation, affects
the rate at which the spore DNA is repaired. If the enzymes are damaged to such an
extent that the DNA repair is not completed, the spore is unable to germinate, or produce
outgrowth. The DNA repair process, repair enzymes, and outgrowth time influences the
spore‟s chance of survival. Using this information, a probability of survival model was
created based on water mobility, hydrolysis reactions, an initial state of DNA, viable
repair enzymes, and an outgrowth time.

v
Acknowledgments
I would like to thank my committee, Dr. Baker, Dr. Burggraf, and Dr. Schubert
Kabban, for their support and guidance. I would also like to thank the faculty and staff for
helping me along this journey. This has been a very fulfilling opportunity to grow and
learn more about the world of applied mathematics.

vi
Table of Contents
Page
Abstract .............................................................................................................................. iv
Acknowledgements ..............................................................................................................v
List of Figures .................................................................................................................... ix
List of Tables ..................................................................................................................... xi
I. Introduction ..................................................................................................................1
Background...................................................................................................................1
Previous Research ........................................................................................................2
Purpose .........................................................................................................................3
Modeling Objectives ....................................................................................................5
Overview ......................................................................................................................5
II. Spore Structure and Dynamics .....................................................................................7
Introduction ..................................................................................................................7
Spore Structure .............................................................................................................7
Reaction Kinetics..........................................................................................................9
Water Mobility Model ................................................................................................11
III. Thermogravimetric Analysis ......................................................................................16
Introduction ................................................................................................................16
General Discussion .....................................................................................................16
Thermogravimetric Analysis Data .............................................................................18
Raw TGA Data. .......................................................................................................... 18
Modeling Data............................................................................................................ 20

vii
Results. ....................................................................................................................... 22
IV. Spore Damage and Repair Mechanisms .....................................................................26
Introduction ................................................................................................................26
Spore Damage Model .................................................................................................26
Hydrolysis & Pyrolysis............................................................................................... 26
Types of Damages to DNA and enzymes. ................................................................... 28
DNA Repair Mechanisms. .......................................................................................... 31
Damage Model. .......................................................................................................... 33
Fitness Distribution Models .......................................................................................34
Gaussian Model.......................................................................................................... 34
Beta Model. ................................................................................................................ 40
Probability of Survival. .............................................................................................. 46
V. Germination and Outgrowth .......................................................................................50
Introduction ................................................................................................................50
Germination ................................................................................................................50
DNA BER.................................................................................................................... 52
Michaelis-Menten Kinetics ......................................................................................... 53
DNA BER Model .......................................................................................................56
Sensitivity Analysis. .................................................................................................... 59
Linear Model of DNA BER Model. ............................................................................ 64
Outgrowth ...................................................................................................................70
Probability of Survival ...............................................................................................71
Multivariate Probability Distribution. ....................................................................... 71

viii
Enzyme Dependence. .................................................................................................. 72
Probability of Survival Calculations. ......................................................................... 76
VI. Conclusions and Future Work ....................................................................................78
Conclusions ................................................................................................................78
Future Work................................................................................................................81
Bibliography ......................................................................................................................82
ix
List of Figures
Figure Page
2.1. Spore Structure [33] ..................................................................................................... 8
3.1. TGA Raw Data .......................................................................................................... 19
3.2. TGA Raw Data Mass Loss versus Temperature. ....................................................... 20
3.3. Weighted Gaussian Density Functions ...................................................................... 23
3.4. TGA Model Fit .......................................................................................................... 24
3.5. TGA Model Fit (Percent Mass Loss) ......................................................................... 25
4.1. Enzyme Fitness Prior to Any Heating ....................................................................... 36
4.2. Enzyme Fitness Evolution ......................................................................................... 39
4.3. Enzyme Fitness Prior to Any Heating (Beta) ............................................................ 43
4.4. Enzyme Fitness Evolution (Beta) .............................................................................. 45
4.5. Gaussian and Beta Distribution Comparison ............................................................. 46
4.6. Probability of Enzyme Survival (225 C) ................................................................... 48
4.7. Probability of Enzyme Survival (300 C) ................................................................... 49
5.1. Base Excision Repair [3] ........................................................................................... 52
5.2. Schematic of the DNA Repair Model (BER) [36] ..................................................... 56
5.3. DNA Repair Analysis when 10% of DNA & Enzymes are Damaged ...................... 61
5.4. DNA Repair Analysis when 50% of DNA & Enzymes are Damaged ...................... 62
5.5. DNA Repair Analysis when 90% of DNA & Enzymes are Damaged ...................... 63
5.6. Nonlinear and Linear Model Comparison (I0=10 nM) .............................................. 66
5.7. Nonlinear and Linear Model Comparison (I0=100 nM) ............................................ 67
5.8. Nonlinear and Linear Model Comparison (I0=1000 nM) .......................................... 68

x
Figure Page
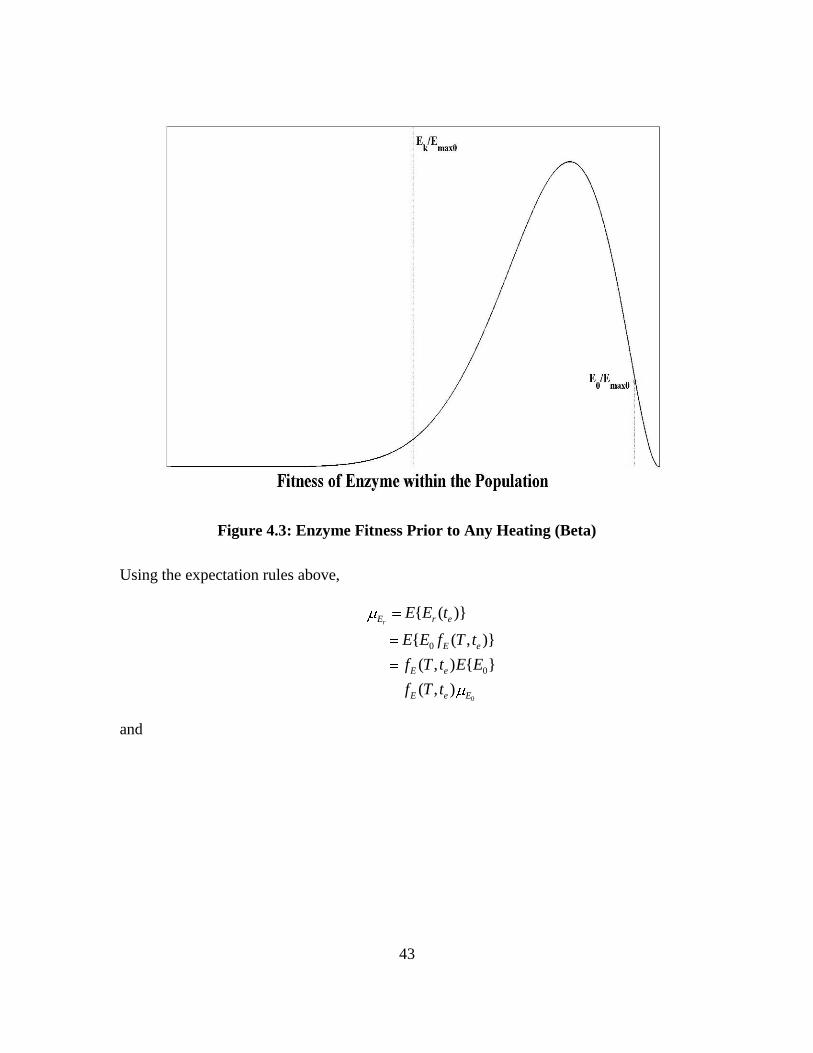
5.9. Illustration of Bacillus subtilis Vegetative Cells [9] .................................................. 71
5.10. Critical DNA Threshold ........................................................................................... 74
5.11. Enzyme Combinations for Different Critical Thresholds ........................................ 75

xi
List of Tables
Table Page
3.1. Parameters for TGA Curve Fit ................................................................................... 22
4.1. Parameters for Probability of Kill Models ................................................................. 47
5.1. Parameters for Model ................................................................................................. 59
5.2. Enzyme Maximum Parameters .................................................................................. 60
5.3. I0 values for Cases 1, 2, 3 ........................................................................................... 60
5.4. Probability of Survival for Different Outgrowth Times (300oC 2 sec) ..................... 76
5.5. Probability of Survival for Different Outgrowth Times (400oC .01 sec) .................. 77

1
MODELING OF BACILLUS SPORES: INACTIVATION AND OUTGROWTH
I. Introduction
Background
Anthrax is a bacterial infection that has a high fatality rate of 89% in the United
States that occurs when Bacillus anthracis (B.a) endospores are inhaled into lung alveoli
and germinate [4, 18]. Anthrax spores can be easily prepared from B.a obtained from
infected animals or soil [27]. The spores can be aerosolized and used with intent to harm
by causing anthrax disease in humans. The early diagnosis of inhalational anthrax is very
difficult, if there no knowledge of the anthrax exposure. Antibiotic treatment is effective
only during the first stage of this infection, which is characterized by nonspecific flu-like
symptoms. This stage normally lasts for several days. This is followed by the final stage,
death sometimes occurs after only a few hours [18]. These are reasons why B.a is listed
as a biological warfare agent.
Several incidents have occurred involving the agent [26]. In 1979, anthrax spores
were accidently released in Sverdlovsk, Russia. The release caused an epidemic of
inhalational anthrax in Russia resulting in 66 deaths and 18 cases of exposure to anthrax
in the United States. In 1993, Aum Shinrikyo, a Japanese cult, aerosolized a liquid
suspension of B.a from the roof of an eight story building. The liquid apparently had a
low concentration of spores and was ineffective since the B.a strain was used to vaccinate
animals in Japan. In 2001, anthrax spores were mailed through the United States Postal
2
Service to members of the U.S. Senate and to national news agencies. These attacks
resulted in 22 combined inhalational and cutaneous cases of anthrax infection. Of the 22
cases, five Americans died of inhalational anthrax. These attacks pointed out the
possibilities and vulnerabilities of bioterrorism using B.a. Furthermore, these attacks
illustrated the need for detection, recognition, environmental surveillance,
decontamination, and destruction of anthrax.
Previous Research
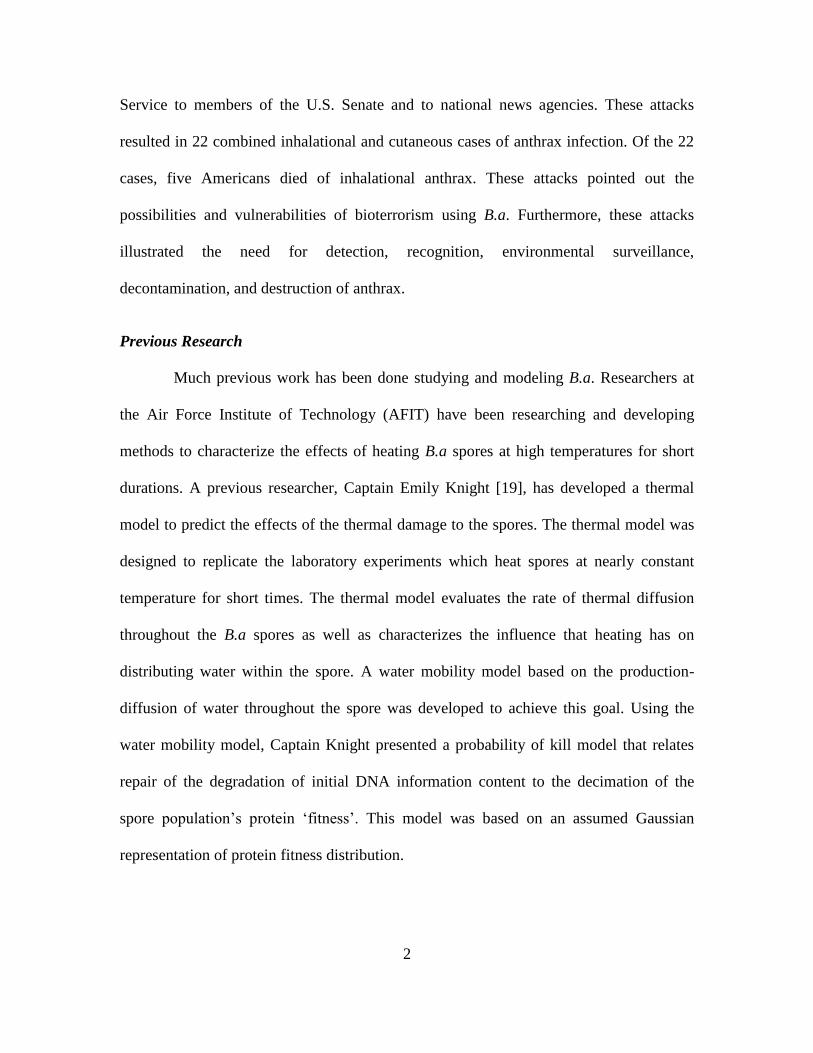
Much previous work has been done studying and modeling B.a. Researchers at
the Air Force Institute of Technology (AFIT) have been researching and developing
methods to characterize the effects of heating B.a spores at high temperatures for short
durations. A previous researcher, Captain Emily Knight [19], has developed a thermal
model to predict the effects of the thermal damage to the spores. The thermal model was
designed to replicate the laboratory experiments which heat spores at nearly constant
temperature for short times. The thermal model evaluates the rate of thermal diffusion
throughout the B.a spores as well as characterizes the influence that heating has on
distributing water within the spore. A water mobility model based on the production-
diffusion of water throughout the spore was developed to achieve this goal. Using the
water mobility model, Captain Knight presented a probability of kill model that relates
repair of the degradation of initial DNA information content to the decimation of the
spore population‟s protein „fitness‟. This model was based on an assumed Gaussian
representation of protein fitness distribution.

3
Purpose
The purpose for this research is to develop a probability of survival model for B.a
spores exposed to high temperatures at short exposure times. This research will estimate
the concentration of water within the B.a spore and the temperatures at which this water
will become available for hydrolysis reactions to occur. Hydrolysis is the reaction of
molecules with water molecules. Water can react with biopolymers which are molecules
such as DNA and proteins resulting in deploymerization (breaking a large strand of
polymers into two smaller ones) or denaturation (when proteins or DNA loses their
unique three-dimensional structures). This research will use as an input to the water
mobility model mathematical fits of measured data of water evolved from B.a spores
obtained from thermogravimetric analysis conducted by Dr. Daniel Felker.
Hydrolysis reactions can damage the spore‟s DNA and proteins to such an extent
that the DNA cannot be repaired. The extent to which the DNA and proteins have been
damaged beyond repair is the critical threshold. The threshold for the enzyme damage
influences the threshold for the DNA. This is because the DNA repair process is
mediated by the concentration of viable enzymes (proteins that catalyze specific chemical
reactions). Therefore, the probability of kill model developed by Captain Knight [19] will
be reviewed as well as different representations for the distribution of enzyme fitness.
The spore exist in a dormant state where metabolic activity has stopped and the
DNA is immobilized in the spore‟s core contributing to increase the spore‟s resistance to
damage. The spore can stay in this dormant state for long periods. Once placed in a
moist and nutrient-rich environment, the spore will break its dormancy and begin
germination. During germination, the spore will repair damaged DNA. The rate of this

4
repair process depends on the concentration of viable enzymes. Quantitative models by
Sokhansanj et al [36] exist for the base excision repair process. These models will be
mimicked to obtain a qualitative look at the spore‟s DNA repair process. Since the
enzymes are also damaged during thermal exposure, the DNA repair time will be affected
by their damage. If there is little damage to the enzymes, then the repair time will be
quicker. Whereas, if there is substantial damage to the enzymes, the repair time would
take longer or if the enzyme damage is irreversible the spore cannot repair the damaged
DNA. For example, elimination of multiple bases (adenine, guanine, cytosine, thymine)
on a single strand of the DNA double helix can be readily, faithfully repaired, but
completely cleaving the DNA double helix in multiple locations may not be faithfully
repaired. Thus, a spore suffering significant unrepaired DNA damage will not be able to
produce outgrowth and, unable to replicate itself, it is permanently inactive, i.e. dead for
the purpose of producing disease.
Many parameters influence the repair process. These influences include the initial
state of the spore DNA and the concentration of viable enzymes. The concentration of
viable enzymes is dependent on the exposure temperature and exposure time.
This research will examine the different influences of these parameters on the
repair process and model their effect on the spore‟s chances of survival. Previously, the
probability of kill model was based on an arbitrary estimate of the enzymes‟ critical
threshold. Unfortunately, information about this critical threshold is unknown for
Bacillus spores. Therefore, this research will develop a probability of kill model based on
thermal exposure as well as different combinations of enzymes available for DNA repair
process and several outgrowth times. Let outgrowth time be defined as the amount of

5
time selected to see if the spore produces a viable, replicating cell during germination.
Therefore, shorter outgrowth measurement time will lead to a higher measured
probability of kill and a longer measured outgrowth time will lead to a shorter measured
probability of kill. The actual probability of kill is estimated by very long measurement
times. However, there are practicable limits to extending these measurement times.
Producing a model of kill probability that includes damage repair necessary for
outgrowth will further enhance experimentalists‟ ability to interpret their data.
Modeling Objectives
Analyze thermogravimetric analysis water evolution data to estimate available
water within the spore to produce hydrolysis reactions and the temperatures at
which this water becomes mobile
Review the probability of kill model based on the enzyme threshold killing
mechanisms of B.a spores and extend to an enzyme fitness model using a beta
distribution rather than Gaussian representation
Numerically model the DNA repair mechanism within the spore and develop a
probability of kill model based on the DNA critical threshold, DNA repair
process, exposure time, temperature, viable repair enzymes, and outgrowth times.
Overview
The model development will be presented in the following manner. Chapter II
will review Captain Knight‟s water mobility model. Chapter III describes the two types
of water released within the spore due to heating. The thermogravimetric analysis
conducted will be used in this chapter to determine the temperatures at which these

6
waters are available within the spore for hydrolysis reactions. Chapter IV reviews the
probability of kill model and extends that ideal to employ the more physically realistic
beta distribution. Chapter V examines the model of the spore‟s probability of survival
after the thermal inactivation treatment. Since the spore‟s DNA is damaged, the damage
DNA must be repaired in order to synthesize the enzymes and produce outgrowth.
Chapter V will also describe and present results from the probability of kill model based
on the concentration of repair enzymes available for the DNA repair process. Chapter VI
will give the conclusions and future work.

7
II. Spore Structure and Dynamics
Introduction
The spore‟s strong resistance to heat and chemicals is primarily due to the
properties of multiple layers that make up the spore. These layers protect the spore‟s
DNA from damage by acting as a diffusion barrier and by dehydrating the spore‟s core
where the DNA resides. During the thermal inactivation process, water within the spore
becomes mobile and can react with molecules. In addition to pyrolysis reactions in which
bonds that hold the molecule together break by heating, the mobile water can also cause
hydrolysis damage to the spore‟s DNA and enzymes. Further, the release and movement
of molecular water is important for these hydrolysis reactions.
Spore Structure
The Bacillus spore is constructed of several layers including the exosporium,
spore coat, germ cell wall, outer and inner membrane, cortex, and core. The structure and
chemical composition of the spore play major roles in spore resistance. Figure 2.1 shows
an illustration of the major layers of a Bacillus spore (note that layers are not drawn to
scale). The outermost layer is the exosporium. The exosporium is not present in spores
of all Bacillus species. It contains mostly water, but also carbohydrates and proteins [33].
However, the exosporium is not believed to provide extra protection or heat resistance for
the spore [16].

8
Beneath the exosporium is the spore coat made up largely of proteins. The spore
coat protects the spore from destruction by lytic enzymes and many toxic chemicals. [33].
However, heat resistance is not provided by the spore coat [6].
Inside the spore coat lays the outer membrane. Although the outer membrane is
important in spore formation, in the dormant spore the function of this membrane is not
clear [33]. However, like the spore coat the outer membrane “has no notable effect of
spore resistance to heat” [34].
Figure 2.1: Spore Structure [33]
The next layer in the spore is the cortex which consists of peptidoglycan (PG).
The cortex reduces the core water content which is essential to the spore‟s resistance to
wet heating. The germ cell wall is also composed of PG. During germination, the germ

9
cell wall becomes the cell wall of the outgrowing cell. It does not provide any heat
resistance for the spore [12, 34].
The inner membrane separates the core from the cortex and is relatively
impermeable to small hydrophilic and hydrophobic molecules [33]. This membrane
provides a strong permeability barrier to protect the core from damage.
In the center of the spore is the core. The core consists of the spore DNA and
most spore enzymes. Depending on the species, the core‟s wet weight as water is only
25-55%. Additionally, the amount of free water is extremely low which indicates that
molecular mobility within the core is almost nonexistent. The core water content plays a
key role in spore resistance to wet heat and in the spore‟s enzymatic dormancy. The spore
is more resistance to wet heat with low core water content [11]. The core water content is
dependent on numerous things including sporulation condition, temperature, and spore
preparation temperatures. For example, the higher the preparation temperature, the lower
the core water content [23]. In high humidity conditions, more water accumulates in the
regions external to the core. To understand the chemical reactions taking place within the
spore, reaction kinetics concepts will be reviewed in the next section.
Reaction Kinetics
Reaction kinetics will be used throughout to describe damage reactions. Reaction
kinetics, also known as chemical kinetics, is the study of rates of chemical processes.
First-order reactions are ones that are directly proportional to the reactant concentration.
The rate of the reaction is directly related to the concentration of the reactant by a

10
proportionality constant, k. The rate constant for thermal reactions satisfies an Arrhenius
equation, that is
( )aE
RTk T Ae (2.1)
where A is the encounter frequency, Ea is the activation energy, R is the gas constant, and
T is absolute temperature. Therefore, the rate constants increase with increasing
temperature. The reaction rates are influenced by the physical state of the reactants, the
concentration of the reactants, the temperature at which the reaction occurs, and the
presence of any catalysts in the reaction. For example, later in Chapter IV, the rate of
enzyme damage has been modeled as
1 2 2( ) ( )[ ]( , )dE
k T E k T H O t T Edt
(2.2)
where
E = spore‟s enzyme concentration
[H2O] = average water concentration
k1 = rate coefficient associated with enzyme breakdown during pyrolysis
thermal damage
k2 = rate coefficient associated with enzyme breakdown during hydrolysis
damage.
The units of enzyme and average water concentrations are in molal units. Molal is the
number of moles of solute per kilogram of solvent. Activation energies for hydrolysis
reactions are generally smaller than those for pyrolysis reactions. Therefore, it can be
seen that, since water plays an important role in the chemical kinetics of thermal damage,
the water mobility can be a significant influence on thermal damage within the spore.

11
Water Mobility Model
Using the knowledge of the role of each layer in the spore with respect to heat
resistance, Captain Knight developed a model to illustrate the mobility of water within
the spore. This water mobility model was based on a diffusion equation (Equation 2.3)
where only the spore‟s core and cortex was considered in a two-layer spore model [19],
and is given by
( )w
f w D wt
(2.3)
where
w = concentration of mobile water (molal)
t = time (sec)
f (w) = production of water (molal/sec)
D = diffusion coefficient (cm2/sec).
In the water mobility model, since the core initially contains an extremely low
amount of absorbed water, it was assumed that the concentration of absorbed water in the
core is zero. Thus, the water content in the core was assumed to be only chemically
bound water. Whereas, the cortex contains absorbed and chemically bound water
molecules. It was assumed an equal amount of chemically bound water is available
throughout the core and cortex.
The absorbed and chemically bound water molecules become mobile in a free
molecular state, similar to a gaseous state, when the spores are heated.
2 2
2 2
[ [
[
] ]
] [ ]b
l g
g
O O
O
H Heat H
H Hea Ot H

12
where
[H2O] l = initial concentration of absorbed water molecules (molal)
[H2O] b = initial concentration of chemically bound water molecules (molal)
[H2O] g = initial concentration of mobile water molecules (molal).
The two types of mobile water are energized at different temperatures. These
temperatures will be estimated in the Chapter III thermogravimetric analysis.
For the water mobility model, the initial distribution of mobile water in the spore
is the following,
2( ,0) [ ( )]gw r H O r (2.4)
where r is the radius.
Since water is consumed through reaction with hydrocarbon compounds within
the spore, the production term in Equation 2.3 was reduced to a simple first order reaction
term:
( ) tf w wk (2.5)
where kt is the average rate for all possible hydrolysis reactions in the spore. The rate
coefficient again satisfies the Arrhenius equation given in Equation 2.1.
In the water mobility model, it was assumed that the spore is spherically
symmetric. Therefore, the model becomes one dimensional with respect to the radius of
the spore and time (w(r, t)). The diffusion of water was modeled radially from the spore‟s
coat into the cortex and the surrounding environment. At the boundary where the radius
is equal to zero, the solution must be finite, that is,
.| (0, ) |w t

13
When the radius is equal to the total spore radius (0r r ), the flow of water across the
outside boundary is proportional to the water content in the spore at the outer boundary
and ambient humidity. This boundary condition was modeled by,
0 0 2( , ) { ( }, ]ˆ ) [ an w r t h w r tD H O (2.6)
where
n̂ = outward normal vector
[H2O] a = water concentration outside spore (molal)
h = surface flow velocity.
For spherical geometry, n̂ became the outward radial direction. Therefore, Equation 2.4
became
0 0 2( , ) { ( , ) [ ] }a
wr t h w r t H O
rD . (2.7)
Since the diffusivity, D, was assumed to remain constant across the radius of the
spore, the diffusion term in Equation 2.3 became
2
2
2w wD w D
r r r. (2.8)
In order to find the analytical solution to the water mobility model, dimensionless
variables were chosen. Refer to Ref. 19 for additional details pertaining to these
variables. Introducing these variables gives the following expression,
2
20 1
1) ,( 0x
x x xx (2.9)
with boundary conditions
(0, ) 0 0x
(2.10)

14
(1, ) ( (1, ) ) 0Bx
(2.11)
The initial condition
* *
1 1 2 2( ,0) ( ) ( ) ( ) ( ) 0 1x x f T x f xT (2.12)
The dimensionless constants are
2
0 2
2
[and,
[
],
]
o t a
M
HrB
H
h r k O
D D O
with functions
2 0 2 01
2 2
2
[ [an
] ( ) ] ( )( ) ( )d
[ ] [ ]
l b
M M
O r x O r xx x
O
H H
H H O.
Using separation of variables, the homogenous problem given in Equation (2.7)
and the homogenous boundary conditions became
) ( ) ( )'( 0hh (2.13)
2 2( )]' ([ ) 0g x xx g x (2.14)
'(0) 0g (2.15)
'(1) (1)g Bg (2.16)
where is a separation parameter. The eigenvalues and eigenfunctions were found by
solving Equations 2.14, 2.15, and 2.16 with respect to the homogenous boundary
conditions. Further details are outlined in Ref.19 page 3-14 and 3-15.
The solution to the homogenous system is the following,
2*
1 1
( , ) ( ) ( ) [11, ( )]n nw w tnn n n n
n n n
sx F T e g gx e xg
w. (2.17)
The first series represents the influence of the initial water distribution while the second
series represents the influence of the wet or dry heating environment. Since the DNA is

15
only present in the spore core, all hydrolysis reactions with DNA will occur in the core.
The average total mobile water concentration in the core was given by
2
2 3 0
30 ( )[ ] ( , )
cr
c
c
t drr
H w r t r . (2.18)
Substituting Equation 2.17 and dimensionless variables into Equation 2.18 yields
2*
2 231 1
3[ ] ) [ ] ( ) ( ) (1) ( ) [( ]1n nw w tn
c c M n n c n n c
n nc n
sH O H O F T G x e G x e
x wt G .(2.19)
Physically, Equation 2.19 states that for short exposure times, the second term
approaches zero. This implies that the first term dictates the release, diffusion, and
reaction of water in the core. During long exposure times, the effect of the water
concentration outside the spore becomes relevant [19]. For additional details about the
water mobility model see Ref. 19 Appendix B.
Captain Knight‟s water mobility model will be used to characterize the spore‟s
chances of survival during the inactivation process. The spore‟s survival is dependent on
hydrolysis and pyrolysis reactions occurring within the spore during the thermal heating.
Chapter III Thermogravimetric Analysis will focus on the concentration of water within
the spore and the temperatures at which this water will be available for hydrolysis
reactions.

16
III. Thermogravimetric Analysis
Introduction
Two types of water are contained within the spore, absorbed and chemically
bound water. Absorbed water, weakly associated with cell materials, is located in the
spore‟s cortex while chemically bound water is located in the spore‟s core and cortex.
During the inactivation of the spore, the absorbed and chemically bound water molecules
become mobile. The weakly bound absorbed water becomes energized and mobile at
lower temperature than strongly held chemically bound water. Captain Knight assumed
these temperatures were around 100 oC for absorbed water and 300
oC for chemically
bound water [19]. In order to confirm these assumptions and approximate the percentage
of water in the Bacillus spore, thermogravimetric analysis studies were conducted by Dr.
Felker [10]. Dr. Felker used Bacillus thuringiensis when conducting this analysis. The
percentage of water in the spores is important during the inactivation process; the
diffusion of water allows hydrolysis reactions to occur within the spore. These reactions
are important in the inactivation of the spore because they lead to deploymerization
reactions of the spore‟s DNA and enzymes. Damage to the DNA and to enzymes
influence the DNA repair process and the spore‟s ability to produce outgrowth as well as
the repair time to produce outgrowth.
General Discussion
Thermogravimetric analysis (TGA) is a thermal analysis technique that measures
the weight change in a material as a function of temperature and time under a controlled

17
atmosphere [38]. Thus, TGA can directly measure the weight loss of a material with
temperature or time, as such loss is due to dehydration or decomposition as the
temperatures ranges from ambient to 1000oC. TGA can be used in multiple applications,
such as, thermal stability or degradation investigation of organic/inorganic materials and
inert/oxidative atmospheres, determining of organic/inorganic content of mixtures, phase
transition measurement, reaction kinetics with reactive gases, and pyrolysis kinetics [38].
The TGA of solids relies on a high degree of precision in three measurements:
weight, temperature, and temperature change. The analysis is carried out by raising the
temperature gradually and plotting percentage of weight change against temperature [28,
38]. The thermogravimetric analyzer consists of a high precision balance with a platinum
pan loaded with a sample. The platinum pan is rigidly attached to the end of the balance
arm in the horizontal configuration, and there is no added mass due to a suspension
harness. According to Menczel et al, “suspension below the balance may be less rigid and
does not recognize the compensating weight and thus detracts less from the available
range” [24]. The sample is placed in a small electrically heated oven with a thermocouple
to accurately measure the temperature. A computer is used to control the instrument.
TGA can provide a quantitative measurement of the weight change but cannot
indicate the nature of the material lost. Therefore, evolved gas analysis (EGA)
measurements can be done. EGA gives the nature of the changes in the gas phase. It can
be qualitative or quantitative measurements. Mass spectroscopy (MS) or Fourier
transform infrared spectroscopy (FTIR) can be applied to the EGA [24]. For our analysis
Dr. Felker used FTIR. The FTIR system allowed Dr. Felker to confirm that the major
volatile associated with the mass change was indeed water.

18
Thermogravimetric Analysis Data
Raw TGA Data.
There are two types of TGA, differential and normal. The normal TGA method
was used for our study. The sample can be in various atmospheres including oxidizing
and non-oxidizing. An oxidizing atmosphere is one in which oxygen is present whereas
in a non-oxidizing atmosphere oxygen is not present. For this study, Bacillus
thuringiensis (B.t) was focused on. The B.t sample was in a quasi-wet state and slowly
dried. Therefore, the study has a steady state measurement of all excess water. Although,
there is water located on the outside of the sample and within the spores, this study is
only concerned with the water within the spores. As the sample is heated, several things
can happen. The sample can stay the same, lose mass, or gain mass. Also, as the sample
is heated, more than one process is occurring. There is an early release of water and at
later temperatures combustion is released from the sample.
The TGA raw data obtained from using B.t can be seen in Figure 3.1. The blue
curve represents the weight change in the sample as a function of time (seconds). The
green curve shows the increase in temperature with time. The temperature increases
linearly at a rate of 0.2 oC per second. Also, there are distinct slope variations in the mass
as time increases.

19
Figure 3.1: TGA Raw Data
For use in this study, the TGA data was represented by mass change as a function
of temperature. This is the blue curve depicted in Figure 3.2. This curve depicts steep
slopes between 55oC and 125
oC and between 200
oC and 350
oC. These steep slopes
indicate a rapid loss of mass in these temperature ranges. This mass loss is related to the
release of water from the sample.

20
Figure 3.2: TGA Raw Data Mass Loss versus Temperature.
Modeling Data.
In order to estimate the amount of absorbed and chemically bound water released
from spores at selected temperatures, a model was built to provide the best fit to the TGA
experimental data (blue curve in Figure 3.2). Gaussian density functions were chosen to
represent the distributions of absorbed water, chemically bound water, and other
chemical processes. Each Gaussian density function is centered about their respective
mean release temperature, T1, T2, and T3 with associated standard deviations 1, 2, and
3.

21
21
211,2 3)
2,( .
i
i
T T
i
i
f T ie
The total mass, G(T*), released at any given temperature, T
*, is determined by
integrating the weighted sum of the Gaussian density functions, that is,
*
*
1 1 2 2 3 3) ( ) ( ) ( )(T
fG w dfw fT w
2 2 3
* * *
1 1 3( ) ( ) ( )w w wF T F T F T (3.1)
where
** 1
( ) 1 ,2 2
1,2,3.ii
i
F iT T
T erf (3.2)
Here w1 represents the total amount of absorbed water available for release, w2 represents
the total amount of chemically bound water available for release, w3 represents the total
amount of other chemical processes available for release, and erf is the error function.
The TGA model is then expressed by subtracting the total mass released at any
temperature, G(T*), from the total mass of the sample, TM, i.e.
* *) )( (f TTG MA GT T (3.3)
where
1 2 3.w wT wM
Furthermore, how much water is released at any temperature from the spore,
[H2O]s(T*), can be determined by subtracting the total available water, [H2O]A, released
at any temperature from the total mass of the sample,

22
* *
2 2] ( )[ ([ ] )s AO T TM H OH T (3.4)
where
* *
2 1 1 2 2] ( ) ( )[ .AO F T w FH Tw
Results.
Using the TGA model, the appropriate values that give the best fit approximation
to the TGA experimental data curve. These values are outlined below in Table 3.1.
Table 3.1: Parameters for TGA Curve Fit
The three weighted Gaussian density functions are illustrated in the Figure 3.3
using the values from Table 3.1. The majority of absorbed water is mostly likely released
in a neighborhood of 105 oC until all the absorbed water is active. Then the chemically
bound water most likely begins its release to a peak of 290 oC. The other chemical
processes which reduce the mass are mainly released to a peak of 815 oC.
Weighted
Coefficient
(wi)
Mean
Temperature
(Ti)
Standard
Deviation
( i
Absorbed Water 5 105 60
Chemically Bound Water 38 290 70
Other Chemical Processes 50 815 300

23
Figure 3.3: Weighted Gaussian Density Functions
Figure 3.4 shows the results of our best fit approximation to the TGA data using
the values in Table 3.1. This figure depicts the release of mass from the sample as
temperature increases. The blue curve represents the true TGA experimental data, the
solid red line represents our best fit model to the TGA data, and the dashed red line
represents the amount of mass loss due to water only.
From probability theory, the empirical rule states that for a Gaussian distribution
[12],
68% of the measurements lie within
95% of the measurements lie within 2
97.7% of the measurements lie within 3

24
where represents the mean and represents the standard deviation. Therefore, since our
best fit model gives a close approximation to the TGA experimental data, 68% of
absorbed water is released approximately between 45oC and 165
oC while 68% of the
chemically bound water is released approximately between 220oC and 360
oC. Also, our
results support Captain Knight, assumptions that the absorbed water becomes available
around 100oC and chemically bound water becomes available around 300
oC.
Figure 3.4: TGA Model Fit
Figure 3.5 shows the percent mass loss as temperature increases. Approximately
2% of the sample‟s weight is loss around 105oC and 25% is loss around 290
oC.
Furthermore, by 430oC all of the sample‟s water is released and that approximately 40-
45% of the sample‟s weight is water. The percentage of water within the spore is

25
important for hydrolysis reactions to occur. The higher percentage of water implies
increase hydrolysis reactions can occur. During the heating process of the Bacillus
spores, hydrolysis reactions are an important aspect to inactivating the spores.
Figure 3.5: TGA Model Fit (Percent Mass Loss)

26
IV. Spore Damage and Repair Mechanisms
Introduction
In Chapter III, the study observed that approximately 40-45% of the spore‟s
weight is water. Water plays an important role in the inactivation of the spores. The
transport of water throughout the spore allows hydrolysis reactions to occur in the core.
The hydrolysis reactions can cause damage to the spore DNA and enzymes which leads
to the spore death if the DNA is not repaired. In the spore population, it is assume that
each spore contains a full complement of DNA and a concentration of enzymes adequate
for germination. It has been assumed that the damage repair capability for a spore in the
spore population is a sample from a certain initial enzyme fitness distribution. When the
enzyme damage accumulates, this fitness distribution is degraded. Once degradation is
beyond some critical level, the spore cannot repair the damaged DNA and therefore,
cannot germinate or produce outgrowth. Probability of kill models based on water
mobility, hydrolysis, DNA information content, and the spore‟s enzyme fitness levels
have been created to further explore the spore‟s chance of survival.
Spore Damage Model
Hydrolysis & Pyrolysis.
Hydrolysis is the reaction of a molecule with water. At low temperatures,
hydrolysis reactions can occur because of their low activation energy. Hydrolysis can be
catalyzed by hydrogen ions in low pH or by hydroxide ions in high pH, where the pH of
an aqueous solution is the logarithm of the reciprocal of the concentration of hydrogen

27
ions in the solution. A solution with a pH below seven is acidic and a pH above seven is
basic; neutral solution has pH equal to seven. So hydrolysis rates increase in strongly
basic or strongly acidic solution.
(Note that: (hydrolysis) (acid catalysis) (neutral) (base catalysi2 s)k k [ k [H ] ] ]k [H OHO ) [32]
Bacteria can survive in an environment with pH measurements between five and
eight, so acid hydrolysis is somewhat less damaging than basic hydrolysis paralleling the
pH dependence of hydrolysis rates for most organic molecules that are susceptible to
hydrolysis for which k(acid catalysis) < k(base catalysis).
Autoionization is a reaction in which water molecules dissociate into hydrogen
cations (H+) and hydroxide anions (OH
-) in an equilibrium process. That is,
2 .O H OH H
The equilibrium constant (K) for this dissociation of water is defined as
2
[ ].
[ ]
[ ]
H OH
OK
H
The pH in a solution is related to its acidity or basicity. pH is defined as
pH log[ ]H
where [H+] is in molarity (M). The concentration of hydroxide ions in the solution, given
by
pOH= log[ ]OH
can be derived from pH using the equilibrium constant (K). Define a new constant, KW,
such that
2[ ] [ ][ ]WK K H O H OH .

28
Then
[ ][ ],
[ ] .[ ]
W
W
K
KOH
H
H OH
Therefore,
log[ ] log[
,
[ ],
pOH log
]
log
pH.
W
W
W
KOH
H
K log H
K
The change in pH within the spore can cause damage to the spore DNA by
hydrolysis. For example, as pH approaches 9, the DNA double helix begins to dissociate
into its component single strands. This is because the hydroxide ions can react with bases
in DNA base pairs to remove certain protons enhancing the rate of reaction of the bases
with water. Acids can accelerate the rate of reaction of DNA bases with water by
donating a proton to the bases. Therefore, certain chemicals that alter spore pH may be
effective to cause DNA damage which can lead to spore death.
Pyrolysis is the thermal decomposition of organic materials within the spores.
These damage reactions are mediated by radical formation, abstraction and
recombination reactions. Pyrolysis usually occurs at much higher temperatures than do
hydrolysis reactions except in the extreme absence of water.
Types of Damages to DNA and enzymes.
DNA and enzymes are biopolymers having very different structures and very
different functions. DNA is the information storage medium that encodes the recipe for
making all cellular polymers, including the enzymes. Enzymes are active proteins which

29
catalyze specific chemical reactions necessary to build biopolymers and disassemble
them to generate energy.
DNA is a linear polymer made up of four different types of monomers. It has a
fixed backbone which is built of repeating sugar-phosphate units. Each sugar is
connected to one of four possible bases: adenine (A), cytosine (C), guanine (G), and
thymine (T). In 1953, James Watson and Francis Crick correctly proposed that the DNA
molecule consist of two stands bound together in a double helix through specific
hydrogen bonding affinities of complementary bases for each other. The double helix
structure is arranged such that the sugar-phosphate backbone lies on the outside and the
bases on the inside. The bases form specific base pairing held together by hydrogen
bonds: adenine (A) pairs with thymine (T) and guanine (G) pairs with cytosine (C). The
sequence of bases along the DNA strands is the manner that genetic information is stored.
The DNA sequence also determines the sequences of the ribonucleic acid (RNA) and
protein molecules. If the DNA double helix is separated into two single strands, each
strand can act as a template for replication. For perfect encoding of information, the loss
of a single base in one DNA strand can be recognized by reading the complementary base
and so the total information in the double helix is not degraded if the loss is recognized
and repaired.
During the thermal inactivation of the spores, there are numerous types of reactive
processes that can lead to DNA damage. Some include chemical modification such as
alkylation or oxidation and base removal [35]. However, not all regions of DNA within
the spore are important for spore survival and replication. Therefore, only damage to the
critical or essential DNA necessary for germination and outgrowth is considered.

30
Proteins are linear polymers. Proteins are built from 20 amino acids and fold up
into elaborate three-dimensional structures determined by their amino acid sequences.
Enzymes are proteins folded into three-dimensional structures that can catalyze specific
chemical reactions. DNA genes encode the sequences of proteins. The gene is the
fundamental unit of hereditary information encoding a series of 3-bit letters or codons. A
codon, a set of three bases along the DNA strand, determines the identity of one amino
acid within the protein sequence. One incorrect amino acid can dramatically alter the
function of the protein. The three bits of ordered information allow 64 possible encoding
combinations. The capability of the three-bit letter is sufficient to encode for the 20
amino acids. Therefore, there is redundancy in the code. As a result, removing or altering
the third base pair in the sequence in a codon may or may not destroy the information
content. Whereas, removing the first base in a codon most likely will cause problems
[19]. Some codon letters are inactive, so destroying that information will cause no
degradation in the useful DNA gene information or proteins function encoded by that
gene.
As previously stated, spore DNA and enzyme damage can occur in many ways.
According to Setlow “chemicals such as nitrous acid or formaldehyde can kill the spores
by DNA damage, while others, such as oxidizing agents, appear to damage the spore‟s
inner membrane so that this membrane ruptures upon spore germination and outgrowth”
[34]. Water can react with DNA and proteins resulting in deploymerization.
Deploymerization is breaking a large strand of polymers into two smaller ones. Water
more frequently reacts with DNA causing deamination and depurination damage.
Deamination is the removal of amino group from the DNA‟s base pair. This type of

31
damage can prevent the DNA from replicating properly. The major type of deamination
reaction converts cytosine (C) to an altered DNA base, uracil (U), but deamination occurs
on other bases as well.
Denaturation is the reaction in which the proteins lose their structure. The proteins
lose their structure by application of some external stress, such as heat or a strong acid or
base. Following denaturation, however, some proteins will return to their native structure
under proper conditions. Although, under extreme conditions usually cause irreversible
change and the protein can no longer perform its function once it has been denatured.
Depurination is an alteration of DNA in which the purine base (adenine or
guanine) is removed from the DNA chain. Depurination damage is most common since
the purine bond is especially susceptible to hydrolysis.
When DNA is missing one of its base pairs, the DNA strand cannot match up with
its other half of the helix chain. Removal of a DNA base can have a range of effects
depending on the information content of the codon. For this research, only damage which
reduces the information content in critical or essential codon, which contain information
necessary to replicate the spore during germination. Also, it has been assumed that
hydrolysis reactions are equally likely to occur at all protein sites and that the critical
threshold damage to DNA caused by depurination is equally likely for all base pair sites
[19].
DNA Repair Mechanisms.
DNA repair is a complex system of interacting biomolecular processes. The DNA
repair pathways have evolved but are partially conserved in all life, from bacteria to
mammals [36]. Each repair pathway is directed to a specific type of damage, and several

32
pathways can target a given type of damage. Major DNA repair pathways include base
excision repair (BER), nucleotide excision repair (NER), mismatch repair (MMR),
homologous recombinational repair (HR), and non-homologous end joining (NHEJ).
Each repair pathway requires a number of repair enzymes for the process.
BER is the main mechanism for removing spontaneous DNA lesions that are
caused by hydrolysis or oxidation. This repair process removes damaged bases from
DNA through a multistep process in which the repair enzymes work independent of each
other [37]. An example of BER is the repair of uracil-containing DNA. Recall that uracil
can be formed in DNA by the deamination of cytosine.
NER removes bulky adducts in DNA or chemical bonds between bases of DNA.
The mechanisms of NER are more complex than that of BER, but the basic principles are
similar [37]. MMR provides protection against occasional rare errors that occur during
DNA replication [8]. HR and NHEJ double-stand breaks. HR uses a homologous DNA
template, is highly accurate, whereas NHEJ rejoins the broken ends without a template
and is often accompanied by loss of some nucleotides [8].
As mentioned above, deamination and depurination is the reaction of water with
the base pairs of DNA. Therefore, most likely during the thermal inactivation of the
spores, the base pairs are damaged. Since BER is the main repair system for this type of
damage, it will be assumed during germination that BER will be used to repair most of
the damaged DNA, dominating the overall rate of repair. Further discussion will be given
in Chapter V.
33
Damage Model.
This research assumes that the spore starts out with 100% healthy DNA and this is
degraded by exposure to heat due to hydrolysis and pyrolysis reactions. The rate of
critical DNA damage can be modeled by the following rate equation,
1 2 2( ) ( )[ 0] )( ,D
D c e D
e
dIk T I k tT H IT
dt (4.1)
whereDI represents the critical DNA, 1k is the rate coefficient associated with critical
DNA breakdown during pyrolysis, 2k is the rate coefficient associated with critical DNA
breakdown during hydrolysis, te is the exposure time, T is temperature, and [H2O]c is the
average core water concentration given in Equation 2.19. The rate coefficients again
satisfy the Arrhenius equation in Equation 2.1.
A simple solution to the rate equation is the following where the critical DNA
diminishes exponentially,
( ) ( , )D e c D et I Tf tI (4.2)
where 1 2( ) ( , )( , ) e ek T t k H t T
D eT tf e is the fraction of DNA remaining after some exposure
time and temperature, 20
) [ 0]( ( )et
e c dt HH , and Ic represents the initial state of critical
DNA.
As the spore is heated, there is also damage occurring to the spore‟s enzymes.
Since the enzymes are crucial for DNA repair, a damaged spore will only be able to
germinate using the enzymes that survive the heating process. The damage to the DNA
must be repaired before a viable cell is produced during outgrowth and there has to be a
suitable amount of repair enzymes viable to accomplish this.

34
Let ( )r eE t be the enzyme concentration for the spore population at exposure, et .
The rate of enzyme damage can be modeled by
1 2 2( ) ( )[ 0] ( , )r
r c e r
e
dEk T E k T E
dtH
tT (4.3)
where k1 is the rate coefficient associated with enzyme breakdown during pyrolysis and
k2 is the rate coefficient associated with enzyme breakdown during hydrolysis. These rate
coefficients may not be the same rate coefficients associated with DNA damage. After
integration, Equation 4.3 becomes
1 2( )( ( , )
0
) )(( ) e ek t k H T t
r e
T TE t E e
0 ( , )ef T tE (4.4)
where, for simplicity,
1 2( )( ( , ))( ))( , e ek T Tt k H T t
E ef T et . (4.5)
Equation 4.5 represents the fraction of remaining enzymes after a given exposure time
and temperature.
Fitness Distribution Models
The spores‟ fitness distribution has been modeled with a Gaussian distribution
representation [19]. In this section, this approach will be reviewed and extended the
fitness model to a beta distribution representation.
Gaussian Model.
The Gaussian (Normal) distribution is the most widely used continuous
probability distribution [12]. The Gaussian probability density function has the following
representation with mean, and variance, 2 ,
35
2
2
( )
2( ) ,1
, , 0.2
x
f x e x (4.6)
The Gaussian cumulative density function can be found by integrating equation 4.5,
2
0 2
( )
20
1)
2( ( ) .
xx
P x x x e dx (4.7)
A very important contributor to spore fitness is the store of enzymes in the spore
that can serve to reconstitute an active cell. Prior to any heat treatment, the initial enzyme
content, E0, will be dependent on the initial state of the spore population. This initial state
of enzymes will depend on numerous things. For example, spore preparation or
sporulation will have an important role on the initial state. According to Melly et al, spore
preparation temperature affects the core water content which in turn influences the
spore‟s heat resistance [23]. Therefore, 0E was drawn from a Gaussian fitness distribution
with mean,0E and variance,
0
2
E ,
20 0
2
0
0 0
0
(
0 0
)
2( ,
1) , ,
20.
E
E
E
E E
E
f e EE
The illustration of a notional enzyme fitness density function prior to heat is shown in
Figure 4.1.
In order to repair damaged DNA, a certain amount of viable enzymes are needed.
However, during the inactivation of the spore, damage is also done to the enzymes.
Therefore, there must be a point at which there will be insufficient concentration of
enzymes to repair the damaged DNA. This location is the critical kill threshold, Ek.
Above this threshold, the spore contains the necessary enzymes needed for repair.
36
Figure 4.1: Enzyme Fitness Prior to Any Heating
As thermal exposure time progresses, the evolution of the distribution of
( )r eE t will approach the kill threshold. Since 0E is a random variable, ( )r eE t is also a
random variable drawn from a distribution with mean,rE and variance,
2
rE .
From probability theory, the expectation of a continuous variable X is
( ) ( ) ,E X x f x dx (4.8)
where f(x) is the probability density function for X. The mean and variance of a
continuous distribution is defined in terms of expectations, that is
2 2
[ ]
[( ) ]
E X
E X
37
Expectation is a linear operator, that is
1 2 1 2... ] [ ] [ ] ... [ ]
[ ] [ ]
[ n nX X E X E X
E cX cE X
E X E X
where c is a constant and X1, X2,…, Xn are continuous random variables [12].
Using these expectation properties, the mean of ( )r eE t is the following
0
0
0
( )]
[ ( , )]
( , )
[
[ ]
( , )
rE r e
E e
E e
E e E
t
E E f T t
f T t E E
f T
E
t
E
and variance of ( )r eE t is the following
0
0
2 2
2
2
0
2
0
[( ( )
[( ( , )
( [
) ]
) ( , ) ]
( , ()) ])
r rE r e E
E e E e E
E e E
E E t
E E f T t
f
f T t
ET t E
Using Equation 4.8,
0 0
20 0
2
0
0
0
20 0
2
0
0
0
2 2
0 0
(
0 0
)
2
0
)
2
0
2
0
(
2
0
[( ) ( )
( )
(
] ( )
1
2
1)
2
E
E
E
E
E E
E
E
E
E
E
E
E E E
E dE
E dE
f E dE
e
e
Using integration by parts method, v-udv u vdu , let
20 0
20 0
0
0
2(
0 0
)
)
(
)( )
(
2,
E
E
E
o E
E
E
dv E e dEE
u
then

38
20 0
2
0
0
0
( )
2(2
0
)1.
2
E
E
E
E
E
du dE v e
Thus,
2 20 00 0
2 20 0 0
0 0 0
0 0
20 0
2
0
0
0
0
( ) ( )
2( 2(2 2 2) )
0 0
( )
2(2
0
)
2
( 1]
2 2
1
2
)[( )
0 ( )
( ) .
E E
E E
E
E
E E
o E
E E E
E E
E
E
E
E
E E e e dE
e dE
E
Therefore,
0
0
2 2 2
2 2
0( , ))( [( )
( ( ) .
]
( , ))
rE E e E
E e E
f T t
f T t
E E
Figure 4.2 depicts the evolution of the distribution of Er(te) as exposure time
increases. The Gaussian function outlined in black represents the initial distribution of the
enzyme content with mean, 0E and variance,
0
2
E . The Gaussian function outlined in
blue represents the distribution of the enzyme content after some exposure time, 1t
with mean, 1)(rE and variance,
2
1)(rE . The Gaussian function outlined in red
represents the distribution of the enzyme content after additional heat
exposure, 2 1t with mean, 2)(rE and variance,
2
2 )(rE . As the exposure time
increases, the mean of the distribution decreases as does the variance.

39
Figure 4.2: Enzyme Fitness Evolution
The probability of kill, Pk, for the spore population is the cumulative probability
up to the kill threshold, )( ( )r eE t kE , that is
)
0
0
( ( ) ( ( ) )
( ( , ) )
,( , )
r eE k k r e k
k E e k
t
kk
E e
E E t E
P E f T
P
Et
EP E
f T t
Using equation 4.7,
0 0
0
2
0
2
(
( , )
)
2
00
1( )
( , ) 2
1[1 ( )]
2
Ek
EE e
E
f T tkk
E
E e E
E
Ee dEP E
f T t
erf Q

40
where
0
0
).
2
( ,
( ),
k E E e
E
E E e
f T tQ
f T t
E
Beta Model.
The Gaussian distribution is often used because the random variables can be
standardized, but this assumes the random variables are between negative infinity and
positive infinity. However, since the maximum amount of enzymes, Emax, within any
spore cannot be infinite nor can the minimum amount be negative, the Gaussian
representation may not give an adequate physical representation. A probability
distribution bounded by [0, Emax] would provide a better estimation of the fitness
probability. Therefore, the beta distribution which is defined on a positive range and
bounded will be used to model the initial enzyme content.
The beta probability density family is represented by a two-parameter density
function typically defined over the closed interval between zero and one [12] and is given
by
1 1( )(1 ) 0, 0,
( ) (, 0 1,
( )
0, 1.
)
x
x x xf x (4.9)
Here ) is the gamma function [12] where
1
0( ) .xx e dx
Refer to Ref. 12 for additional properties of the gamma function.
The beta cumulative distribution is then
41
0 1 1
00
0
0
( )(1 ) , 1
(
1,
0( ) ( ))
1
x
dx xP x x
x
x x (4.10)
This beta distribution can be expressed in terms of the incomplete beta function
[12],0( , )xB , given by
0
0
1 1
0( , ) (1 ) .
x
x xB xx d (4.11)
Thus,
0 0
0
0
( ), ) 0( , 1
(
1,
( ) ( ))
1
xB xP x x
x
As noted above, the concentration of each enzyme within the spore is between
zero and ( ) ( , )i
max eE T t where0
( ) ( )) )( , ( ,i i
max e max E eEE T t f T t . 0
( )i
maxE is the maximum
concentration of each enzyme prior to any treatment and )( , ef T t is given in Equation 4.5.
By dividing the concentration of each enzyme amount by ( ) ( , )i
max eE T t , the concentration of
each enzyme will be proportions between zero and one. In order to generate the
physically realistic representation of the spore‟s initial enzyme content, it was assumed
that initially . From this assumption, the mean amount of enzymes will be close to
the maximum possible, Emax, and the probability distribution of enzymes will be skewed.
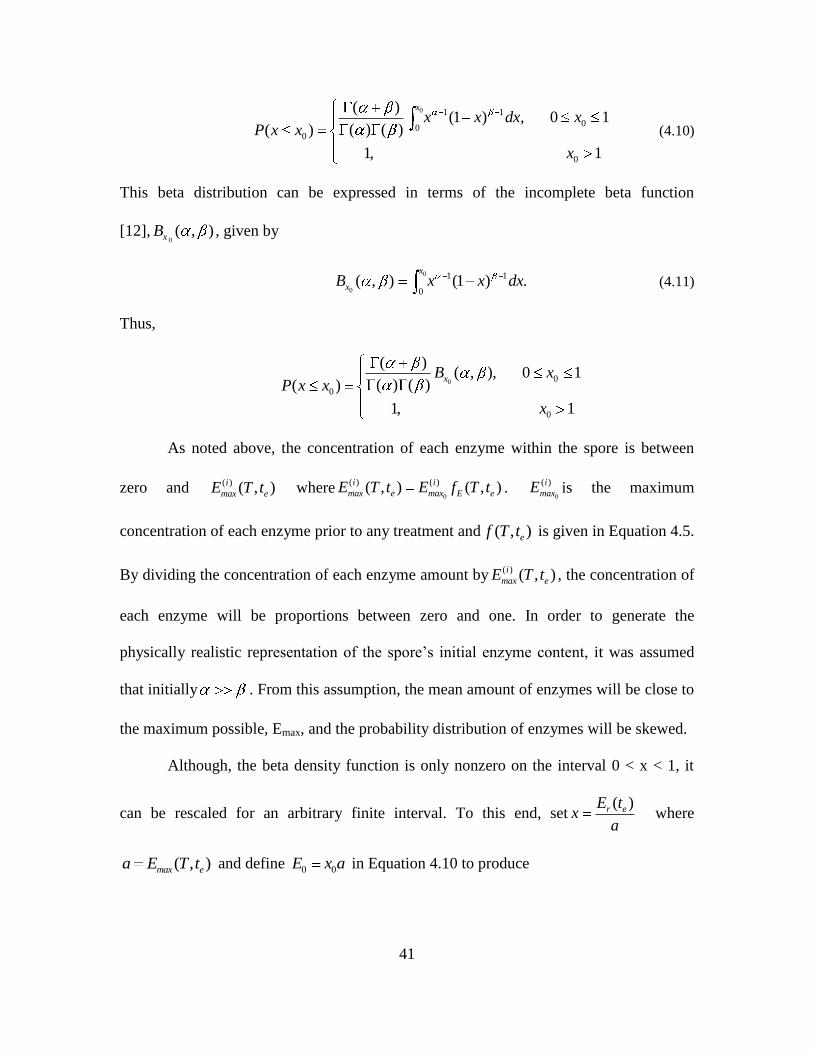
Although, the beta density function is only nonzero on the interval 0 < x < 1, it
can be rescaled for an arbitrary finite interval. To this end, set( )r eE
ax
t where
( , )max ea E T t and define 0 0E x a in Equation 4.10 to produce

42
0
0
0
0
0
0
0
0
0
1
1 1( ) ( )
1 0
( ) 1 ( )
( ) ( )
1,
( )
( ) ( )( ) )
1
1 1( )
,
(
,
1,
( ) 0
r e r e
E
E
r e
r e r e
E t E t d
a
y
a a
E
aE tE
a
E t E t d
P E
a a a
a
y E
E
This leads to the associated scaled density function
11 ( ) 1( )( ) ( ( )) (, 0
( )
0,
)( ) ( )( )
( )
r e r e r e
r e
r e
af
a E t a E t E tE t
E at
(4.12)
Figure 4.3 shows an illustration of a notional enzyme fitness density function with
10 and 3prior to any heat treatment. The random variable, E0, will be drawn from
this enzyme fitness distribution with mean, 0E and variance,
0
2
E . As exposure time
increases, the distribution of the enzymes will evolve. Since E0 is a random variable,
Er(te) is a random variable with mean,rE and variance,
2
rE .
43
Figure 4.3: Enzyme Fitness Prior to Any Heating (Beta)
Using the expectation rules above,
0
0
0
{
( , }
(
( )}
{
,
( ,
)
}) {
)
rE r e
E e
E e
E e E
t
E E
E E
E E
f T t
f T t
f T t
and

44
2 2 2
2
2 2 2
0
2
2 2
0
2
2 2 1 1
0 0 0 00
2
0
1
1
{ } ,
[ ( , } [ ( , ,
[ ( , } ,
[ ( , ( ) ,
{ )] )]
)] {
( ))] (1 )
( ) ( )
( ))]
( ) ( )[ ( , (
r rE r E
E e e
E e
E e
E e
E E
f T t f T t
f T t
f T t d
E E
E E
E E E E
Ef T t
2
( 2) 1 1
0 0 0
2
2
2
2
(1 )
( ) ( 2) ( ))] ,
( ) ( ) ( 2 )
( 1 1) ( 2))]
( 1 1) ( 2
) ,
[ ( ,
[ ( , .)
E e
E e
d
f T t
f T t
E E
Using, the property that ( ) ( 1)x xx
0
2
2 2
2
2
2
2
2 2
( 1) ( 1) ( 1))] ,
( ) ( 1) ( 1) ( 1)
( 1))] ,
( )( 1)
)]
[ ( ,
[ ( ,
[ ( ,
[ (
( ) ( 1)
)],
rE E e
E e
E e
E e E
f T t
f T t
f T t
f T t
As exposure time increases from 0et to 2et , Er(te) moves closer to the kill
threshold as depicted in Figure 4.4. The curve outlined in blue represents the enzyme
distribution at exposure time, 0.et Since no enzyme damage has yet occurred, the
population mean is 10/13 (for and . The curve outlined in green represents the
enzyme distribution after some enzyme damage at time, 1et , 1 2 . Now that damage

45
has been done to the enzymes, the mean01)(
rE E . The curve outlined in red
represents the enzyme distribution at exposure time,2.et Here the spore‟s enzymes
have accumulated even greater damage and the mean 02 )( .
rE E Also, the majority of
the fitness distribution has exceeded the kill threshold and thus, there will be little viable
enzymes available for DNA repair process. Possessing behaviors similar to those when
using the Gaussian representation, as exposure time increases the mean and variance of
the distribution also decreases.
Figure 4.4: Enzyme Fitness Evolution (Beta)
The probability of kill, Pk, can be found by computing the cumulative probability
up to the kill threshold. Notationally,

46
0
0
))
( , ) (
(( ,
, ),r e k
k k e k
max e max e
k k
E t EP P f T t E
E EE
P
T t T t
E E
where( ),
kk
efE
T
E
t.
Then from equation 4.10,
1 1
0 0 00
0
(1 , 0 1)
1
( ))
( ) ( )(
1
( ), ),
( ) ( )
1
,
( 1
1
0
,
k
k
E
k
k k
k
kE
k
E E d EP E E
E
E
B E
E
Probability of Survival.
Figure 4.5: Gaussian and Beta Distribution Comparison

47
Figure 4.5 shows a comparison between the Gaussian and beta density functions
prior to any exposure time. In order to make this comparison, the mean and variance were
chosen to be the same, that is,
0
0
2
0.7692,
0.0127.
E
E
The Gaussian density function exceeds one while the beta density function is bounded by
one. This will be the basis for comparing the probability of survival for the Gaussian and
beta distribution.
The notional parameters used within the probability of kill models can be found in
Table 4.1 [5, 22, 25, 29, 40].
Table 4.1: Parameters for Probability of Kill Models
Parameter Value Units
R 1.986 x 10⁻³
kcal/moloK
A1 4 x 10¹⁰
sec-1
E1 26.1 kcal/mol
A2 4.828 x 10¹⁵
sec-1
E2 38.3 kcal/mol
1A 1.6 x 10³
sec-1
1E 10 kcal/mol
Figure 4.6 depicts the probability of enzyme survival during dry heating or 0
with an initial release temperature of 225oC and a kill threshold of 0.1. That is, once the
enzyme population drops to 10%, the spore will not contain the necessary enzyme for
DNA repair. The red curve is the beta distribution representation for the fitness model

48
and blue curve is the Gaussian representation. As it can be seen, the beta representation
drops off faster than the Gaussian. This is because the Gaussian distribution is not
bounded above like the beta distribution. With the beta representation, it will take about
thirty seconds to achieve a significant reduction (10-10
) in enzyme survival and for the
Gaussian representation, it will take about thirty-six seconds to receive the same
reduction.
Figure 4.6: Probability of Enzyme Survival (225 C)
Figure 4.7 illustrates the probability of enzyme survival for dry heating with an
initial release temperature of 300oC. Again, notice that the estimate of spore survival in
the beta model falls of faster than the Gaussian model. When heated at higher
temperatures, equivalent enzyme damage takes place within a shorter duration. With the

49
beta model, it only takes approximately 0.0038 seconds to reduce the enzyme survival by
a significant amount. With the Gaussian model, it takes approximately 0.0041 seconds to
receive the same reduction. This can be explained by the fact that from Chapter II at
290oC, chemically bound water becomes available within the spores. The release of
chemically bound water causes the enzymes to be damaged faster as more water is
available for hydrolysis reactions.
Figure 4.7: Probability of Enzyme Survival (300 C)

50
V. Germination and Outgrowth
Introduction
Once the environment becomes nutrient rich, the spore can break the dormant
state and move into germination. There are three stages of germination: activation,
germination, and outgrowth. During activation, the spore prepares to germinate. During
germination, the dormant spore‟s resistance mechanisms are eliminated and metabolic
activity begins as a vegetative cell is formed. Also, during germination, the spore‟s DNA
will be repaired if there are enough viable enzymes for the repair process. If the spore‟s
DNA is repaired, the spore transitions into outgrowth. During outgrowth, the spore‟s
proteins and DNA are synthesized for daughter cells. An initial vegetative cell is first
formed from the spore. Whether the spore can survive to the last stage of outgrowth is
dependent on several events, such as the exposure time and temperature during thermal
inactivation, the initial state of the DNA, as well as the extent of viable enzymes to
complete the repair process.
Germination
Germination is an irreversible and degradative process in which the spore
transforms from dormant and highly resistance spore to an actively growing and dividing
cell. Many changes occur during germination. The spore‟ resistance to heat, desiccation,
ultraviolet radiation, and chemicals are lost.
Activation reversibly conditions the spore to germinate if appropriate germinants
are provided [27]. This process may take less than one minute for an individual spore and

51
longer for a population of spores. Mild heating of approximately 65oC or the presence of
certain chemicals triggers this stage. After activation, “the core enzymes do not function
properly and the core water content remains low” [27].
Germination terminates the dormant spore resistance, metabolic inactivity, and
refractivity. It occurs when the spore come into contact with many types of nutrients such
as amino acids, sugars, and purine nucleosides [33]. The result is the initiation of a
breakdown of macromolecules and excretion of spore substances such as the release of
the dipicolinic acid, calcium, and peptides [16]. These substances are replaced by water
[30]. There are observable physical changes within the layers of the spore structure
during this stage. The spore coat remains intact, but the cortex dissolves as the core
swells, filling the exosporium. This resulting increase in the spore volume is an important
step in the rehydration of the core.
Furthermore, during this stage, the spore‟s damaged DNA is repaired. As
mentioned above, since enzyme synthesis does not occur during dormancy, the spore
must contain enough viable enzymes in order to complete the DNA repair process.
Additionally, “if too much damage has been accumulated during spore dormancy, this
damage can overwhelm the capacity of the repair systems and lead to the death of the
germinated spore” [34].
As mentioned in Chapter IV, although there are numerous types of mechanisms to
repair damaged DNA, it is believed that BER will mostly likely be necessary within the
spore during germination.

52
DNA BER.
Figure 5.1 illustrates the BER process after U has been formed by deamination of
C and is therefore opposite G in the DNA strand. Initially, the bond between uracil and
the deoxyribose is cleaved by a DNA glycosylase. This leaves an apurinic/apyrimidinic
(AP) site, a sugar with no base attached in the DNA. Next, AP endonuclease cleaves the
DNA chain. Deoxyribose phosphodiesterase removes the remaining deoxyribose. The
gap is then filled by DNA polymerase and sealed by ligase with the correct base,
cytosine.
Figure 5.1: Base Excision Repair [3]

53
Many pathways exist for the BER. Quantitative models exist for this type of
repair mechanism [36]. These models were based on Michaelis-Menten kinetics, which is
also the foundation of the work in this research
Michaelis-Menten Kinetics
Enzymes act as regulators of biochemical processes such as DNA repair. Enzyme
kinetics is the study of the rates of enzyme-catalyzed reactions. Michaelis-Menten
kinetics is a model of enzyme kinetics. The Michaelis-Menten equation describes the
rates of enzymatic reactions by relating reaction rate to the substrate concentration. The
main assumption is that the enzyme and the substrate react reversibly to initially form a
complex. The complex then breaks down to form the free enzyme plus one or more
products, as shown below,
1 2
1
k kE S ES E P
k (5.1)
Equation 5.1 states that an enzyme E combines with substrate S to form an ES complex,
with a rate constant of k1. The ES complex then can dissociate to E and S, with a rate
constant k-1 or it can form a product P, with a rate constant k2. The turnover number, kcat,
is the number of substrate molecules converted into product by an enzyme molecule
when the enzyme is fully saturated with substrate and is equal to the rate constant, k2.
Using Equation 5.1, rate equations can be formed for the concentration of
enzyme, substrate, complex, and product, (the notation [ ] represents concentration of)
2
[ ][ ]
d Pk ES
dt, (5.2)
1 1 ]]
[[
[ ][ ]E S kd S
dESk
t, (5.3)

54
1 2 1[ ][ ] ([ ]
)[ ]E Sd ES
k k ESd
kt
, (5.4)
1 2 1[ ][ ] ([ ]
)[ ]E Sd E
k kd
k ESt
, (5.5)
where t represents time.
The velocity of the reaction, V, is the rate of product of the concentration of a
substrate with the rate coefficient. For example in Equation 5.2, the reaction velocity for
[P] is the product of rate constant, k2, with the concentration of complex, [ES], i.e.
2
[ ][ ]
d PES
dtV k . (5.6)
To solve Equations 5.2-5.6, initial conditions are necessary. If only the enzyme and
substrate are present at time t=0, then
0 0([ ], [ ], [ ], [ ]) ( , , 0, 0)S E ES P ES (5.7)
Briggs and Haldane suggested the steady state for the complex is when the concentration
of complex stays the same even if the concentrations of starting materials and products
are changing. That is, the rate of change in the complex, [ES], is equal to zero, i.e.
1 2 1)[][ ]] .[ ( 0k kE SS k E
Therefore,
2 1
1
([ ][ ] ).
[ ]
kE
ES k
kS (5.8)
Equation 5.8 is the Michaelis constant, KM,
2 1
1
).
(M
kK
k
k (5.9)
The Michaelis constant is independent of enzyme and substrate concentrations. Also, by
adding Equations 5.4 and 5.5,

55
[ ] [ ] 0d
ES Edt
.
This implies that
[ ] [ ] ,E ES C
where C is a constant. From Equation 5.7, at t=0,
0[ ] [ ]E ES E (5.10)
Now, by substituting Equation 5.10 into Equation 5.8,
0( []
][ ])[ ,
M
ESS
E SE
K
and solving for [ES],
0[[ ] .
[ ]
]
M
S E
KES
S (5.11)
Therefore, from Equation 5.6,
2 0[ ].
[ ]M
k S E
KV
S (5.12)
This gives the Michaelis-Menten equation. At low substrate concentration, when [S] is
much less than KM,
2 0[ ]
M
k S EV
K. (5.13)
The reaction becomes first order with the rate directly proportional to the substrate
concentration. At high substrate concentration, when [S] is much greater than KM,
2 0.V k E (5.14)
The reaction is now independent of substrate concentration and the rate becomes
maximal. The reaction velocity is then said to saturate with respect to the substrate or to

56
exhibit saturation. Using the Michaelis-Menten theory, quantitative models were
developed for the BER of DNA [36]. These models will be further explored in the next
section.
DNA BER Model
Figure 5.2 shows an illustration of a pathway for the BER mechanism with the
definitions of substrate concentrations yi (nM), enzyme concentrations ei (nM), and
reaction velocities vi (nM/sec).
Figure 5.2: Schematic of the DNA Repair Model (BER) [36]
Initially, Ape1 incises the abasic site producing a single nucleotide gap with a 3’-
hydroxyl group and a 5’-dRp group. Then, DNA Pol (e2) fills the gap producing a
nicked substrate with a 5’-dRp remaining. The 5’-terminus is then processed by the
dRp lyase activity of Pol . Lastly, DNA ligase (e3) seals the nicked substrate.
A quantitative model of human DNA BER was developed from kinetic data
available in by Sokhansanj et al. [36]. By assuming Michaelis-Menten kinetics, the model
equations are

57
1 1 11 1 1
1 1
2 2 2
2 2
3 23 3
3 3
1 2
4 34 4
2 2
32 3
43 4
5
4 4
4
,
,
,
.
,
r
r
r
r
r
dy k ev y
dt y K
dy k ev v y
dt y
v
vK
dy k ev v y
dt y K
k edyv v y
dt y K
dyv
dt
v
v
where k (1/sec) represents kcat, K (nM) represents the Michaelis constant, and tr
represents the repair time (sec). Notice that the velocity rates are dependent on the
individual enzyme concentrations. Since the enzymes too are damaged during the
inactivation process, the amount of viable enzymes is decreased. If the spore contains a
sufficient amount of enzymes, then the repair time will be quick. Whereas, if the spore‟s
enzymes are reduced substantially, the repair time will take longer.
Each compartment in Figure 5.2 is dependent on the previous one. If e1 is reduced
during the thermal inactivation, then v1 would be slow and it will affect the speed of the
second compartment, y2. This in turn would affect the third compartment, y3. And so on.
The same can be same for e2 and e3. Reductions in the enzyme concentrations will also
affect the repair velocities of each compartment.
This model has been mimicked to explain the repair process within the Bacillus
spores. Furthermore, this research is interested in DNA information content instead of
DNA concentration. Therefore, a dimensionless variable is introduced. Also, from

58
Chapter IV since the fitness of each enzyme is assumed to come from a beta distribution,
the enzyme concentrations will be scaled by ( ) ( , )i
max eT tE . This results in the following
0
( )( ,
( ) ( )
) )( ,
i r i r
i
i e i max e
y
e T t T t
t t I
E (5.15)
where ( ) ( , )i
max eE T t represents the maximum enzyme concentration for the ith
enzyme type
after exposure time. Further, I0 represents the initial state of the total DNA (critical and
non critical) such that
0cI I ,
and Ic represents the initial state of critical DNA with the fraction of the total DNA
which is critical. Moreover, the repair process does not recognize the difference between
critical and non critical DNA and therefore will repair the total damaged DNA.
Substituting the dimensionless variables into the DNA BER model produces five
equations as follows
111
1
1 2 221 2
1
(1)
1
0 1
(1) (2)
1
0 1 0
(2)
2 2
3 22
0
23
2 2
)( )( )
( )
) )( )( ) ( ) ,
( )
( ,,
( , ( ,
( ,
( )
( ) )( )
( )
max err
r r
max e max err r
r r r
r max er
r r
k Ed tt
dt t I K
k E k Ed tt t
dt t I
T t
K t I K
d t k Et
dt
T t T t
T t
t I K
3 2
3 3
3 2 4 343 4
3 3 4 4
5
(2)
0
(2) (3)
0
4 34
4 4
0
(3)
0
)( )
( )
) )( )( ) ( ) ,
( ) ( )
( ) )( )
( )
( ,,
( , ( ,
( ,.
max er
r
max e max err r
r r r
r max er
r r
k Et
t I K
k E k Ed tt t
dt t I K t I K
d t k Et
dt
T t
T t T t
t K
T t
I
(5.16)
In this model, when 0( )i r it I K , the rates become independent of the substrate
concentration as in Equation 5.14. When ( )i r o it I K , the rates become first order linear

59
equations as in Equation 5.13. The initial concentration of DNA, I0, plays an important
role in the rate equations. To further understand the influences of I0 on the DNA repair
process, a sensitivity analysis was conducted.
Sensitivity Analysis.
Table 5.1 contains the values for parameters used within the original DNA BER
model [36].
Table 5.1: Parameters for Model
Parameter Value Parameter Value
k1 0.625 sec-1
K1 300 nM
k2 0.04 sec-1
K2 100 nM
k3 0.78 sec-1
K3 39 nM
k4 0.05 sec-1
K4 130 nM
Additionally, from Chapter IV the DNA information content and enzymes
diminishes exponentially from hydrolysis and pyrolysis damage, i.e., recall
0
( ) ( , )
( ) ( ,
,
).
D e c D e
r e E e
I f
E
t I T t
t E T tf
If the rate coefficients associated with pyrolysis and hydrolysis for both DNA
information content and enzymes are the same, then the spore‟s DNA and enzymes will
be reduced at the same rate. For example by this simplification, after the inactivation
process, if 10% of the spore‟s DNA is damaged then 10% of the spore‟s enzymes are also
damaged.

60
An additional assumption must be made about the maximum enzyme
concentration for each enzyme prior to thermal heating. The spore contains an initial
concentration of enzymes used for the repair process. These initial maximum
concentrations are presented in Table 5.2. These values were chosen based on the
parameter values in Ref. 33, an exposure time of 2 seconds, and temperature of 300oC.
Table 5.2: Enzyme Maximum Parameters
Enzyme 0
( )
max
iE ( ) ( , )i
max eE T t
1(Ape1) 130 nM 83.19 nM
2 (Pol ) 50 nM 32.00 nM
3 (Ligl) 150 nM 95.99 nM
Multiple cases were examined. Case 1 assumed ( )i r o it I K for all 1,...,4.i
Case 2 assumed ( )i r o it I K for some 1,...,4.i Case 3 assumed ( )i r o it I K for
all 1,...,4.i The initial DNA information parameter, I0, for each of these cases is given
in Table 5.3,
Table 5.3: I0 values for Cases 1, 2, 3
Case I0
1 10 nM
2 100 nM
3 1000 nM

61
Further, three levels of damaged DNA and enzymes were considered. These were
when 10%, 50%, and 90% of DNA and enzymes are damaged during the thermal heating.
Figure 5.3 illustrates the repair of DNA when 10% of the spore‟s DNA and enzymes are
damaged. In this instance, there is little difference between I0 = 10 nM and I0 = 100 nM.
However, for I0 = 1000 nM, the rate of repair decreases and it takes longer to repair the
damaged DNA. For example, it takes approximately 100 seconds to repair half of the
damaged DNA when0I 10 nM and approximately 146 seconds when I0 = 1000 nM.
Figure 5.3: DNA Repair Analysis when 10% of DNA & Enzymes are Damaged
Figure 5.4 depicts the repair of DNA when 50% of the spore‟s DNA and enzymes
have been damaged. Compared to Figure 5.3, the repair time has increased because lower

62
enzymes concentrations are now available for the repair process. Again, when I0 = 10 nM
and I0 = 100 nM, there is not great difference in the time required to repair the damaged
DNA. It takes about 187 seconds when0I 10 nM and about 223 seconds when I0 = 100
nM to repair half of the damaged DNA. Whereas, for I0 = 1000 nM, it takes
approximately 580 seconds to repair half of the damaged DNA.
Figure 5.4: DNA Repair Analysis when 50% of DNA & Enzymes are Damaged
Figure 5.5 illustrates the repair of DNA when 90% of the spore‟s DNA and
enzymes have been damaged. When the majority of the spore‟s enzymes are damaged,
the repair process takes much longer than in the previous cases. In order to repair half of

63
the damaged DNA when I0 = 1000 nM , the time required would be 4477 seconds or
roughly 1 hour and 14 minutes.
Figure 5.5: DNA Repair Analysis when 90% of DNA & Enzymes are Damaged
Thus, the initial state of DNA is important in the repair rate and whether or not
the spore will be able to repair the damaged DNA. If Case 1 holds true, then the DNA
BER model becomes a system of first order linear equations. Therefore, an analytical
solution can be written. The influence that assumption has on the DNA BER model will
be examined in the next section.

64
Linear Model of DNA BER Model.
When ( )i r o it I K , the substrates stay far from saturation where a saturation
value will be defined as 0
iK
I. The DNA BER model equations can be reduced to a first
order linear system. Assume that ( )i r o it I K for i=1,…,4. The influence of the
enzymes and initial state of DNA will be explored.
To linearize the nonlinear model in Equation 5.16, the Taylor series expansion of
functions was used. Let fi( ) be a function such that fi(0)=0 and define the differential
) ( )( ( )i r i rt f t . If (0) 0 , fi( ) may be expanded in a Taylor series about zero to
produce
2( ) ( (0)) ( (0)) ), 1,..( - (0))+ (( .,4.- (0))i i if f O if
Then since ( (0)) (0) 0i if f ,
2( ) (0) ), 1,..+ , .( . 4i if Of i
Using Equation 5.16, the following is obtained
(1)
11 0
1
(1) (2)
10
1
(2) (
1
1 2 22
2
2 2
2)
03 2
3
2 3
3 2 4 34
3
(2) (3)
4
0
( ) | , 0, 0, 0 ,
( ) | , , 0, 0 ,
( ) | 0, , , 0 ,
( ) | 0, 0, , .
i
i
i
i
max
max max
max max
max max
k Ef
K
k E k Ef
K K
k E k Ef
K K
k E k Ef
K K
In these results the exposure time and temperature dependence on ( ) ( , )i
max eT tE has been
suppressed.

65
For simplicity, let
(1) (2) (2) (3)
11 2 3 4
1
1 2 2 3 2 4 3
2 3 4
, , , .max max max maxk E k E k E k E
K K K K (5.17)
Then the Jacobian for the system becomes
1
1 2
2 3
3 4
0 0 0
0
0 0
0 0
0J .
Thus, ( ) ( ).r rt J t Therefore, a simple solution can be given as 0.( ) rJt
rt e Since J is
a constant matrix, 4
1{ }i i are distinct eigenvalues of J with corresponding
eigenvectors 4
1{ }k k the solution can be given as
4
( ) ( )
1
( ) 1,...,, 4k rti i
i r k k
k
t c e i
with
4
0
1
1
0
(0) k k
k
c Z
c Z
c
where Z is the matrix of eigenvectors,
1 2 3 4, , ,[ ].Z
The eigenvalues of J are 1 2 3 4, , , with corresponding eigenvectors,
1 1 11
1 2 1 2 1 1 2 1
32 2
3 3 41
1, , ,
T
,
32 2
2 3 2 3 2 4
2 0, 1, ,
T
,

66
33
3 4
0, 0, 1,
T
,
4 0, 0, 0, 1T
.
Figure 5.6 shows comparisons between the numerical solution of the nonlinear
DNA BER model equations and the linearization solution if 50% of the spore DNA and
enzymes are damaged and I0=10 nM. Values from Tables 5.1-5.2 were used with an
exposure time of 2 seconds at a temperature of 300oC. For and 2, there is no
distinction between the linear and nonlinear equations. For 3 and 4 , the linear and
nonlinear equations reach different peaks and as time progresses they evolve together.
Given the Michaelis constant, Ki, in Table 5.1 and I0 = 10 nM, the saturation value for 1,
2, 3, 4 respectively are 30, 10, 3.9, and 13. Shown in Figure 5.6, each i stays far from
its respective saturation value.
Figure 5.6: Nonlinear and Linear Model Comparison (I0=10 nM)

67
Figure 5.7 shows comparisons between the nonlinear DNA BER model and the
linear model when I0=100 nM and 50% of the spore DNA and enzymes are damaged. For
there is again no distinction between the linear and nonlinear model equations. For 2,
as exposure time progress there is some difference between the nonlinear and linear
equations. For 3 and 4 , the linear and nonlinear equations reach different peaks but this
difference is not significant since the scaling is small. Further, as repair time progresses,
the linear and nonlinear equations evolve together. Here the saturation values for 1, 2, 3,
4 respectively are 3, 1, 0.39, and 1.3. Each i stays away from its respective saturation
value.
Figure 5.7: Nonlinear and Linear Model Comparison (I0=100 nM)

68
Figure 5.8 shows comparisons between the nonlinear DNA BER model and the
linear model when I0=1000 nM and 50% of the spore DNA and enzymes are damaged.
For early on there is a difference between the linear and nonlinear model equations but
as repair time progress, they evolve together. For 2, the linear and nonlinear equations
reach different peaks and as exposure time progress there is some difference between the
two. For 3 and 4 , the linear and nonlinear equations reach different peaks. There is also
a point at which the nonlinear equations remain constant and therefore, the nonlinear and
linear equations do not evolve together. When I0=1000 nM, the saturation values for 1,
2, 3, 4 respectively are 0.3, 0.1, 0.039, and 0.13. For 1 and 2, each passes their
respective saturation value. For 3, the saturation value is not reach and for 4, the
saturation value is approached.
Figure 5.8: Nonlinear and Linear Model Comparison (I0=1000 nM)

69
The repair term in the DNA repair model can be given as
3
4 3 max5 4 0
00 4 4 0
3
4 3 max4
04 4 0
1( ) ( ) ,
( )
( ) .( )
r
r
t
r
t
k Et I d
I K I
k Ed
K I
Assume 4 4( )r ot I K , then
3
4 3 max5 4
04
( ) ( ) .rt
r
k Et d
K (5.18)
Evaluating the integral in Equation 5.18 produces
31 4 2(4) 325 0 4 1
1 4 2 3
11 1
( ; 1 1 1) rr r r tt t t
r e e e et (5.19)
where
31 21
1 2 1 3 1 4
231 2
1 2 3 4
31 2
1 2 1
2 2
3 4
3
3
,
,
.
Observe that under the assumption each enzyme is subjected to the same rate of
hydrolysis and pyrolysis reactions, fE(T,te) can be factored with respect to resulting in
the exposure time appearing only in the exponential terms in Equation 5.19. Therefore,
the effect of exposure time will only change the rate at which the velocity equilibrates.
If the spore‟s DNA is repaired without complications, the next step in germination
is outgrowth.

70
Outgrowth
Outgrowth is the development of a vegetative cell from a germinated spore [17].
Outgrowth is dependent on the repair of the protein-synthesizing system and an ordered
synthesis of proteins [21]. According to Hansen et al, the synthesis of RNA begins after
germination and then the proteins are synthesized when the new vegetative cell emerges
and divides and outgrowth can last for hours in one spore, but in a population of spores, it
occurs synchronously [17]. Let outgrowth time, to, be defined as the time when the
experimental data is taken to determine if the spore produced a viable cell.
During outgrowth, the core wall thickens to become the vegetative cell wall.
Remains of the outer part of the old spore coat and the exosporium are found within the
new vegetative cell [16]. Also, in the vegetative cell, “the heat resistance is increased and
hardiness is gone” [39]. Figure 5.9 illustrates the vegetative cells forming from the
spores.
The spore‟s chance of survival is dependent on numerous environmental
parameters. The probability of survival models examined in Chapter IV was based on
knowledge of a critical threshold for the enzymes. In Figures 4.6 and 4.7, this threshold
was chosen to be 0.1. That is, once the enzyme population drops to 10%, the spore will
not contain the necessary enzyme for DNA repair. However, this threshold is not a
known quantity. In fact, if no DNA damage occurs, no repair enzymes are necessary for
outgrowth. Thus, the enzyme threshold may also depend on DNA damage. The influence
that the DNA threshold, outgrowth time, and viable enzymes have on the spore‟s
probability of survival will be examined in the following section.
71
Figure 5.9: Illustration of Bacillus subtilis Vegetative Cells [9]
The image is of a stained preparation of Bacillus subtilis showing endospores as
green and the vegetative cell as red.
Probability of Survival
Multivariate Probability Distribution.
Let Y1, Y2, …, Yn be continuous random variables with joint cumulative
distribution function F (y1, y2, …, yn). That is,
1 2
1 2 1 2 1( ( dt, ,..., ) , ,..., )ny y y
n n ny y f t ty t tF d (5.20)
where the function 1 2, ,..., )( nf yy y is the joint probability density function [12].
If Y1, Y2, …, Yn are independent then
1 2 1 1 2 2, ,..., ) ( ) ( ) ( )( Fn n ny y F yF F yy y
and the joint density function becomes

72
1 2 1 1 2 2, ,..., ) ( ) ( ) ( )( fn n ny y f yf f yy y [12].
Using these concepts, the probability of survival model based only on single DNA
threshold will be derived.
Enzyme Dependence.
The spore‟s chance of survival is dependent on the available viable enzymes for
the DNA repair process. Therefore, the total number of possible combinations of each
enzyme, e1, e2, and e3 will determine the domain in which the spore has a chance of
survival. Assuming these enzymes are independent random variables, the probability of
kill is defined as
5
3) ( ) ,
1
, ( ,k r D e c i i iP y t I y f e deD
T t
i
e (5.21)
where ,D eI T t is the fraction of the total undamaged DNA after some exposure
temperature and time. This value is computed from Equation 4.2 with
)
( , )( ,D e
D e
IT t
TI
t.
Further, y5 is the concentration of damaged total DNA which has been repaired after time
tr, and yc is the critical threshold value below which outgrowth cannot occur. The domain
of integration D is defined by
1 2 3 5, , ( , ) ( , ){( ) : }r D e ce e t e I T tD e y y
and fi(ei) is the probability density function for fitness due to enzyme ei, that is
1 ( ) 1 1( )( )
( ) ( ), 0
( )
0,
i i i
i i
i
ea a e af
ee
e a
(5.22)

73
where ( ) ( , )i
max eTE ta . Now introducing the dimensionless variables ii
o
y
Iand i
i
e
a
from Section 5.4 into Equation 5.21 yields
5
3, ) ( , )( ,
1
ik r D e c i if T t f
ai
dP t
D
with
1 1
1 2 3 5
, 0
0,
( ) 1(1 ) 1
( ) ( )( )
1
, , ) : ,{( ( }) , ,( )
i i i
i i
i
r D e c
a
D
f
Tt f t
5 represents the percentage of damaged DNA repaired, c represents the critical DNA
threshold as a percentage of the total repaired, and fD(T,te) is given in Equation 4.2.
Figure 5.10 illustrates the DNA repair for various combinations of enzymes, that
is, each curve represents the DNA repair within a given spore from the spore population.
The horizontal axis represents the repair time in seconds. The vertical axis is split
between the fraction of remaining DNA after an exposure time of 2 seconds at a
temperature of 300oC , fD(T, te), and the fraction of damaged DNA repaired, 5.
Approximately 76 % of the DNA is still viable based on the notional values given in
Table 4.1, 5.1 and 5.2. The red dashed line represents a critical threshold for DNA set to
95% of total DNA, c=.95. If all of the curves lie below this critical threshold at an
arbitrary chosen outgrowth time, t0=150 seconds, then the spore‟s probability of survival
is zero. However, if the outgrowth time is chosen to be larger, say t0=250 seconds, then
some of the curves lie above this critical threshold while others lie below. This will lead
to a nonzero probability of survival for the spore.

74
Figure 5.10: Critical DNA Threshold
The distribution of curves depicted in Figure 5.10 is dependent on the distribution
of enzymes. As mentioned before, the combinations of viable enzymes will influence the
DNA repair process. To further explore this influence, consider different enzyme
combinations that satisfy
5 , ) ( , )( r D e cf T tt (5.23)
Using the nonlinear model from Equation 5.16 with fixed exposure time,
exposure temperature, and outgrowth time, while each enzyme varied between zero and
one, it was observed that different enzyme combinations effected the percentage of
damaged DNA that is repaired, 5 .

75
Figure 5.11 illustrates the different combinations of enzymes that will yield
particular threshold values as given in Equation 5.23. The blue surface represents the
different sets of enzymes when .85c. The green surface represents the combination of
enzymes when .90cand the red surface represents those when .95c
. The domain of
integration for the probability of kill would include all combinations of enzymes below
their respective critical surface. For example, the domain of integration for the probability
of kill when the critical threshold is .95 would include all combinations of enzymes
below the red surface moving toward the origin.
Figure 5.11: Enzyme Combinations for Different Critical Thresholds
Based on I0=100 nM, te = 2 sec, T = 350oC, to = 250 sec, and values from
Table 5.1 and 5.2.

76
After have defining the probability of kill and the domain of integration,
calculations can be made to determine how outgrowth time influences the spore‟s
probability of survival after a fixed exposure temperature and time.
Probability of Survival Calculations.
Outgrowth time is a key factor for the spore‟s probability of survival. For
example, after 2 minutes there might not be any visible vegetative cells formed from the
spores. After 20 minutes there might be several visible vegetative cells. This is because
the spore has more time to repair damaged DNA. Therefore, in order to look at the
spore‟s chance of survival, the probability of survival will be computed for three different
outgrowth times as well as for two different fixed exposure temperature and time.
The probability of survival, Ps, is defined as
51 ( , ) ( , ) )(s k r D e cP P t f T t .
Table 5.4 gives the probability of survivals for different outgrowth times. These
calculations were based on te = 2 seconds, T = 300oC, I0 = 100 nM, c = .95
and the values from Tables 5.1 and 5.2.
Table 5.4: Probability of Survival for Different Outgrowth Times (300oC 2 sec)
Outgrowth Times Probability of Survival
120 seconds 0 %
240 seconds 58 %
300 seconds 94 %

77
From Table 5.4, as the outgrowth time increase, the spore‟s chance of survival
also increases. Increased outgrowth time gives the spore additional time to repair
damaged DNA as expected. Therefore, if the spore‟s enzymes are substantially damaged,
the longer outgrowth time is crucial for the repair process since the rate velocities will be
slow.
Table 5.5: Probability of Survival for Different Outgrowth Times (400oC .01 sec)
Outgrowth Times Probability of Survival
300 seconds 0 %
540 seconds 41 %
720 seconds 94 %
Table 5.5 gives the probability of survivals for different outgrowth times. These
calculations were based on te = .01 second, T = 400oC, I0 = 100 nM, c =
.95 and the values from Tables 5.1 and 5.2. The increase in temperature allows pyrolysis
reactions to occur. Therefore, the longer outgrowth times are required for higher
probability of survival.

78
VI. Conclusions and Future Work
Conclusions
In Chapter III, the thermogravimetric analysis data obtained from Dr. Felker [18]
was examined. The purpose of this data was to estimate the water content within the
spore and the temperatures at which this water would become mobile. From these results
it was concluded that the absorbed water becomes mobile around a peak of 105oC and the
chemically bound water becomes available for release at a peak of 290oC. These findings
verify the assumptions made previously [19] who assumed that the absorbed water is
released at a peak of 100oC and chemically bound water is released at a peak of 300
oC.
Additionally, the spore‟s weight was estimated to be about 40-45% water. The amount of
water within the spore is important for hydrolysis reactions to occur.
Chapter IV examined the type of damage occurring within the spore. Damage can
be caused by hydrolysis and pyrolysis reactions. The hydrolysis reactions can cause
damage to the spore‟s DNA and enzymes. This damage includes deamination,
depurination, denaturation, and depolymerization. Furthermore, five different DNA repair
mechanisms within the spore were discussed with emphasis on BER as the repair
mechanism responsible for spore outgrowth. It was assumed that a spore taken from a
spore population begins with 100% healthy DNA information and that the DNA
information diminishes exponentially based on rate coefficients corresponding to
hydrolysis and pyrolysis reactions. Following this further, the initial fitness distribution
of enzymes developed by Captain Knight which followed a Gaussian distribution was

79
enhanced by using a scaled beta distribution that corrects the concentration of enzymes
within the spore to fall between zero and some maximum value. Using both the Gaussian
and scaled beta distributions, probability of survival models were developed to examine
the spore‟s chance of survival. These probability of survival models were based on
knowledge of a critical enzyme threshold, that is, the value below which the spore does
not contain the sufficient concentration of enzymes for the DNA repair process. Using the
notational values, it was concluded that when heating the spore population at a
temperature of 225oC during dry heating and a threshold of 0.10, the probability of
survival was estimated to drop off faster when using the beta representation. This is
because the Gaussian distribution was not bounded above as was the beta distribution.
However, because the enzyme critical threshold is unknown and the model is compared
to actual data collected after outgrowth, there is a need for an outgrowth model.
The spore will break dormancy once placed in a nutrient rich environment. Once
this begins, the spore moves into germination. Germination occurs when the spore‟s
metabolic activity resumes and the spore begins repairing the damaged DNA. It was
asserted that the BER mechanisms will be necessary to repair the damaged DNA. This
assertion was based on the type of damage caused within the spore from hydrolysis
reactions. Quantitative models exist for this DNA repair process within humans. Since
these repair process are conserved from bacteria to humans, these models were mimicked
to provide a qualitative understanding of the process within the spore. Since the focus
was on DNA information content instead of concentration, a dimensionless variable,
0i iy I was introduced as was the initial state of DNA within the repair model. The

80
initial state of DNA plays a major role in the nonlinear DNA BER model. It was
concluded that if0i iI K , then the DNA BER model could be linearized and an
analytical solution was found. Also, by using the linear model, the exposure time
influence was shown to appear only in the exponential terms. This means that the
exposure time will only change the rate at which the repair velocity equilibrates. When
0i iI K , then the DNA BER model must remain nonlinear and a numerical method
must be used to find the solution. Additionally, since the concentration of enzyme‟s
initial distribution was based on a beta distribution, additional assumptions were made
about the maximum concentration for each type of enzyme present during the repair
process. If the spore‟s DNA is repaired, the spore then moves into the last stage which is
outgrowth. The time at which survival is assessed plays a crucial role in the
determination of the spore‟s survival. Using this fact and the enzyme influence on the
repair process, a probability of survival model was developed. Unlike before, this model
is not based on critical threshold values for the enzymes. Instead, the probability of
survival model is based on a threshold value for the DNA information. Since the enzymes
as well as the DNA are damaged during the thermal inactivation, they influence the DNA
repair process which in turn influences the probability of survival. Using the probability
of kill model with the notational values, it was concluded that with a fix exposure time of
2 seconds, a temperature of 300oC, and an initial state of DNA, I0 = 100 nM, if given an
outgrowth time of 120 seconds, the spore has a 0 % chance of survival. With an
outgrowth time of 240 seconds, the spore‟s chance of survival increases to 58 % and with
an outgrowth time of 300 seconds, the spore‟s chance of survival increase to 94 %.

81
Future Work
The Gaussian and beta distributions were looked at for the initial enzyme
distribution. However, additional distributions could be considered. The DNA BER
model was based on human DNA and even though, there is comparison between bacteria
and human DNA repair process, possible refinement in the model should be considered
for future work. Moreover, to execute the model, kinetics data found in literature based
on human DNA was used. It would be advisable to compare the model to actual
experimental data from the spore. In addition, when developing the probability of
survival model in Chapter V only the nonlinear model was considered. The linear model
might provide additional insight into the spore‟s chance of survival. Further, assumptions
about independence for the enzymes were made. This assumption may not hold true,
therefore a joint distribution will need to be consider. Lastly, this research only
considered hydrolysis reactions within the spore. Additional work should be done that
looks at the affects of the physical and chemical environment on the spore. Along with
various chemical and biologic processes that can affect the probability of survival of a
B.a spore after heat treatment.

82
Bibliography
1. Berg, Jeremy M., John L. Tymoczko, and Lubert Stryer. Biochemistry (6th
Edition).
New York: W.H. Freeman & Company, 2007.
2. Coates, Philip J., Sally A. Lorimore, and Eric G. Wright. “Cell and Tissue Responses
to Genotoxic Stress,” Journal of Pathology, 205: 221-235 (2005).
3. Cooper, Geoffrey M. and Robert E. Hausman. The Cell: A Molecular Approach (5th
Edition). Washington D.C.: ASM Press, 2009.
4. Dixon, Terry C., Matthew Meselson, Jeanne Guillemin, and Philip C. Hanna.
“Anthrax,” The New England Journal of Medicine, 341: 815-826 (1999)
5. Doughty, Alan and John C. Mackie. “Kinetics of Thermal Decomposition of the
Diazines: Shock-tube Pyrolysis of Pyrimidine,” Journal of the Chemical Society,
Faraday Transactions, 90: 541-548 (1994).
6. Driks, Adam. “The Bacillus subtilis spore coat,” Microbiology and Molecular
Biology Reviews, 63: 1-20 (March 1999).
7. Driks, Adam. “The Dynamic Spore.” PNAS, 100: 3007-3009 (March 2003).
8. Fleck, Oliver and Olaf Nielsen. “DNA repair,” Journal of Cell Science, 117: 515-517
(2004).
9. “Endospore.” 10 February 2011 <http:// wapedia.mobi/en/Endospore>.
10. Felker, Daniel. Analytical Chemist, AFIT, Personal Correspondence. 30 November
2010.
11. Gerhardt, P.C. and R. E. Marquis. “Spore Thermoresistance Mechanisms,”
Regulation of Prokaryotic Development, Washington DC: American Society for
Microbiology, (1989).
12. Giri, Narayan C. Introduction to Probability & Statistics (2nd
Edition). New York:
Marcel Dekker Inc., 1993.
13. Goetz, Kristina M. Lethality of Bacillus Anthracis Spores Due to Short Duration
Heating Measured Using Infrared Spectroscopy. MS thesis, AFIT/GNE/ENP/05-04.
Graduate School of Engineering and Management, Air Force Institute of Technology
(AU), Wright-Patterson AFB OH, March 2005.

83
14. Gould, G.W. “Recent Advances in the Understanding of Resistance and Dormancy in
Bacterial Spores,” Journal of Applied Bacteriology, 42: 297-309 (1977).
15. Gradshteyn, I.S. and I. M. Ryzhik. Table of Integrals, Series, and Products (4th
Edition). New York & London: Academic Press, 1965.
16. Hawkins, Leslie S. Micro-Etched Platforms for Thermal Inactivation of Bacillus
Anthracis and Bacillus Thuringiensis Spores. MS thesis, AFIT/GWM/ENP/08-M01.
Graduate School of Engineering and Management, Air Force Institute of Technology
(AU), Wright-Patterson AFB OH, March 2008.
17. Hansen, J.N., G. Spiegelman, and H.O. Halvorson. “Bacterial Spore Outgrowth: Its
Regulation,” Science, 168: 1291-1298 (1970).
18. Inglesby, Thomas V. and others. “Anthrax as a Biological Weapon,” JAMA, 281:
1735-1745 (1999).
19. Knight, Emily A. Modeling Thermal Inactivation of Bacillus Spores. MS thesis,
AFIT/GAM/ENC/09-01. Graduate School of Engineering and Management, Air
Force Institute of Technology (AU), Wright-Patterson AFB OH, March 2009
20. Kobayashi, Y., W. Steinberg, A. Higa, H. O. Halvorson, and C. Levinthal.
“Sequential Synthesis of Macromolecules during Outgrowth of Bacterial Spores,” In
L.L Campbell, and H. O. Halvorson (ed), Spores III. American Society for
Microbiology, Ann Arbor, Mich. p. 200-212.
21. Leuschner, Renata G.K. and Peter J. Lillford. “Investigation of Bacterial Spore
Structure by High Resolution Solid-State Nuclear Magnetic Resonance Spectroscopy
and Transmission Electron Microscopy,” International Journal of Food
Microbiology, 35: 35-50 (2001).
22. Lindahl, Tomas and Barbro Nyberg. “Heat-Induced Deamination of Cytosine
Residues in Deoxyribonucleic Acid,” Biochemistry, 13: 3405-3410 (1974).
23. Melly, E., P. C. Genest, M.E. Gilmore, S. Little, D. L. Popham, A. Driks, and P.
Setlow. “Analysis of the properties of spores of Bacillus subtilis prepared at different
temperatures,” Journal of Applied Microbiology, 92:1105-1115 (2000).
24. Menczel, Joseph D. and R. Bruce Prime. Thermal Analysis of Polymers,
Fundamentals and Applications. Hoboken, New Jersey: John Wiley & Sons, Inc.,
2009.
25. Meot-Ner (Mautner), Michael, Ashok R. Dongre, Arpad Somogyi, and Vicki H.
Wysocki. “Thermal Decomposition Kinetics of Protonated Peptides and Peptide
Dimers, and Comparison with Surface-induced Dissociation,” Rapid Communications
in Mass Spectrometry, 9: 829-836 (1995).

84
26. Missiakas, Dominique M. and Olaf Schneewind. “Bacillus anthracis and the
Pathogenesis of Anthrax,” In Luther E. Lindler, Frank J. Lebeda, and George W.
Korch (ed), Biological Weapons Defense: Infectious Diseases and Counterterrorism.
Infectious Diseases, Totowa, NJ. p. 79-97.
27. Moberly, Betty J., F. Shafa, and Philipp Gerhardt. “Structural Details of Anthrax
Spores During Stages of Transformation into Vegetative Cells.” Journal of
Bacteriology, 92: 220-228 (1966).
28. Mohomed, Kadine. "Thermogravimetric Analysis Theory, Operation, Calibration and
Data Interpretation." 18 August 2010 <
http://membrane.ces.utexas.edu/Home/LabPractice/TGA.ppt>.
29. Mohr, Peter J. and Barry N. Taylor. “CODATA Recommended Values of the
Fundamental Physical Constants: 2006,” Review of Modern Physics, 80: 633-730
(December 2007).
30. Plomp, Marco, Terrance J. Leighton, Katherine E. Wheeler, Haley D. Hill, and
Alexander J. Malkin. “In vitro high-resolution structural dynamics of single
germinating bacterial spores”. PNAS, 104: 9644-9649 (2007).
31. Rubinow, S.I. Introduction to Mathematical Biology. New York: John Wiley & Sons,
Inc., 1975.
32. Schwarzenbach, Rene P. Environmental Organic Chemistry. New York: John Wiley
& Sons, Inc., 1993.
33. Setlow, Peter. “The Bacterial Spore: Nature‟s Survival Package.” Culture, 26: 1-4
(September 2005).
34. Setlow, Peter. “Spores of Bacillus subtilis: Their Resistance To and Killing by
Radiation, Heat and Chemicals.” Journal of Applied Microbiology, 101: 514-525
(2006).
35. Setlow, Peter. “I Will Survive: Protecting and Repairing Spore DNA.” Journal of
Bacteriology, 174: 2737-2741 (May 1992).
36. Sokhansanj, Bahrad A., Garry R. Rodrigue, J. Patrick Fitch, and David M. Wilson III.
“A Quantitative Model of Human DNA Base Excision Repair. I. Mechanistic
Insights,” Nucleic Acids Research, 30: 1817-1825 (2002).
37. Tainer, John A., Maria M. Thayer, and Richard P. Cunningham. “DNA Repair
Proteins,” Current Opinion in Structural Biology, 5: 20-26 (1995).
38. "Thermogravimetric Analysis (TGA)/ Differential Thermal Analysis (DTA)." 18
August 2010 <http://www.cea.com/techniques/analytical_techniques/tga_dta.php>.

85
39. Willet, Hilda P. and Suydam Osterhout. “Bacillus,” In Joklik, Wolfgang K. and Hilda
P. Willett (ed), Zinsser Microbiology. New York: Appleton-Century-Crofts, 1976.
40. Yoshii, H., Furuta, T., Noma, S., and Noda, T. “Kinetic Analysis of Soy-protein
Denaturation by a Temperature Programmed Heat-denaturation Technique,”
Agricultural and Biological Chemistry, 54: 863-869 (1990).

86
REPORT DOCUMENTATION PAGE Form Approved OMB No. 074-0188
The public reporting burden for this collection of information is estimated to average 1 hour per response, including the time for reviewing instructions, searching existing data sources, gathering and maintaining the data needed, and completing and reviewing the collection of information. Send comments regarding this burden estimate or any other aspect of the collection of information, including suggestions for reducing this burden to Department of Defense, Washington Headquarters Services, Directorate for Information Operations and Reports (0704-0188), 1215 Jefferson Davis Highway, Suite 1204, Arlington, VA 22202-4302. Respondents should be aware that notwithstanding any other provision of law, no person shall be subject to an penalty for failing to comply with a collection of information if it does not display a currently valid OMB control number.
PLEASE DO NOT RETURN YOUR FORM TO THE ABOVE ADDRESS.
1. REPORT DATE (DD-MM-YYYY)
24-03-2011 2. REPORT TYPE
Master‟s Thesis 3. DATES COVERED (From – To)
September 2009 – March 2011
TITLE AND SUBTITLE
Modeling of Bacillus spores: Inactivation and Outgrowth
5a. CONTRACT NUMBER
5b. GRANT NUMBER
5c. PROGRAM ELEMENT NUMBER
6. AUTHOR(S)
Hurst, Alexis X.
5d. PROJECT NUMBER
JON: 10P281 JON: 11P113 5e. TASK NUMBER
5f. WORK UNIT NUMBER
7. PERFORMING ORGANIZATION NAMES(S) AND ADDRESS(S)
Air Force Institute of Technology
Graduate School of Engineering and Management (AFIT/ENC)
2950 Hobson Way, Building 641
WPAFB OH 45433-8865
8. PERFORMING ORGANIZATION REPORT NUMBER
AFIT/GAM/ENC/11-01
9. SPONSORING/MONITORING AGENCY NAME(S) AND ADDRESS(ES)
AFNWC/EN Attn: Lt. Col Brian L. Evans and Ms. Angelica I. Rubio
1551 Wyoming Blvd SE, Kirtland AFB, NM 87117 (505)853-3266
Defense Threat Reduction Agency Attn: Su Peiris, RD-BAS, Cube 3645E
8725 John J Kingman Rd STOP 6201, Fort Belvoir, VA 22060-6201
10. SPONSOR/MONITOR’S ACRONYM(S)
AFNWC/EN DTRA 11. SPONSOR/MONITOR’S REPORT NUMBER(S)
12. DISTRIBUTION/AVAILABILITY STATEMENT
APPROVED FOR PUBLIC RELEASE; DISTRIBUTION UNLIMITED.
13. SUPPLEMENTARY NOTES
14. ABSTRACT This research models and analyzes the thermochemical damage produced in Bacillus spores by
short, high-temperature exposures as well the repair process within damaged Bacillus spores. Thermochemical
damage in spores is significantly due to reaction with water, hydrolysis reactions. Applying heat to the spore causes
absorbed and chemically bound water molecules become mobile within the spore. These mobile water molecules
react by hydrolysis reactions to degrade DNA and enzyme molecules in the spore. In order to survive the thermal
inactivation, the spore must repair the damaged DNA during spore germination. The DNA repair process, as well as
other germination functions, is dependent on reactions catalyzed by enzymes that are viable after the thermal
exposure. Increased damage to the enzymes during thermal inactivation, affects the rate at which the spore DNA is
repaired. If the enzymes are damaged to such an extent that the DNA repair is not completed, the spore is unable to
germinate, or produce outgrowth. The DNA repair process, repair enzymes, and outgrowth time influences the
spore‟s chance of survival. Using this information, a probability of survival model was created based on water
mobility, hydrolysis reactions, an initial state of DNA, viable repair enzymes, and an outgrowth time.
15. SUBJECT TERMS
Bacillus, anthrax, thermal exposure, DNA repair, outgrowth
16. SECURITY CLASSIFICATION OF:
17. LIMITATION OF ABSTRACT
UU
18. NUMBER OF PAGES
99
19a. NAME OF RESPONSIBLE PERSON
William P. Baker, PhD (ENC) a. REPORT
U
b. ABSTRACT
U
c. THIS PAGE
U
19b. TELEPHONE NUMBER (Include area code)
(937) 255-6565, x4517 [email protected]
Standard Form 298 (Rev. 8-98) Prescribed by ANSI Std. Z39-18