Air Flow in Sewers - Ohio Water Environment … Air_flow_in_sewers_5-10-2012_v02.pdf · than the...
41
Air Flow in Sewers Approach to Design Sewers for both Air and Water OWEA 2012 Collection Systems Specialty Conference May 10, 2012 Foster A. McMasters, Jr., PE, BCEE May 10, 2012
Transcript of Air Flow in Sewers - Ohio Water Environment … Air_flow_in_sewers_5-10-2012_v02.pdf · than the...

Air Flow in Sewers
Approach to Design Sewers for both Air and Water
OWEA 2012 Collection Systems Specialty Conference
May 10, 2012
Foster A. McMasters, Jr., PE, BCEE
May 10, 2012

Air Flow Presentation Agenda
• Objective
• Background
• Approach to Calculating Air Flows
• Pressure Criteria to Control Odor Release
• Estimating Design Air Flow Rates
• Design Example 1 – Co-current Flow
• Design Example 2 – Counter-current Flow
May 10, 2012 Air Flow in Sewers Page 2

Objective A properly designed wastewater collection system must be
designed to satisfactorily convey two fluids -- air and water.
Proper sewer design can prevent discharge of the air at
unplanned locations, minimizing sewer odor complaints.

Sewers must be designed to convey both air and water
• Air flow within, as well as in and out of sewers is often neglected during
sewer design despite its importance in controlling the occurrence of
odor problems and the development of corrosion-inducing atmospheres
within the sewer.
• These issues have become more pronounced in the large, deep
interceptors used to convey and store wastewater to control overflows.
• Contributing factors:
– Dependence on hydraulic computer models
– Inappropriate friction factors used for design
– Lack of attention to obstructions to air flow
May 10, 2012 Page 4 Air Flow in Sewers

Plumbing code provides for both air and water
• Plumbing codes clearly define requirements for venting and trapping of
plumbing in homes and buildings
• The municipal wastewater collection system is an extension of the
building plumbing systems with:
– Wastewater discharging to the WWTP, and
– Air often discharging at unplanned locations
• Large interceptors are a particular concern
– limited number of manholes or shafts
– often allowed to become surcharged at their downstream end
– blockage to air flow results in a buildup of air pressure, escape of significant
air volumes at a few locations, and associated odor problems.
May 10, 2012 Page 5 Air Flow in Sewers
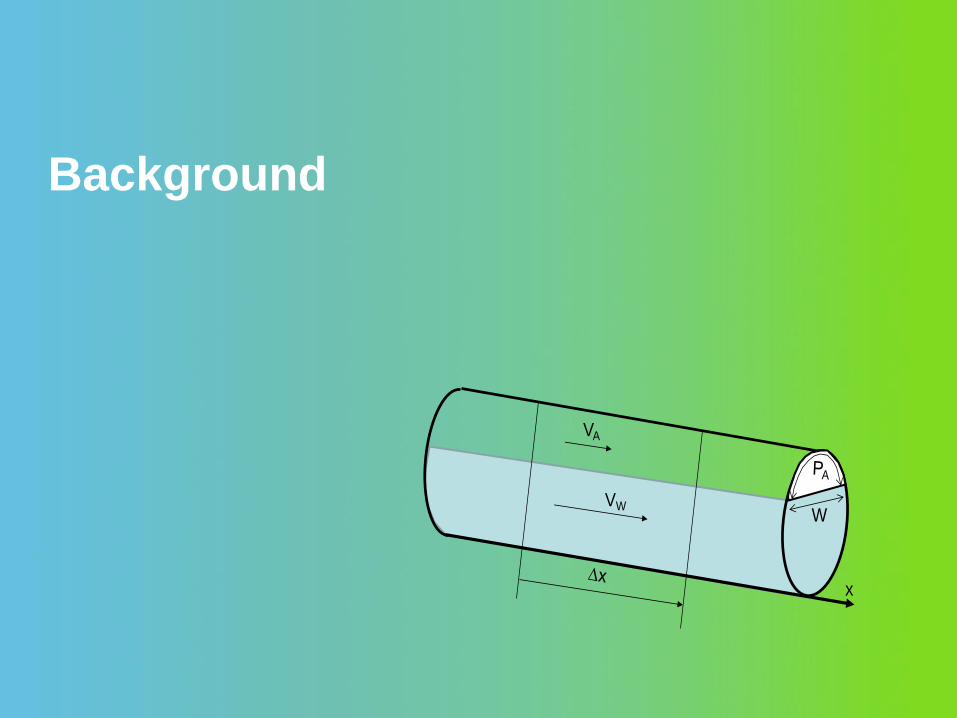
Background
VW
VA
x
W

Wastewater Related References
• Thistlethwayte, D. K. B. 1972. The
Control of Sulphides in Sewerage
Systems,
• Henry T. Falvey. 1980. Air-Water
Flow in Hydraulic Structures,
Engineering Monograph No. 41,
United Stages Department of the
Interior
• Pescod, M.B. and Price, A.C. 1982.
Major Factors in Sewer Ventilation.
Journal of the Water Pollution
Control Federation, 1982. Vol 54,
No.4.
May 10, 2012 Air Flow in Sewers Page 7
From Pescod & Price (1982)
From EM No. 41 (1980)

Wastewater Related References
• Edwini-Bonsu, S and P.M. Steffler.
2004. Air Flow in Sanitary Sewer
Conduits Due to Wastewater Drag: a
Computational Fluid Dynamics
Approach, Journal of Environmental
Engineering and Science, Volume 3,
Number 5, August 2004, pp.
331342(12)
• Witherspoon, J., Easter, C., and
Apgar, D. 2009. Collection System
Ventilation Final Report. Water
Environment Research Foundation
Report ISBN 9781843392880.
May 10, 2012 Air Flow in Sewers Page 8

Hydraulic Approach to Calculating Air Flows
VW
VA
x
W

Calculation Approach
• Headloss is calculated from air friction along the water
interface and along the conduit wall
• Two air flow conditions to evaluate
– Counter-current flow
– Co-current flow
• Calculate air flows and pressures over the full range of
wastewater flows for the project
VW
VA
VW
VA
May 10, 2012 Air Flow in Sewers Page 10

The formula for counter-current flow is:
• DH / Dx = (fC / 4RHC) (VA2 / 2g) + (fW / 4RHW) (VA + VW)2 / 2g)
– Expanding gives:
– DH / Dx = (fC PC / 4A) (VA2 / 2g) + (fW W / 4A) (VW + VA)2 / 2g)
• DH = head loss (ft or m),
• Dx = distance (ft or m),
• VA = air velocity (ft/s or m/s),
• VW = water velocity (ft/s or m/s),
• PC = air contact perimeter with conduit, (ft or m)
• A = air cross section area (ft2 or m2),
• W = water surface width, (ft or m)
• g = acceleration of gravity (ft/s2 or m/s2),
• fC = air-conduit friction factor,
• fW = air-water friction factor
Calculation Approach for Counter-Current Flow
May 10, 2012 Page 11 Air Flow in Sewers
W
PC
VW
VA

The formula for co-current flow with VA less than VW is:
• DH / Dx = (fC / 4RHC) (VA2 / 2g) - (fW / 4RHW) (VW - VA)2 / 2g)
– Expanding gives:
– DH / Dx = (fC PC / 4A) (VA2 / 2g) - (fW W / 4A) (VW - VA)2 / 2g)
Calculation Approach for Co-current Flow
May 10, 2012 Page 12 Air Flow in Sewers
VW
VA
W
PC

The formula for co-current flow with VA greater than VW is :
• DH / Dx = (fC / 4RHC) (VA2 / 2g) + (fW / 4RHW) (VW - VA)2 / 2g)
– Expanding gives:
– DH / Dx = (fC PC / 4A) (VA2 / 2g) + (fW W / 4A) (VW - VA)2 / 2g)
– Applicable to fan driven systems
Calculation Approach for Co-current Flow
May 10, 2012 Page 13 Air Flow in Sewers
VW
VA
W
PC

Data Required to Characterize the Collection System
• Pipe invert, top of pipe, and ground elevations,
• Pipe slope, length, roughness coefficient,
• Access chamber locations and depths,
• Wastewater flows:
– typical day maximum, minimum, and average,
– peak wet weather flows,
• Air inlet and exhaust sizes and locations identified,
• Headspace obstructions identified.
May 10, 2012 Air Flow in Sewers Page 14

Develop a spreadsheet model of the wastewater system:
• Each section between access chambers, pipe size changes, or pipe
slope changes is calculated separately,
• Wastewater depths and velocities calculated using the Manning
equation,
• Air pressures calculated based on collection system elevation and
pressure changes in the headspace based on the Darcy equation,
• Determine air pressure at each shaft and calculate the air inflow or
outflow using a conventional orifice equation,
• Concrete surface and water surface impacts calculated separately.
• Air flows are based on design basis air flows for each air exhaust
/intake location in the system.
May 10, 2012 Air Flow in Sewers Page 15

Spreadsheet Headloss Calculation
May 10, 2012 Air Flow in Sewers Page 16
• Wastewater = 2.8 m3/s (8.5 MGD)
• Air = 27,200 m3/hr (16,000 cfm)

Calculate each segment, each size change, and each
grade change
May 10, 2012 Air Flow in Sewers Page 17
AS
11
AS
10
air water

Typical air pressure profile
May 10, 2012 Air Flow in Sewers Page 18
Chainage (meters)
Ground Line Shaft Centerline
Sewer Wall 150.82 Invert Elevation
140
160
140
160
180 180
200 200
183.0
191.5
187.7
175.5 175.5
150.82 152.99
146.61 144.58
141.69
Shaft
9
Shaft
10
Shaft
11
Shaft
12
Shaft
13
Air
In
take
Air
Ou
t
0 1,000 2,000 3,000 4,000 5,000 6,000 7,000
Ele
va
tion
(m
ete
rs)
120
100
120
100
112.32
123.99

Minimum Pressure Criteria Design Criteria to Control Odor Release

Negative Air Pressure Required to Prevent Escape of
Odorous Air
• “Rule of Thumb” value is typically -0.05 inches water pressure
• Deep shafts can require a lower negative pressure due to “stack
effect”
• The stack effect occurs as a result of the
air in the interceptor being of lower density
than the atmospheric air
May 10, 2012 Air Flow in Sewers Page 20
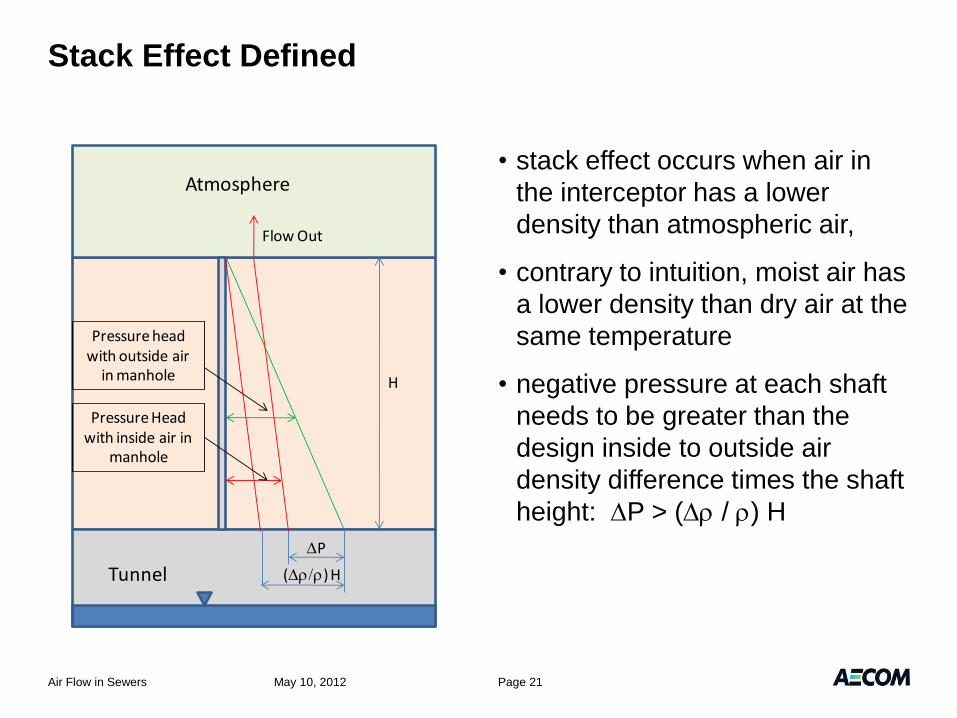
Stack Effect Defined
• stack effect occurs when air in
the interceptor has a lower
density than atmospheric air,
• contrary to intuition, moist air has
a lower density than dry air at the
same temperature
• negative pressure at each shaft
needs to be greater than the
design inside to outside air
density difference times the shaft
height: DP > (Dr / r) H
May 10, 2012 Air Flow in Sewers Page 21
Pressure head with outside air
in manhole
DP
Pressure Head with inside air in
manhole
Flow Out
Tunnel
H
(Dr/r) H
Atmosphere

Stack Effect Example
• Shaft depth is 44 m (144-ft)
• Outside air at -20oC (-4oF) and
25% relative humidity
• Sewer air at 13oC (55oF) and
100% relative humidity
• (Dr / r) = 0.14
• Required pressure is -0.29
inches water pressure
– 6 times the “rule-of-thumb”
May 10, 2012 Air Flow in Sewers Page 22

Estimating Design Air Flow Rates

Starting Point to Select a Design Air Flow Rate
Thistlethwayte Recommendation
• 0.05 cubic feet per minute per square foot of sewage surface
• 0.914 cubic meters per hour per square meter of sewage surface
Natural flow condition to produce 0.05 cfm of air flow
• Generalized Case
– Pipe = 72-inch RCP
– Pipe wall friction factor = water surface friction factor
– Pipe Slope = 0.30%
– Wastewater Velocity at 50% full = 8.2 ft/s (2.5 m/s)
– Froude No is >1, so subcritical flow regime
May 10, 2012 Page 24 Air Flow in Sewers

Design Example No 1 -- Co-current Flow 3 m (9.8-ft) Diameter Trunk Sewer

YDSS Southeast Collector Trunk Sewer Project
May 10, 2012 Air Flow in Sewers Page 26

Southeast Collector Trunk Sewer Project 15,000 m (49,200 ft) -- 3.0 m dia (9.84 ft) -- Tunnel construction
May 10, 2012 Air Flow in Sewers Page 27

SeC Air Handling Design
• Central OCF Location
• Upstream air = 27,200 m3/hr (16,000 cfm)
• Downstream air = 31,000 m3/hr (18,200 cfm)
• Air Intakes at Shaft 13 & CDC Chamber
• Fans around Drop Shafts 4 & 6
May 10, 2012 Air Flow in Sewers Page 28
Air Flow
Wastewater Flow

Southeast Collector Profile
May 10, 2012 Air Flow in Sewers Page 29
Proposed OCF
(Shaft 9)
Air Drawn with Wastewater Flow
(within headspace of pipe)
Air Drawn Counter to Wastewater Flow
(within headspace of pipe)
Air Bypass Piping and fan (to be confirmed) to allow air to pass submerged baffle drop structures and metering facility
Sh
aft
13
Sh
aft
12
Sh
aft
11
Sh
aft
10
Sh
aft
9
Sh
aft
8
Sh
aft
6
Sh
aft
5
Ma
int.
Sh
aft
Sh
aft
4
Ma
int.
Sh
aft
Sh
aft
2
Co
nn
ectio
n C
ha
mb
er
100 100
200 200
150 150
50 50
Distance (m)
Ele
vation (
mA
MS
L)
15+000 10+000 0+000 5+000
Air Intake Air Intake Air bypass piping and fans provided to allow
air to pass drop structures at high flow
Air Drawn Counter to Wastewater Flow
(within headspace of pipe)
Air Drawn with Wastewater Flow
(within headspace of pipe)

Southeast Collector (upstream section)
• Wastewater = 2.8 m3/s (8.5 MGD)
• Air = 27,200 m3/hr (16,000 cfm)
May 10, 2012 Air Flow in Sewers Page 30

SeC Air Pressure Profile (Pressure = -0.25 to -0.45 in-water)
May 10, 2012 Air Flow in Sewers Page 31

Southeast Collector (with “leaks” at access chambers)
May 11, 2012 Air Flow in Sewers Page 32

Design Example No. 2 – Counter-current flow Parallel Trunk Sewers

Metro Vancouver South Surry Interceptor – Air Management and Odour Control
• Maintain negative pressure
• 64th Avenue to 152nd Street
• 10,100 meters (33,100 ft)
• Parallel Interceptors
– 1.4 m wide x 1.75 m high box
– 1.675 to 3.05 m diameter
• Relatively flat 0.03% slope
• Siphon at downstream end
• Two pumping stations
– Crescent Beach
– Cloverdale
May 10, 2012 Air Flow in Sewers Page 34

South Surry Interceptors
Hwy 10 Grit Crescent
Beach JC
King George
Grit
Crescent Beach PS /
Central Trunk JC
May 10, 2012 Air Flow in Sewers Page 35

Hydraulic Model Needed for more complex SSI System
May 10, 2012 Air Flow in Sewers Page 36
• SWMM Model with dynamic wave routing
– Necessary to evaluate surcharge/backwater effects
• Typical Day and Peak Day flow patterns developed
– Crescent Beach Pump Station
– Cloverdale Pump Station
– Central Valley Trunk
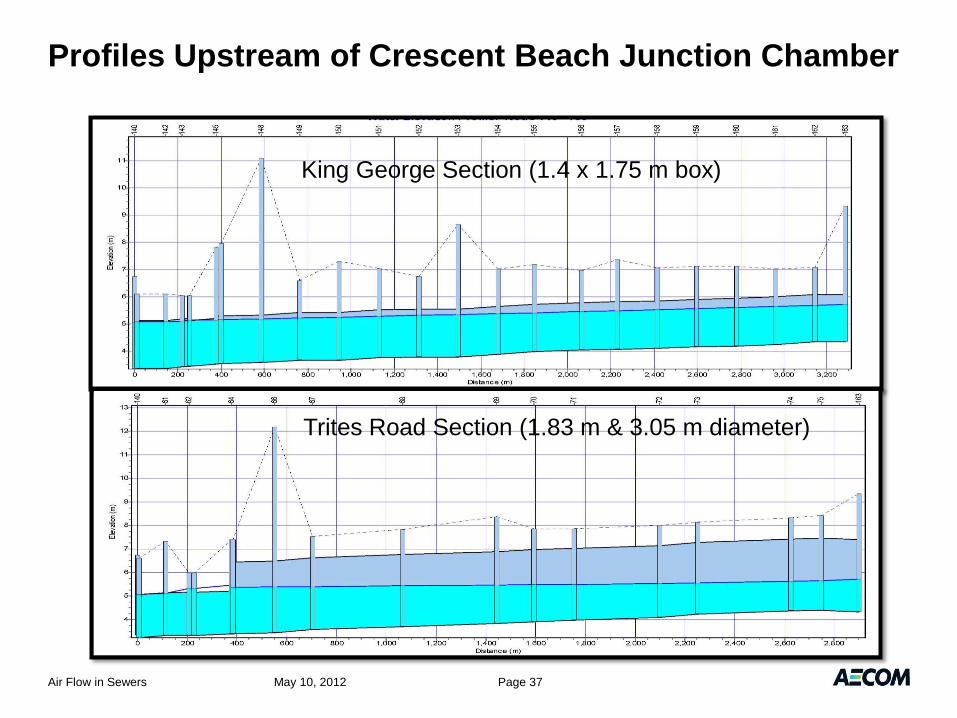
Profiles Upstream of Crescent Beach Junction Chamber
May 10, 2012 Air Flow in Sewers Page 37
King George Section (1.4 x 1.75 m box)
Trites Road Section (1.83 m & 3.05 m diameter)

Air Model Prepared for SSI System
May 10, 2012 Air Flow in Sewers Page 38

SSI Air Management Recommendations
May 10, 2012 Air Flow in Sewers Page 39
OCF at King George Grit Chamber Air Flow
Pressure
Downstream Design Air Flow 16,000 cfm
-3.0
in-water
Upstream Design Air Flow 7,000 cfm
-1.0
in-water
Total OCF Design Air Flow 23,000 cfm
• Locate Odour Control Facility at King George Grit Site
– Air dam required to separate downstream/upstream headspaces
• New Air Intake at Highway 10 Grit Chamber
– Crescent Beach Pump Station
• “Air Jumper” required around the Crescent Beach Junction Chamber
– King George Section planned to serve as “air jumper”
• Provide traps to block any large “air leak” locations (if any)

Conclusions
•All sewers should be designed to properly
convey both water and air

Thank You Please send examples from your system to the author at:
Air Flow in Sewers May 10, 2012