AINL 2016: Muravyov
35
Towards Cluster Validity Index Evaluation and Selection Andrey Filchenkov, Sergey Muravyov, Vladimir Parfenov ITMO University St. Petersburg, Russia {afilchenkov,smuravyov}@corp.ifmo.ru, [email protected] 11.11.2016
-
Upload
lidia-pivovarova -
Category
Science
-
view
237 -
download
0
Transcript of AINL 2016: Muravyov

Towards Cluster Validity Index Evaluation and Selection
Andrey Filchenkov, Sergey Muravyov, Vladimir Parfenov
ITMO University St. Petersburg, Russia
{afilchenkov,smuravyov}@corp.ifmo.ru, [email protected]
11.11.2016

What is clustering?
Clustering means grouping the objects based on the information found in the data describing the objects or their relationships.
The goal is that the objects in a group will be similar (or related) to one other and different from (or unrelated to) the objects in other groups.
2 / 35
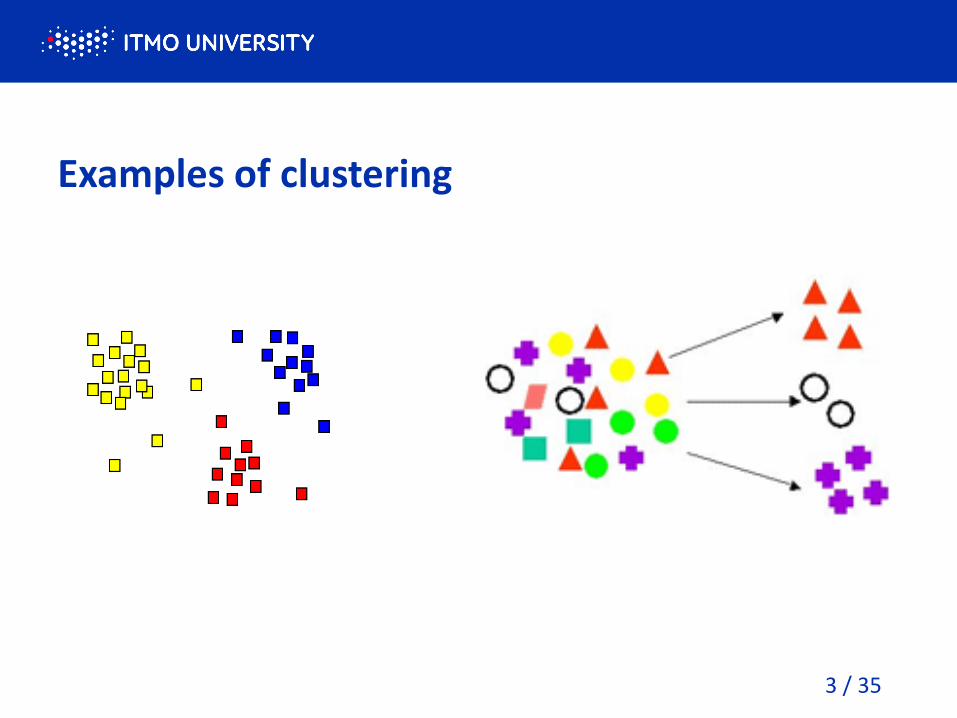
Examples of clustering
3 / 35

Applications of clustering
Biology
Medicine
Business and marketing
Social science
Computer science
4 / 35
Clustering Evaluation
No target field
Two ways of partition evaluation:
• External
• Internal
5 / 35

External measures
Based on known class labels and external benchmarks
Examples:
• F-measure
• Rand measure
• Jaccard index
Not applicable for real-life tasks!
6 / 35

Internal measures
Usually assign the best score to the algorithm that produces clusters with high similarity within a cluster and low similarity between clusters
No need for extra information
7 / 35
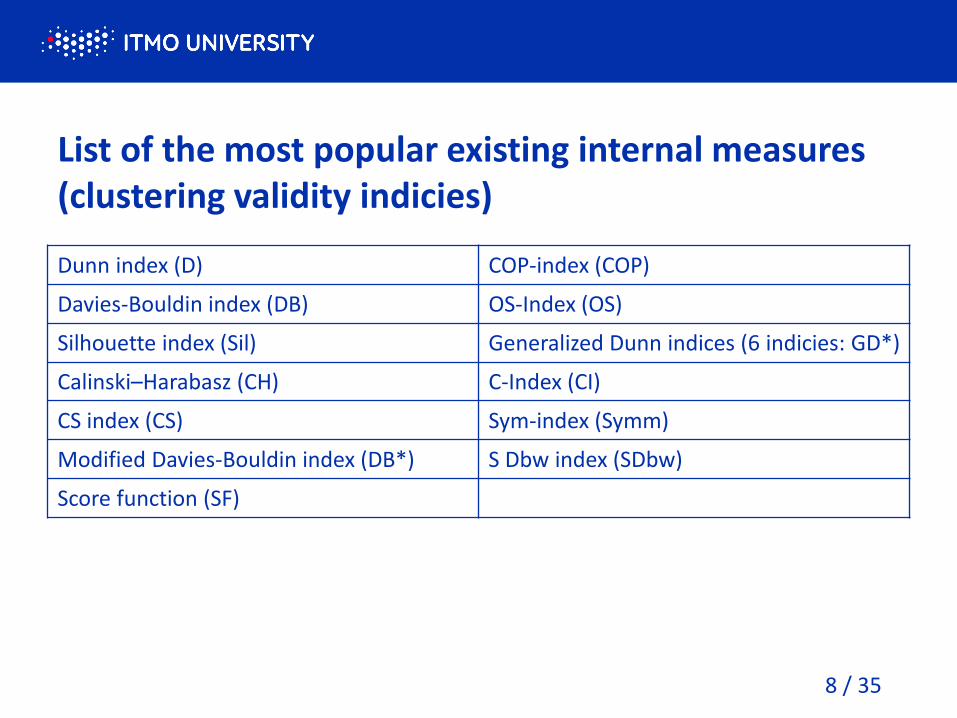
List of the most popular existing internal measures (clustering validity indicies)
Dunn index (D) COP-index (COP)
Davies-Bouldin index (DB) OS-Index (OS)
Silhouette index (Sil) Generalized Dunn indices (6 indicies: GD*)
Calinski–Harabasz (CH) C-Index (CI)
CS index (CS) Sym-index (Symm)
Modified Davies-Bouldin index (DB*) S Dbw index (SDbw)
Score function (SF)
8 / 35
Problem of choice
There are a lot of CVIs
Which one should be chosen for a hard clustering problem?
• How to compare the existing ones?
• How to evaluate each one?
9 / 35

Approaches for CVI comparison
Visual-based comparison
Comparison with known labels
Purely theoretical comparison that is based on studying CVI properties
Comparison based on stability, robustness of structure, or other desired properties
10 / 35

Approaches for CVI comparison
Visual-based comparison
Comparison with known labels
Purely theoretical comparison that is based on studying CVI properties
Comparison based on stability, robustness of structure, or other desired properties
11 / 35

Practical approach for partition evaluation
It is stated in the classical book [1], ”Understanding our world requires conceptualizing the similarities and differences between the entities that compose it”
M. Ackerman showed that there is no difference in partition evaluations made by clustering experts and non-experts
The only way of obtaining ground truth for partition quality estimation is human estimation
12 / 35 [1] - R.C. Tryon and D. E. Bailey, Cluster analysis, 1970

Formalized ground truth for partitions
Let 𝐶 denote the space of clustering tasks
Weak ordering:
• 𝐻𝑟 𝑐 : 𝐶 → 𝑃𝑎𝑟𝑡𝑖𝑡𝑖𝑜𝑛 𝑐 × 𝑃𝑎𝑟𝑡𝑖𝑡𝑖𝑜𝑛 𝑐 , 𝑐 ∈ 𝐶
Binary estimation scale
• 𝐻𝑏: 𝑃𝑎𝑟𝑡𝑖𝑡𝑖𝑜𝑛 𝑐 → {0,1}
13 / 35

Measure evaluation framework
Procedure for one assessor
Procedure for multiple assessors
14 / 35
Procedure for one assessor
Evaluate all possible partitions
Set partial order, compare all pairs of partitions
15 / 35

Constraints on one-assessors procedure
Choose finite set of partitions
Mark each partition with a number
• There is a score function that can be put into correspondence to any weak strict order
16 / 35

Procedure for multiple assessors
Four criteria for each CVI:
• Binarized adequacy
• Weighted adequacy
• Adequacy of the best
• Aggregated ranking
17 / 35

Binarized adequacy
𝑅𝐵𝐴 = 𝜌𝐾𝜏(𝑏𝑏𝑒𝑠𝑡,𝑏𝐶𝑉𝐼)
𝜌𝐾𝜏(𝑏𝑏𝑒𝑠𝑡,𝑏𝑤𝑜𝑟𝑠𝑡)
• 𝑏𝐶𝑉𝐼 — permutation on binary marks with respect to the CVIs estimations of these partitions, contains of + and −
• 𝑏𝑏𝑒𝑠𝑡 — best permutation: + + ⋯ + − ⋯ −
• 𝑏𝑤𝑜𝑟𝑠𝑡— worst permutation: − ⋯ − + ⋯ +
• 𝜌𝐾𝜏 — modified Kendall tau distance
18 / 35

Weighted adequacy
𝑅𝑊𝐴 = 𝜌𝐾𝜏(𝑟𝑏𝑒𝑠𝑡,𝑟𝐶𝑉𝐼)
𝜌𝐾𝜏(𝑟𝑏𝑒𝑠𝑡,𝑟𝑤𝑜𝑟𝑠𝑡)
• Instead of + and − we take the amount of assessors that gave an adequate mark to CVI: 𝑤𝑖
• 𝑟𝐶𝑉𝐼 — permutation on weighted marks with respect to the CVIs estimations of these partitions
• 𝑟𝑏𝑒𝑠𝑡 — best permutation: 𝑤1 ≥ ⋯ ≥ 𝑤𝑛
• 𝑟𝑤𝑜𝑟𝑠𝑡— worst permutation:𝑤1 ≤ ⋯ ≤ 𝑤𝑛
• 𝜌𝐾𝜏 — modified Kendall tau distance
19 / 35
Adequacy of the best
Chose the adequacy mark, which was assigned to the partition having the highest value of CVI being estimated.
20 / 35

Aggregated ranking
Represents how many orderings produced by the assessors and by each CVI differ
Weak order aggregation algorithm and distance measure 𝜌 J. L. Garcia-Lapresta and D. Perez-Roman
𝑅𝐴𝑅 = 𝜌(𝑎𝑟𝑏𝑒𝑠𝑡,𝑎𝑟𝐶𝑉𝐼)
𝜌(𝑎𝑟𝑏𝑒𝑠𝑡,𝑎𝑟𝑤𝑜𝑟𝑠𝑡)
• 𝑎𝑟∗— aggregated ordering
21 / 35

Experimental evaluation
19 of the most popular CVIs were taken to find out if any of them matches the real quality of resulting clusters
22 / 35

Experimental data
41 datasets:
• Artificial
• 2D
23 / 35

Clustering algorithms
6 algorithms:
• 𝑘-Means
• X-Means
• EM
• DBSCAN
• FarthestFirst
• Hierarchical
14 configurations totally
24 / 35

Example of partitions (densed clusters)
25 / 35
Initial K-Means
EM Hierarchical

Example of partitions (curves topology)
26 / 35
Initial K-Means
EM Hierarchical

Summarization for binarized adequacy
CVI Adequacy CVI Adequacy
DB 0.151 Symm 0.333
D 0.515 CI 0.121
Syl 0.393 DB* 0.121
CH 0.352 GD31 0.333
SDBW 0.454 GD41 0.435
SF 0.393 GD51 0.393
CS 0.303 GD33 0.352
COP 0.575 GD43 0.272
SV 0.272 GD53 0.333
OS 0.575 threshold 0.7
27 / 35
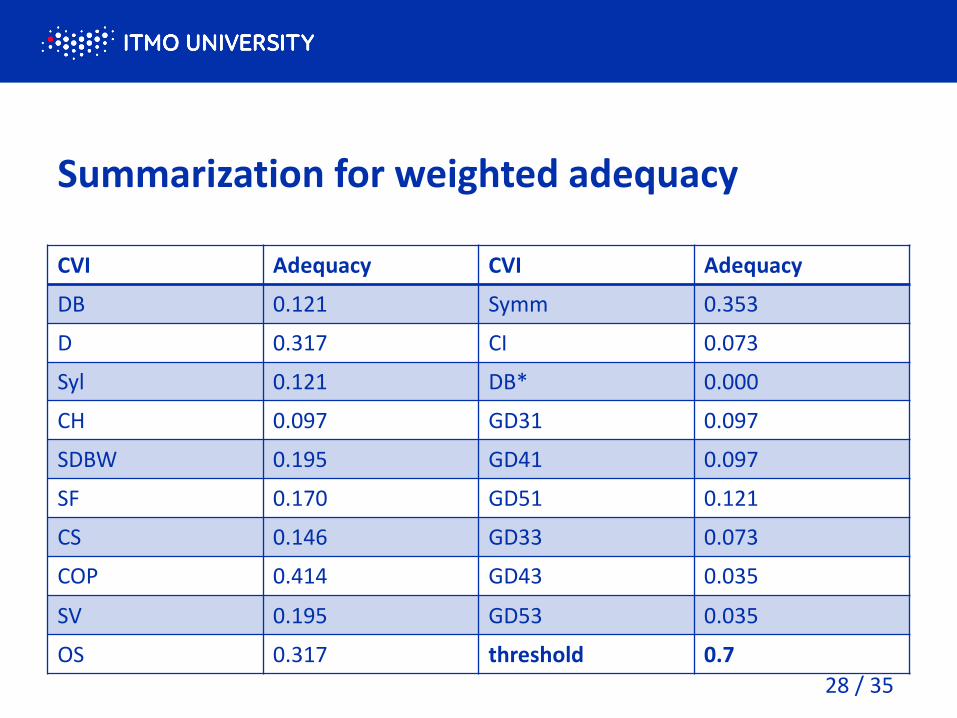
Summarization for weighted adequacy
CVI Adequacy CVI Adequacy
DB 0.121 Symm 0.353
D 0.317 CI 0.073
Syl 0.121 DB* 0.000
CH 0.097 GD31 0.097
SDBW 0.195 GD41 0.097
SF 0.170 GD51 0.121
CS 0.146 GD33 0.073
COP 0.414 GD43 0.035
SV 0.195 GD53 0.035
OS 0.317 threshold 0.7
28 / 35
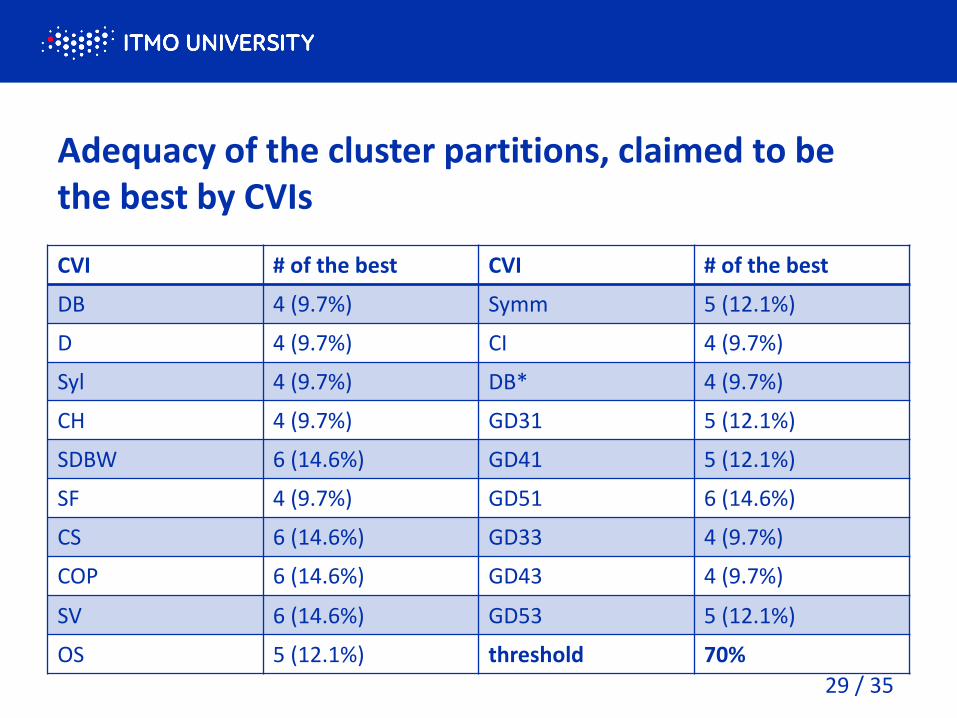
Adequacy of the cluster partitions, claimed to be the best by CVIs
CVI # of the best CVI # of the best
DB 4 (9.7%) Symm 5 (12.1%)
D 4 (9.7%) CI 4 (9.7%)
Syl 4 (9.7%) DB* 4 (9.7%)
CH 4 (9.7%) GD31 5 (12.1%)
SDBW 6 (14.6%) GD41 5 (12.1%)
SF 4 (9.7%) GD51 6 (14.6%)
CS 6 (14.6%) GD33 4 (9.7%)
COP 6 (14.6%) GD43 4 (9.7%)
SV 6 (14.6%) GD53 5 (12.1%)
OS 5 (12.1%) threshold 70%
29 / 35

Summarization for weighted adequacy
CVI Rank CVI Rank
DB 0.390 Symm 0.292
D 0.353 CI 0.353
Syl 0.170 DB* 0.317
CH 0.073 GD31 0.073
SDBW 0.353 GD41 0.146
SF 0.146 GD51 0.195
CS 0.146 GD33 0.035
COP 0.414 GD43 0.035
SV 0.414 GD53 0.073
OS 0.073 threshold 0.7
30 / 35
Results
None of the metrics fits the requirements described above
No perfectly applicable, universal metric
CVIs should be chosen for problems specifically
31 / 35
Main disadvantage of proposed measure evaluation framework
Expensive: each new dataset has to be evaluated by assessors
Improvement:
• Meta-learning
32 / 35

Meta-learning approach
Selecting a CVI based on the set of meta-features
Classification task:
• Train on datasets by using framework described above
33 / 35

Conclusion
Assessors’ estimates should be used as the ground truth (and measure of CVI quality)
No universal clustering validity index existing at the moment
Cluster validity indices should be chosen for problems specifically (meta-leaning approach)
34 / 35

QA Session
35 / 35


![[XLS] · Web view11/1/2016 1/25/2016 1/22/2016 1/22/2016 1/21/2016 1/21/2016 1/21/2016 1/21/2016 1/21/2016 1/21/2016 1/21/2016 1/21/2016 1/20/2016 1/20/2016 1/19/2016 1/18/2016 1/18/2016](https://static.fdocuments.us/doc/165x107/5c8e2bb809d3f216698ba81b/xls-web-view1112016-1252016-1222016-1222016-1212016-1212016-1212016.jpg)