
Aimee Flannery Jenny Meszaros Applied Engineering ... · Flannery was supported by Ms. Jenny...
154
SHRP 2 L34 COPY X OF X e-tool FOR BUSINESS PROCESSES TO IMPROVE TRAVEL TIME RELIABILITY FINAL REPORT Prepared for The Strategic Highway Research Program 2 Transportation Research Board of The National Academies TRANSPORTATION RESEARCH BOARD OF THE NATIONAL ACADEMIES PRIVILEGED DOCUMENT This report, not released for publication, is furnished only for review to members of or participants in the work of SHRP 2. This report is to be regarded as fully privileged, and dissemination of the information included herein must be approved by SHRP 2. Aimee Flannery Jenny Meszaros Applied Engineering Management Corporation Herndon, VA January 2014
Transcript of Aimee Flannery Jenny Meszaros Applied Engineering ... · Flannery was supported by Ms. Jenny...

SHRP 2 L34 COPY X OF X
e-tool FOR BUSINESS PROCESSES TO IMPROVE
TRAVEL TIME RELIABILITY
FINAL REPORT
Prepared for
The Strategic Highway Research Program 2
Transportation Research Board
of
The National Academies
TRANSPORTATION RESEARCH BOARD
OF THE NATIONAL ACADEMIES
PRIVILEGED DOCUMENT
This report, not released for publication, is furnished only for review to
members of or participants in the work of SHRP 2. This report is to be
regarded as fully privileged, and dissemination of the information
included herein must be approved by SHRP 2.
Aimee Flannery
Jenny Meszaros
Applied Engineering Management Corporation
Herndon, VA
January 2014

THIS PAGE INTENTIONALLY LEFT BLANK
i
ACKNOWLEDGMENT OF SPONSORSHIP
This work was sponsored by Federal Highway Administration in cooperation with the
American Association of State Highway and Transportation Officials, and it was conducted in the
Strategic Highway Research Program, which is administered by the Transportation Research
Board of the National Academies.
DISCLAIMER
This is an uncorrected draft as submitted by the research agency. The opinions and
conclusions expressed or implied in the report are those of the research agency. They are not
necessarily those of the Transportation Research Board, the National Academies, or the program
sponsors.

ii
THIS PAGE INTENTIONALLY LEFT BLANK

iii
SHRP 2 L34
e-tool for Business Processes to Improve
Travel Time Reliability
Aimee Flannery
Jenny Meszaros
Applied Engineering Management Corporation
Herndon, VA
January 2014

iv
THIS PAGE INTENTIONALLY LEFT BLANK
v
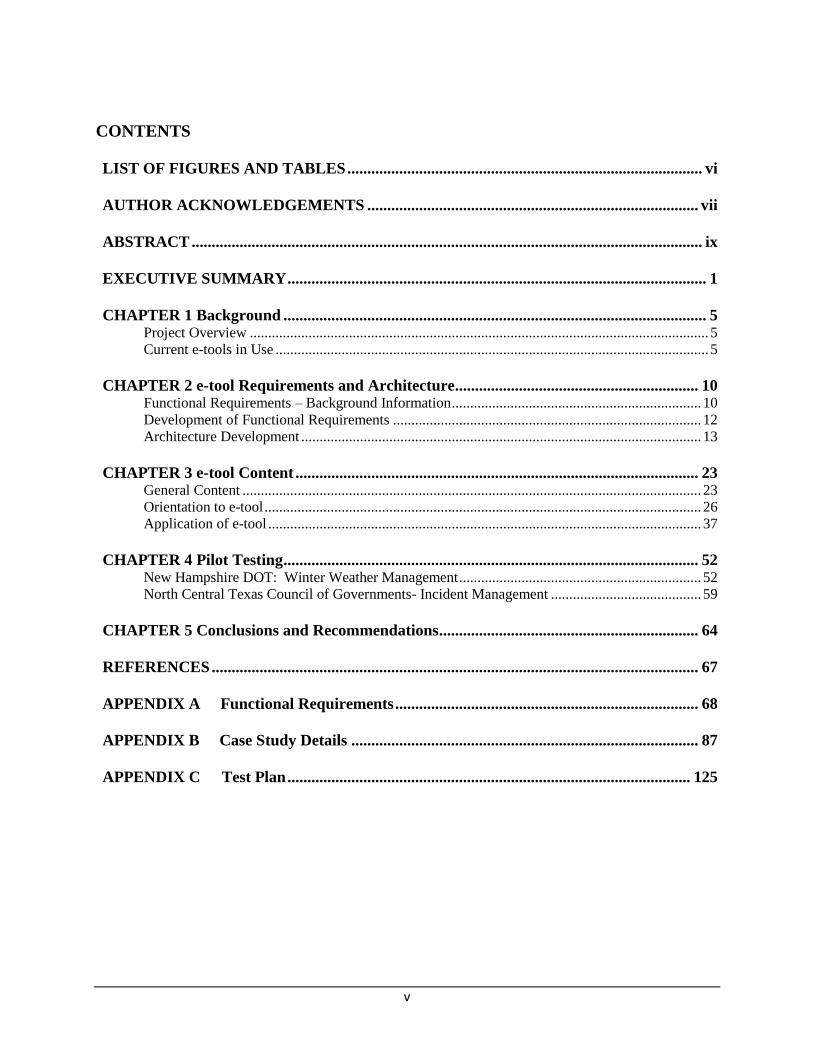
CONTENTS
LIST OF FIGURES AND TABLES ......................................................................................... vi
AUTHOR ACKNOWLEDGEMENTS ................................................................................... vii
ABSTRACT ................................................................................................................................ ix
EXECUTIVE SUMMARY ......................................................................................................... 1
CHAPTER 1 Background .......................................................................................................... 5 Project Overview ............................................................................................................................. 5 Current e-tools in Use ...................................................................................................................... 5
CHAPTER 2 e-tool Requirements and Architecture............................................................. 10 Functional Requirements – Background Information .................................................................... 10 Development of Functional Requirements .................................................................................... 12 Architecture Development ............................................................................................................. 13
CHAPTER 3 e-tool Content ..................................................................................................... 23 General Content ............................................................................................................................. 23 Orientation to e-tool ....................................................................................................................... 26 Application of e-tool ...................................................................................................................... 37
CHAPTER 4 Pilot Testing ........................................................................................................ 52 New Hampshire DOT: Winter Weather Management .................................................................. 52 North Central Texas Council of Governments- Incident Management ......................................... 59
CHAPTER 5 Conclusions and Recommendations ................................................................. 64
REFERENCES .......................................................................................................................... 67
APPENDIX A Functional Requirements ............................................................................ 68
APPENDIX B Case Study Details ....................................................................................... 87
APPENDIX C Test Plan ..................................................................................................... 125
vi
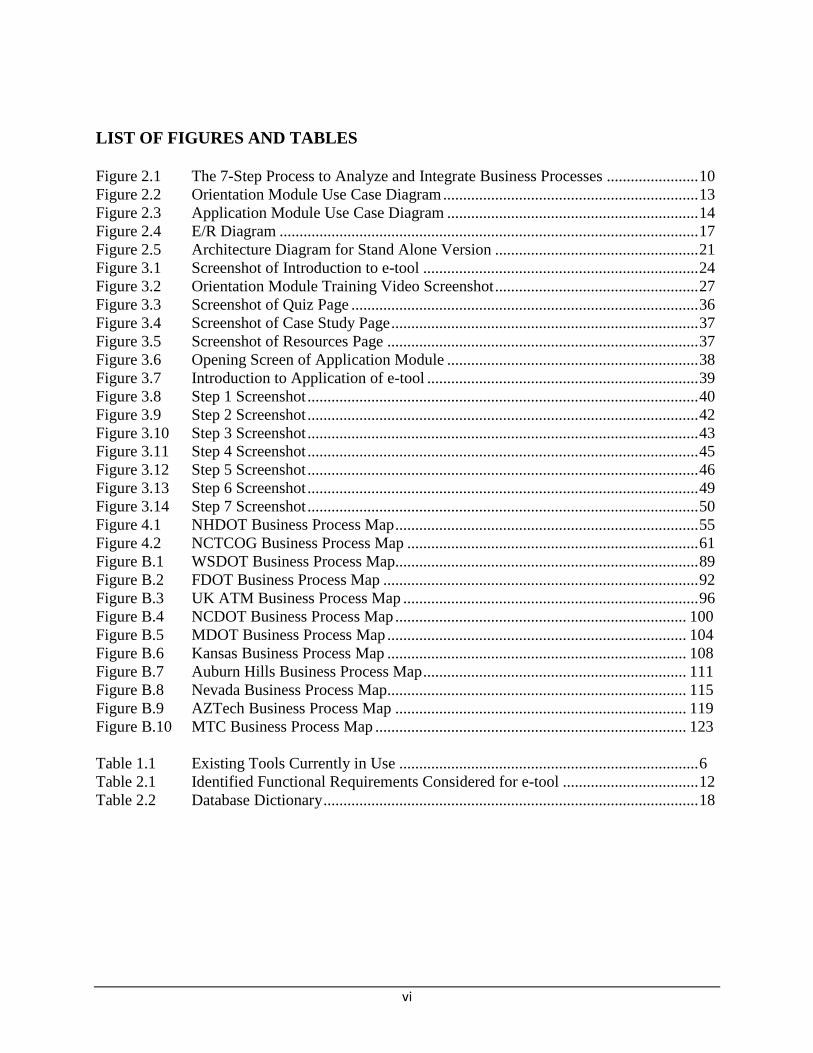
LIST OF FIGURES AND TABLES Figure 2.1 The 7-Step Process to Analyze and Integrate Business Processes ....................... 10
Figure 2.2 Orientation Module Use Case Diagram ................................................................ 13
Figure 2.3 Application Module Use Case Diagram ............................................................... 14
Figure 2.4 E/R Diagram ......................................................................................................... 17
Figure 2.5 Architecture Diagram for Stand Alone Version ................................................... 21
Figure 3.1 Screenshot of Introduction to e-tool ..................................................................... 24
Figure 3.2 Orientation Module Training Video Screenshot ................................................... 27
Figure 3.3 Screenshot of Quiz Page ....................................................................................... 36
Figure 3.4 Screenshot of Case Study Page ............................................................................. 37
Figure 3.5 Screenshot of Resources Page .............................................................................. 37
Figure 3.6 Opening Screen of Application Module ............................................................... 38
Figure 3.7 Introduction to Application of e-tool .................................................................... 39
Figure 3.8 Step 1 Screenshot .................................................................................................. 40
Figure 3.9 Step 2 Screenshot .................................................................................................. 42
Figure 3.10 Step 3 Screenshot .................................................................................................. 43
Figure 3.11 Step 4 Screenshot .................................................................................................. 45
Figure 3.12 Step 5 Screenshot .................................................................................................. 46
Figure 3.13 Step 6 Screenshot .................................................................................................. 49
Figure 3.14 Step 7 Screenshot .................................................................................................. 50
Figure 4.1 NHDOT Business Process Map ............................................................................ 55
Figure 4.2 NCTCOG Business Process Map ......................................................................... 61
Figure B.1 WSDOT Business Process Map............................................................................ 89
Figure B.2 FDOT Business Process Map ............................................................................... 92
Figure B.3 UK ATM Business Process Map .......................................................................... 96
Figure B.4 NCDOT Business Process Map ......................................................................... 100
Figure B.5 MDOT Business Process Map ........................................................................... 104
Figure B.6 Kansas Business Process Map ........................................................................... 108
Figure B.7 Auburn Hills Business Process Map .................................................................. 111
Figure B.8 Nevada Business Process Map........................................................................... 115
Figure B.9 AZTech Business Process Map ......................................................................... 119
Figure B.10 MTC Business Process Map .............................................................................. 123
Table 1.1 Existing Tools Currently in Use ........................................................................... 6
Table 2.1 Identified Functional Requirements Considered for e-tool .................................. 12
Table 2.2 Database Dictionary .............................................................................................. 18
vii
AUTHOR ACKNOWLEDGEMENTS
This work was sponsored by the Federal Highway Administration in cooperation with the
American Association of State Highway and Transportation Officials. It was conducted in the
second Strategic Highway Research Program (SHRP 2), which is administered by the
Transportation Research Board of the National Academies. This project was managed by Ms.
Reena Mathews, Senior Program Officer for SHRP 2 with assistance from Mr. Ralph Hessian,
Speical Consultant for the SHRP 2 Program. The project oversight was provided by the SHRP 2
L34 Technical Expert Task Group (TETG) chaired by Mr. Mark F. Muriello, Assistant Director
of Tunnels, Bridges & Terminals of the Port Authority of New York and New Jersey. Members
of the SHRP 2 L34 TETG included:
Ron Achelpohl, Assistant Director of
Transportation Mid-America Regional Council
John Miller, Associate Principal Research
Scientist, Virginia Center for Transportation
Innovation and Research
Robert Case, Principal Transportation
Engineer, Hampton Roads TPO
Larry Orcutt, Chief, Division of Research and
Innovation, California Department of
Transportation
Gene Donaldson, Operations Manager, TMC,
Delaware Department of Transportation
Craig Reed, Director, Bureau of Municipal
Services, Pennsylvania Department of
Transportation
Michael Floberg, Bureau Chief, Bureau of
Transportation Safety and Technology, Kansas
Department of Transportation
Wayne Berman, Transportation Specialist,
Federal Highway Administration
Meryl Mandell, I-91 ITS Project Manager,
Massachusetts Department of Transportation
Lacy Love, Associate Program Director,
Operations, American Association of State
Highway and Transportation Officials
The research reported on herein was performed by Applied Engineering Management Corporation
(AEM Corp.), and supported by Cambridge Systematic, Inc. Dr. Aimee Flannery, Applied
Engineering Management Corporation, served as the Principal Investigator for the project. Dr.
Flannery was supported by Ms. Jenny Meszaros of AEM Corporation who served as the co-
author of the final report and subject matter expert in the development of software developed
through this project. Mr. Jason Holzbach served as the project’s IT Architect with support from
Mr. Paul Dotsenko and Ms. Jeanine Staab. Mr. Jason Kennedy of AEM Corp and Ms. Dena
Snyder developed materials used to pilot test the software developed through this project. The
Team was supported by Ms. Anita Vandervalk and Mr. Rich Margiotta of Cambridge
Systematics.

viii
THIS PAGE INTENTIONALLY LEFT BLANK
ix
ABSTRACT
This report documents and presents the approach to and the results of the development of an e-
tool to assist transportation agencies when evaluating their processes to improve travel time
reliability. The e-tool design was based on the research conducted in the SHRP 2 L01 project,
Integrating Business Processes to Improve Travel Time Reliability. It directly follows the seven
step process outlined in the L01 guide, as well as utilizes the case studies completed in the report.
This report details the functional requirements, software architecture, and content development for
the tool. Pilot testing was conducted at two locations, the New Hampshire DOT and the North
Central Texas Council of Governments in Dallas, Texas. The New Hampshire location evaluated
their Weather Management Program process and the Dallas, Texas location evaluated their
Traffic Incident Management process. Details and feedback from these testing groups were
incorporated into the final product of the L34 e-tool.

x
THIS PAGE INTENTIONALLY LEFT BLANK

1
EXECUTIVE SUMMARY
Project Background and Objectives
As part of the 2005 Safe, Accountable, Flexible, Efficient Transportation Equity Act: A Legacy
for Users (SAFETEA-LU), Congress authorized the U.S. Department of Transportation to create
a highway research program that would address future challenges facing the U.S. highway
system. In 2006, the Second Strategic Highway Research Program (SHRP 2) was established.
SHRP 2 addresses four strategic focus areas. The Reliability focus area targets travel time
variation and reducing congestion by mitigating the effects of incidents, weather, work zones,
special events, traffic control devices, fluctuations in demand, and bottlenecks. In addition to
research activities, SHRP 2 includes activities such as pilot tests and field demonstrations to aid
in preparing the SHRP 2 research results for implementation.
In 2008, SHRP 2 began work on Reliability Project L01. From a series of case studies, the L01
project identified the core of operations business processes within transportation management
that had day-to-day influence over operations and network performance and, in turn, had positive
impacts on travel time reliability. The research developed a representation of the generalized
steps that can be referenced for mapping out business processes, each of which is critical to
successfully developing, integrating, and institutionalizing a business process. The L01 project
culminated in two research products; a final report and a guide to integrating business processes
to improve travel time reliability.
As a follow-on to the L01 project, the L34 project’s two fundamental objectives were to
implement the findings from project L01 and develop an interactive e-tool that transportation
agencies can use to evaluate their current business processes and to identify and remove barriers
to implementing and sustaining improved processes to advance operations to enhance travel time
reliability. The e-tool is primarily an electronic version of the business processes and guidance
material developed in project L01.
Specific objectives that were established for this project include:
Complete a best practices review of existing e-tools, which will provide input into the
development of functional requirements and architecture recommendations for the L34 e-
tool.
Develop and test a prototype e-tool.
Develop and pilot test the e-tool.
Host the e-tool through the end of SHRP 2.
Approach
The research team was tasked with transforming the technical reports generated in the L01
research study into an educational and useful electronic tool to help agencies understand and
evaluate their current business processes that affect travel time reliability. Per the L01 report,
2
integrating a business process to improve travel time reliability is a seven step process that
includes:
Identifying Influences
Defining Specific Reliability Goals
Identifying and Documenting Current Business Processes
Develop/Change Business Processes to Meet Reliability Goals
Assess Changes to Business Processes
Document Processes
Institutionalize Processes
The L01 research reports provide information and case studies that directly relate to key
operational areas that have the most effect on travel time reliability including:
Incident Management
Work Zone Management
Planned Special Events Management
Road Weather Management
Traffic Control and Traffic Operations
Agencies considering changes in business processes to improve performance often skip the step
of thinking through current business processes in a systematic way to identify and document
potential data or information gaps or issues. The overall benefit to the e-tool is it provides a
mechanism to help agencies identify key components or enablers that can promote a more
efficient process that may improve travel time reliability. By using the e-tool to document and
represent the agency’s process(s), stakeholders can see the connections between the different
components of their day to day operations and understand areas to improve their current business
processes to improve operations.
Based on the findings of the review of existing e-tools and literature and an in-depth review of
the L01 reports, a decision was made by the research team and supported by the Technical
Expert Technical Group (TETG) to develop an e-tool with two separate modules. The first
module is an orientation to the e-tool. The orientation provides a learning experience for an
individual to gain insight into the seven steps of the methodology to improve business processes
for better travel time reliability. The second module, known as the application module, provides
a framework for users to apply the method to their own business processes. The application
module provides a structure to complete the seven steps and provides a mechanism for storing
and organizing information and decisions. Ideally the application module would be used in a
group setting with relevant stakeholders present as was the case in the pilot sessions described in
more detail shortly.
Utilizing the two module approach to the e-tool, the project team next developed functional
requirements and proposed the system architecture. Following the approval of the proposed
architecture from the project TETG, the research team developed technical content for the e-tool
and a prototype of the software. The primary source of information for the e-tool was the L01
reports. One key difference between the L01 research report and the L34 e-tool software is the
3
shifting from the formal Business Process Mapping Notation (BPMN) as was contained in the
L01 research and the less formal business process mapping used within the e-tool. The primary
purpose of shifting away from the formal BPMN mapping approach was to lower the barriers for
use of the e-tool. Members of the TETG felt that while the BPMN mapping process is one that
many agencies could implement, the mapping should not be the focus of the overall effort, but
instead the act of reviewing business processes with stakeholders in a format that allows for easy
collaboration might be of better use to agencies. As a result, the e-tool was developed in a
manner to allow users to utilize any mapping approach that they are comfortable using. Once the
software was tested and refined, the e-tool was demonstrated through pilot tests at two locations.
The researchers completed two pilot tests of the e-tool to test the applicability and ease of use.
The two pilot test locations (Dallas, TX and Concord, New Hampshire) were selected from a list
of seven potential sites using eight criteria to identify the most beneficial locations. The
Incident Management Program in Dallas and the Road Weather Management Program in New
Hampshire were the focus of the pilot tests.
As part of the pilot sessions, participants were briefed on the e-tool and the supporting research
that was incorporated into the e-tool. Prior to the pilot sessions, team members worked with
each location to gather information on a specific management area for discussion and
demonstration using the e-tool. It was noted by the workshop organizers and participants that
while the overall process of business process mapping was not overly complicated, having an
outside party review their current business processes and presenting the stakeholders with an
initial business process map was very useful and helped to focus the participants on the specific
business process under consideration. Both agencies noted that having a third party review their
current business processes was helpful in that the third party did not review the existing business
processes with any bias. Both agencies also noted that having a third party facilitate a discussion
of current business processes and areas for improvement was useful. It was also noted that the
Orientation Module of the tool could be beneficial to help educate staff on the idea of business
process mapping and could be helpful to have stakeholder group participants review the
Orientation Module prior to utilizing the Application Module of the e-tool. Participants felt that
the e-tool helped to facilitate discussion between stakeholders that may not normally have such
an opportunity and also to document their information flows which were successful in
identifying areas for improvement in the future.
Other key findings related to the e-tool include expanding the e-tool to include additional case
studies to help users identify better with a particular management area. In addition, while case
studies were developed for the five management areas, because the L01 research team was
essentially reverse engineering existing management systems, in some cases data were missing
to support the full seven step business process mapping methodology outlined in the L01
research. Having additional case studies and additional management areas included in future
editions of the e-tool was noted as a worthwhile investment for users of the e-tool.
Outcomes
The research team developed an e-tool that can be used by practitioners for planning,
implementing, integrating, and analyzing business processes to improve travel time reliability.
Based on the feedback obtained from the pilot testing, practitioners indicate that the e-tool can
4
help them by providing valuable outputs that can be used by agency business processes to
allocate resources and funding to advance operations. Additionally, the agencies acknowledged
that the e-tool pilot study sessions provides agencies an opportunity to help identify areas where
operations might be improved or better integrated through the business processing mapping
portion of its seven-step process.
The results of L34 research project are directly applicable to the SHRP2 Reliability area’s
objectives. The e-tool will assist State DOTs, MPOs, and local transportation agencies evaluate
where they stand with respect to their business processes related to advancing operations and
therefore enhancing travel time reliability. The e-tool has the potential to be one of the most
useable applications of results of the SHRP Reliability program since it was designed to be
intuitive, easy to use and directly applicable to the business of a State, MPO, or local agency.
The final e-tool product will be hosted by the research team until the final home of the product is
finalized by FHWA and TRB. Designing the tool as an electronic product helps ensure its use
and applicability in today’s environment. However as with any research product implementation
is important. The e-tool needs to be marketed and promoted to State DOTs, MPOs, and local
agencies, especially in conjunction with other related Reliability research products, to provide a
better opportunity for wide-spread use. It will be important for FHWA and TRB staff to generate
interest by promoting it with those parties involved in the development of relevant SHRP 2
Reliability products as well as relevant TRB Committees.
5
CHAPTER 1 Background
Project Overview
In 2008, SHRP 2 began work on Reliability Project L01. From a series of case studies, the L01
project identified the core of operations business processes within transportation management
that had day-to-day influences over operations and network performance and, in turn, had
positive impacts on travel time reliability. It was found that there were two distinct aspects to
process integration that were critical to support reliability-focused operations: process integration
at the operations level and process integration at the institutional or programmatic level. The
research developed a representation of the generalized steps that can be referenced for mapping
out business processes, each of which is critical to successfully developing, integrating, and
institutionalizing a business process. The L01 project culminated in two research products, a
final report and a guide to integrating business processes to improve travel time reliability.
The project team for this L34 project was tasked with designing, developing, and testing an
electronic tool (e-tool) to implement the methods and conclusions from the previous L01 study.
The user for this e-tool would be local, state, and federal transportation agencies and their
respective stakeholders interested in improving existing processes or developing new processes
to analyze performance measures associated with travel time reliability.
This final report documents the tasks undertaken to achieve the goals of the project, namely to
develop a software tool that can educate users on the concept of business process mapping. Other
items included are the process undertaken to pilot test the e-tool and the recommended next steps
to ensure implementation of the concepts contained in the e-tool. The tasks undertaken in this
study included:
1. Review current e-tools used within and outside of the transportation industry to
document expected functionality of the L34 e-tool by professionals
2. Develop the functional requirements and applicable architecture for the L34 e-tool
within the anticipated parameters of distribution of the software
3. Develop the L34 e-tool content and supporting software
4. Pilot test the L34 e-tool in two locations
5. Document findings of pilot tests and recommended next steps for successful
implementation
Current e-tools in Use
The research team reviewed several relevant e-tools (software tools) currently in use to
understand the context for the L34 e-tool and determine functionality to incorporate into the e-
tool that would make it most useful for the user. The review and assessment of the e-tools gave
the team insight into how the L34 e-tool should function based on the current best practices. The
review included e-tools from the transportation, education, public works, and labor sectors to
ensure a wide-range of applications and perspectives were investigated.
6
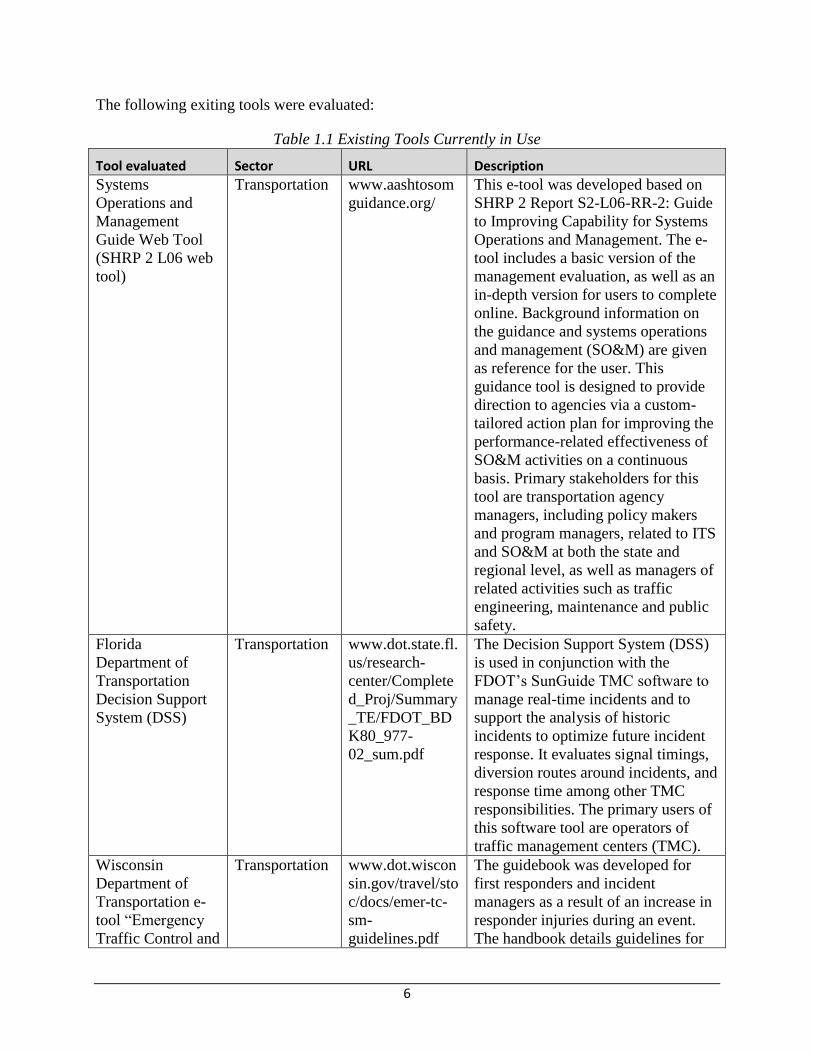
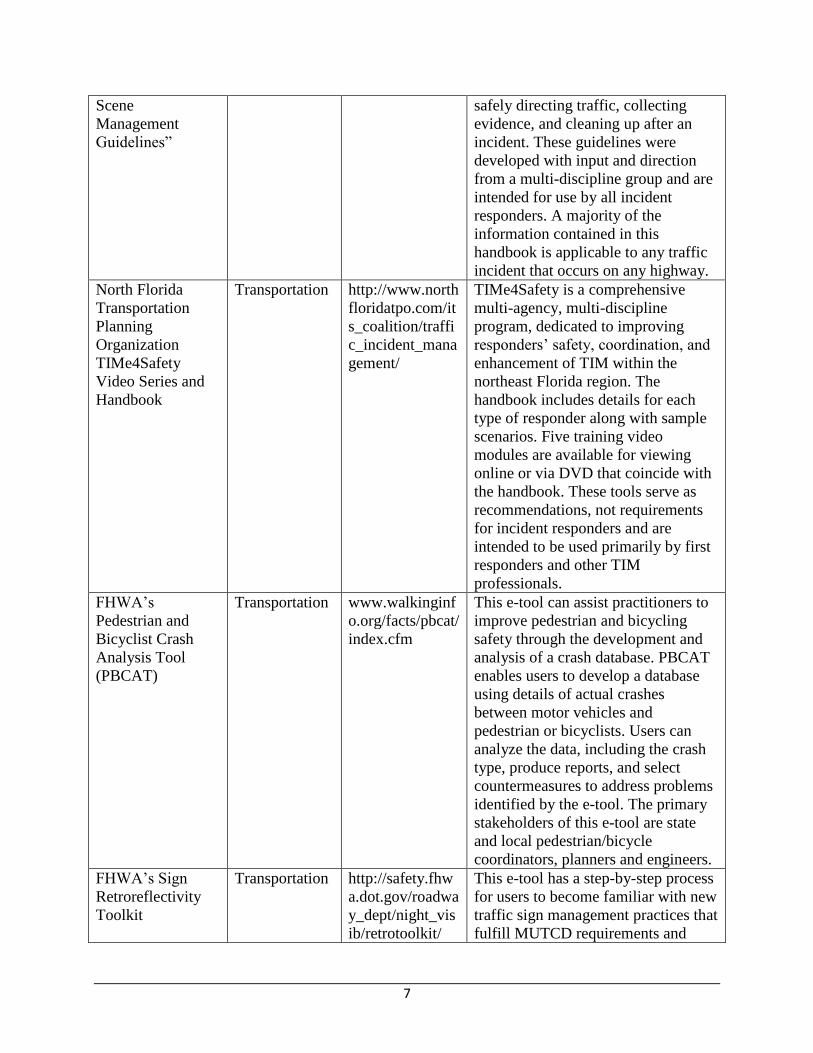
The following exiting tools were evaluated:
Table 1.1 Existing Tools Currently in Use
Tool evaluated Sector URL Description
Systems
Operations and
Management
Guide Web Tool
(SHRP 2 L06 web
tool)
Transportation www.aashtosom
guidance.org/
This e-tool was developed based on
SHRP 2 Report S2-L06-RR-2: Guide
to Improving Capability for Systems
Operations and Management. The e-
tool includes a basic version of the
management evaluation, as well as an
in-depth version for users to complete
online. Background information on
the guidance and systems operations
and management (SO&M) are given
as reference for the user. This
guidance tool is designed to provide
direction to agencies via a custom-
tailored action plan for improving the
performance-related effectiveness of
SO&M activities on a continuous
basis. Primary stakeholders for this
tool are transportation agency
managers, including policy makers
and program managers, related to ITS
and SO&M at both the state and
regional level, as well as managers of
related activities such as traffic
engineering, maintenance and public
safety.
Florida
Department of
Transportation
Decision Support
System (DSS)
Transportation www.dot.state.fl.
us/research-
center/Complete
d_Proj/Summary
_TE/FDOT_BD
K80_977-
02_sum.pdf
The Decision Support System (DSS)
is used in conjunction with the
FDOT’s SunGuide TMC software to
manage real-time incidents and to
support the analysis of historic
incidents to optimize future incident
response. It evaluates signal timings,
diversion routes around incidents, and
response time among other TMC
responsibilities. The primary users of
this software tool are operators of
traffic management centers (TMC).
Wisconsin
Department of
Transportation e-
tool “Emergency
Traffic Control and
Transportation www.dot.wiscon
sin.gov/travel/sto
c/docs/emer-tc-
sm-
guidelines.pdf
The guidebook was developed for
first responders and incident
managers as a result of an increase in
responder injuries during an event.
The handbook details guidelines for
7
Scene
Management
Guidelines”
safely directing traffic, collecting
evidence, and cleaning up after an
incident. These guidelines were
developed with input and direction
from a multi-discipline group and are
intended for use by all incident
responders. A majority of the
information contained in this
handbook is applicable to any traffic
incident that occurs on any highway.
North Florida
Transportation
Planning
Organization
TIMe4Safety
Video Series and
Handbook
Transportation http://www.north
floridatpo.com/it
s_coalition/traffi
c_incident_mana
gement/
TIMe4Safety is a comprehensive
multi-agency, multi-discipline
program, dedicated to improving
responders’ safety, coordination, and
enhancement of TIM within the
northeast Florida region. The
handbook includes details for each
type of responder along with sample
scenarios. Five training video
modules are available for viewing
online or via DVD that coincide with
the handbook. These tools serve as
recommendations, not requirements
for incident responders and are
intended to be used primarily by first
responders and other TIM
professionals.
FHWA’s
Pedestrian and
Bicyclist Crash
Analysis Tool
(PBCAT)
Transportation www.walkinginf
o.org/facts/pbcat/
index.cfm
This e-tool can assist practitioners to
improve pedestrian and bicycling
safety through the development and
analysis of a crash database. PBCAT
enables users to develop a database
using details of actual crashes
between motor vehicles and
pedestrian or bicyclists. Users can
analyze the data, including the crash
type, produce reports, and select
countermeasures to address problems
identified by the e-tool. The primary
stakeholders of this e-tool are state
and local pedestrian/bicycle
coordinators, planners and engineers.
FHWA’s Sign
Retroreflectivity
Toolkit
Transportation http://safety.fhw
a.dot.gov/roadwa
y_dept/night_vis
ib/retrotoolkit/
This e-tool has a step-by-step process
for users to become familiar with new
traffic sign management practices that
fulfill MUTCD requirements and

8
provides assistance for
implementation of the various
methods/procedures. Primary users
and stakeholders that will likely be
interested in this e-tool are State and
local DOTs or other agencies
responsible for the maintenance of
traffic signs.
Transportation
Project Impact
Case Studies (T-
PICS) Web Tool
Transportation http://transportati
onforcommunitie
s.com/t-pics
The website is currently in draft form.
This e-tool provides access to a
national database of case studies that
can be used to assess the pre-and
post-construction economic
development and related effects of
various kinds of transportation
projects. The primary users include
state departments of transportation,
metropolitan planning organizations,
and economic development agencies.
Program to Assist
in Risk and
Resilience
Examination
(PARRE)
Water and
Wastewater
N/A The PARRE e-tool will assist critical
infrastructure water utilities in
assessing their risk to natural and
man-made threats. The primary users
are likely to be risk and security
managers and decision makers in the
public works sector.
GRADS360° Education https://www.grad
s360.org/app/Def
ault.aspx
GRADS360° is an e-tool that
enhances grants management and
oversight by empowering US
Department of Education Program
Officers with actionable and easily
accessible data. The e-tool can
manage the interactions with US
Department of Education Program
Officers including capturing and
storing their “as is” and “to be”
business processes, system
requirements, issues, and schedule. It
helps Program Officers standardize
and automate their grants
management business processes.
Common
Education Data
Standards
Alignment Tool
Education https://ceds.ed.g
ov/alignmentToo
l.aspx
The CEDS Alignment Tool allows a
user to load an organization's data
dictionary and compare it, in detail, to
CEDS and the data dictionaries of
other users' organizations. This

9
facilitates alignment with CEDS and
across systems, paving the way for
easier sharing and comparison of
data.
Common
Education Data
Standards Connect
Tool
Education https://ceds.ed.g
ov/connect.aspx
The Connect Tool provides a
selection of education data related
components and their alignment to
the Common Education Data
Standard (CEDS). This e-tool allows
users to find and create
"Connections" from data elements to
practical applications across the P-
20W (early learning through
workforce) environment.
Stakeholders use this e-tool to learn
how others in the education field are
using data elements to answer policy
questions, calculate metrics and
indicators, and report to the federal
government.
Unemployment
Insurance State
Information Data
Exchange (UI-
SIDES)
Labor N/A This e-tool allows electronic
transmission of unemployment
insurance (UI) information requests
from agencies to multi-state
employers and/or Third Party
Administrators (TPAs), as well as
transmission of replies containing the
requested information back to the UI
agencies.
Following the review and assessment of various existing e-tools, the research team determined
the most important and relevant functional requirements to be included in the L34 e-tool.
Functional requirements capture the intended behavior of the system. This behavior may be
expressed as services, tasks or functions the system is required to perform. It defines what a
system is supposed to accomplish, what the user interface looks like, and how the system will
interact with the user. Generally, functional requirements are expressed in the form, "system
must do <requirement>". For example, a potential functional requirement for the e-tool could
be:
“Below the training video, the text containing the dialogue in the training video will be
displayed and be left-justified.”
Based on the review of available e-tools, several functional requirements were identified and
approved by the TETG that are described in more detail in Chapter 2 of this final report.
10
CHAPTER 2 e-tool Requirements and Architecture
Functional Requirements – Background Information
The L34 e-tool includes two modules: Orientation Module and Application Module. The
purpose of the Orientation Module is to introduce users to the concepts of business process
modeling through the use of case studies and voice-over slide tutorials, as well as quizzes to test
the user’s retention of information presented in the Orientation Module. The Application
Module is designed to be used with a group of stakeholders to guide them through the business
process mapping for a specific application area (for example, Traffic Incident Management).
The functional requirements for each of these areas are included for the reader’s reference.
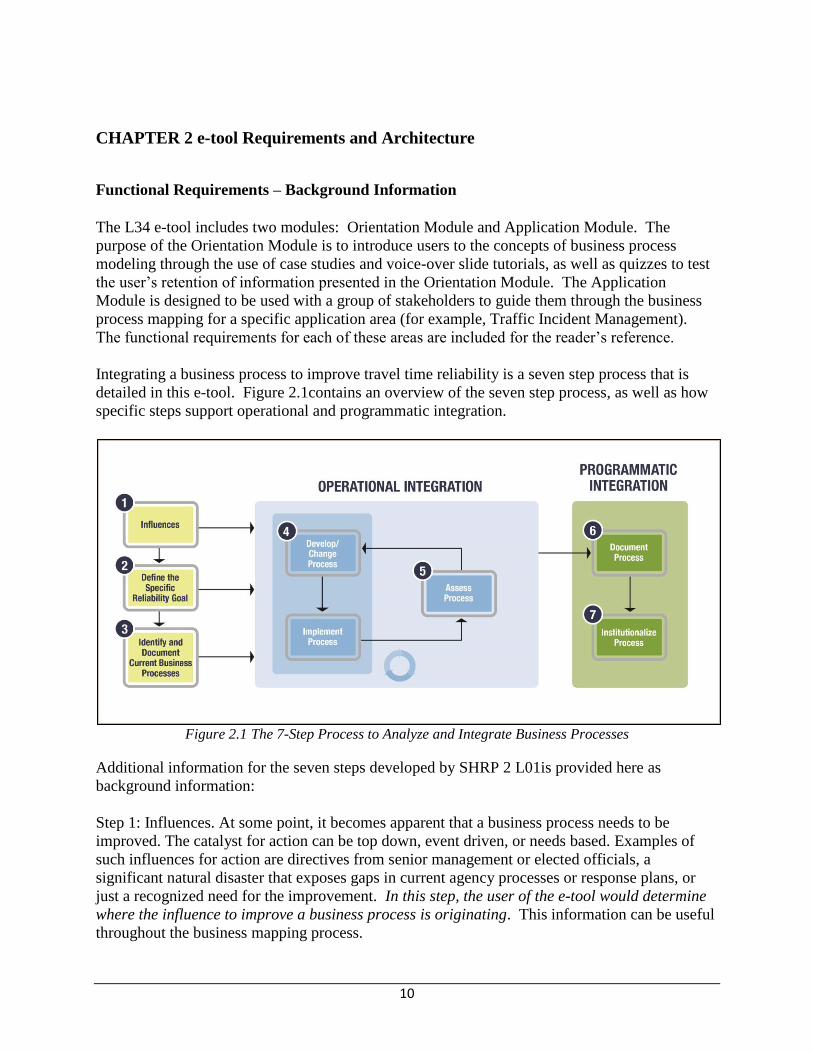
Integrating a business process to improve travel time reliability is a seven step process that is
detailed in this e-tool. Figure 2.1contains an overview of the seven step process, as well as how
specific steps support operational and programmatic integration.
Figure 2.1 The 7-Step Process to Analyze and Integrate Business Processes
Additional information for the seven steps developed by SHRP 2 L01is provided here as
background information:
Step 1: Influences. At some point, it becomes apparent that a business process needs to be
improved. The catalyst for action can be top down, event driven, or needs based. Examples of
such influences for action are directives from senior management or elected officials, a
significant natural disaster that exposes gaps in current agency processes or response plans, or
just a recognized need for the improvement. In this step, the user of the e-tool would determine
where the influence to improve a business process is originating. This information can be useful
throughout the business mapping process.
11
Step 2: Define the Specific Reliability Goal. Goals focus the agency’s efforts on the problem at
hand regardless of any specific process. Defined goals help to develop benchmarks that an
agency can use to determine how well the process is meeting the need. Goals such as reducing
incident clearance time, providing 24/7 operations, or improving resource efficiency often
require multiple processes to work together. In this step, the user of the e-tool would establish a
reliability or other performance measure goal related to the identified business process.
Step 3: Identify and Document Current Business Processes. Agencies considering changes in
business processes often skip the step of thinking through current business processes in a
systematic way to identify and document potential gaps or issues. This third step helps the
agency identify key components or enablers that can promote a more efficient process. By using
the Business Process Modeling Notation (BPMN) template (or similar process modeling tool) to
document and represent the agency’s process, stakeholders can see the connections between the
different components of the process more easily. In this step, the e-tool user develops and
evaluates their existing business processes.
Step 4: Develop/Change and Implement Process. This step is driven by a particular influence
identified in the first step. This step is usually initiated at the grassroots level of an organization
by staff or advocates who are at the center of the activities involved. The implementation can be
formal or informal, depending on the complexity of the process and the agencies involved. This
is the core step toward process integration. In this step, the e-tool user identifies areas for
improvement, and develops and implements the changes to be made to their business processes.
Step 5: Assess Process. Once the new process has been implemented, it is assessed or evaluated
against the identified goals. In an iterative approach with Step 4 (Develop/Change and
Implement Process), the process continues to be refined on the basis of performance against the
goals. Here, the e-tool user evaluates their proposed changes made against the identified goals.
Step 6: Document Process. Agencies document their processes with varying degrees of
complexity. Documentation can be as simple as an interagency agreement or as complex as a
multivolume operations manual. Regardless of the type of documentation, it should capture the
roles, responsibilities, objectives, and expected outcomes of the process. In this step, the e-tool
user would populate the e-tool with documentation or references to documentation used to
improve the identified business process.
Step 7: Institutionalize Process. The seventh step of business process integration may consist of
adopting operational activities and processes, implementing formal traffic policies, establishing
training, or other actions. Institutionalization requires the buy-in and support of upper
management, as well as other stakeholders who have a vested interest in the outcomes of the
business process. This step will have a direct impact on the long-term survival of a process
within an organization. In this final step, the user would populate the e-tool with a description of
how the new process will be institutionalized within the organization.
12
Development of Functional Requirements
Use cases and/or storyboarding are effective ways to determine functional requirements. The
research team utilized storyboarding to determine the functional requirements for the e-tool.
This is an effective approach for the L34 project because the training material to be included in
the e-tool was already developed in the L01 reports. Functional requirements are supported by
non-functional requirements (also known as quality requirements), which impose constraints on
the design or implementation (such as performance requirements, security, or reliability). These
include the items in the TCAPP specifications provided by FHWA for any tools residing on their
website, the anticipated permanent home of the L34 e-tool. The plan for implementing
functional requirements is detailed in the system design. The plan for implementing non-
functional requirements is detailed in the system architecture.
Using ideas developed from the review of e-tool features and the IT expertise of the research
team, a list of general functional requirements was developed. Table 2.1 includes a list of
general functional requirements. This table presents a brief description of some of the key
features and functions to be provided by the e-tool. The table is not intended to describe in detail
all possible features and functions but rather to provide a summary of functions that are
described in more technical detail in the functional requirements documentation. The full
functional requirements developed for this project can be found in Appendix A.
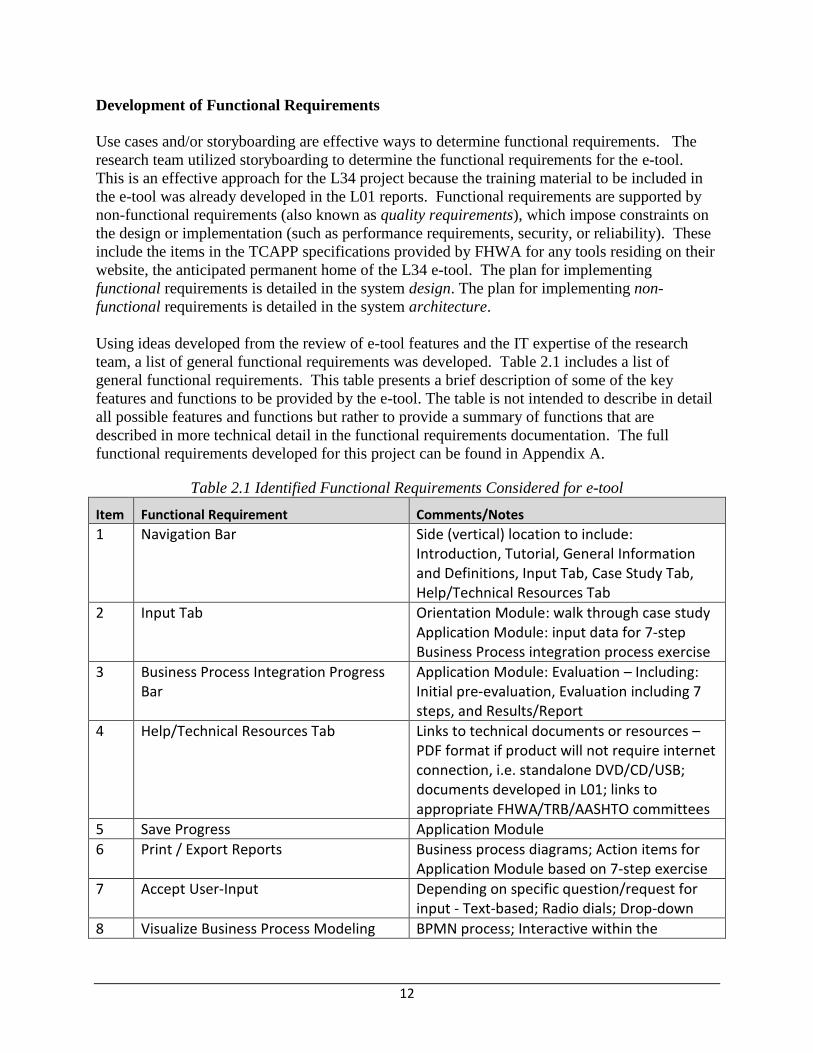
Table 2.1 Identified Functional Requirements Considered for e-tool
Item Functional Requirement Comments/Notes
1 Navigation Bar Side (vertical) location to include: Introduction, Tutorial, General Information and Definitions, Input Tab, Case Study Tab, Help/Technical Resources Tab
2 Input Tab Orientation Module: walk through case study Application Module: input data for 7-step Business Process integration process exercise
3 Business Process Integration Progress Bar
Application Module: Evaluation – Including: Initial pre-evaluation, Evaluation including 7 steps, and Results/Report
4 Help/Technical Resources Tab Links to technical documents or resources – PDF format if product will not require internet connection, i.e. standalone DVD/CD/USB; documents developed in L01; links to appropriate FHWA/TRB/AASHTO committees
5 Save Progress Application Module
6 Print / Export Reports Business process diagrams; Action items for Application Module based on 7-step exercise
7 Accept User-Input Depending on specific question/request for input - Text-based; Radio dials; Drop-down
8 Visualize Business Process Modeling BPMN process; Interactive within the
13
Notation (BPMN) Process Step 3 Mapping
software or static image uploaded from previous mapping activity offline
9 Quizzing mechanism Orientation module; multiple choice answers
10 No per-user distribution fees
Architecture Development
The architecture for the e-tool includes a set of components that describe the software elements,
the relationship between those elements. This section of the report describes the functionality of
the e-tool software and includes details as to the various components of the Orientation and
Application Modules as well as the underlying database that supports the e-tool.
Base Architecture
The base architecture includes Use Cases (Use Case Diagrams, Use Cases Descriptions) and the
Database Architecture. Use Case Diagrams are a simple, graphical way of depicting the
interactions between the users (actors) and the e-tool. The Use Case diagrams consist of a
diagram for the Orientation Module and a daigram for the Application Module. Use Case
Descriptions build off of the diagrams and help identify, define, and organize the requirements
for the e-tool. The Database Architecture illustrates how data is composed and stored in the e-
tool. It contains an entity-relationship (E/R) diagram and a database dictionary that defines the
objects in the E/R diagram.
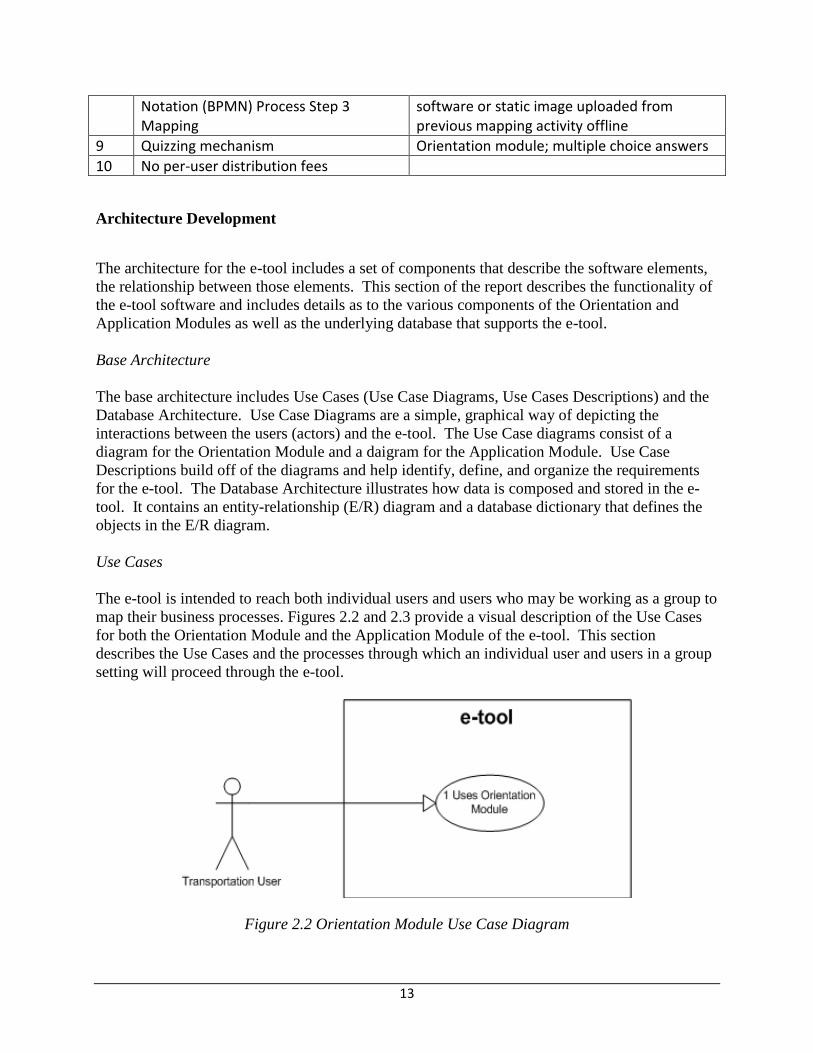
Use Cases
The e-tool is intended to reach both individual users and users who may be working as a group to
map their business processes. Figures 2.2 and 2.3 provide a visual description of the Use Cases
for both the Orientation Module and the Application Module of the e-tool. This section
describes the Use Cases and the processes through which an individual user and users in a group
setting will proceed through the e-tool.
Figure 2.2 Orientation Module Use Case Diagram
14
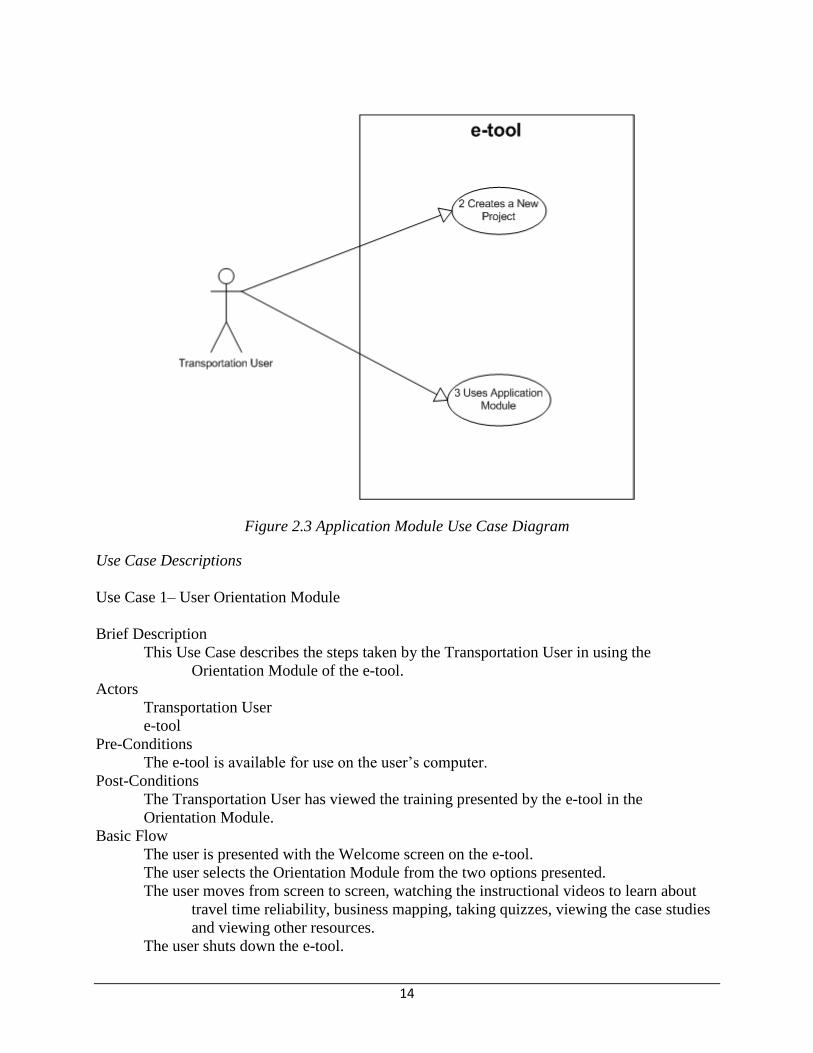
Figure 2.3 Application Module Use Case Diagram
Use Case Descriptions
Use Case 1– User Orientation Module
Brief Description
This Use Case describes the steps taken by the Transportation User in using the
Orientation Module of the e-tool.
Actors
Transportation User
e-tool
Pre-Conditions
The e-tool is available for use on the user’s computer.
Post-Conditions
The Transportation User has viewed the training presented by the e-tool in the
Orientation Module.
Basic Flow
The user is presented with the Welcome screen on the e-tool.
The user selects the Orientation Module from the two options presented.
The user moves from screen to screen, watching the instructional videos to learn about
travel time reliability, business mapping, taking quizzes, viewing the case studies
and viewing other resources.
The user shuts down the e-tool.
15
The use case ends.
Alternate Flows
None
Exception Flows
None
Use Case 2 – Creates a New Project
Brief Description
This Use Case describes the steps taken by the Transportation User in creating a new
project for use in the Application Module of the e-tool.
Actors
Transportation User
e-tool
Pre-Conditions
The e-tool is available for use on the user’s computer.
The following alternate flows and exceptions have been handled:
None
Post-Conditions
The user will have a new project to work on in the e-tool.
The following alternate flows and exceptions have been handled:
The user enters a name already in the database associated with a project
Basic Flow
The user is presented with the Project screen on the e-tool.
The user enters a project name into the Project Name text box.
The user selects the Create button.
The project is entered into the system and appears in the existing projects list with the
current date.
The use case ends.
Alternate Flows
None
Exception Flows
Exception Flow 1 – The user enters a project name already in the database associated
with a project
The user has selected a project name already in use for that user.
The system returns an error and prompts the user for a new project name.
Use Case 3 – User Application Module
Brief Description
This Use Case describes the steps taken by the User to use the Application Module of the
e-tool.
Actors
Transportation User
e-tool
Pre-Conditions
16
The e-tool is available for use on the user’s computer.
Post-Conditions
The user will use the Application Module in the e-tool.
The following alternate flows and exceptions have been handled.
None
Basic Flow
The user is presented with the Project Screen in the Application Module.
The user selects a project from the project list and selects the Open button next to the
project list.
The system takes the user to the introduction page.
The user proceeds to use the Application Module.
The use case ends.
Alternate Flows
None
Exception Flows
None
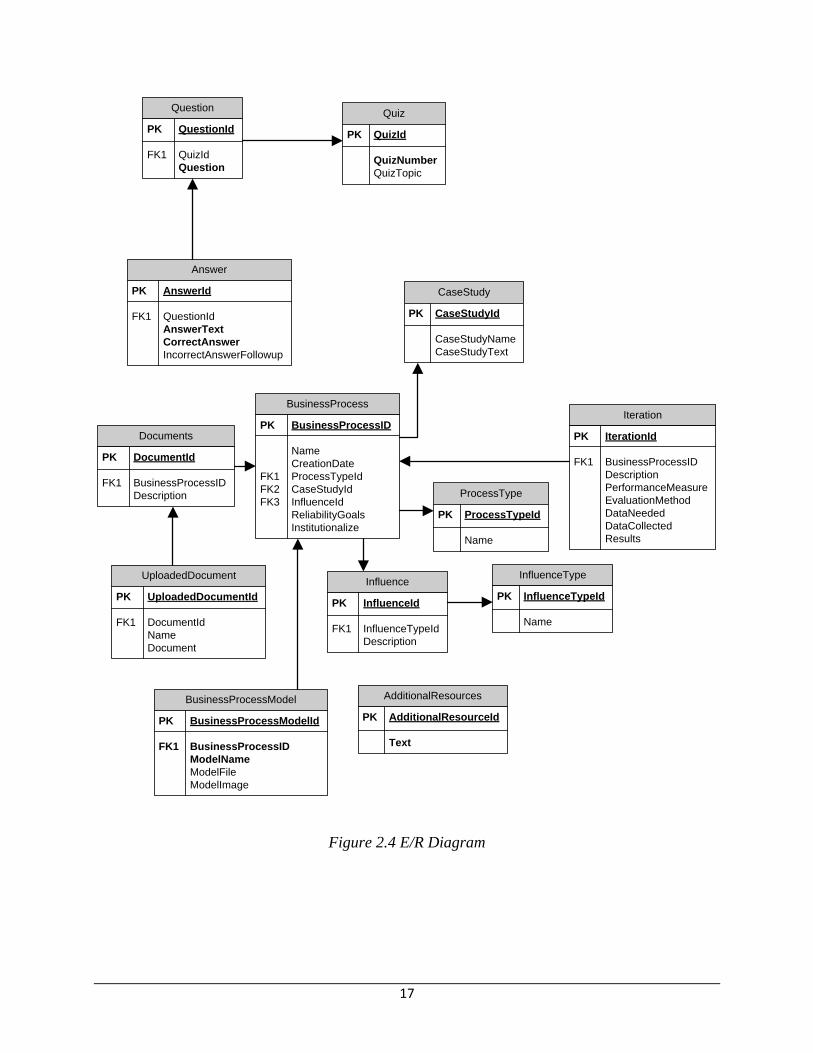
Database Diagram
To represent the database during design, a logical entity relationship (E/R) diagram was
created. The entity relationship diagram is used to interpret, specify and document requirements
for the database irrespective of the database management system (DBMS) being used. Figure
2.4 illustrates the database diagram.
17
CaseStudy
PK CaseStudyId
CaseStudyName
CaseStudyText
BusinessProcess
PK BusinessProcessID
Name
CreationDate
FK1 ProcessTypeId
FK2 CaseStudyId
FK3 InfluenceId
ReliabilityGoals
Institutionalize
BusinessProcessModel
PK BusinessProcessModelId
FK1 BusinessProcessID
ModelName
ModelFile
ModelImage
Quiz
PK QuizId
QuizNumber
QuizTopic
Question
PK QuestionId
FK1 QuizId
Question
AdditionalResources
PK AdditionalResourceId
Text
ProcessType
PK ProcessTypeId
Name
Influence
PK InfluenceId
FK1 InfluenceTypeId
Description
InfluenceType
PK InfluenceTypeId
Name
Iteration
PK IterationId
FK1 BusinessProcessID
Description
PerformanceMeasure
EvaluationMethod
DataNeeded
DataCollected
Results
Documents
PK DocumentId
FK1 BusinessProcessID
Description
UploadedDocument
PK UploadedDocumentId
FK1 DocumentId
Name
Document
Answer
PK AnswerId
FK1 QuestionId
AnswerText
CorrectAnswer
IncorrectAnswerFollowup
Figure 2.4 E/R Diagram
18
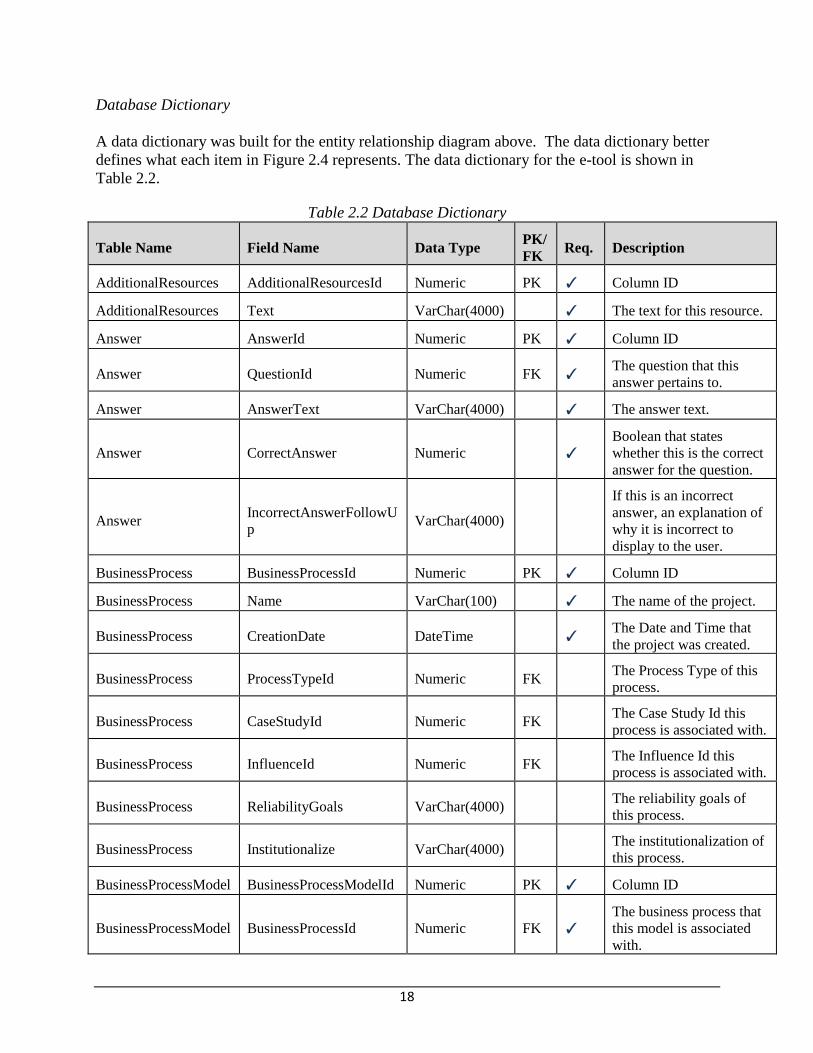
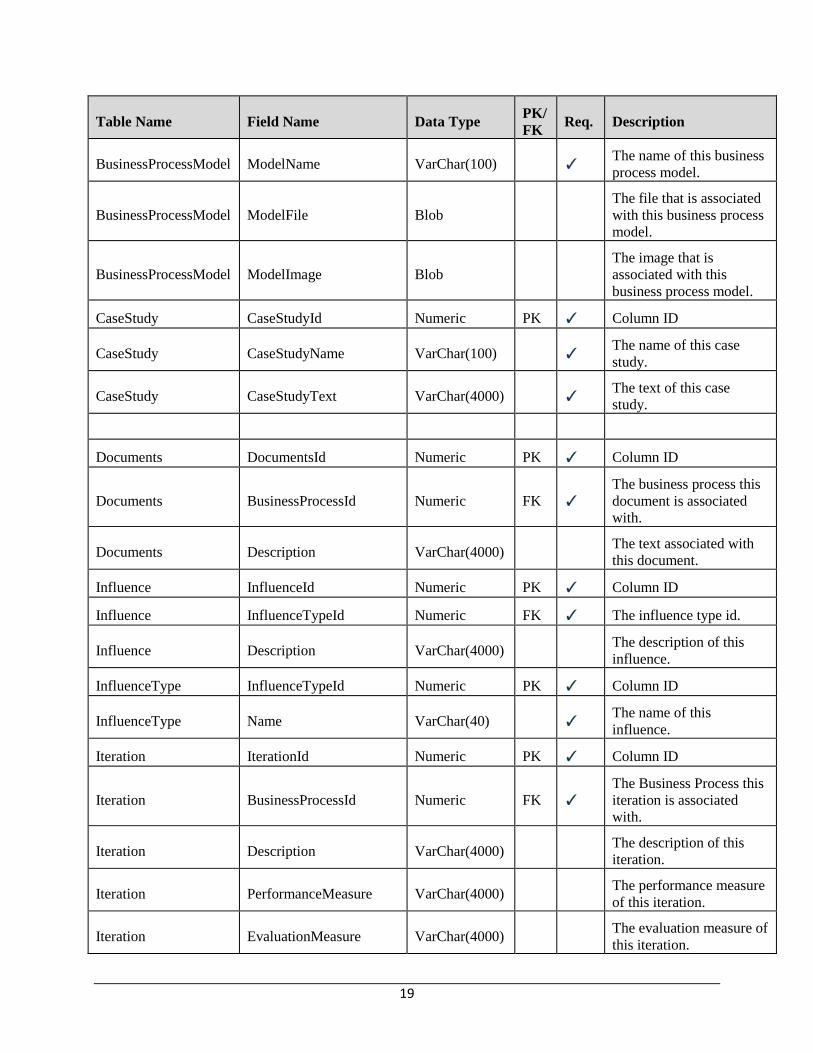
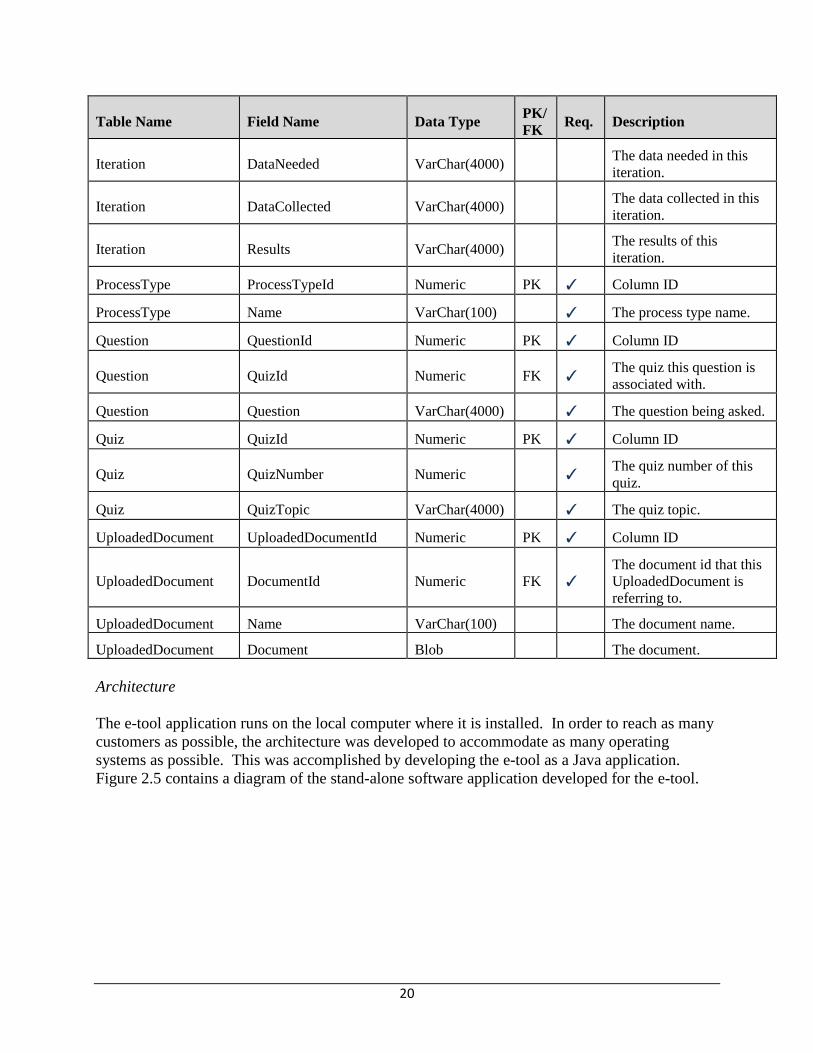
Database Dictionary
A data dictionary was built for the entity relationship diagram above. The data dictionary better
defines what each item in Figure 2.4 represents. The data dictionary for the e-tool is shown in
Table 2.2.
Table 2.2 Database Dictionary
Table Name Field Name Data Type PK/
FK Req. Description
AdditionalResources AdditionalResourcesId Numeric PK ✓ Column ID
AdditionalResources Text VarChar(4000) ✓ The text for this resource.
Answer AnswerId Numeric PK ✓ Column ID
Answer QuestionId Numeric FK ✓ The question that this
answer pertains to.
Answer AnswerText VarChar(4000) ✓ The answer text.
Answer CorrectAnswer Numeric ✓
Boolean that states
whether this is the correct
answer for the question.
Answer IncorrectAnswerFollowU
p VarChar(4000)
If this is an incorrect
answer, an explanation of
why it is incorrect to
display to the user.
BusinessProcess BusinessProcessId Numeric PK ✓ Column ID
BusinessProcess Name VarChar(100) ✓ The name of the project.
BusinessProcess CreationDate DateTime ✓ The Date and Time that
the project was created.
BusinessProcess ProcessTypeId Numeric FK The Process Type of this
process.
BusinessProcess CaseStudyId Numeric FK The Case Study Id this
process is associated with.
BusinessProcess InfluenceId Numeric FK The Influence Id this
process is associated with.
BusinessProcess ReliabilityGoals VarChar(4000) The reliability goals of
this process.
BusinessProcess Institutionalize VarChar(4000) The institutionalization of
this process.
BusinessProcessModel BusinessProcessModelId Numeric PK ✓ Column ID
BusinessProcessModel BusinessProcessId Numeric FK ✓
The business process that
this model is associated
with.
19
Table Name Field Name Data Type PK/
FK Req. Description
BusinessProcessModel ModelName VarChar(100) ✓ The name of this business
process model.
BusinessProcessModel ModelFile Blob
The file that is associated
with this business process
model.
BusinessProcessModel ModelImage Blob
The image that is
associated with this
business process model.
CaseStudy CaseStudyId Numeric PK ✓ Column ID
CaseStudy CaseStudyName VarChar(100) ✓ The name of this case
study.
CaseStudy CaseStudyText VarChar(4000) ✓ The text of this case
study.
Documents DocumentsId Numeric PK ✓ Column ID
Documents BusinessProcessId Numeric FK ✓
The business process this
document is associated
with.
Documents Description VarChar(4000) The text associated with
this document.
Influence InfluenceId Numeric PK ✓ Column ID
Influence InfluenceTypeId Numeric FK ✓ The influence type id.
Influence Description VarChar(4000) The description of this
influence.
InfluenceType InfluenceTypeId Numeric PK ✓ Column ID
InfluenceType Name VarChar(40) ✓ The name of this
influence.
Iteration IterationId Numeric PK ✓ Column ID
Iteration BusinessProcessId Numeric FK ✓
The Business Process this
iteration is associated
with.
Iteration Description VarChar(4000) The description of this
iteration.
Iteration PerformanceMeasure VarChar(4000) The performance measure
of this iteration.
Iteration EvaluationMeasure VarChar(4000) The evaluation measure of
this iteration.
20
Table Name Field Name Data Type PK/
FK Req. Description
Iteration DataNeeded VarChar(4000) The data needed in this
iteration.
Iteration DataCollected VarChar(4000) The data collected in this
iteration.
Iteration Results VarChar(4000) The results of this
iteration.
ProcessType ProcessTypeId Numeric PK ✓ Column ID
ProcessType Name VarChar(100) ✓ The process type name.
Question QuestionId Numeric PK ✓ Column ID
Question QuizId Numeric FK ✓ The quiz this question is
associated with.
Question Question VarChar(4000) ✓ The question being asked.
Quiz QuizId Numeric PK ✓ Column ID
Quiz QuizNumber Numeric ✓ The quiz number of this
quiz.
Quiz QuizTopic VarChar(4000) ✓ The quiz topic.
UploadedDocument UploadedDocumentId Numeric PK ✓ Column ID
UploadedDocument DocumentId Numeric FK ✓
The document id that this
UploadedDocument is
referring to.
UploadedDocument Name VarChar(100) The document name.
UploadedDocument Document Blob The document.
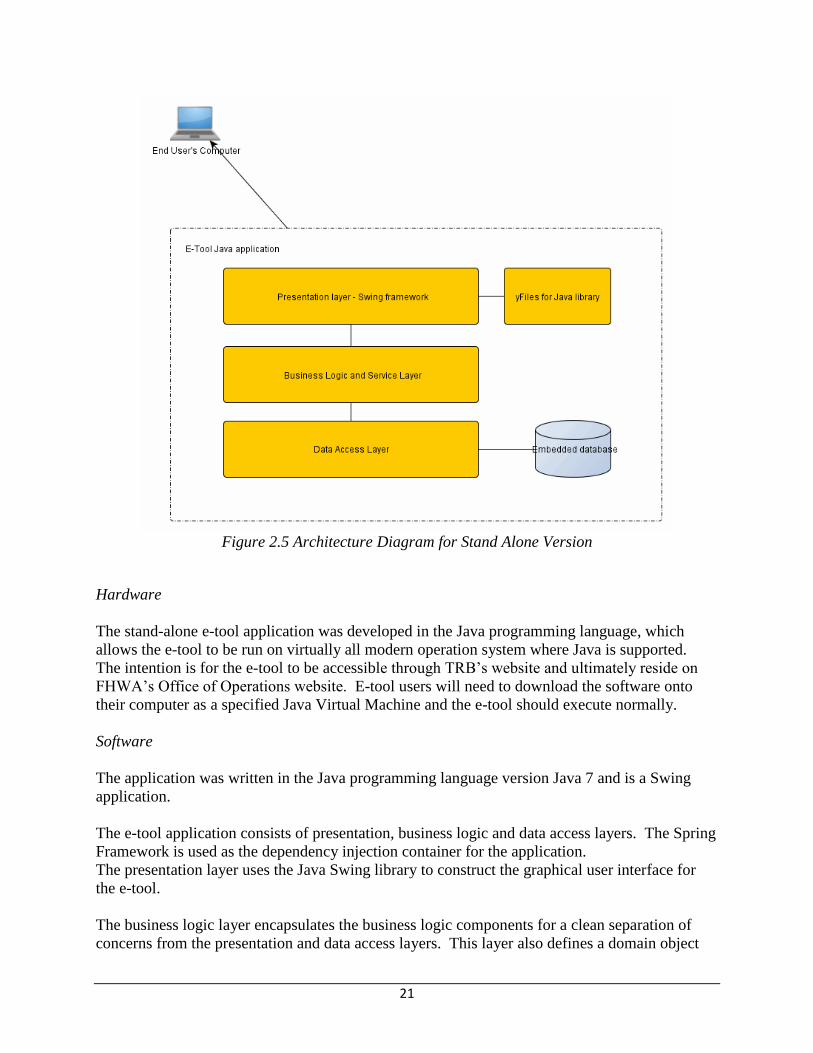
Architecture
The e-tool application runs on the local computer where it is installed. In order to reach as many
customers as possible, the architecture was developed to accommodate as many operating
systems as possible. This was accomplished by developing the e-tool as a Java application.
Figure 2.5 contains a diagram of the stand-alone software application developed for the e-tool.
21
Figure 2.5 Architecture Diagram for Stand Alone Version
Hardware
The stand-alone e-tool application was developed in the Java programming language, which
allows the e-tool to be run on virtually all modern operation system where Java is supported.
The intention is for the e-tool to be accessible through TRB’s website and ultimately reside on
FHWA’s Office of Operations website. E-tool users will need to download the software onto
their computer as a specified Java Virtual Machine and the e-tool should execute normally.
Software
The application was written in the Java programming language version Java 7 and is a Swing
application.
The e-tool application consists of presentation, business logic and data access layers. The Spring
Framework is used as the dependency injection container for the application.
The presentation layer uses the Java Swing library to construct the graphical user interface for
the e-tool.
The business logic layer encapsulates the business logic components for a clean separation of
concerns from the presentation and data access layers. This layer also defines a domain object

22
model to be used by all application layers.
The data access layer employs the Hibernate library to provide an Object-relational mapping
(ORM) between domain objects and relational database tables. Hibernate is also be used to
implement data access objects (DAOs) for storing and retrieving data from the database. This
layer targets Hyper SQL Database (HSQLDB) in embedded mode.

23
CHAPTER 3 e-tool Content
General Content
This section presents the text version of the materials to be included in the orientation module,
application module, and the case studies section of the e-tool. The information provided below
was presented to the e-tool user in two formats:
Voice over slides for training purposes – the user may elect to learn about a particular
topic by hearing the information through an audio feed while an outline of the
information is presented in bulleted form on animated slides on the screen.
Interactive input sections- the user will use this section to complete an assessment after
learning about the process. The program gives the user guidance and examples to help
guide them through the process.
All pages of the e-tool were tested for functionality and 508 compliance, which ensure
compatibility for use by persons with disabilities. The full testing document is located in
Appendix C.
Screen shots from the e-tool are included in this section to assist the reader in visualizing how
the e-tool is assembled if access to the actual tool is not available.
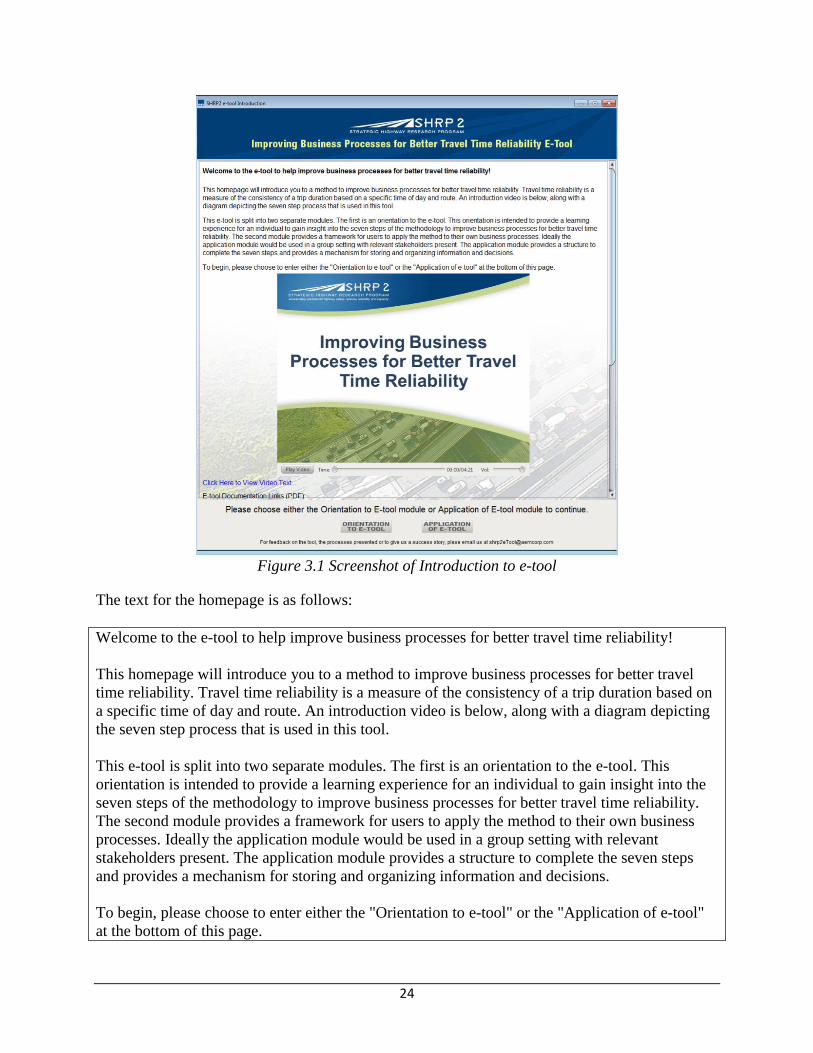
The home screen of the e-tool contains general information on the tool and provides the user
guidance on proceeding through the orientation and application modules. Figure 3.1 shows the
home screen of the e-tool.
24
Figure 3.1 Screenshot of Introduction to e-tool
The text for the homepage is as follows:
Welcome to the e-tool to help improve business processes for better travel time reliability!
This homepage will introduce you to a method to improve business processes for better travel
time reliability. Travel time reliability is a measure of the consistency of a trip duration based on
a specific time of day and route. An introduction video is below, along with a diagram depicting
the seven step process that is used in this tool.
This e-tool is split into two separate modules. The first is an orientation to the e-tool. This
orientation is intended to provide a learning experience for an individual to gain insight into the
seven steps of the methodology to improve business processes for better travel time reliability.
The second module provides a framework for users to apply the method to their own business
processes. Ideally the application module would be used in a group setting with relevant
stakeholders present. The application module provides a structure to complete the seven steps
and provides a mechanism for storing and organizing information and decisions.
To begin, please choose to enter either the "Orientation to e-tool" or the "Application of e-tool"
at the bottom of this page.
25
Video located here.
E-tool Documentation Links (PDF)
E-tool Informational Flyer
E-tool Materials List
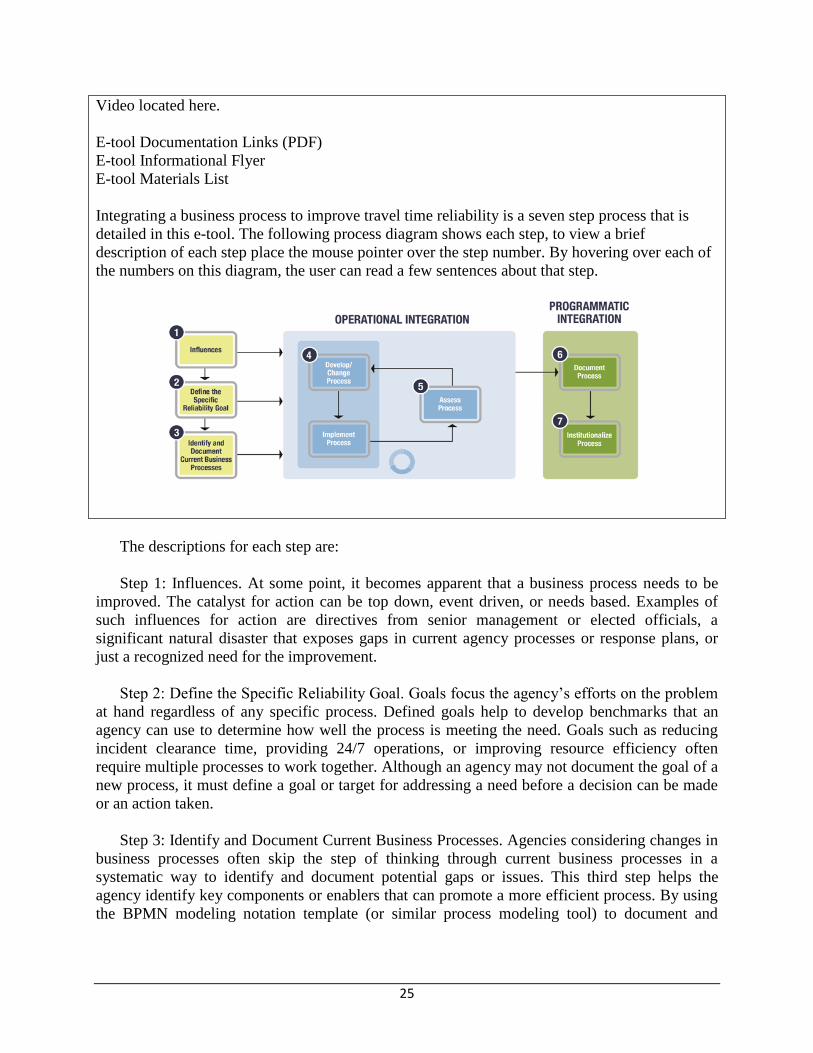
Integrating a business process to improve travel time reliability is a seven step process that is
detailed in this e-tool. The following process diagram shows each step, to view a brief
description of each step place the mouse pointer over the step number. By hovering over each of
the numbers on this diagram, the user can read a few sentences about that step.
The descriptions for each step are:
Step 1: Influences. At some point, it becomes apparent that a business process needs to be
improved. The catalyst for action can be top down, event driven, or needs based. Examples of
such influences for action are directives from senior management or elected officials, a
significant natural disaster that exposes gaps in current agency processes or response plans, or
just a recognized need for the improvement.
Step 2: Define the Specific Reliability Goal. Goals focus the agency’s efforts on the problem
at hand regardless of any specific process. Defined goals help to develop benchmarks that an
agency can use to determine how well the process is meeting the need. Goals such as reducing
incident clearance time, providing 24/7 operations, or improving resource efficiency often
require multiple processes to work together. Although an agency may not document the goal of a
new process, it must define a goal or target for addressing a need before a decision can be made
or an action taken.
Step 3: Identify and Document Current Business Processes. Agencies considering changes in
business processes often skip the step of thinking through current business processes in a
systematic way to identify and document potential gaps or issues. This third step helps the
agency identify key components or enablers that can promote a more efficient process. By using
the BPMN modeling notation template (or similar process modeling tool) to document and
26
represent the agency’s process, stakeholders can see the connections between the different
components of the process more easily.
Step 4: Develop/Change and Implement Process. This step is driven by a particular influence
identified in the first step. This step is usually initiated at the grassroots level of an organization
by staff or advocates who are at the center of the activities involved. The implementation can be
formal or informal, depending on the complexity of the process and the agencies involved. This
is the core step toward process integration.
Step 5: Assess Process. Once the new process has been implemented, it is assessed or
evaluated against the identified goals. In an iterative approach with Step 4 (Develop/Change and
Implement Process), the process continues to be refined on the basis of performance against the
goals.
Step 6: Document Process. Agencies document their processes with varying degrees of
complexity. Documentation can be as simple as an interagency agreement or as complex as a
multivolume operations manual. Regardless of the type of documentation, it should capture the
roles, responsibilities, objectives, and expected outcomes of the process.
Step 7: Institutionalize Process. The seventh step of business process integration may consist
of adopting operational activities and processes, implementing formal traffic policies,
establishing training, or other actions. Institutionalization requires the buy-in and support of
upper management, as well as additional stakeholders who have a vested interest in the outcomes
of the business process. This step will have a direct impact on the long-term survival of a process
within an organization.
From the home screen, the user can choose either the orientation to the e-tool or the application
of the e-tool module. If the user selects to learn about the seven step process before going
forward, then the following shows the information that would be presented to the user.
Orientation to e-tool
The introduction page to the orientation module contains the following information:
Welcome to the Orientation to the e-tool! Here, the seven steps to help improve travel time
reliability through improving business processes are explained. This orientation is developed for
an individual to utilize for learning the seven steps of the methodology through training videos,
which explain the steps and provide real world examples through existing case studies. There are
also quizzes throughout this training to assist in identifying key points in the training. As each
step of the methodology is completed, a check will appear in the navigation panel on the left side
of this screen next to the appropriate step to indicate completion of the training for that step. The
Case Studies and Resources pages may be accessed at the left side panel at any time.
The objectives of this orientation are:
To educate technical and non-technical employees to identify how to evaluate/change a
business process
27
To educate technical and non-technical employees to overcome obstacles that will result
in an advancement of operations
To introduce all seven steps of the methodology to improve travel time reliability
Reinforce training through recall quizzes and case study examples
For more information on the specific case studies, please go to the Case Studies section of this
orientation. When ready, click Next to being the training.
To return to the home page, please use the "Return to Home Page" button in the menu bar to the
left or just close this window using the standard window close mechanism above.
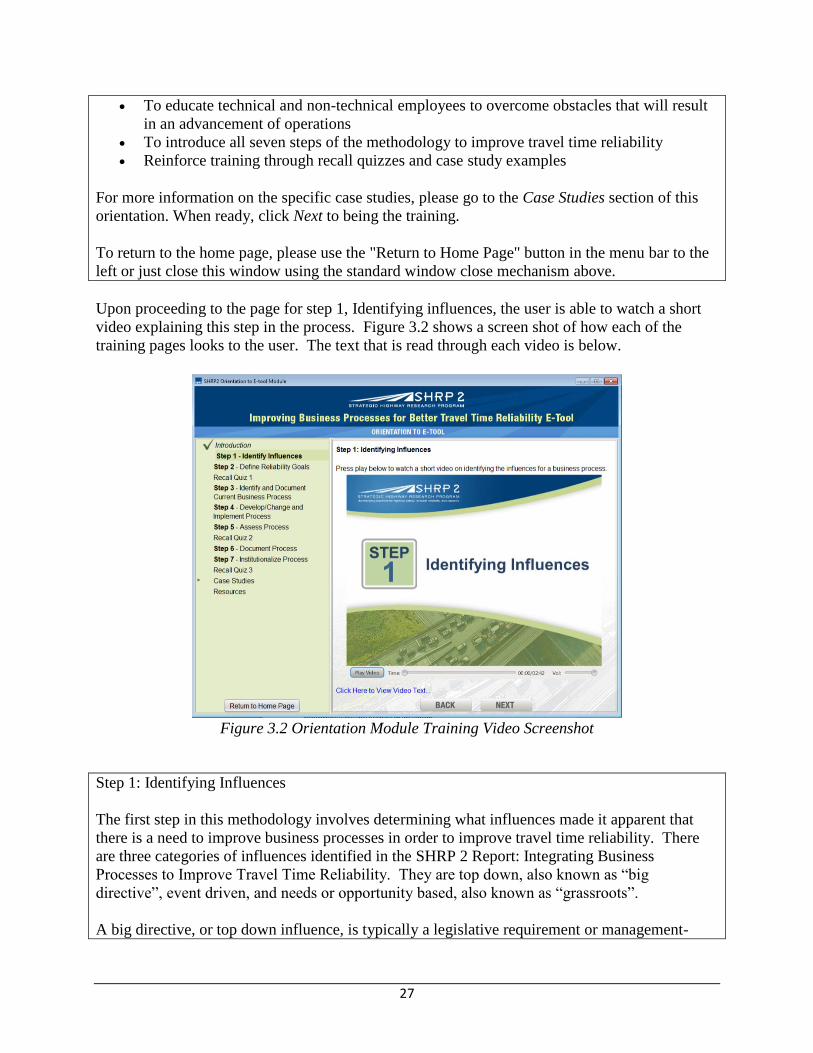
Upon proceeding to the page for step 1, Identifying influences, the user is able to watch a short
video explaining this step in the process. Figure 3.2 shows a screen shot of how each of the
training pages looks to the user. The text that is read through each video is below.
Figure 3.2 Orientation Module Training Video Screenshot
Step 1: Identifying Influences
The first step in this methodology involves determining what influences made it apparent that
there is a need to improve business processes in order to improve travel time reliability. There
are three categories of influences identified in the SHRP 2 Report: Integrating Business
Processes to Improve Travel Time Reliability. They are top down, also known as “big
directive”, event driven, and needs or opportunity based, also known as “grassroots”.
A big directive, or top down influence, is typically a legislative requirement or management-
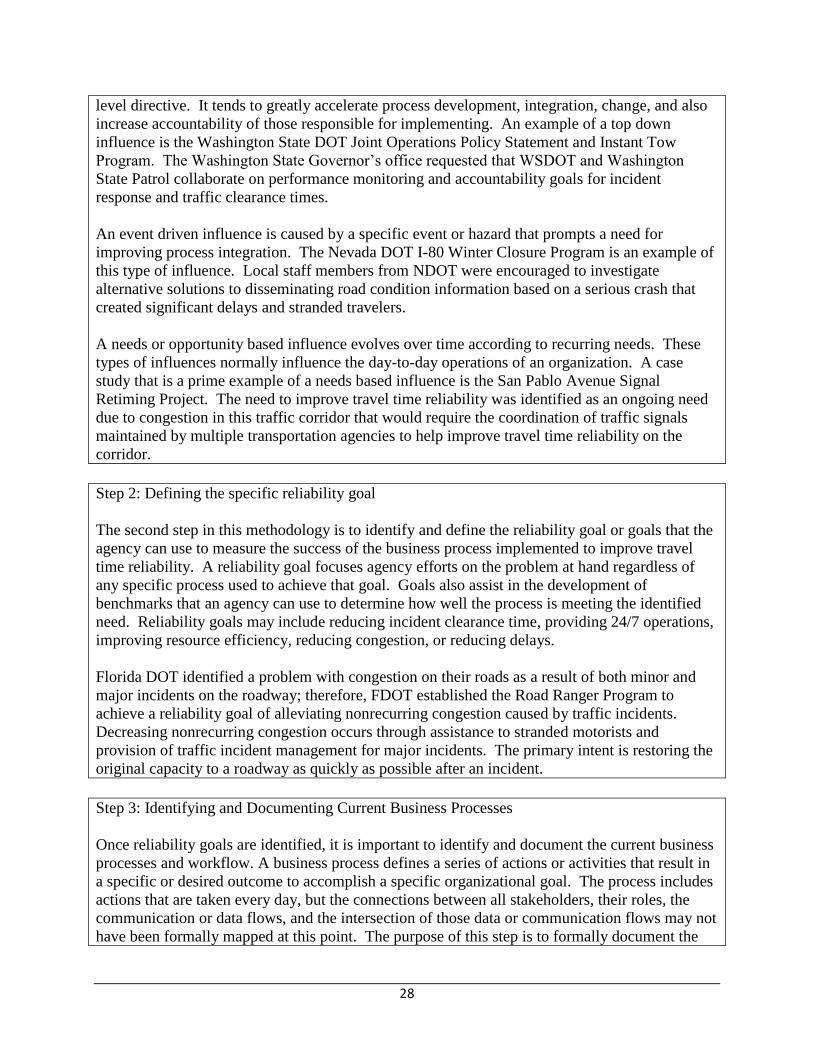
28
level directive. It tends to greatly accelerate process development, integration, change, and also
increase accountability of those responsible for implementing. An example of a top down
influence is the Washington State DOT Joint Operations Policy Statement and Instant Tow
Program. The Washington State Governor’s office requested that WSDOT and Washington
State Patrol collaborate on performance monitoring and accountability goals for incident
response and traffic clearance times.
An event driven influence is caused by a specific event or hazard that prompts a need for
improving process integration. The Nevada DOT I-80 Winter Closure Program is an example of
this type of influence. Local staff members from NDOT were encouraged to investigate
alternative solutions to disseminating road condition information based on a serious crash that
created significant delays and stranded travelers.
A needs or opportunity based influence evolves over time according to recurring needs. These
types of influences normally influence the day-to-day operations of an organization. A case
study that is a prime example of a needs based influence is the San Pablo Avenue Signal
Retiming Project. The need to improve travel time reliability was identified as an ongoing need
due to congestion in this traffic corridor that would require the coordination of traffic signals
maintained by multiple transportation agencies to help improve travel time reliability on the
corridor.
Step 2: Defining the specific reliability goal
The second step in this methodology is to identify and define the reliability goal or goals that the
agency can use to measure the success of the business process implemented to improve travel
time reliability. A reliability goal focuses agency efforts on the problem at hand regardless of
any specific process used to achieve that goal. Goals also assist in the development of
benchmarks that an agency can use to determine how well the process is meeting the identified
need. Reliability goals may include reducing incident clearance time, providing 24/7 operations,
improving resource efficiency, reducing congestion, or reducing delays.
Florida DOT identified a problem with congestion on their roads as a result of both minor and
major incidents on the roadway; therefore, FDOT established the Road Ranger Program to
achieve a reliability goal of alleviating nonrecurring congestion caused by traffic incidents.
Decreasing nonrecurring congestion occurs through assistance to stranded motorists and
provision of traffic incident management for major incidents. The primary intent is restoring the
original capacity to a roadway as quickly as possible after an incident.
Step 3: Identifying and Documenting Current Business Processes
Once reliability goals are identified, it is important to identify and document the current business
processes and workflow. A business process defines a series of actions or activities that result in
a specific or desired outcome to accomplish a specific organizational goal. The process includes
actions that are taken every day, but the connections between all stakeholders, their roles, the
communication or data flows, and the intersection of those data or communication flows may not
have been formally mapped at this point. The purpose of this step is to formally document the

29
current process to visually facilitate a better understanding of that process.
There are important benefits in documenting the existing or baseline processes. One benefit is
understanding how the data flows, the decisions points, and where the process integration occurs.
Understanding the critical entities and actions that effect travel time reliability and performance
on a broader scale will help an agency identify areas for improvement. By documenting the
current processes, the agency or stakeholders will also be able to identify critical gaps or issues
and key components or enablers to establish a more efficient process. Documenting the processes
also helps to identify stakeholders that are missing from the current process, and formalize roles
and responsibilities to improve the continuity of the business process with personnel changes.
Although here are many ways to document the existing process, and one is not better than
another, this video will present two approaches to mapping your business processes that
influence travel time reliability. It is up to the group to decide how to best document the process
that is being evaluated. For additional information on mapping and documenting business
processes, please refer to the final reports of the SHRP 2 L01 Integrating Business Processes to
Improve Travel Time Reliability.
When mapping your business process start with the basics: which agencies or organizations are
key to the successful implementation of a particular operations management deployment? For
example, the Florida Road Rangers Program identified their incident management stakeholders
to include:
Florida Highway Patrol
FDOT District Headquarters
FDOT District TMC
Private towing vendor
Private sponsor of the Florida Road Ranger Program
The motorist
By formally identifying your partners you may identify people or groups that may not have been
recognized otherwise.
Next, gather all existing documentation of the existing process, if any. This could include
current standard operating procedures, written thoughts from the group, existing MOUs, or any
other ways that the current processes are shared with others. The goal of this step is to organize
all of the documentation into a form that can be assessed for missing steps or other areas of
improvement.
Documenting the process or reverse engineering the current management process is the next step.
For example, in an incident management program, how are incidents detected, reported,
processed, and ultimately cleared from the roadway? Consider:
Data flows
Decision points
Where process integration occurs
30
Critical input and output
Responsible entities
Integration of processes
Once all of the existing documentation is collected, creating a flow chart or other model to
visually represent the current process is greatly beneficial to the assessment as a whole. Visual
representation of the process will help the group better understand where improvements can be
made. There are several approaches to mapping your business process. In some instances, a
basic sketch of the stakeholders, their roles and responsibilities, and data flows may be enough to
help an agency identify their strengths and weaknesses within a particular operations area. Other
groups may find it helpful to utilize a more comprehensive drawing to fully understand a
process. Two representations of the Florida Road Ranger Program have been included in the e-
tool to illustrate these two methods.
First, a readily available drawing program was used to map the Florida Road Ranger Program.
To begin, a fictitious incident was placed on the map and the various scenarios for detection
were noted on the drawing. For example, if an incident was reported via a 911 call, an arrow
was drawn between the incident and the Florida Highway Patrol Dispatcher. Next, the Road
Ranger Operators are notified of the incident accordingly. This process is continued for each of
the possible data flows between the stakeholders during the clearing of the incident. Once the
incident is cleared, the incident report is filled out and the motorist completes a comment card
that is later used to evaluate the program. This is an example of a flow chart used to visually
document the business process of the Florida Road Ranger Program.
Another approach to business process mapping is a more formal process developed by IBM that
utilizes Business Process Mapping Notation, or BPMN. Similar to the previous example,
stakeholders are identified and processes documented. Business process modeling makes a
connection between those who create the process, those who implement the process, and those
who will perform the process. The SHRP 2 L01 report, Integrating Business Processes to
Improve Travel Time Reliability, details the parts of Business Process Modeling Notation.
Let’s look at the main parts of a model using Business Process Modeling Notation for the same
Florida Road Rangers Program. Similar to the flow chart, the key stakeholders and players are
first identified. Also included in the BPMN example are the policy and organizational structure
headings to break up the types of actions that are taken throughout the process. Instead of
beginning with an incident, a BPM begins with the policy level steps. For the Road Rangers, the
process began with identifying a need for the program, followed by other policy level steps.
Then, the steps of the specific process are identified and filled in. Lastly, any steps of evaluation
or documentation are identified and populated in the model. BPMN uses a visual representation
consisting of several terms and symbols that provide consistency to help guide a process’s flow
of events. For a detailed explanation of each of the terms and symbols in BPMN, refer to the L01
Report. This is an example of a more detailed model for visually documenting the current
business process.
Step 4: Developing/Changing and Implementing Process
31
Step 4 of the process integration begins the iterative portion of the exercise. Step 4 and step 5
are performed in a cycle, repeated until the process successfully meets a predetermined goal.
Step 4 is broken down into two parts, develop or change the process and implement the process.
The first, develop or change the process, builds upon the business processes developed in step 3.
Solutions to identified needs and goals are addressed here. Utilizing the influences identified in
Step 1 will help to guide the changes in processes to improve travel time reliability. Involving
key personnel that work closest to the process is beneficial, as they will have extra incentive to
produce an effective model. At this point, you will reference your business processes that were
identified in step 3 and make any changes to the process that the group feels are necessary.
These changes may be policy changes, changes to the physical process, or any other changes that
will be implemented and evaluated in the following steps. The timeframe for moving forward to
the implementation phase of Step 4 will depend on the agency’s ability to develop/change the
current business process. The amount of time it will take to move to implementation will be
unique for each agency and situation and it can be formal or informal in nature.
Once the changes to the business process or processes have been identified, the updated or new
process can be implemented. The approach to this implementation will vary based on factors
such as the number of agencies involved and the depth of the process within the agency’s
broader operations strategy. It is important to be sure to involve all stakeholders in the
implementation stage, as buy-in is key to the success of the overall process. Stakeholders may
include a broad range of people, from office managers to workers in the field, and their input will
be important to the successful implementation of the identified business process changes needed
to improve travel time reliability. The amount of time between implementation and moving on to
Step 5 needs to be sufficient to allow for stabilization of the new process to be assessed fairly. If
after the initial assessment, further iterations are required, the amount of time between
implementation and assessment may be reduced due to the continued refinement of the process.
The Florida Road Ranger Program changed the business processes to improve travel time
reliability. The Program brings together FDOT, the Florida Highway Patrol, private service
providers, and private sponsors to patrol 1,000 centerline miles of freeway in Florida and assist
travelers with a variety of issues. When the program lost funding due to budget cuts, the
processes were changed to allow the service providers to seek sponsorship in order to continue
their patrols. The influence for this change in business processes was the decrease in funding;
however, the program was able to identify a new business model that allows it to continue to
assist travelers and improve travel time reliability.
Step 5: Assessing the Process
Step 5 involves assessing the newly developed process. Some level of assessment is important to
determine the effectiveness of that process. Step 5 is the third part of the iterative cycle
introduced in step 4. The results of this assessment are then either fed back into step 4 in order
to make additional changes, or are used in moving forward to the next step of the overall process.
Ensuring that having a measure of success, a method for continuous evaluation, and the data
needed to complete the evaluation is important. These things provide a means to communicate
32
the effectiveness of the process with senior managers, vital staff, and the public. By measuring
the effectiveness of the newly developed process, opportunities are available to periodically
evaluate performance in an ongoing effort for improvement of travel time reliability. It is also
important to assess the new processes against pre-implementation conditions; this will provide an
opportunity to determine if any changes made to business processes are effective at improving
travel time reliability.
Tracking performance can be fundamental to gaining support of the public and ensuring
continual funding for identified solutions to improve travel time reliability. FDOT collects
output and outcome based performance measures on their Road Ranger service patrol program.
Output-based measures include the number of assists provided to motorists and the number of
miles of freeways covered by the Road Ranger patrols. The outcome based performance
measures include the incident duration, travel time reliability, and customer satisfaction. The
Road Rangers have a direct impact on the customer satisfaction measure; however the program
does play a significant role in reducing incident congestion and thus improving travel time
reliability.
Step 6: Documenting the Process
After the completion of steps 4 and 5, which may require one or more iterations and time to
observe the effectiveness of improved business processes, the next step is to document the new
or changed process. Documentation typically occurs once the process has been implemented and
proven effective. Documentation is intended to provide detailed steps of the business process,
the evaluation process, and the stated benefits and lessons learned. Documentation should also
include the roles and responsibilities of the stakeholders involved in the future.
Documentation will help to demonstrate performance against the goals identified in Step 2 and
will also facilitate easier updates and modifications to the process in the future. If time is not
available to prepare detailed process models, it is recommended that key steps, relationships,
information exchanges, and other details be documented. These types of documentation can be
achieved through developing internal memorandums, informal memorandums of understanding
(MOU), user guides, or other complex agreements between stakeholders. Other types of
documentation include conducting evaluation meetings and development and creation of reports
and flowcharts.
FDOT documents its processes through ongoing performance measurement efforts, customer
surveys, and a benefit-cost analysis study on the benefits of the Road Ranger program.
Step 7: Institutionalizing the Process
The seventh and final step identified in the SHRP 2 Integrating Business Processes to Improve
Travel Time Reliability Guide is institutionalizing the process. It is the way in which a new or
changed process is incorporated into existing policies or management programs.
Institutionalizing typically starts at the highest level possible of an organization, and must be
able to survive changes in management and personnel. The most successful business processes
rely on linking the process to firmly established agency goals, objectives, or mission-critical
33
activities.
There are four strategies and considerations to keep in mind when institutionalizing processes.
The first strategy is the importance of stakeholder buy-in and support of the process.
Institutionalization requires more than just adopting operational activities or processes; it is
dependent on buy-in and ongoing support of agency leaders. If the stakeholders do not support
and encourage the use of identified business processes, it may not remain a viable process.
Strong buy-in from FDOT and the Florida Highway Patrol for the Road Ranger Program has
greatly increased the viability of the program as a whole. A second strategy is to ensure tangible
and directly relatable results. Processes will more likely transcend individual divisions or
operating units or be solidified across multiple agencies if the benefits and outcomes are tangible
and directly related to each agency and operating unit.
A third strategy that will greatly assist in institutionalizing business processes is developing
formal documentation that is accessible and available to all stakeholders. This formal
documentation and accessibility of the documentation will help institutionalize implemented
processes to improve travel time reliability. An example of formal documentation is an inter-
agency agreement on a network directory that is available to all stakeholders. Lastly, a fourth
consideration is focusing on the sustainability of the documentation. Formal agreements that
require approval from management tend to last longer than informal ones.
An example of successful institutionalization of business processes to improve travel time
reliability is demonstrated in the Florida Road Ranger program case study. The program had
strong buy-in from FDOT, Florida Highway Patrol (FHP) and the tow vendors associated with
the program. During the slow economy in 2008 and 2009, FDOT needed to secure private
sponsorship of the program due to state budget reductions. The buy-in of stakeholders and
continual measurement of the performance and benefits of the Road Rangers program were key
to the successful recruitment of private program sponsors.
Quizzes
Included in the orientation module are three quizzes to test the knowledge of the user on the
information provided on the seven step process. Quizzes were developed to help reinforce the
information that was communicated through the voice over videos. The questions and answers
for each question in each of the three quizzes are given below.
Orientation Module Quiz 1
1) Which of the following is NOT considered a type of influence?
a. Top-down
b. Event driven
c. Crash report
d. Needs Based
2) Big Directive influence evolves over time according to recurring needs. These types of
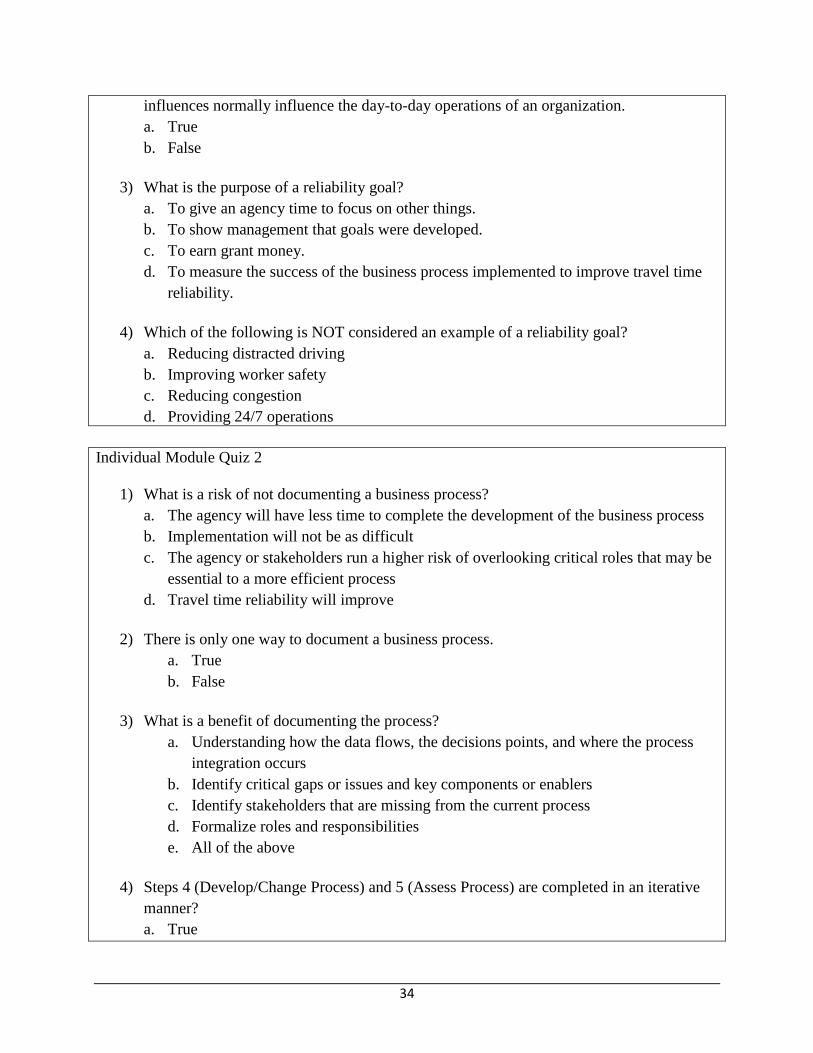
34
influences normally influence the day-to-day operations of an organization.
a. True
b. False
3) What is the purpose of a reliability goal?
a. To give an agency time to focus on other things.
b. To show management that goals were developed.
c. To earn grant money.
d. To measure the success of the business process implemented to improve travel time
reliability.
4) Which of the following is NOT considered an example of a reliability goal?
a. Reducing distracted driving
b. Improving worker safety
c. Reducing congestion
d. Providing 24/7 operations
Individual Module Quiz 2
1) What is a risk of not documenting a business process?
a. The agency will have less time to complete the development of the business process
b. Implementation will not be as difficult
c. The agency or stakeholders run a higher risk of overlooking critical roles that may be
essential to a more efficient process
d. Travel time reliability will improve
2) There is only one way to document a business process.
a. True
b. False
3) What is a benefit of documenting the process?
a. Understanding how the data flows, the decisions points, and where the process
integration occurs
b. Identify critical gaps or issues and key components or enablers
c. Identify stakeholders that are missing from the current process
d. Formalize roles and responsibilities
e. All of the above
4) Steps 4 (Develop/Change Process) and 5 (Assess Process) are completed in an iterative
manner?
a. True
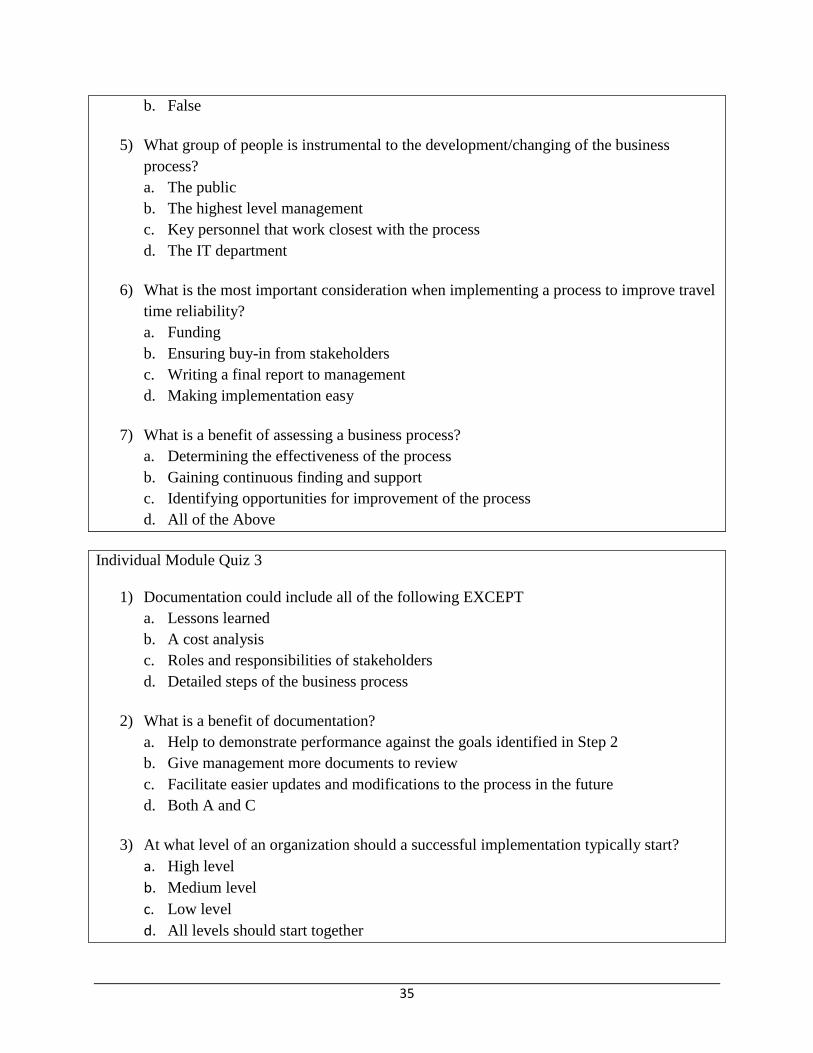
35
b. False
5) What group of people is instrumental to the development/changing of the business
process?
a. The public
b. The highest level management
c. Key personnel that work closest with the process
d. The IT department
6) What is the most important consideration when implementing a process to improve travel
time reliability?
a. Funding
b. Ensuring buy-in from stakeholders
c. Writing a final report to management
d. Making implementation easy
7) What is a benefit of assessing a business process?
a. Determining the effectiveness of the process
b. Gaining continuous finding and support
c. Identifying opportunities for improvement of the process
d. All of the Above
Individual Module Quiz 3
1) Documentation could include all of the following EXCEPT
a. Lessons learned
b. A cost analysis
c. Roles and responsibilities of stakeholders
d. Detailed steps of the business process
2) What is a benefit of documentation?
a. Help to demonstrate performance against the goals identified in Step 2
b. Give management more documents to review
c. Facilitate easier updates and modifications to the process in the future
d. Both A and C
3) At what level of an organization should a successful implementation typically start?
a. High level
b. Medium level
c. Low level
d. All levels should start together
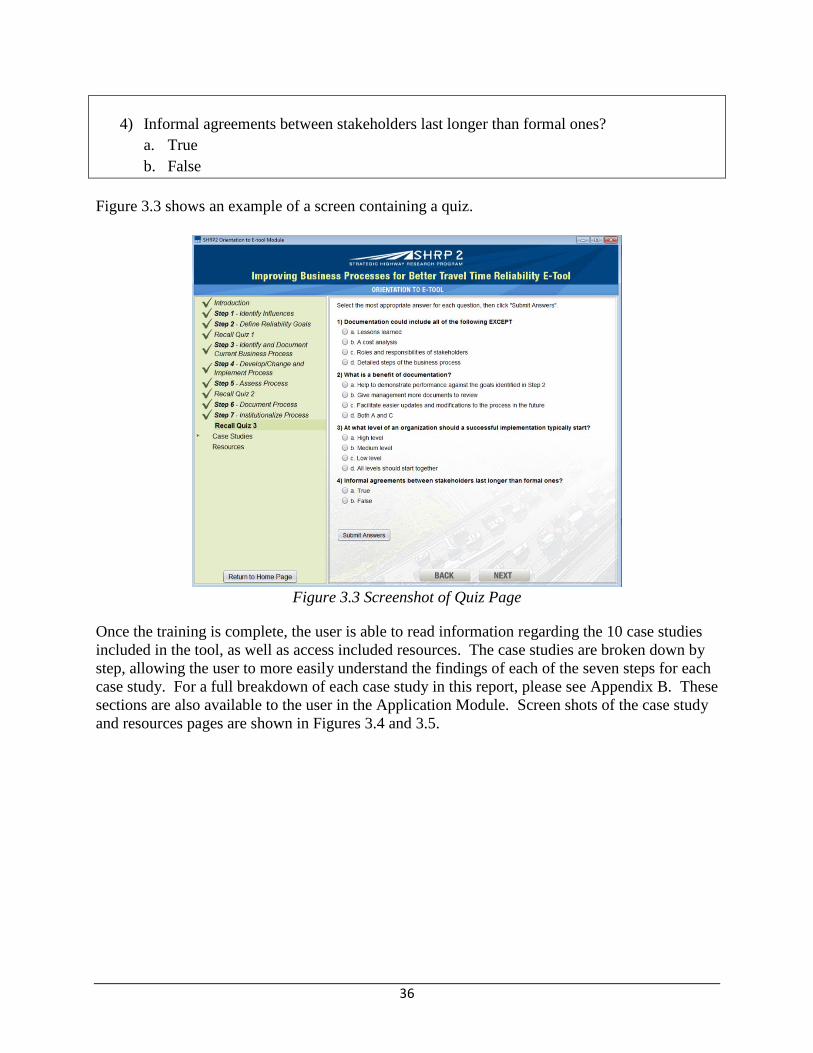
36
4) Informal agreements between stakeholders last longer than formal ones?
a. True
b. False
Figure 3.3 shows an example of a screen containing a quiz.
Figure 3.3 Screenshot of Quiz Page
Once the training is complete, the user is able to read information regarding the 10 case studies
included in the tool, as well as access included resources. The case studies are broken down by
step, allowing the user to more easily understand the findings of each of the seven steps for each
case study. For a full breakdown of each case study in this report, please see Appendix B. These
sections are also available to the user in the Application Module. Screen shots of the case study
and resources pages are shown in Figures 3.4 and 3.5.
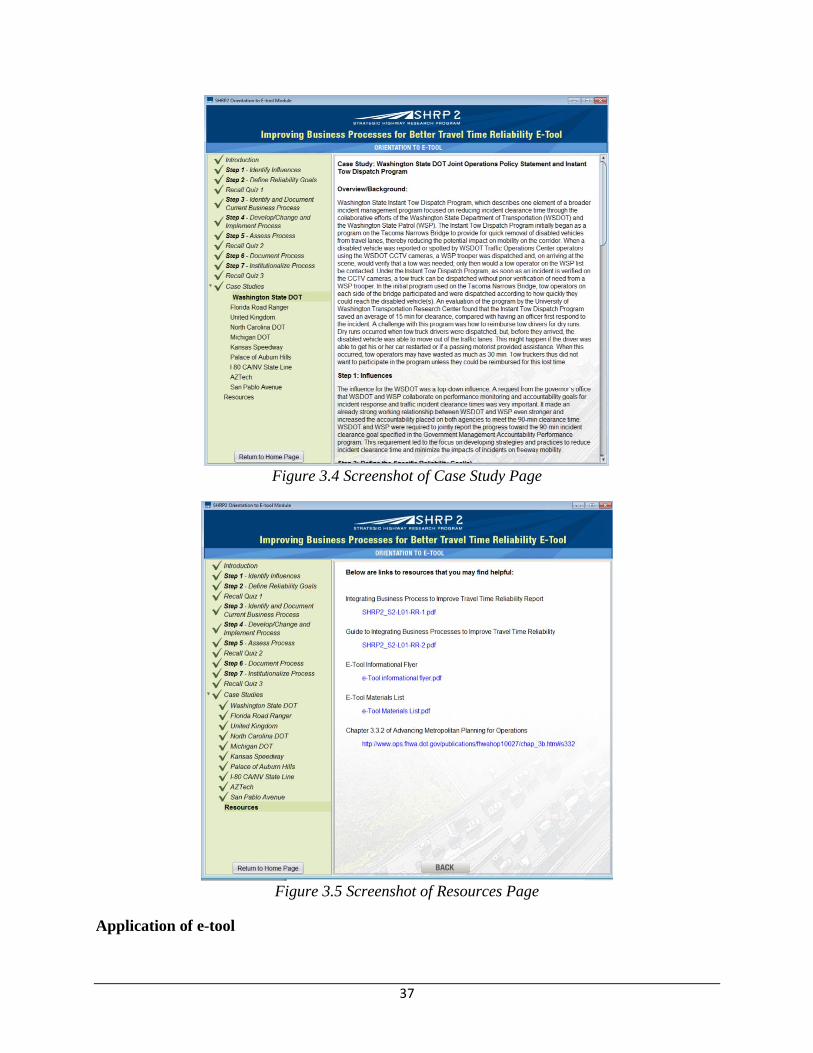
37
Figure 3.4 Screenshot of Case Study Page
Figure 3.5 Screenshot of Resources Page
Application of e-tool
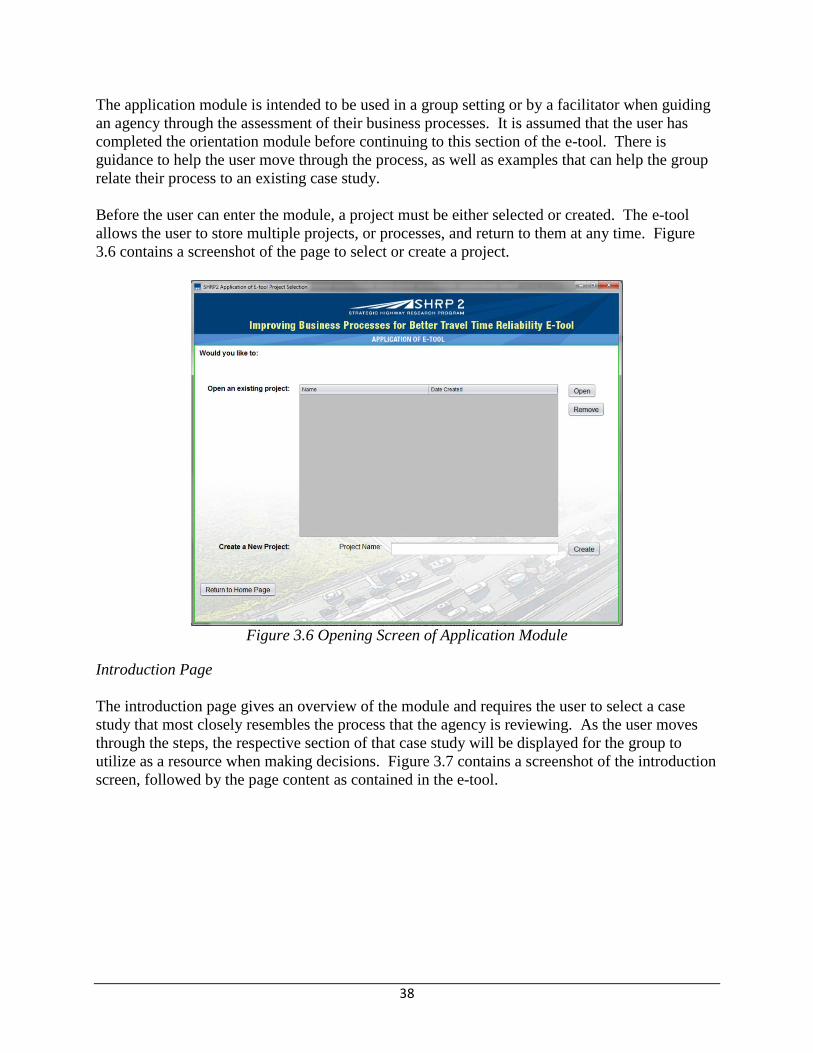
38
The application module is intended to be used in a group setting or by a facilitator when guiding
an agency through the assessment of their business processes. It is assumed that the user has
completed the orientation module before continuing to this section of the e-tool. There is
guidance to help the user move through the process, as well as examples that can help the group
relate their process to an existing case study.
Before the user can enter the module, a project must be either selected or created. The e-tool
allows the user to store multiple projects, or processes, and return to them at any time. Figure
3.6 contains a screenshot of the page to select or create a project.
Figure 3.6 Opening Screen of Application Module
Introduction Page
The introduction page gives an overview of the module and requires the user to select a case
study that most closely resembles the process that the agency is reviewing. As the user moves
through the steps, the respective section of that case study will be displayed for the group to
utilize as a resource when making decisions. Figure 3.7 contains a screenshot of the introduction
screen, followed by the page content as contained in the e-tool.
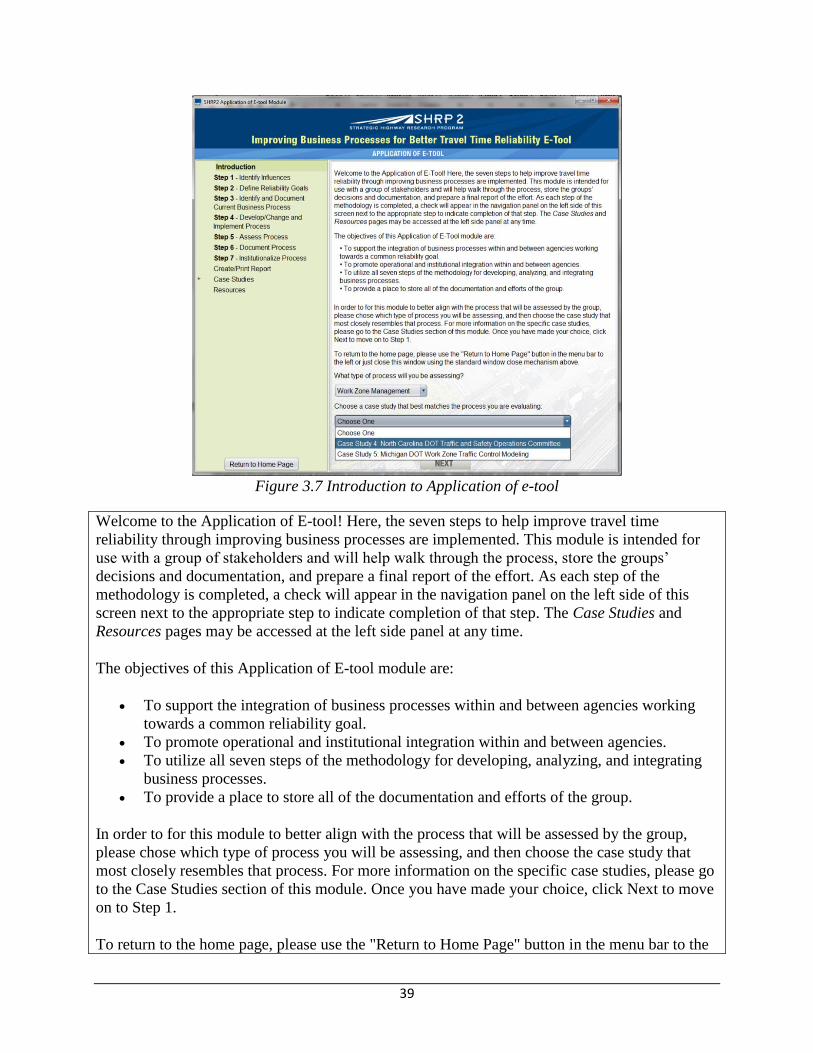
39
Figure 3.7 Introduction to Application of e-tool
Welcome to the Application of E-tool! Here, the seven steps to help improve travel time
reliability through improving business processes are implemented. This module is intended for
use with a group of stakeholders and will help walk through the process, store the groups’
decisions and documentation, and prepare a final report of the effort. As each step of the
methodology is completed, a check will appear in the navigation panel on the left side of this
screen next to the appropriate step to indicate completion of that step. The Case Studies and
Resources pages may be accessed at the left side panel at any time.
The objectives of this Application of E-tool module are:
To support the integration of business processes within and between agencies working
towards a common reliability goal.
To promote operational and institutional integration within and between agencies.
To utilize all seven steps of the methodology for developing, analyzing, and integrating
business processes.
To provide a place to store all of the documentation and efforts of the group.
In order to for this module to better align with the process that will be assessed by the group,
please chose which type of process you will be assessing, and then choose the case study that
most closely resembles that process. For more information on the specific case studies, please go
to the Case Studies section of this module. Once you have made your choice, click Next to move
on to Step 1.
To return to the home page, please use the "Return to Home Page" button in the menu bar to the
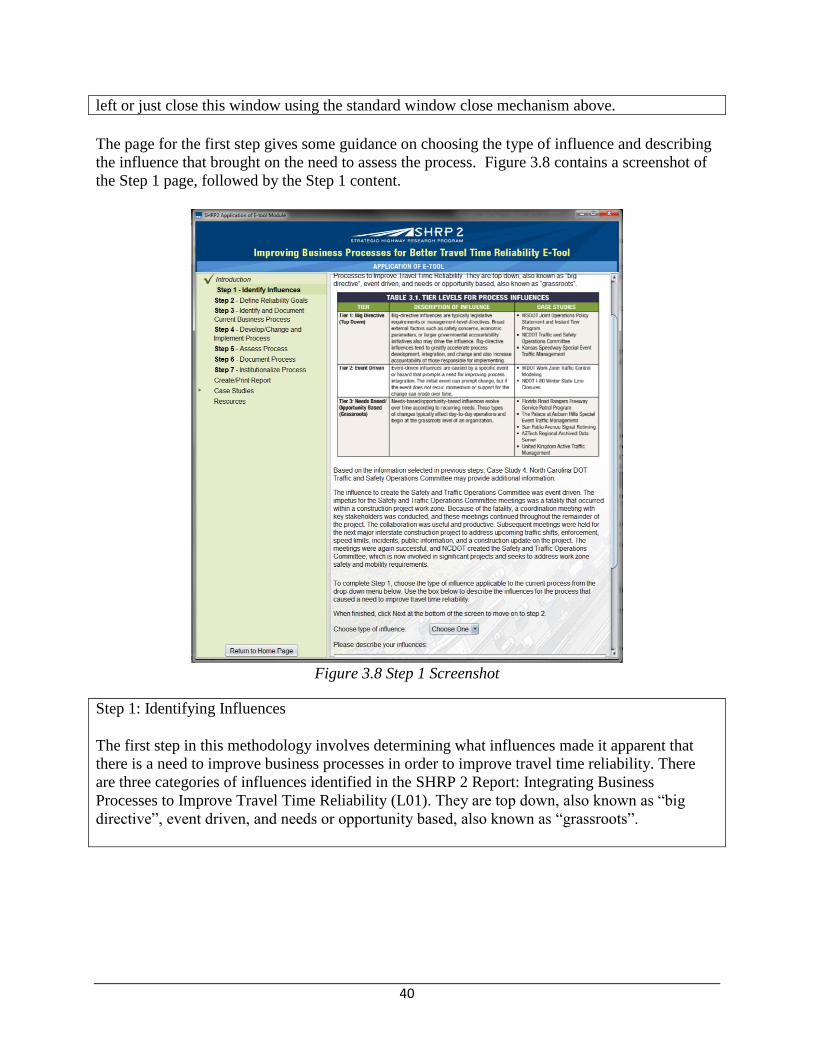
40
left or just close this window using the standard window close mechanism above.
The page for the first step gives some guidance on choosing the type of influence and describing
the influence that brought on the need to assess the process. Figure 3.8 contains a screenshot of
the Step 1 page, followed by the Step 1 content.
Figure 3.8 Step 1 Screenshot
Step 1: Identifying Influences
The first step in this methodology involves determining what influences made it apparent that
there is a need to improve business processes in order to improve travel time reliability. There
are three categories of influences identified in the SHRP 2 Report: Integrating Business
Processes to Improve Travel Time Reliability (L01). They are top down, also known as “big
directive”, event driven, and needs or opportunity based, also known as “grassroots”.

41
Based on the information selected in previous steps, Case Study X may provide additional
information:
Text content located here will be dependent on the case study selected in the introduction screen.
The Step 1 section from the selected case study is displayed to help guide the user. To view the
case study breakdowns, please see Appendix B.
Step 2 asks the user to define the reliability goals associated with the process that is being
assessed. Guidance is given on completing this task to the user. Figure 3.9 contains a screenshot
of step 2, followed by the content of this step as contained in the e-tool.
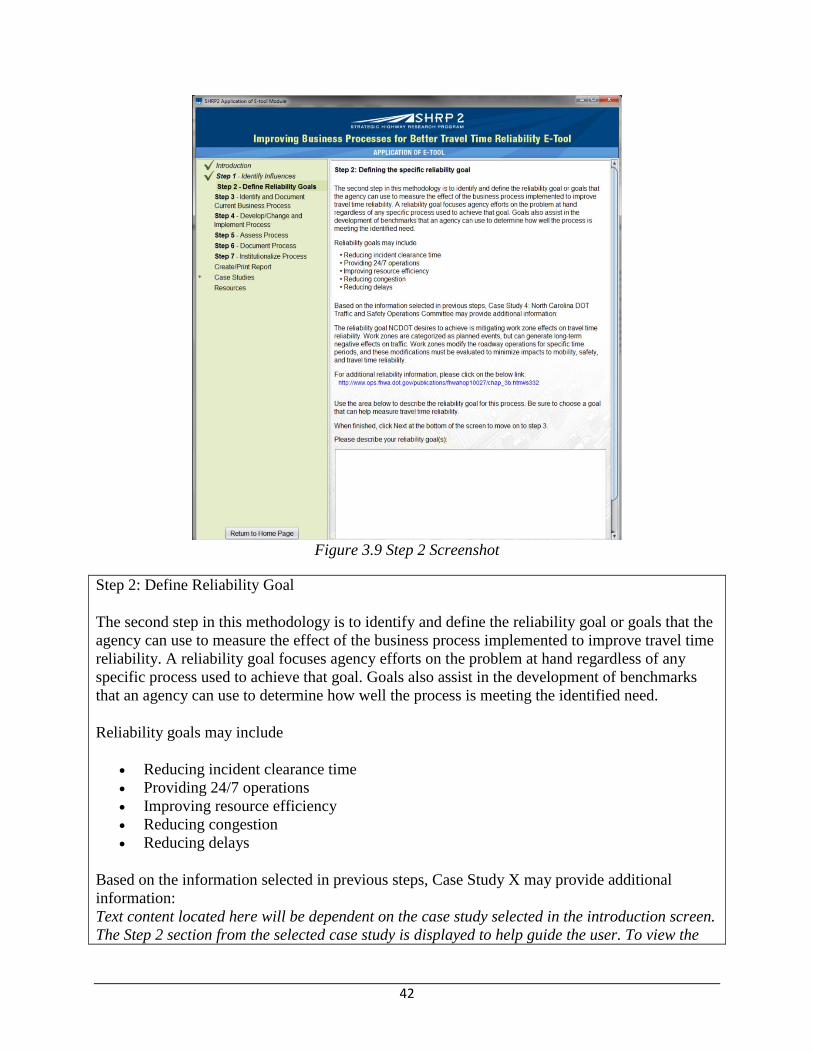
42
Figure 3.9 Step 2 Screenshot
Step 2: Define Reliability Goal
The second step in this methodology is to identify and define the reliability goal or goals that the
agency can use to measure the effect of the business process implemented to improve travel time
reliability. A reliability goal focuses agency efforts on the problem at hand regardless of any
specific process used to achieve that goal. Goals also assist in the development of benchmarks
that an agency can use to determine how well the process is meeting the identified need.
Reliability goals may include
Reducing incident clearance time
Providing 24/7 operations
Improving resource efficiency
Reducing congestion
Reducing delays
Based on the information selected in previous steps, Case Study X may provide additional
information:
Text content located here will be dependent on the case study selected in the introduction screen.
The Step 2 section from the selected case study is displayed to help guide the user. To view the
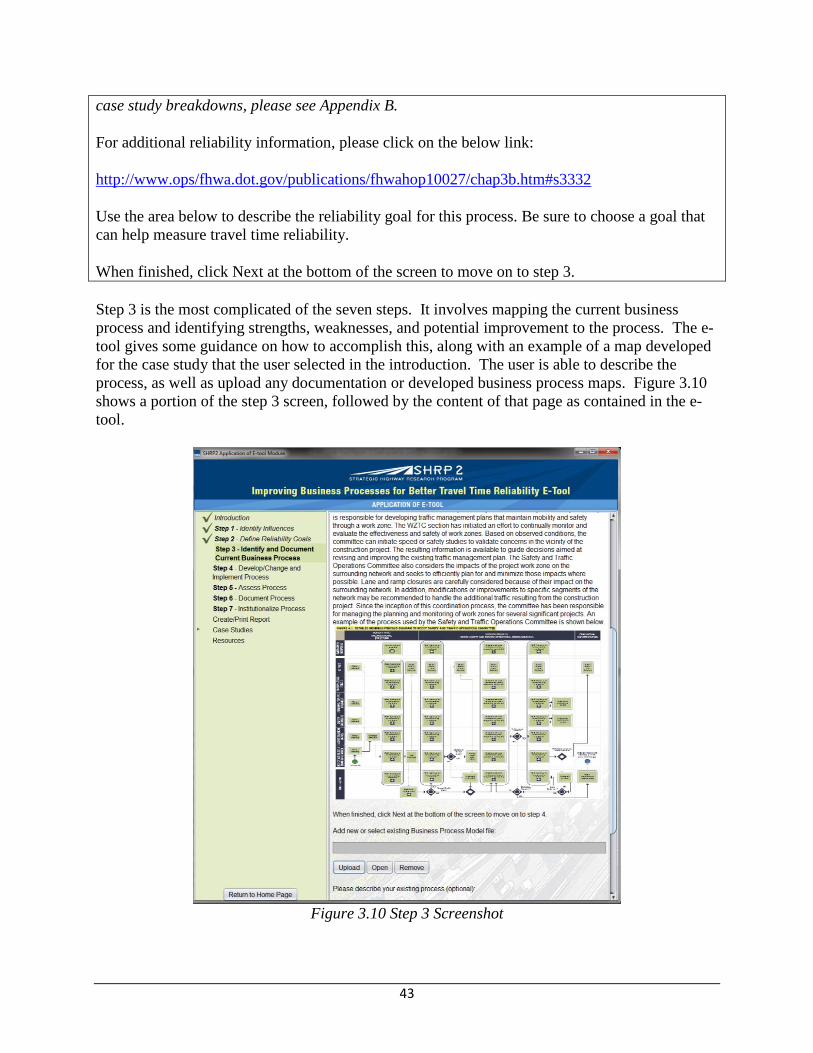
43
case study breakdowns, please see Appendix B.
For additional reliability information, please click on the below link:
http://www.ops/fhwa.dot.gov/publications/fhwahop10027/chap3b.htm#s3332
Use the area below to describe the reliability goal for this process. Be sure to choose a goal that
can help measure travel time reliability.
When finished, click Next at the bottom of the screen to move on to step 3.
Step 3 is the most complicated of the seven steps. It involves mapping the current business
process and identifying strengths, weaknesses, and potential improvement to the process. The e-
tool gives some guidance on how to accomplish this, along with an example of a map developed
for the case study that the user selected in the introduction. The user is able to describe the
process, as well as upload any documentation or developed business process maps. Figure 3.10
shows a portion of the step 3 screen, followed by the content of that page as contained in the e-
tool.
Figure 3.10 Step 3 Screenshot
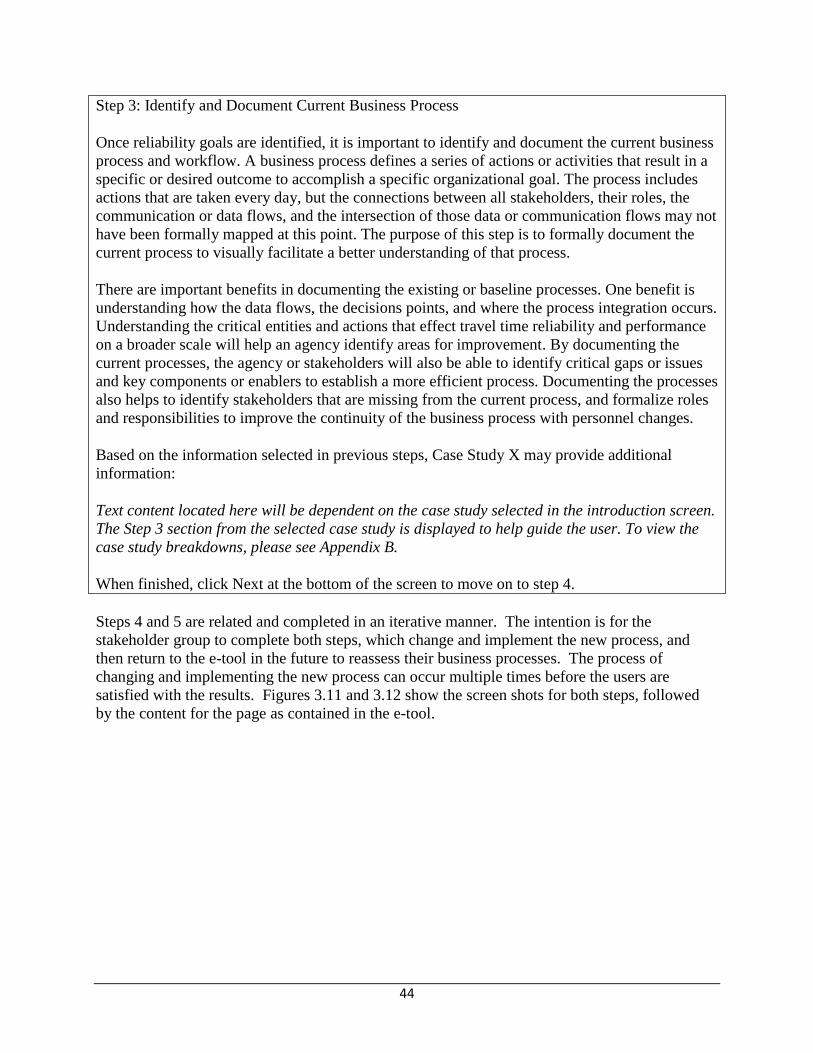
44
Step 3: Identify and Document Current Business Process
Once reliability goals are identified, it is important to identify and document the current business
process and workflow. A business process defines a series of actions or activities that result in a
specific or desired outcome to accomplish a specific organizational goal. The process includes
actions that are taken every day, but the connections between all stakeholders, their roles, the
communication or data flows, and the intersection of those data or communication flows may not
have been formally mapped at this point. The purpose of this step is to formally document the
current process to visually facilitate a better understanding of that process.
There are important benefits in documenting the existing or baseline processes. One benefit is
understanding how the data flows, the decisions points, and where the process integration occurs.
Understanding the critical entities and actions that effect travel time reliability and performance
on a broader scale will help an agency identify areas for improvement. By documenting the
current processes, the agency or stakeholders will also be able to identify critical gaps or issues
and key components or enablers to establish a more efficient process. Documenting the processes
also helps to identify stakeholders that are missing from the current process, and formalize roles
and responsibilities to improve the continuity of the business process with personnel changes.
Based on the information selected in previous steps, Case Study X may provide additional
information:
Text content located here will be dependent on the case study selected in the introduction screen.
The Step 3 section from the selected case study is displayed to help guide the user. To view the
case study breakdowns, please see Appendix B.
When finished, click Next at the bottom of the screen to move on to step 4.
Steps 4 and 5 are related and completed in an iterative manner. The intention is for the
stakeholder group to complete both steps, which change and implement the new process, and
then return to the e-tool in the future to reassess their business processes. The process of
changing and implementing the new process can occur multiple times before the users are
satisfied with the results. Figures 3.11 and 3.12 show the screen shots for both steps, followed
by the content for the page as contained in the e-tool.
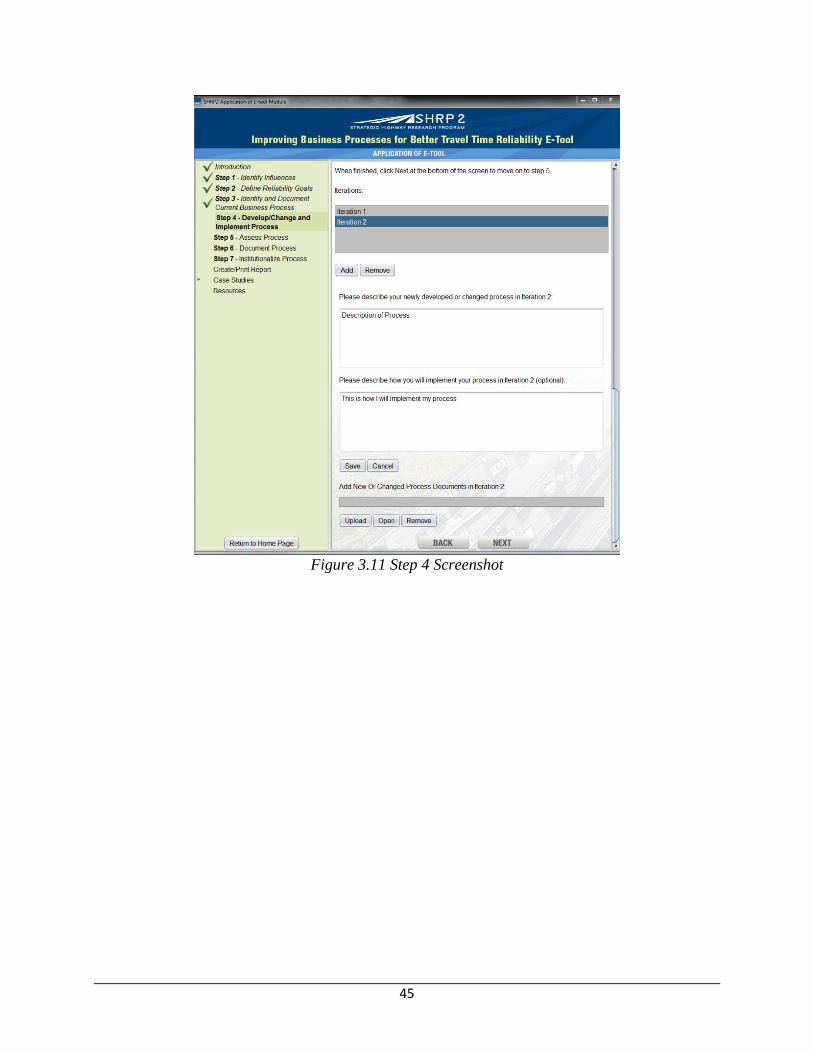
45
Figure 3.11 Step 4 Screenshot
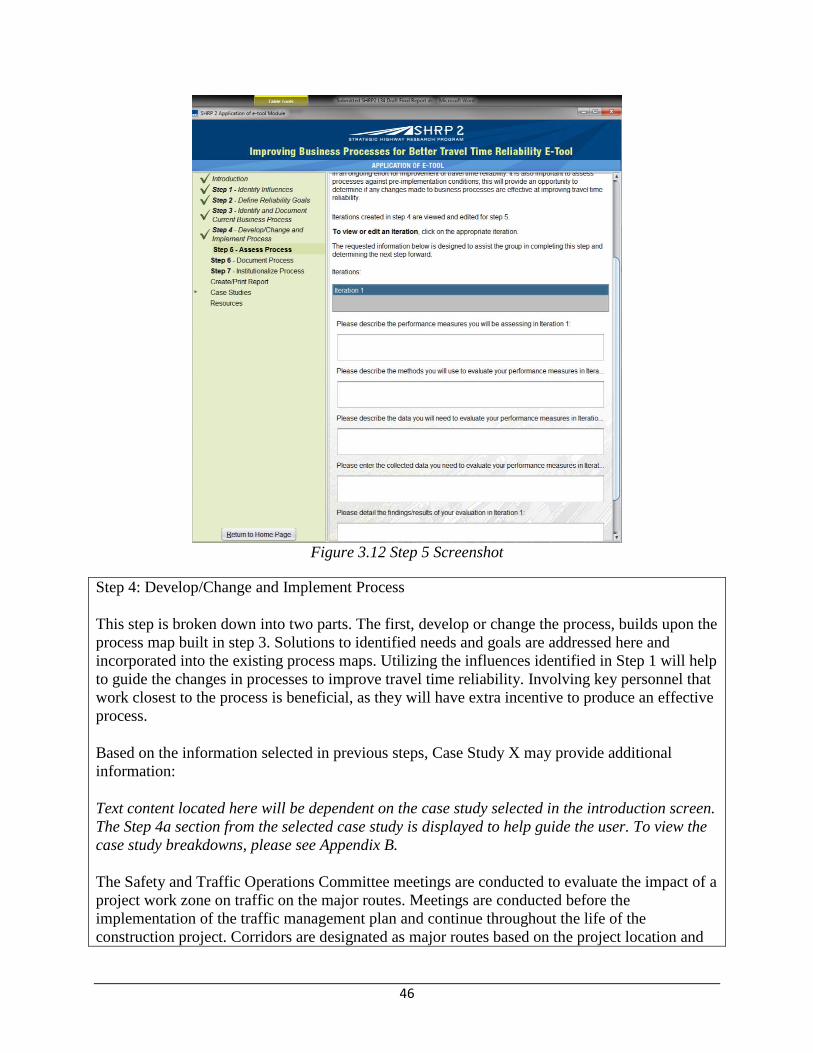
46
Figure 3.12 Step 5 Screenshot
Step 4: Develop/Change and Implement Process
This step is broken down into two parts. The first, develop or change the process, builds upon the
process map built in step 3. Solutions to identified needs and goals are addressed here and
incorporated into the existing process maps. Utilizing the influences identified in Step 1 will help
to guide the changes in processes to improve travel time reliability. Involving key personnel that
work closest to the process is beneficial, as they will have extra incentive to produce an effective
process.
Based on the information selected in previous steps, Case Study X may provide additional
information:
Text content located here will be dependent on the case study selected in the introduction screen.
The Step 4a section from the selected case study is displayed to help guide the user. To view the
case study breakdowns, please see Appendix B.
The Safety and Traffic Operations Committee meetings are conducted to evaluate the impact of a
project work zone on traffic on the major routes. Meetings are conducted before the
implementation of the traffic management plan and continue throughout the life of the
construction project. Corridors are designated as major routes based on the project location and

47
the perceived regional impact of the work zone. The meetings are conducted based on key
milestones of the project and when certain issues are identified within or in the vicinity of the
work zone. The milestones include scheduled traffic shifts or changes in the work zone that can
result in major impacts on traffic. The committee also provides the contractor with another
avenue to seek direction and communicate concerns. The contractor is aware of daily
experiences in the work zone and can identify unsafe scenarios within the work zone and when
traffic patterns, such as increased speeds, begin to change. Possible solutions include ramp
closures, added presence of law enforcement, or restrictions in the contractor’s available working
hours. The committee also attempts to minimize the incidents that occur by carefully establishing
the appropriate speed limits within the work zone.
Once the changes to the business process or processes have been identified, the updated or new
process can be implemented. The approach to this implementation will vary based on factors
such as the number of agencies involved and the depth of the process within the agency’s
broader operations strategy. It is important to be sure to involve all stakeholders in the
implementation stage, as buy-in is key to the success of the overall process. Stakeholders may
include a broad range of people, from office managers to workers in the field and their input will
be important to the successful implementation of the identified business process changes needed
to improve travel time reliability.
Based on the information selected in previous steps, Case Study X may provide additional
information:
Text content located here will be dependent on the case study selected in the introduction screen.
The Step 4b section from the selected case study is displayed to help guide the user. To view the
case study breakdowns, please see Appendix B.
Because step 4 may have multiple iterations before it is deemed acceptable to move on, this tool
will allow the storage of information for multiple iterations.
To add an iteration, click the Add button then update the process maps and use the text box at the
bottom of the page to describe how the changes were implemented.
To view or edit an old iteration, click on the appropriate iteration.
When finished, click Next at the bottom of the screen to move on to step 5.
Step 5: Assess Process
Step 5 involves assessing the process. Some level of assessment is important to determine the
effectiveness of that process. Step 5 is the third part of the iterative cycle introduced in step 4.
The results of this assessment are then either fed back into step 4 in order to make additional
changes, or are used in moving forward to the next step of the overall process.

48
Ensuring that a measure of success, a method for continuous evaluation, and data needed to
complete the evaluation is important. These things provide a means to communicate the
effectiveness of the process with senior managers and vital staff. By measuring the effectiveness
of the process, opportunities are available to periodically evaluate performance in an ongoing
effort for improvement of travel time reliability. It is also important to assess processes against
pre-implementation conditions; this will provide an opportunity to determine if any changes
made to business processes are effective at improving travel time reliability.
Based on the information selected in previous steps, Case X may provide additional information:
Text content located here will be dependent on the case study selected in the introduction screen.
The Step 5 section from the selected case study is displayed to help guide the user. To view the
case study breakdowns, please see Appendix B.
Similar to step 4, iterations of step 5 are created.
To add an iteration, click the Add button then fill in the text boxes.
To view or edit an old iteration, click on the appropriate iteration.
The requested information below is designed to assist the group in completing this step and
determining the next step forward.
The page for step 6 allows the user to upload any documentation associated with the new or
changed processes. The page includes guidance on types of documentation that might be useful
to capture, as well as a location to store it within the e-tool. Figure 3.13 contains a screenshot of
the page for step 6, followed by the content as contained in the e-tool.
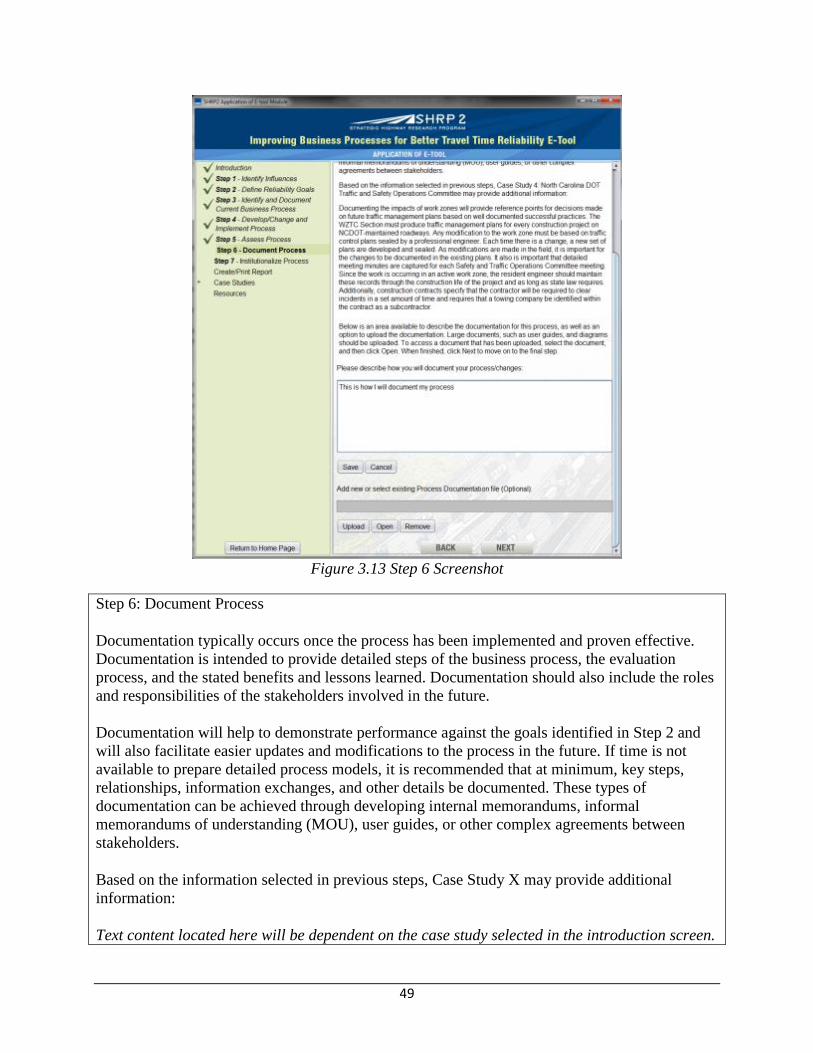
49
Figure 3.13 Step 6 Screenshot
Step 6: Document Process
Documentation typically occurs once the process has been implemented and proven effective.
Documentation is intended to provide detailed steps of the business process, the evaluation
process, and the stated benefits and lessons learned. Documentation should also include the roles
and responsibilities of the stakeholders involved in the future.
Documentation will help to demonstrate performance against the goals identified in Step 2 and
will also facilitate easier updates and modifications to the process in the future. If time is not
available to prepare detailed process models, it is recommended that at minimum, key steps,
relationships, information exchanges, and other details be documented. These types of
documentation can be achieved through developing internal memorandums, informal
memorandums of understanding (MOU), user guides, or other complex agreements between
stakeholders.
Based on the information selected in previous steps, Case Study X may provide additional
information:
Text content located here will be dependent on the case study selected in the introduction screen.
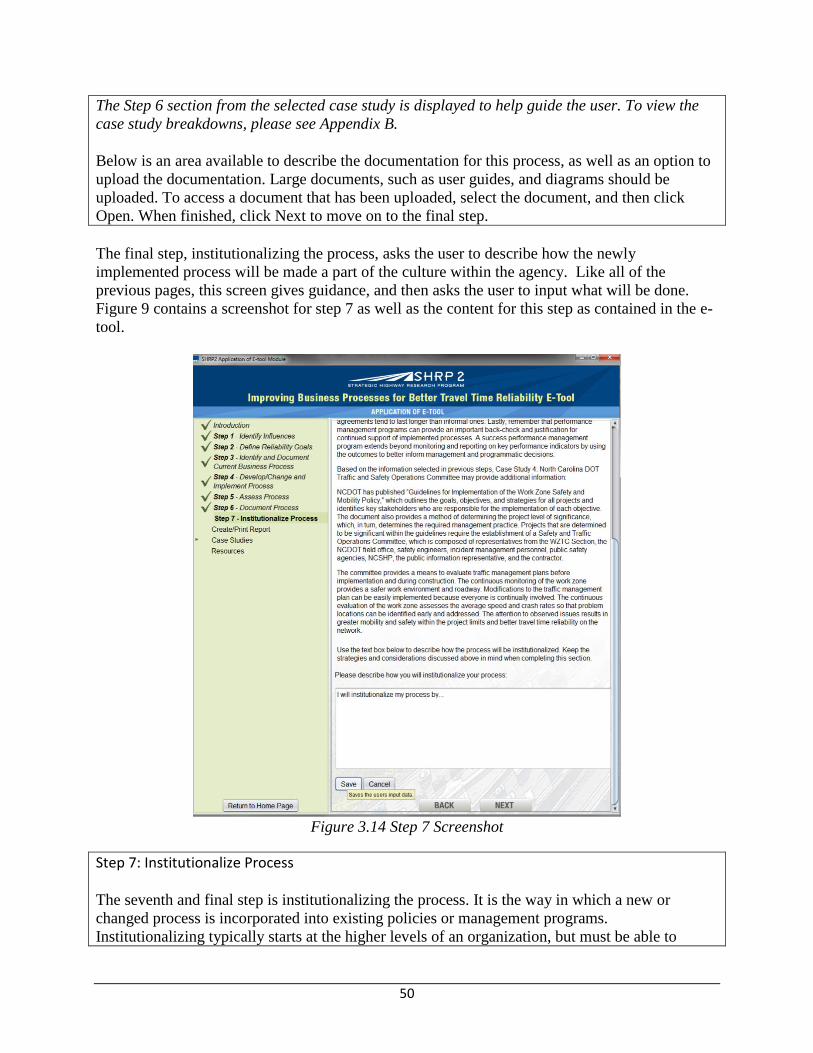
50
The Step 6 section from the selected case study is displayed to help guide the user. To view the
case study breakdowns, please see Appendix B.
Below is an area available to describe the documentation for this process, as well as an option to
upload the documentation. Large documents, such as user guides, and diagrams should be
uploaded. To access a document that has been uploaded, select the document, and then click
Open. When finished, click Next to move on to the final step.
The final step, institutionalizing the process, asks the user to describe how the newly
implemented process will be made a part of the culture within the agency. Like all of the
previous pages, this screen gives guidance, and then asks the user to input what will be done.
Figure 9 contains a screenshot for step 7 as well as the content for this step as contained in the e-
tool.
Figure 3.14 Step 7 Screenshot
Step 7: Institutionalize Process
The seventh and final step is institutionalizing the process. It is the way in which a new or
changed process is incorporated into existing policies or management programs.
Institutionalizing typically starts at the higher levels of an organization, but must be able to
51
survive changes in management and personnel. The most successful business processes rely on
linking the process to firmly established agency goals, objectives, or mission-critical activities.
There are four main strategies and considerations to keep in mind when institutionalizing
processes. The first item to keep in mind is the importance of buy-in and ongoing support for the
process. If the stakeholders do not support and encourage the use of identified business
processes, it may not remain a viable process. The second strategy that will greatly assist in
institutionalizing business processes is developing formal documentation that is accessible and
available to all stakeholders. This formal documentation and accessibility of the documentation
will help institutionalize implemented processes to improve travel time reliability.
The third consideration is focusing on the sustainability of the documentation. Formal
agreements tend to last longer than informal ones. Lastly, remember that performance
management programs can provide an important back-check and justification for continued
support of implemented processes. A success performance management program extends beyond
monitoring and reporting on key performance indicators by using the outcomes to better inform
management and programmatic decisions.
Based on the information selected in previous steps, Case Study X may provide additional
information:
Text content located here will be dependent on the case study selected in the introduction screen.
The Step 7 section from the selected case study is displayed to help guide the user. To view the
case study breakdowns, please see Appendix B.
Use the text box below to describe how the process will be institutionalized. Keep the strategies
and considerations discussed above in mind when completing this section.
52
CHAPTER 4 Pilot Testing The researchers completed two pilot tests of the e-tool to test the applicability and ease of use.
The research team selected these two pilot test locations from a list of seven potential sites. These
seven potential sites were evaluated using eight criteria to identify the most beneficial locations.
Those criteria were:
Source of Congestion – Did the location/application for the pilot tests include an
application that addresses one of the seven sources of nonrecurring congestion?
Geographic Representation – Was the geographic location and size representative of a
typical region?
Interagency Coordination – Did the local/regional agencies work together and/or meet on
a regular basis towards a common goal (e.g., improved work zone management)? – Pilot
testing the e-tool in a location where agencies already work together was thought to likely
yield a richer testing environment.
Use of Reliability Measures – Did the local/regional agencies currently use travel time
reliability performance measures or did they want to incorporate travel time reliability
performance measures? – Locations/agencies that are already using or have taken the first
step towards the use of travel time reliability performance measures could potentially
benefit from use of the e-tool.
Business Processes – Did the local/regional agencies currently have business processes in
place to reduce nonrecurring congestion/improve travel time reliability? – Pilot testing
the e-tool in a location where agencies have already begun to develop business processes
to reduce nonrecurring congestion were thought to provide an environment in which the
business process assessment/change steps could be tested.
Benefit – Did the local/regional agencies have an existing process they are looking to
improve that could benefit from the application of the e-tool? – Applying the e-tool in a
location that could directly benefit from its use could demonstrate the true benefits of the
tool, as well as any weaknesses that it may have.
Responsiveness – Did the local/regional agencies have interest/willingness to participate
in the pilot test?
Familiarity – What was the extent of the research team’s familiarity with the candidate
site’s stakeholders and business processes for improving travel time reliability?
The two sites selected were New Hampshire DOT’s Winter Management Program and North
Central Texas Council of Governments’ (NCTCOG) Incident Management Program. The
following two sections detail the actions and outcomes from these two pilot test cases.
New Hampshire DOT: Winter Weather Management
Overview/Background
New Hampshire DOT (NHDOT) is working to reduce nonrecurring congestion through winter
weather management and weather-related incident management activities. Essential program
elements include weather related messaging on dynamic message signs (DMS) and 511 traveler
information, advisory speed messaging, Night Riders that patrol for icy conditions on a 24/7
53
basis during winter months (November to April), road weather information system (RWIS)
stations, freeway service patrol that operates during commuting hours (4 hours during both AM
and PM peak periods), and reporting of roadway conditions by plow truck drivers to the traffic
management center (TMC). The TMC monitors incident timeline activities for lane blocking
crashes (i.e., Categories 3 and 4), but there is a breakdown in reporting incident timeline
activities during the winter months when operations are turned over to the Districts.
NHDOT has a desire to improve business processes in the area of winter weather management
and weather-related incident management and identified the following candidate topics for the
pilot workshop: 1) improve communications between the Districts and the TMC; 2) improve
communications between the TMC, plow truck drivers, and first responders for incidents; 3)
improve incident timeline reporting during the winter months when operations are turned over to
Districts; and 4) improve incident notification time to the public. It was decided that the pilot
case study would focus on mapping current business processes for weather-related incident
management and discussing ways to improve communications between the Districts and the
TMC in order to better prepare the State for meeting Federal Real-Time System Management
Information Program Requirements (Title 23 CFR 511). The most applicable case study
documented in the SHRP L01 study is the California and Nevada: I-80 Winter State Line
Closures.
The pilot workshop was held on October 15, 2013 at NHDOT’s offices in Concord, New
Hampshire. Representatives from the following agencies were in attendance: NHDOT
Operations, NHDOT Maintenance, NHDOT District Engineers, TMC Operations, NH State
Police, SHRP 2 L34 TETG Members, SHRP 2/TRB Staff, and FHWA NH Division.
The following section captures the information gathered at the workshop to support the 7-step
process used to identify business processes that affect travel time reliability outlined in SHRP
L34 and SHRP L01.
Step 1: Influences
There is a Needs Based/Opportunity Based (Grassroots) influence at the staff level to improve
current business processes for incident management and winter weather management.
Commissioner staffers are provided with a weekly incident briefing on assistance call-outs that
occurred over the weekend. These include incidents with road closures or road closures due to
downed power lines with debris. The purpose of the briefings is to keep Commissioner staff
informed of DOT/TMC activities.
Step 2: Define the Specific Reliability Goal(s)
The following specific goals for reliability were identified during the pilot workshop:
Reduce incident clearance time. Participants identified the need to monitor and reduce
incident clearance times over time. A base incident clearance time should be established
based on historical conditions and then thresholds should be set based on specific type of
incidents. It was noted that the same process could be done for internal response times.
Improve incident notification time to the public. TMC operators are currently tracking
incident notification times to see if they are meeting the 10 or 20 minute window for
notifying the public (i.e., Title 23 CFR 511 requirements). A news agency website
54
(WMUR.com) pushes traveler information to the public via a mobile app and push alerts,
and the TMC also displays messages on DMS.
Improve incident timeline reporting to the TMC. The TMC is trying to implement
incident severity level reporting, and there has been a good response for crashes on the
Turnpike and major highways. However, crashes on state highways and rural routes are
not reported to the TMC as often, or the TMC is notified as an incident is being cleared.
If there is a major road closure on these routes, the TMC needs to be notified so they can
post a DMS message on adjacent major highways. If there is a minor incident that can be
cleared quickly, these may not need to be reported to the TMC due to the quick clearance
time.
Step 3: Identify and Document Current Business Processes
Two initial business process maps were created based on background information provided to
the SHRP L34 project team prior to the workshop: 1) Winter weather management, which
includes messaging and winter maintenance activities; and 2) Incident management activities for
a weather-related incident. Significant time was spent during the pilot workshop
discussing/mapping current business processes related to winter weather management activities
as established in the NHDOT Winter Maintenance Snow Removal and Ice Control Policy. The
following changes to the business process map were discussed:
State law dictates that the Fire Department is Commander on Scene for all incidents.
This was noted to be added to the map.
Mobile Decision Support Service (MDSS) was added as another source of weather and
road condition information.
The District 2 Engineer is responsible for sending approved messages to the TMC to
forewarn motorists of an upcoming storm. The messages are posted prior to the storm;
after the storm hits, TMC staff and State Police update messages as needed.
If there is an incident on the Interstate, TMC staff enter the information into 511, post
messages on Twitter, and display messages on DMS. Advanced messaging is used to
support brining operations (Brining Ahead messages), provide advanced notice of a
storm, and notify motorists of events during the storm.
Other TMC resources for distributing information include service patrols and portable
message boards. DOT foremen make the decision on where equipment are to be
deployed.
Once it begins to snow, a DOT foreman or maintenance person in the field will monitor
the snow event and decide when and where to deploy equipment. DOT response occurs
after the snow event, and they will start plowing operations when there is a plowable
amount of snow on the road.
NH State Police identifies reduced road conditions and notifies State Police dispatch,
who determines if DOT assistance is needed. State Police Dispatch notifies the TMC,
and TMC staff notify either the District office (if the event occurs during normal business
hours) or Night Riders (if it occurs during the night). Dispatch will notify the District
Office even if it is a minor event where DOT assistance isn’t requested. If there is any
event that impedes traffic, State Police notify the DOT, and the District Office determines
which staff to notify at the District level. NH District assets are then deployed to address
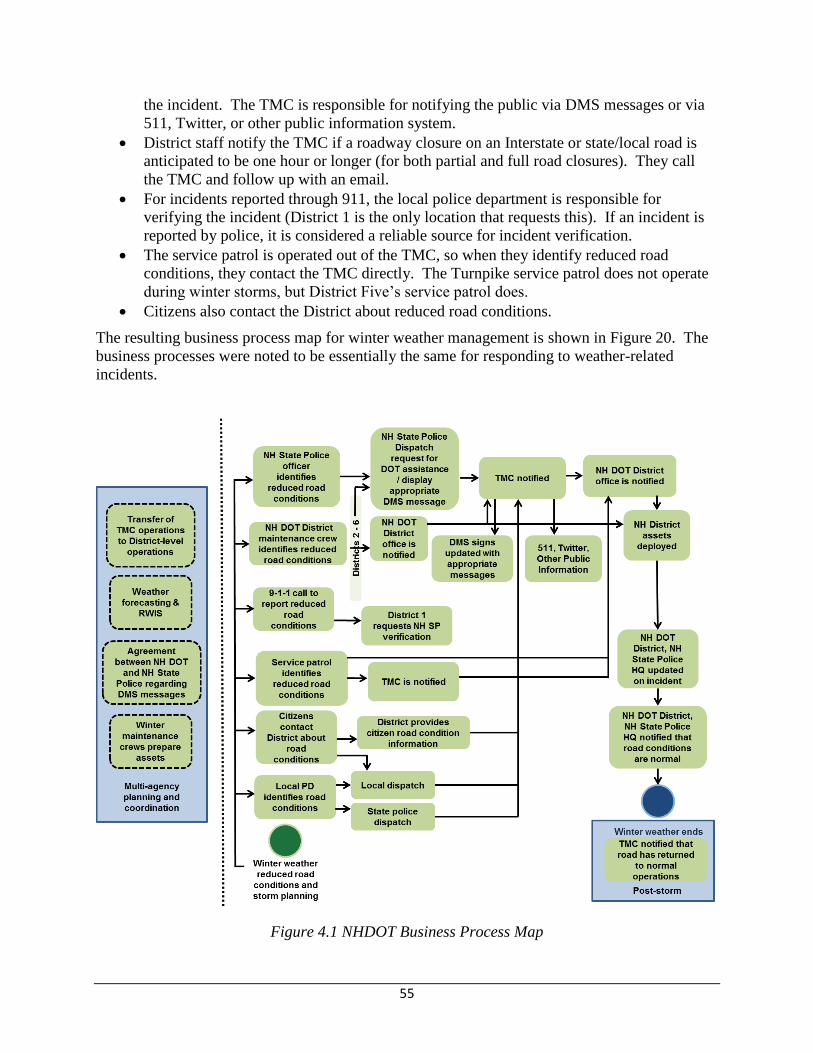
55
the incident. The TMC is responsible for notifying the public via DMS messages or via
511, Twitter, or other public information system.
District staff notify the TMC if a roadway closure on an Interstate or state/local road is
anticipated to be one hour or longer (for both partial and full road closures). They call
the TMC and follow up with an email.
For incidents reported through 911, the local police department is responsible for
verifying the incident (District 1 is the only location that requests this). If an incident is
reported by police, it is considered a reliable source for incident verification.
The service patrol is operated out of the TMC, so when they identify reduced road
conditions, they contact the TMC directly. The Turnpike service patrol does not operate
during winter storms, but District Five’s service patrol does.
Citizens also contact the District about reduced road conditions.
The resulting business process map for winter weather management is shown in Figure 20. The
business processes were noted to be essentially the same for responding to weather-related
incidents.
Figure 4.1 NHDOT Business Process Map

56
Step 4a: Develop/Change Process
Pilot workshop participants identified the following potential business process changes as a
result of the mapping exercise:
Improve communication between first responders and the TMC. State Police, County
Sheriff’s Offices, and local police departments all notify the TMC of incidents; however,
there is often a breakdown in communication with smaller, local agencies. For example,
there was a major incident that occurred recently, and the TMC was not notified until the
incident was being cleaned up. In other cases, a road may be closed for several hours, but
the TMC is never notified. There is a need to improve relationships with these smaller
agencies and encourage them to include TMC notification as part of their standard
protocol.
Better define the data points needed for the incident timeline and communicate these
requirements to Districts. The incident timeline includes the time State Police are
notified (notification time) and the time the lane is cleared (clearance time). The timeline
also includes timestamps for full roadway closures and partial closures. The beginning
point of the incident timeline is vague (e.g., time foreman was notified, TMC notified,
etc.). The time at which the lane is re-opened is also vague (i.e., the lane might re-open
before first responders have left the scene).
Identify winter weather hotspots. It may be useful to generate a list of hotspots in each
District that have the most problems during winter months (e.g., hazardous conditions
exist due to roadway grades, elevated roadways, or the way the wind hits a particular
roadway). District staff reported that they know where the problem spots are (e.g., High
School Hill, 11A, Temple Mountain) and have been responding effectively. However, a
hotspot list could be useful for identifying where to deploy portable DMS in rural areas.
Examine impact of DOT assistance on incident timelines. It may be useful to review
historical incident timeline data to determine patterns, identify if certain roadways are a
problem, and compare clearance times with and without DOT assistance.
Improve CCTV use during nighttime hours. TMC staff reported that they use CCTV
camera feeds to monitor conditions, but it is difficult to use them at night. The TMC
should consider switching the cameras from black/white mode to color to improve
visibility at night. The need to push camera feeds to District offices should also be
considered.
Improve communications between the TMC and District maintenance personnel. It could
be useful to push information on brining operations and District maintenance activities to
the TMC. Activation of DOT maintenance crews is typically done without notice. It
would be helpful for the TMC to be able to post information on brining operations or
activation of a DOT crew in order to reduce the number of incoming phone calls from the
public. It would also be helpful for TMC staff to know what crews are out there.
Currently, the TMC monitors radio chatter or receive a message from the District office
when they open in the morning. There is a need for development of a policy on event
notifications to improve current operations (e.g., require notification for certain types of
events such as hazardous roads or maintenance crews in the field). For example, Outlook

57
could be used as a paging system to notify the DOT Foreman, and the Outlook message
could be pushed out to their cell phones.
Improve incident timeline reporting during winter months. The TMC hands off
operations to Districts during winter months, but there is a breakdown in communication
on specific events that occur during the timeline. There is a need to improve
communications and make the link back to the TMC. The TMC maintains an archive of
incident information. Currently, each District logs their activities into an Access
database, and there are separate databases maintained for each District. Eventually, the
TMC system will serve as the primary log when the Advanced Traffic Management
System (ATMS) system is implemented in 2 years. There is a need for training of
District dispatchers to enter information into the new ATMS system.
Improve consistency in District reporting of event timelines. Currently, each District has
their own internal protocol for responding to an event. During the winter months, the
District notifies the TMC only after the event is complete. There is a need for a policy
that requires all Districts to use the same protocol for event timeline reporting. With that
policy, the Districts could establish a method to best track the information needed for the
event timeline. It was noted that it could be useful to have a workshop with all Districts
to identify best practices and develop a protocol. Pilot workshop participants identified
the following event information that is needed in District logs to improve event timeline
consistency:
o Incident start time
Detection vs. notification
o Who, what, where, why, how (District 3 has developed data fields addressing
who, what, where, why, and how. There is a need to compare these to FHWA’s
eight questions and evaluate the potential for statewide implementation.)
Location – Need intersecting street, address, and mile marker information
to improve incident location consistency. (There is a need to examine
crash timeline data for consistency of location identification and
methodologies for tracking incidents.)
o Verification time
o Response time
DOT
Fire/EMS
Tow
Other
o Clearance time
How defined?
o Other data elements to meet 1201: Time of closure and time of reopening
(construction related closures only), time the information is made available to the
public (e.g., time message posted, tweeted, etc. – these are currently being
captured in the timeline).
Implement standard protocols for responding to incidents. There are temporary staff in
place at each District during the winter time, and it may not be the same staff from year
to year. There is a need for standard protocols for responding to incidents or perhaps a
checklist for operators to walk through (e.g., field person notifies dispatch, dispatch
notifies the DOT supervisor, dispatch notifies police/fire/EMS/TMC, etc.). There are
58
some guidelines in place, but they are not consistent from District to District.
Dispatchers should be a conduit for relaying information. Whether there is a request for
DOT assistance or not will determine the order/priority for notification. A request for
DOT assistance could come during the middle of an incident, so the DOT sometimes
responds whether assistance is required or not.
Implement standard communication protocols. NH has a Distracted Driving Policy, so
staff is not allowed to use cell phones while driving. Therefore, it is often difficult to
reach DOT maintenance staff if they are in their vehicles. There is a need for a policy
that requires all communication to contact maintenance personnel take place via radio
(rather than cell phones). However, development of radio etiquette procedures/policies
would be required to minimize chatter.
Evaluate towing policies/procedures. There may be a need to evaluate current towing
policies and procedures and determine if changes are needed to improve incident
clearance times.
Improve the organization/sharing of documents/MOUs. It may be useful to provide a
central repository for storing documents and MOUs for multiple agencies so that
stakeholders can have access to this information and understand what the policies are.
This repository could improve relationships between stakeholders.
A Memorandum of Understanding (MOU) may be needed between Districts and the TMC to
implement some of these business process changes. It is recommended that this group meet
again in six months to identify additional policy changes that are needed.
Step 4b: Implement Process
This step was not addressed during the pilot workshop, as stakeholders need time to assess and
implement the potential business process changes.
Step 5: Assess Process
There is a need to identify performance measures to assess the success of winter weather
management activities. Pilot workshop participants indicated that there is always room for
improvement in terms of getting information to maintenance staff. They examine DOT activities
in response to specific weather events from the previous year to identify improvements, but
noted that problem areas change, so it is difficult to compare across different storms.
Step 6: Document Process
This step was not addressed during the pilot workshop.
Step 7: Institutionalize Process
This step was not addressed during the pilot workshop.
Pilot Workshop Feedback
In terms of workshop delivery format, encouraging stakeholder input throughout the
presentation of each of the individual steps seemed to generate discussion. There were minimal
comments received regarding the e-toole-tool itself.

59
NHDOT will distribute the business process map and case study report to the pilot workshop
participants. The group will reconvene in April/May and reassess the process based on
operations during the upcoming winter season. The checklist of incident timeline data elements
will be distributed to the group to use as a training ground for this winter so that NHDOT will
be in a position to meet Federal Real-Time System Management Information Program
Requirements (Title 23 CFR 551).
North Central Texas Council of Governments- Incident Management
Overview/Background:
The North Central Texas Council of Governments (NCTCOG) is working to reduce nonrecurring
congestion in the Dallas-Fort Worth region through support of a coordinated, regional Freeway
Incident Management (FIM) program focused on the quick detection and clearance of incidents.
Essential program elements include a Mobility Assistance Patrol (MAP) program and a FIM
training course. The goal of the FIM training course is to initiate a common, coordinated
response to traffic incidents that will build partnerships, enhance safety for emergency personnel,
reduce upstream traffic accidents, improve the efficiency of the transportation system, and
improve air quality in the Dallas-Fort Worth region.
Due to the multi-jurisdictional nature of the Dallas-Fort Worth metroplex, each jurisdiction is
responsible for TIM in their region. As such, there is not a regional FIM group that meets on a
regular basis. However, there is interagency coordination between NCTCOG, City of Dallas
Police Department, Dallas County Sheriff’s Office (DSO), Texas Department of Transportation
(TxDOT) Dallas District, and the Dallas County Towing Consortium to respond to and clear
incidents quickly. The City of Dallas has a partnership with DSO to assume responsibility for
traffic incident management and enforcement on freeways in southern Dallas County. This
allows Dallas PD to reallocate resources to focus more intently on neighborhoods, while the
Sheriff’s Office can provide a targeted regional response on the highways. There is a formal
interlocal agreement in place between these two agencies, and they meet via conference call on a
monthly basis to refine FIM processes and discuss operations.
NCTCOG has a desire to improve business processes in the area of incident management and
identified the following candidate topics for the pilot workshop: 1) institutionalizing their
performance measurement process; 2) establishing a regional TIM group to meet on a regular
basis; 3) identifying a sustainable funding source that would allow them to expand service for
their Mobility Assistance Patrol (MAP) Program; 4) improving incident identification, response,
traffic management, and clean-up; and 5) improved communication between police and tow
truck companies. It was decided that the pilot case study would focus on improving business
processes in the area of incident response, and that the scope of the pilot would be limited to the
City of Dallas/Dallas County partnership. The most applicable case study is the Washington
State DOT Joint Operations Policy Statement.
The pilot workshop was held on October 9, 2013 at NCTCOG’s offices in Arlington, Texas.
Representatives from the following agencies were in attendance: TxDOT Dallas District, Dallas
County Sheriff’s Office, City of Dallas PD, City of Dallas Fire/EMS, SHRP2/TRB Staff, and
NCTCOG.
The following section captures the information gathered at the workshop to support the 7-step
60
process used to identify business processes that affect travel time reliability outlined in SHRP
L34 and SHRP L01.
Step 1: Influences
Current business processes were influenced by a Big Directive (Top Down) to be more
responsive to incident management and clearance; however, there was also a Needs
Based/Opportunity Based (Grassroots) influence at the staff level to improve incident
management and response. The current interlocal agreement between Dallas PD and DSO was
implemented because police officers saw that things weren’t working well and decided to
implement the change. When DSO assumed responsibility for traffic management on the
freeways within the City of Dallas’ jurisdiction, they continued this approach but implemented
different business processes for responding to incidents.
Air quality issues, which may be classified as a top-down influence, are another influence on the
towing component of the region’s FIM program, since Dallas is considered a non-attainment
area.
In addition, there are policy level influences that restrict the processes that can be used for
incident clearance. The City of Dallas uses a rotation policy with private vendors, while the
DSO has an agreement with the Dallas County Towing Consortium. It becomes a problem when
DSO responds to an incident within the City of Dallas, since the private vendors feel they are
being cut off from a segment of business.
Step 2: Define the Specific Reliability Goal(s)
Specific goals for reliability are included in the region’s Long Range Transportation Plan
(LRTP) and Congestion Management Process (CMP). The following reliability goals were
identified during the pilot workshop:
Reduce delay due to commercial vehicle crashes. Commercial vehicle crashes cause
significant delays and are really becoming an issue. Several downtown area Interstates
are also designated as hazardous material routes, which adds additional travel delays and
response burden when there is an incident.
Improve incident response capabilities/reduce response times. Heavy duty wrecker
response times are slow, especially when they get caught upstream of the crash site in the
backup. There is also a need to improve routing for police officers responding to a crash
location. DSO typically dispatches multiple squads to respond to a crash, and they access
the freeway from different entrance ramps so they don’t overshoot the crash location.
Goals in this area include increasing responder access to CCTV video feeds, improving
sharing of resources between the City and County, and improving the efficiency of
response to the scene.
Step 3: Identify and Document Current Business Processes
Current business processes in the area of incident identification and response were mapped for a
Category 5 incident with a 60 minute maximum duration of lane blockage as shown in Figure 21:
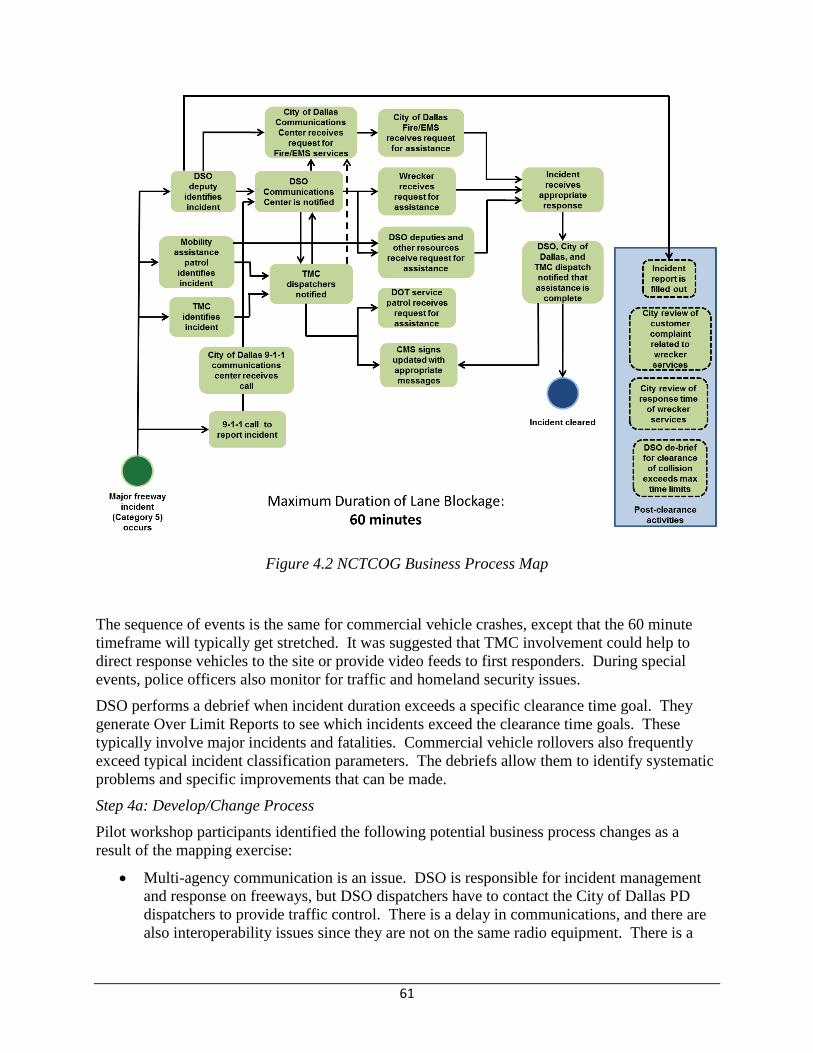
61
Figure 4.2 NCTCOG Business Process Map
The sequence of events is the same for commercial vehicle crashes, except that the 60 minute
timeframe will typically get stretched. It was suggested that TMC involvement could help to
direct response vehicles to the site or provide video feeds to first responders. During special
events, police officers also monitor for traffic and homeland security issues.
DSO performs a debrief when incident duration exceeds a specific clearance time goal. They
generate Over Limit Reports to see which incidents exceed the clearance time goals. These
typically involve major incidents and fatalities. Commercial vehicle rollovers also frequently
exceed typical incident classification parameters. The debriefs allow them to identify systematic
problems and specific improvements that can be made.
Step 4a: Develop/Change Process
Pilot workshop participants identified the following potential business process changes as a
result of the mapping exercise:
Multi-agency communication is an issue. DSO is responsible for incident management
and response on freeways, but DSO dispatchers have to contact the City of Dallas PD
dispatchers to provide traffic control. There is a delay in communications, and there are
also interoperability issues since they are not on the same radio equipment. There is a
62
project in place to resolve this issue, but it will not be implemented for several years.
This issue will eventually resolve itself; however, in the meantime, there is a need for
improved business processes.
Resolve institutional issues and improve business processes for towing. There is a need
to examine other agency best practice examples to improve processes in this area.
Improve routing of response vehicles to incident location. TMC resources could be used
to provide more efficient routing to the crash location. For example, police cars have in-
vehicle laptops that could be used to pull up snapshots of current traffic conditions.
Dispatchers could also get access to the data and provide assistance with routing. There
may be a need for a central dispatch to feed routing information to Fire/EMS, Police, and
other responders. There would be a need to engage legal staff in this discussion.
Improve efficiency within the individual components of the incident timeline. The 60
minute timeline could be broken out to identify gaps in the individual components of the
timeline (e.g., response time for emergency responders, response time for wreckers,
incident clearance time, etc.) and improvements needed to close the gaps.
Improve the efficiency of tow truck response. E-books are going to be implemented
within DSO. Their use could be expanded to allow officers to email crash pictures to
wreckers so they could be better prepared for the response.
Implement use of towing and vehicle storage software. The region has discussed
privatizing vehicle impound lots and implementing a towing and vehicle storage software
solution. There is a need to investigate the technical and institutional challenges
associated with the software and how its implementation could be expedited.
Increase customer feedback for the Mobility Assistance Patrol (MAP) Program. The
program includes customer feedback postcards that customers mail in to TxDOT.
However, they are not receiving as many cards back in recent months, and it is unknown
whether this is due to the cards not being given out or customers not mailing them in. It
would be useful to have a website link for customers to provide feedback.
Improve the organization/sharing of regional FIM documents. There is a need for a
central repository for storing all of the regional FIM documents that could be accessed by
stakeholders via userID/password. For example, NCTCOG’s Freeway Incident
Management training materials captures best practices and feedback from agencies for
improving FIM business processes. Other useful documents include FIM standard
operating procedures, interagency agreements, and TxDOT’s Hazardous Material
Procedures. NCTCOG has a FIM webpage with a list of resources, but it is not password
protected.
Implement a Regional FIM Team to meet on a regular basis. Interagency
communication/coordination could be improved through formation of a regional FIM
team that would meet on a regular basis. However, due to the multi-jurisdictional nature
of the DFW area, it has been a challenge to figure out how best to structure and organize
the team in a way that would be productive. A corridor approach could be feasible, but
the region would have to decide which corridors would be covered and which agencies
would respond to certain types of crashes on these corridors.
Step 4b: Implement Process
This step was not addressed during the pilot workshop, as stakeholders need time to assess and
implement the potential business process changes.

63
Step 5: Assess Process
Workshop participants reported that performance measures have worked well in helping them to
identify FIM improvement areas. Reliability performance measures include the buffer index and
national TIM measures related to incident response/clearance times. TxDOT and the Tollway
Authority have incorporated the performance measures into their control system to track
measures and secondary crashes. In addition, tow truck operators are required to respond to
incidents within a specific time period, and these performance measures are reported to the
County on a regular basis.
Step 6: Document Process
This step was not addressed during the pilot workshop.
Step 7: Institutionalize Process
This step was not addressed during the pilot workshop.
Pilot Workshop Feedback
The following feedback was received from participants:
There is a need for more variation in speed and intonation in the voice-over recording for
the e-tool. Alternative formats such as video clips of a person presenting the material,
news program format, or video clips of case studies (e.g., Florida Road Rangers) could be
incorporated to keep participants more engaged.
It is reasonable to apply the seven step process for improving travel time reliability to
incident management, and the e-tool is helpful for mapping current policies/business
processes and identifying needed improvements.
The orientation module could be useful for engaging individual stakeholders in the
process and introducing them to the general concepts of SHRP L01.
In terms of an agency’s ability to facilitate the group module, NCTCOG participants
reported that facilitating the group through the seven steps would not be difficult;
however, staff would not have known how to weave all of the source documents together
to produce the business process map and timeframe for incident response. It was
estimated that approximately 1-2 weeks of preparation time would be required.
The general concepts are easy to understand. It was suggested that stakeholders could be
walked through the individual module in a group format first, and then they could
reconvene to go through the group module concept.
NCTCOG will distribute the business process map and case study report to the pilot workshop
participants. The group will discuss the results during their next stakeholder conference call and
decide on a course of action. It was noted that the group should reconvene in 6 to 12 months to
discuss and analyze the results of the suggested changes.
64
CHAPTER 5 Conclusions and Recommendations The SHRP 2 L34 project utilized findings from the SHRP 2 L01 study to develop a stand-alone
software tool for transportation personnel to assess their business processes that may affect travel
time reliability. The software can be downloaded to any computer and has been built to be
compatible with any modern system that supports the Java operating system. The software has
been fully documented and this documentation will be provided to TRB upon conclusion of the
project to ensure continuity of the product in the future.
The e-tool was tested in two pilot locations, Dallas, Texas and Concord, New Hampshire, to
assess business processes for Traffic Incident Management Programs as well as Winter Weather
Management. Several key findings came from the two pilot sessions that are described here for
future consideration.
It was noted by the workshop organizers and participants that while the overall process of
business process mapping was not overly complicated, having an outside party review their
current business processes and presenting the stakeholders with an initial business process map
was very useful and helped to focus the participants on the specific business process under
consideration. Both agencies noted that having a third party review their current business
processes was helpful in that the third party, AEM and Cambridge Systematics in this case, did
not review the existing business processes with any bias. Both agencies also noted that having a
third party facilitate a discussion of current business processes and areas for improvement was
useful. It was also noted that the Orientation Module of the tool could be beneficial to help
educate staff on the idea of business process mapping and could be helpful to have stakeholder
group participants review prior to utilizing the Application Module of the e-tool.
Other key findings related to the e-tool include expanding the e-tool to include additional case
studies to help users identify better with a particular management area. In addition, while case
studies were developed for the five management areas, because the L01 research team was
essentially reverse engineering existing management systems, in some cases data were missing
to support the full seven step business process mapping methodology outlined in the L01
research. In the fall of 2013, FHWA kicked off research to pilot test the L01 research in an
additional twelve locations. One approach that could be utilized to expand the case studies
included in the L34 e-tool could be to capitalize on the locations selected for the L01 pilot
locations by FHWA and build new case studies for inclusion in future additions of the L34
software. It is believed that additional case studies will help to improve the user’s understanding
of mapping business processes to improve performance.
It was noted by the pilot location participants that additional enhancements to the e-tool should
include more interactive features to help guide the user through the data entry requirements for
the seven step process. For example, simple questionnaires could be included in the e-tool at
each of the seven steps to help the user zero in on the applicable information to include in each
of the steps. As of now, the e-tool simply contains information directly from the L01 report (as
per contract requirements) without much guidance as to how a user might generate their own
65
input for each of the seven steps. The e-tool currently includes example information from the 10
case studies documented in the L01 research report to help guide the user. More interactive
guidance might improve the information that the user may use to generate their business process
map for a particular management area.
Another potential future enhancement that was noted by the pilot session participants includes
the use of more multimedia enhanced examples to make the e-tool more interesting for a user.
For example, the e-tool has an orientation module that currently contains a voice over slideshow
to walk the reader through the information contained in the L01 report. The pilot session
attendees noted that perhaps including a cut-away to videos depicting a particular management
process (such as incident management scenes or interviews) would help to enhance the learning
experience.
When the e-tool was under development, challenges were noted to using inexpensive or open
source mapping tools within the FHWA website. Ultimately, the e-tool is to reside on the
FHWA website and the website does not currently support Java-based code, which most open
source mapping tools were found to be developed. In addition, the requirements to host any tool
within the FHWA website were not finalized in a manner that aligned well with the tight project
schedule of this project. However, it should be noted that attendees of the pilot sessions noted
that having the e-tool in a web-based format to allow users from multiple stakeholder groups
(fire, police, EMS, county agencies, highway agency personnel in different locations, etc.) who
all contribute to a particular management area to view documents in one location (for example,
Memorandums of Understanding, policy statements, etc.). This approach may allow for agencies
to learn tactics that improve business processes to improve performance. For example, in one
location the sheriff department had in place a policy to allow officers to use their push bumpers
to remove vehicles from the travel roadway, however, in the neighboring city, police officers
were head liability for any damage they may inflict on a vehicle if they used their push bumpers
to move a vehicle from the roadway. If the city officers were able to view the policy in place by
the sheriff’s department, they could potentially request a change in policy in their jurisdiction.
The e-tool is currently formatted to reside on a single computer after being downloaded by the
user making it difficult for stakeholders on different systems to share information within the e-
tool. The expansion of the e-tool into a web-based format that would allow users to login to a
system and store documents in the Cloud might be an enhancement worth consideration in the
future.
Finally, while the TETG members wanted to simplify the mapping process to avoid agencies
becoming confused by the mapping process based on IBM’s business process mapping approach
in the L01 report, one enhancement worth further investigation would be to include a simplified
mapping tool in future editions of the e-tool. At this time, users of the e-tool can simply use any
drawing package and import that drawing into their e-tool application. The effort to build a
mapping tool could be great, however, early searches revealed many open-source software tools
that utilize less cumbersome mapping techniques that could potentially be incorporated into the
e-tool if compatible with future versions of the e-tool.
The SHRP 2 L34 project resulted in a stand-alone software that can be utilized by transportation
professionals to learn more about the concept of business process mapping and a tool that can

66
also be used to help facilitate a stakeholder meeting to map current business process for a
particular management area. The L-34 e-tool is primarily based on the research published in the
SHRP 2 L01research reports but was overall well received by pilot session attendees and several
key recommendations are provided here for consideration by future research sponsors.
67
REFERENCES Integrating Business Processes to Improve Travel Time Reliability. Kimley-Horn and Associates
and PB Consult, SHRP 2 Report S2-L01-RR-1, Transportation Research Board of the National
Academies, Washington, DC, 2011.
Guide to Integrating Business Processes to Improve Travel Time Reliability. Kimley-Horn and
Associates and PB Consult, SHRP 2 Report S2-L01-RR-2, Transportation Research Board of the
National Academies, Washington, DC, 2011.
Transportation for Communities - Advancing Projects through Partnerships (TCAPP)
Conversion Specifications – DRAFT. Federal Highway Administration. August 20, 2012.
68
APPENDIX A Functional Requirements
Introduction
The purpose of this section is to describe the functional requirements of the e-tool.
General Look and Feel
NFR1 The e-tool will conform to the TCAPP Conversion Specification where applicable
if it is web based.
NFR1.1 If the e-tool cannot conform to the TCAPP Conversion Specification, then a
justification will be given for the deviation.
NFR1.2 The Server Platform is a Microsoft Windows Server 2008 R2
NFR1.3 The Database Platform is a Microsoft SQL 2008 R2
NFR1.4 The Application Platform is Java version 2 and .Net version 4
NFR1.5 The Code Repository is Microsoft Team Foundation Server
NFR1.6 The application must be developed using the following technologies
NFR1.6.1 Microsoft .NET Framework v4.0
NFR1.6.2 Microsoft ASP.NET 4.0 or ASP.NET MVC 3.0
NFR1.6.3 Microsoft Entity Framework for database access
NFR1.6.4 Telerik Ultimate Collection Grids Tool Library
NFR1.6.5 Syncfusion Studio Tool library
NFR 1.7 The e-tool must be 508 compliant
NFR 1.8 The e-tool must pass WC3 test
NFR 1.9 The e-tool must use the FHWA Web Site as a basis for its look and feel
General Requirements
2.1 Header
A header must appear on all pages within this e-tool and will span the entire width of 2.1.1
each page.
The following SHRP 2 graphic must be located at top of the header and be centered. 2.1.2
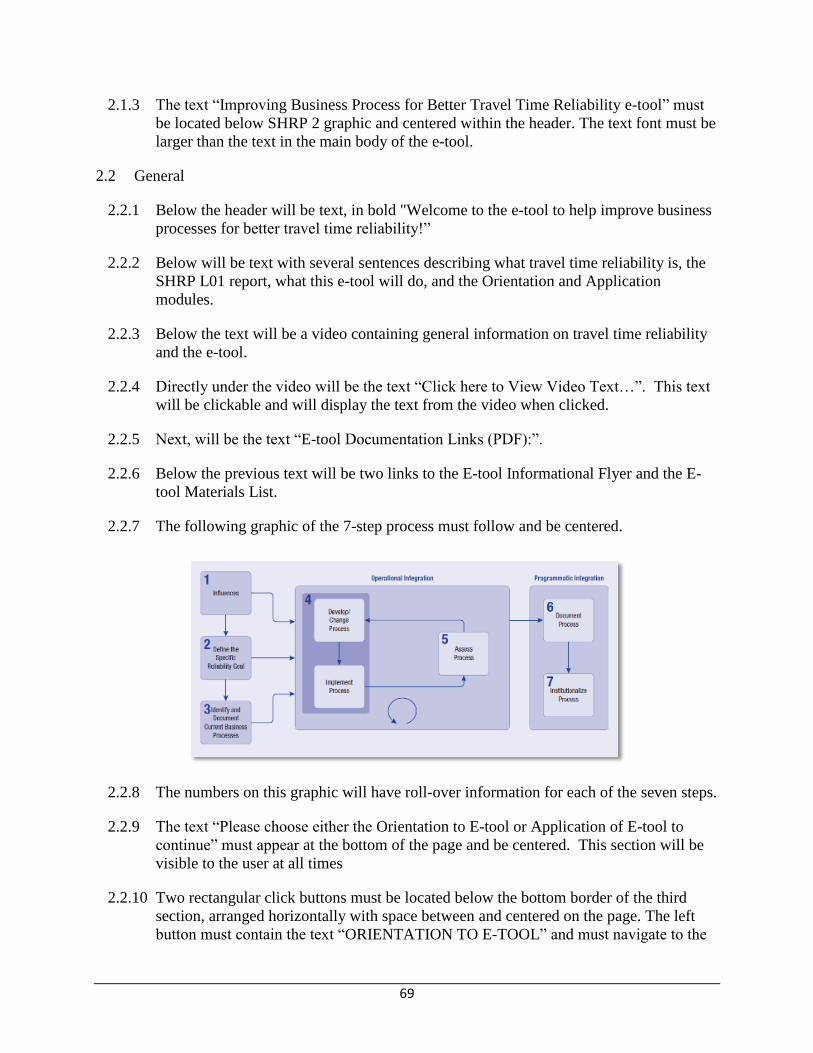
69
The text “Improving Business Process for Better Travel Time Reliability e-tool” must 2.1.3
be located below SHRP 2 graphic and centered within the header. The text font must be
larger than the text in the main body of the e-tool.
2.2 General
Below the header will be text, in bold "Welcome to the e-tool to help improve business 2.2.1
processes for better travel time reliability!”
Below will be text with several sentences describing what travel time reliability is, the 2.2.2
SHRP L01 report, what this e-tool will do, and the Orientation and Application
modules.
Below the text will be a video containing general information on travel time reliability 2.2.3
and the e-tool.
Directly under the video will be the text “Click here to View Video Text…”. This text 2.2.4
will be clickable and will display the text from the video when clicked.
Next, will be the text “E-tool Documentation Links (PDF):”. 2.2.5
Below the previous text will be two links to the E-tool Informational Flyer and the E-2.2.6
tool Materials List.
The following graphic of the 7-step process must follow and be centered. 2.2.7
The numbers on this graphic will have roll-over information for each of the seven steps. 2.2.8
The text “Please choose either the Orientation to E-tool or Application of E-tool to 2.2.9
continue” must appear at the bottom of the page and be centered. This section will be
visible to the user at all times
Two rectangular click buttons must be located below the bottom border of the third 2.2.10
section, arranged horizontally with space between and centered on the page. The left
button must contain the text “ORIENTATION TO E-TOOL” and must navigate to the
70
first page of the Orientation Module portion of the e-tool. The right button must contain
the text “APPLICATION OF E-TOOL” and must navigate to the first page of the
Application Module portion of the e-tool.
At the bottom of the page, the text “For feedback on the tool, the processes presented or 2.2.11
to give us a success story, please email us at SHRP [email protected]”
Orientation Module
3.1 Overall
The text “Orientation to E-tool” must appear below the header and be centered for all 3.1.1
pages related to the individual training module.
A navigation bar must be on left side of the page that spans to the right horizontally 3.1.2
approximately ¼ the page width for all pages related to the Orientation Module. The
navigation bar should be colored or have some contrast to the main content. Within the
navigation bar the following text must be aligned left in order ascending vertically:
“Introduction” should be in bold
“Step 1 – Identify Influences”
“Step 2 – Define Reliability Goals”
“Recall Quiz 1”
“Step 3 – Identify and Document Current Business Process”
“Step 4 – Develop/Change and Implement Process”
“Step 5 – Assess Process”
“Recall Quiz 2”
“Step 6 – Document Process”
“Step 7 – Institutionalize Process”
“Recall Quiz 3”
“Case Studies”
“Resources”
A checkmark must appear to the left of each of the navigation bar items that the user 3.1.3
has completed. The checkmarks from previously completed pages will remain on the
navigation bar to the left of each of the lines of text. The checkmarks must not appear
next to “Case Studies” or “Resources”.
The text of the navigation items completed must turn to italics and remain during each 3.1.4
subsequent page visited.
The text of the navigation item describing the page the user is currently viewing will 3.1.5
have bold text.
Font type will be Times New Roman for all text. 3.1.6
Font size will be sufficiently large to comply with 508 Standards 3.1.7
71
The bottom of the navigation bar will include a button containing the text “Return to 3.1.8
Home Page” and will return the user to the home page when clicked.
3.2 Introduction
A section with border on four (4) sides must be located to the right of the navigation 3.2.1
bar. The section must span horizontally from navigation bar to right far side of page.
A scroll bar will be located on the right side of the content box. Only the information 3.2.2
within the box will scroll.
Text will be inside the content box and will include the introduction to the orientation 3.2.3
module and the objectives of orientation module. This text will be left justified within
the section.
One rectangular click button must be located at the bottom of the content box, centered 3.2.4
on the page. The button must contain the text “Next ” and navigate to the next page.
3.3 Step 1 – Identify Influences
Text describing Step 1 must be in the content box at the top and be left justified. 3.3.1
Following the text, a training video file that plays when clicked will be displayed and 3.3.2
be centered in the section.
Following the video in the content box, clickable text reading “Click here to view video 3.3.3
text” will be shown. When clicked, the text of the dialogue in the training video will be
displayed and be left-justified.
Two rectangular click buttons must be located at the bottom of the section, arranged 3.3.4
horizontally with space between and centered on the page. The left button must contain
the text “Back” and must navigate to the previous page. The right button must contain
the text “Next” and navigate to the next page.
3.4 Step 2 – Define Reliability Goal
Text describing Step 2 must be in the section at top and left justified. 3.4.1
Following the text must be a training video file that is clickable and be centered in the 3.4.2
section.
Following the video in the content box, clickable text reading “Click here to view video 3.4.3
text” will be shown. When clicked, the text of the dialogue in the training video will be
displayed and be left-justified.
Two rectangular click buttons must be located at the bottom of the section, arranged 3.4.4
horizontally with space between and centered on the page. The left button must contain

72
the text “< Back” and must navigate to the previous page. The right button must contain
the text “Next >” and must navigate to the next page.
3.5 Recall Quiz 1
At the top of the content box, the text “Select the most appropriate answer for each 3.5.1
question, then click Submit Answers” must appear and be left justified.
On the next line, “Question 1” must be in bold, left justified. 3.5.2
On the following lines, text answers must follow vertically, one on each line, and be 3.5.3
indented.
Radio buttons must be located to the left of each text answer. 3.5.4
Requirements 5.5.4-5.5.6 will be repeated for additional questions labeled “Question 3.5.5
2”, “Question 3”, etc.
One rectangular click button must be located at bottom of the content box and be right 3.5.6
justified with the text “Submit Answers” centered within the box. The user’s responses
will be saved when the button is clicked. The users’ responses will be checked for
accuracy and where they have an incorrect answer, the correct answer will be
presented.
Two rectangular click buttons must be located at the bottom of the section, arranged 3.5.7
horizontally with space between and centered on the page. The left button must contain
the text “Back” and must navigate to the previous page. The right button must contain
the text “Next” and must navigate to the next page.
3.6 Step 3 – Identify and Document Current Business Process
At the top of the content box, the text describing Step 3 must be left justified. 3.6.1
Following the text must be a training video file that is clickable and be centered in the 3.6.2
section.
Following the video in the content box, clickable text reading “Click here to view video 3.6.3
text” will be shown. When clicked, the text of the dialogue in the training video will be
displayed and be left-justified.
Two rectangular click buttons must be located at the bottom of the content box, 3.6.4
arranged horizontally with space between and centered on the page. The left button
must contain the text “Back” and must navigate to the previous page. The right button
must contain the text “Next” and navigate to the next page.
3.7 Step 4 – Develop/Change and Implement Process
At the top of the content box, text describing Step 4 must be left justified. 3.7.1
73
Following the text, a training video file that is clickable must be displayed and be 3.7.2
centered in the section.
Following the video in the content box, clickable text reading “Click here to view video 3.7.3
text” will be shown. When clicked, the text of the dialogue in the training video will be
displayed and be left-justified.
Two rectangular click buttons must be located at the bottom of the section, arranged 3.7.4
horizontally with space between and centered on the page. The left button must contain
the text “Back” and must navigate to the previous page. The right button must contain
the text “Next” and must navigate to the next page.
3.8 Step 5 – Assess Process
At the top of the content box, the text describing Step 5 must be left justified. 3.8.1
Following the text, a training video file that is clickable must be displayed and be 3.8.2
centered in the section.
Following the video in the content box, clickable text reading “Click here to view video 3.8.3
text” will be shown. When clicked, the text of the dialogue in the training video will be
displayed and be left-justified.
Two rectangular click buttons must be located at the bottom of the section bottom 3.8.4
border, arranged horizontally with space between and centered on the page. The left
button must contain the text “Back” and must navigate to the previous page. The right
button must contain the text “Next” and navigate to the next page.
3.9 Recall Quiz 2
At the top of the section box, the text “Select the most appropriate answer for each 3.9.1
question, then click Submit Answers” must appear and be left justified.
On the next line, “Question 1” must be in bold, left justified. 3.9.2
On the following lines, text answers must follow vertically, one on each line, and be 3.9.3
indented.
Radio buttons must be located to left of each text answer. 3.9.4
Requirements 5.9.2-5.9.4 will be repeated for additional questions labeled “Question 3.9.5
2”, “Question 3”, etc.
One rectangular click button must be located at bottom of the content box and be right 3.9.6
justified with “Submit Answers” centered within the box. The user’s responses will be
saved when the button is clicked. The users’ responses will be checked for accuracy
and where they have an incorrect answer, the correct answer will be presented.

74
Two rectangular click buttons must be located at the bottom of the section, arranged 3.9.7
horizontally with space between and centered on the page. The left button must contain
the text “Back” and must navigate to the previous page. The right button must contain
the text “Next” and navigate to the next page.
3.10 Step 6 – Document Process
The top of the section box will have text describing Step 6 and will be left justified. 3.10.1
Following the text, a training video file that plays when clicked will be displayed and 3.10.2
be centered in the section.
Following the video in the content box, clickable text reading “Click here to view video 3.10.3
text” will be shown. When clicked, the text of the dialogue in the training video will be
displayed and be left-justified.
Two rectangular click buttons must be located at the bottom of the section bottom 3.10.4
border, arranged horizontally with space between and centered on the page. The left
button must contain the text “Back” and must navigate to the previous page. The right
button must contain the text “Next” and navigate to the next page.
3.11 Step 7 – Institutionalize Process
The top of the content box will have text describing Step 7 and will be left justified. 3.11.1
Following the text, a training video file that plays when clicked will be displayed and 3.11.2
be centered in the section.
Following the video in the content box, clickable text reading “Click here to view video 3.11.3
text” will be shown. When clicked, the text of the dialogue in the training video will be
displayed and be left-justified.
Two rectangular click buttons must be located at the bottom of the section, arranged 3.11.4
horizontally with space between and centered on the page. The left button must contain
the text “Back” and must navigate to the previous page. The right button must contain
the text “Next” and navigate to the next page.
3.12 Recall Quiz 3
At the top of the content box, the text “Select the most appropriate answer for each 3.12.1
question, then click Submit Answers” must appear and be left justified.
On the next line, “Question 1” must be in bold, left justified. 3.12.2
On the following lines, text answers must follow vertically, one on each line, and be 3.12.3
indented.
Radio buttons must be located to left of each text answer. 3.12.4
75
Requirements 5.12.2-5.12.4 will be repeated for additional questions labeled “Question 3.12.5
2”, “Question 3”, etc.
One rectangular click button must be located at bottom of section right justified with 3.12.6
“Submit Answers” centered within the box. User’s responses will be saved when the
button is clicked. The users’ responses will be checked for accuracy and where they
have an incorrect answer, the correct answer will be presented.
Two rectangular click buttons must be located at the bottom of the section, arranged 3.12.7
horizontally with space between and centered on the page. The left button must contain
the text “Back” and must navigate to the previous page. The right button must contain
the text “Next” and navigate to the next page.
3.13 Case Studies
At the top of the content box, the text “Please select a case study from the left panel to 3.13.1
view its content:” will be left justified.
Below the text will be a table containing basic information regarding each case study. 3.13.2
“Case Study 1: Washington State DOT Joint Operations Policy Statement and Instant 3.13.3
Tow Dispatch Program”
“Case Study 2: Florida Road Rangers”
“Case Study 3: United Kingdom Active Traffic Management”
“Case Study 4: North Carolina DOT Traffic and Safety Operations Committee”
“Case Study 5: Michigan DOT Work Zone Traffic Control Modeling”
“Case Study 6: Kansas Speedway Special-Event Traffic Management”
“Case Study 7: The Palace of Auburn Hills, Special-Event Traffic Management
(Michigan)”
“Case Study 8: I-80 Winter State Line Closures (California and Nevada State Line)”
“Case Study 9: AZTech Regional Archived Data Server (Arizona)”
“Case Study 10: San Pablo Avenue Signal Retiming (California)”
At the top of each individual case study page will be the title of the case study, left 3.13.4
justified and bold.
Text containing information on the 7 steps of that case study will follow. 3.13.5
Two rectangular click buttons must be located below the last section’s bottom border, 3.13.6
arranged horizontally with space between and centered on the page. The left button
must contain the text “Back” and must navigate to the previous page. The right button
must contain the text “Next” and navigate to the next page.
3.14 Resources
76
In the content section, the text “Below are links to resources that you may find helpful” 3.14.1
must be at the top of the section and be left-justified. One blank line must follow.
On the line following the blank line, the text “Integrating Business Process to Improve 3.14.2
Travel Time Reliability Report: S2-L01-RR-1”will be left-justified.
Below the text, a hyperlink with the text “http://onlinepubs.trb.org/onlinepubs/SHRP 3.14.3
2/SHRP 2_S2-L01-RR-1.pdf” must open the associated file from the internet. One
blank line must follow.
On the line following the blank line, the text “Guide to Integrating Business Processes 3.14.4
to Improve Travel Time Reliability: S2-L01-RR-2” must be left-justified.
Below the text, a hyperlink with the text “http://onlinepubs.trb.org/onlinepubs/SHRP 3.14.5
2/SHRP 2_S2-L01-RR-2.pdf” must open the associated file from the internet.
On the line following the blank line, the text “E-tool Informational Flyer” must be left-3.14.6
justified.
Below the text, a hyperlink with the text “e-tool informational flyer.pdf” must open the 3.14.7
associated file.
On the line following the blank line, the text “E-tool Materials List” must be left-3.14.8
justified.
Below the text, a hyperlink with the text “e-tool Materials List.pdf” must open the 3.14.9
associated file.
On the line following the blank line, the text “Chapter 3.3.2 of Advancing Metropolitan 3.14.10
Planning for Operations” must be left-justified.
Below the text, a hyperlink with the text 3.14.11
“http://www.ops.fhwa.dot.gov/publications/fhwahop10027/chap_3b.htm#s332” must
open the associated file from the internet.
Application module
4.1 Overall
The text “Application of e-tool” must appear below the header and be centered for all 4.1.1
pages related to the application module.
A navigation bar must be on left side of the page that spans to the right horizontally 4.1.2
approximately ¼ the page width for all pages related to the group Application Module.
The navigation bar should be colored or have some contrast to the main content. Within
the navigation bar the following text must be aligned left in order ascending vertically:
“Introduction”
77
“Step 1 – Identify Influences”
“Step 2 – Define Reliability Goals”
“Step 3 – Identify and Document Current Business Process”
“Step 4 – Develop/Change and Implement Process”
“Step 5 – Assess Process”
“Step 6 – Document Process”
“Step 7 – Institutionalize Process”
“Create/Print Report”
“Case Studies”
“Resources”
A checkmark must appear to the left of each of the navigation bar items that the user 4.1.3
has completed. The checkmarks from previously completed pages will remain on the
navigation bar to the left of each of the lines of text.
The text of the navigation items completed must turn to italics and remain during each 4.1.4
subsequent page visited.
The text of the navigation item describing the page the user is currently viewing will 4.1.5
have bold text.
Font type will be Times New Roman for all text. 4.1.6
Font size will be sufficiently large to comply with 508 Standards 4.1.7
4.2 Open an Existing Process or Create New Project
At the top left of the screen, below the header, will be the text “Would you like to:”. 4.2.1
Under the text, centered on the page, there will be a table with two columns. The first 4.2.2
column will show the name of any previously created projects. The second column will
display the date that the corresponding project was created. The user will be able select
a project by clicking on it.
To the left of the table will be the text “Open an Existing Project”. This text will be 4.2.3
bold.
To the right of the table will be a click box with the text “Open”. Clicking this box will 4.2.4
open the existing project for the user and direct them to the last page they accessed
when the project was previously open.
Below the “Open” button will be a button with the text “Remove”. Clicking this button 4.2.5
will delete the selected project from the project list.
Below the table, aligned with the text “Open an Existing Document” will be the text 4.2.6
“Create a New Project”. This text will be bold.
78
To the right of “Create a New Project”, the text “Project Name:” will be displayed. 4.2.7
To the right of the text “Project Name:” will be a blank text box for the user to type a 4.2.8
name.
To the right of the text box will be a click button with the text “Create”. Clicking this 4.2.9
button will create a new project and direct the user to the Introduction Page of the
Application Module.
4.3 Introduction
A section with border on four (4) sides must be located right of navigation bar. The 4.3.1
section must span horizontally from navigation bar to right far side of page.
Text will be inside the section and will include the introduction to the Application 4.3.2
Module and the objectives of the Application Module. This text will be left justified
within the section.
After all previous text must be the text “Which type of process will you be assessing?”. 4.3.3
The next line will contain a drop down menu that allows users to make a selection. The 4.3.4
visible text of the drop down menu is “Choose One”. The options for the user to choose
are:
Incident Management
Work Zone Management
Special-Event Management
Weather Management
Multiagency Operations
Below the drop down must be text “Choose a case study that best matches the process 4.3.5
you are evaluating”
A drop down menu will follow below the text that allows users to make a selection. The 4.3.6
visible text of the drop down menu is “Choose One”. The options contained in this box
are dependent on the selection made in the previous box (requirement 6.6.5). The
correlations are as follows:
Incident Management:
-Washington: WSDOT Joint Operations Policy Statement
-Florida: FDOT Road Rangers
-United Kingdom: Active Traffic Management
Work Zone Management
-North Carolina: NCDOT Safety and Traffic Operations Committee
-Michigan: MDOT Work Zone Traffic Control Modeling
Special Event Management
-Kansas: Kansas Speedway
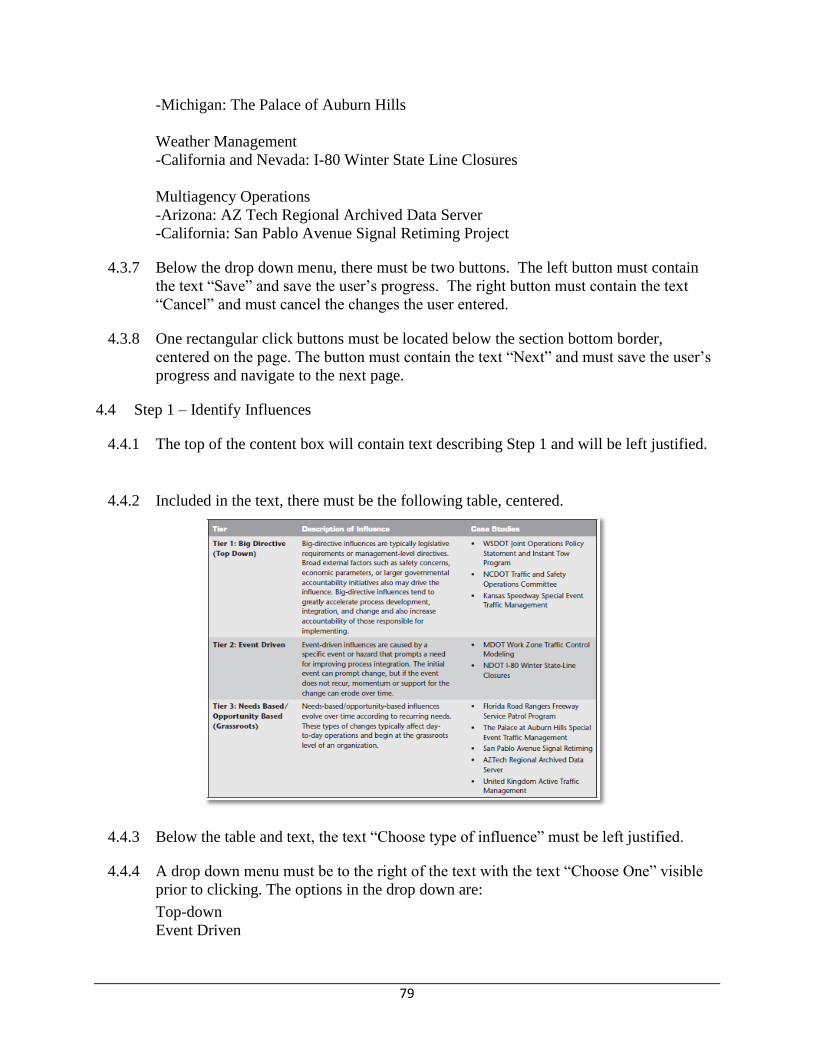
79
-Michigan: The Palace of Auburn Hills
Weather Management
-California and Nevada: I-80 Winter State Line Closures
Multiagency Operations
-Arizona: AZ Tech Regional Archived Data Server
-California: San Pablo Avenue Signal Retiming Project
Below the drop down menu, there must be two buttons. The left button must contain 4.3.7
the text “Save” and save the user’s progress. The right button must contain the text
“Cancel” and must cancel the changes the user entered.
One rectangular click buttons must be located below the section bottom border, 4.3.8
centered on the page. The button must contain the text “Next” and must save the user’s
progress and navigate to the next page.
4.4 Step 1 – Identify Influences
The top of the content box will contain text describing Step 1 and will be left justified. 4.4.1
Included in the text, there must be the following table, centered. 4.4.2
Below the table and text, the text “Choose type of influence” must be left justified. 4.4.3
A drop down menu must be to the right of the text with the text “Choose One” visible 4.4.4
prior to clicking. The options in the drop down are:
Top-down
Event Driven
80
Bottom-up
Below the text “Choose type of influence”, will be the text “Please describe your 4.4.5
influences”.
Below the text will be a text box with visible borders that spans the entire width of the 4.4.6
content box and displays lines of text vertically that users can type in must begin under
the text. The text box should be able to store a pre-defined amount of text.
Below the text box, there must be two buttons. The left button must contain the text 4.4.7
“Save” and save the user’s progress. The right button must contain the text “Cancel”
and must cancel the changes the user entered.
Two rectangular click buttons must be located below the content section’s bottom 4.4.8
border, arranged horizontally with space between and centered on the page. The left
button must contain the text “Back” and must navigate to the previous page. The right
button must contain the text “Next” and must save the user’s progress and navigate to
the next page.
4.5 Step 2 – Define Reliability Goal
The top of the content box will contain text describing Step 2 and will be left justified. 4.5.1
The text “Please describe your reliability goal(s)” must follow the previous content and 4.5.2
be left justified.
Below the text will be a text box with visible borders that spans the entire width of the 4.5.3
content box and displays lines of text vertically that users can type in must begin under
the text. The text box should be able to store a pre-defined amount of text.
Below the text box, there must be two buttons. The left button must contain the text 4.5.4
“Save” and save the user’s progress. The right button must contain the text “Cancel”
and must cancel the changes the user entered.
Two rectangular click buttons must be located below the section bottom border, 4.5.5
arranged horizontally with space between and centered on the page. The left button
must contain the text “Back” and must navigate to the previous page. The right button
must contain the text “Next” and must save the user’s progress and navigate to the next
page.
4.6 Step 3 – Identify and Document Current Business Process
The top of the content box will contain text describing Step 3 and will be left justified. 4.6.1
The text “Add new or select existing business process model file” must follow the 4.6.2
previous content.

81
Below the text will be a content box where file names are displayed. 4.6.3
Below the content box, there will be three (3) buttons. The first will contain the text 4.6.4
“Upload” and will allow the user to upload a file. The second will contain the text
“Open” and will allow the user to open a file that has been uploaded to the database.
The third button will contain the text “Remove” and will delete the selected file from
the application.
The text “Please describe your existing process (optional)” must follow the previous 4.6.5
content and be left justified.
Below the text will be a text box with visible borders that spans the entire width of the 4.6.6
content box and displays lines of text vertically that users can type in must begin under
the text. The text box should be able to store a pre-defined amount of text.
Two rectangular click buttons must be located below the content section’s bottom 4.6.7
border, arranged horizontally with space between and centered on the page. The left
button must contain the text “Back” and must navigate to the previous page. The right
button must contain the text “Next” and must save the user’s progress and navigate to
the next page.
4.7 Step 4 – Develop/Change and Implement Process
The top of the content box will contain text describing Step 4 and will be left justified. 4.7.1
Below will be the text “Iterations” and will be left-justified 4.7.2
Below the text will be a table with one column. The table will contain the iterations that 4.7.3
have been completed. Each line will be selectable by clicking.
Directly under the table, two rectangular clickable buttons will be arranged 4.7.4
horizontally. The left button must have the text “Add” centered within the button and
will display a blank iteration for the user to edit as well as add a new line to the table.
The right button must have the text “Remove” centered within the button and will
remove the selected iteration from the table.
The text “Please describe your newly developed or changed process in iteration x” must 4.7.5
follow the previous content and be left justified. The letter “x” will be replaced with the
current iteration number.
Below the text will be a text box with visible borders that spans the entire width of the 4.7.6
content box and displays lines of text vertically that users can type in must begin under
the text. The text box should be able to store a pre-defined amount of text.
Following the above content, the text “Please describe how you will implement your 4.7.7
process in iteration x” must be left justified. The letter “x” will be replaced with the
current iteration number.
82
Below the text will be a text box with visible borders that spans the entire width of the 4.7.8
content box and displays lines of text vertically that users can type in must begin under
the text. The text box should be able to store a pre-defined amount of text.
Below the text box, there must be two buttons. The left button must contain the text 4.7.9
“Save” and save the user’s progress. The right button must contain the text “Cancel”
and must cancel the changes the user entered.
Following the above buttons, the text “Add new or changed process documents in 4.7.10
iteration x” must be left justified. The letter “x” will be replaced with the current
iteration number.
Below the text will be a content box where file names are displayed. 4.7.11
Below the content box, there will be three (3) buttons. The first will contain the text 4.7.12
“Upload” and will allow the user to upload a file. The second will contain the text
“Open” and will allow the user to open a file that has been uploaded to the database.
The third button will contain the text “Remove” and will delete the selected file from
the application.
Two rectangular click buttons must be located below the content section’s bottom 4.7.13
border, arranged horizontally with space between and centered on the page. The left
button must contain the text “Back” and must navigate to the previous page. The right
button must contain the text “Next” and must save the user’s progress and navigate to
the next page.
4.8 Step 5 – Assess Process
The top of the content box will contain text describing Step 5 and will be left justified. 4.8.1
Below will be the text “Iterations” and will be left-justified 4.8.2
Below the text will be a table with one column. The table will contain the iterations that 4.8.3
have been completed. Each line will be selectable by clicking.
Directly under the table, two rectangular clickable buttons will be arranged 4.8.4
horizontally. The left button must have the text “Add” centered within the button and
will display a blank iteration for the user to edit as well as add a new line to the table.
The right button must have the text “Remove” centered within the button and will
remove the selected iteration from the table.
Below the text will be, the text “Please describe the performance measures you will be 4.8.5
assessing in iteration x” and be left justified. The letter “x” will be replaced with the
current iteration number.
Directly below the text will be a text box with visible borders that spans the entire 4.8.6
width of the content box and displays lines of text vertically that users can type in must
begin under the text. The text box should be able to store a pre-defined amount of text.

83
The next line must have the text “Please describe the methods you will use to evaluate 4.8.7
your performance measures in iteration x” and be left justified. The letter “x” will be
replaced with the current iteration number.
Directly below the text will be a text box with visible borders that spans the entire 4.8.8
width of the content box and displays lines of text vertically that users can type in must
begin under the text. The text box should be able to store a pre-defined amount of text.
The next line must have the text “Please describe the data you will need to evaluate 4.8.9
your performance measures” and be left justified.
Directly below the text will be a text box with visible borders that spans the entire 4.8.10
width of the content box and displays three (3) lines of text vertically that users can
type in must begin under the text. The text box should be able to store a pre-defined
amount of text.
The next line must have the text “Please enter the collected data you need to evaluate 4.8.11
your performance measures in iteration x” and be left justified. The letter “x” will be
replaced with the current iteration number.
Directly below the text will be a text box with visible borders that spans the entire 4.8.12
width of the content box and displays lines of text vertically that users can type in must
begin under the text. The text box should be able to store a predefined amount of text.
The next line must have the text “Please detail the findings/results of your evaluation in 4.8.13
iteration x” and be left justified. The letter “x” will be replaced with the current
iteration number.
Directly below the text will be a text box with visible borders that spans the entire 4.8.14
width of the content box and displays lines of text vertically that users can type in must
begin under the text. The text box should be able to store a predefined amount of text.
Below the text box, there must be two buttons. The left button must contain the text 4.8.15
“Save” and save the user’s progress. The right button must contain the text “Cancel”
and must cancel the changes the user entered.
Two rectangular click buttons must be located below the content section bottom border, 4.8.16
arranged horizontally with space between and centered on the page. The left button
must contain the text “Back” and must navigate to the previous page. The right button
must contain the text “Next” and must save the user’s progress and navigate to the next
page.
4.9 Step 6 – Document Process
The top of the content box will contain text describing Step 6 and will be left justified. 4.9.1
The text “Please describe how you will document your process/changes” must follow 4.9.2
the previous content and be left justified.

84
Directly below the text will be a text box with visible borders that spans the entire 4.9.3
width of the content box and displays lines of text vertically that users can type in must
begin under the text. The text box should be able to store a pre-defined amount of text.
Below the text box, there must be two buttons. The left button must contain the text 4.9.4
“Save” and save the user’s progress. The right button must contain the text “Cancel”
and must cancel the changes the user entered.
Below the buttons, the text “Add new or select existing process documentation file 4.9.5
(Optional)” must follow the previous content and be left justified.
Below the text will be a content box where file names are displayed. 4.9.6
Below the content box, there will be three (3) buttons. The first will contain the text 4.9.7
“Upload” and will allow the user to upload a file. The second will contain the text
“Open” and will allow the user to open a file that has been uploaded to the database.
The third button will contain the text “Remove” and will delete the selected file from
the application.
Two rectangular click buttons must be located below the content section bottom border, 4.9.8
arranged horizontally with space between and centered on the page. The left button
must contain the text “Back” and must navigate to the previous page. The right button
must contain the text “Next” and must save the user’s progress and navigate to the next
page.
4.10 Step 7 – Institutionalize Process
The top of the content box will contain text describing Step 7 and will be left justified. 4.10.1
Below, the text “Please describe how you will institutionalize your process” must be 4.10.2
left justified.
Directly below the text will be a text box with visible borders that spans the entire 4.10.3
width of the content box and displays fifteen (15) lines of text vertically that users can
type in must begin under the text. The text box should be able to store a predefined
amount of text.
Below the text box, there must be two buttons. The left button must contain the text 4.10.4
“Save” and save the user’s progress. The right button must contain the text “Cancel”
and must cancel the changes the user entered.
Two rectangular click buttons must be located below the content section’s bottom 4.10.5
border, arranged horizontally with space between and centered on the page. The left
button must contain the text “Back” and must navigate to the previous page. The right
button must contain the text “Next” and must save the user’s progress and navigate to
the next page.
4.11 Create/Print Report
85
The contents of all 7 steps from the Group Implementation Module must be displayed 4.11.1
on this page, in order, in a printable/savable format.
Two rectangular click buttons must be located below the content section bottom border, 4.11.2
on the left hand side. The first button will contain the text “Save Report” and will
allow the user to save the report to their computer. The second button will contain the
text “Print Report”. The displayed report will print when clicked.
Two rectangular click buttons must be located below the content section’s bottom 4.11.3
border, arranged horizontally with space between and centered on the page. The left
button must contain the text “Back” and must navigate to the previous page. The right
button must contain the text “Next” and must save the user’s progress and navigate to
the next page.
4.12 Case Studies
At the top of the content box, the text “Please select a case study from the left panel to 4.12.1
view its content:” will be left justified.
Below the text will be a table containing basic information regarding each case study. 4.12.2
“Case Study 1: Washington State DOT Joint Operations Policy Statement and Instant 4.12.3
Tow Dispatch Program”
“Case Study 2: Florida Road Rangers”
“Case Study 3: United Kingdom Active Traffic Management”
“Case Study 4: North Carolina DOT Traffic and Safety Operations Committee”
“Case Study 5: Michigan DOT Work Zone Traffic Control Modeling”
“Case Study 6: Kansas Speedway Special-Event Traffic Management”
“Case Study 7: The Palace of Auburn Hills, Special-Event Traffic Management
(Michigan)”
“Case Study 8: I-80 Winter State Line Closures (California and Nevada State Line)”
“Case Study 9: AZTech Regional Archived Data Server (Arizona)”
“Case Study 10: San Pablo Avenue Signal Retiming (California)”
At the top of each individual case study page will be the title of the case study, left 4.12.4
justified and bold.
Text containing information on the 7 steps of that case study will follow. 4.12.5
Two rectangular click buttons must be located below the last section’s bottom border, 4.12.6
arranged horizontally with space between and centered on the page. The left button
must contain the text “Back” and must navigate to the previous page. The right button
must contain the text “Next” and navigate to the next page.
4.13 Resources
86
In the content section, the text “Below are links to resources that you may find helpful” 4.13.1
must be at the top of the section and be left-justified. One blank line must follow.
On the line following the blank line, the text “Integrating Business Process to Improve 4.13.2
Travel Time Reliability Report: S2-L01-RR-1”will be left-justified.
Below the text, a hyperlink with the text “http://onlinepubs.trb.org/onlinepubs/SHRP 4.13.3
2/SHRP 2_S2-L01-RR-1.pdf” must open the associated file from the internet. One
blank line must follow.
On the line following the blank line, the text “Guide to Integrating Business Processes 4.13.4
to Improve Travel Time Reliability: S2-L01-RR-2” must be left-justified.
Below the text, a hyperlink with the text “http://onlinepubs.trb.org/onlinepubs/SHRP 4.13.5
2/SHRP 2_S2-L01-RR-2.pdf” must open the associated file from the internet.
On the line following the blank line, the text “E-tool Informational Flyer” must be left-4.13.6
justified.
Below the text, a hyperlink with the text “e-tool informational flyer.pdf” must open the 4.13.7
associated file.
On the line following the blank line, the text “E-tool Materials List” must be left-4.13.8
justified.
Below the text, a hyperlink with the text “e-tool Materials List.pdf” must open the 4.13.9
associated file.
On the line following the blank line, the text “Chapter 3.3.2 of Advancing Metropolitan 4.13.10
Planning for Operations” must be left-justified.
Below the text, a hyperlink with the text 4.13.11
“http://www.ops.fhwa.dot.gov/publications/fhwahop10027/chap_3b.htm#s332” must
open the associated file from the internet.
On the line following the blank line, the text “Project Report” must be left-justified. 4.13.12
Below the text, a hyperlink with the text “Report.html” must open the associated file 4.13.13
from the internet.
87
APPENDIX B Case Study Details
SHRP 2 Report S2-L01-RR-1 Integrating Business Processes to Improve Travel Time Reliability
documented 10 case studies of organizations that identified business processes that could be
altered to improve travel time reliability. The e-tool provides the user numerous opportunities to
tap into the wealth of information available through these 10 case studies. We anticipate that
various pieces of information will be applicable to the user as they work their way through the e-
tool, as such, we have taken the time to condense and categorize the information presented in the
Report S2-L01-RR-1 into the 7 steps of business process modeling to ease the incorporation of
the information into the e-tool by the software developers. Next, we provide a summary of each
of the 10 case studies that were included in the e-tool.
Case Study: Name of Case Study
Overview/Background:
Provide a brief background of the case study. Step 1: Influences
Determine if the influence was top-down, event driven, or needs/opportunity based. Describe
what the influence was. Step 2: Define the Specific Reliability Goal(s)
Determine the specific reliability goals that the agency wants to achieve. Step 3: Identify and Document Current Business Processes
Summarize current business process. Step 4a: Develop/Change Process
Discuss how the agency changed the process to better fit their needs. Step 4b: Implement Process
Discuss how the agency implemented the process. Step 5: Assess Process
Discuss what the agency assessed and the outcome of the assessment. Step 6: Document Process
Determine how the agency documented the process for the stakeholders. Step 7: Institutionalize Process
Determine what the agency did to institutionalize the process and the outcome.
88
Case Study: Washington State DOT Joint Operations Policy Statement and Instant Tow Dispatch
Program
Overview/Background:
Washington State Instant Tow Dispatch Program, which describes one element of a broader
incident management program focused on reducing incident clearance time through the
collaborative efforts of the Washington State Department of Transportation (WSDOT) and the
Washington State Patrol (WSP). The Instant Tow Dispatch Program initially began as a program
on the Tacoma Narrows Bridge to provide for quick removal of disabled vehicles from travel
lanes, thereby reducing the potential impact on mobility on the corridor. When a disabled vehicle
was reported or spotted by WSDOT Traffic Operations Center operators using the WSDOT
CCTV cameras, a WSP trooper was dispatched and, on arriving at the scene, would verify that a
tow was needed; only then would a tow operator on the WSP list be contacted. Under the Instant
Tow Dispatch Program, as soon as an incident is verified on the CCTV cameras, a tow truck can
be dispatched without prior verification of need from a WSP trooper. In the initial program used
on the Tacoma Narrows Bridge, tow operators on each side of the bridge participated and were
dispatched according to how quickly they could reach the disabled vehicle(s). An evaluation of
the program by the University of Washington Transportation Research Center found that the In-
stant Tow Dispatch Program saved an average of 15 min for clearance, compared with having an
officer first respond to the incident. A challenge with this program was how to reimburse tow
drivers for dry runs. Dry runs occurred when tow truck drivers were dispatched, but, before they
arrived, the disabled vehicle was able to move out of the traffic lanes. This might happen if the
driver was able to get his or her car restarted or if a passing motorist provided assistance. When
this occurred, tow operators may have wasted as much as 30 min. Tow truckers thus did not want
to participate in the program unless they could be reimbursed for this lost time.
Step 1: Influences
The influence for the WSDOT was a top-down influence. A request from the governor’s office
that WSDOT and WSP collaborate on performance monitoring and accountability goals for
incident response and traffic incident clearance times was very important. It made an already
strong working relationship between WSDOT and WSP even stronger and increased the
accountability placed on both agencies to meet the 90-min clearance time. WSDOT and WSP
were required to jointly report the progress toward the 90-min incident clearance goal specified
in the Government Management Accountability Performance program. This requirement led to
the focus on developing strategies and practices to reduce incident clearance time and minimize
the impacts of incidents on freeway mobility.
Step 2: Define the Specific Reliability Goal(s)
The primary reliability goal that WSDOT was trying to achieve was the 90-min incident
clearance time; the Instant Tow Dispatch was one of several strategies that were developed and
implemented to work toward achieving that overarching clearance time goal. During the initial
pilot test of the Instant Tow Dispatch Program, it was not clear how well the program would
contribute to meeting that goal, so there were no specific goals established for the program other
than monitoring the impact of the program on reduced incident clearance. WSDOT planned to
evaluate the program after the initial pilot test to determine the costs and benefits of the program.
It is also important to note that goals and performance for WSDOT’s transportation system and
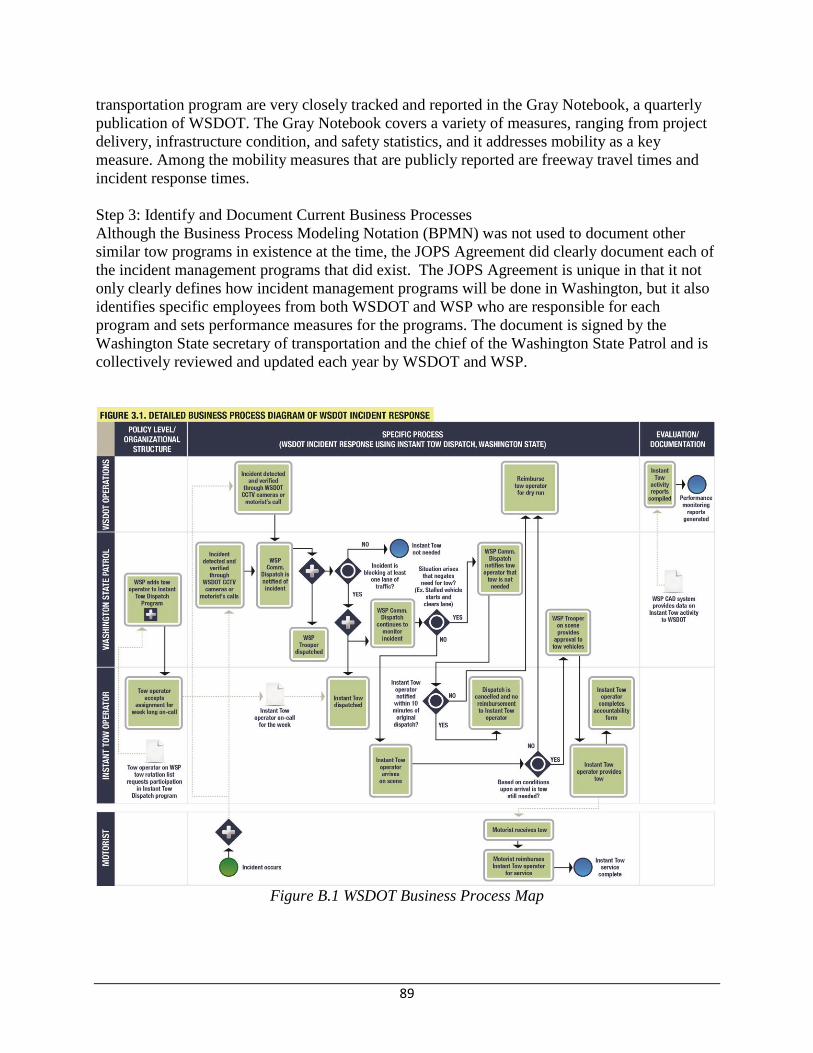
89
transportation program are very closely tracked and reported in the Gray Notebook, a quarterly
publication of WSDOT. The Gray Notebook covers a variety of measures, ranging from project
delivery, infrastructure condition, and safety statistics, and it addresses mobility as a key
measure. Among the mobility measures that are publicly reported are freeway travel times and
incident response times.
Step 3: Identify and Document Current Business Processes
Although the Business Process Modeling Notation (BPMN) was not used to document other
similar tow programs in existence at the time, the JOPS Agreement did clearly document each of
the incident management programs that did exist. The JOPS Agreement is unique in that it not
only clearly defines how incident management programs will be done in Washington, but it also
identifies specific employees from both WSDOT and WSP who are responsible for each
program and sets performance measures for the programs. The document is signed by the
Washington State secretary of transportation and the chief of the Washington State Patrol and is
collectively reviewed and updated each year by WSDOT and WSP.
Figure B.1 WSDOT Business Process Map
90
Step 4a: Develop/Change Process
In Washington, the Instant Tow Dispatch Program initially began as a program on the Tacoma
Narrows Bridge. Although it was successful in reducing clearance times, it was not sustainable
because tow operators were not reimbursed for dry runs, which occurred when they were
dispatched to tow a vehicle and the vehicle had been removed from the lanes before the tow
operator arrived. Without a reimbursement program, tow operators did not want to continue
participating in the Instant Tow Dispatch Program. Through the reimbursement program that
WSDOT initiated, WSDOT found it could maintain active participation by tow operators and yet
still provide the Instant Tow Dispatch Program at a very low cost. WSDOT has several examples
of changes that were made to the initial program to improve the process, better meet performance
measures, and satisfy all of its partners.
Step 4b: Implement Process
WSDOT implemented the changes as information was collected and change was deemed
necessary. The implementation step worked closely, in an iterative manner, with assessment of
the process and changes in the process.
Step 5: Assess Process
WSDOT and WSP had several measures, such as response time, number of tows, and cost of the
program, to monitor the impact and effectiveness of the program. The University of Washington
Transportation Research Center was also asked to study the initial pilot program. The study
found that without the Instant Tow Dispatch Program it would take an average of 18 min to
dispatch a tow truck after an incident was detected and verified. With the Instant Tow Dispatch
Program, it takes an average of 3 min to dispatch a tow truck. The program has reduced the time
for a tow truck to arrive at an incident by approximately 15 min for most incidents. WSDOT
looked at the saving this created in terms of lost time and wasted fuel resulting from congestion
and estimated that for less than $1,000 per year to operate the program, WSDOT would see
annual benefits of approximately $6.5 million to $11.1 million.
Step 6: Document Process
The JOPS Agreement includes the Instant Tow Dispatch Program objective; roles and
responsibilities, including those of lead staff from WSDOT and WSP; performance measures;
and reporting requirements. Annual updates of the JOPS Agreement ensure that any changes to
any of the joint programs included in the agreement can be captured and require the signature of
the Washington secretary of transportation and the chief of the Washington State Patrol.
Step 7: Institutionalize Process
The JOPS Agreement provides the higher level policy for the Instant Tow Dispatch Program by
establishing roles and responsibilities and lead staff. A set of standard operating guidelines was
developed for the Instant Tow Dispatch Program, which was rolled out in several urban areas
around the state over time. With specific staff assigned from both WSDOT and WSP in the JOPS
Agreement, accountability for continuing the program is clearly defined; the annual update of the
JOPS Agreement reinforces the continued desire of WSDOT and WSP leadership to keep the
program.
Case Study: Florida Road Rangers
91
Overview/Background:
The Florida Road Rangers are a freeway service patrol operated by Florida Department of
Transportation (FDOT). There are more than 100 Road Ranger vehicles in service patrolling
more than 1,000 centerline miles of freeways. To operate the Road Ranger program, FDOT
contracts with private vendors to provide vehicles and drivers and uses private sponsorship to
supplement funding for the program. The Florida Road Ranger case study examines the use of
private tow vendors and sponsors to successfully deliver a freeway service patrol program
throughout the state of Florida. Delivery of the Road Ranger program includes the participation
of FDOT, Florida Highway Patrol (FHP), private service patrol providers, and private sponsors.
The Road Ranger program is coordinated through the FDOT Central Office and operated by the
FDOT districts and the Florida Turnpike Enterprise. The Road Ranger program in its current
format began in 2000, but at that time the program was completely funded by the State of
Florida. Budget cuts later forced FDOT to look elsewhere for funding or consider reducing the
hours and miles of service covered by the Road Ranger program. FDOT was able to
successfully implement a sponsorship program to supplement funding of the Road Ranger
program through corporate sponsorship.
Road Ranger roving patrols are used on heavily congested freeways, high incident locations, and
work zones. The State Traffic Engineering and Operations Office coordinates the Road Ranger
program statewide, but each district has independent supervision and control over its Road
Ranger program. Districts contract directly with private companies to provide the operators and
vehicles for a specified number of miles that need to be patrolled. To ensure program
consistency across the state, each tow vendor provides white vehicles affixed with the Road
Ranger logo, provides uniforms to drivers, and offers the same types of services as all other tow
vendors. Road Rangers are equipped to assist moving disabled vehicles off the roadway to the
nearest safe place and traffic control during incidents. They also provide limited amounts of
fuel, tire changing assistance, cell phone calls for car service, and other types of minor
emergency repairs to disabled vehicles to get them off the freeway and reduce the potential for
secondary incidents.
Step 1: Influences
The creation of a Road Ranger program was influenced by the need to assist distressed vehicles
in Alligator Alley. Service patrols were implemented in Florida over 20 years ago to assist with
work zones and later expanded to include coverage of I-75 through the Everglades to assist
stranded motorists in an area with little amenities. The service patrol on I-75 through the
Everglades relieved FHP of the burden of assisting motorists on a stretch of road where the FHP
patrols were already sparse
Step 2: Define the Specific Reliability Goal(s)
The reliability goal FDOT intends to achieve through the Road Ranger program is alleviating
nonrecurring congestion caused by traffic incidents. Decreasing nonrecurring congestion should
occur through assistance to stranded motorists and provision of traffic incident management for
major incidents. The primary intent is restoring the original capacity to a facility.
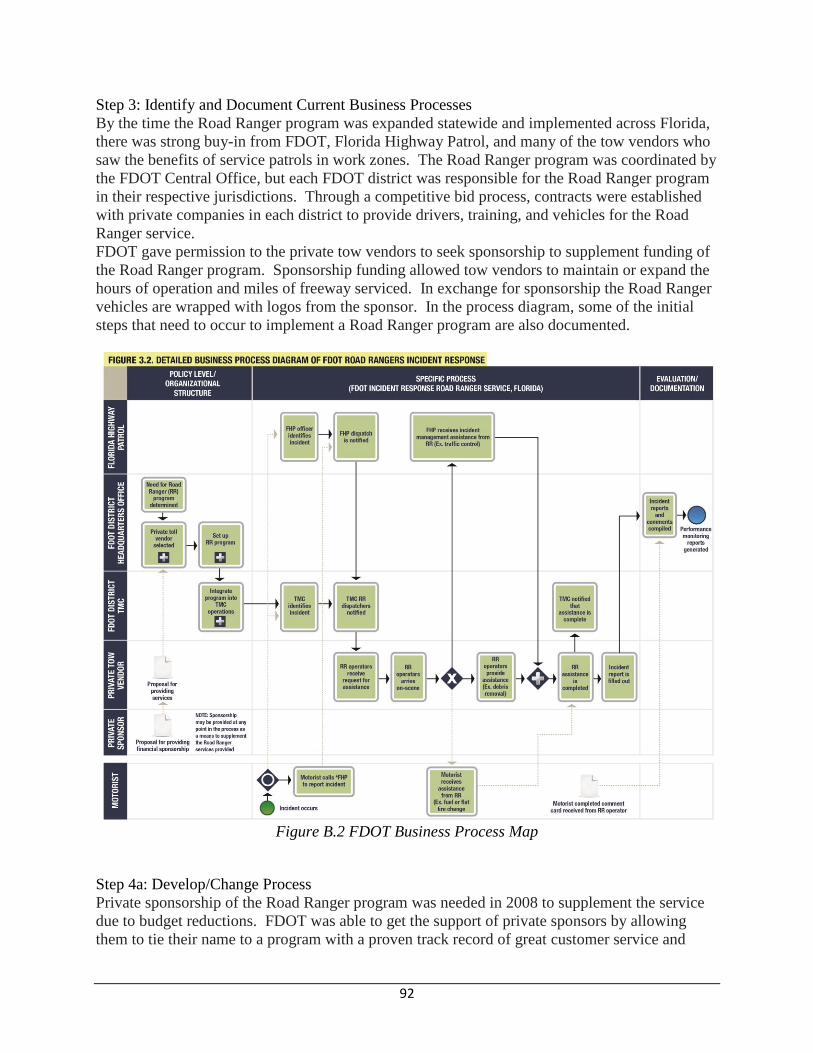
92
Step 3: Identify and Document Current Business Processes
By the time the Road Ranger program was expanded statewide and implemented across Florida,
there was strong buy-in from FDOT, Florida Highway Patrol, and many of the tow vendors who
saw the benefits of service patrols in work zones. The Road Ranger program was coordinated by
the FDOT Central Office, but each FDOT district was responsible for the Road Ranger program
in their respective jurisdictions. Through a competitive bid process, contracts were established
with private companies in each district to provide drivers, training, and vehicles for the Road
Ranger service.
FDOT gave permission to the private tow vendors to seek sponsorship to supplement funding of
the Road Ranger program. Sponsorship funding allowed tow vendors to maintain or expand the
hours of operation and miles of freeway serviced. In exchange for sponsorship the Road Ranger
vehicles are wrapped with logos from the sponsor. In the process diagram, some of the initial
steps that need to occur to implement a Road Ranger program are also documented.
Figure B.2 FDOT Business Process Map
Step 4a: Develop/Change Process
Private sponsorship of the Road Ranger program was needed in 2008 to supplement the service
due to budget reductions. FDOT was able to get the support of private sponsors by allowing
them to tie their name to a program with a proven track record of great customer service and

93
strong public support. Private tow vendors contract with FDOT to provide the equipment and
staff necessary to deliver the Road Ranger program in each district. In addition, private
sponsorship supplements the funding provided by the state. Without sponsorship, FDOT would
have had to cut back on the Road Ranger service severely in the last two years and future
operation of the system might have been in jeopardy.
Incidents are typically identified by an FHP officer, the FDOT Traffic Monitoring Center
(TMC), the Road Ranger operator during roving service, or by a stranded or observant motorist.
Depending on the incident, the Road Ranger unit may respond independently to motorists who
call for help, such as a stranded motorist who needs fuel, or they may respond in coordination
with FHP to assist with traffic control during a major incident that closes part or all of a freeway.
During larger incidents when emergency responders are called to the scene, the Road Rangers
can provide traffic management through assisting with placing cones and flares, setting up detour
routes, or providing warning with truck-mounted dynamic message signs (DMSs), to motorists
near the back of queues caused by incidents.
Step 4b: Implement Process
There are many coordinating pieces working together to successfully implement the Road
Rangers service:
Integration between FDOT TMC dispatch and private tow vendors responsible for
providing Road Ranger service
Integration between FDOT TMC and FHP for identifying and responding to incidents
Integration between FDOT Headquarters and private tow vendors to document services
provided and develop the performance monitoring reports
The FDOT districts advertise through an RFP process. Through the private tow vendors,
FDOT is able to reduce some of its administrative burden of managing the program and
can seek competitive bids to provide the service after each contract expires
Integration between FDOT Headquarters and private sponsors for funding of the Road
Ranger service.
Integration still needed between FHP and Road Ranger operators to allow FHP offices to
talk directly to Road Rangers in the field. Through close cooperation between the FDOT
Road Ranger program, FDOT TMCs, FHP, and local fire and EMS, these agencies can
improve incident detection, response, and clearance times.
Step 5: Assess Process
FDOT keeps numerous performance measures to track the benefits of the Road Ranger program,
such as the miles of freeway patrolled with roving service, number of patrols operating, and the
number of assists provided to motorists. Outcome-based performance measures include the
incident duration, travel time reliability, and customer satisfaction. Of the outcome-based
performance measures, the Road Ranger program only has a direct impact on the customer
satisfaction measure. Motorists who receive assistance from a Road Ranger unit are given a
comment card to complete and mail back to FDOT to rate their satisfaction with the Road
Ranger service.
94
In November 2005, FDOT sponsored a benefit-cost analysis to evaluate the cost-effectiveness of
the Road Ranger program. The overall benefit-cost ratio of the Road Ranger program was
measured at 25.8:1. Benefits of the program included a savings of 1,138,869 vehicle hours of
delay and 1,717,064 gallons of fuel. At the time, the program cost approximately $1.1 million
statewide and the benefits were estimated at $29.2 million.
Step 6: Document Process
The Road Ranger operators complete an incident report for every incident they respond to and
the FDOT District Office compiles the incident reports to monitor performance of the Road
Ranger program. The incident report that Road Ranger operators complete for each incident
provides a detailed log of what services were provided, time to clear incident, and any other
relevant information about the incident. Customer feedback has been extremely positive, with
more than 90% of responses rating the Road Rangers as “very useful.” In addition to the
comment cards, FDOT routinely receives letters and e-mail thanking them for the Road Ranger
service.
The performance measures for incident duration and travel time reliability are not a direct
measurement of the Road Ranger program; however, the Road Rangers have a significant impact
on both of these measures. An overall decrease in incident clearance time will reduce
nonrecurring congestion, reduce the chances of secondary incidents, and improve overall travel
time reliability.
Step 7: Institutionalize Process
Three primary agencies work together to deliver the Road Ranger program: FDOT (Central
Office and districts), FHP, and private tow vendors. FDOT provides the oversight for the
program through the Central Office and districts. Day-to-day monitoring of the freeways and
dispatch of the Road Rangers are provided by the FDOT TMC. In the Central Office, the traffic
incident management manager and Road Ranger program manager are responsible for
coordinating with each district to provide a consistent level of service for the Road Ranger
program and to compile performance information. FHP identifies incidents through their patrol
officers, as well as through dispatchers answering calls from motorists. The relationship and
cooperation between FDOT and FHP have been good, and the benefits of the Road Ranger
program to both agencies are clearly understood.
Case Study: United Kingdom Active Traffic Management
Overview/Background:
Active traffic management (ATM) is used in a number of European countries, including
Denmark, Germany, the United Kingdom, and the Netherlands. This case study investigates
how ATM practices and technologies are used to improve travel time reliability in the United
Kingdom. ATM is based on several new or modified operational strategies that together produce
a fully managed corridor, optimizing the existing infrastructure along the roadway. This method
typically focuses on improving travel reliability, enhancing efficiency, and increasing throughput
and safety along the existing roadway. The Highway Administration (HA) took a different
approach to designing and developing its ATM program by conducting a safety analysis of the
95
study corridor. The HA has eight transportation control centers throughout the region to monitor
traffic. The National Traffic Control Center (NTCC) near Birmingham is the main hub for travel
information within England. The NTCC is used to relay information to motorists along the
national network. NTCC provides continuous information about incidents, notification of
congested sections, and alerts concerning severe weather that may affect the roadway. The other
seven regional control centers (RCCs) are used for tactical issues along the roadway. They
dispatch support to disabled vehicles, help clear incidents, provide traffic management support,
and operate ATM deployments.
The United Kingdom originally initiated a pilot program along M42, southeast of Birmingham,
England. Based on the identified safety issues, mitigation strategies were determined and
packaged into the ATM solution for the pilot study corridor. The ATM program consists of
gantries, detection, variable speed limit (VSL) signs, cameras, and variable message signs
(VMS) along a 10.5-mile section. The regional control center (RCC) in the area, West Midlands
RCC, actively operates the ATM deployment. After the M42 ATM deployment was in operation
for 12 months, a private firm was hired to review its effectiveness and document its benefits.
These documented benefits were used to gain support for funding of a full ATM program,
including extending ATM to all seven regions in England. The success of this pilot project has
generated significant benefits that have led to the extensive expansion of the ATM project to
over 300 centerline miles.
Step 1: Influences
The influence for deploying ATM strategies along the corridor was needs based. Congestion on
M42 was so severe that motorists were regularly experiencing stop-start conditions. Not only
did the congestion cause significant delay, it also led to increased safety issues.
Step 2: Define the Specific Reliability Goal(s)
The HA’s reliability goal is to improve travel time variability in the worst PM peak hour. The
HA indirectly intends to address nonrecurring congestion by focusing on improving safety. To
reduce secondary crashes, VSL signs will be deployed, decreasing the likelihood of rear-end
collisions. This ATM pilot project will alert travelers of any incident occurring along the
corridor by means of VMS. The message signs are used to give travel information or detour
routes during severe incidents. If the information is not consistent or current on the VMS,
drivers likely would disregard the messages, thereby affecting the impacts of the overall ATM
solution.
Step 3: Identify and Document Current Business Processes
The UK government’s Transport 2010 strategy included the idea of an ATM solution. After a
comprehensive review of five potential sites (including M25, London’s Orbital Motorway), the
M42 was selected for a pilot study. The HA performed a safety evaluation of M42 during 2002
and 2003 and identified over 2000 new and existing safety issues on the corridor. A risk
assessment was performed for each hazard type to determine the probability of occurrence. The
impacts were reviewed and mitigation strategies specific to each hazard were identified. Data in
several areas, including safety, traffic conditions (mobility), noise, and user perspective, were
documented so the benefit of ATM strategies could be evaluated appropriately and to guide
future decisions for the HA.
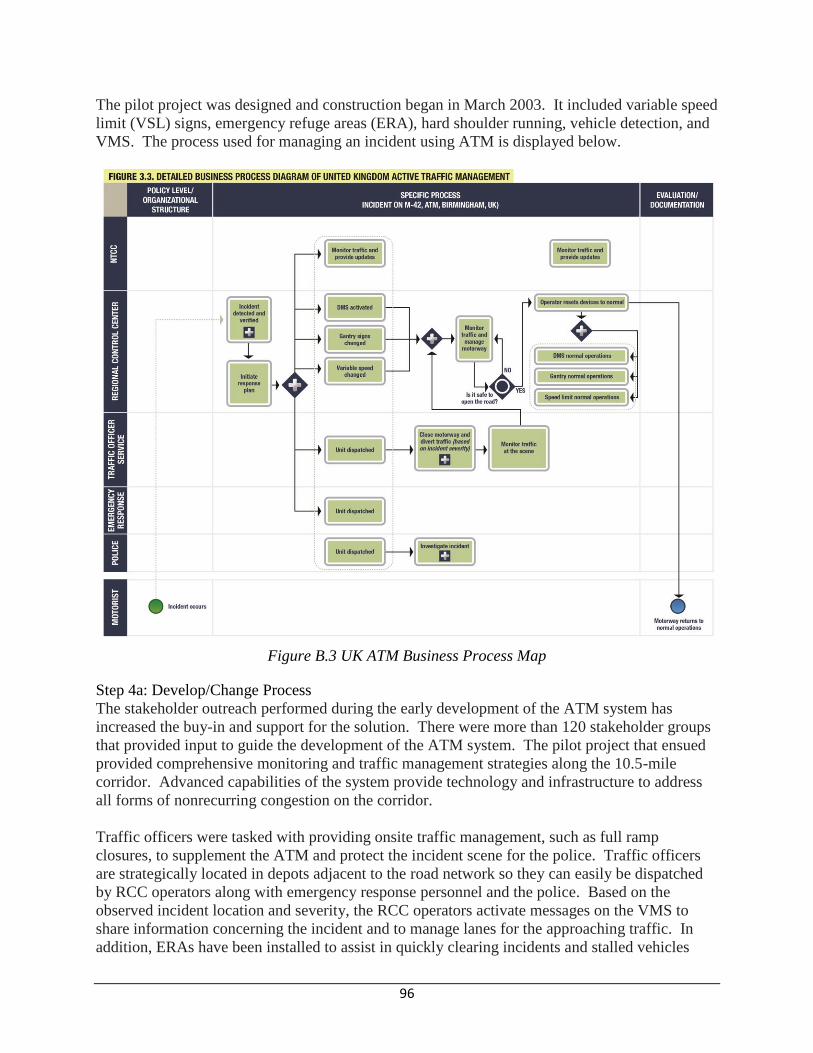
96
The pilot project was designed and construction began in March 2003. It included variable speed
limit (VSL) signs, emergency refuge areas (ERA), hard shoulder running, vehicle detection, and
VMS. The process used for managing an incident using ATM is displayed below.
Figure B.3 UK ATM Business Process Map
Step 4a: Develop/Change Process
The stakeholder outreach performed during the early development of the ATM system has
increased the buy-in and support for the solution. There were more than 120 stakeholder groups
that provided input to guide the development of the ATM system. The pilot project that ensued
provided comprehensive monitoring and traffic management strategies along the 10.5-mile
corridor. Advanced capabilities of the system provide technology and infrastructure to address
all forms of nonrecurring congestion on the corridor.
Traffic officers were tasked with providing onsite traffic management, such as full ramp
closures, to supplement the ATM and protect the incident scene for the police. Traffic officers
are strategically located in depots adjacent to the road network so they can easily be dispatched
by RCC operators along with emergency response personnel and the police. Based on the
observed incident location and severity, the RCC operators activate messages on the VMS to
share information concerning the incident and to manage lanes for the approaching traffic. In
addition, ERAs have been installed to assist in quickly clearing incidents and stalled vehicles

97
from the hard shoulder. These locations also provide safe and easy access for maintenance of the
ATM field devices. Once the incident has been cleared, the RCC operators will evaluate the
safety of the roadway and decide when to reopen traffic lanes. Once the operators decide the
roadway is safe, the devices are reset to normal operations and the VMS are used to continue
sharing updates on traffic flow. The VSL signs will automatically adjust to higher speeds as the
traffic flow regains capacity and speeds slowly increase.
Step 4b: Implement Process
The UK implementation of ATM was initiated differently from those of other countries within
Europe. They began by completing an in-depth safety analysis of the corridor. HA focused on
determining the problem areas, the influences, and the impacts that these areas make on an
average daily trip along one of the UK’s busiest corridors. Once those hazards were identified, a
risk assessment was completed.
Several key integration points were identified in implementing the ATM incident management
process, including the following:
Integration between NTCC and the regional control centers to monitor incidents and to
activate devices, respectively
Integration between NTCC, traffic officer service, emergency response, and the police
While monitoring the incident location, the on-road traffic officer service integrates with
the RCC
Integration between the RCC operator and the field devices.
This coordination has significantly reduced the impact of incidents on nonrecurring congestion.
Step 5: Assess Process
Before ATM was implemented and an incident occurred, the impact on capacity was severe, with
impacts lasting for several hours. Travel time along the corridor was extremely volatile, ranging
from 30 minutes to 3 hours. Use of arterials was limited because of the lack of traffic
management strategies and limited coordination with local agencies. The HA hired a consultant
to survey travelers along M4; they surveyed the short distance and long distance users. The
survey asked for the traveler’s thoughts on ATM modifications, specifically as they pertain to
congestion along the corridor, the ATM measures, environmental impacts, enforcement, driver
information, and overall use of the corridor.
Based on effective operations of ATM, the motorists on M42 have experienced a 27%
improvement in travel time variability and a 24% improvement in travel times during the worst
p.m. peak. The ATM pilot project also has resulted in a 4% decrease in fuel consumption; a 10%
decrease in vehicle emissions; and a decrease in the crash rate from 5.1 to 1.8 per month.
Another benefit of the ATM project is the lower cost and reduced schedule compared to a road
widening project. Widening of the corridor by one additional lane was estimated to cost about
$820 million, take 8 to 12 years to complete, and would require an environmental statement and
public involvement. The ATM pilot project cost only $160 million and was complete within 3 to
4 years, with no environmental impacts or need for additional right-of-way.
Even with the success of the pilot project, there are some elements that will be modified or
improved during expansion of ATM. For example, to improve the future efficiency of the ATM
98
program, the camera density could be reduced. The possibility of supplementing cameras with
more advanced detection or other technologies should be considered. More advanced
technologies, such as artificial intelligence or millimetric radar detection, should also be
deployed. Millimetric detection provides a more refined monitoring of the roadway and could
recognize debris or stalled vehicles. This advanced detection would help the control center
determine when it is safe to reopen the roadway after an incident.
Step 6: Document Process
The project is documented in a 12-month performance report about the process, the outcomes,
and the benefits. The HA website also contains comprehensive information about the ATM pilot
project. This information includes details of the project scope, funding, how ATM manages
traffic, and the results. In addition, all incidents require a report. The complexity of the report
depends on the severity of the incident.
The ATM pilot project demonstrated several congestion and safety benefits along the M42
corridor. The documentation of these benefits has helped to gain the support of government
ministers and industry. These benefits are due in large part to the overwhelming compliance rate
of the drivers. Driver compliance with VSL signs and VMS was a concern before implementing
the pilot project. However, HA has documented a 95% compliance rate for speed limits
equivalent to 50, 60, and 70 mph and an 85% compliance rate for speed limits equivalent to 40
mph. ATM is successful in the UK because of compliance by freight, local and long distance
travelers.
Step 7: Institutionalize Process
The HA assesses the ATM system on a continuous basis. The continued communication
between the NTCC, RCC, traffic officer service, emergency response, and the police provide for
a more effective system. After severe incidents, evaluation meetings are held with the agencies
involved. A more severe incident requires a larger number of agencies involved with
investigation and clearance to debrief.
The benefits demonstrated from the pilot project provided sufficient documentation to support
funding for project expansion. In January 2009, government ministers announced that a $10
billion project, Managed Motorways, was initiated to expand ATM to over 300 roadway miles.
The expansion will provide ATM coverage across England, with ATM control being conducted
from all seven regional control centers.
Case Study: North Carolina DOT Traffic and Safety Operations Committee
Overview/Background:
This case study was selected based on the proactive approach to managing the impacts of the
project work zone and the continuous coordination between several involved agencies. The
North Carolina Department of Transportation (NCDOT) has implemented an interagency
coordination process for the planning and monitoring of major construction work zones. The
coordination process begins before construction, ideally in the planning stage, and is continued
throughout the project. The process is determined by the needs of each unique construction
99
project. Initially, internal planning level meetings are conducted to establish the scope of a work
zone. A project-specific Safety and Traffic Operations Committee is created to oversee the
implementation of a work zone.
The NCDOT Safety and Traffic Operations Committee is composed of representatives from the
Work Zone Traffic Control (WZTC) Section, the NCDOT field office, safety engineers, incident
management personnel, public safety agencies, North Carolina State Highway Patrol (NCSHP),
the public information representative, and the contractor. These representatives coordinate to
ensure the safety of the workers and travelers, as well as the efficiency of the work zone and the
transportation network. The NCDOT Safety and Traffic Operations Committee focuses on
significant projects as defined by the Work Zone Safety and Mobility Policy, where mobility and
potential safety concerns exist. This allows the committee to provide better focus and attention
to those construction projects, which will allow them to have the greatest positive impact.
NCDOT guidelines clearly define four activity levels of significance. The criteria for
determining the level of significance includes lane closures, annual average daily traffic
(AADT), truck traffic, additional travel times expected, level of adverse impacts to existing
transportation infrastructure/high-volume traffic generators, duration of traffic impacts and user
value or cost. The coordination process and committee involvement are then based on the
determined level and specific needs of the project.
Step 1: Influences
The influence to create the Safety and Traffic Operations Committee was event driven. The
impetus for the Safety and Traffic Operations Committee meetings was a fatality that occurred
within a construction project work zone. Because of the fatality, a coordination meeting with
key stakeholders was conducted, and these meetings continued throughout the remainder of the
project. The collaboration was useful and productive. Subsequent meetings were held for the
next major interstate construction project to address upcoming traffic shifts, enforcement, speed
limits, incidents, public information, and a construction update on the project. The meetings
were again successful, and NCDOT created the Safety and Traffic Operations Committee, which
is now involved in significant projects and seeks to address work zone safety and mobility
requirements.
Step 2: Define the Specific Reliability Goal(s)
The reliability goal NCDOT desires to achieve is mitigating work zone effects on travel time
reliability. Work zones are categorized as planned events, but can generate long-term negative
effects on traffic. Work zones modify the roadway operations for specific time periods, and
these modifications must be evaluated to minimize impacts to mobility, safety, and travel time
reliability.
Step 3: Identify and Document Current Business Processes
NCDOT Work Zone Traffic Control Section, which is part of the Mobility and Safety Division,
is responsible for developing traffic management plans that maintain mobility and safety through
a work zone. The WZTC section has initiated an effort to continually monitor and evaluate the
effectiveness and safety of work zones. Based on observed conditions, the committee can
initiate speed or safety studies to validate concerns in the vicinity of the construction project.
The resulting information is available to guide decisions aimed at revising and improving the
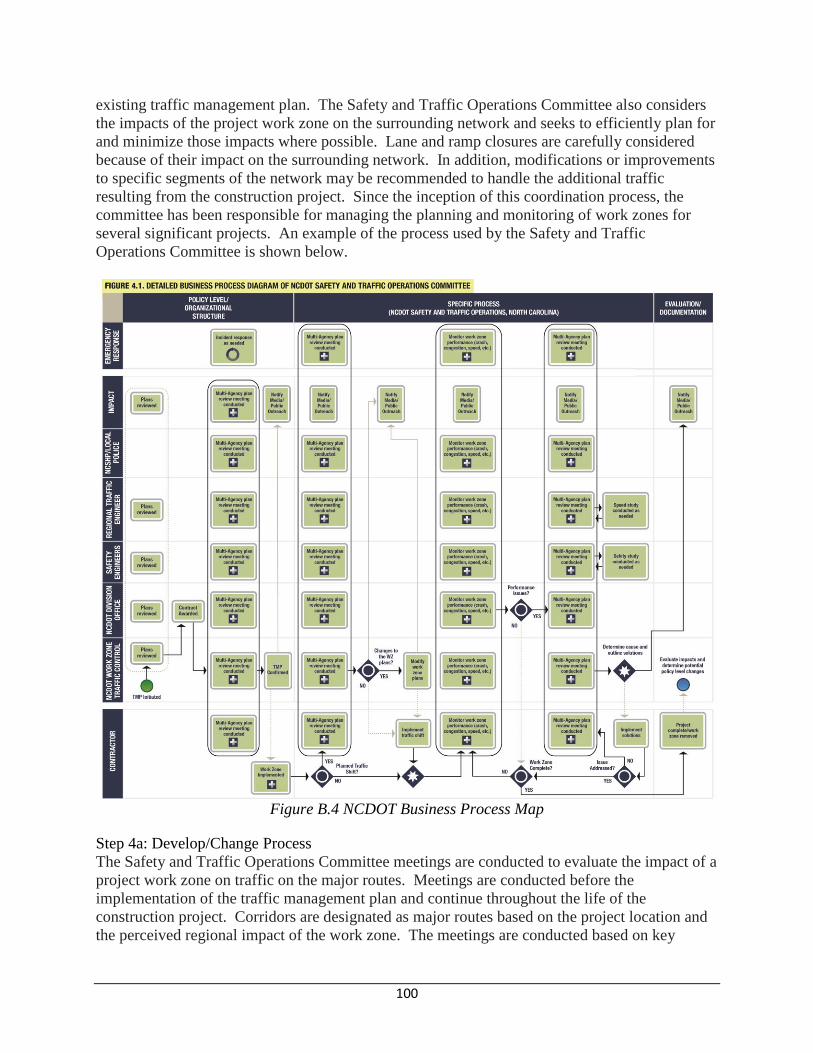
100
existing traffic management plan. The Safety and Traffic Operations Committee also considers
the impacts of the project work zone on the surrounding network and seeks to efficiently plan for
and minimize those impacts where possible. Lane and ramp closures are carefully considered
because of their impact on the surrounding network. In addition, modifications or improvements
to specific segments of the network may be recommended to handle the additional traffic
resulting from the construction project. Since the inception of this coordination process, the
committee has been responsible for managing the planning and monitoring of work zones for
several significant projects. An example of the process used by the Safety and Traffic
Operations Committee is shown below.
Figure B.4 NCDOT Business Process Map
Step 4a: Develop/Change Process
The Safety and Traffic Operations Committee meetings are conducted to evaluate the impact of a
project work zone on traffic on the major routes. Meetings are conducted before the
implementation of the traffic management plan and continue throughout the life of the
construction project. Corridors are designated as major routes based on the project location and
the perceived regional impact of the work zone. The meetings are conducted based on key

101
milestones of the project and when certain issues are identified within or in the vicinity of the
work zone. The milestones include scheduled traffic shifts or changes in the work zone that can
result in major impacts on traffic. The committee also provides the contractor with another
avenue to seek direction and communicate concerns. The contractor is aware of daily
experiences in the work zone and can identify unsafe scenarios within the work zone and when
traffic patterns, such as increased speeds, begin to change. Possible solutions include ramp
closures, added presence of law enforcement, or restrictions in the contractor’s available working
hours. The committee also attempts to minimize the incidents that occur by carefully
establishing the appropriate speed limits within the work zone.
Step 4b: Implement Process
The committee coordinates to identify viable mitigation strategies in response to the issues
observed in the work zone. Several key integration points were identified in the NCDOT Safety
and Traffic Operations Committee process, including the following:
Integration between the NCDOT Division Office, the NCDOT Work Zone Traffic
Control Section, and the contractor to review work zone traffic control plans
Integration between NCDOT, the contractor, and the NCSHP to review final plans before
implementation
Integration between NCDOT and the contractor for revised work zone plans before
implementation
Integration across all players to monitor performance of the work zone once implemented
Integration between agencies to review potential solutions when issues are identified and
implemented
Coordination with North Carolina’s Information Management Public Affairs,
Construction and Traffic Control (IMPACT) group for public information assistance to
provide outreach and information specific to the work zone.
The committee also plans for secondary incidents and considers how emergency responders can
efficiently respond within the work zone. Successful implementation of effective strategies also
can lead to policy-level changes to guide future traffic management plans and work zone
implementations.
Step 5: Assess Process
The NCDOT Safety and Traffic Operations Committee is focused on continually monitoring the
effect of a work zone on the roadway capacity. The strategies are implemented and continually
monitored for effectiveness until other negative trends are identified or the construction project is
complete. The work zone plans are reviewed for effectiveness based on observed conditions in
the work zone. The field personnel, contractor, and law enforcement agencies provide input into
the actual traffic conditions experienced in the work zone. The committee has established a
process to identify, evaluate, and implement mitigation strategies to offset negative impacts on
travel time reliability, and these strategies have proven successful in recent projects. Once a
mitigation strategy has been implemented, the safety and mobility of the area are monitored to
ensure that the strategy has been effective and does not generate more problems, such as an
increase in congestion. The committee has identified specific performance measures, such as
102
speed and crash rates, to continually evaluate the safety and mobility of the work zone. When
these measures demonstrate negative trends, the committee works to address issues that promote
the variation in driver behavior.
Step 6: Document Process
Documenting the impacts of work zones will provide reference points for decisions made on
future traffic management plans based on well documented successful practices. The WZTC
Section must produce traffic management plans for every construction project on NCDOT-
maintained roadways. Any modification to the work zone must be based on traffic control plans
sealed by a professional engineer. Each time there is a change, a new set of plans are developed
and sealed. As modifications are made in the field, it is important for the changes to be
documented in the existing plans. It also is important that detailed meeting minutes are captured
for each Safety and Traffic Operations Committee meeting. Since the work is occurring in an
active work zone, the resident engineer should maintain these records through the construction
life of the project and as long as state law requires. Additionally, construction contracts specify
that the contractor will be required to clear incidents in a set amount of time and requires that a
towing company be identified within the contract as a subcontractor.
Step 7: Institutionalize Process
NCDOT has published “Guidelines for Implementation of the Work Zone Safety and Mobility
Policy,” which outlines the goals, objectives, and strategies for all projects and identifies key
stakeholders who are responsible for the implementation of each objective. The document also
provides a method of determining the project level of significance, which, in turn, determines the
required management practice. Projects that are determined to be significant within the
guidelines require the establishment of a Safety and Traffic Operations Committee, which is
composed of representatives from the WZTC Section, the NCDOT field office, safety engineers,
incident management personnel, public safety agencies, NCSHP, the public information
representative, and the contractor.
The committee provides a means to evaluate traffic management plans before implementation
and during construction. The continuous monitoring of the work zone provides a safer work
environment and roadway. Modifications to the traffic management plan can be easily
implemented because everyone is continually involved. The continuous evaluation of the work
zone assesses the average speed and crash rates so that problem locations can be identified early
and addressed. The attention to observed issues results in greater mobility and safety within the
project limits and better travel time reliability on the network.
Case Study: Michigan DOT Work Zone Traffic Control Monitoring
Overview/Background:
This case study examines the modeling process that Michigan Department of Transportation
(MDOT) used to evaluate the impacts and to develop work zone traffic control plan alternatives
for the I-75 Ambassador Bridge Gateway Project. The Ambassador Bridge, which connects
Detroit, Michigan, and Windsor, Ontario, Canada, is one of the busiest commercial bridges in the
world and the largest commercial border crossing in North America, with approximately 11
million vehicles crossing the bridge each year. The Michigan DOT I-75 Ambassador Bridge
103
Gateway Project includes the reconstruction of the I-75 and I-96 freeways, a new interchange for
the Ambassador Bridge, a redesign of the Ambassador Bridge Plaza, and a pedestrian bridge
across I-75 and I-96 to connect east and west Mexicantown in southwest Detroit. It is a vital
international trade route, and access to the bridge needed to be maintained at all times during the
reconstruction.
Construction started on the I-75 Ambassador Bridge Gateway Project in February 2008 and was
scheduled for completion in fall 2009. As part of the construction, I-75 was scheduled to be
closed for 18 months through downtown Detroit, and a complete closure of the I-75/I-96
interchange was scheduled for three months. To determine the impacts of the closure and plan
detours and traffic management strategies, MDOT used large network microsimulation. The
ability of MDOT to develop network microsimulation models of work zones around the project
began years before construction started, with the development of the Southeast Michigan
Freeway Simulation (SEMSIM) model on the Paramics platform. The Ambassador Bridge
Gateway Project marked the first time that network microsimulation had been used in an
operations analysis, as opposed to planning applications. The model also had to take into
account numerous other planned closures of I-75 and surrounding roads partly because of the I-
75 Ambassador Bridge Gateway Project and partly because of other planned freeway and local
construction projects.
Step 1: Influences
The influence to develop SEMSIM was driven by multiple freeway and arterial projects in the
same area being constructed concurrently. Presently, network simulation is the only tool that can
provide the traffic analysis needed to stage, coordinate, and mitigate multiple interacting
projects. The Ambassador Bridge Gateway Project marks the first time that network
microsimulation has been used for an operations application in Michigan.
Step 2: Define the Specific Reliability Goal(s)
MDOT’s reliability goal is to address nonrecurring congestion caused by work zones for a major
project such as the 18-month closure of I-75. By using microsimulation to develop detailed
models of work zone traffic control, MDOT’s Metro Region was able to objectively evaluate
scenarios and work with MDOT Traffic, Safety, and Construction to select strategies that
provide the most effective mobility.
Step 3: Identify and Document Current Business Processes
The MDOT consultants modeled several scenarios corresponding to various project stages. The
scenario for the summer of 2008 was most critical because, in addition to the I-75 mainline
closure, it included the complete closure of the I-75/I-96 interchange, as well as other scheduled
project closures within the Gateway simulation network. Construction began in February 2008,
with the most critical phase – the complete closure of the I-75/I-96 interchange – occurring in
summer 2008. During the three months modeled for summer 2008, MDOT found that the traffic
and congestion predicted by the model was close to what MDOT was observing in the actual
construction work zones.
MDOT found that a bridge on another segment of I-75—part of the detour route and a critical
evacuation route from downtown Detroit—had only been scheduled for resurfacing but actually
needed to be completely reconstructed. This required freeway lane closures on a detour route for
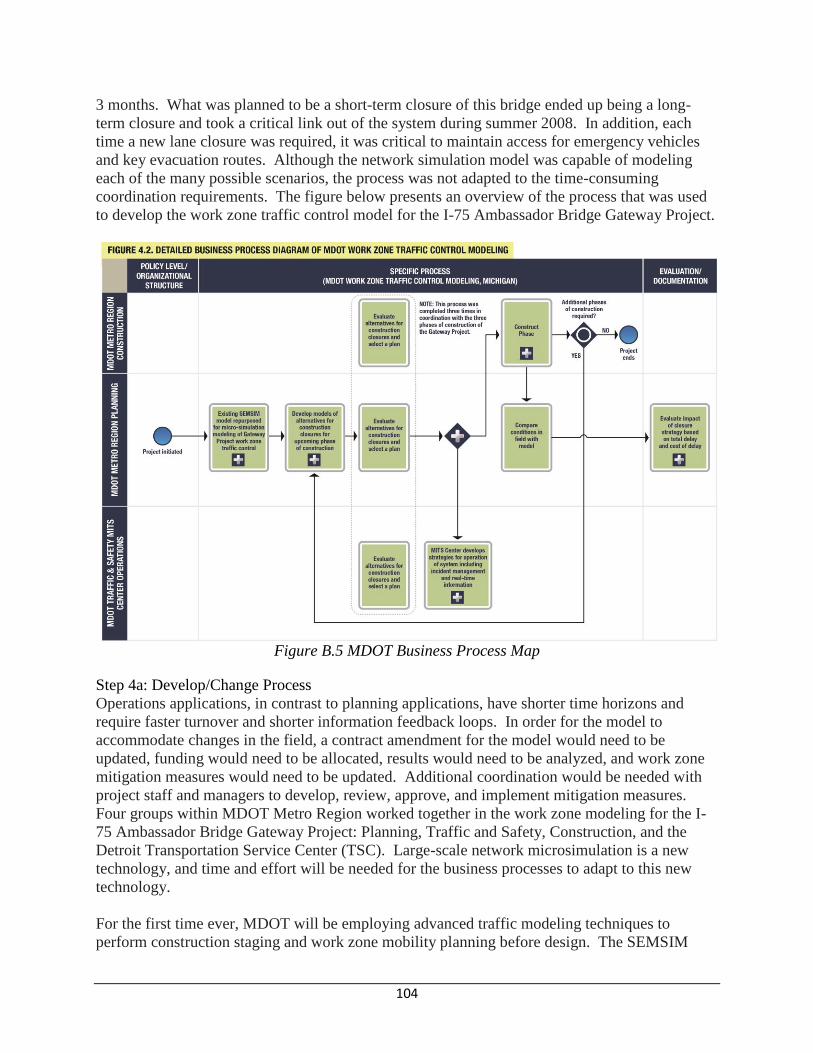
104
3 months. What was planned to be a short-term closure of this bridge ended up being a long-
term closure and took a critical link out of the system during summer 2008. In addition, each
time a new lane closure was required, it was critical to maintain access for emergency vehicles
and key evacuation routes. Although the network simulation model was capable of modeling
each of the many possible scenarios, the process was not adapted to the time-consuming
coordination requirements. The figure below presents an overview of the process that was used
to develop the work zone traffic control model for the I-75 Ambassador Bridge Gateway Project.
Figure B.5 MDOT Business Process Map
Step 4a: Develop/Change Process
Operations applications, in contrast to planning applications, have shorter time horizons and
require faster turnover and shorter information feedback loops. In order for the model to
accommodate changes in the field, a contract amendment for the model would need to be
updated, funding would need to be allocated, results would need to be analyzed, and work zone
mitigation measures would need to be updated. Additional coordination would be needed with
project staff and managers to develop, review, approve, and implement mitigation measures.
Four groups within MDOT Metro Region worked together in the work zone modeling for the I-
75 Ambassador Bridge Gateway Project: Planning, Traffic and Safety, Construction, and the
Detroit Transportation Service Center (TSC). Large-scale network microsimulation is a new
technology, and time and effort will be needed for the business processes to adapt to this new
technology.
For the first time ever, MDOT will be employing advanced traffic modeling techniques to
perform construction staging and work zone mobility planning before design. The SEMSIM
105
model allowed MDOT to build on the existing network model and to develop detailed models of
the work zone traffic control strategies. Unlike other planning and design applications, work
zone mobility requires a system perspective. Closing a part of an interstate freeway would have
systemic impacts on other freeways, system interchanges, and major arterial roads.
Microsimulation will allow MDOT to effectively determine the impacts of the work zones and
test various strategies to mitigate those impacts in the most effective ways.
Step 4b: Implement Process
Concurrent with the modeling effort, three major efforts were developed and implemented.
These included incident management under the direction of Metro Region Traffic and Safety and
the Michigan Intelligent Transportation System (MITS) Center; the addition of real-time sensors
and travel advisories brought into operation under the MITS Center; and a public involvement
and stakeholder outreach effort involving meetings, presentations, and the generation of
feedback from major corporations in the auto, auto supplier, and logistics industries. The MITS
Center also participated in planning for the construction. Although the MITS Center was not
directly involved in work zone mobility modeling and planning, they were integral to the effort
through their operation of the real-time and incident management programs.
Several key integration points were identified in the MDOT work zone traffic control modeling
process, including the following:
Integration between MDOT Metro Region Planning, Construction, and Traffic and Safety
to model impacts of construction, select the best work zone traffic control strategies, and
develop operational strategies
Coordination and integration with the Detroit TSC, which is responsible for other Detroit
projects. Some of these were included in the simulation for the Gateway, all required
coordination of traffic plans
Continual integration during construction between MDOT engineers responsible for
construction and MDOT planners responsible for modeling to incorporate construction
changes into the model and develop new work zone traffic control strategies
Use of the existing SEMSIM Paramics network model of southeastern Michigan to
repurpose it for microsimulation of freeway closures.
These groups all worked well in the initial planning stages for construction.
Step 5: Assess Process
The primary performance measure that MDOT used was to determine the overall cost to
motorists based on total delay of the various scenarios. MDOT was able to quantitatively
evaluate the impacts in terms of delay on motorists and commercial vehicles and assign costs to
that delay to measure the economic impacts of construction closures and the various work zone
traffic control strategies. An evaluation of the Gateway simulation model results showed that the
work zone mobility plan for the 90-day period during the complete closure of the I-75/I-96
interchange would save about $1.63 million a day in user costs in just the a.m. and p.m. peak
periods alone. The cost savings provided an effective way to compare different work zone traffic
control strategies against each other, and the potential for monetary savings clearly demonstrated
the benefits of careful modeling and selecting the best work zone traffic control strategies.
MDOT Metro Region Planning, Construction, and Traffic and Safety reviewed the models of
106
closure alternatives for each phase of construction and selected the closure plans based in part on
the impact of the closures on motorist delay and mobility. The selected plans were shared with
the MITS Center before the start of construction to allow them time to develop strategies for the
operation of the system, including how to handle incident management and provide real-time
information.
MDOT recognized that it will be important in the future to develop a tool that will allow field
engineers and technicians to change the model to examine different work zone traffic control
scenarios. While the microsimulation model was effective for this high-budget, high-impact
project, which also had a long planning horizon, other projects with smaller budgets and shorter
planning horizons will require a more flexible approach. Specifically, general project scheduling
and work zone mobility for the annual program, which has multiple simultaneous projects, will
require a more flexible process and technology that will shorten the planning and implementation
cycle.
Step 6: Document Process
The U.S. Department of Transportation (USDOT) Final Rule on Work Zone Safety and Mobility
requires that the impacts of work zones be determined and that transportation management plans
are developed to mitigate those impacts. These new rules require that planning for work zone
mobility start as early as possible, even in the project concept stage. It was critical for MDOT to
understand the impacts of shutting down I-75 and to determine how to set up traffic control and
detour routes in a manner that would have the least impact on the transportation network. The
MDOT work zone traffic control modeling provided several benefits. It provided MDOT with a
quantitative measure of total delay based on a project design, as well as the ability to compare
work zone traffic control strategies and determine options with the least delay.
Step 7: Institutionalize Process
The rapidly changing conditions in the field during construction led to changes from the initial
mitigation plans. The process also allowed the MITS Center to coordinate incident and real-time
management along the detour routes, giving them advance notice of closures and projected
traffic volumes so that they could develop operational strategies. Field engineers and technicians
could not access the model used for developing work zone traffic control strategies. As effective
as the microsimulation model was in this project, without a process in place to continually update
the model based on actual conditions during construction in the field, the model will likely
become out of date on large projects during the construction phase. Organizational changes also
might be considered, such as bringing modeling under the direct control of the users, including
the MDOT Metro Region Traffic and Safety engineers responsible for operational decisions.
Case Study: Kansas Speedway Special-event Traffic Management
Overview/Background:
This case study examines the development of special-event management procedures for races at
the Kansas Speedway. The Kansas Speedway is a 1.5-mi oval race track suitable for many types
of races, including Indy and NASCAR. In 2001, the first NASCAR race was attended by more
than 110,000 people. This set a record as the largest single-day sporting event in the history of
Kansas. Attendance has continued to grow and now exceeds 135,000 for most major races.
107
Events are held throughout the year, and there are typically two major race events each year
when crowds reach capacity. The primary agencies involved in traffic management for the
Kansas Speedway include Kansas Highway Patrol (KHP), Kansas DOT District One (KDOT),
and the Kansas City Police Department. KHP is responsible for traffic management on the
freeways and for operation of the KHP Command Center, which is activated several days before
major events and serves as the central communications center for all public agencies on race day.
KDOT is responsible for maintaining five CCTV cameras and deploying 12 portable DMS
boards on roads used to access the Speedway. The Kansas City Police Department provides
officers for the city street network that links the freeways to the Kansas Speedway
Step 1: Influences
The effort to bring the track to Kansas was a top-down influence, with strong support from the
governor and lieutenant governor. Understanding the importance of accessibility, the governor
directed Kansas DOT to develop a plan to handle race traffic for the Speedway. The priority
placed on this project by the governor’s office served as the first enabler to implementing the
traffic management process. The traffic control strategies that were put into place to handle
these major events were the result of years of planning between the Kansas Speedway, KHP,
KDOT, and the Kansas City Police Department.
Step 2: Define the Specific Reliability Goal(s)
The primary reliability goal that the organizers were trying to achieve was the need to
successfully host large events. The organizers desired to efficiently move race day traffic from
freeways, through arterials, to parking spaces. KDOT intended to maintain throughput of
vehicles traveling on I-70 and track statistics of parking ingress/egress and parking lot clearance
times. Agencies involved in traffic management have improved their efficiency; parking lot
clearance times after races have decreased since the initial race in 2001. Over time there has
been a reduction in the manpower needed to manage traffic.
Step 3: Identify and Document Current Business Processes
Leaders from the various agencies developed an extensive three-layered traffic plan identifying
responsibilities of the KHP and KDOT in developing the initial infrastructure and strategies.
The roles the different agencies played in leading different layers led to a successful special-
event management process. The first layer dealt with interstate traffic, which was KHP’s
responsibility. The second layer dealt with traffic on local streets traveling between the
interstates and the Kansas Speedway, this layer was the responsibility of the Kansas City Police
Department. The third layer handled traffic entering or leaving the track property, which was the
responsibility of the Kansas Speedway. KDOT provided support to all three layers and
identified funding for each of their proposed infrastructure projects, and these projects were
included in the package that was submitted to the International Speedway Corporation. The
major projects included widening I-70, constructing a new interchange at 110th Street, and
realigning US-24, which went through the proposed site of the track. Once the race is
completed, a follow-up meeting to review race day events may be held. This meeting was
originally held after every event during the first few years the Kansas Speedway was in
operation.
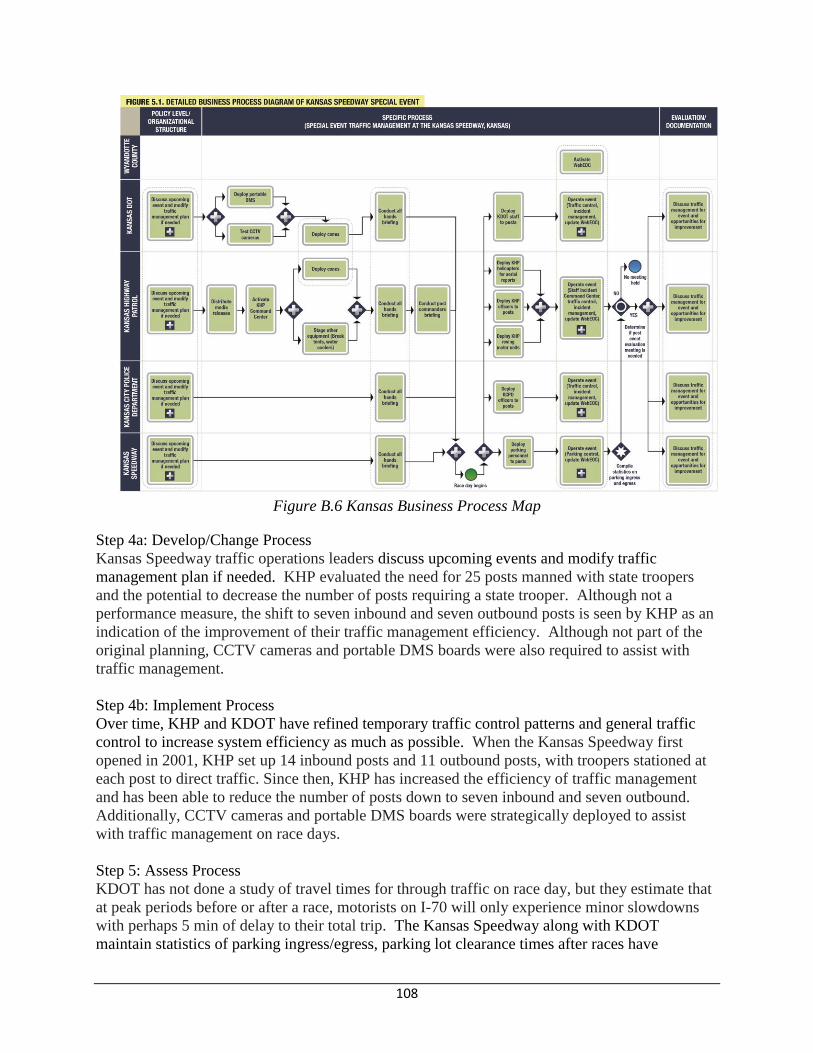
108
Figure B.6 Kansas Business Process Map
Step 4a: Develop/Change Process
Kansas Speedway traffic operations leaders discuss upcoming events and modify traffic
management plan if needed. KHP evaluated the need for 25 posts manned with state troopers
and the potential to decrease the number of posts requiring a state trooper. Although not a
performance measure, the shift to seven inbound and seven outbound posts is seen by KHP as an
indication of the improvement of their traffic management efficiency. Although not part of the
original planning, CCTV cameras and portable DMS boards were also required to assist with
traffic management.
Step 4b: Implement Process
Over time, KHP and KDOT have refined temporary traffic control patterns and general traffic
control to increase system efficiency as much as possible. When the Kansas Speedway first
opened in 2001, KHP set up 14 inbound posts and 11 outbound posts, with troopers stationed at
each post to direct traffic. Since then, KHP has increased the efficiency of traffic management
and has been able to reduce the number of posts down to seven inbound and seven outbound.
Additionally, CCTV cameras and portable DMS boards were strategically deployed to assist
with traffic management on race days.
Step 5: Assess Process
KDOT has not done a study of travel times for through traffic on race day, but they estimate that
at peak periods before or after a race, motorists on I-70 will only experience minor slowdowns
with perhaps 5 min of delay to their total trip. The Kansas Speedway along with KDOT
maintain statistics of parking ingress/egress, parking lot clearance times after races have
109
decreased since initial race in 2001.
Step 6: Document Process
A determination is made on the necessity of a post-evaluation meeting to discuss traffic
management for the event and opportunities for improvement. After races, if something went
wrong or clearance times exceeded normal ranges, this information is shared with KHP and an
evaluation meeting with all agencies involved in the traffic management may be held to review
the traffic management.
Step 7: Institutionalize Process
Development of multiple race-day protocols/policies is particularly important, so that procedures
for handling incidents or other unexpected events are well understood. KHP has worked with
their partners to develop a tow policy to address abandoned vehicles, a traffic crash policy to
quickly clear incidents, and a no-patrol zone to keep troopers and police officers in cruisers from
adding to the congestion around the race track by limiting patrols to troopers on motorcycles.
Case Study: The Palace of Auburn Hills, Special-event Traffic Management (Michigan)
Overview/Background:
The Palace of Auburn Hills (the Palace) is an arena located in Auburn Hills, a suburb of the
greater Detroit, Michigan. The Palace hosts events such as concerts, basketball games, circuses,
and graduations throughout the year. The arena has been operational for over 20 years and can
accommodate over 22,000 fans for basketball games and over 25,000 for concerts. In terms of
traffic operations and management, these types of events can be categorized as scheduled
interruptions to normal traffic flow. Because of the volume of traffic generated by these types of
events, an increase in traffic congestion is typical in the vicinity of the Palace.
The Palace special event case study provides an analysis for a multiagency, public–private
partnership focused on managing traffic for planned events of varying sizes. The current traffic
management plan includes a partnership between the Palace, Police, Road Commission for
Oakland County (RCOC), and Michigan DOT (MDOT) and has resulted in memoranda of
understanding (MOUs) and formal agreements between some of these agencies. The Auburn
Hills Police Department (AHPD) provides security and traffic enforcement for the Palace during
events. AHPD manages the traffic before, during, and after each event, with a focus on providing
efficient and safe access for motorists. The traffic management plan provides a direct connection
between the Police dispatch and the RCOC traffic operations center (TOC). The effectiveness of
the plan allows fewer officers to be used for managing traffic at special events.
Step 1: Influences
The incentive for a new traffic management plan was Needs/opportunities based – the Palace had
a vested interest in streamlining personnel and time required to manage traffic during events.
The Palace had two primary motivations for improving traffic management. The first was the
satisfaction of attendees driving to and from the events and the second was monetary. Since the
Palace pays for the use of AHPD officers to manage traffic at events, there was vested interest in
streamlining the personnel and the time required. The larger events would require a total of 15
officers to work an event and effectively manage traffic. Each intersection required two to three
officers to safely direct traffic to and from the facility (15 officers total). A new traffic
110
management plan would effectively increase mobility and save the Palace money.
Step 2: Define the Specific Reliability Goal(s)
The reliability goal the Palace set out to achieve was more efficient management of traffic during
events. AHPD and the Palace used two specific measures of effectiveness initially to determine
if pre-event traffic was being managed properly. These measures allowed the two agencies to
assess reliability and determine the appropriate area of concern, namely:
1. If traffic was queuing on the public roadway but the Palace driveways had additional
capacity, then traffic was not being managed effectively by the police.
2. If traffic was stopped at the driveways and vehicles were queuing on the public roads,
then the Palace personnel were not effectively managing the parking operations.
For post event traffic, the reliability goal was based on all the access drives clearing at the same
time.
Step 3: Identify and Document Current Business Processes
The Palace, AHPD, and RCOC developed a personalized traffic management plan for events.
The original traffic management plan used several police officers and manual traffic control to
move vehicles through several intersections in the vicinity of the Palace. When the Palace
opened in 1988, AHPD manually controlled traffic in and around the arena using approximately
three to four traffic control police officers per intersection at several intersections (15 officers in
all). In addition, the larger events required at least an hour to move traffic in and out of the
parking facilities. The original site plan included only three driveways, which created some
capacity issues for event traffic ingress and egress. These observations were used to support the
need to increase the access lanes and construct the additional driveway.
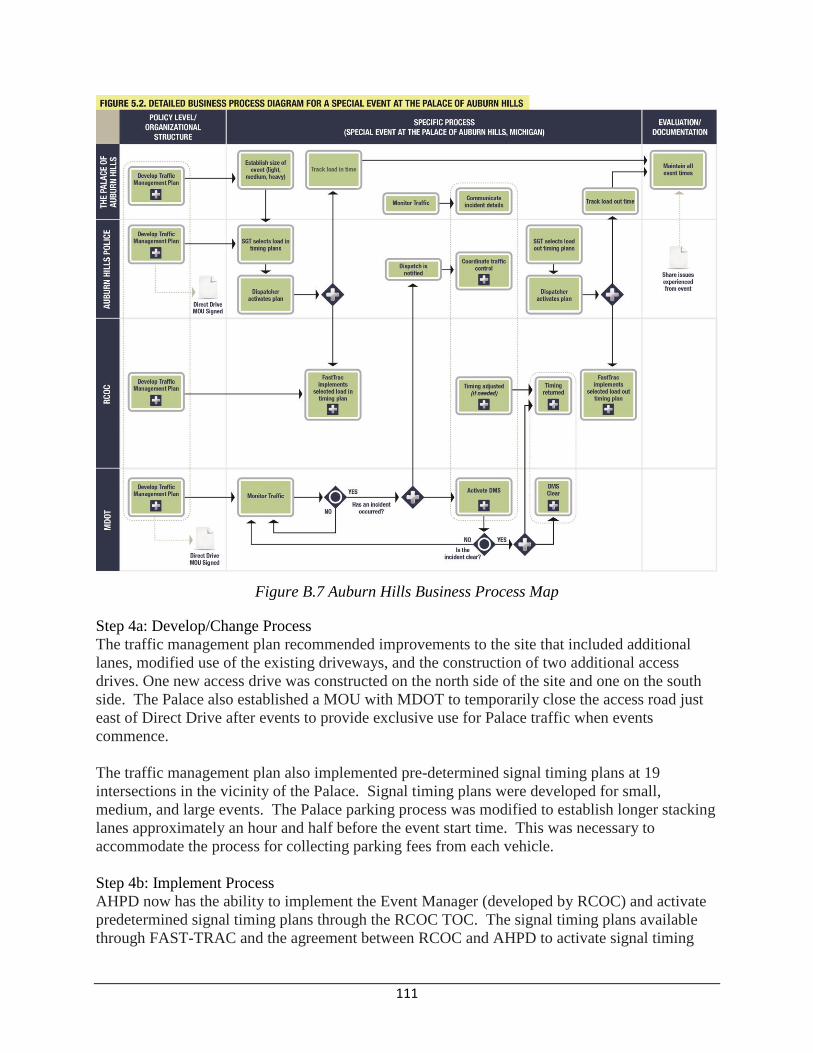
111
Figure B.7 Auburn Hills Business Process Map
Step 4a: Develop/Change Process
The traffic management plan recommended improvements to the site that included additional
lanes, modified use of the existing driveways, and the construction of two additional access
drives. One new access drive was constructed on the north side of the site and one on the south
side. The Palace also established a MOU with MDOT to temporarily close the access road just
east of Direct Drive after events to provide exclusive use for Palace traffic when events
commence.
The traffic management plan also implemented pre-determined signal timing plans at 19
intersections in the vicinity of the Palace. Signal timing plans were developed for small,
medium, and large events. The Palace parking process was modified to establish longer stacking
lanes approximately an hour and half before the event start time. This was necessary to
accommodate the process for collecting parking fees from each vehicle.
Step 4b: Implement Process
AHPD now has the ability to implement the Event Manager (developed by RCOC) and activate
predetermined signal timing plans through the RCOC TOC. The signal timing plans available
through FAST-TRAC and the agreement between RCOC and AHPD to activate signal timing
112
plans remotely via the Event Manager make it possible to improve efficiency. The signal timing
plans are predetermined based on the estimated level of traffic for scheduled events. The signal
timing plans also incorporate additional intersections that were previously not managed during
events.
Step 5: Assess Process
Because the Palace tracks the load-in and load-out times during each event, those times can be
compared to ensure the traffic management plan is working effectively. The Palace documents
the load-in and load-out times for each event that occurs, and has observed that the load-out time
has decreased from approximately 1 hour to less than 25 minutes with the current traffic
management plan. The improved signal timing plans have allowed AHPD to reduce the number
of required traffic control police officers from 15 to no more than two officers for each event.
Emptying the parking lots of the Palace can now be achieved in less than 25 min. In addition,
crash rates have remained consistent with the implementation of the Event Manager. The
Palace’s cost for police personnel also is reduced. The Palace indicated that the savings from the
fewer officers required to control traffic can be redirected to other expenses, such as an extension
of parking facilities or a reduction in ticket costs for events.
The Palace personnel discuss improvements to the traffic management plan with AHPD on a
continuous basis. The continued communication between the Palace, AHPD, and RCOC has
improved operations and resulted in improved mobility for the motorists going to the Palace, as
well as for motorists within the area.
Step 6: Document Process
The Palace maintains records of all events, including the load-in and load-out times. Based on
this documentation, the stakeholders have identified consistent results in the current traffic
management plan. RCOC maintains the event signal timing plans respective to each event size.
These timing plans can be revisited if issues or changing traffic patterns are identified. The
MDOT MITS Center maintains incident records that can be referenced to determine impacts on
the traffic during events. There is no central location for data related to events at the Palace, but
it can be obtained from the individual partners.
Evaluation meetings are held between the Palace personnel and AHPD to share event
issues/experiences.
Step 7: Institutionalize Process
There are four main partners involved in the coordination of events at the Palace of Auburn
Hills. The public–private partnership includes AHPD, the Palace, RCOC, and MDOT. The
Palace is responsible for traffic on arena property, maintaining an arena-specific traffic
management plan, and coordinating with AHPD for implementation. The Palace also has access
to MDOT CCTV cameras so they can monitor traffic conditions on approaching routes. AHPD is
the local police department responsible for traffic control within the city, including the local
interstate routes. RCOC is responsible for county road maintenance and operations of the
countywide signal system. RCOC has developed and programmed event-specific timing plans
relative to the three categories of event sizes and allows AHPD to activate appropriate timing
plans remotely. The MDOT MITS Center is responsible for monitoring the southeastern
Michigan roadway network and uses CCTV cameras and detection for surveillance and DMS
113
and the MiDrive website for sharing traveler information.
Several key integration points were identified in the Palace of Auburn Hills special-event traffic
management process, including the following:
1. Coordination between the Palace and AHPD: Based on guidelines established in the
traffic management plan, the Palace determines the size of an event (small, medium, or
large) and informs AHPD.
2. The AHPD Dispatcher has the ability to activate the predetermined signal timing plans
within FAST-TRAC. The AHPD Sergeant has the authority to select the appropriate
timing plan based on the size of the event and directs the Dispatcher as to which plan to
activate. The AHPD dispatch has a direct connection with FAST-TRAC so RCOC
personnel are not required during most events.
3. Agreements have been established between AHPD, the Palace, and MDOT to share
CCTV camera video images for improved incident management. With this closely
integrated coordination, the issues have decreased and the coordination meetings have
been reduced to only twice a year.
Case Study: I-80 Winter State Line Closures (California and Nevada State Line)
Overview/Background:
Heavy freight traffic heading westbound on I-80 toward the Nevada/California state line needs
advance warning about closures at Donner Summit (7,000 ft), which frequently occur during
hazardous winter storms. During extreme winter snowstorms, conditions pose a significant
hazard for freight and passenger vehicles, and Caltrans will often restrict I-80 for westbound
traffic if weather conditions warrant. Although state-line restrictions and closures and associated
notifications are initiated through Caltrans, if freight and other traffic are not notified in enough
time to find suitable and safe parking or to alter their route to avoid the closure, the impacts on
Nevada DOT (NDOT) roadway facilities as well as local streets in Nevada cities and towns can
be significant.
Freight parking on I-80 during winter weather events not only affects freight drivers who are
trying to maintain their schedules but also affects NDOT’s winter plowing operations, restricts
lane usage by emergency vehicles, and creates hazardous driving conditions for passenger
vehicles.
Step 1: Influences
During the 5-year period between 2002 and 2007, NDOT observed 23 closures on I-80 at the
Nevada/California state line and an additional 31 truck prohibitions resulting from severe winter
weather. There was a definite need to address on-site restriction issues, as well as the need to
provide advance notification to westbound I-80 freight traffic of the state-line closure and the
limited to no parking options in Reno (just east of the Nevada/California state line). NDOT
estimates daily truck traffic of 2,500 vehicles per day on I-80 on a typical winter day. Although
the majority of I-80 within Nevada and near the state line with California is considered rural
(with the exception of the Reno/Sparks metropolitan area), winter weather impacts have the
potential to cause significant congestion if trucks and other vehicles are held in Nevada.
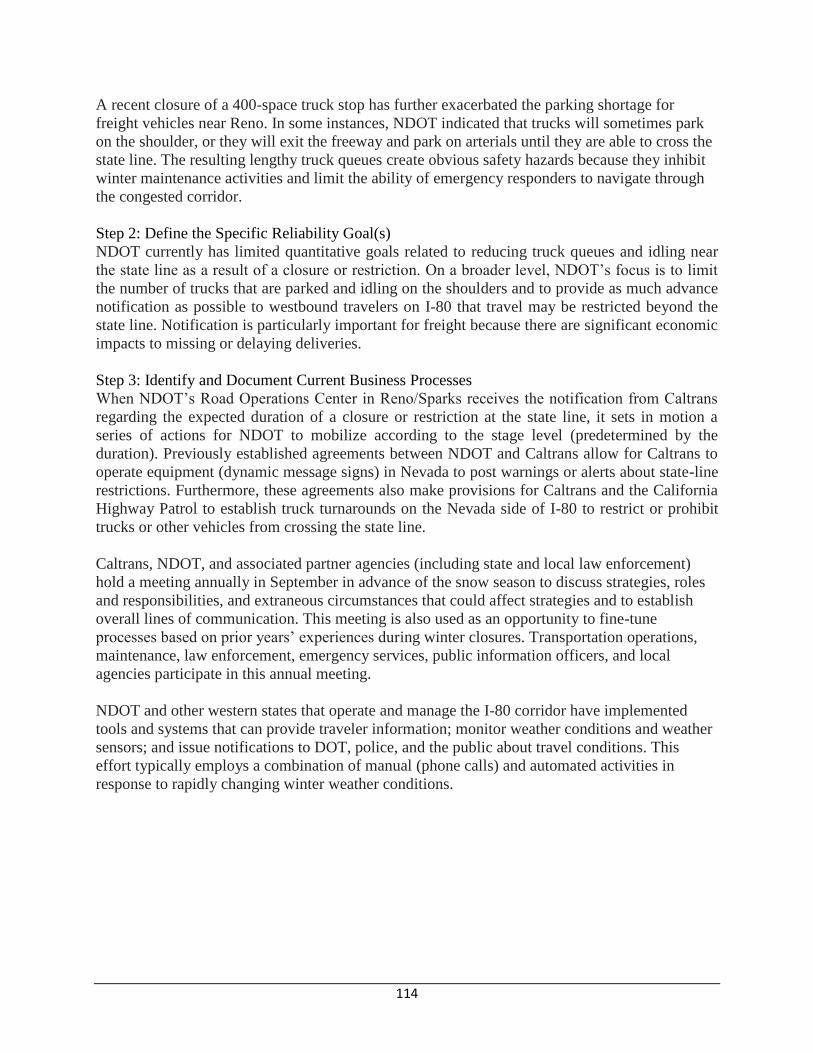
114
A recent closure of a 400-space truck stop has further exacerbated the parking shortage for
freight vehicles near Reno. In some instances, NDOT indicated that trucks will sometimes park
on the shoulder, or they will exit the freeway and park on arterials until they are able to cross the
state line. The resulting lengthy truck queues create obvious safety hazards because they inhibit
winter maintenance activities and limit the ability of emergency responders to navigate through
the congested corridor.
Step 2: Define the Specific Reliability Goal(s)
NDOT currently has limited quantitative goals related to reducing truck queues and idling near
the state line as a result of a closure or restriction. On a broader level, NDOT’s focus is to limit
the number of trucks that are parked and idling on the shoulders and to provide as much advance
notification as possible to westbound travelers on I-80 that travel may be restricted beyond the
state line. Notification is particularly important for freight because there are significant economic
impacts to missing or delaying deliveries.
Step 3: Identify and Document Current Business Processes
When NDOT’s Road Operations Center in Reno/Sparks receives the notification from Caltrans
regarding the expected duration of a closure or restriction at the state line, it sets in motion a
series of actions for NDOT to mobilize according to the stage level (predetermined by the
duration). Previously established agreements between NDOT and Caltrans allow for Caltrans to
operate equipment (dynamic message signs) in Nevada to post warnings or alerts about state-line
restrictions. Furthermore, these agreements also make provisions for Caltrans and the California
Highway Patrol to establish truck turnarounds on the Nevada side of I-80 to restrict or prohibit
trucks or other vehicles from crossing the state line.
Caltrans, NDOT, and associated partner agencies (including state and local law enforcement)
hold a meeting annually in September in advance of the snow season to discuss strategies, roles
and responsibilities, and extraneous circumstances that could affect strategies and to establish
overall lines of communication. This meeting is also used as an opportunity to fine-tune
processes based on prior years’ experiences during winter closures. Transportation operations,
maintenance, law enforcement, emergency services, public information officers, and local
agencies participate in this annual meeting.
NDOT and other western states that operate and manage the I-80 corridor have implemented
tools and systems that can provide traveler information; monitor weather conditions and weather
sensors; and issue notifications to DOT, police, and the public about travel conditions. This
effort typically employs a combination of manual (phone calls) and automated activities in
response to rapidly changing winter weather conditions.
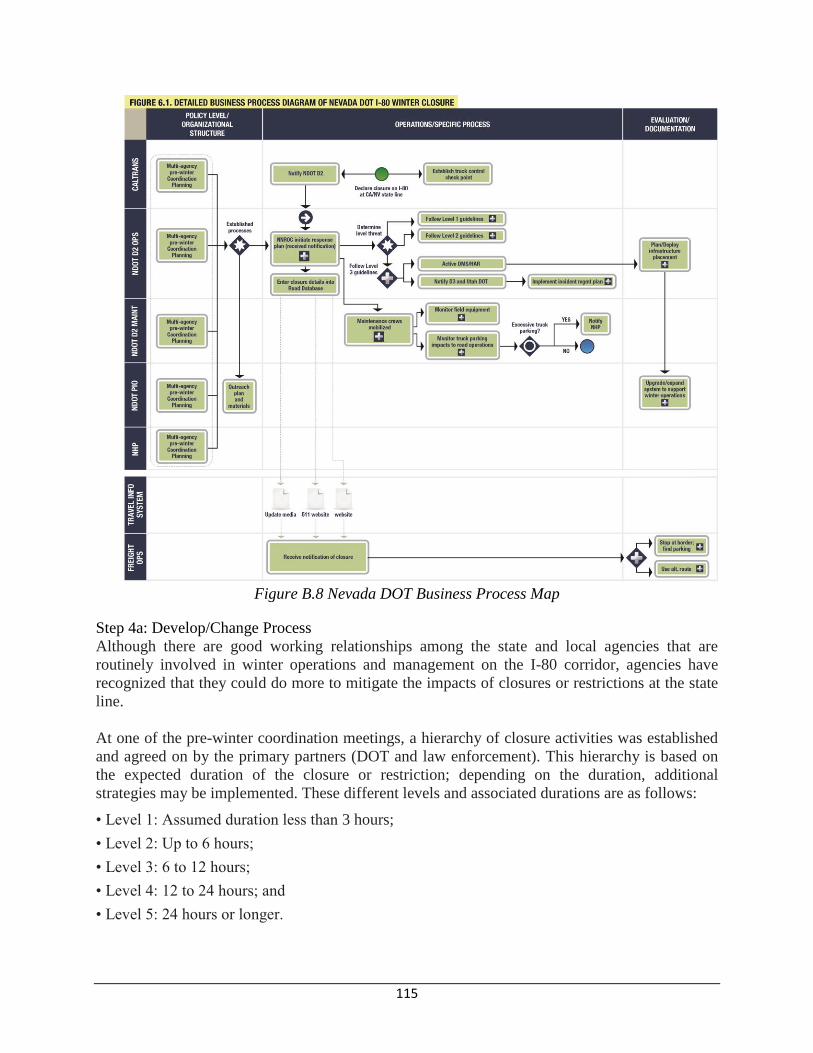
115
Figure B.8 Nevada DOT Business Process Map
Step 4a: Develop/Change Process
Although there are good working relationships among the state and local agencies that are
routinely involved in winter operations and management on the I-80 corridor, agencies have
recognized that they could do more to mitigate the impacts of closures or restrictions at the state
line.
At one of the pre-winter coordination meetings, a hierarchy of closure activities was established
and agreed on by the primary partners (DOT and law enforcement). This hierarchy is based on
the expected duration of the closure or restriction; depending on the duration, additional
strategies may be implemented. These different levels and associated durations are as follows:
• Level 1: Assumed duration less than 3 hours;
• Level 2: Up to 6 hours;
• Level 3: 6 to 12 hours;
• Level 4: 12 to 24 hours; and
• Level 5: 24 hours or longer.
116
Step 4b: Implement Process
For closures or restrictions up to 12 hours, controls are primarily implemented by Caltrans for
the state-line closure or restriction, and NDOT initiates notifications to other agencies and
travelers for westbound traffic. For a Level 3 closure, NDOT dynamic message signs (DMSs)
further east on I-80 are activated by District 2 or 3. For a Level 4 and Level 5 closure, NDOT
and NHP implement Nevada controls and turn trucks away before they reached the Reno area,
while the Caltrans controls are in effect at the state line. For closures or restrictions of 12 hours
or longer, NDOT also notifies the Utah and Wyoming DOTs of the conditions at the
Nevada/California state line, and these states would also initiate notifications using their
respective systems and infrastructure.
Step 5: Assess Process
The recurring nature of these winter events and the long-standing collaboration of the agencies
involved, particularly California and Nevada, allow for ongoing assessment of how various steps
in the I-80 winter operations and management are working. On an event-by-event basis, NDOT
examines how its internal processes have worked, and, on at least an annual basis, agencies are
able to meet and discuss the prior year’s activities and identify opportunities to modify or
enhance plans and procedures. The duration hierarchy is a direct result of a need to provide
specific guidelines to indicate when certain strategies should be implemented.
Nevada and California can measure public usage of their information tools (including web-based
and phone-based traveler information systems) during these major winter events and can also
track the number of notifications issued and the number of truck stops on their distribution list.
Highway patrols can track the number of incidents or callouts through their dispatch systems.
NDOT does monitor queue length of trucks on I-80 when there is a closure or restriction on the
state line, although as yet there are no formal performance monitoring processes to enable
comparing queue lengths with queues in prior closures or restrictions.
Step 6: Document Process
Processes for I-80 winter operations and management are well documented. The outcomes of the
planning meetings are shared with affected agencies, and the established duration levels allow
agencies to tailor operational procedures to meet the needs of those specific closure or restriction
durations. Moreover, a more formal agreement that has been in place for many years between
Caltrans and NDOT allows for joint operations of equipment and for Caltrans personnel to
activate restrictions and turnarounds on Nevada’s portion of I-80. Operational procedures within
NDOT at the Road Operations Centers also capture the steps required to initiate various
notifications, update traveler information systems, or involve other divisions or agencies.
Step 7: Institutionalize Process
The need to effectively operate and manage the I-80 corridor during winter has been the impetus
for ongoing collaboration among multiple state DOTs, interagency cooperation, and the
establishment of operational procedures that expedite notifications of corridor conditions.
Partners on the I-80 corridor work cooperatively and have made a focused effort at implementing
and integrating processes within and outside their agencies in order to achieve the broader
objective of reducing truck queues and idling during state-line restrictions.
117
A long-standing agreement between Caltrans and NDOT established the initial framework for
cooperative management strategies and enabled Caltrans to set up checkpoints and truck
turnaround points in Nevada. A cooperative venture between Caltrans and NDOT installed three
DMSs on I-80 just east of the state line. Caltrans has remote access to these signs in Nevada to
be able to post messages about state-line closures or restrictions for westbound traffic. It is the
ongoing collaboration throughout the pre-winter strategies that allows agencies in both states to
continually review and refine these processes and procedures.
The operations and management needs on this corridor have extended to planning and
programmatic processes and have been the primary justification for enhanced communications
and infrastructure in Nevada on I-80. Corridor information needs along I-80 have resulted in
NDOT Districts 2 and 3 installing permanent DMSs and highway advisory radio on westbound I-
80, with an increased number of flashing beacons that are activated during state-line closures on
the segment of I-80 in District 2 approaching the Reno area. The need to provide more
comprehensive and timely information to freight traffic has also inspired some key
enhancements to NDOT’s 511 and web traveler information system.
Case Study: AZTech Regional Archived Data Server (Arizona)
Overview/Background:
The AZTech Regional Archived Data Server (RADS) was selected as a case study to
demonstrate how various agency processes and operations functions are enhanced through the
ability to view and exchange real-time data from adjacent jurisdictions. From the state
perspective, Arizona DOT operates a robust freeway management system that supports
operations during recurring and nonrecurring congestion, including real-time detection, traveler
information, incident management and response strategies, and planned event management.
Coordinated and effective arterial operations are also a significant part of the region’s
transportation operations and management strategy. Many local agencies within the Phoenix
metropolitan area operate independent traffic signal management systems; many also use CCTV
cameras and DMS and operate web-based traveler information systems. Agencies within the
AZTech partnership include Arizona DOT, Maricopa County DOT, the Maricopa Association of
Governments, Valley Metro/Regional Public Transportation Authority, several cities, and state
and local law enforcement and emergency response agencies.
One unique element to the AZTech program is the use of a regional database to support real-time
information sharing among partner agencies. Agencies in the region determined it would not be
financially feasible, nor would it be a viable option from an information technology security
standpoint to implement individual connections between agencies to share transportation data. A
Regional Archived Data Server was established to archive data generated by local and state
agency transportation management systems. Initially, the RADS was intended to serve as a
regional data archive and to provide a repository for regional data that would be populated by
local systems. Agencies in the region also could retrieve archived data from the server to
support planning and analysis activities. The RADS has since evolved into a data engine that is
supporting real-time information exchanges among agencies for transportation network
operations data.
118
Step 1: Influences
AZTech was established in Phoenix, Arizona, and influenced in a top down nature as part of the
federally funded Metropolitan Model Deployment Initiatives in 1996. A federal interoperability
grant was awarded to the AZTech partnership; Arizona DOT and Maricopa County DOT
focused the grant funds on enhancements to information sharing between public safety and
transportation management agencies in the Phoenix region.
Step 2: Define the Specific Reliability Goal(s)
The reliability goal AZTech wants to achieve is to minimize the impact of nonrecurring
congestion on travel time reliability. There are several aspects to the AZTech program that are
focused on improving travel time reliability in the Phoenix metropolitan area. This helps to
support both recurring and nonrecurring congestion management on arterials and promotes a
more coordinated operations approach.
Step 3: Identify and Document Current Business Processes
Maricopa County DOT and Arizona DOT were the two primary partner agencies responsible for
the RADS development, operations, and maintenance. Maricopa has operated a TMC for more
than 10 years and also operates traffic signals, DMS, and CCTV cameras on county-owned
facilities. Arizona DOT is responsible for operating and managing state owned transportation
facilities, which includes urban area freeways and rural interstate and highway corridors. Within
the Phoenix metropolitan area, Arizona DOT operates the freeway management system. Arizona
DOT’s freeway management system uses an algorithm that can detect major slowdowns in
freeway speeds where there are detectors; however, this does not provide any information about
the nature of the incident or potential impacts. From an arterial operations standpoint,
information about arterial incidents and impacts was not readily available, and each city had
varying levels of coordination between traffic operations staff and law enforcement and
emergency response staff.
Maricopa County DOT initiated the development of the RADS database, and Arizona DOT is a
key partner in operating, maintaining, and enhancing the capabilities of that system. Arizona
DOT generates a substantial amount of real-time data that is used by the Arizona DOT Traffic
Operations Center. The figure below shows a series of processes that result from agencies using
data from the RADS database.
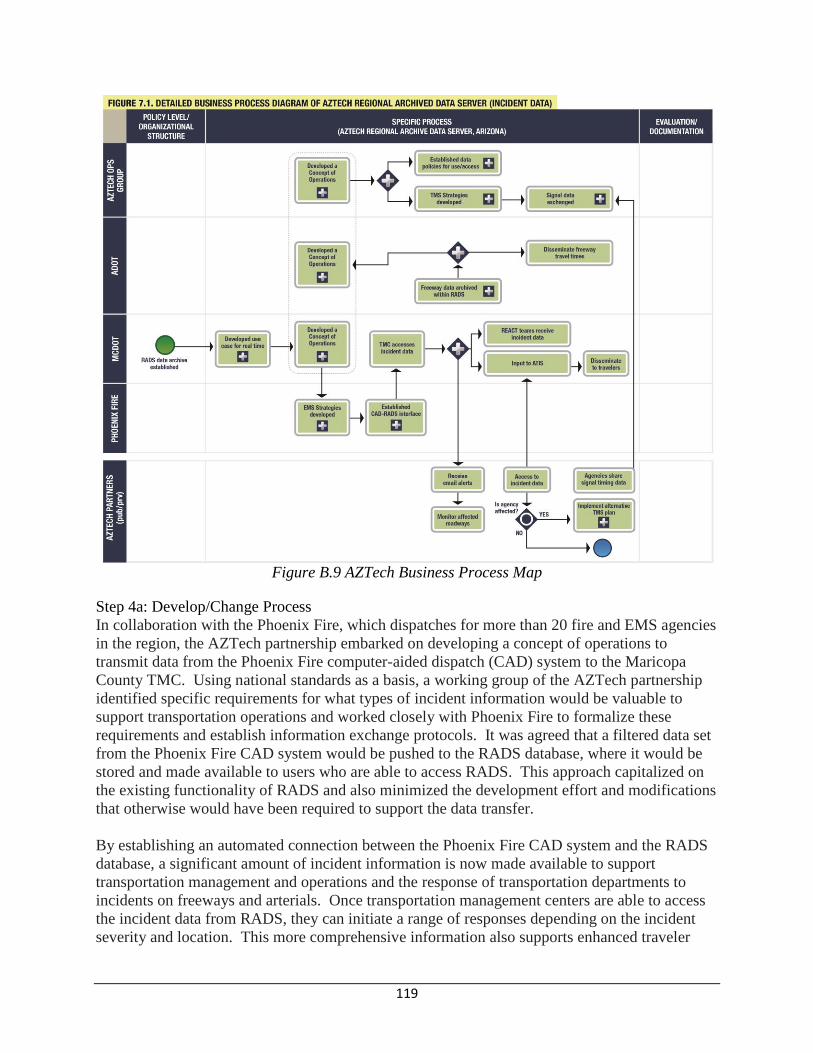
119
Figure B.9 AZTech Business Process Map
Step 4a: Develop/Change Process
In collaboration with the Phoenix Fire, which dispatches for more than 20 fire and EMS agencies
in the region, the AZTech partnership embarked on developing a concept of operations to
transmit data from the Phoenix Fire computer-aided dispatch (CAD) system to the Maricopa
County TMC. Using national standards as a basis, a working group of the AZTech partnership
identified specific requirements for what types of incident information would be valuable to
support transportation operations and worked closely with Phoenix Fire to formalize these
requirements and establish information exchange protocols. It was agreed that a filtered data set
from the Phoenix Fire CAD system would be pushed to the RADS database, where it would be
stored and made available to users who are able to access RADS. This approach capitalized on
the existing functionality of RADS and also minimized the development effort and modifications
that otherwise would have been required to support the data transfer.
By establishing an automated connection between the Phoenix Fire CAD system and the RADS
database, a significant amount of incident information is now made available to support
transportation management and operations and the response of transportation departments to
incidents on freeways and arterials. Once transportation management centers are able to access
the incident data from RADS, they can initiate a range of responses depending on the incident
severity and location. This more comprehensive information also supports enhanced traveler
120
information to the public. Maricopa County DOT will issue e-mail alerts for major incidents to
subscribers. Data are also made available to other systems that push incident details to Arizona’s
511 service and web-based traveler information system (www.az511.gov).
Step 4b: Implement Process
Dispatchers at the Phoenix Fire Communications Center receive and initiate responses to 911
calls. Initial information is entered into the CAD system, which includes several fields. As the
dispatcher receives more information about incident details and what types of units are being
dispatched to respond (fire engines, fire ladder trucks, chief, ambulance), they update the CAD to
reflect the current status, severity, and impacts of the incident. The automated feed from the
CAD system filters certain data before sending the data set to the RADS database; this
minimizes issues with regard to victim privacy, and it minimizes any potential compromises to
the response as a result of information about the incident being distributed.
With the implementation of RADS and establishing automated data feeds between data providers
and end users (including TMCs, media, and traveler information systems), Maricopa County
DOT and Arizona DOT were able to automate several business processes, as well as provide for
enhanced process integration as a result of having more comprehensive incident details on the
region’s transportation network. From a recurring congestion standpoint, RADS also supports
more coordinated agency operations for day-to-day travel conditions. Having access to
neighboring jurisdictions’ traffic signal timing plans supports better cross-jurisdictional signal
timing and coordination without compromising each agency’s control of its signal management
systems
Step 5: Assess Process
Up-to-date and near-real-time information about incidents affecting arterials and freeways in the
Phoenix metropolitan area represented a significant gap that needed to be addressed. There was
a need to be able to capture data about incidents in a way that was automated and could provide
broad coverage throughout the metropolitan area; many of the region’s key arterials traverse
more than one jurisdiction, so it is likely that a major incident could potentially affect multiple
traffic management agencies. Maricopa County DOT tracks the number of incidents input to
RADS from the Phoenix Fire CAD on a monthly basis. Incident inputs to RADS from this data
feed average between 2,500 and 3,000 per month. The Maricopa County DOT has a broader
performance monitoring program that also tracks the number of responses of its incident
management crews and the number of incident e-mail alerts distributed to its mailing list, both of
which depend on incident information received from the Phoenix Fire CAD data feed. Arizona
DOT tracks detector congestion data and travel times to be able to view mobility trends for urban
freeways. Arizona also monitors its 511 phone and website activity. Arizona DOT estimates
that there are 400 incident messages more per month broadcast on 511 and www.az511.gov with
the addition of the Phoenix Fire data feed.
Step 6: Document Process
Design for the interface to the Phoenix Fire CAD data feed to RADS was documented as part of
an April 2006 publication entitled Emergency Management System Center-to-Center Interface
Module, Phoenix Fire Dispatch System Design. This document included a mapping for the CAD
fields to International Traveler Information System (ITIS) codes that could then be supported by
121
Arizona DOT and Maricopa County DOT systems. A formal MOU was established between
Phoenix Fire and Maricopa County DOT to share CAD data from Fire with the RADS database.
As part of this MOU, data sharing parameters were outlined, including recognition by
transportation agencies that they would be able to access a filtered data feed about arterial
incidents, and recognition by Phoenix Fire that incident data provided to RADS would be shared
with several external entities. Multiple data types are stored in the RADS database to support
traffic management, incident management and response, and traveler information alerts and
notifications. Traffic signal data is beginning to be stored on the RADS database, which allows
agencies to share information about current traffic signal timing plans for better coordination on
cross-jurisdictional corridors.
Step 7: Institutionalize Process
The institutional framework established by the AZTech partnership has been the key contributor
to implementing the systems. Agencies in the Phoenix metropolitan area operate various traffic
control and management systems, and direct interfaces between agencies to share these data are
not feasible, nor are they an option that agencies are interested in exploring. RADS provides a
neutral, centralized platform where agencies can access data. Establishing the data transfer from
the Phoenix Fire CAD system to RADS represents a very key integration of multiple agency
processes. The RADS database has been configured to produce a data set suitable to transmit to
other systems, as well as to be viewed by operators at TMCs to ascertain potential impacts to
street networks and initiate an appropriate response from the city and county crews, which could
include maintenance support for incident cleanup or specialized response teams to support
emergency traffic management near a major incident.
The RADS receives updated information from the CAD system every minute, and information
that is sent to TMCs or traveler information systems is updated accordingly. There could be
multiple incidents active within the CAD system; the data set is automatically updated with all
active incidents and any changes in status. Operators at the Phoenix Fire Communications
Center are responsible for entering and updating incident information as more details emerge
from 911 callers and from fire and EMS responders. With the development work completed to
establish the data feed, there is no impact on Phoenix Fire dispatcher operations to provide the
data; an automated push is built into the system, which then populates the RADS database and
makes that information available to outside entities to support a range of other operations and
response processes.
Case Study: San Pablo Avenue Signal Retiming (California)
Overview/Background:
The San Pablo Avenue Corridor case study focuses on a multiagency approach to the
development of a corridor signal timing plan. Retiming on the corridor was funded through the
Metropolitan Transportation Commission (MTC) Regional Signal Timing Program (RSTP).
MTC supports the efforts to improve the operations, safety, and management of the Bay Area’s
arterial network. Through the RSTP, MTC provides support to hire, fund, and manage
performance monitoring on behalf of the local agencies. Through the application process, MTC
encourages multiagency coordination for consistency among neighboring jurisdictions. MTC’s
122
primary goal through the RSTP is to optimize signal coordination through effective partnerships
between multiple entities. This corridor was selected as a case study based on the multiple-
agency support of the program and its successful integration across several jurisdictions along
the corridor. The San Pablo Avenue Corridor is one of three main arterial corridors identified as
part of the SMART Corridor Program. The SMART Corridor Program is a regional initiative to
assemble stakeholders from several local agencies to focus on improving congestion along three
major arterial corridors. The Alameda County Congestion Management Association (ACCMA)
is closely involved with the SMART Corridor Program and led the application effort to retime
the San Pablo Avenue Corridor using the RSTP as a funding mechanism.
The corridor consists of 13 miles of San Pablo Avenue from 17th
Street in the city of Oakland to
Highway 4 in the city of Hercules. A portion of the corridor is signed State Route 123 and is
maintained by Caltrans. The other portions of the corridor traverse through 10 local-agency
jurisdictions. The corridor runs through multiple jurisdictions, includes traffic signals on
municipal and Caltrans roadways, and required coordination across 13 different agencies. The
development of the signal timing plan was funded by the MTC RSTP and was led by ACCMA.
The corridor also included transit signal priority for the Alameda Contra Costa Transit District.
Step 1: Influences
The coordinated signal timing plan was influenced from the top down; the SMART Corridor
Program identified San Pablo Avenue as a key corridor with the need for a revised signal timing
plan. ACCMA successfully applied for the RSTP funds to revise the San Pablo Avenue signal
timing plan.
Step 2: Define the Specific Reliability Goal(s)
The reliability goal of the San Pablo Corridor project is directly focused on addressing recurring
congestion but has indirect impacts on several nonrecurring congestion types. The inter-agency
coordination, relationships, and improved signal timing plans on all the major arterials will
improve the travel time reliability
Step 3: Identify and Document Current Business Processes
MTC’s primary goal through the RSTP is to optimize signal coordination through effective
partnerships between multiple entities. Through the application process, MTC encourages
multiagency coordination for consistency among neighboring jurisdictions. MTC remains
involved only to the level needed for success of the project. If necessary, MTC can serve as a
facilitator between the consultant and the applicant group or between local agencies participating
in the retiming. Typically, the projects will last approximately 12 months but can extend longer.
The figure below shows the process used by MTC for corridor signal retiming.
The SMART Corridor Program is the first integration point that fed into the success of the
corridor timing project. The strong relationships developed through these regularly scheduled
meetings paved the way for successful partnerships and well-developed timing plans. The
SMART Corridor Program (SCP) is conducted through regularly scheduled meetings focused on
developing and implementing projects that improve the identified major arterials.
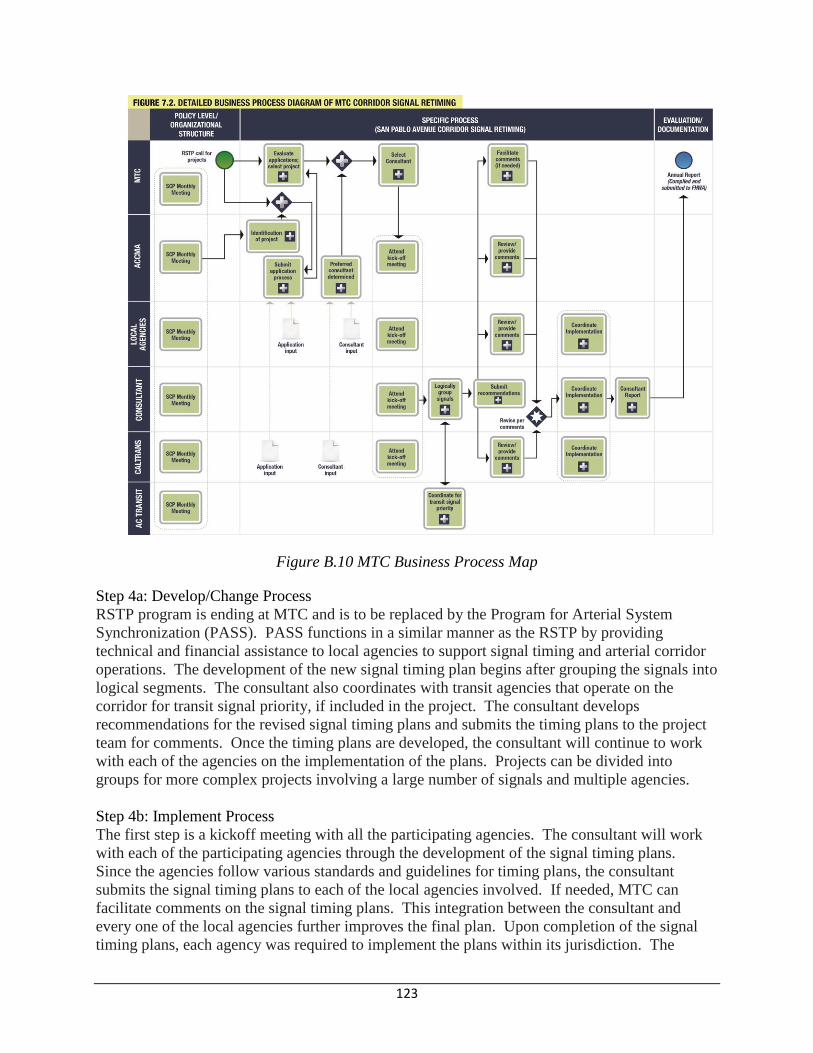
123
Figure B.10 MTC Business Process Map
Step 4a: Develop/Change Process
RSTP program is ending at MTC and is to be replaced by the Program for Arterial System
Synchronization (PASS). PASS functions in a similar manner as the RSTP by providing
technical and financial assistance to local agencies to support signal timing and arterial corridor
operations. The development of the new signal timing plan begins after grouping the signals into
logical segments. The consultant also coordinates with transit agencies that operate on the
corridor for transit signal priority, if included in the project. The consultant develops
recommendations for the revised signal timing plans and submits the timing plans to the project
team for comments. Once the timing plans are developed, the consultant will continue to work
with each of the agencies on the implementation of the plans. Projects can be divided into
groups for more complex projects involving a large number of signals and multiple agencies.
Step 4b: Implement Process
The first step is a kickoff meeting with all the participating agencies. The consultant will work
with each of the participating agencies through the development of the signal timing plans.
Since the agencies follow various standards and guidelines for timing plans, the consultant
submits the signal timing plans to each of the local agencies involved. If needed, MTC can
facilitate comments on the signal timing plans. This integration between the consultant and
every one of the local agencies further improves the final plan. Upon completion of the signal
timing plans, each agency was required to implement the plans within its jurisdiction. The
124
consultant coordinates directly with each agency to implement the final signal timing plans.
Step 5: Assess Process
The improved corridor timing plans will maximize the corridor capacity during normal operating
procedures. The emergency vehicle preemption will minimize impacts on travel times during
major incidents that require emergency management or first responders to easily access all
segments of the corridor. The quicker these vehicles arrive at the scene of an incident, the
quicker they can clear the incident and return traffic operations to normal. Finally, the use of
transit signal priority improves the travel time reliability for the transit users along these
corridors. Transit signal priority only elongates the green phase when transit vehicles are behind
schedule. Therefore, it will improve the timeliness of the bus arrivals for delayed vehicles and
minimize the interruption to normal signal operations by only affecting the green phase.
The largest impacts of the program are quantified at a regional level. Each of the corridors has
shown increases in its capacity and travel time reliability, but assembling the regional benefits
demonstrates the true impacts of the program. MTC has seen a 10% improvement in travel time
for the region. From a regional view, the 10% improvement on travel time for a 60-min trip
across the region for multiple vehicles is a greater impact than a 10% improvement for a single
vehicle making a 10-min trip on one corridor. The 2004 annual report stated a 13%
improvement in travel time and a 13% decrease in fuel consumption. The latest report shows an
improvement of 10% in travel time and 10% increase in speed.
Step 6: Document Process
At the conclusion of the signal timing plan implementation, a summary report of the process is
required by MTC. A final report is prepared including the recommendations, the implementation
process, and measured improvements on the corridor using information from the summary
report. The final report is submitted to MTC and includes information regarding which projects
were completed, improvements to travel times, fuel savings, and emissions reduction for the
corridor and the region. The MTC also compiles the benefit-cost analysis from all completed
projects into an annual report. Several performance measures indicate how the public will judge
the project and indirectly how the public will support similar projects in the future. The annual
report is then submitted to the Operations Committee of MTC and FHWA.
Step 7: Institutionalize Process
The most effective means of coordinating traffic signals at intersections within several different
jurisdictions is the installation of a GPS/time clock. The use of the time clock eliminates the
need for interconnection between the signals. Despite the effectiveness gained by the installation
of the time clock, interconnected communication between all the signals could further improve
coordination strategies on several of the corridors. At the time this case study was prepared, an
estimated 50% of the 7,500 signals were interconnected. The cost to expand communication
would be approximately $10,000 per project. One recommendation is to develop a program that
would fund the installation of interconnected equipment. Until those funds are made available,
the region will continue to pursue the use of GPS/time clocks to manage corridors within
multiple jurisdictions. Consistent results experienced from reliable communication between
personnel to personnel; field equipment to field equipment; and personnel to field equipment has
established a well-integrated regional timing plan.
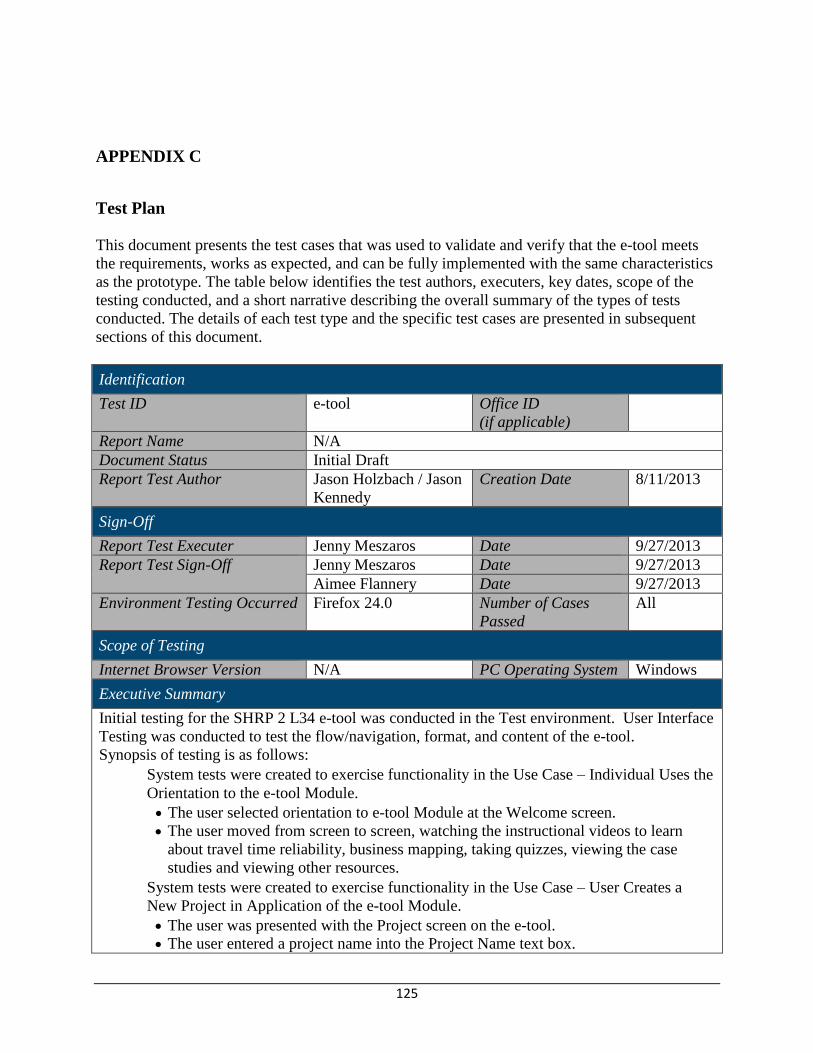
125
APPENDIX C
Test Plan
This document presents the test cases that was used to validate and verify that the e-tool meets
the requirements, works as expected, and can be fully implemented with the same characteristics
as the prototype. The table below identifies the test authors, executers, key dates, scope of the
testing conducted, and a short narrative describing the overall summary of the types of tests
conducted. The details of each test type and the specific test cases are presented in subsequent
sections of this document.
Identification
Test ID e-tool Office ID
(if applicable)
Report Name N/A
Document Status Initial Draft
Report Test Author Jason Holzbach / Jason
Kennedy
Creation Date 8/11/2013
Sign-Off
Report Test Executer Jenny Meszaros Date 9/27/2013
Report Test Sign-Off Jenny Meszaros Date 9/27/2013
Aimee Flannery Date 9/27/2013
Environment Testing Occurred Firefox 24.0 Number of Cases
Passed
All
Scope of Testing
Internet Browser Version N/A PC Operating System Windows
Executive Summary
Initial testing for the SHRP 2 L34 e-tool was conducted in the Test environment. User Interface
Testing was conducted to test the flow/navigation, format, and content of the e-tool.
Synopsis of testing is as follows:
System tests were created to exercise functionality in the Use Case – Individual Uses the
Orientation to the e-tool Module.
The user selected orientation to e-tool Module at the Welcome screen.
The user moved from screen to screen, watching the instructional videos to learn
about travel time reliability, business mapping, taking quizzes, viewing the case
studies and viewing other resources.
System tests were created to exercise functionality in the Use Case – User Creates a
New Project in Application of the e-tool Module.
The user was presented with the Project screen on the e-tool.
The user entered a project name into the Project Name text box.
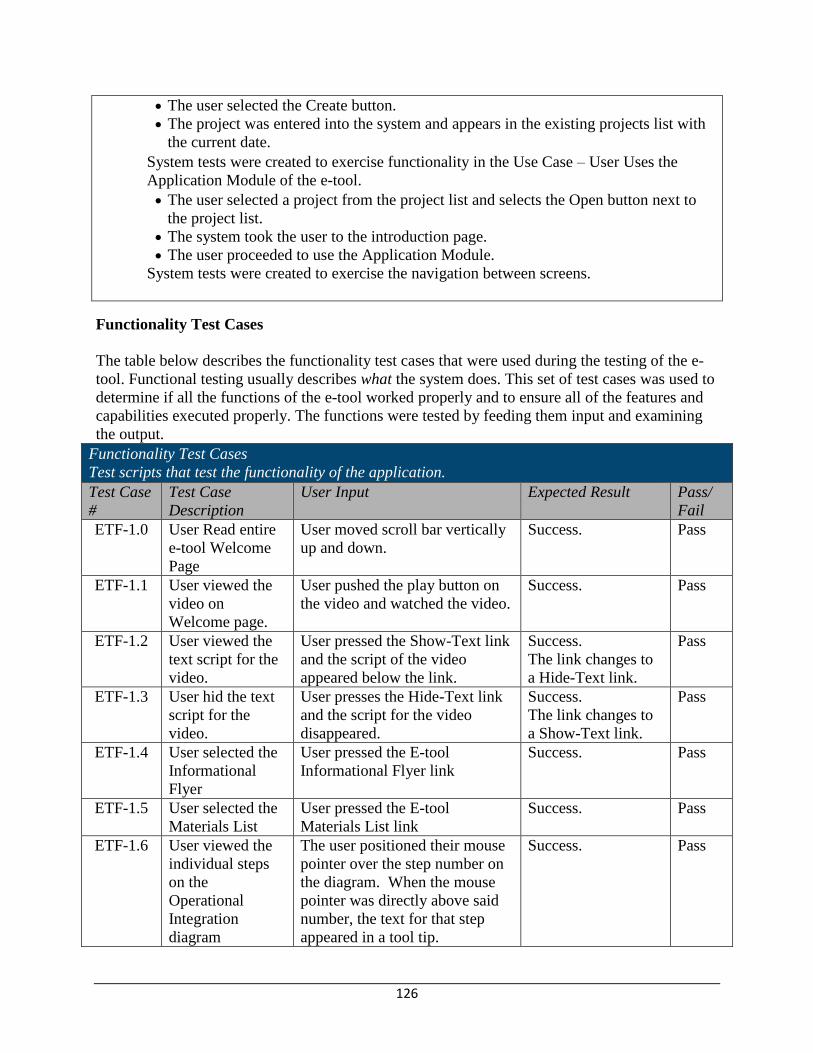
126
The user selected the Create button.
The project was entered into the system and appears in the existing projects list with
the current date.
System tests were created to exercise functionality in the Use Case – User Uses the
Application Module of the e-tool.
The user selected a project from the project list and selects the Open button next to
the project list.
The system took the user to the introduction page.
The user proceeded to use the Application Module.
System tests were created to exercise the navigation between screens.
Functionality Test Cases
The table below describes the functionality test cases that were used during the testing of the e-
tool. Functional testing usually describes what the system does. This set of test cases was used to
determine if all the functions of the e-tool worked properly and to ensure all of the features and
capabilities executed properly. The functions were tested by feeding them input and examining
the output.
Functionality Test Cases
Test scripts that test the functionality of the application.
Test Case
#
Test Case
Description
User Input Expected Result Pass/
Fail
ETF-1.0 User Read entire
e-tool Welcome
Page
User moved scroll bar vertically
up and down.
Success. Pass
ETF-1.1 User viewed the
video on
Welcome page.
User pushed the play button on
the video and watched the video.
Success. Pass
ETF-1.2 User viewed the
text script for the
video.
User pressed the Show-Text link
and the script of the video
appeared below the link.
Success.
The link changes to
a Hide-Text link.
Pass
ETF-1.3 User hid the text
script for the
video.
User presses the Hide-Text link
and the script for the video
disappeared.
Success.
The link changes to
a Show-Text link.
Pass
ETF-1.4 User selected the
Informational
Flyer
User pressed the E-tool
Informational Flyer link
Success. Pass
ETF-1.5 User selected the
Materials List
User pressed the E-tool
Materials List link
Success. Pass
ETF-1.6 User viewed the
individual steps
on the
Operational
Integration
diagram
The user positioned their mouse
pointer over the step number on
the diagram. When the mouse
pointer was directly above said
number, the text for that step
appeared in a tool tip.
Success. Pass
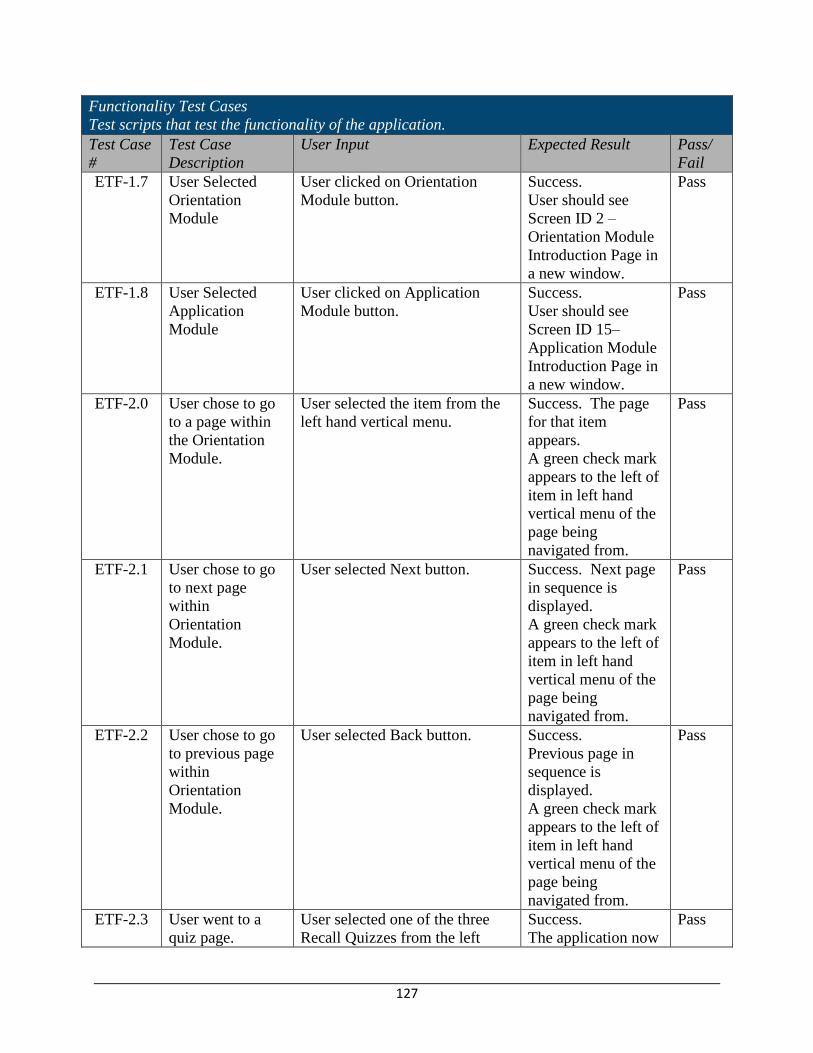
127
Functionality Test Cases
Test scripts that test the functionality of the application.
Test Case
#
Test Case
Description
User Input Expected Result Pass/
Fail
ETF-1.7 User Selected
Orientation
Module
User clicked on Orientation
Module button.
Success.
User should see
Screen ID 2 –
Orientation Module
Introduction Page in
a new window.
Pass
ETF-1.8 User Selected
Application
Module
User clicked on Application
Module button.
Success.
User should see
Screen ID 15–
Application Module
Introduction Page in
a new window.
Pass
ETF-2.0 User chose to go
to a page within
the Orientation
Module.
User selected the item from the
left hand vertical menu.
Success. The page
for that item
appears.
A green check mark
appears to the left of
item in left hand
vertical menu of the
page being
navigated from.
Pass
ETF-2.1 User chose to go
to next page
within
Orientation
Module.
User selected Next button. Success. Next page
in sequence is
displayed.
A green check mark
appears to the left of
item in left hand
vertical menu of the
page being
navigated from.
Pass
ETF-2.2 User chose to go
to previous page
within
Orientation
Module.
User selected Back button. Success.
Previous page in
sequence is
displayed.
A green check mark
appears to the left of
item in left hand
vertical menu of the
page being
navigated from.
Pass
ETF-2.3 User went to a
quiz page.
User selected one of the three
Recall Quizzes from the left
Success.
The application now
Pass
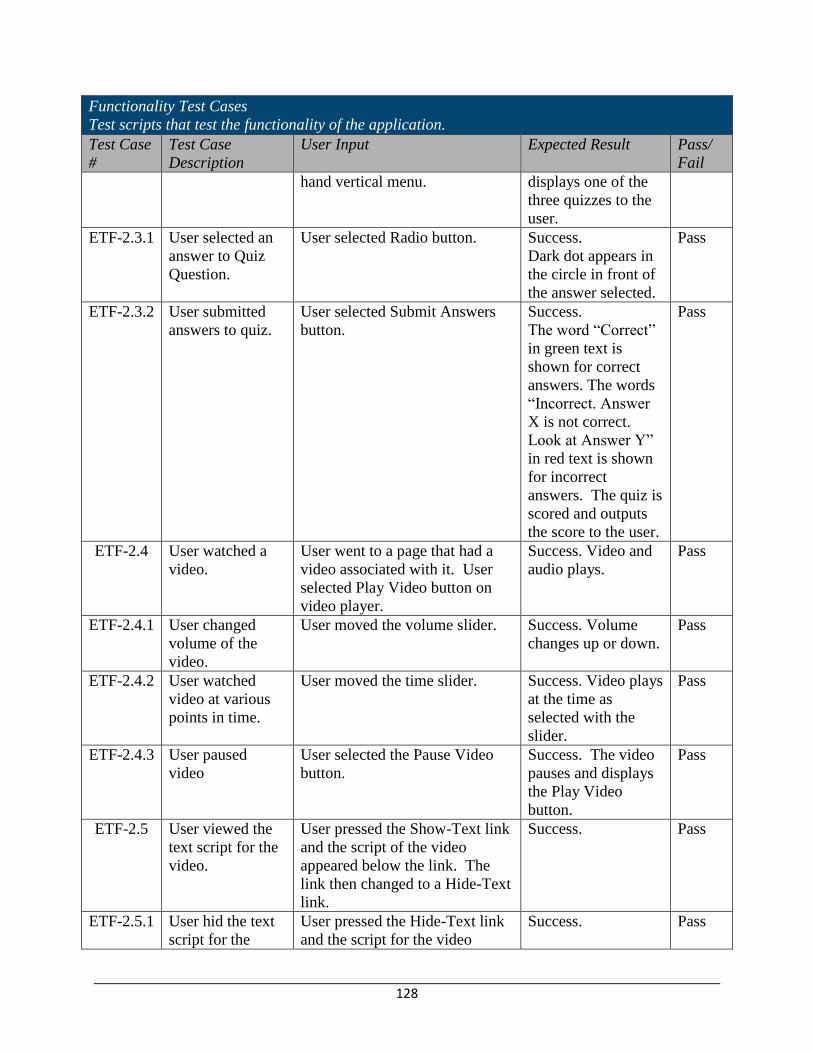
128
Functionality Test Cases
Test scripts that test the functionality of the application.
Test Case
#
Test Case
Description
User Input Expected Result Pass/
Fail
hand vertical menu. displays one of the
three quizzes to the
user.
ETF-2.3.1 User selected an
answer to Quiz
Question.
User selected Radio button. Success.
Dark dot appears in
the circle in front of
the answer selected.
Pass
ETF-2.3.2 User submitted
answers to quiz.
User selected Submit Answers
button.
Success.
The word “Correct”
in green text is
shown for correct
answers. The words
“Incorrect. Answer
X is not correct.
Look at Answer Y”
in red text is shown
for incorrect
answers. The quiz is
scored and outputs
the score to the user.
Pass
ETF-2.4 User watched a
video.
User went to a page that had a
video associated with it. User
selected Play Video button on
video player.
Success. Video and
audio plays.
Pass
ETF-2.4.1 User changed
volume of the
video.
User moved the volume slider. Success. Volume
changes up or down.
Pass
ETF-2.4.2 User watched
video at various
points in time.
User moved the time slider. Success. Video plays
at the time as
selected with the
slider.
Pass
ETF-2.4.3 User paused
video
User selected the Pause Video
button.
Success. The video
pauses and displays
the Play Video
button.
Pass
ETF-2.5 User viewed the
text script for the
video.
User pressed the Show-Text link
and the script of the video
appeared below the link. The
link then changed to a Hide-Text
link.
Success. Pass
ETF-2.5.1 User hid the text
script for the
User pressed the Hide-Text link
and the script for the video
Success. Pass

129
Functionality Test Cases
Test scripts that test the functionality of the application.
Test Case
#
Test Case
Description
User Input Expected Result Pass/
Fail
video. disappeared. The link then
changed to a Show-Text link.
ETF-2.6 User selected
resources URL
when connected
to the internet.
User went to the Resources page.
User selected URL of the
resource desired.
Success.
User should see the
PDF.
Pass
ETF-2.6.1 User selected
resources URL
when not
connected to the
internet.
User went to the Resources page.
User selected URL of the
resource desired.
Fail.
Device running e-
tool is not connected
to Internet.
Pass
ETF-3.0 User chose to go
to a page within
the Application
Module.
User selected the item from the
left hand vertical menu.
Success.
The page for that
item appears.
A green check mark
appears to the left of
item in left hand
vertical menu of the
page being
navigated from.
Pass
ETF-3.1 User chose to go
to next page.
User selected Next button. Success.
Next page in
sequence is
displayed.
A green check mark
appears to the left of
item in left hand
vertical menu of the
page being
navigated from.
Pass
ETF-3.2 User chose to go
to previous page.
User selected Back button. Success.
Previous page in
sequence is
displayed.
A green check mark
appears to the left of
item in left hand
vertical menu of the
page being
navigated from.
Pass
ETF-4.0 User chose to
open a project.
User selected a project from the
list and clicked on Open button.
Success.
User should see
Pass
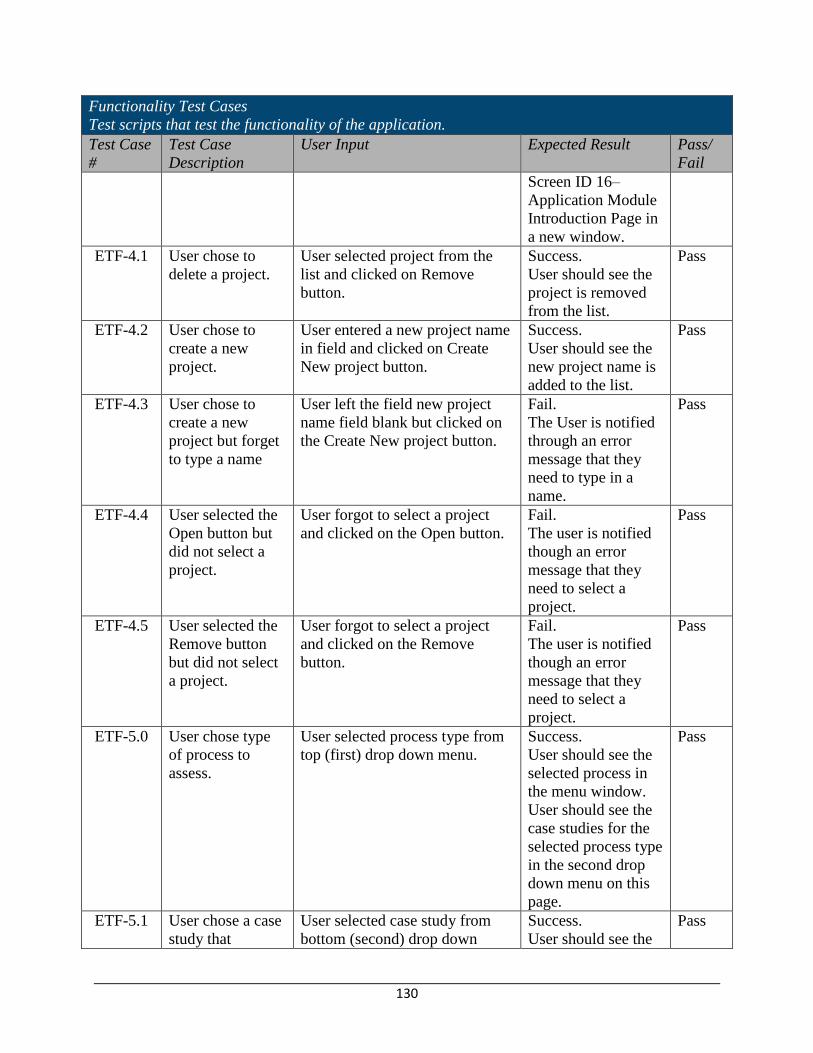
130
Functionality Test Cases
Test scripts that test the functionality of the application.
Test Case
#
Test Case
Description
User Input Expected Result Pass/
Fail
Screen ID 16–
Application Module
Introduction Page in
a new window.
ETF-4.1 User chose to
delete a project.
User selected project from the
list and clicked on Remove
button.
Success.
User should see the
project is removed
from the list.
Pass
ETF-4.2 User chose to
create a new
project.
User entered a new project name
in field and clicked on Create
New project button.
Success.
User should see the
new project name is
added to the list.
Pass
ETF-4.3 User chose to
create a new
project but forget
to type a name
User left the field new project
name field blank but clicked on
the Create New project button.
Fail.
The User is notified
through an error
message that they
need to type in a
name.
Pass
ETF-4.4 User selected the
Open button but
did not select a
project.
User forgot to select a project
and clicked on the Open button.
Fail.
The user is notified
though an error
message that they
need to select a
project.
Pass
ETF-4.5 User selected the
Remove button
but did not select
a project.
User forgot to select a project
and clicked on the Remove
button.
Fail.
The user is notified
though an error
message that they
need to select a
project.
Pass
ETF-5.0 User chose type
of process to
assess.
User selected process type from
top (first) drop down menu.
Success.
User should see the
selected process in
the menu window.
User should see the
case studies for the
selected process type
in the second drop
down menu on this
page.
Pass
ETF-5.1 User chose a case
study that
User selected case study from
bottom (second) drop down
Success.
User should see the
Pass
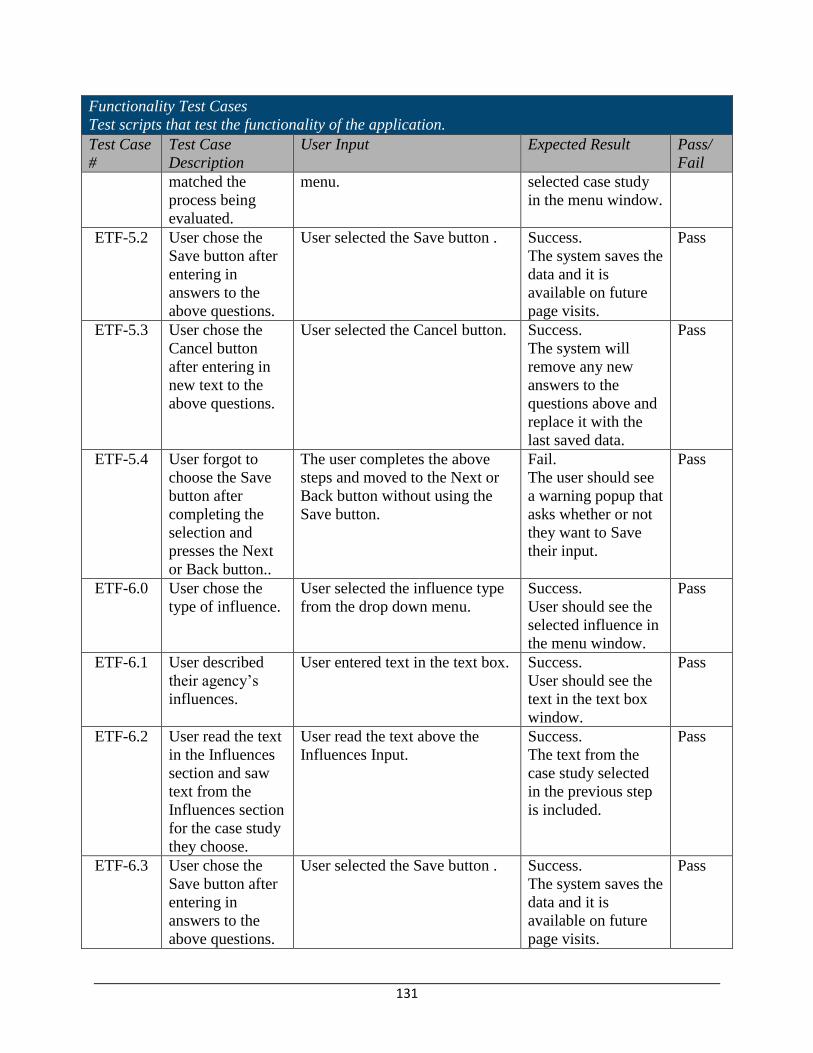
131
Functionality Test Cases
Test scripts that test the functionality of the application.
Test Case
#
Test Case
Description
User Input Expected Result Pass/
Fail
matched the
process being
evaluated.
menu. selected case study
in the menu window.
ETF-5.2 User chose the
Save button after
entering in
answers to the
above questions.
User selected the Save button . Success.
The system saves the
data and it is
available on future
page visits.
Pass
ETF-5.3 User chose the
Cancel button
after entering in
new text to the
above questions.
User selected the Cancel button. Success.
The system will
remove any new
answers to the
questions above and
replace it with the
last saved data.
Pass
ETF-5.4 User forgot to
choose the Save
button after
completing the
selection and
presses the Next
or Back button..
The user completes the above
steps and moved to the Next or
Back button without using the
Save button.
Fail.
The user should see
a warning popup that
asks whether or not
they want to Save
their input.
Pass
ETF-6.0 User chose the
type of influence.
User selected the influence type
from the drop down menu.
Success.
User should see the
selected influence in
the menu window.
Pass
ETF-6.1 User described
their agency’s
influences.
User entered text in the text box. Success.
User should see the
text in the text box
window.
Pass
ETF-6.2 User read the text
in the Influences
section and saw
text from the
Influences section
for the case study
they choose.
User read the text above the
Influences Input.
Success.
The text from the
case study selected
in the previous step
is included.
Pass
ETF-6.3 User chose the
Save button after
entering in
answers to the
above questions.
User selected the Save button . Success.
The system saves the
data and it is
available on future
page visits.
Pass
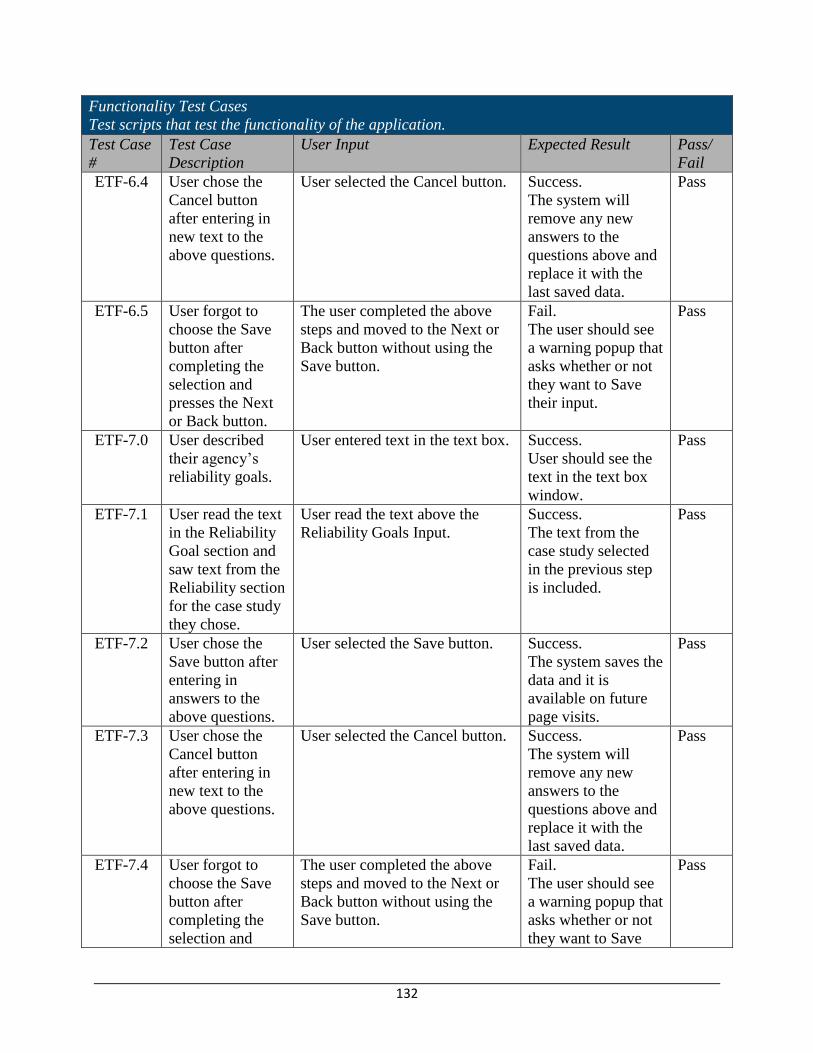
132
Functionality Test Cases
Test scripts that test the functionality of the application.
Test Case
#
Test Case
Description
User Input Expected Result Pass/
Fail
ETF-6.4 User chose the
Cancel button
after entering in
new text to the
above questions.
User selected the Cancel button. Success.
The system will
remove any new
answers to the
questions above and
replace it with the
last saved data.
Pass
ETF-6.5 User forgot to
choose the Save
button after
completing the
selection and
presses the Next
or Back button.
The user completed the above
steps and moved to the Next or
Back button without using the
Save button.
Fail.
The user should see
a warning popup that
asks whether or not
they want to Save
their input.
Pass
ETF-7.0 User described
their agency’s
reliability goals.
User entered text in the text box. Success.
User should see the
text in the text box
window.
Pass
ETF-7.1 User read the text
in the Reliability
Goal section and
saw text from the
Reliability section
for the case study
they chose.
User read the text above the
Reliability Goals Input.
Success.
The text from the
case study selected
in the previous step
is included.
Pass
ETF-7.2 User chose the
Save button after
entering in
answers to the
above questions.
User selected the Save button. Success.
The system saves the
data and it is
available on future
page visits.
Pass
ETF-7.3 User chose the
Cancel button
after entering in
new text to the
above questions.
User selected the Cancel button. Success.
The system will
remove any new
answers to the
questions above and
replace it with the
last saved data.
Pass
ETF-7.4 User forgot to
choose the Save
button after
completing the
selection and
The user completed the above
steps and moved to the Next or
Back button without using the
Save button.
Fail.
The user should see
a warning popup that
asks whether or not
they want to Save
Pass
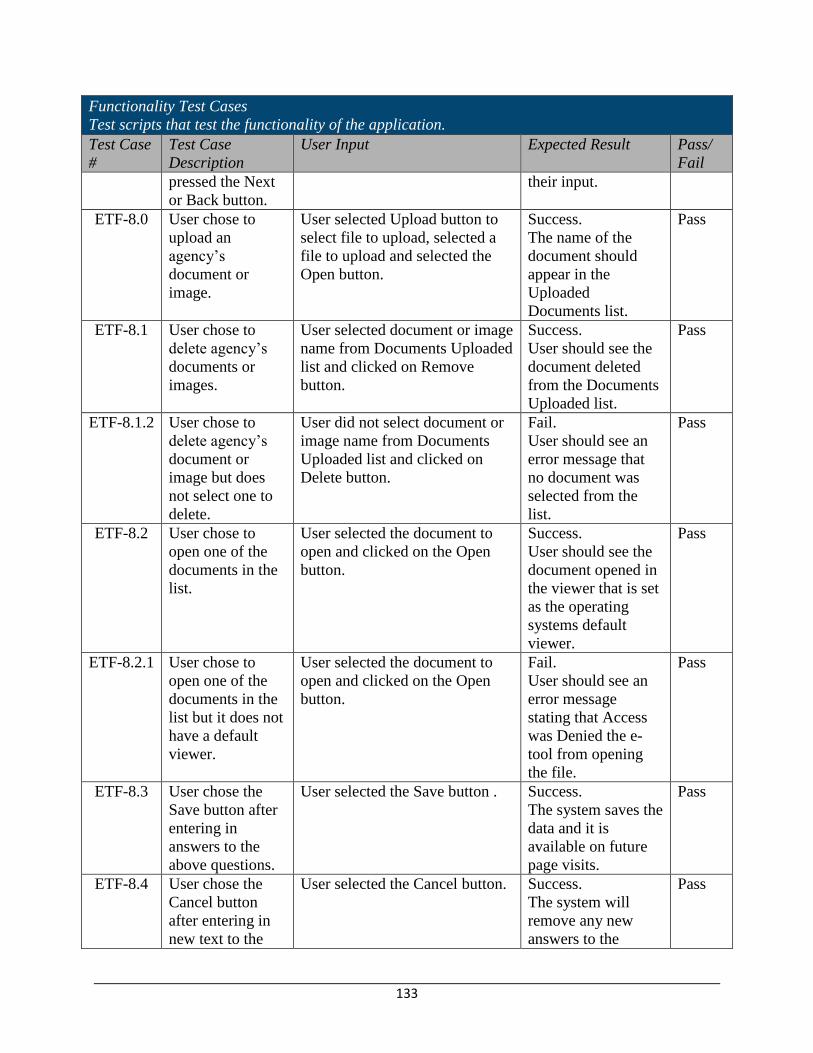
133
Functionality Test Cases
Test scripts that test the functionality of the application.
Test Case
#
Test Case
Description
User Input Expected Result Pass/
Fail
pressed the Next
or Back button.
their input.
ETF-8.0 User chose to
upload an
agency’s
document or
image.
User selected Upload button to
select file to upload, selected a
file to upload and selected the
Open button.
Success.
The name of the
document should
appear in the
Uploaded
Documents list.
Pass
ETF-8.1 User chose to
delete agency’s
documents or
images.
User selected document or image
name from Documents Uploaded
list and clicked on Remove
button.
Success.
User should see the
document deleted
from the Documents
Uploaded list.
Pass
ETF-8.1.2 User chose to
delete agency’s
document or
image but does
not select one to
delete.
User did not select document or
image name from Documents
Uploaded list and clicked on
Delete button.
Fail.
User should see an
error message that
no document was
selected from the
list.
Pass
ETF-8.2 User chose to
open one of the
documents in the
list.
User selected the document to
open and clicked on the Open
button.
Success.
User should see the
document opened in
the viewer that is set
as the operating
systems default
viewer.
Pass
ETF-8.2.1 User chose to
open one of the
documents in the
list but it does not
have a default
viewer.
User selected the document to
open and clicked on the Open
button.
Fail.
User should see an
error message
stating that Access
was Denied the e-
tool from opening
the file.
Pass
ETF-8.3 User chose the
Save button after
entering in
answers to the
above questions.
User selected the Save button . Success.
The system saves the
data and it is
available on future
page visits.
Pass
ETF-8.4 User chose the
Cancel button
after entering in
new text to the
User selected the Cancel button. Success.
The system will
remove any new
answers to the
Pass
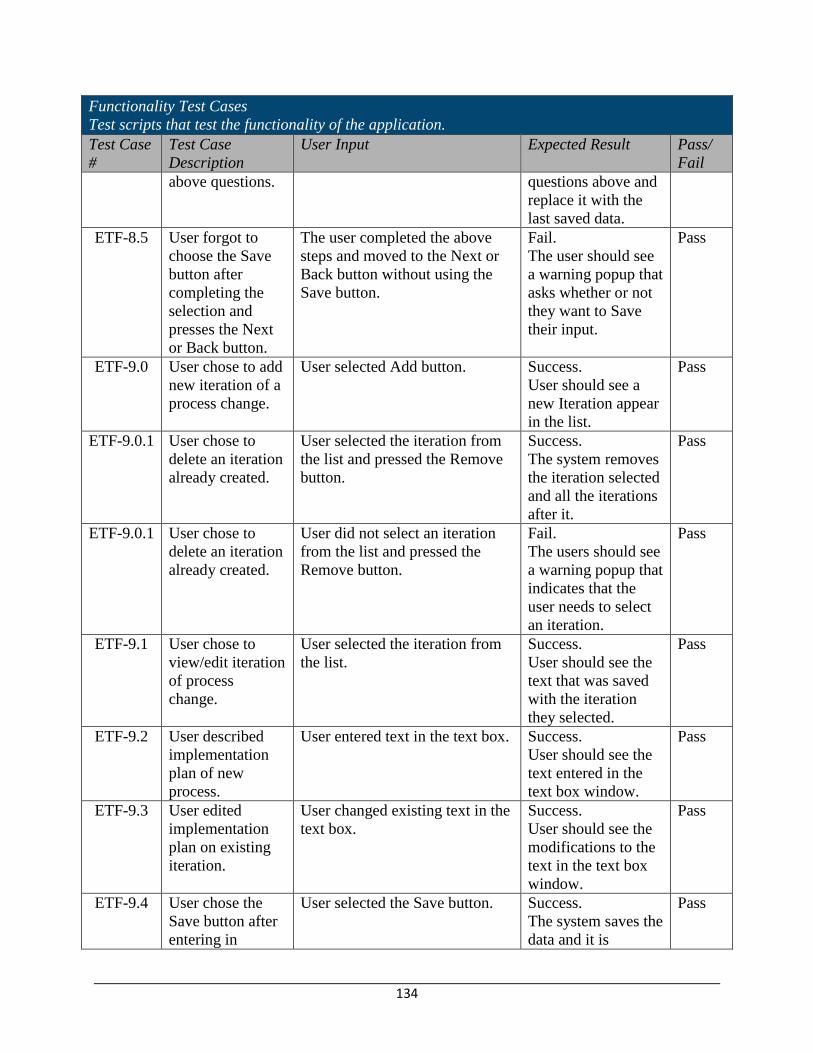
134
Functionality Test Cases
Test scripts that test the functionality of the application.
Test Case
#
Test Case
Description
User Input Expected Result Pass/
Fail
above questions. questions above and
replace it with the
last saved data.
ETF-8.5 User forgot to
choose the Save
button after
completing the
selection and
presses the Next
or Back button.
The user completed the above
steps and moved to the Next or
Back button without using the
Save button.
Fail.
The user should see
a warning popup that
asks whether or not
they want to Save
their input.
Pass
ETF-9.0 User chose to add
new iteration of a
process change.
User selected Add button. Success.
User should see a
new Iteration appear
in the list.
Pass
ETF-9.0.1 User chose to
delete an iteration
already created.
User selected the iteration from
the list and pressed the Remove
button.
Success.
The system removes
the iteration selected
and all the iterations
after it.
Pass
ETF-9.0.1 User chose to
delete an iteration
already created.
User did not select an iteration
from the list and pressed the
Remove button.
Fail.
The users should see
a warning popup that
indicates that the
user needs to select
an iteration.
Pass
ETF-9.1 User chose to
view/edit iteration
of process
change.
User selected the iteration from
the list.
Success.
User should see the
text that was saved
with the iteration
they selected.
Pass
ETF-9.2 User described
implementation
plan of new
process.
User entered text in the text box. Success.
User should see the
text entered in the
text box window.
Pass
ETF-9.3 User edited
implementation
plan on existing
iteration.
User changed existing text in the
text box.
Success.
User should see the
modifications to the
text in the text box
window.
Pass
ETF-9.4 User chose the
Save button after
entering in
User selected the Save button. Success.
The system saves the
data and it is
Pass

135
Functionality Test Cases
Test scripts that test the functionality of the application.
Test Case
#
Test Case
Description
User Input Expected Result Pass/
Fail
answers to the
above questions.
available on future
page visits.
ETF-9.5 User chose the
Cancel button
after entering in
new text to the
above questions.
User selected the Cancel button. Success
The system will
remove any new
answers to the
questions above and
replace it with the
last saved data.
Pass
ETF-9.6 User forgot to
choose the Save
button after
completing the
selection and
pressed the Next
or Back button.
The user completed the above
steps and moved to the Next or
Back button without using the
Save button.
Fail.
The user should see
a warning popup that
asks whether or not
they want to Save
their input.
Pass
ETF-10.0 User chose to add
new iteration to
be assessed.
User selected Add button. Success.
User should see a
new Iteration added
to the list.
Pass
ETF-
10.0.1
User chose to
delete an iteration
already created.
User selected the iteration from
the list and pressed the Remove
button.
Success.
The system removes
the iteration selected
and all the iterations
after it.
Pass
ETF-
10.0.1
User chose to
delete an iteration
already created.
User did not select an iteration
from the list and pressed the
Remove button.
Fail.
The users should see
a warning popup that
indicates that the
user needs to select
an iteration.
Pass
ETF-10.1 User chose to
view/edit iteration
of process
change.
User selected the iteration from
the list.
Success.
User should see the
text that was saved
with the iteration
they selected.
Pass
ETF-10.2 User chose to
describe
performance
measures,
methods, data
needed, data
User entered text in the text
boxes.
Success.
User should see the
text entered in the
five text box
windows.
Pass
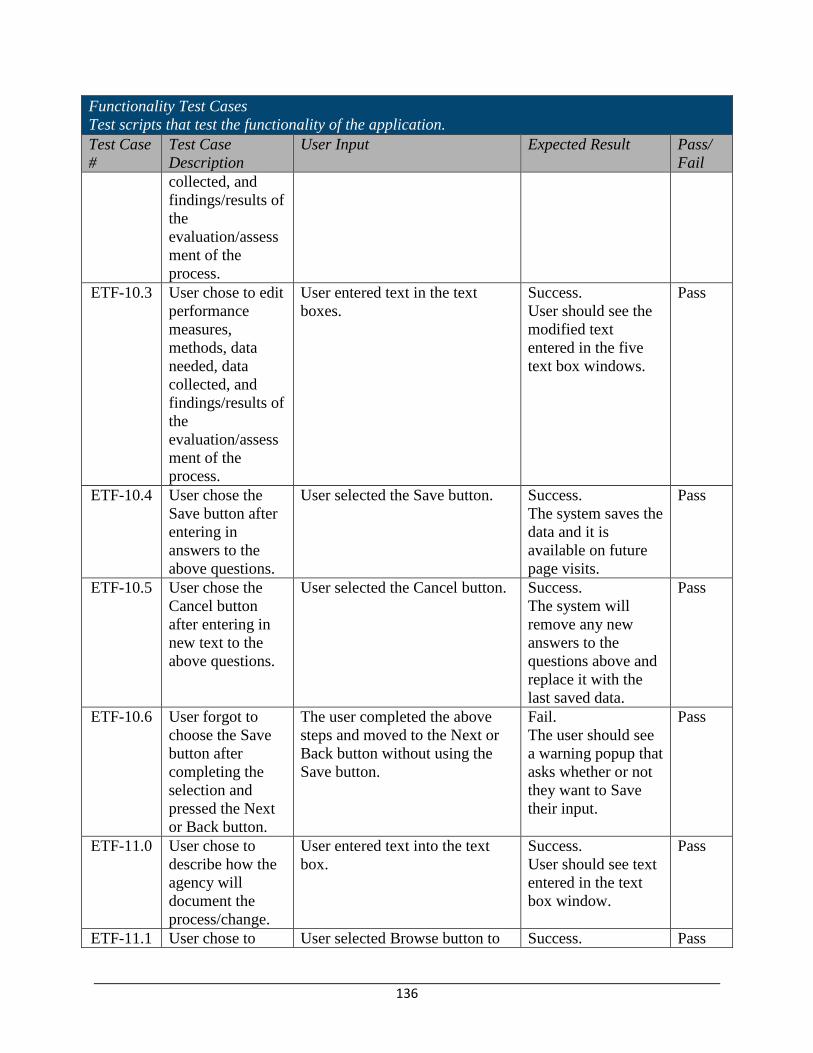
136
Functionality Test Cases
Test scripts that test the functionality of the application.
Test Case
#
Test Case
Description
User Input Expected Result Pass/
Fail
collected, and
findings/results of
the
evaluation/assess
ment of the
process.
ETF-10.3 User chose to edit
performance
measures,
methods, data
needed, data
collected, and
findings/results of
the
evaluation/assess
ment of the
process.
User entered text in the text
boxes.
Success.
User should see the
modified text
entered in the five
text box windows.
Pass
ETF-10.4 User chose the
Save button after
entering in
answers to the
above questions.
User selected the Save button. Success.
The system saves the
data and it is
available on future
page visits.
Pass
ETF-10.5 User chose the
Cancel button
after entering in
new text to the
above questions.
User selected the Cancel button. Success.
The system will
remove any new
answers to the
questions above and
replace it with the
last saved data.
Pass
ETF-10.6 User forgot to
choose the Save
button after
completing the
selection and
pressed the Next
or Back button.
The user completed the above
steps and moved to the Next or
Back button without using the
Save button.
Fail.
The user should see
a warning popup that
asks whether or not
they want to Save
their input.
Pass
ETF-11.0 User chose to
describe how the
agency will
document the
process/change.
User entered text into the text
box.
Success.
User should see text
entered in the text
box window.
Pass
ETF-11.1 User chose to User selected Browse button to Success. Pass

137
Functionality Test Cases
Test scripts that test the functionality of the application.
Test Case
#
Test Case
Description
User Input Expected Result Pass/
Fail
upload an
agency’s
documentation of
their process.
select file to upload, selected a
file to upload and selected the
Open button.
User should see
window to choose
file to upload. User
selects file to upload
and selects Open
button and directory
path should appear
in the text box next
to the Browse
button. The name of
the document should
appear in the
Uploaded
Documents list.
ETF-11.2 User chose to
delete the
agency’s
documentation.
User selected document name
from Documents Uploaded list
and clicked on Delete button.
Success.
User should see the
document deleted
from the Documents
Uploaded list.
Pass
ETF-
11.2.1
User chose to
delete agency’s
document but
does not select
one to delete.
User did not select document
from Documents Uploaded list
and clicked on Delete button.
Fail.
User should see an
error message that
no document was
selected from the
list.
Pass
ETF-11.3 User chose to
open one of the
documents in the
list.
User selected the document to
open and clicked on the Open
button.
Success.
User should see the
document opened in
the viewer that is set
as the operating
systems default
viewer.
Pass
ETF-
11.3.1
User chose to
open one of the
documents in the
list but it does not
have a default
viewer.
User selected the document to
open and clicked on the Open
button.
Fail.
User should see an
error message
stating that Access
was Denied the e-
tool from opening
the file.
Pass
ETF-11.4 User chose the
Save button after
entering in
User selected the Save button. Success.
The system saves the
data and it is
Pass
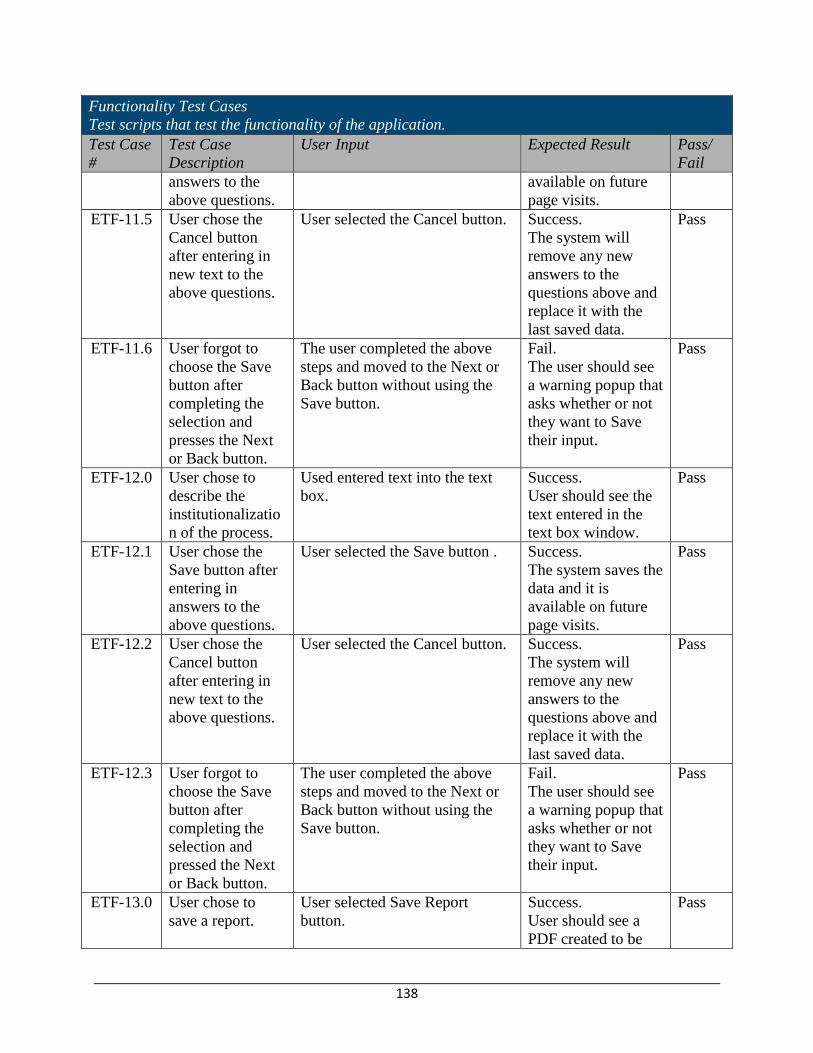
138
Functionality Test Cases
Test scripts that test the functionality of the application.
Test Case
#
Test Case
Description
User Input Expected Result Pass/
Fail
answers to the
above questions.
available on future
page visits.
ETF-11.5 User chose the
Cancel button
after entering in
new text to the
above questions.
User selected the Cancel button. Success.
The system will
remove any new
answers to the
questions above and
replace it with the
last saved data.
Pass
ETF-11.6 User forgot to
choose the Save
button after
completing the
selection and
presses the Next
or Back button.
The user completed the above
steps and moved to the Next or
Back button without using the
Save button.
Fail.
The user should see
a warning popup that
asks whether or not
they want to Save
their input.
Pass
ETF-12.0 User chose to
describe the
institutionalizatio
n of the process.
Used entered text into the text
box.
Success.
User should see the
text entered in the
text box window.
Pass
ETF-12.1 User chose the
Save button after
entering in
answers to the
above questions.
User selected the Save button . Success.
The system saves the
data and it is
available on future
page visits.
Pass
ETF-12.2 User chose the
Cancel button
after entering in
new text to the
above questions.
User selected the Cancel button. Success.
The system will
remove any new
answers to the
questions above and
replace it with the
last saved data.
Pass
ETF-12.3 User forgot to
choose the Save
button after
completing the
selection and
pressed the Next
or Back button.
The user completed the above
steps and moved to the Next or
Back button without using the
Save button.
Fail.
The user should see
a warning popup that
asks whether or not
they want to Save
their input.
Pass
ETF-13.0 User chose to
save a report.
User selected Save Report
button.
Success.
User should see a
PDF created to be
Pass
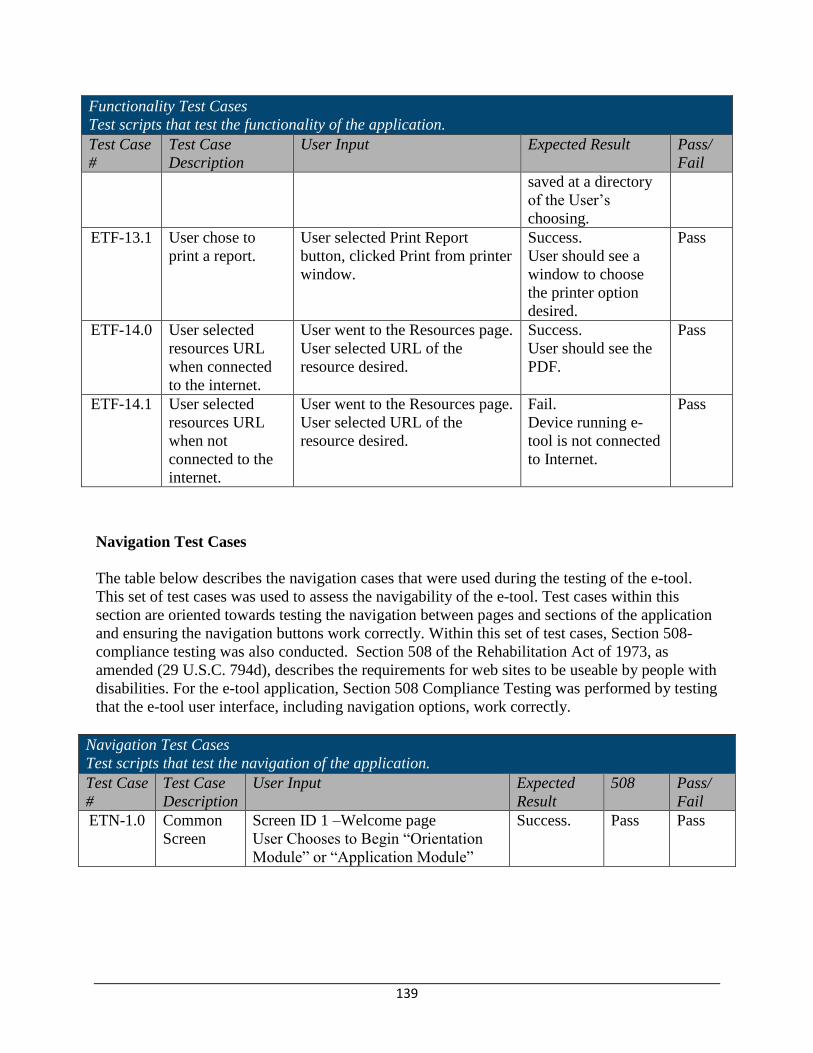
139
Functionality Test Cases
Test scripts that test the functionality of the application.
Test Case
#
Test Case
Description
User Input Expected Result Pass/
Fail
saved at a directory
of the User’s
choosing.
ETF-13.1 User chose to
print a report.
User selected Print Report
button, clicked Print from printer
window.
Success.
User should see a
window to choose
the printer option
desired.
Pass
ETF-14.0 User selected
resources URL
when connected
to the internet.
User went to the Resources page.
User selected URL of the
resource desired.
Success.
User should see the
PDF.
Pass
ETF-14.1 User selected
resources URL
when not
connected to the
internet.
User went to the Resources page.
User selected URL of the
resource desired.
Fail.
Device running e-
tool is not connected
to Internet.
Pass
Navigation Test Cases
The table below describes the navigation cases that were used during the testing of the e-tool.
This set of test cases was used to assess the navigability of the e-tool. Test cases within this
section are oriented towards testing the navigation between pages and sections of the application
and ensuring the navigation buttons work correctly. Within this set of test cases, Section 508-
compliance testing was also conducted. Section 508 of the Rehabilitation Act of 1973, as
amended (29 U.S.C. 794d), describes the requirements for web sites to be useable by people with
disabilities. For the e-tool application, Section 508 Compliance Testing was performed by testing
that the e-tool user interface, including navigation options, work correctly.
Navigation Test Cases
Test scripts that test the navigation of the application.
Test Case
#
Test Case
Description
User Input Expected
Result
508 Pass/
Fail
ETN-1.0 Common
Screen
Screen ID 1 –Welcome page
User Chooses to Begin “Orientation
Module” or “Application Module”
Success. Pass Pass
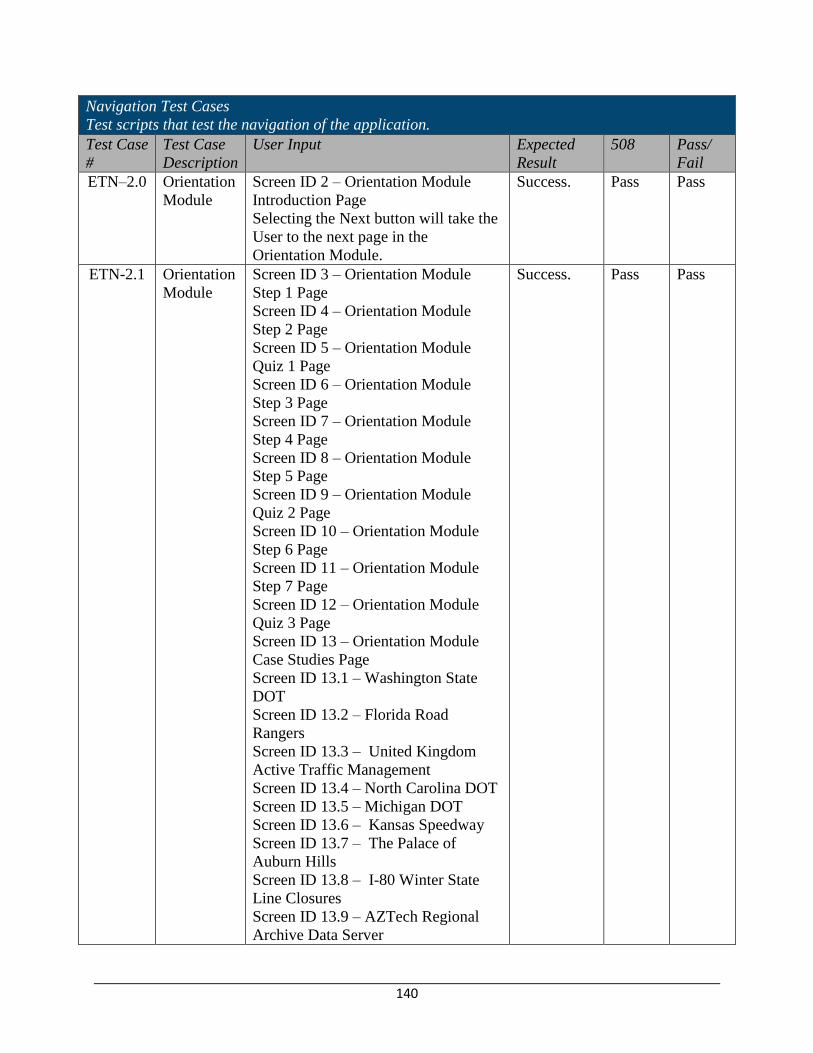
140
Navigation Test Cases
Test scripts that test the navigation of the application.
Test Case
#
Test Case
Description
User Input Expected
Result
508 Pass/
Fail
ETN–2.0 Orientation
Module
Screen ID 2 – Orientation Module
Introduction Page
Selecting the Next button will take the
User to the next page in the
Orientation Module.
Success. Pass Pass
ETN-2.1 Orientation
Module
Screen ID 3 – Orientation Module
Step 1 Page
Screen ID 4 – Orientation Module
Step 2 Page
Screen ID 5 – Orientation Module
Quiz 1 Page
Screen ID 6 – Orientation Module
Step 3 Page
Screen ID 7 – Orientation Module
Step 4 Page
Screen ID 8 – Orientation Module
Step 5 Page
Screen ID 9 – Orientation Module
Quiz 2 Page
Screen ID 10 – Orientation Module
Step 6 Page
Screen ID 11 – Orientation Module
Step 7 Page
Screen ID 12 – Orientation Module
Quiz 3 Page
Screen ID 13 – Orientation Module
Case Studies Page
Screen ID 13.1 – Washington State
DOT
Screen ID 13.2 – Florida Road
Rangers
Screen ID 13.3 – United Kingdom
Active Traffic Management
Screen ID 13.4 – North Carolina DOT
Screen ID 13.5 – Michigan DOT
Screen ID 13.6 – Kansas Speedway
Screen ID 13.7 – The Palace of
Auburn Hills
Screen ID 13.8 – I-80 Winter State
Line Closures
Screen ID 13.9 – AZTech Regional
Archive Data Server
Success. Pass Pass
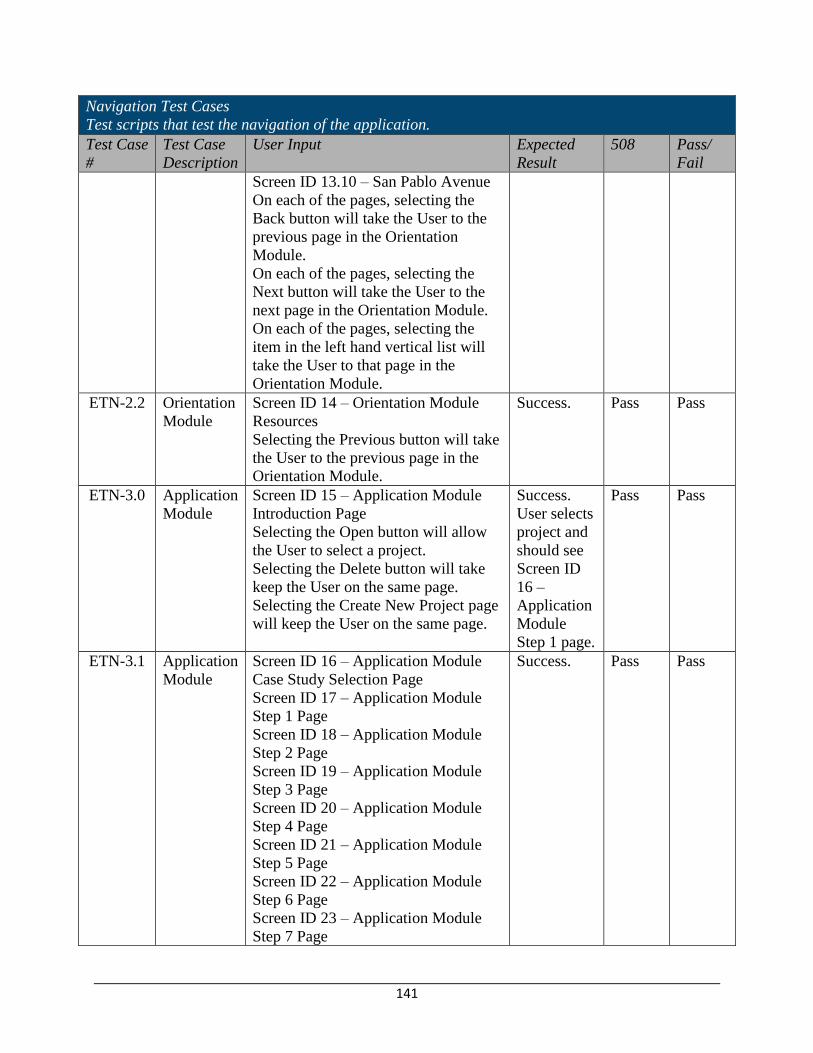
141
Navigation Test Cases
Test scripts that test the navigation of the application.
Test Case
#
Test Case
Description
User Input Expected
Result
508 Pass/
Fail
Screen ID 13.10 – San Pablo Avenue
On each of the pages, selecting the
Back button will take the User to the
previous page in the Orientation
Module.
On each of the pages, selecting the
Next button will take the User to the
next page in the Orientation Module.
On each of the pages, selecting the
item in the left hand vertical list will
take the User to that page in the
Orientation Module.
ETN-2.2 Orientation
Module
Screen ID 14 – Orientation Module
Resources
Selecting the Previous button will take
the User to the previous page in the
Orientation Module.
Success. Pass Pass
ETN-3.0 Application
Module
Screen ID 15 – Application Module
Introduction Page
Selecting the Open button will allow
the User to select a project.
Selecting the Delete button will take
keep the User on the same page.
Selecting the Create New Project page
will keep the User on the same page.
Success.
User selects
project and
should see
Screen ID
16 –
Application
Module
Step 1 page.
Pass Pass
ETN-3.1 Application
Module
Screen ID 16 – Application Module
Case Study Selection Page
Screen ID 17 – Application Module
Step 1 Page
Screen ID 18 – Application Module
Step 2 Page
Screen ID 19 – Application Module
Step 3 Page
Screen ID 20 – Application Module
Step 4 Page
Screen ID 21 – Application Module
Step 5 Page
Screen ID 22 – Application Module
Step 6 Page
Screen ID 23 – Application Module
Step 7 Page
Success. Pass Pass
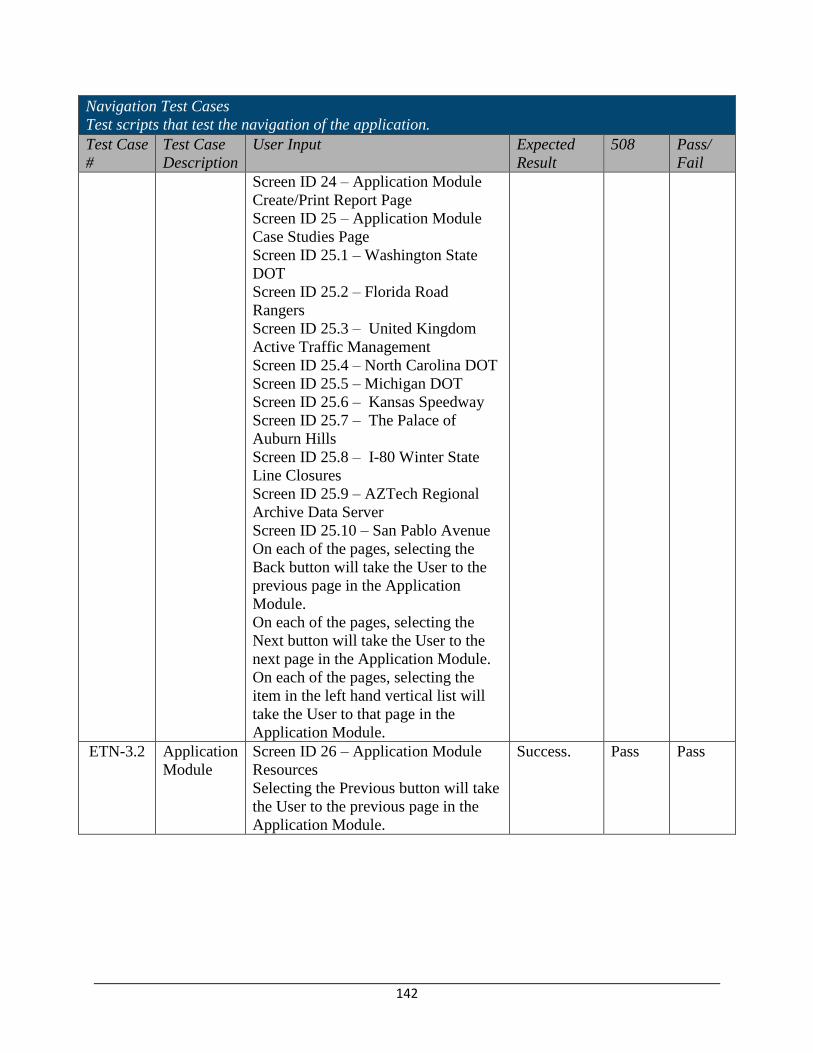
142
Navigation Test Cases
Test scripts that test the navigation of the application.
Test Case
#
Test Case
Description
User Input Expected
Result
508 Pass/
Fail
Screen ID 24 – Application Module
Create/Print Report Page
Screen ID 25 – Application Module
Case Studies Page
Screen ID 25.1 – Washington State
DOT
Screen ID 25.2 – Florida Road
Rangers
Screen ID 25.3 – United Kingdom
Active Traffic Management
Screen ID 25.4 – North Carolina DOT
Screen ID 25.5 – Michigan DOT
Screen ID 25.6 – Kansas Speedway
Screen ID 25.7 – The Palace of
Auburn Hills
Screen ID 25.8 – I-80 Winter State
Line Closures
Screen ID 25.9 – AZTech Regional
Archive Data Server
Screen ID 25.10 – San Pablo Avenue
On each of the pages, selecting the
Back button will take the User to the
previous page in the Application
Module.
On each of the pages, selecting the
Next button will take the User to the
next page in the Application Module.
On each of the pages, selecting the
item in the left hand vertical list will
take the User to that page in the
Application Module.
ETN-3.2 Application
Module
Screen ID 26 – Application Module
Resources
Selecting the Previous button will take
the User to the previous page in the
Application Module.
Success. Pass Pass